20
North American versus European Global Warming Policies: Same Constraints, Different Objectives Ross McKitrick Department of Economics University of Guelph
| Date post: | 25-Dec-2015 |
| Category: |
Documents |
| Upload: | elvin-hodges |
| View: | 213 times |
| Download: | 0 times |

North American versus European Global
Warming Policies: Same Constraints, Different Objectives
Ross McKitrick
Department of Economics
University of Guelph

Europe and USA
Different stated objectives EU: Kyoto target of 8% below 1990 by
2008 US: Intensity reduction of 18% by 2012
EU target implies hard cap and total cut
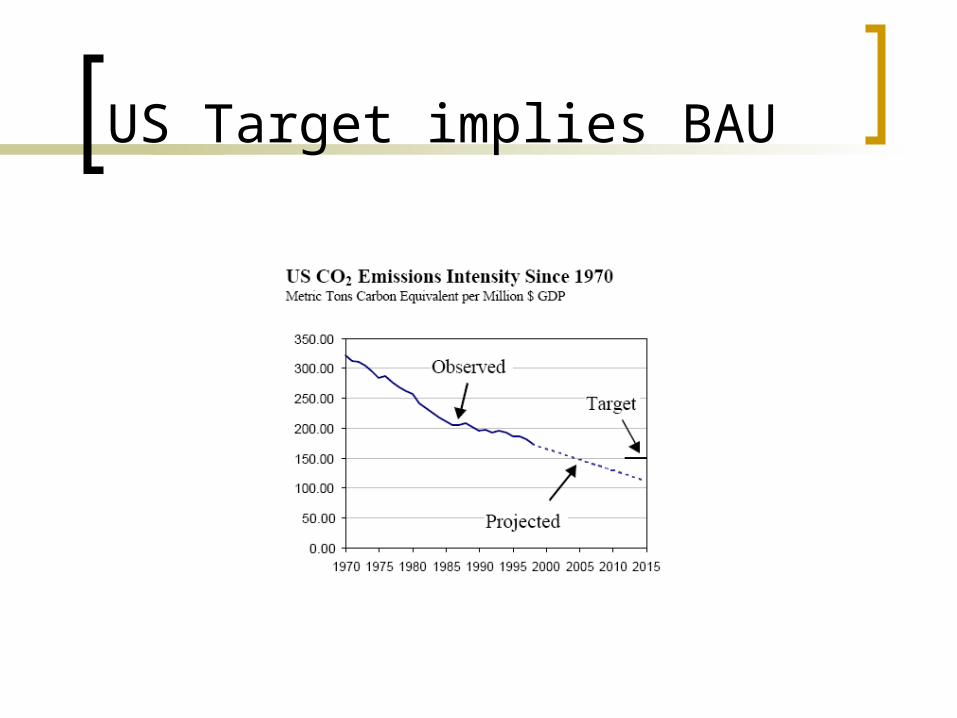
US Target implies BAU
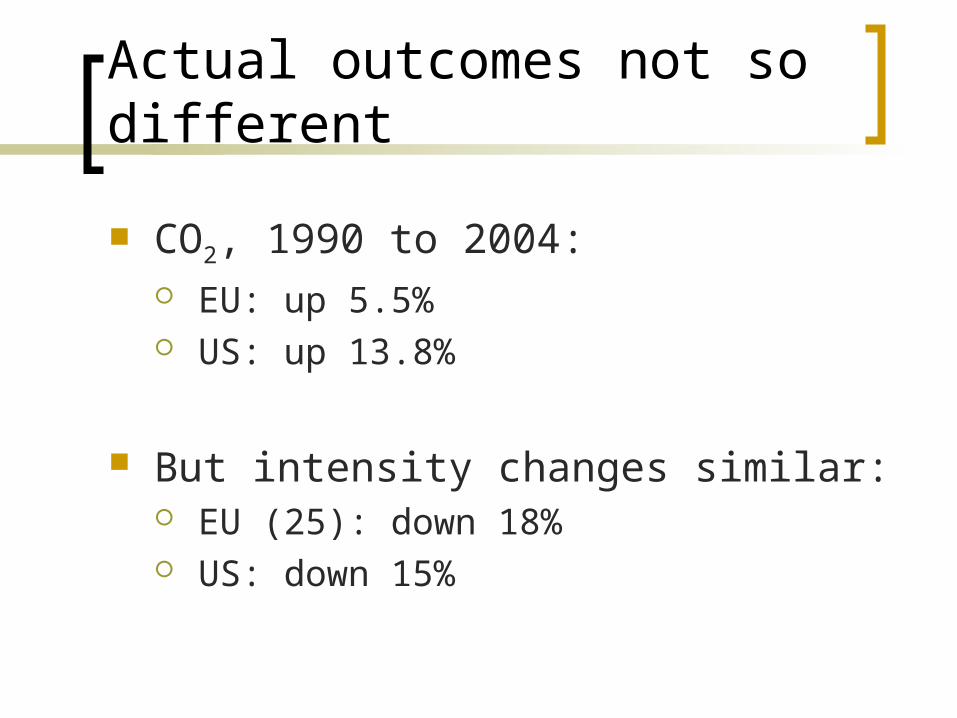
Actual outcomes not so different
CO2, 1990 to 2004: EU: up 5.5% US: up 13.8%
But intensity changes similar: EU (25): down 18% US: down 15%
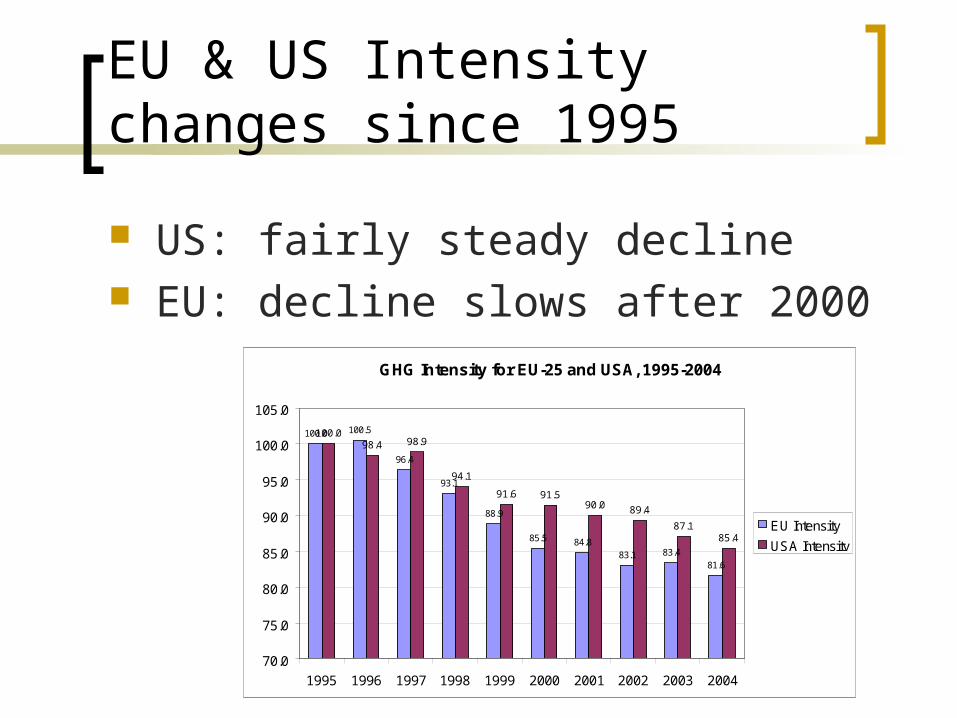
EU & US Intensity changes since 1995
US: fairly steady decline EU: decline slows after 2000
GHG Intensity for EU-25 and USA, 1995-2004
100.0 100.5
96.4
93.1
88.9
85.5 84.883.1 83.4
81.6
100.098.4 98.9
94.1
91.6 91.590.0 89.4
87.185.4
70.0
75.0
80.0
85.0
90.0
95.0
100.0
105.0
1995 1996 1997 1998 1999 2000 2001 2002 2003 2004
EU Intensity
USA Intensity

Why aren’t outcomes more different?
Same constraints Energy efficiency & emissions intensity are
resilient to change No low-cost CO2 abatement options appear to
exist Price paths favour coal over oil and natural gas
in recent years Energy is crucial for growth
These constraints matter more than the objectives

Context
Historical US emissions

Context
Historical EU emissions (not incl. Germany)

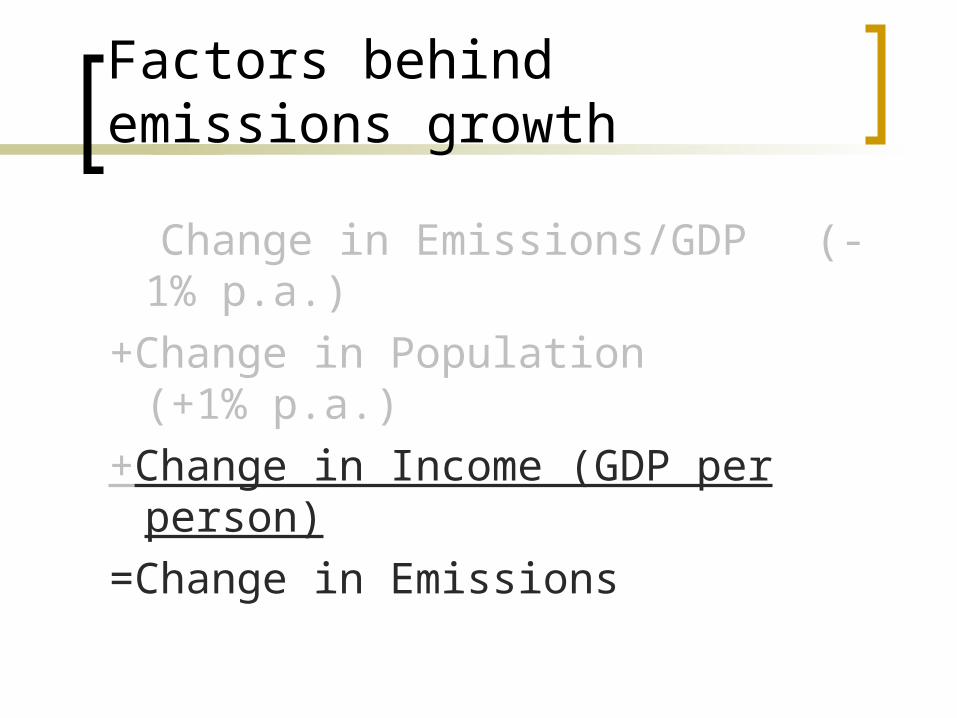
Factors behind emissions growth
Change in Emissions/GDP
+Change in Population
+Change in Income (GDP per person)
=Change in Emissions
PopulationPopulation
GDP
GDP
EmissionsEMISSIONSGHGTOTAL
Factors behind emissions growth
Change in Emissions/GDP (-1% p.a.)
+Change in Population (+1% p.a.)
+Change in Income (GDP per person)
=Change in Emissions

Historical rates
US after 1960 Population +1.1% p.a. Intensity -1.7% p.a. Real Income +2.2% p.a.
If Income+Pop grow by 3.3%, intensity must fall by 3.3% just to cap emissions
Twice the historical rate
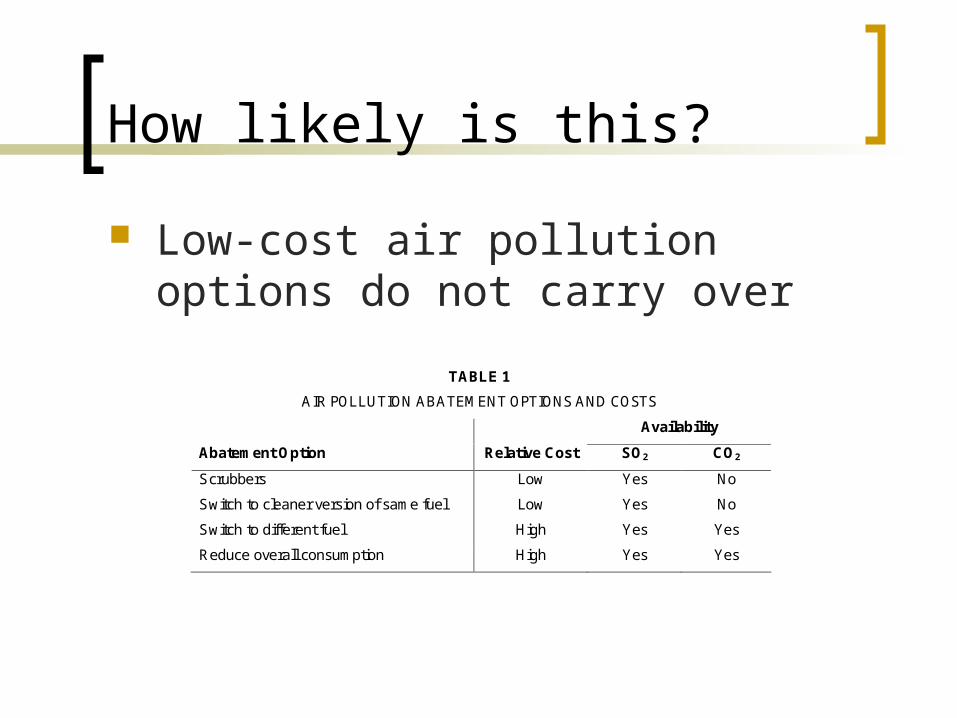
How likely is this?
Low-cost air pollution options do not carry over
TABLE 1
AIR POLLUTION ABATEMENT OPTIONS AND COSTS
Availability
Abatement Option Relative Cost SO2 CO2
Scrubbers Low Yes No
Switch to cleaner version of same fuel Low Yes No
Switch to different fuel High Yes Yes
Reduce overall consumption High Yes Yes

OPA Analysis 2007
“[Projected] Reductions in CO2 emissions between 2010 and 2014 were driven by reductions in coal [-fired electricity] production rather than by emission controls. At present there is no viable control technology available to reduce CO2 emissions from coal plants. Therefore CO2 reductions under all alternatives are the same.” (OPA 2007, p. 5)
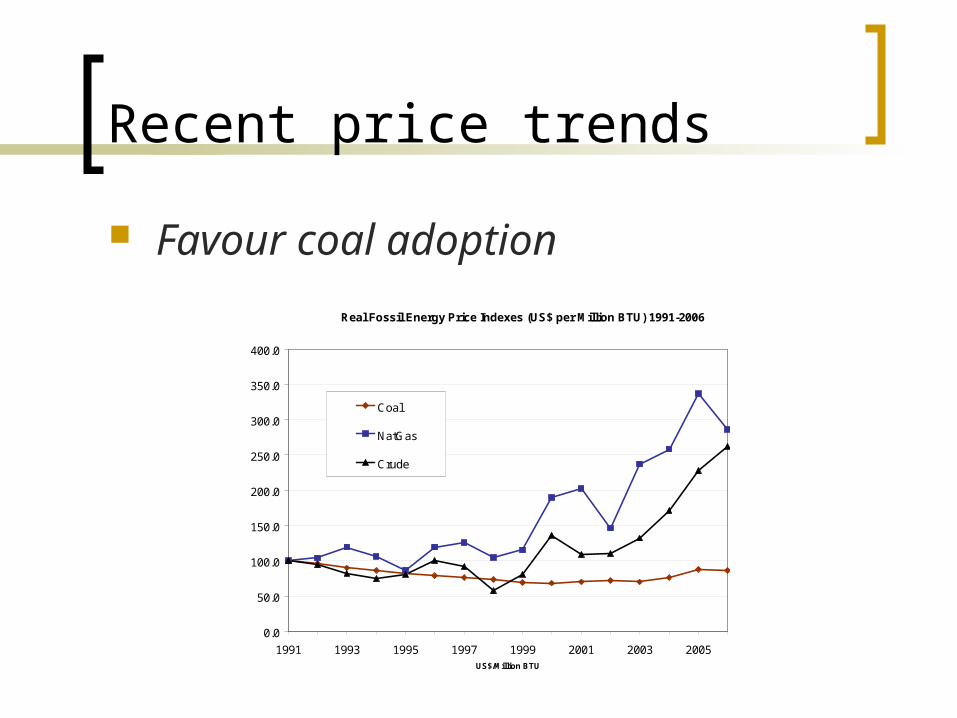
Recent price trends
Favour coal adoption
Real Fossil Energy Price Indexes (US$ per Million BTU) 1991-2006
0.0
50.0
100.0
150.0
200.0
250.0
300.0
350.0
400.0
1991 1993 1995 1997 1999 2001 2003 2005US$/Million BTU
Coal
NatGas
Crude

Energy consumption & growth
Does energy use cause growth or does growth cause energy use?
If the latter, the 2 can be more easily decoupled without putting growth at risk
Method of analysis: Vector Autoregression/Granger Causality testing

Causality runs both ways
The multivariate analysis shows that energy Granger causes GDP either unidirectionally as indicated by the first of the three models investigated or possibly through a mutually causative relationship… The results presented in this paper, strengthen my previous conclusions that energy is a limiting factor in economic growth. Shocks to energy supply will tend to reduce output.
Stern (2000) p. 281 (emph. added)

Rhetoric and reality in EU
US opposition to mandatory cuts longstanding and clear
But EU countries have done little either
Apart from UK and German one-time drops, EU emissions paths have not changed much “there are no systematic signals for distinguishing the
behavior of the examined countries in the pre- and post-Kyoto period.” Diakoulaki and Madaraki (2007 p. 655)

ETS problems
Price collapse in first round
German request for 14-year supply for coal plants
Latvia, Poland, Hungary, the Czech Republic, Slovakia and Estonia suing Brussels
13 Polish and one French steel companies suing Brussles, as well as the governments of the UK, Slovakia and Germany on behalf of domestic power and steel companies
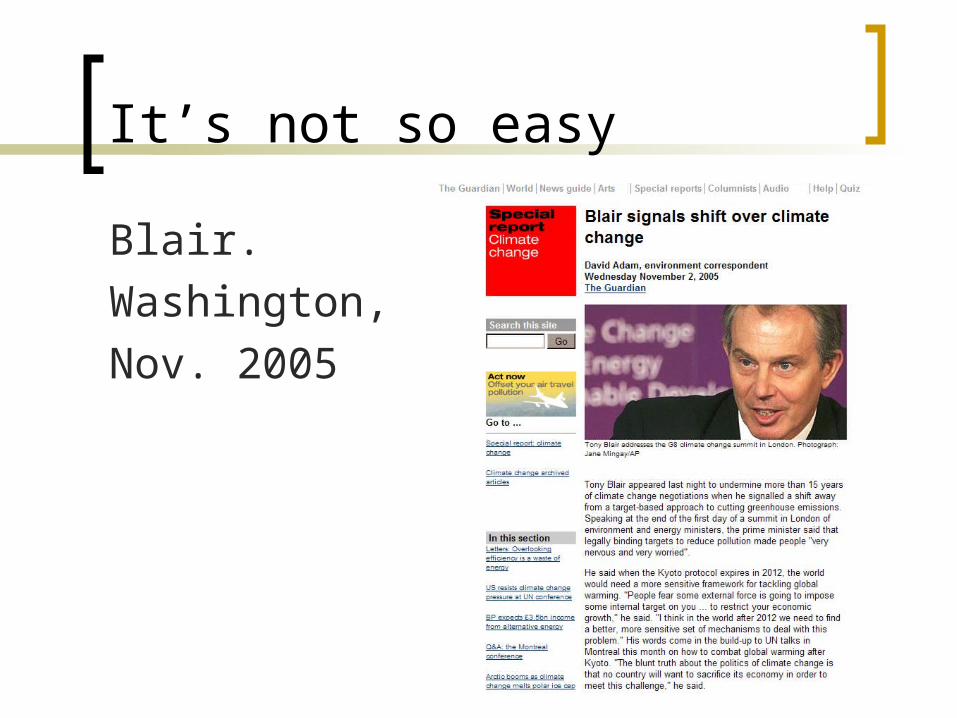
It’s not so easy
Blair.
Washington,
Nov. 2005

Conclusions
EU and US have staked out very different objectives
But both operate under same basic constraints
These constraints are sufficiently strong that the outcomes are not all that different


