VIRGINIA ELECTRIC AND POWER COMPANY RICHMOND, VIRGINIA 23261 April 25, 2007 United States Nuclear Regulatory Commission Serial No. 07-0297 Attention: Document Control Desk NAPS/JHL Washington, D. C. 20555 Docket Nos. 50-338/339 72-16 License Nos. NPF-4/7 SNM-2507 VIRGINIA ELECTRIC AND POWER COMPANY (DOMINION) NORTH ANNA POWER STATION UNIT NOS. 1 AND 2 INDEPENDENT SPENT FUEL STORAGE INSTALLATION (ISFSI) ANNUAL RADIOLOGICAL ENVIRONMENTAL OPERATING REPORT In accordance with North Anna Units 1 and 2 Technical Specification 5.6.2 and North Anna Independent Spent Fuel Storage Installation Technical Specification 5.5.2b, enclosed is the 2006 Annual Radiological Environmental Operating Report. If you have any questions or require additional information, please contact Page Kemp at (540) 894-2295. Very truly yours, D. G. Stoddard Site Vice President Enclosure Commitments made in this letter: None cc: U. S. Nuclear Regulatory Commission Region II Sam Nunn Atlanta Federal Center 61 Forsyth Street, SW Suite 23T85 Atlanta, Georgia 30303 Director, Nuclear Material Safety and Safeguards U. S. Nuclear Regulatory Commission Washington, D. C. 20555 Mr. J. T. Reece NRC Senior Resident Inspector North Anna Power Station /J• C550
Transcript
VIRGINIA ELECTRIC AND POWER COMPANY
RICHMOND, VIRGINIA 23261
April 25, 2007
United States Nuclear Regulatory Commission Serial No. 07-0297Attention: Document Control Desk NAPS/JHLWashington, D. C. 20555 Docket Nos. 50-338/339
72-16License Nos. NPF-4/7
SNM-2507
VIRGINIA ELECTRIC AND POWER COMPANY (DOMINION)NORTH ANNA POWER STATION UNIT NOS. 1 AND 2INDEPENDENT SPENT FUEL STORAGE INSTALLATION (ISFSI)ANNUAL RADIOLOGICAL ENVIRONMENTAL OPERATING REPORT
In accordance with North Anna Units 1 and 2 Technical Specification 5.6.2 and NorthAnna Independent Spent Fuel Storage Installation Technical Specification 5.5.2b,enclosed is the 2006 Annual Radiological Environmental Operating Report.
If you have any questions or require additional information, please contact Page Kempat (540) 894-2295.
Very truly yours,
D. G. Stoddard
Site Vice President
Enclosure
Commitments made in this letter: None
cc: U. S. Nuclear Regulatory CommissionRegion IISam Nunn Atlanta Federal Center61 Forsyth Street, SWSuite 23T85Atlanta, Georgia 30303
Director, Nuclear Material Safety and SafeguardsU. S. Nuclear Regulatory CommissionWashington, D. C. 20555
Mr. J. T. ReeceNRC Senior Resident InspectorNorth Anna Power Station
Supervisor Radiological AnalysisDominion North Anna Power Station
Reviewed by:
Approved by:
ch W. DreyerSupervisor Health Physics Technical Services
Dominion North Anna Power Station
Robert B. Evans, Jr.Manager Radiological Protection and Chemistry
Dominion North Anna Power Station
2
Table of Contents
1. EXECU TIVE SU M M A R Y ....................................................................................................... 4
2. PRO G RA M D ESCRIPTIO N ...................................................................................................... 72.1 Introduction ............................................................................................................................. 72.2 Sam pling and A nalysis Program ........................................................................................ 8
3. AN ALY TICAL RESULTS ........................................................................................................ 223.1 Sum m ary of Results...................................................................................................... 223.2 A nalytical R esults of 2006 REM P Sam ples ................................................................... 32
4. D ISCU SSIO N O F RESULTS ...................................................................... ........................... 594.1 G am m a Exposure R ate ................................................................................................... 594.2 A irborne G ross Beta .............................................................................................................. 614.3 A irborne R adioiodine ...................................................................................................... 624.4 Air Particulate Gamma ........... : ................................... 624.5 A ir Particulate Strontium ................................................................................................. 624.6 Soil ........................................................................................................................................ 634.7 Precipitation .......................................................................................................................... 634.8 Cow M ilk .............................................................................................................................. 634.9 Food Products and V egetation ........................................................................................ 644.10 W ell W ater .......................................................................................................................... 644.11 R iver W ater ......................................................................................................................... 644.12 Surface W ater ...................................................................................................................... 654.13 Bottom Sedim ent ................................................................................................................. 664.14 Shoreline Soil ....................................................................................................................... 674.15 Fish ..................................................................................................................................... 68
5. PRO G RA M EX CEPTIO N S ..................................................................................................... 69
RE FERE N CES .................................................................................................................................... 71
A PPEND ICES ..................................................................................................................................... 73A PPEND IX A : LA ND U SE CEN SU S ...................................................................................... 74APPENDIX B: SUMMARY OF INTERLABORATORY COMPARISONS .......................... 77APPENDIX C: SUMMARY OF GOUNDWATER PROTECTION ANALYSES .......... 85
3
. 1. EXECUTIVE SUMMARY
This document is a detailed report of the 2006 North Anna Nuclear Power StationRadiological Environmental Monitoring Program (REMP). It is submitted inaccordance with North Anna Unit 1 and 2 Technical Specification 5.6.2 and NorthAnna Independent Spent Fuel Storage Installation (ISFSI) Technical Specification5.5.2b. Radioactivity levels from January 1 through December 31, 2006, in water,silt, shoreline sediment, milk, aquatic biota, food products, vegetation, and directexposure pathways have been analyzed, evaluated and summarized. The REMP isdesigned to confirm that radiological effluent releases are As Low As is ReasonablyAchievable (ALARA), no undue environmental effects occur and the health andsafety of the public are protected. The program also detects any unexpectedenvironmental processes that could allow radiation accumulations in theenvironment or food pathway chains.
Radiation and radioactivity in the environment is monitored within a 25-mileradius of the station. North Anna Power Station personnel collect a variety ofsamples within this area. A number of sampling locations for each medium areselected using available meteorological, land use, and water use data. Two typesof samples are obtained. The first type, control samples, are collected from areas
* that are beyond the measurable influence of North Anna Power Station or anyother nuclear facility. These samples are used as reference data. Normalbackground radiation levels, or radiation present due to causes other than NorthAnna Power Station, can be compared to the environment surrounding thestation. Indicator samples are the second sample type obtained. These samplesshow how much radiation is contributed to the environment by the station.Indicator samples are taken from areas close to the station where any stationcontribution will be at the highest concentration.
Prior to station operation, samples were collected and analyzed to determine theamount of radioactivity present in the area. The resulting values are used as a"pre-operational baseline." Analysis results from the indicator samples arecompared to both current control sample values and the pre-operational baselineto determine if changes in radioactivity levels are attributable to stationoperations, or causes such as the Chernobyl accident or natural variation.
Global Dosimetry Solutions provided thermoluminescent dosimetry (TLD) servicesand AREVA Environmental Laboratory provided radioanalytical services.Participation in an Interlaboratory Comparison Program provides an independentcheck of sample measurement precision and accuracy. Typically, radioactivitylevels in the environment are so low that analysis values frequently fall below the. minimum detection limits of state-of-the-art measurement methods. Because ofthis, the Nuclear Regulatory Commission (NRC) requires that equipment used for
4
* radiological environmental monitoring must be able to detect specified minimumLower Limits of Detection (LLDs). This ensures that analyses are as accurate aspossible. The NRC also mandates a reporting level for certain radionuclides.Licensed nuclear facilities must report the radionuclide activities in thoseenvironmental samples that are equal to or greater than the specified reportinglevel. Environmental radiation levels are sometimes referred to as a percent of thereporting level.
Analytical results are reported for all possible radiation exposure pathways toman. These pathways include airborne, water, aquatic, terrestrial, and directradiation exposure. The airborne exposure pathway includes radioactive airborneiodine and particulates, and precipitation. The 2006 airborne results were similarto previous years. No plant related radioactivity was detected and fallout ornatural radioactivity levels remained at levels consistent with past years' results.
Water and aquatic exposure pathway samples include surface, river and wellwater, silt and shoreline sediments, and fish. No plant related isotopes weredetected in Lake Anna surface water except for tritium. The average tritiumactivity in surface water for 2006 was 3625 pCi/liter. Naturally occurringpotassium-40 was detected at average environmental levels. River water collectedfrom the North Anna River, 5.8 miles downstream of the site had an averagetritium level of 3283 pCi/liter. No plant related radioisotopes were detected in wellwater. This trend is consistent throughout the environmental operationalmonitoring program. Both silt samples indicated the presence of naturallyoccurring thorium-228 at levels consistent with the natural background.Shoreline sediment, which may provide a direct exposure pathway, indicated thepresence of Th-228 also at levels consistent with natural levels. Cs-137 wasdetected in only one sediment sample at 153 pCi/kg. No Cs-137 was detected inshoreline soil. This Cs-137 level is consistent with historic levels. The terrestrialexposure pathway includes milk and food/vegetation products. Iodine-131 wasnot detected in any 2006 milk samples and has not been detected in milk prior toor since the 1986 Chernobyl accident. No plant related radioisotopes weredetected in any milk samples. A ten-year activity trend continues to indicate theslow decrease in Sr-90 activity. Naturally occurring potassium-40 was detected atevironmental levels consistent with historical data. Cs-137 was detected in onevegetation sample at 88 pCi/kg. This level is consistent with low levels of Cs- 137detected intermittently in past years. The direct exposure pathway measuresenvironmental radiation doses by use of thermoluminescent dosimeters (TLDs).TLD results have remained essentially constant over the years.
During 2006, as in previous years, operation of the North Anna Power Station andthe Independent Spent Fuel Storage Installation (ISFSI) created no adverseenvironmental effects or health hazards. The maximum dose calculated for a
5
* hypothetical individual at the station site boundary due to liquid and gaseouseffluents released from the station during 2006 was 0.32 millirem. For reference,this dose may be compared to the 360 millirem average annual exposure to everyperson in the United States from natural and man-made sources. Natural sourcesin the environment provide approximately 82% of radiation exposure to man,while nuclear power contributes less than 0.1%. These results demonstrate notonly compliance with federal and state regulations but also demonstrate theadequacy of radioactive effluent control at North Anna Power Station.
S
6
. 2. PROGRAM DESCRIPTION
2.1 Introduction
This report documents the 2006 North Anna Power Station operationalRadiological Environmental Monitoring Program (REMP).
The North Anna Power Station of Dominion Virginia Power Company is located onLake Anna in Mineral, Virginia, approximately 35 miles southwest ofFredericksburg, Virginia. The site consists of two units, each with a pressurizedwater reactor (PWR) nuclear steam supply system and turbine generator furnishedby Westinghouse Electric Corporation. Each unit was designed with a grosselectrical output of 979 megawatts electric (MWe). Unit 1 achieved commercialoperation on June 6, 1978 and Unit 2 on December 14, 1980. An independentspent fuel storage facility was licensed for dry cask storage of spent fuel in 1998.
The United States Nuclear Regulatory Commission (USNRC) regulations requirethat nuclear power plants be designed, constructed, and operated to keep levels ofradioactive material in effluents to unrestricted areas as low as is reasonablyachievable (ALARA). To ensure these criteria are met, the operating license for. North Anna Power Station includes Technical Specifications, which address therelease of radioactive effluents. In-plant monitoring is used to ensure releaselimits are not exceeded. As a precaution against unexpected or undefinedenvironmental processes which might allow undue accumulation of radioactivityin the environment, a program for monitoring the plant environs is also includedin North Anna Power Station Offsite Dose Calculation Manual (ODCM).
North Anna Power Station is responsible for collecting the various indicator andcontrol environmental samples. Global Dosimetry Solutions is responsible forprocessing the TLDs. AREVA Environmental Laboratory is responsible for sampleanalyses. The results of the analyses are used to determine if changes inradioactivity levels may be attributable to station operations. Measured values arecompared with control levels, which vary with time due to external events, such ascosmic ray bombardment, nuclear weapons test fallout and seasonal variations ofnaturally occurring radioisotopes. Data collected prior to station operation is usedto indicate the degree of natural variation to be expected. This pre-operationaldata is compared with data collected during the operational phase to assist inevaluating any radiological impact of station operation.
Occasional samples of environment media show the presence of man-madeisotopes. As a method of referencing the measured radionuclide concentrations inthe sample media to a dose consequence to man, the data is compared to thereporting level concentrations listed in the USNRC Regulatory Guide 4.8 and
7
W North Anna's ODCM. These concentrations are based upon the annual dosecommitment recommended by 10CFR50, Appendix I, to meet the criterion of "AsLow As Is Reasonably Achievable".
This report documents the results of the Radiological Environmental MonitoringProgram for 2006 and satisfies the following objectives of the program:
To provide measurements of radiation and of radioactive materials inthose exposure pathways and for those radionuclides that lead to thehighest potential radiation exposure of the maximum exposed member ofthe public resulting from station operations.
To supplement the radiological effluent monitoring program by verifying
that radioactive effluents are within allowable limits.
To identify changes in radioactivity in the environment.
To verify that station operations have no detrimental effect on the healthand safety of the public.
O 2.2 Sampling and Analysis Program
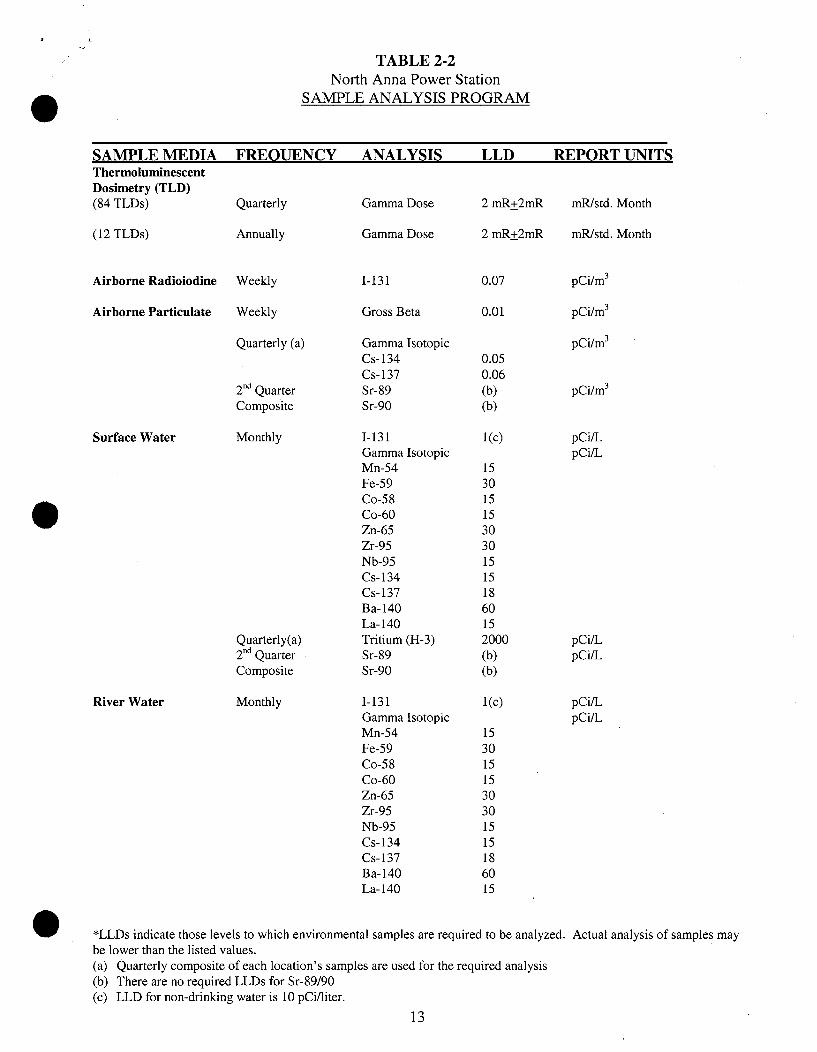
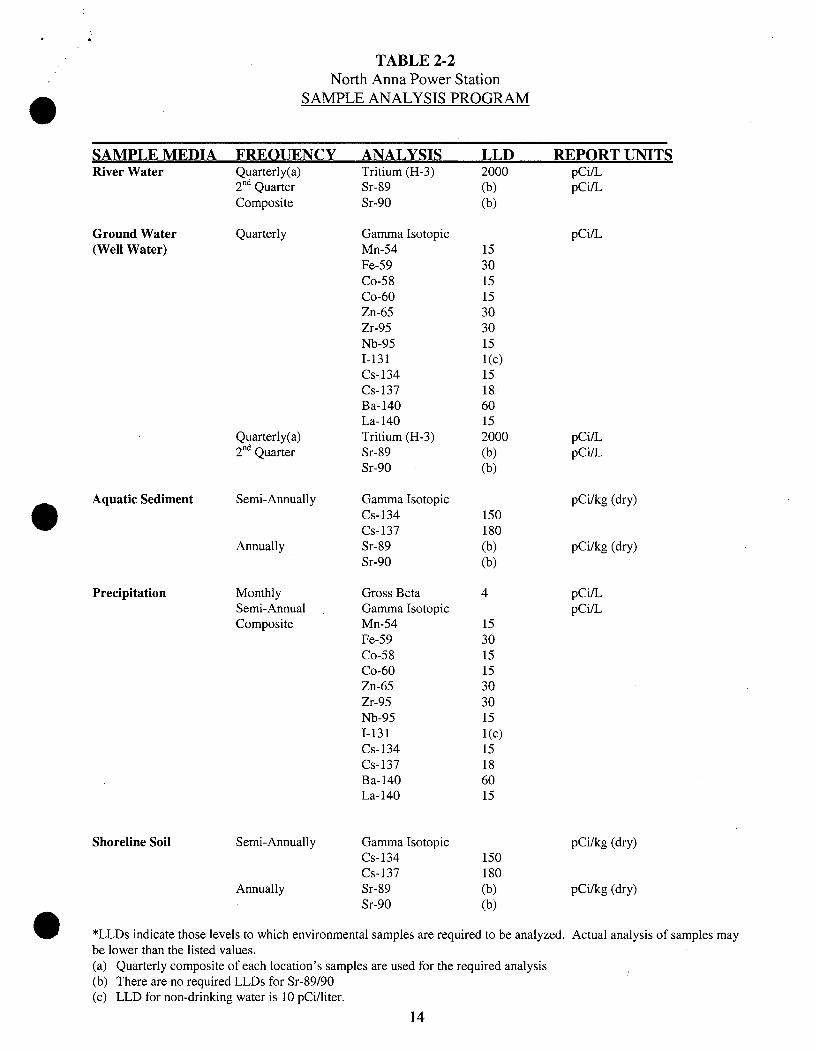
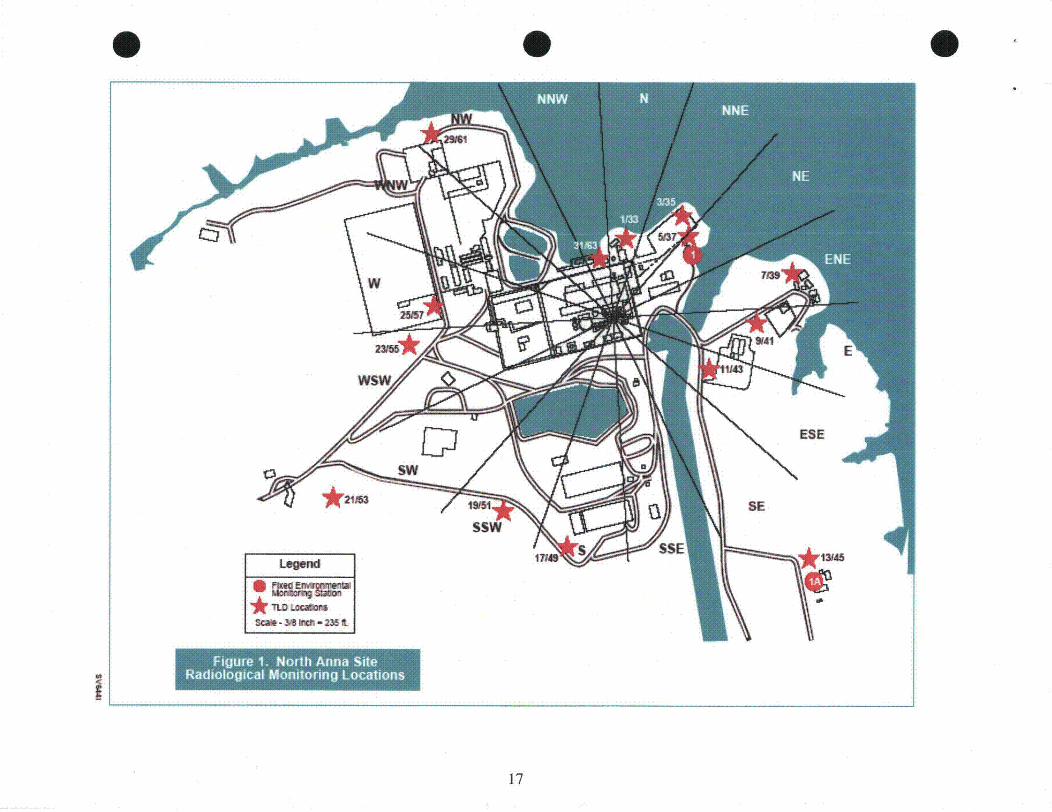
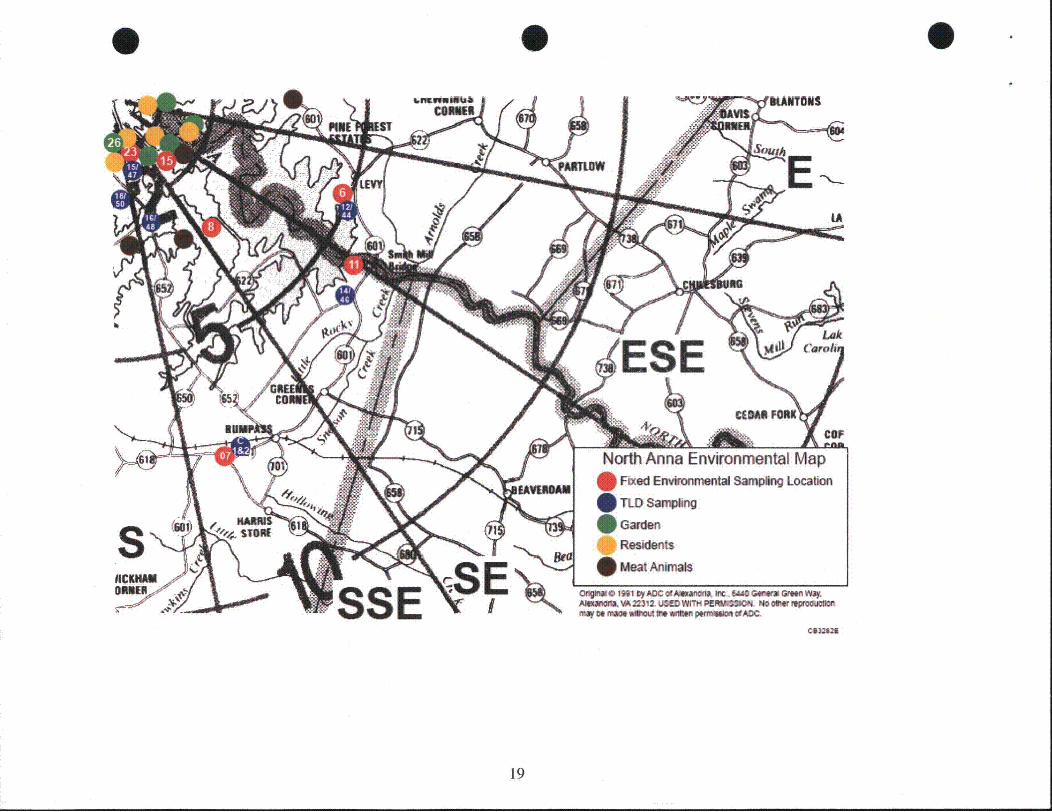
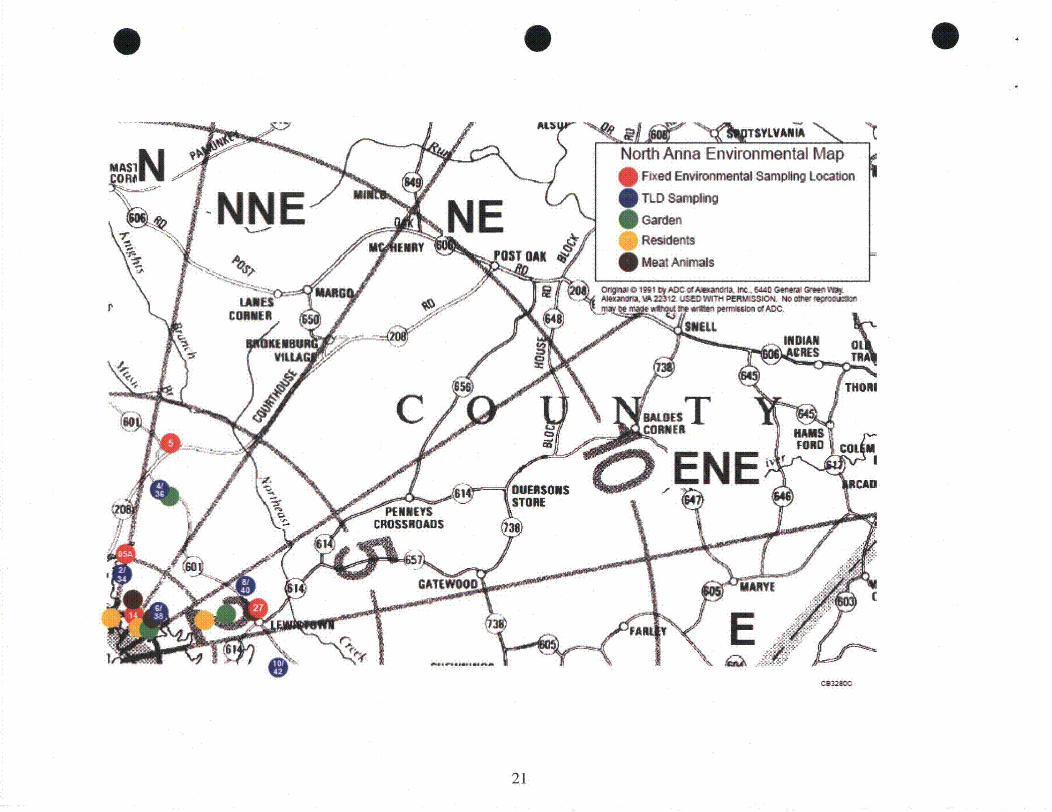
Table 2-1 summarizes the 2006 sampling program for North Anna Power Station.All samples listed in Table 2-1 are taken at indicator locations except thoselabeled "control." The North Anna Radiological Monitoring Locations maps denotesample locations for North Anna Power Station. The locations are color coded todesignate sample types. Table 2-2 summarizes the analysis program conductedby AREVA Environmental Laboratory for North Anna Power Station during theyear 2006.
Samples of various subsurface waters were taken as part of the Nuclear EnergyInstitute, NEI, Ground Water Protection Initiative. The results of these analysesare included in Appendix C of this report as part of that initiative.
S
8
* ~TABLO-1North Anna Power Station - 2006
RADIOLOGICAL SAMPLING STATIONDISTANCE AND DIRECTION FROM UNIT NO. 1
Collection
Sample Media Location Station Distance Direction Degrees Frequency RemarksEnvironmental NAPS Sewage Treatment Plant 01Thermoluminescent Fredericks Hall 02
Dosimetry (TLD) Mineral, Va 03Wares Crossroads 04
Route 752 05
Sturgeon's Creek Marina 05ALevy, VA 06
Bumpass, VA 07End of Route 685 21
Route 700 22
"Aspen Hills" 23
Orange, VA 24Bearing Cooling Tower N- 1/33
Sturgeon's Creek Marina N-2/34Parking Lot "C" (on-site) NNE-3/35
Good Hope Church NNE-4/36Parking Lot "B" ' NE-5/37
* In October 1991 the Surface Water Sample location at station 09 was moved to 09A.** Shoreline soil was changed from station 09 to 08 effective with the August 1996 sample.
LocationElk Creek ChurchNAPS Access Rd.Route 618500kv TowerRoute 700NAPS Radio TowerRoute 700 (Exclusion Boundary)South Gate SwitchyardRoute 685End of Route 685Route 685North Gate - Construction Side
Laydown AreaLake Anna Campground#1/#2 IntakeRoute 208Bumpass Post OfficeOrange, VAMineral, VALouisa, VA
ControlControlControlControl
Airborne Particulateand Radioiodine
NAPS Sewage Treatment PlantFredericks HallMineral, VAWares CrossroadsRoute 752Sturgeon's Creek MarinaLevy, VABumpass, VA
0102
03
04
05
05A
06
07
0.205.307.105.104.202.044.707.30
NESSWWSWWNWNNENESESSE
4202030
2430
2870
200
1101150
1670
WeeklyWeekly
Weekly
Weekly
Weekly
Weekly
Weekly
Weekly
* In October 1991 the Surface Water Sample location at station 09 was moved to 09A.** Shoreline soil was changed from station 09 to 08 effective with the August 1996 sample.
10
* ~TABLO-1North Anna Power Station - 2006
RADIOLOGICAL SAMPLING STATIONDISTANCE AND DIRECTION FROM UNIT NO. I
Sample MediaAirborne Particulateand Radioiodine
LocationEnd of Route 685Route 700"Aspen Hills"Orange, VA
* In October 1991 the Surface Water Sample location at station 09 was moved to 09A.** Shoreline soil was changed from station 09 to 08 effective with the August 1996 sample.
11
TAB*-1North Anna Power Station - 2006
RADIOLOGICAL SAMPLING STATIONDISTANCE AND DIRECTION FROM UNIT NO. 1
0N
Sample MediaSoil
LocationRoute 752Sturgeon's Creek MarinaLevy, VABumpass, VAEnd of Route 685Route 700 (Exclusion Boundary)"Aspen Hills"Orange, VA
Station0505A060721222324
Distance4.20
2.04
4.70
7.30
1.00
1.00
0.93
22.00
DirectionNNENESESSEWNWWSWSSENW
Degrees200
1101150
1670
3010
2420
1580
3250
CollectionFrequency
Once/3 yearsOnce/3 yearsOnce/3 yearsOnce/3 yearsOnce/3 yearsOnce/3 yearsOnce/3 yearsOnce/3 years
1.37 SE 1330 Monthly if available or at harvestRoute 614
Route 629/522 12.60 NW
0.93 SSEAspen Hills
3140 Monthly if available or at harvest
1580 Monthly if available or at harvest
172 0 Monthly if available or at harvest
Control
"Historic Lane" 1.15 S
* In October 1991 the Surface Water Sample location at station 09 was moved to 09A.** Shoreline soil was changed from station 09 to 08 effective with the August 1996 sample.
12
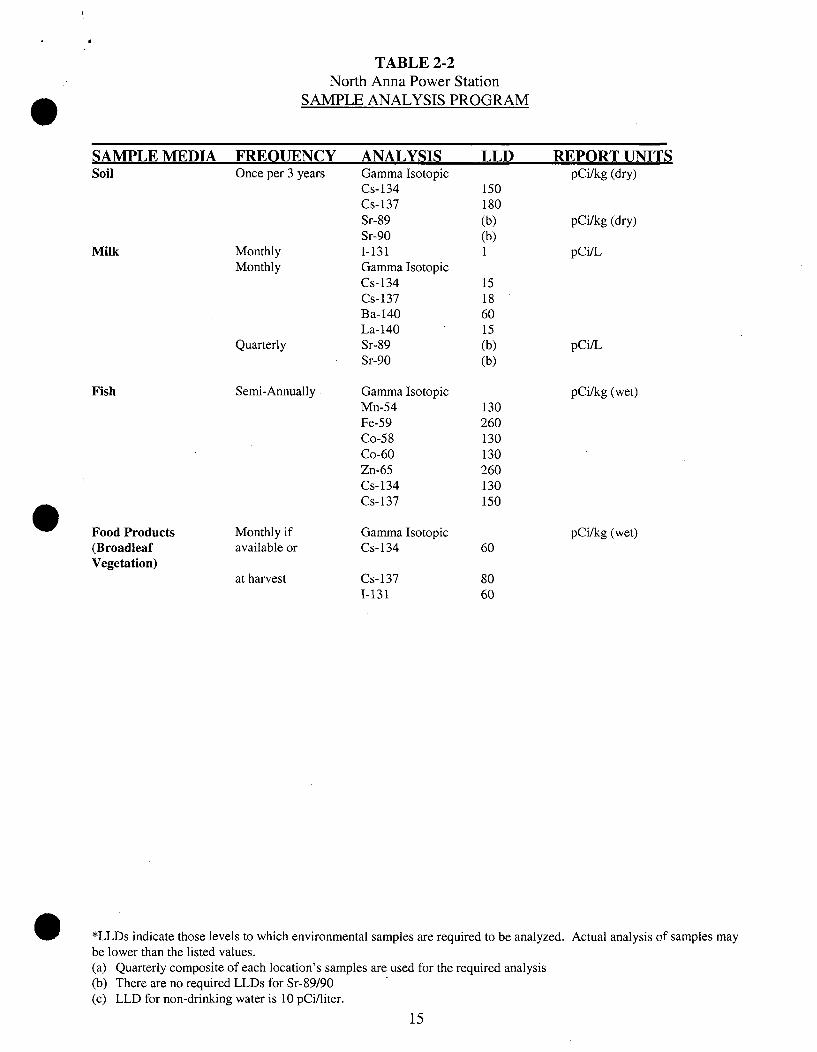
TABLE 2-2North Anna Power Station
SAMPLE ANALYSIS PROGRAM
SAMPLE MEDIA FREQUENCY ANALYSIS LLD REPORT UNITSThermoluminescentDosimetry (TLD)(84 TLDs)
*LLDs indicate those levels to which environmental samples are required to be analyzed. Actual analysis of samples maybe lower than the listed values.(a) Quarterly composite of each location's samples are used for the required analysis(b) There are no required LLDs for Sr-89/90(c) LLD for non-drinking water is 10 pCi/liter.
Actual analysis of samples may0 *LLDs indicate those levels to which environmental samples are required to be analyzed.be lower than the listed values.(a) Quarterly composite of each location's samples are used for the required analysis(b) There are no required LLDs for Sr-89/90(c) LLD for non-drinking water is 10 pCi/liter.
0 *LLDs indicate those levels to which environmental samples are required to be analyzed. Actual analysis of samples maybe lower than the listed values.(a) Quarterly composite of each location's samples are used for the required analysis(b) There are no required LLDs for Sr-89/90(c) LLD for non-drinking water is 10 pCi/liter.
15
Legend For The North Anna Power StationEnvironmental Monitoring Stations Overview Maps
MapDesignation
Environmental StationIdentification
MapDesignation
1
1A
2
3
4
5
5A
6
7
8
9AS 11
12
13
14
15
16
21
22
23
24
25
26
(a) 01,NE-5/37
01A,SE-13/45
(a) 02,SSW-20/52
(a) 03,C-5/6
(a) 04
(a) 05
(a) 05A,N-2/34
(a) 06,ESE-12/44
(a) 07,C-1/2
08-Water, Fish Sediment,
Shoreline Soil
09A-Water sample, sediment
11-River Water, Sediment
12-Milk
13-Milk
14-Vegetation, NE-6/38
Vegetation
Vegetation
(a) 21,WNW-27/59
(a) 22,WSW-24/56
(a) 23-SSE-15/47
(a)(b) 24,C-3/4
(c) 25-Fish
26-Vegetation
27
7/8
1/33
31/63
29/61
3/35
7/39
9/41
11/43
17/49
19/51
21/53
23/55
25/57
16/48
18/50
14/46
22/54
26/58
28/60
32/64
8/40
4/36
10/42
EnvironmentalStation
27-Milk
C-7/8
N-1/33
NNW-31/63
NW-29/61
NNE-3/35
ENE-7/39
E-9/41
ESE- 11/43
S-17/49
SSW-19/51
SW-21/53
WSW-23/55
W-25/57
SSE-16/48
S-18/50
SE-14/46
SW-22/54
W-26/58
WNW-28/60
NNW-32/64
ENE-8/40
NNE-4/36
E- 10/42
(a) Indicates air sample station, annual and quarterly TLD, Triennial soil.(b) In Orange(c) In Lake Orange
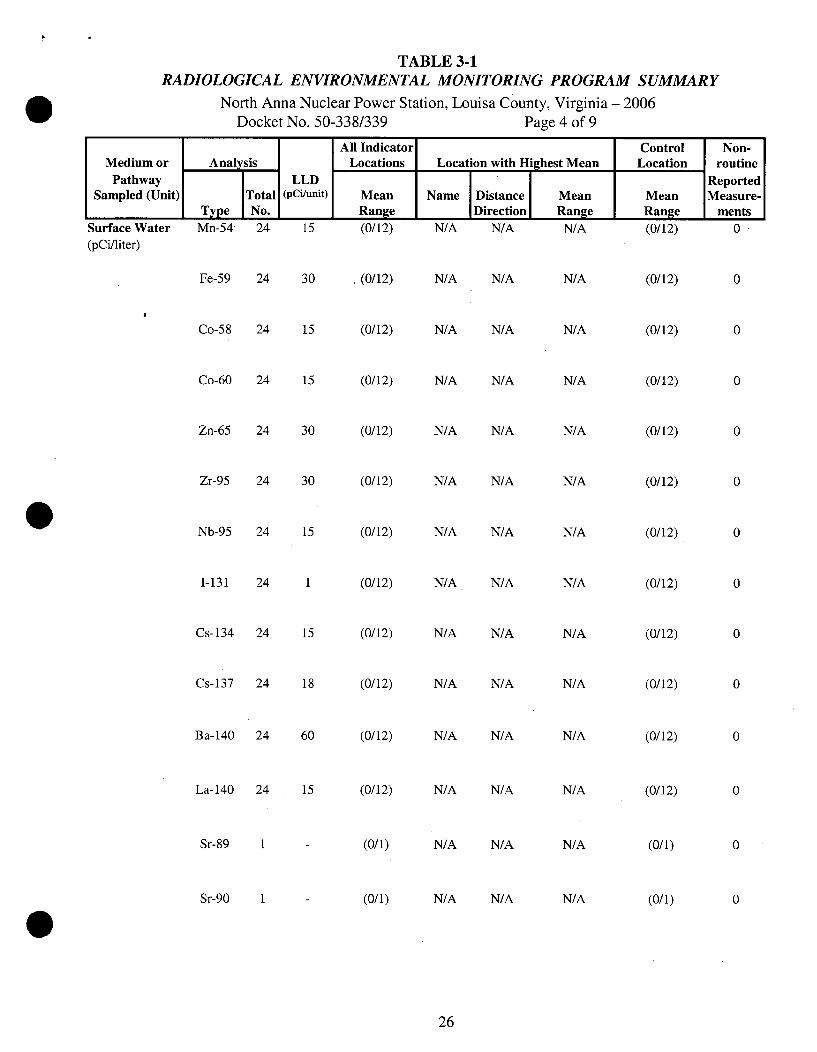
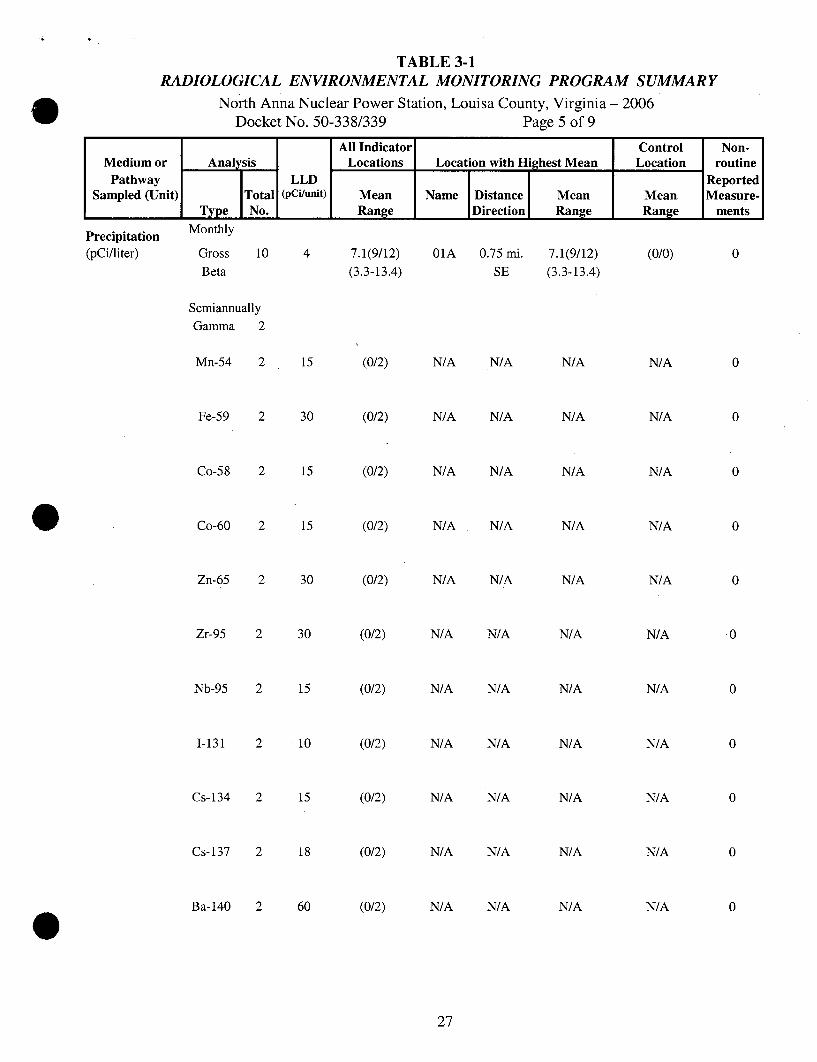
In accordance with the North Anna Offsite Dose Calculation Manual (ODCM), asummary table of the analytical results has been prepared and is presented inTable 3-1. This data is presented in accordance with the format of the USNRCBranch Technical Position, "Acceptable Radiological Environmental MonitoringProgram", Rev. 1, November 1979. The LLD listed value is taken from the ODCM.
A more detailed analysis of the data is given in Section 4 where a discussion of thevariations in the data explains many aspects that are not evident in the SummaryTable because of the basic limitation of data summaries.
22
TABLE 3-1RADIOLOGICAL ENVIRONMENTAL MONITORING PROGRAM SUMMARY
North Anna Nuclear Power Station, Louisa County, Virginia - 2006Docket No. 50-338/339 Page 1 of 9
All Indicator Control Non-Medium or Anal sis Locations Location with Highest Mean Location routine
Pathway LLD ReportedSampled (Unit) Total (pCi/unit) Mean Name Distance Mean Mean Measure-
Type No. ____ Range Direction Range Range mentsAir Iodine 1-131 624 0.07 (0/572) N/A N/A N/A (0/52) 0
TriennialGamma 12 Soil samples not required in 2006
Cs-134 12
Cs-137 12
Th-228 12
Sr-89 12
Sr-90 12
150
180
N/A
N/A
N/A
N/A
N/A
N/A N/A
N/A N/A
N/A N/A
N/A N/A
N/A N/A
N/A
N/A
N/A
N/A
N/A
N/A
N/A
N/A
N/A
N/A
N/A
N/A
N/A
N/A
N/A
28
TABLE 3-1RADIOLOGICAL ENVIRONMENTAL MONITORING PROGRAM SUMMARY
North Anna Nuclear Power Station, Louisa County, Virginia - 2006Docket No. 50-338/339 Page 7 of 9
All Indicator Control Non-Medium or Anal sis Locations Location with Highest Mean Location routinePathway LLD Reported
Sampled (Unit) Total (pCi/unit) Mean Name Distance Mean Mean Measure-Type No. I Range Direction Range Range ments
Shoreline Soil
(pCi/kg) (dry)Gamma
K-40
Th-228
Cs-134
Cs-137
Sr-89(Annually)
Sr-90(Annually)
Gamma
K-40
1-131
Cs-134
Cs-137
Ba-140
2
2
2
2
2
1
1
24
24
24
24
24
24
5055(2/2)(2200-7910)
- 1210(1/2)
(1210)
150 (0/2)
180 (0/2)(N/A)
- (0/1)
- (0/1)
8
8
N/A
N/A
N/A
N/A
12
N/A
N/A
N/A
N/A
3.37 mi.
SSE
3.37 mi.SSE
N/A
N/A
N/A
N/A
5055(2/2)
(2200-7910)
1210(1/2)(1210)
N/A
N/A
N/A
N/A
N/A
N/A
N/A
N/A
N/A
N/A
Milk(pCi/liter)
1
15
18
60
1355(24/24)
(1210-1440)
(0/24)
(0/24)
(0/24)
(0/24)
8.3 mi.NW
N/A
N/A
N/A
N/A
1357(12/12)(1230-1430)
N/A
N/A
N/A
N/A
N/A
N/A
N/A
N/A
N/A
0
0
0
0
0
29
TABLE 3-1RADIOLOGICAL ENVIRONMENTAL MONITORING PROGRAM SUMMARY
North Anna Nuclear Power Station, Louisa County, Virginia - 2006Docket No. 50-338/339 Page 8 of 9
All Indicator Control Non-Medium or Anal sis Locations Location with Highest Mean Location routine
Pathway LLD ReportedSampled (Unit) Total (pah/uwit) Mean Name Distance Mean Mean Measure-
Type No. I Range Direction Range Range ments
Milk(pCi/liter)
La-140 24 15 (0/24) N/A N/A N/A N/A 0
Fish
(pCi/kg) (wet)
Sr-89(Quarterly)
Sr-90(Quarterly)
Gamma
K-40
Mn-54
Fe-59
Co-58
Co-60
Zn-65
Cs- 134
Cs-137
(0/8)
(0/8)
130
260
130
130
260
130
150
1313(4/4)(1010-1460)
(0/4)
(0/4)
(0/4)
(0/4)
(0/4)
(0/4)
(0/4)
N/A
N/A
08
N/A
N/A
N/A
N/A
N/A
N/A
N/A
N/A
N/A
3.37 mi.
SSE
N/A
N/A
N/A
N/A
N/A
N/A
N/A
N/A
N/A
1313(4/4)(1010-1460)
N/A
N/A
N/A
N/A
N/A
N/A
N/A
N/A
N/A
1773(4/4)(1460-2050)
(0/4)
(0/4)
(0/4)
(0/4)
(0/4)
(0/4)
(0/4)
0
0
30
TABLE 3-1RADIOLOGICAL ENVIRONMENTAL MONITORING PROGRAM SUMMARY
North Anna Nuclear Power Station, Louisa County, Virginia - 2006Docket No. 50-338/339 Page 9 of 9
All Indicator Control Non-Medium or Anal sis Locations Location with Highest Mean Location routinePathway LLD Reported
Sampled (Unit) Total (PC/unit) Mean Name Distance Mean Mean Measure-Type INo. Range Direction Range Range ments
Food
Vegetation(pCi/kg) (wet)
Gamma 20
Be-7 20
K-40 20
- 2510(23/24)
(550-8030)
- 12583(24/24)
(2870-27700)
14 varies 3102(6/6)NE (910-7180)
2758(5/6)(970-6670)
14 varies 3102(6/6) 2758(5/6)
NE (910-7180) (970-6670)
1-131 20 60 (0/24)
Cs- 134 20 60 (0/24)
Cs-137 20 80 88(1/24)(88)
N/A N/A N/A
N/A N/A N/A
15 varies 88(1/6)
SE (88)
26 varies 294(2/6)
S (147-440)
23 0.93 mi. 5.6(4/4)
SSE (5.1-6.1)
(0/6)
(0/6)
(0/6)
(0/6)
0
0
0
0
0
0
0
Th-228 20 267(4/24)
(147-440)
Direct
Radiation(mR/std. month)(EnvironmentalTLDs)
Direct
Radiation(mR/std. Month)(Annual TLDs)
DirectRadiation(mR/std. Month)
(Sector TLDs)
GammaDose
48 2 3.8(44/44)(2.3-6.1)
3.5(4/4)(3.1-4.6)
Gamma 12Dose
2 3.4(11/11)(1.9-5.1)
23 0.93 mi. 5.1(1/1)SSE (5.1)
3.6(1/1)(3.6)
0
Gamma 256
Dose
2 5.5(256/256) 19/51"') 0.42 mi.
(1.6-38.3) SSW
27.8(8/8)(16.0-38.3)
3.4(32/32)
(1.9-4.8)
0
(1) 19/51 located onsitenear ISFSI.
31
3.2 Analytical Results of 2006 REMP Samples
Radiological analyses of environmental media characteristically approach andfrequently fall below the detection limits of state-of-the-art measurement methods.The data reported in the following tables are strictly counting statistics. Thereported error is two times the standard deviation (2a) of the net activity. Unlessotherwise noted, the overall error (counting, sample size, chemistry, errors, etc.) isestimated to be 2 to 5 times that listed. Results are considered positive when themeasured value exceeds 1.5 times the listed 2y error (i.e., the measured valueexceeds 3cy).
Because of counting statistics, negative values, zeros and numbers below theMinimum Detectable Level (MDL) are statistically valid pieces of data'. For thepurposes of this report all valid data are presented in order to indicate anybackground biases. AREVA Environmental Laboratory's analytical methods meetthe Lower Limit of Detection (LLD) requirements given in Table 2 of the USNRCBranch Technical Position, "An Acceptable Radiological Environmental MonitoringProgram", (November 1979, Revision 1) and the North Anna ODCM.
Data are given according to sample type as indicated below.1. Gamma Exposure Rate2. Air Particulates, Gross Beta Radioactivity3. Air Particulates, Weekly 1-1314. Air Particulates, Quantitative Gamma Spectra5. Air Particulate Strontium6. Soil7. Precipitation8. Cow Milk9. Food Products and Vegetation10. Well Water11. River Water12. Surface Water13. Bottom Sediment/Silt14. Shoreline Soil15. Fish
Analytical results are handled as recommended by HASL ("Reporting of Analytical Results from
HASL," letter by Leo B. Higginbotham) and NUREG/CR-4007 (Sept. 1984).
Period Station Station Station Stato Station Station StationEnding 01 02 03 041 05 05A 0607/05/06 43.2 +-6.7 37.3 +- 5.4 35.5 +-5.3 30.3 +- 5.1 29.7 +- 5.1 33.4 +- 5.2 22.1 +- 4.7
Date K-40 Mn-54 Fe-59 Co-58 Co-60 Zn-65 Cs-i 34 Cs-137
03/20/06 1870.0 +/- 680.0
10/18/06 1460.0 +/- 250.0
9.0 +/- 22.0 -15.0 +/- 63.0
6.0 +/- 10.0 -15.0 +/- 23.0
3.0 +/- 28.0
8.0 +/- 10.0
0.0 +/- 32.0
2.0 +/- 10.0
-22.0 +/- 56.0
9.0 +/- 23.0
6.0 +/- 19.0
3.0 +/- 11.0
-1.0 +/- 29.0
-1.0 +/- 10.0
[a] Non-bottom dwelling species of gamefish.
[b] Bottom dwelling species of fish.
58
. 4. DISCUSSION OF RESULTS
Data from the radiological analyses of environmental media collected during 2006and tabulated in Section 3, are discussed below. Except for TLDs, AREVAEnvironmental Laboratory analyzed all samples throughout the year. Theprocedures and specifications followed for these analyses are as required in theAREVA Environmental Laboratory quality assurance manuals and laboratoryprocedures. In addition to internal quality control measurements performed byeach laboratory, they also participate in an Interlaboratory Comparison Program.Participation in this program ensures that independent checks on the precisionand accuracy of the measurements of radioactive material in environmentalsamples are performed. The results of the Interlaboratory Comparison Programsare provided in Appendix B.
The predominant radioactivity detected throughout 2006 was that from externalsources, such as fallout from nuclear weapons tests and naturally occurringradionuclides. Naturally occurring nuclides such as Be-7, K-40, and Th-228 weredetected in numerous samples. Th-228 results were variable and are generally atlevels higher than plant related radionuclides.
The following is a discussion and summary of the results of the environmental. measurements taken during the 2006 reporting period.
4.1 Gamma Exposure Rate
A thermoluminescent dosimeter (TLD) is an inorganic crystal used to detectambient radiation. TLDs are placed in two concentric rings around the station.The inner ring is located at the site boundary, and the outer ring is located atapproximately five miles from the station. TLDs are also placed in special interestareas, such as population areas and nearby residences. Additional TLDs serve ascontrols. Ambient radiation comes from naturally occurring radioisotopes in theair and soil, radiation from cosmic origin, fallout from nuclear weapons testing,station effluents and direct radiation from the station.
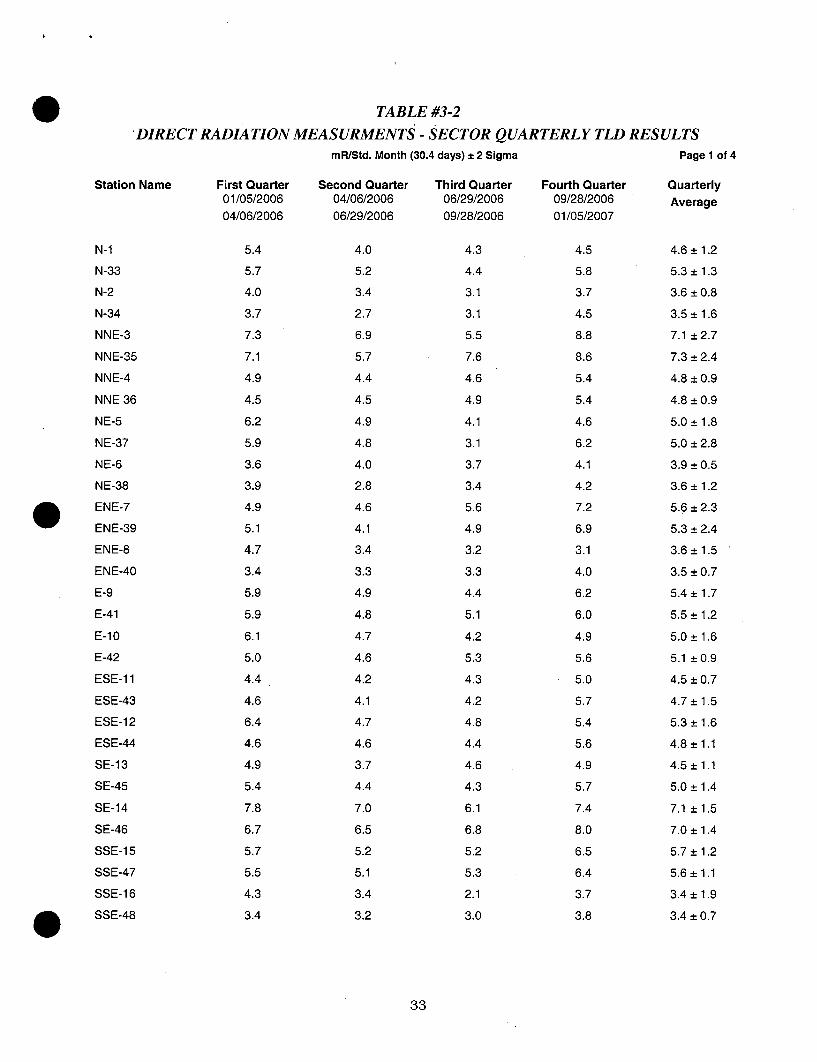
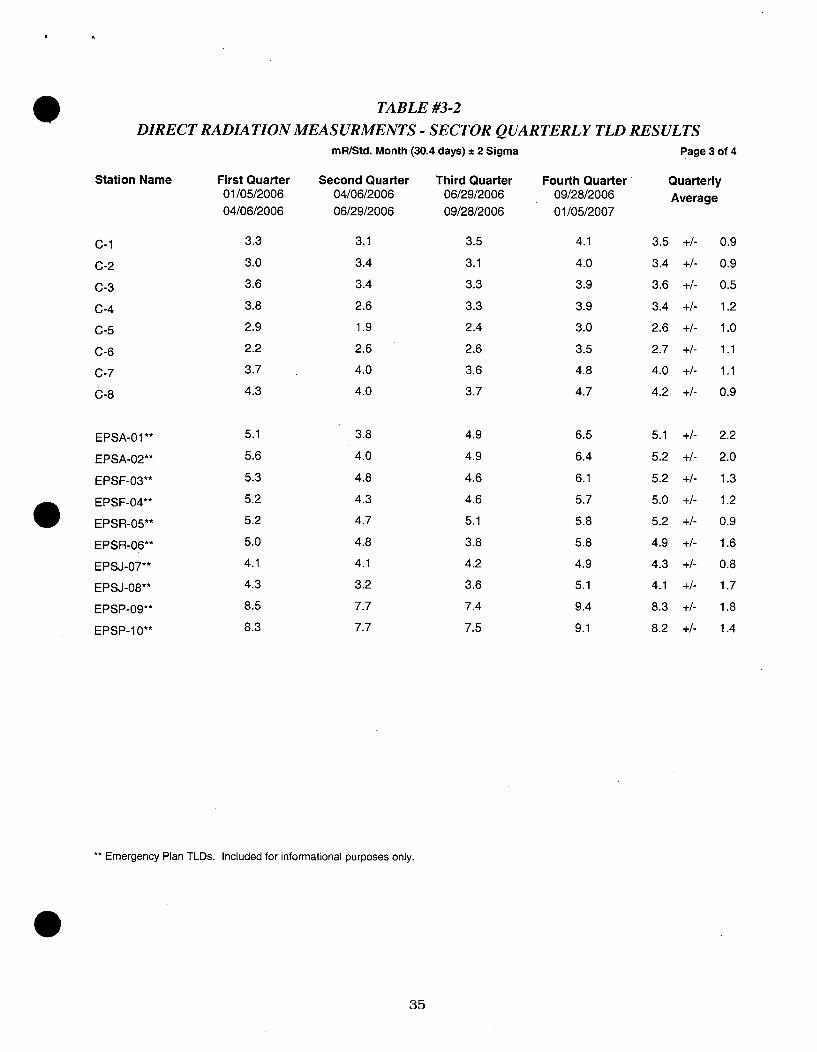
The results of the analyses are presented in Table 3-2. Figure 4-1 shows ahistorical trend of TLD exposure rate measurements. Control and indicatoraverages indicate a steady relationship. Two dosimeters made of CaF and LiFsensitive elements are deployed at each sampling location. These TLDs replacedthe previously used CaSO4:Dy in Teflon TLDs in January 2001. The dose with thereplacement TLDs is lower than that of the previously used TLDs. This willcontinue to be monitored.
59
Figure 4-1: Environmental Radiation - TLDs
10.0
- -- Environmental- TL-- --- - t -- ------Ave.-Pre-op. --0
Sector TLDs are deployed quarterly at thirty-two locations in the environs of theNorth Anna site. Two badges are placed at each location. The average level of the32 locations (two badges at each location) was 5.5 mR/standard month with arange of 1.6 to 38.3 mR/standard month. The highest quarterly average readingand highest single quarter average for any single location were obtained atlocation SSW-19/51. These values were 27.8 mR/standard month and 32.6
* mR/standard month, respectively. This location is on site directly across theaccess road from the Independent Spent Fuel Storage Facility. The higher valuescan thus be attributed to the spent fuel stored in the ISFSI. Quarterly and annualTLDs are also located at each of the twelve environmental air sampling stations.For the eleven locations within 10 miles of the station the average quarterlyreading was 3.8 mR/standard month with a range of 2.3 to 6.1 mR/standardmonth. The average annual reading for these locations was 3.4 mR/standardmonth with a range of from 1.9 to 5.1 mR/standard month. The control locationshowed a quarterly average of 3.5 mR/standard month with a range of 3.1 to 4.6mR/standard month. Its annual reading was 3.6 mR/standard month. Eightother TLDs, designated C- 1 thru C-8, were collected quarterly from four locationsand showed an average reading of 3.4 mR/standard month with a range of 1.9 to4.8 mR/standard month. During the pre-operational period (starting in 1977) thedoses were measured between 4.3 and 8.8 mR/standard month.
60
4.2 Airborne Gross Beta
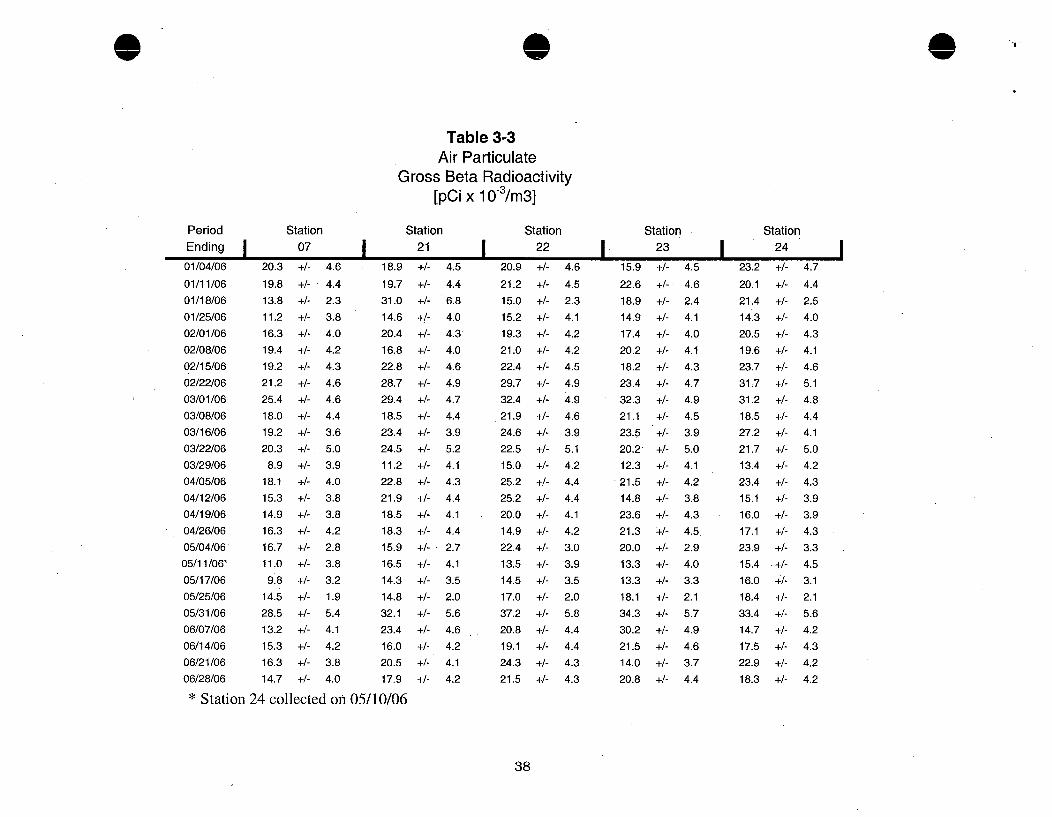
Results of the weekly gross beta analyses are presented in Table 3-3. A review ofthe historical plot in Figure 4-2, indicates gross beta activity levels have remainedrelatively unchanged. Inner and outer ring monitoring locations continue to showno significant variation in measured activities (see Figure 4-3). This indicates thatany station contribution is not measurable.
Gross beta activity found during the pre-operational and early operating period ofNorth Anna Power Station was higher because of nuclear weapons testing. Duringthat time, nearly 740 nuclear weapons were tested worldwide. In 1985 weaponstesting ceased, and with the exception of the Chernobyl accident in 1986, airbornegross beta results have remained steady. During the preoperational period of July1, 1974 through March 31, 1978 gross beta activities ranged from a low of 0.005
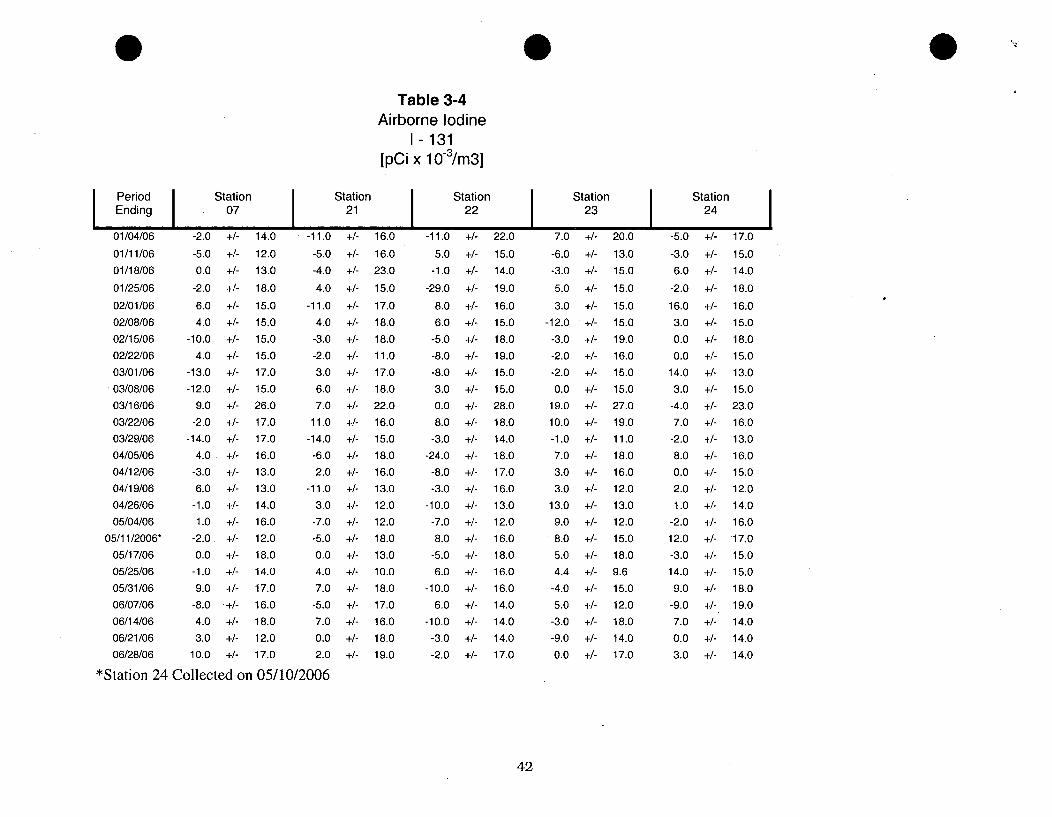
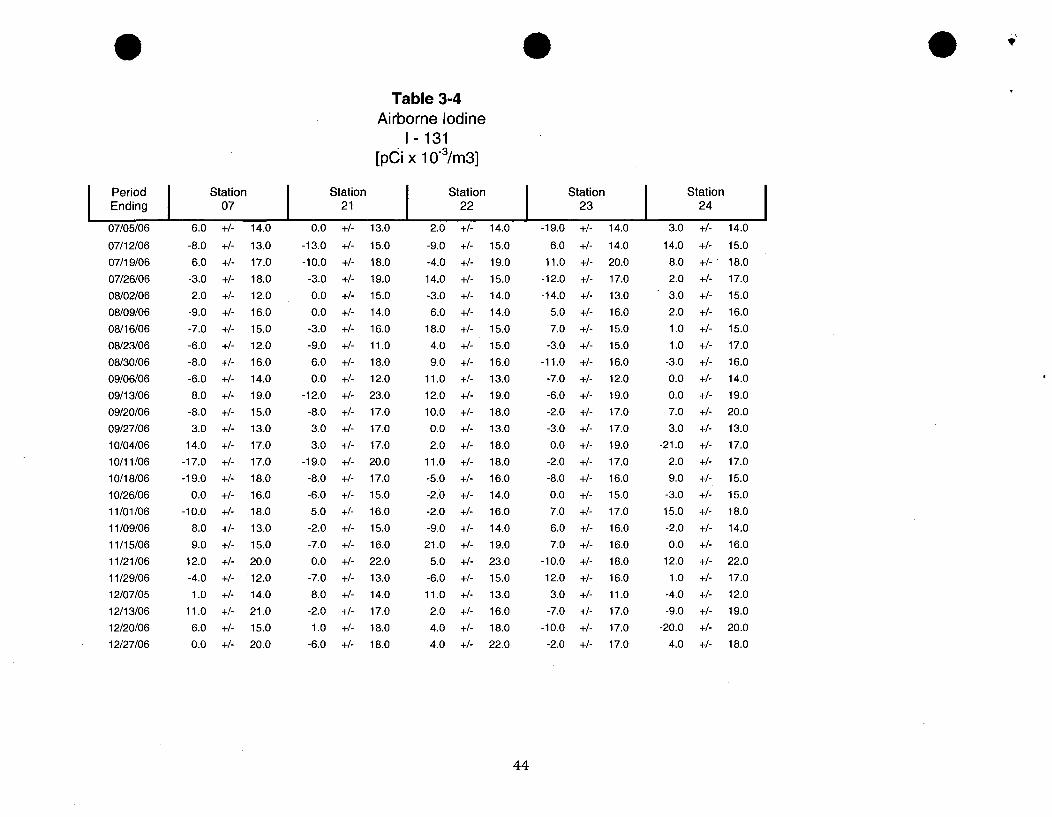
Charcoal cartridges are used to collect airborne radioiodine. Once a week thesamples are collected and analyzed. The results of the analyses are presented inTable 3-4. All results are below the lower limit of detection with no positiveactivity detected. These results are similar to pre-operational data and the resultsof samples taken prior to and after the 1986 accident in the Soviet Union atChernobyl.
4.4 Air Particulate Gamma
The air particulate filters that are utilized for the weekly gross beta analyses arecomposited by location and analyzed quarterly by gamma spectrometry. Theresults are listed in Table 3-5. The results indicate the presence of naturallyoccurring Be-7, which is produced by cosmic processes. Examination of pre-operational data indicates comparable measurements of Be-7, as would beexpected. No other positive results were seen. These analyses indicate the lack ofstation effects.
44.5 Air Particulate Strontium
62
Strontium-89 and 90 analyses were performed on the second quarter compositesof air particulate filters from all twelve monitoring stations. The results are listedin Table 3-5. There was no detection of these fission products at any of theindicator or control stations.
4.6 Soil
Soil samples, which are collected every three years from twelve stations, werecollected in 2004 and therefore not collected in 2006.
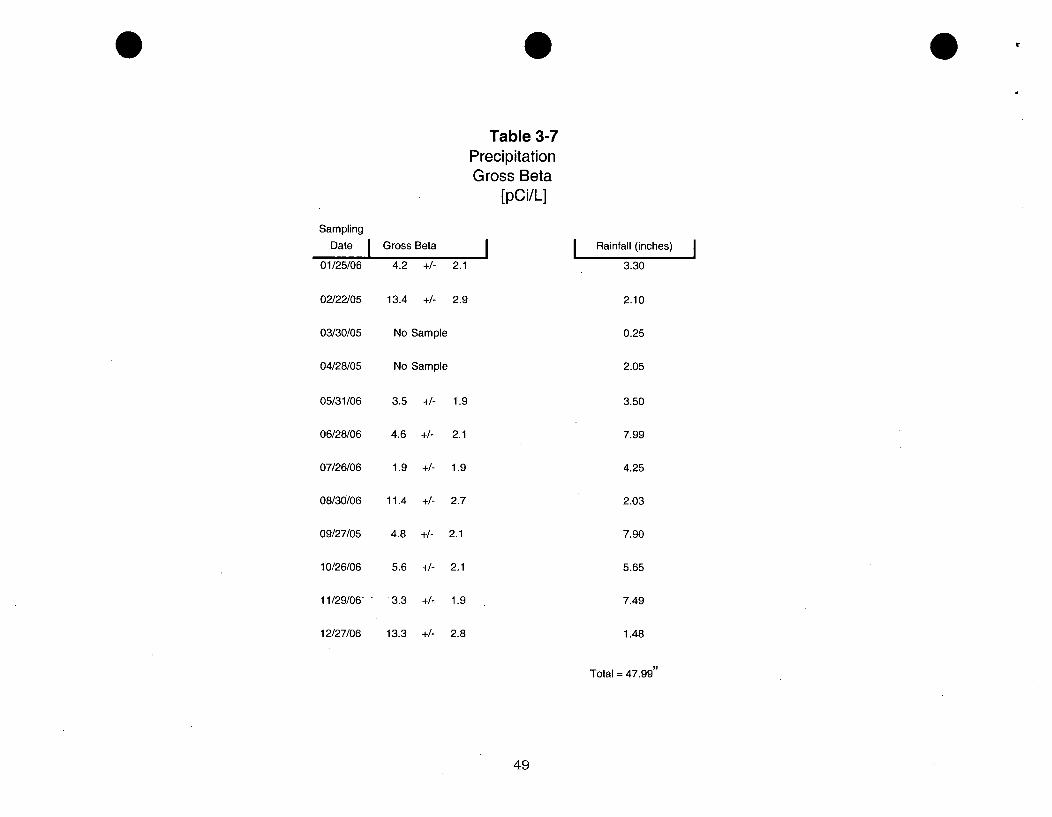
4.7 Precipitation
A sample of rain water was collected monthly at on-site station 01A and analyzedfor gross beta activity. The results are presented in Table 3-7. Ten precipitationsamples were obtained with no samples available for two months due to drought.Nine of the ten precipitation samples showed positive results in 2006. Theaverage annual gross beta activity was 7.1 pCi/liter with a range from 3.3 to 13.4pCi/liter. Semi-annual composites were prepared and analyzed for gammaemitting isotopes and tritium. No positive indications of gamma emittingradioisotopes were observed in the semi-annual composite samples for 2006.During the pre-operational period gross beta activity in rain water was expressedin nCi per square meter of the collector surface, thus a direct comparison can notbe made to the 2006 period. During the pre-operational period, tritium wasmeasured in over half of the few quarterly composites made. This tritium activityranged from 100 to 330 pCi/liter.
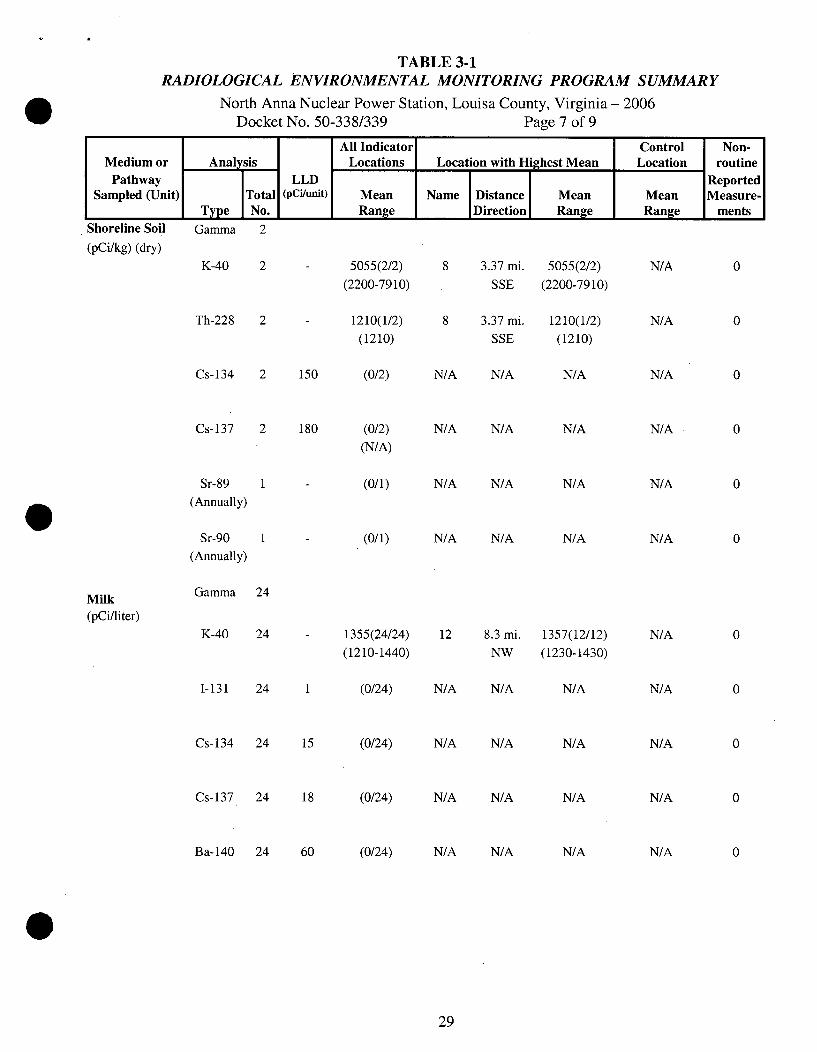
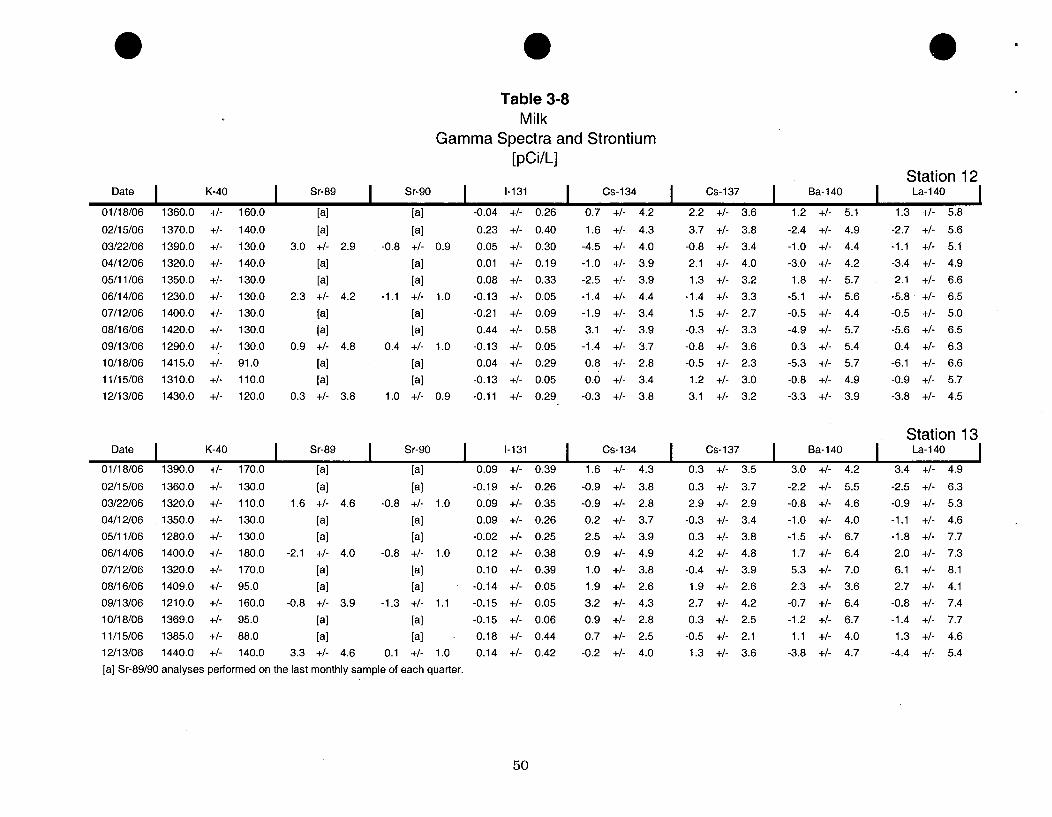
4.8 Cow Milk
Analysis of milk samples is generally the most sensitive indicator of fissionproduct existence in the terrestrial environment. This, in combination with thefact that consumption of milk is significant, results in this pathway usually beingthe most critical from the plant release viewpoint. This pathway also showsmeasurable amounts of nuclear weapons testing fallout. Therefore, this medianeeds to be evaluated very carefully when trying to determine if there is any planteffect.
Analysis results for cow milk are contained in Table 3-8. All results show nodetectable I- 131 above the LLD of 1 pCi/1. Results of gamma ray spectroscopyindicate no detectable plant related radioactivity in the milk samples. In years
* past, Cs-137 has been detected sporadically. The occurrences were attributed toresidual global fallout from past atmospheric weapons testing. Cs- 137 was notdetected at a level above the LLD in 2006.
63
w Once each quarter a sample from each of the two collection stations is analyzed forstrontium-89 and strontium-90. Neither Sr-89 not Sr-90 were detected. Sr-90has been observed in the past. Pre-operational levels of 2.2 to 5.4 pCi/liter weremeasured for Sr-90. There has been a long-term activity trend for Sr-90 showinga continuous decline. It should be noted that strontium-90 is not a part of stationeffluents. Its detection is the product of nuclear weapons testing fallout. Thisconclusion can be made based upon the fact that Sr-89 and Sr-90 have not beendetected in effluents released from the station in many years, and the trend ofconsistent declining levels since the pre-operational period.
4.9 Food Products and Vegetation
Twenty-four food/vegetation samples were collected from five locations andanalyzed by gamma spectrometry. The results of the analyses are presented inTable 3-9. Cs-137 was detected at 88 pCi/kg in one sample, as has occurredintermittently in previous years. As expected, naturally occurring potassium-40was detected in all samples, cosmogenic beryllium-7 was detected in mostsamples, and thorium-228 was detected in some samples.
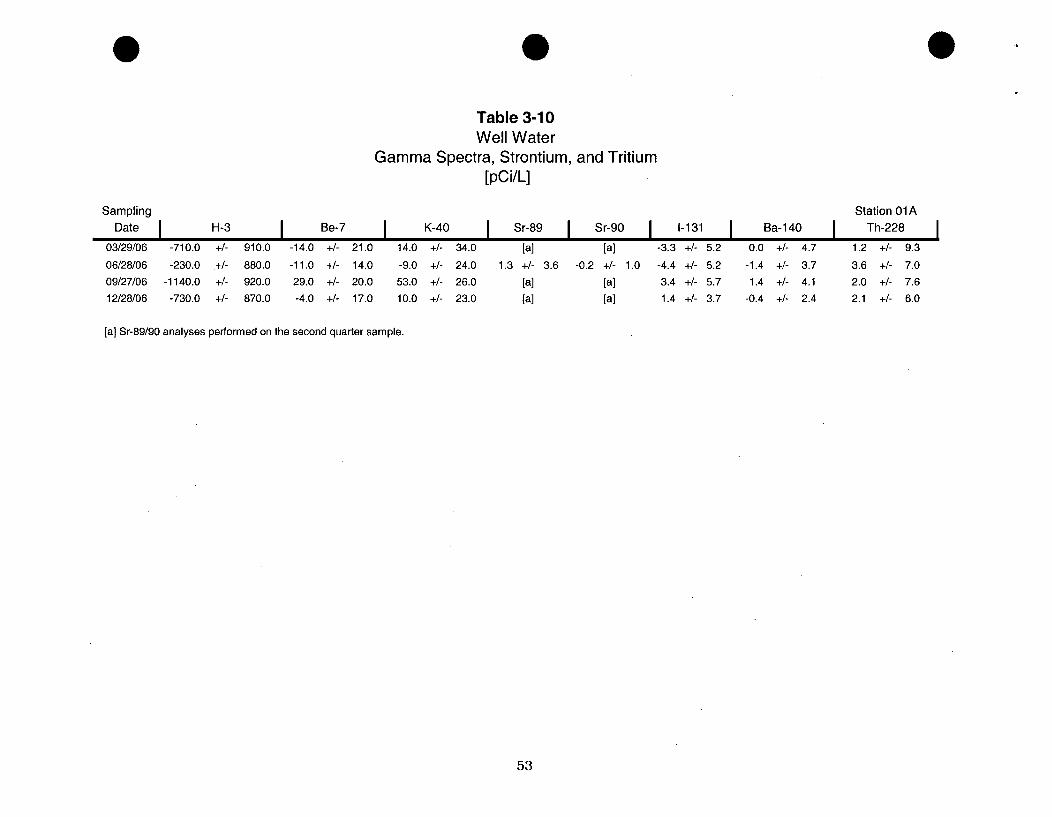
4.10 Well Water
Water was sampled quarterly from the on site well at the metrology laboratory.These samples were analyzed for gamma radiation and for tritium. The secondquarter sample was analyzed for strontium-89 and strontium-90. The results ofthese analyses are presented in Table 3-10. Consistent with past monitoring, noplant related radioactivity was detected. No gamma emitting isotopes were detectedduring the pre-operational period.
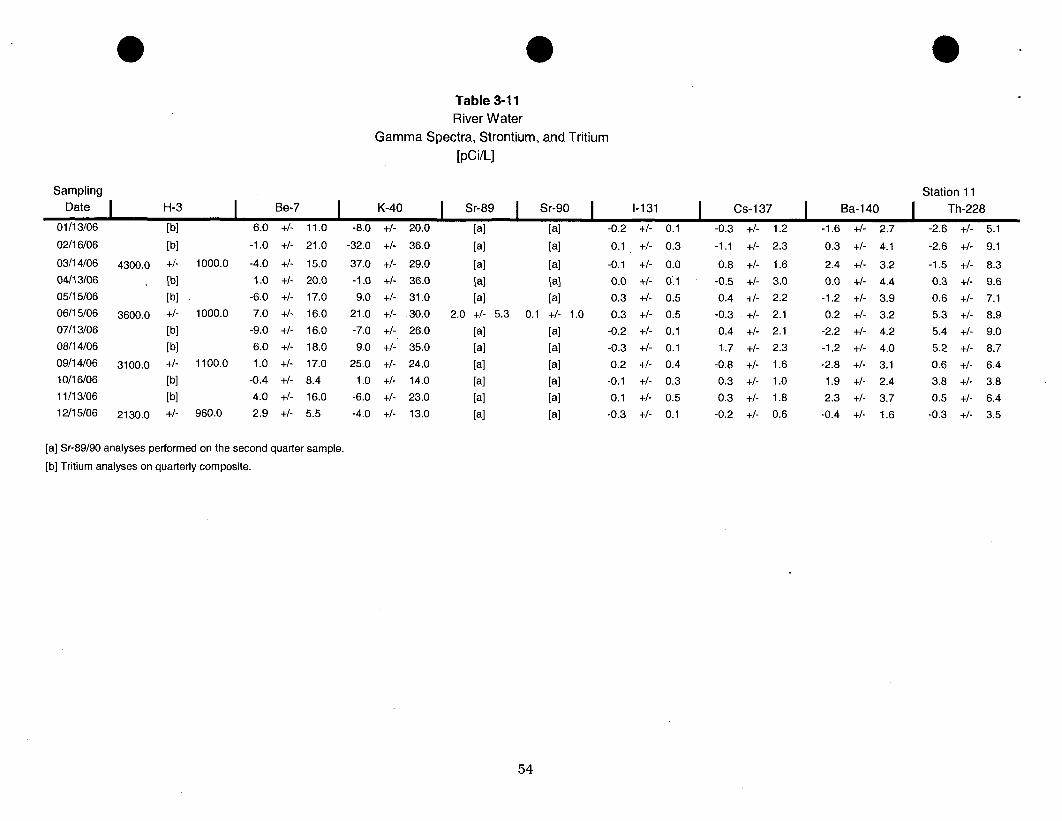
4.11 River Water
A sample of water from the North Anna River was collected monthly, the analysesare presented in Table 3-11. All monthly samples are analyzed by gammaspectroscopy. The monthly samples were composited quarterly and analyzed fortritium, the second quarter samples were additionally analyzed for strontium-89and strontium-90. No gamma emitting radioisotopes were detected in any of thesamples. There was no measured activity of strontium-89 or strontium-90.
* Tritium was measured in all four samples with an average annual concentration of3283 pCi/liter and a range of 2130 to 4300 pCi/liter. These levels are comparableto those observed in previous years, see Figure 4-4. No river water samples were
64
collected during the pre-operational period.
Figure 4-4: Tritium in River Water
10000
0z
1
10()(I) II1
I00 . . 00 OW M . . . . W 00 O . . .00 00 00 00 00 O7N ON ON ON ON ON O, ON ON ON 8 0 0 0 0ON ON ONý ON ON ON ON1 ON O11 OI C\0 ' ON ON ý ON CN 0 0 0 00 0
- - -- - - - - - -- - - - - - - -'4e C4 (N
-4--Tritium - - A - -Required LLD
4.12 Surface Water
Samples of surface water were collected monthly from two stations, an indicatorstation located at the discharge lagoon and a control station located 12.9 milesWNW. The samples were analyzed by gamma ray spectrometry and for iodine- 131by radiochemical separation. A quarterly composite from each station wasprepared and analyzed for tritium, and the second quarter samples wereadditionally analyzed for strontium-89 and strontium-90. The results arepresented in Table 3-12.Neither gamma emitting radioisotopes nor iodine were detected in any of thesamples. The average level of tritium activity at the indicator station was 3625pCi/liter with a range of 2900 to 4100 pCi/liter. Levels of tritium have beenincreasing since 1978 when the average level was below 300 pCi/liter. Levelsmeasured at the indicator location (Station 8) are comparable to those measuredsince 1986, see Figure 4-5. During the pre-operational period tritium wasmeasured in several samples with concentrations between 90 and 250 pCi/liter.
65
Figure 4-5: Tritium in Surface Water
10000
Z 1000
S
100r,-00o~o~r-r-oo~ I
CO CO CO CO-~ ~C
- Ni M~ 'I k \ r- 00 C) CD - Ni M r T V 0 r- WoO C\ 0 Mi "T V- \C
C? 0? C O O C O CO ?C ? O? CO, CO 91 9\ CO C CO CO CO1 ICO CO C? C? O C
I Tritium - - N - -Required LLD - -A - Average Pre-op !
4.13 Bottom Sediment
Bottom sediment or silt is sampled to evaluate any buildup of radionuclides in theenvironment due to the operation of the station. Buildup of radionuclides inbottom sediment could indirectly lead to increasing radioactivity levels in fish.
Sediment samples were collected during March and October from each of threelocations and were analyzed by gamma spectrometry. The October samples wereanalyzed for strontium-89 and strontium-90. The results are presented in Table 3-13. Figure 4-6 shows the historical trend of Cs- 137 in sediments.
66
Figure 4-6: Cesium-137 in Sediment Silt
0
z~ 100001000
"l 10010
A A& A
~XXjX~)O(~ h~XX~k\ A
00
00
r-00
I I I I I I
00 Q00 00
0
00
Z000
000
00l
00000i
0
00
005
--- Station-8 - Station-9 * Control-Sta-09A
-x- Station-11 * Average Pre-Op --* Required LID's
* Cesium-137 was detected in the one sediment sample in 2006 at a level of 153pCi/kg. This level is consistent with the historical trend. The detection of Cs- 137in bottom sediment is historically common with positive indications usuallyapparent in both indicator and control samples. The detection of Cs-137 is theresult of accumulation and runoff into the lake of residual weapons testing fallout;its global presence has been well documented. During the pre-operational periodsediment samples were analyzed by gamma ray spectroscopy.
There was no measurable amount of strontium-89 or 90 in aquatic sediment/silt.A number of naturally occunring radioisotopes were detected in these samples atbackground levels.
4.14 Shoreline Soil
Shoreline soil/sediment, unlike bottom sediment, may provide a direct dose tohumans. Buildup of radioisotopes along the shoreline may provide a source ofdirect exposure for those using the area for commercial and recreational uses. Asample of shoreline sediment was collected in March and October from indicatorstation 08. The samples were analyzed by gamma ray spectrometry. TheSeptember sample was analyzed for strontium-89 and strontium-90. The results
* are presented in Table 3-14.
Naturally occurring radioisotopes were detected at concentrations equivalent tonormal background activities. The activities of these radioisotopes indicate a
67
steady trend. Cesium- 137 was not detected in 2006, but has been detectedintermittently in the past. No Strontium was detected. Strontium-90 is normallydetected in this media, however as discussed previously, the presence of Sr-90and Cs- 137 is attributed to accumulation of residual global fallout from pastatmospheric weapons testing.
4.15 Fish
Four sample sets of fish, two from Lake Anna and two from the control station,Lake Orange, were collected during 2006 and analyzed by gamma spectroscopy.Each sample set consisted of a sample of game species and a sample of bottom-dwelling species, which were analyzed separately. The results are presented inTable 3-15. Except for naturally occurring K-40, no other nuclide was observed inthis media in 2006. Only Cs-137 was measured in pre-operational environmentalfish samples.
68
0 5. PROGRAM EXCEPTIONS
REMP Exceptions for Scheduled Sampling and Analysis During 2006 - North Anna
Location Description Date of Sampling Reason(s) for Loss/ExceptionSta. 21
Sta. 27
Sta. 14-16, 23,26Sta. 27
Sta. 14-16, 23,26
Sta. 14-16, 23,26Sta. 27
Sta. O0A
Sta. 27
Sta. 14-16, 23,26
Sta. O0A
Sta. 05A
Sta. 27
Sta. 05A
Sta. 05A
Sta. 24
Sta. 27
Sta. 02
Sta. 27
Sta. 27
Sta. 27
Sta. 01
Sta. 14-16, 23,24
Air Iodine andParticulateMilk
Vegetation
Milk
Vegetation
Vegetation
Milk
Precipitation
Milk
Vegetation
Precipitation
Air Particulateand Iodine
Milk
Air Particulateand Iodine
Air Particulateand Iodine
Air Particulateand Iodine
Milk
Air Iodine andParticulateMilk
Milk
Milk
Air Particulateand Iodine
01/18/06
01/18/06
01/25/06
02/15/06
02/22/06
03/16/06
03/22/06
03/29/06
04/12/06
04/19/06
04/26/06
05/04/06
05/11/06
05/17/06
05/25/06
06/07/06
06/14/06
06/21/06
07/12/06
08/16/06
09/13/06
09/28/06
10/10/06
Low Volume - pump stopped. LLD achieved.
Milk animal no longer present
Seasonal Unavailability.
Milk animal no longer present.
Seasonal Unavailability.
Seasonal Unavailability.
Milk animal no longer present.
No sample, lack of precipitation
Milk animal no longer present..
Seasonal Unavailability.
Insufficient volume, lack of precipitation.
Low Volume - GFIC tripped & reset. LLD achieved.
Milk animal no longer present.
Low Volume - GFIC tripped & reset. LLD achieved.
Low Volume - GFIC tripped & reset. LLD achieved.
Motor running no flow indicated. LLD achieved.
Milk animal no longer present.
Low Volume - power loss. LLD achieved.
Milk animal no longer present.
Milk animal no longer present.
Milk animal no longer present.
Air sampler failed calibration. Notified vendor of correctedvolume. All values recalculated and LLDs were achieved.Seasonal Unavailability.
0
69
Location Description Date of Sampling Reason(s) for Loss/ExceptionSta. 27 Milk 10/24/06 Milk animal no longer present
Sta. 27 Milk 11/21/06 Milk animal no longer present
Station O0A Precipitation 12/27/06 LLD not met for 1-131 and La-140 due to delay in vendoranalysis (CR-07-07 submitted by vendor)
REMP Exceptions for 2005 - North Anna
Several typographical errors were identified in the 2005 North Anna REMP followingdistribution.
" Table 3-3 Gross Beta Air Particulate:. 03/16/2005 Station 05 the value should be 17.8 vice 17.608/17/05 Station 21 the error should be + 4.6 vice + 4.408/24/05 Station 21 the error should be + 4.7 vice + 4.3
" Table 3-4 Airborne Iodine:09/14/05 Station 24 the error should be + 32 vice + 3.2
* Table 3-5 Airborne Particulate Gamma Spectra and Strontium:
2nd Quarter Station 01 the Sr-90 value should be 3.4 vice 0.32nd Quarter Station 24 the Sr-89 error should be + 9.4 vice + 2.43rd Quarter Station 01 the Cs-137 error should be + 0.75 vice + 0.7
" Table 3-7 Precipitation Gamma Spectra:06/28/05 Station O0A 1-131 value should be - 5.4 + 4.0 vice - 0.9 + 2.506/28/05 Station 01A Cs-134 value should be 0.2 vice - 0.2
" Table 3-8 Milk09/14/2005 Station 13 Sr-89 value should be - 0.9 vice 0.9
* Table 3-11 River Water Gamma Spectra, Strontium, and Tritium01/13/05 Station 11 Cs-137 value should be 0.1 vice - 0.1
* Table 3-12 Surface Water Gamma Spectra, Strontium, and TritiumStation 08 sample date should be 01/13/05 vice 01/19/05Station 09A sample should be 01/13/05 vice 01/19/05
* Table 3-14 Shoreline Soil Gamma Spectra and Strontium10/19/05 Station 08 Sr-89 value should be -10 + 360 vice blank
Sr-90 value should be 80 + 150 vice 41 + 98
70
REFERENCES
71
References
1. Dominion, North Anna Power Station Technical Specifications, Units 1and 2.
2. Dominion, North Anna Power Station Independent Spent Fuel StorageInstallation Technical Specifications.
3. Dominion, Station Administrative Procedure, VPAP-2103N, "Offsite DoseCalculation Manual".
4. Virginia Electric and Power Company, North Anna Technical Procedure,HP-3051.010, "Radiological Environmental Monitoring Program".
5. Title 10 Code of Federal Regulation, Part 50 (10CFR50), "DomesticLicensing of Production and Utilization Facilities".
6. United States Nuclear Regulatory Commission Regulatory Guide 1.109,Rev. 1, "Calculation of Annual Doses to Man from Routine Releases ofReactor Effluents for the Purpose of Evaluating Compliance with1OCFR50, Appendix I", October, 1977.
7. United States Nuclear Regulatory Commission, Regulatory Guide 4.8"Environmental Technical Specifications for Nuclear Power Plants",December 1975.
12. NUREG/CR-4007, "Lower Limit of Detection: Definition and Elaborationof a Proposed Position for Radiological Effluent and EnvironmentalMeasurements," September 1984.S
72
0
APPENDICES
73
0
APPENDIX A: LAND USE CENSUS
Year 2006
74
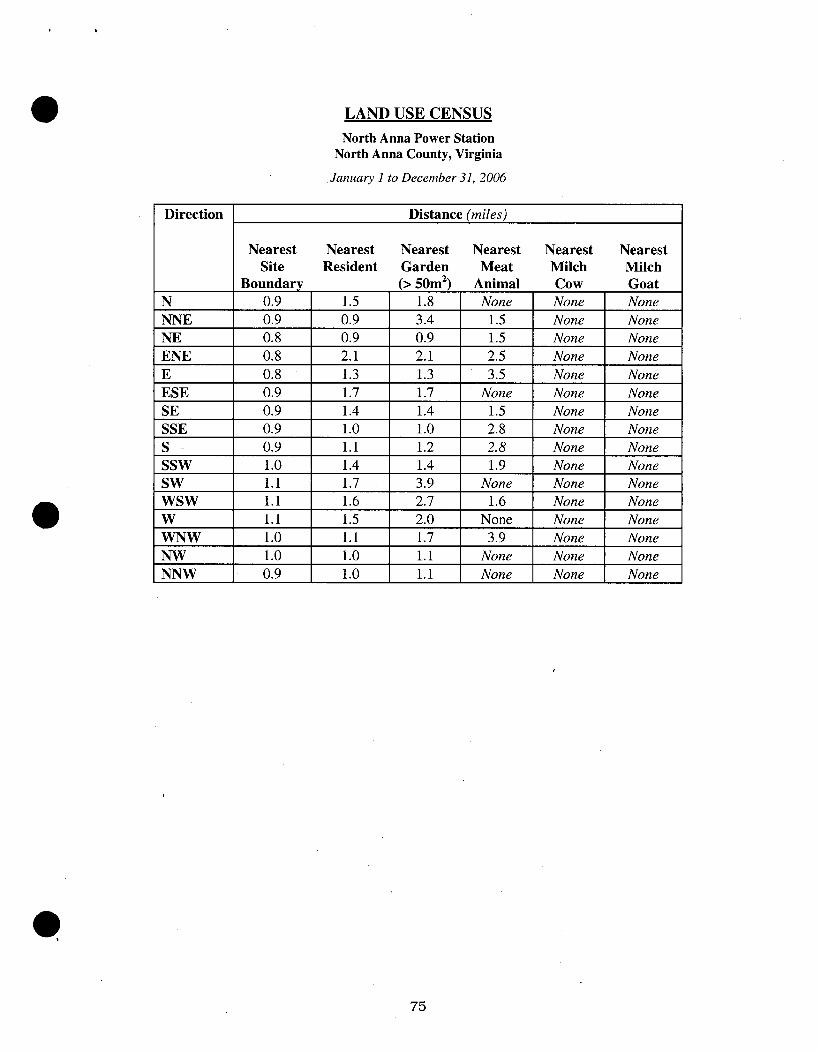
LAND USE CENSUS
North Anna Power StationNorth Anna County, Virginia
2005 2006Nearest Direction Distance DistanceSite Boundary NoneResident
SW 3.1 1.7Garden
N 1.5 1.8NNE 1.4 3.4SSW None 1.4
SW 3.1 3.9WSW 1.6 2.7
W 1.5 2.0WNW 2.5 1.7
Meat Animal NoneMilch Cow NoneMilch Goat
ENE 2.5 None
76
APPENDIX B: SUMMARY OF INTERLABORATORY COMPARISONS
YEAR 2006
S
77
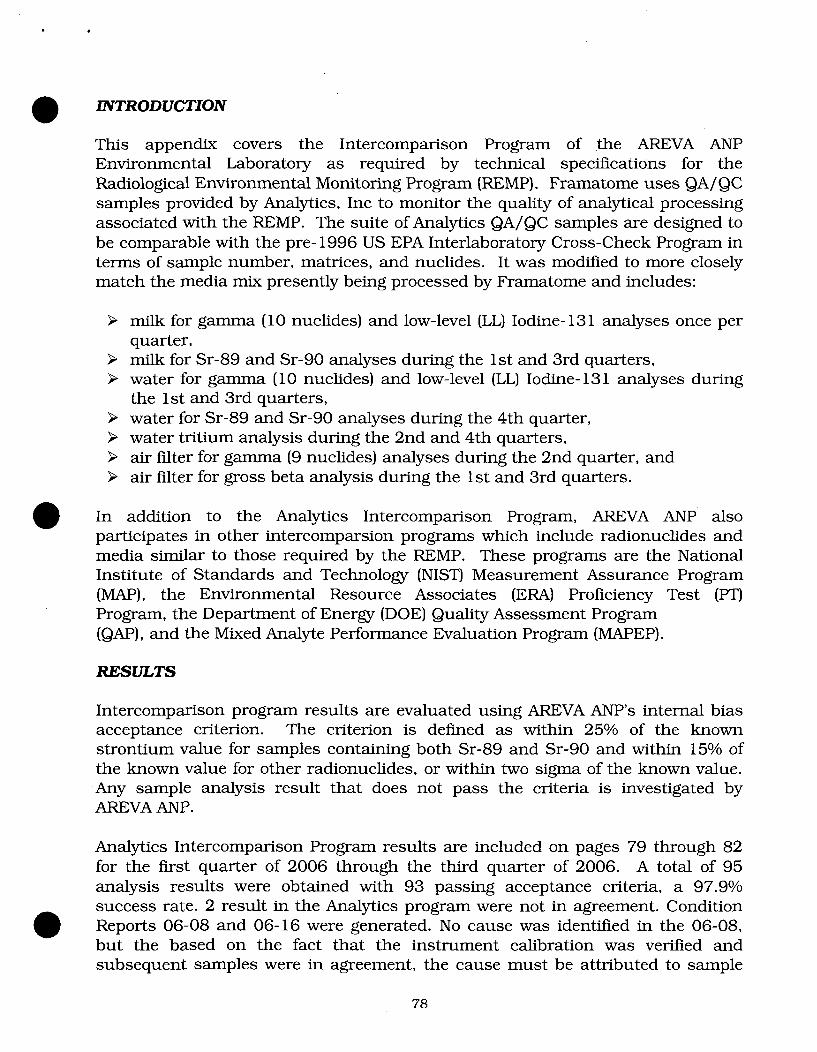
INTRODUCTION
This appendix covers the Intercomparison Program of the AREVA ANPEnvironmental Laboratory as required by technical specifications for theRadiological Environmental Monitoring Program (REMP). Framatome uses QA/QCsamples provided by Analytics, Inc to monitor the quality of analytical processingassociated with the REMP. The suite of Analytics QA/QC samples are designed tobe comparable with the pre-1996 US EPA Interlaboratory Cross-Check Program interms of sample number, matrices, and nuclides. It was modified to more closelymatch the media mix presently being processed by Framatome and includes:
> milk for gamma (10 nuclides) and low-level (LL) Iodine- 131 analyses once perquarter,
> milk for Sr-89 and Sr-90 analyses during the 1st and 3rd quarters,> water for gamma (10 nuclides) and low-level (LL) Iodine- 131 analyses during
the 1st and 3rd quarters,> water for Sr-89 and Sr-90 analyses during the 4th quarter,> water tritium analysis during the 2nd and 4th quarters,> air filter for gamma (9 nuclides) analyses during the 2nd quarter, and> air filter for gross beta analysis during the 1 st and 3rd quarters.
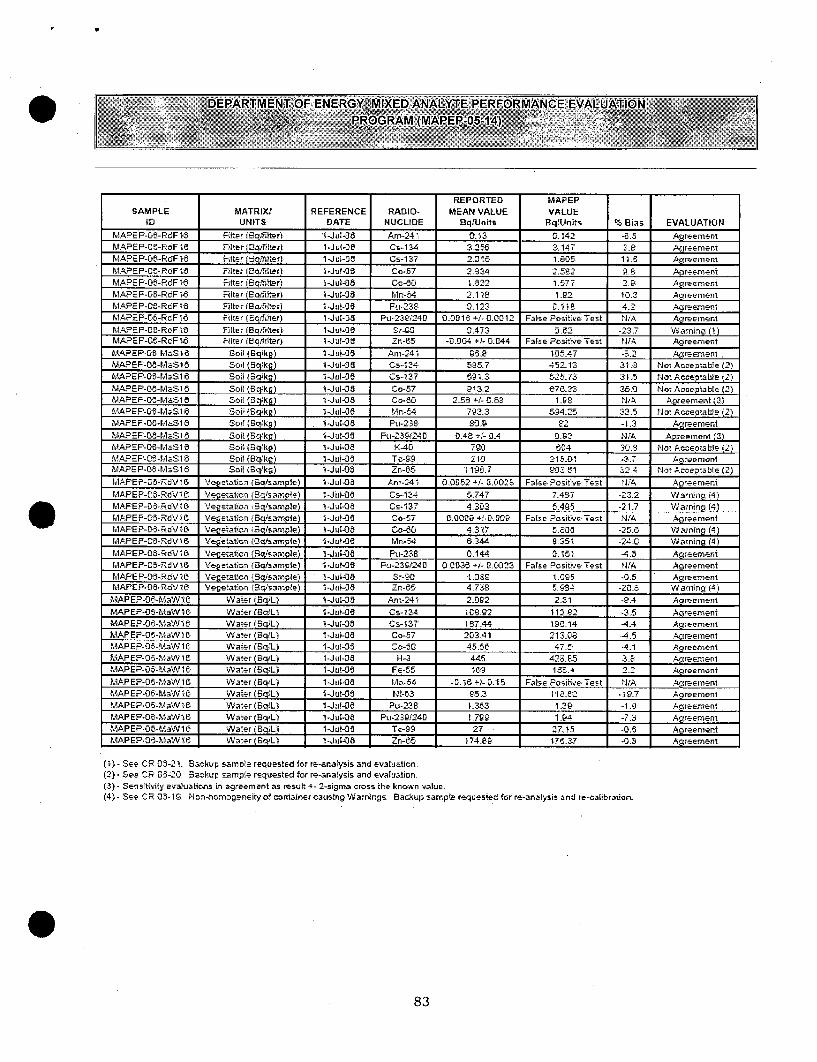
* In addition to the Analytics Intercomparison Program, AREVA ANP alsoparticipates in other intercomparsion programs which include radionuclides andmedia similar to those required by the REMP. These programs are the NationalInstitute of Standards and Technology (NIST) Measurement Assurance Program(MAP), the Environmental Resource Associates (ERA) Proficiency Test (PT)Program, the Department of Energy (DOE) Quality Assessment Program(QAP), and the Mixed Analyte Performance Evaluation Program (MAPEP).
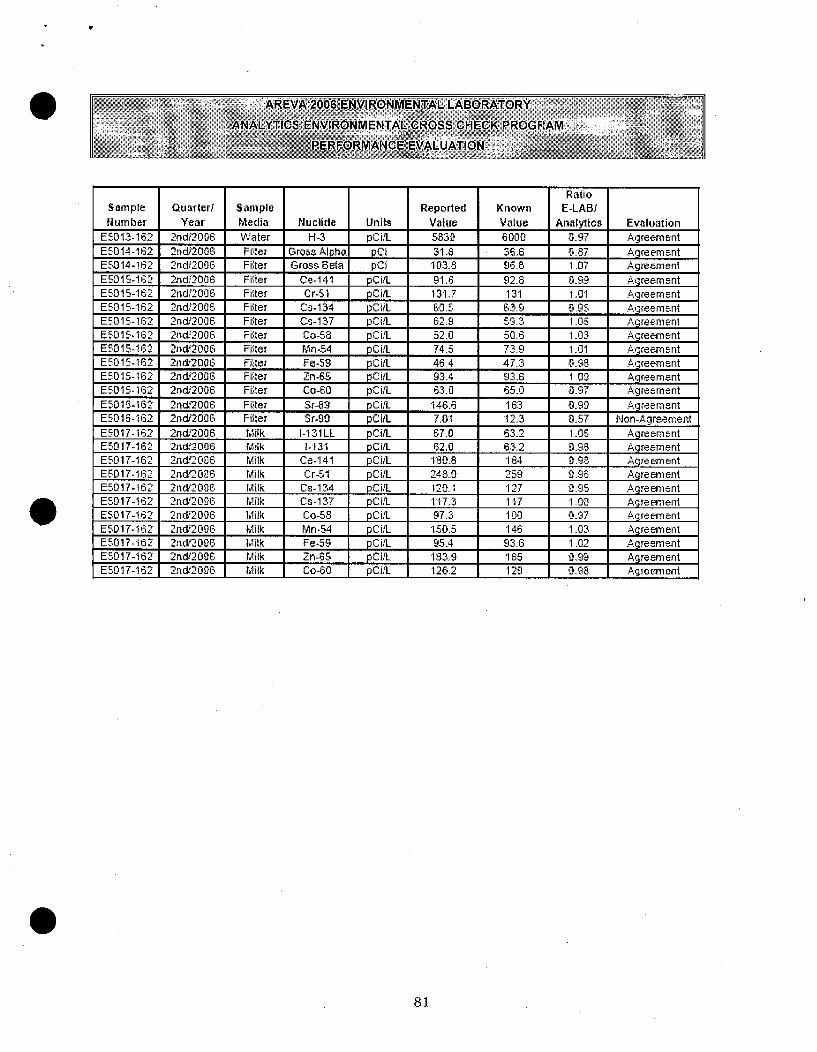
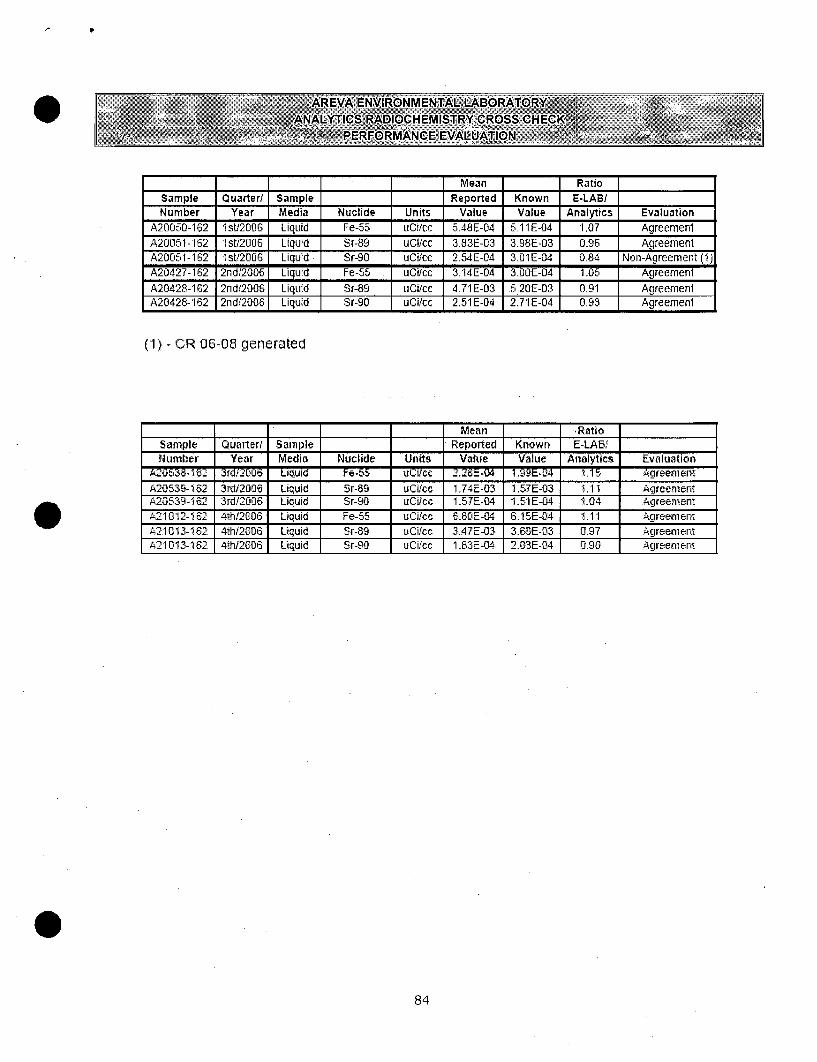
RESULTS
Intercomparison program results are evaluated using AREVA ANP's internal biasacceptance criterion. The criterion is defined as within 25% of the knownstrontium value for samples containing both Sr-89 and Sr-90 and within 15% ofthe known value for other radionuclides, or within two sigma of the known value.Any sample analysis result that does not pass the criteria is investigated byAREVA ANP.
Analytics Intercomparison Program results are included on pages 79 through 82for the first quarter of 2006 through the third quarter of 2006. A total of 95analysis results were obtained with 93 passing acceptance criteria, a 97.9%success rate. 2 result in the Analytics program were not in agreement. Condition
* Reports 06-08 and 06-16 were generated. No cause was identified in the 06-08,but the based on the fact that the instrument calibration was verified andsubsequent samples were in agreement, the cause must be attributed to sample
78
subsequent samples were in agreement, the cause must be attributed to samplepreparation, since no other cause could be identified. CR 06-16 was re-eluted andacceptable results were obtained. However, the CR is still open pendingfinalization of actions to be taken to enhance the scintillation vial backgroundprocess. In the DOE program received 6 results received a warning, and 6 resultswere not in agreement. Condition Reports 06-19, 06-20, and 06-21 weregenerated. Additional samples have been ordered for the DOE disagreements andwarnings. These CR's are still open, as results are currently not available.
In addition to the above, the third quarter Sr-89/-90 in milk was delayeduntil the fourth quarter. Results from the fourth quarter analyses are not yetavailable. The results of the any open corrective actions will be reported in the2007 report.
79
RatioSample Quarter! Sample Reported Known E-LABINumber Year Media Nuclide Units Value Value Analytics Evaluation
E4884-162 sV2,006 Water Gross Alpha pCiIL 38.7 38.1 1.02 AgreementE4884-162 Ist!2006 Water Gross Beta pCiLL 265 262 1-01 AgreementE4885-162 Ist;2006 Water 1-131LL pCiVL 65.6 67.4 0.98 AqreementE4885-162 1st12006 Water 1-131 pCiIL 6B.3 67T4 098 AgreementE4885-162 1st1,2006 Water Ce-141 pCifL 83.0 86.8 0.98 AgreementE4885-162 Ist/2006 Water Cr-51 pCi/L 217 234 0.93 AgreementE48854-62 IsJ2006 Water Cs-134 pCiiL 91:9 101 0.91 AgreementE4885-162 lst12006 Water Cs-137 pCi/L 73.3 74.3 099 AgreementE4885t1-162 Ist2006 Water Co-58 pCiL 84.7 87.5 0.97 AgreementE4685-162 lstL2006 Water Mn-54 pCifL 74.7 78,1. 0.96 Agreement
MAPEP,-O-MaW 1 6 Wa~er (BSqL) 1-JUl-OS Am-241 2.092 2.31 -&.4 AreementMAPEP-00-NtaWI6 Wa.er(BcYL t i-Jul-OS Cs-134 109.22 112.82 -3.5 AoreementMAPEP-06-MaWlt Water (•qIL) 1-Jul-OS Cs-1i7 187.44 125.14 -4.4 AgreementTAAPEP-0O-8tAaWS' Water (Bq/'L) 1-JulOS Co-57 203-41 213.3 .-4.5 AgreementM APEP-X,- NaW 15 Waer (SBqL) 1-Jul-OS Co-SO 45.50 47.6 -4.1 AgreementM APEP-06-3AaW 1e Water (BqL) 1-Jul-DO H-3 44.5 428.85 3.'e, AgreementMAPEP-06-MiaW lO Water (30q1L) 1-JuJl-OS Fe-55 IN 1 -a5..4 2.2 AgreementMAPEP-06-PaW 15 Water (S!q'L) 1-Jul-3[5 Mn-54 -3.16 +,,- 0315 False Positive Test N1A AgreememnMAPEP-064-aW I•6 Waer (BSqL) I-Jul-OD Il-43 C5 5.3 11'1 -;9.7 AgreementMAPEP-06-MaWN1 Wa er(BqL) 1-Jul-OS Pu-238 1.363 1.39 -I . Agreemeni1,1 APEP-06-11aW'O 1 Waaer (Bq'L, 1--ul-O Pu-23i240 137H 1."4 -7.3 AgreementMAPEP-0O-05aW 1. W a*er (Bqý!L-) 1-Jul-0S Tc-@Q 27 27t 5 t5 AgreementEMAPEP-06-MaWi0 Waer (BSqL) I -JuI-O I Zn-ff 174.29 17637 -033 Agreement
(1)-See CR 3•-21. SBcckup-sam.le recuested ,or re-analysis and eval•tation..(2) - See CR 0-5-20. Backup sample requested for re-analysis and evaluation.(3) - Sens'tiMiy evaluations i.n agreement as result 4- 2-sigma cross the krown value.(4)- See CR -5-12. Non-homogeneity of container causing Warnings. Backup sample requested for re-analysis and re-calibration.
83
Mean Ratio
Sample Quarter/ Sample Reported Known E-LABINumber Year Media Nuclide Units Value Value Analytics Evaluation
APPENDIX C: SUMMARY OF GOUNDWATER PROTECTION ANALYSES
YEAR 2006
0
S
85
. INTRODUCTION
This appendix covers the ground water protection sampling undertaken at NorthAnna to voluntarily comply with the Nuclear Energy Institute, NEI, GroundWater Protection Initiative. In addition to the well, river, and surface watersamples included as part of the Radiological Environmental Monitoring Program,North Anna obtained subsurface water samples and soil samples from variouslocations on the site.
The industry groundwater protection initiative was prompted as a result ofelevated levels of tritium being detected at an Illinois plant in November 2005. Itwas determined that these elevated levels of tritium were the result of a spillincident that occurred in 1998. The tritium, which migrated into thegroundwater both on and off site, posed negligible health or safety hazard to thepublic. There were no regulatory requirements for the notification of State/localofficials when the release occurred in 1998. In response to this event andseveral others in the nuclear industry, the Nuclear Energy Institute (NEI)developed an industry groundwater protection initiative to improve the reportingof spills/leaks of radioactive contaminants (including tritium) into groundwaterto State/local officials. In addition, the Nuclear Regulatory Commission hasformed a Lessons-Learned Task Force to evaluate the regulatory processes toidentify areas of improvement.
RESULTS
The results of these samples are displayed in the table on the following page.Though some tritium has been detected in some samples, the levels detected areless than the surface water samples obtained from Lake Anna. The average forpositive subsurface water samples was 1113 pCi/L. The values ranged from<166 pCi/L to 2080 pCi/L. In approximately 60% of all samples counted, notritium was detected above the minimum detectable concentration. Two samplesfrom the ISFSI were analyzed for Sr-89/-90 and gamma emitters in addition toH-3 and no licensed material was detected above the minrumum detectableconcentration.
These results are indicative of lake to ground water communication and notindicative of a leak from a radioactive system.
86
Sample Date SampleMedia Nuclide Value Units
Domestic Water 05/10/06 Water H-3 <166 pCi/L
Subsurface Drains 05/10/06 Water H-3 1110. pCi/L
ISFSI Well #1 06/22/06 Water H-3 <1300 pCi/L
ISFSI Well #1 06/22/06 Water Gamma < MDC pCi/LEmitters
ISFSI Well #1 06/22/06 Water Sr-89/-90 <MDC pCi/L
ISFSI Well #4 06/22/06 Water H-3 <1300 pCi/L
ISFSI Well #4 06/22/06 Water Gamma < MDC pCi/LEmitters
ISFSI Well #4 06/22/06 Water Sr-89/-90 <MDC pCi/L
U-1 Mat Sump East 06/27/06 Water H-3 <725 pCi/L
U-1 Mat Sump South 06/27/06 Water H-3 <725 pCi/L
U-2 Mat Sump East 06/27/06 Water H-3 1740 pCi/L
U-2 Mat Sump South 06/27/06 Water H-3 <726 pCi/L
Discharge Canal 07/11/06 Water H-3 <417 pCi/LStorm Drain
U-1 Storm Drain 07/11/06 Water H-3 1120 pCi/L
U-2 Storm Drain 07/11/06 Water H-3 <417 pCi/L
U-1 Mat Sump East 07/13/06 Water H-3 476 pCi/L
U-1 Mat Sump South 07/13/06 Water H-3 1060 pCi/L
U-2 Mat Sump East 07/13/06 Water H-3 1210 pCi/L
U-2 Mat Sump South 07/13/06 Water H-3 1180 pCi/L
Subsurface Drains 07/13/06 Water H-3 689 pCi/L
NANIC Well 07/19/06 Water H-3 <465 pCi/L
Security Training 07/19/06 Water H-3 <465 pCi/LWell
Station 01A Well 07/19/06 Water H-3 <465 pCi/L
Manhole #10 08/31/06 Water H-3 1320 pCi/L
Manhole #23 09/01/06 Water H-3 560 pCi/L
Manhole #1 09/01/06 Water H-3 <471 pCi/L
Manhole #30 09/01/06 Water H-3 <471 pCi/L
Manhole #31 09/01/06 Water H-3 <471 pCi/L
Manhole #33 09/01/06 Water H-3 <471 pCi/L
Manhole # 46 09/01/06 Water H-3 <471 pCi/L
0
87
Sample Date Sample
Media Nuclide Value Units
Manhole # 41 09/01/06 Water H-3 520 pCi/L
Manhole # 42 09/01/06 Water H-3 <463 pCi/L
Manhole # 47 09/01/06 Water H-3 <463 pCi/L
Manhole # 40 09/01/06 Water H-3 <469 pCi/L
Soil Sample from U-3 09/03/06 Soil Gamma <MDC giCi/kg or Bq/gBoring Emitters
WS-2-ISI-03 09/15/06 Water H-3 <469 pCi/L
WS-3-1SI-Q3 09/15/06 Water H-3 <469 pCi/L
Service Water Vault 10/17/06 Water H-3 1260 pCi/L
Service Water #4 10/17/06 Water H-3 <490 pCi/L
Subsurface Drains 11/03/06 Water H-3 <483 pCi/L
Discharge Canal 11/09/06 Water H-3 1740 pCi/LStorm Drain Outfall
U-1 Storm Drain 11/09/06 Water H-3 <497 pCi/LOutfall
U-2 Storm Drain 11/09/06 Water H-3 <497 pCi/LOutfall
U-1 Mat Sump East 11/10/06 Water H-3 701 pCi/L
U-1 Mat Sump South 11/10/06 Water H-3 697 pCi/L
U-2 Mat Sump East 11/11/06 Water H-3 1430 pCi/L
U-2 Mat Sump South 11/11/06 Water H-3 764 pCi/L
Aux Bldg GW 11/11/06 Water H-3 846 pCi/LMonitoring Well
U-2 Valve Pit Ground 11/13/06 Water H-3 1880 pCi/Lwater
U-3 Well #901 11/22/06 Water H-3 <461 pCi/L
U-3 Well #945 11/22/06 Water H-3 <461 pCi/L
U-3 Well #947 11/22/06 Water H-3 <461 pCi/L
U-3 Well #950 11/22/06 Water H-3 <461 pCi/L
U-2 Valve Pit Ground 11/30/06 Water H-3 2080 pCi/Lwater