77
North Brevard County Hospital District Financial Statements and Supplementary Information For the Years Ended September 30, 2016 and 2015, and Independent Auditor’s Report

North Brevard County Hospital District
Financial Statements
and Supplementary Information
For the Years Ended September 30, 2016 and 2015, and Independent Auditor’s Report

NORTH BREVARD COUNTY HOSPITAL DISTRICT TABLE OF CONTENTS Page INDEPENDENT AUDITOR’S REPORT 1 - 3
MANAGEMENT’S DISCUSSION AND ANALYSIS 4 - 26
BASIC FINANCIAL STATEMENTS FOR THE YEARS ENDED SEPTEMBER 30, 2016 AND 2015:
Balance Sheets 27 - 28
Statements of Revenues, Expenses, and Changes in Net Position 29
Statements of Cash Flows 30 - 31
Notes to Basic Financial Statements 32 - 55
REQUIRED SUPPLEMENTARY INFORMATION FOR THE YEAR ENDED SEPTEMBER 30, 2016:
Unaudited Schedule of Changes in Net Pension Asset and Related Ratios 56
Unaudited Schedule of Pension Contributions 57
Unaudited Schedule of Funding Progress – OPEB 58
Notes to Required Supplementary Information (Unaudited) 59 - 60
OTHER SUPPLEMENTARY INFORMATION FOR THE YEARS ENDED SEPTEMBER 30, 2016 AND 2015:
Consolidating Balance Sheets 61 - 64
Consolidating Statements of Revenues, Expenses, and Changes in Net Position 65 - 66
OTHER REPORT:
Independent Auditor’s Report on Internal Control over Financial Reporting and on Compliance and Other Matters Based on an Audit of Financial Statements Performed in Accordance with Government Auditing Standards 67 - 68

INDEPENDENT AUDITOR’S REPORT
Board of Directors and Audit Committee North Brevard County Hospital District Titusville, Florida Report on the Financial Statements We have audited the accompanying balance sheets of North Brevard County Hospital District (the “District”), including North Brevard Medical Support, Inc. (“NBMS”) (a blended component unit of the District), as of September 30, 2016 and 2015, and the related statements of revenues, expenses, and changes in net position and cash flows for the years then ended, and the related notes to the financial statements. Management’s Responsibility for the Financial Statements Management is responsible for the preparation and fair presentation of these financial statements in accordance with accounting principles generally accepted in the United States of America; this includes the design, implementation, and maintenance of internal control relevant to the prepa-ration and fair presentation of financial statements that are free from material misstatement, whether due to fraud or error. Auditor’s Responsibility Our responsibility is to express opinions on these financial statements based on our audits. We conducted our audits in accordance with auditing standards generally accepted in the United States of America and the standards applicable to financial audits contained in Government Auditing Standards, issued by the Comptroller General of the United States. Those standards require that we plan and perform the audits to obtain reasonable assurance about whether the financial statements are free of material misstatement. An audit involves performing procedures to obtain audit evidence about the amounts and disclosures in the financial statements. The procedures selected depend on the auditor’s judgment, including the assessment of the risks of material misstatement of the financial statements, whether due to fraud or error. In making those risk assessments, the auditor considers internal control relevant to the District’s preparation and fair presentation of the financial statements in order to design audit procedures that are appropriate in the circumstances, but not for the purpose of expressing an opinion on the effectiveness of the District’s internal control. Accordingly, we express no such opinion. An audit also includes evaluating the appropriateness of accounting policies used and the reasonableness of significant accounting estimates made by management, as well as evaluating the overall presentation of the financial statements.

Board of Directors and Audit Committee North Brevard County Hospital District
- 2 -
We believe that the audit evidence we have obtained is sufficient and appropriate to provide a basis for our audit opinion. Opinion In our opinion, based on our audits, the financial statements referred to in the first paragraph present fairly, in all material respects, the financial position of the District as of September 30, 2016 and 2015, and the respective results of operations, changes in net position, and cash flows for the years then ended in conformity with accounting principles generally accepted in the United States of America. Other Matters Required Supplementary Information Accounting principles generally accepted in the United States of America require that the required supplementary information, as listed in the table of contents, be presented to supplement the basic financial statements. Such information, although not a part of the financial statements, is required by the GASB, which considers it to be an essential part of financial reporting, placing the basic financial statements in an appropriate operational, economic, or historical context. This information is the responsibility of the District’s management. We have applied certain limited procedures to the required supplementary information in accordance with auditing standards generally accepted in the United States of America, which consisted of inquiries of management about the methods of preparing the information and comparing the information for consistency with management’s responses to our inquiries, the basic financial statements, and other knowledge we obtained during our audit of the basic financial statements. We do not express an opinion or provide any assurance on the information because the limited procedures do not provide us with sufficient evidence to express an opinion or provide any assurance. Other Supplementary Information Our audits were performed for the purpose of forming an opinion on the financial statements taken as a whole as of and for the years ended September 30, 2016 and 2015. The accompanying other supplementary information, as listed in the table of contents, is presented for the purpose of additional analysis of the financial statements and is not a required part of the financial statements. Such information is the responsibility of management and was derived from, and relates directly to, the underlying accounting and other records used to prepare the financial statements. The information has been subjected to the auditing procedures applied in the audits of the financial statements and certain additional procedures, including comparing and reconciling such information directly to the underlying accounting and other records used to prepare the financial statements, or to the financial statements themselves, and other additional procedures in accordance with auditing standards generally accepted in the United States of America. In our opinion, the information is fairly stated, in all material respects, in relation to the financial statements taken as a whole.

Board of Directors and Audit Committee North Brevard County Hospital District
- 3 -
Other Reporting Required by Government Auditing Standards In accordance with Government Auditing Standards, we have also issued our report dated January 6, 2017, on our consideration of the District’s internal control over financial reporting and on our tests of its compliance with certain provisions of laws, regulations, contracts, and other matters. The purpose of that report is to describe the scope of our testing of internal control over financial reporting and compliance, and the results of that testing, and not to provide an opinion on the internal control over financial reporting or on compliance. That report is an integral part of an audit performed in accordance with Government Auditing Standards in considering the District’s internal control over financial reporting and compliance. MOORE STEPHENS LOVELACE, P.A. Certified Public Accountants Tampa, Florida January 6, 2017
- 4 -
MANAGEMENT’S DISCUSSION AND ANALYSIS
This section of the North Brevard County Hospital District (the “District”) annual financial report presents background information and our analysis of the District’s financial performance during the fiscal years ended September 30, 2016 and 2015. It is intended to be read in conjunction with the District’s financial statements, which follow this section.
FINANCIAL HIGHLIGHTS
Total operating revenues in fiscal year 2016 increased $15.2 million, or 11.7%, while total operating expense decreased $3.4 million, or 2.3%. The net operating margin for the fiscal year 2016 was approximately $0.4 million, or 0.28%, compared to the fiscal year 2015 operating margin loss of approximately $18.2 million, or -14.1%. The total 2016 net nonoperating loss was $4.7 million. As a result, the change in net position in 2016 was a decrease of approximately $4.3 million before capital contributions.
Total fiscal year 2016 admissions decreased by 2.5% (from 6,919 in 2015 to 6,748 in 2016); patient days increased by 5.2% (from 29,244 in 2015 to 30,769 in 2016). In addition, inpatient surgeries and special procedures increased in fiscal year 2016 by 3.9% (from 2,295 in 2015 to 2,385 in 2016). Total cardiac cath lab volume, both cardiac catheterizations and angioplasties (PTCAs), increased 10.0% in 2016 (from 1,535 in 2015 to 1,689 in 2016).
Charges foregone, based upon established rates, from community (charity) care provided to patients increased from $10.5 million in fiscal year 2015 to $11.9 million in fiscal year 2016. Community care as a percentage of total gross patient service revenue was 1.9% in 2016 and 1.8% in 2015. The provision for bad debt decreased in fiscal year 2016 by $7.0 million, as compared to fiscal year 2015. The 2016 amount was $23.8 million versus the 2015 amount of $30.8 million. The 2016 provision for bad debt as a percentage of total gross patient service revenue decreased to 3.9%, compared to 5.2% in fiscal year 2015. In total, bad debt and community care, as a percentage of total gross patient service revenue, decreased to 5.8% for 2016, from 7.0% in 2015.
Net position decreased $3.2 million for the current year, compared to a $28.0 million decrease in the prior year.
The District’s 2016 balance sheet remains strong, as evidenced by comparing the 251 days’ cash on hand, as recorded at fiscal year-end 2016, to the 161 days hospital industry median for Fitch Ratings “BBB” rated hospitals. Similarly, the District’s cash-to-debt ratio of 93.1% is above the Fitch Rating industry median of approximately 90.8%. Because of the decrease in net position during 2016, our long-term debt to capitalization ratio increased to 48.2%, from 48.0% in 2015.
Net capital expenditures for the year were $7.5 million and were funded by cash flow from operations. The breakdown of the $7.5 million in capital expenditures is approximately $3.3 million for the purchase and renovation of the cancer center; $0.9 million for the software and renovation for the Teletracking and Mission Control project; $2.0 million for the Health Village East project; and $1.3 million in routine capital equipment replacement.
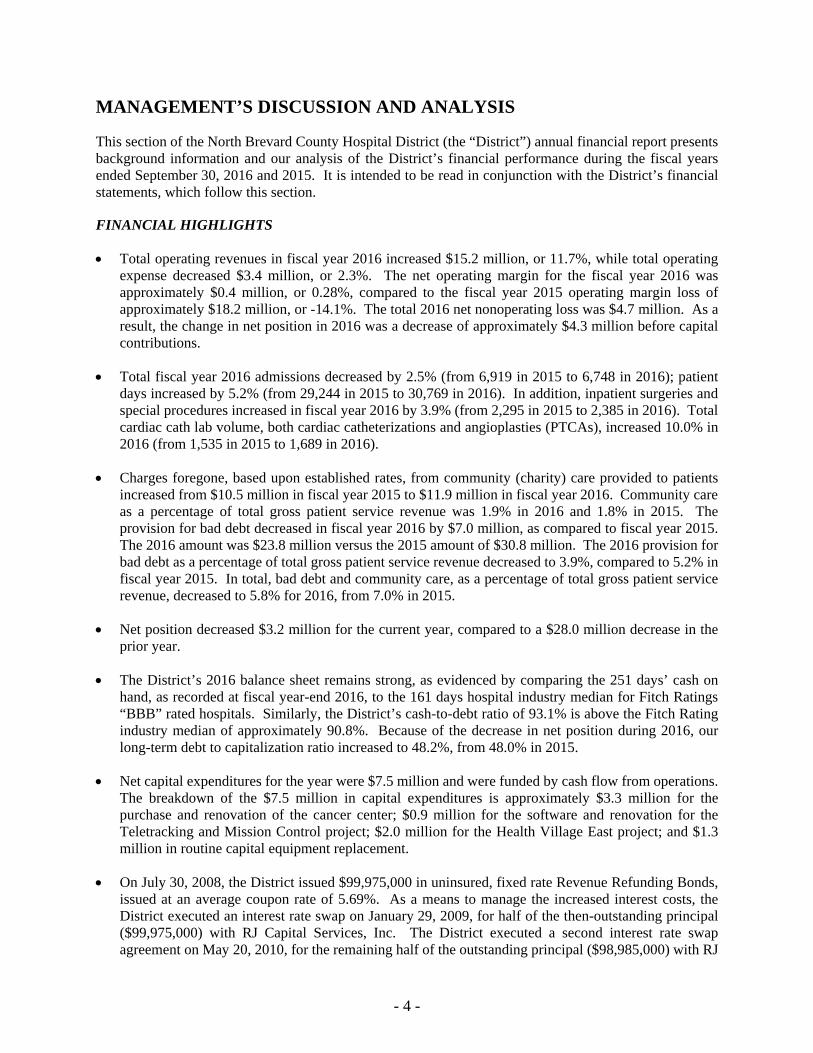
On July 30, 2008, the District issued $99,975,000 in uninsured, fixed rate Revenue Refunding Bonds, issued at an average coupon rate of 5.69%. As a means to manage the increased interest costs, the District executed an interest rate swap on January 29, 2009, for half of the then-outstanding principal ($99,975,000) with RJ Capital Services, Inc. The District executed a second interest rate swap agreement on May 20, 2010, for the remaining half of the outstanding principal ($98,985,000) with RJ

- 5 -
Capital Services, Inc. On September 16, 2015, the Hospital terminated both interest rate swaps. The net proceeds after expenses were approximately $4,250,000.
Parrish Medical Center purchased a claims-made umbrella policy with a $5 million limit covering the Hospital and employed physicians. The umbrella policy is excess over the sovereign immunity limits of $200,000/$300,000. If sovereign immunity does not apply, the policy is excess over a professional liability limit of $1.0 million/$3.0 million, which is the self-insured retention. Parrish Medical Center purchased a claims-made professional liability excess policy for contract physicians working in the Florida Health Network. These physicians carry their own underlying insurance policy for the first $250,000 per claim and $750,000 per physician. The excess policy covers an additional $750,000 per claim and $2.25 million per physician, bringing the total coverage to $1 million/$3 million limits. Both policies were purchased as a result of membership in the Mayo Clinic Care Network.
COMMUNITY BENEFIT HIGHLIGHTS
Bad Debt and Community (Charity) Care
Our fiscal year 2016 total net bad debt write-offs increased $4.0 million, or 19.6%, from $20.4 million in 2015 to $24.4 million in 2016. Net bad debt write-offs reflect the annual amount of total bad debt write-offs less the amount of collections and adjustments to accounts classified as bad debt. Total 2016 bad debt write-offs were $26.3 million, compared to $24.3 million in 2015; a $2.0 million increase.
Total 2016 gross cash collections increased $4.6 million to $134.7 million, compared to the 2015 amount of $130.1 million. Our percentage of cash collected to net patient service revenue was 95.6% in 2016, compared to 101.8% in 2015.
Our fiscal year 2016 total bad debt and community care as a percentage of total gross patient service revenue was 5.8%.
A patient qualifying for community care does not have the ability to pay for services rendered. A patient’s charges charged to bad debt means that, based on information provided, the patient has the financial resources, but nevertheless refuses to pay for the services rendered.
In analyzing the $4.0 million increase in our net bad debt write-offs, we noted that self-pay accounts decrease in 2016 versus 2015. Self-pay account write-offs decreased $3.1 million ($14.3 million in 2016 versus $17.4 million in 2015). Bad debt write-offs for self-pay patients that were unemployed decreased approximately $2.9 million, or 23.9% (from $12.1 million to $9.2 million).
2.7%
5.2%
3.9%
3.2%
1.8% 1.9%
5.9%
7.0%
5.8%
1.0%
3.0%
5.0%
7.0%
9.0%
FY 2014 FY 2015 FY2016
Bad Debt & Community Care as a Percent of Gross Charges
Bad Debt Expense Community Care Total Bad Debt + Community Care

- 6 -
The remaining $7.2 million increase in bad debt write-offs in 2016 compared to 2015 are for the patient portion of Medicare, commercial HMO, and PPO insured patients. Those write-offs increased from $3.0 million for 2015 to $10.1 million for 2016. This increase in actual write-offs is a result of writing off accounts that were reserved for at the end of 2015.
Our self-pay discount policy incorporates the principles and guidelines developed by the American Hospital Association, the Patient Friendly Billing Project, and the Florida Hospital Association. The policy is centered on a sliding scale based on household income. Individuals who make 200% or less of the current Federal Poverty Guidelines (“FPG”) qualify for charity care and 100% write-offs; those with household incomes between 201% and 299% of the FPG qualify for an 80% discount; those with household incomes between 300% and 399% of the FPG qualify for a 70% discount; and those with household incomes over 400% of the FPG qualify for a 60% discount. In addition, if the balance is paid in full within 30 days of service, an extra 5% discount is provided. During fiscal year 2016, we provided approximately $20.4 million in discounts to self-pay accounts, as compared to $17.2 million in fiscal year 2015.
In May 2007, PMC began issuing Care Pass Cards as a service to our self-pay patients. Care Pass is an identification card with information showing the patient’s name, type of assistance for which the individual qualified, and an expiration date. A financial evaluation determines whether the patient qualifies for financial assistance (i.e., community care) or a discount. Both the discount program and financial assistance are based on the FPG. Care Pass Cards are accepted for all hospital-related services and locations, as well as Parrish Medical Group locations.
Prior to receiving the cards, patients are screened for state medical assistance programs. Anyone who qualifies is helped with the application process by using the Access website provided by the Department of Children and Family Services. Our goal in fiscal year 2016 continues to be finding other community partners (physicians, pharmacies, durable medical equipment, and supply companies, etc.) that will recognize the card and offer discounted healthcare services to people in need.
During fiscal year 2016, our community care increased to 1.9% of total gross patient service revenue, from 1.8% in 2015, or a 7.5% increase. Total community care was $11.9 million in 2016, compared to $10.5 million in 2015, a $1.3 million increase, or 12.6%. Included in total community care is a hardship provision category for individuals who would not qualify for community care (200% or less of the FPG), but whose total bill(s) exceeded 25% of the individual’s annual salary. The total fiscal year 2016 write-offs came to approximately $0.1 million for those qualifying for the hardship category and were unchanged compared to fiscal year 2015.
Finally, we continue to work on improving our identification of patients who qualify for community care, especially early in the process of the patient’s access to our system. Our total fiscal year 2016 actual community care write-offs decreased $2.1 million, or 14.6%. Costs associated with providing community care to patients amounted to approximately $3.1 million and $3.6 million for fiscal years 2016 and 2015, respectively.
The District’s growth strategy into our secondary service area of Port St. John and north Cocoa is positively impacting our percentage of self-pay revenue. In comparison to Titusville, Port St. John’s population is younger and has a higher income level. Prior to opening the Parrish Healthcare Center at Port St. John, we had seen a market share decline, despite having a 15,000 square-foot medical office building in the community. We believe our strategy of employing doctors and placing them full-time in the Parrish Healthcare Center is allowing us to provide better healthcare in the area. Our outpatient diagnostic volume in Port St. John decreased from 20,290 in 2015 to 18,565 in 2016, or 8.5%.

- 7 -
Other Community Benefits
PMC is a not-for-profit, community healthcare organization whose mission and vision are Healing experiences for everyone all the time® and Healing families--Healing communities®. These are words our care partners live by at all of the District’s locations: Parrish Medical Center; the Parrish Healthcare Center at Port St. John, located 13 miles south of Titusville; the 4,500-member Parrish Health & Fitness Center; Parrish Occupational Medical Services; Parrish Home Care; the Senior Consultation Center; Parrish Outpatient Dialysis; Parrish Infusion Center; and Parrish Wound Healing Center.
PMC maintains its not-for-profit, public status even though the medical center’s board of directors has, for more than 21 years, voted against accepting public tax money (unlike most public hospitals). Nevertheless, in 2016, we provided more than $35.6 million in bad debt and community (charity) care - a testament to the medical center’s commitment to providing affordable healthcare to the people we serve.
Our service area extends from the Beach Line (SR 528) in the south to the Volusia County line in the north, and from the Atlantic coast in the east to the Orange and Seminole County lines in the west. Our unique Central Florida location means we provide care for year-round residents, seasonal residents, Kennedy Space Center-related tourists, passengers and crews from Cape Canaveral-based cruise lines, and visitors who come to enjoy Brevard County’s beaches and fishing. Today, with more things to do at the Space Center, an increase in rocket launches, a growing eco-tourism business, and an expansion of the Port Canaveral cruise ship port, tourists are coming to northern Brevard. Port Canaveral is one of the busiest ports in the country for both cruise and cargo businesses, adding two additional mega cruise ships to call the port home. In addition, there are a number of businesses relocating to the Brevard County area to take advantage of the highly skilled labor pool. One such venture is Kennedy Space Center (“KSC”), which is utilizing Pizzuti, a private developer, to establish Exploration Park at KSC, for commercial business to advance their company’s aerospace and technology efforts. Pizzuti is developing up to 315,000 square feet of planned research, lab, and office space, with all the necessary infrastructure and utilities.
Titusville will remain a major participant in space flight with the goal of becoming one of the world’s capitals of high-technology and science. Boeing announced in October 2011 that it would be developing its new commercial space capsule at KSC. KSC will also assemble and process the Orion spacecraft for deep space missions. The first Orion exploration flight test took place in December 2014. The successful unmanned test flight lasted four and a half hours before splashing down in the Pacific Ocean. The first mission to carry astronauts is not expected to take place until 2021. Finally, KSC has seen two new programs get under way: commercial crew program and 21st century ground systems program.
Rocket Crafters, a Utah-based corporation that holds licenses for advanced hybrid rocket and aerospace composite technologies, as well as proprietary hybrid rocket design and analysis software, relocated to Titusville. The company plans to develop and commercialize a new hybrid rocket propulsion technology and leverage an ultra-lightweight, advanced composite material to manufacture dual-propulsion suborbital space planes. Rocket Crafters will invest $72 million to support operations at the Space Coast Regional Airport in Titusville. At full employment, up to 1,300 full-time jobs, the company’s total economic impact is estimated to be over $48 million.
Blue Origin, owned by Amazon’s Jeff Bezo, started site work in January 2016 at Exploration Park. They will have a 21st century production facility where they will manufacture a reusable fleet of orbital launchers. Other businesses that have made the Space Coast their home are Space X, Sierra Nevada Corporation, and XCOR Aerospace. Titusville has also seen growth with businesses such as Paragon Plastics, Embraer, a natural gas plant, and a logistics center.
On the medical front, during fiscal year 2010, the Board of Directors decided to turn over the operations of the Community Medical Clinic to Brevard Health Alliance (“BHA”), a federally qualified healthcare clinic with several other locations in Brevard County. Under the agreement, PMC funded more than $0.9 in both

- 8 -
2016 and 2015. In addition, the District provided $0.4 million and $1.1 million in outpatient diagnostic services in 2016 and 2015, respectively. The Board of Directors felt this was the best solution to meet the increasing needs of the uninsured and underinsured in the community.
The transfer of the clinic’s operations to BHA enables PMC to continue to achieve its healing mission with respect to indigent patients at a lower cost than if they use the emergency department for healthcare services. The District’s Board of Directors and management understand that the hospital seeks to assist our community by serving as an extension of the local healthcare safety net. All patients, regardless of their financial position, are served within the goals of the hospital’s vision (Healing families--Healing communities®).
The District also operates Brevard County’s only hospital-based diabetes education program. Parrish Medical Center’s Diabetes Education Program is recognized by the American Diabetes Association as meeting the National Standards for Diabetes Self-Management Education. According to the Centers for Disease Control and Prevention (2014), 12.2% (67,000+) of the population of Brevard County has diabetes. A physician referral is required for participation in the program and for other services.
The Diabetes Education Program includes up to 10 hours of diabetes self-management training which is provided through small group classes and individual assessments with a Diabetes Nurse Educator and a Registered Dietitian. The program tracks multiple quality measures, including program satisfaction and changes in self-care behaviors.
Diabetes Education has taken extra strides to reach out to members of the community through free monthly diabetes support groups, community presentations, grocery store tours for people with diabetes or prediabetes and by participating in health fairs and community events. Last year more than 700 community members participated at our community events, with more than half also completing a diabetes screening.
The diabetes education program revenue does not cover its direct costs, and it operated at a loss of approximately $366,000 in 2016.
In 2000, the District, through its subsidiary, North Brevard Medical Support, Inc. (“NBMS”), opened a $2.0 million Children’s Center (the “Center”) to bring various community children’s programs under one roof. This facility houses Early Learning Coalition of Brevard, Space Coast Early Steps, CDI/Early Head Start, United Way of Brevard’s Healthy Families Program, Nemours pediatric specialty clinics, Caladium school for autistic children, Speakworks, and Parrish Early Care and Education. The Center’s partnering agencies work together to meet the needs of children with learning and/or physical disabilities. Services range from childcare and pre-school to parenting groups, play groups, school tutoring, behavior interventions, developmental evaluations, therapy services, support groups, and more. The Center serves over 300 children each day and operated at a loss of approximately $72,000 in fiscal year 2016.
PMC care partners had more than 13,000 encounters with community members in 2016. The PMC team helped our community learn how to be and stay healthy by providing health fairs, screenings, and education across Brevard County. During 2016 and 2015, the District sponsored numerous community health and wellness-related events and programs. Associated costs, exclusive of staff time, were approximately $16,000 in 2016 and $10,000 in 2015.
The District sponsored more than 59 organizations and programs in 2016 and 63 organizations and programs in 2015 at a cost of approximately $414,000 and $367,000, respectively. In addition, the District paid approximately $20,000 and $21,000 in 2016 and 2015, respectively, for several healthcare programs for the City of Titusville.
The District offers free multiple support groups that use our staff, resources, and facilities. Among these programs are: Beginning Breastfeeding Class, Living Healthy Workshop (Chronic Condition Management Education), Crash Course on Aging, and Caregiver Academy. Support groups include those for AWAKE Sleep Disorders Caregiver, Congestive Heart Failure, Diabetes, Look Good Feel Better Cancer Patient,
- 9 -
Moms & Kids Gathering (childhood development), Parkinson’s, Parrish Partners (cancer), Pulmonary Hypertension, and Stroke.
In addition, the District provides other programs that require a nominal enrollment fee that does not cover the cost of the program but does help pay for materials for the following programs: Moments to Miracles (childbirth education class), Respite Nights (for parents of special needs children), Diabetes Survival Skills - Titusville & Port St. John (diabetes self-management classes), Diabetes Group Class, and HeartSaver CPR Class. In addition, Parrish Medical Center offers HealthBridge, a comprehensive health program providing important education, videos and more through a variety of platforms. A downloadable app includes links to an exclusive online health-education library and videos, as well as healthcare provider information, medical records portals, and a variety of health trackers. A monthly electronic newsletter alerts members to upcoming monthly health events, screenings and important health news. A quarterly health magazine is mailed to more than 26,000 homes in North Brevard.
The District, through its subsidiary NBMS, provides $75,000 annually to support healthcare-related community activities. Brevard County residents and not-for-profit organizations can apply for a grant. A committee reviews the grant requests quarterly to determine who receives grants for that quarter.
The care partners of PMC, through the hospital’s programs, facilities, contributions, and community involvement, are working daily to fulfill our healing mission (Healing experiences for everyone all the time®) and our vision (Healing Families--Healing Communities®). Game Plan: The Game Plan was introduced in 2000 and is the medical center’s strategic plan. It is the framework the District uses for the consistent, standardized communication of the organization’s annual business strategic goals and expectations. It is supported and directed by the medical center’s Board of Directors. In 2012, the District introduced an updated Game Plan. The current Game Plan is a matrix of 10 pillars to drive organizational success: five pillars defining what we do and five pillars defining how we do it. “What we do” Pillars:
Educate = Knowledge-gain strategies Assess = Health screening and assessment strategies Understand = Diagnostic strategies Care = Treatment strategies Maintain = Disease management strategies
“How we do it” Pillars:
Community Investment = Stewardship and budget strategies Engaged Partners in Care = Loyalty and care partner engagement strategies System Reliability = Safety and excellence strategies (applying Lean Sigma principles) Healing Experiences = Compassion and patient satisfaction strategies Healing Communities = Integrity and overall community health management strategies
The premise of the Game Plan is that if an organization is balanced among the pillars, it will be well-positioned to sustain long-term success. These goals are: to achieve and maintain HCAHPS patient satis-faction scores in the top 10% nationally (Healing Experience); to achieve and maintain engagement scores in the top 10% nationally (Engaged Partners in Care); to achieve and maintain a rank in the top 10% nationally in CMS quality indicators for heart attack, heart failure, surgical infection prevention, and pneumonia (System Reliability); to achieve and maintain credit rating in the top 10% nationally (Community Investment); and to achieve and maintain a readmission rate of less than 8% (Healing Communities).

- 10 -
Parrish Medical Center (“PMC”) is proud to be an independent, public, not-for-profit community medical center that not only serves our community with excellence, but also serves as an industry leader on many fronts, most notably as leaders of the healing environment and leaders for integrated quality and safe care.
Mayo Clinic announced PMC as the 29th member of the Mayo Clinic Care Network (“MCCN”) in 2014. With that announcement, PMC became the first Central Florida MCCN member and the third in Florida. As a MCCN member, PMC physicians and patients have direct access to the latest Mayo Clinic expertise, clinical care information, resources and tools. In 2016, PMC deepened its relationship with Mayo with a formal affiliation for cancer care and treatment. PMC, Mayo Clinic in Jacksonville, Florida, and OMNI Healthcare, Brevard County’s only physician-owned and managed multi-specialty group, partnered to create Parrish Cancer Center. The new Parrish Cancer Center is Brevard’s only Commission on Cancer accredited program and is a member of the MCCN.
PMC’s proven care integration, quality and safety performance place us in the top percentile of all U.S. hospitals according to such premier rating and accreditation organizations as The LeapFrog Group, The Safe Care Group, Centers for Medicare & Medicaid Services (“CMS”), The Patient Safety Movement Foundation, Vizient Southeast (formerly VHA Southeast) and The Joint Commission.
The Joint Commission announced in January 2016 that PMC is the first in the United States to be awarded Integrated Care Certification. The Joint Commission’s Integrated Care Certification recognizes that PMC is improving patient outcomes with better coordinated care and demonstrates PMC’s commitment to ensuring that high-quality care transcends the walls of the hospital. With this certification, PMC introduced Parrish Healthcare® to the community — another milestone in our proud tradition of serving as recognized national industry leaders.
Parrish Healthcare is a groundbreaking network of healthcare providers that includes PMC and its affiliates; Parrish Medical Group, NCQA certified patient and family-centered medical homes; and Florida Health Network, a regional network of healthcare providers, insurers, and others.
Unlike other models that opt to build networks through mergers and acquisitions, PMC’s model is one of collaboration. PMC’s network includes like-minded organizations who have agreed to collaborate instead of compete for the benefit of the patients and people served. Collaboration between healthcare providers is preferable to costly competition that raises costs and does nothing to improve care. That’s why PMC created Parrish Healthcare, a regional network of healthcare providers who are committed to working together to practice evidence-based care and to engage in collaborative initiatives that result in superior quality outcomes, the elimination of patient harm, and reduced healthcare costs for all — achieving the triple aim of the government’s valued-based purchasing initiative.
PMC is also a CMS 4-star rated hospital, according to Hospital Compare. The overall rating summarizes up to 64 quality measures reflecting common conditions that hospitals treat. The overall rating shows how well each hospital performed, on average, compared to other hospitals in the U.S.
In 2016, the National Patient Safety Movement announced PMC was the first hospital to make formal commitments that align with all 12 Actionable Patient Safety Solutions (“APSS”) toward eliminating preventable patient deaths by 2020. The Patient Safety Movement Foundation works with medical safety experts from around the world to develop this series of simple and easy-to-follow processes to some of the most common patient safety challenges that hospitals face today. These processes, called APSS, can be adapted to almost any clinical setting, anywhere in the world. There are currently 12 patient safety challenges, and PMC has made a total of 16 commitments that align with all 12 APSS categories, resulting in 142 total lives saved so far in 2016.
Additionally, PMC is ranked among the Top 100 SafeCare Hospitals® by the SafeCare Group. The SafeCare Group was founded in 2010 to help hospitals excel in the areas of Patient Safety, Quality, and

- 11 -
Efficiency. According to the data, PMC was the highest ranking performer among Florida hospitals for CMS Hospital Value-Based Purchasing (“HVBP”) Program, Hospital-Acquired Condition Reduction Program (“HACRP”), and Hospital Readmissions Reduction Program (“HRRP”). It was also the only Florida hospital to attain the coveted three-standard deviations above the average cumulative score with 40 metrics of the Affordable Care Act.
PMC has also maintained the designation of a Top Performer on Key Quality Measures® by The Joint Commission, the leading accreditor of healthcare organizations in the United States.
In 2016, PMC once again earned an ‘A’ Hospital Safety Grade from The LeapFrog Group, which placed the hospital among the top 1.2 percent of hospitals in the United States. In an email to PMC, Tom Zemon from The LeapFrog Group wrote, “With the release of the Fall 2016 Leapfrog Hospital Safety Grade, it’s official: Your hospital has earned ‘Straight As’ in the Leapfrog Hospital Safety Grade since 2012. Your hospital is one of only 72 hospitals across the nation that is able to stake this claim, making it part of an exclusive group consistently dedicated to patient safety. Congratulations on this impressive achievement.”
PMC also received the 2016 Women’s Choice Award®, distinguishing PMC as one of America’s Best Stroke Centers. The Women’s Choice Award is the only declaration that integrates clinical excellence (“CMS”) and consumer experience (“HCAHPS”) to provide women, the family’s Chief Health Officers, the ability to make the best healthcare decisions for their families.
In addition, PMC was designated as a Gynecological Surgery Center of Excellence by the American Institute of Minimally Invasive Surgery (“AIMIS”) in 2015; in 2014, PMC was one of only 37 hospitals in the United States to receive Consumer Reports’ highest rating in preventing surgical-site infections, central line infections, and infections stemming from urinary catheters; in a separate rating, in 2014, Consumer Reports also rated PMC as Florida’s safest hospital; PMC earned the Designated Blue Distinction® Center+ for Maternity Care; among many other awards and distinctions (all of which can be found on parrishmed.com).
In addition to the patient safety and clinical quality distinctions, PMC has also earned a national reputation as one of America’s finest healing work environments. PMC ranks among the top “150 Great Places to Work in Healthcare” by Becker’s Hospital Review 2016, a premier national healthcare publication; was named a Top 100 Places to Work by Modern Healthcare; and earned the Gallup Great Workplaces award; among others.
PMC’s focus on quality, safety and excellent patient experiences is not only the right thing to do on behalf of the patients and communities we serve, but will also lead to increased reimbursement from the government, as part of their value-based purchasing program and commercial insurance payors.
PMC is guided its vision of Healing Families—Healing Communities® and exists to fulfill its mission to provide a Healing experience for everyone all the time®.
We had another surveillance review in June 2016 with Standard and Poor’s, one of our two credit rating agencies; and in February 2016, we met with our other credit rating agency, Fitch Ratings. In Standard & Poor’s report issued in June 2016, they downgraded our rating to BBB with a negative outlook. The Fitch Ratings report was issued in February 2016, and our credit rating was downgraded to BBB, outlook negative, citing the same concerns that Standard & Poor’s noted.
REQUIRED FINANCIAL STATEMENTS
The financial statements of the District report information about the District using accounting methods prescribed by the Government Accounting Standards Board (“GASB”) and the American Institute of Certified Public Accountants Audit and Accounting Guide for Health Care Organizations (the “Audit

- 12 -
Guide”). These financial statements provide current and long-term financial information about the District’s activities. The Balance Sheets include all of the District’s assets and liabilities and provide information about the nature and amounts of investments in resources (assets) and the obligations to the District’s creditors (liabilities). It also provides information to compute rate-of-return, evaluate the capital structure of the District, and assess the District’s liquidity and financial flexibility.
All revenues and expenses are accounted for in the Statements of Revenues, Expenses, and Changes in Net Position. These statements measure changes in the District’s operations over the past two years and can be used to determine whether the District has recovered its costs through patient service revenue and other revenue sources.
The final required statement is the Statement of Cash Flows. This statement provides information about the District’s cash from operating, investing, and financing activities, and provides answers to such questions as where did cash come from, what was cash used for, and what was the change in the cash balance during the reporting period.
FINANCIAL ANALYSIS OF THE DISTRICT
The Balance Sheets and the Statements of Revenues, Expenses, and Changes in Net Position report information about the District’s financial position and activities. These two statements report the net position of the District and the changes in the net position. Increases or decreases in net position are one indicator of whether the District’s financial health is improving or deteriorating. However, other nonfinancial factors, such as changes in economic conditions, population growth (including the uninsured and working poor), and new or changed government legislation, should also be considered.

- 13 -
Net Position
A summary of the District’s condensed Balance Sheets is presented in Table 1 below:
FY2014 FY15 vs. FY16 Total %As Restated FY2015 FY 2016 Dollar Change Change
Current and other long-term assets 147,459$ 132,615$ 126,321$ (6,294)$ (4.75)%Capital assets 98,758 91,129 85,771 (5,358) (5.88)%Deferred outflows 14,690 13,500 18,638 5,138 38.06 %
Total assets and deferred outflows 260,907$ 237,244$ 230,730$ (6,514)$ (2.75)%
Current and long-term debt outstanding 103,140$ 101,023$ 98,734$ (2,289)$ (2.27)%Other current and long-term liabilities 20,616 26,929 25,898 (1,031) (3.83)%Deferred inflows - 131 98 (33) 25.19 %
Total liabilities and deferred inflows 123,756$ 128,083$ 124,730$ (3,353)$ (2.62)%
Invested in capital assets, net of related debt 11,843$ 5,596$ 9,670$ 4,074$ 72.80 %Restricted by donors 545 520 301 (219) (42.12)%Restricted for debt service 5,158 5,156 5,189 33 0.64 %Unrestricted 119,605 97,889 90,840 (7,049) (7.20)%
Total net assets 137,151$ 109,161$ 106,000$ (3,161)$ (2.90)%
TABLE 1Condensed Balance Sheets
(in thousands)
$-
$20
$40
$60
$80
$100
$120
FY 2014 FY 2015 FY 2016
Millions
Change in Cash, Cash Equivalents, Funded Depreciation, and Investments
Cash & Cash Equivalents Funded Depreciation Investments Total

- 14 -
2016 Compared to 2015
The decrease of $6.3 million in current and other long-term assets in fiscal year 2016, compared to 2015, is due to a $0.5 million increase in accounts receivable; a $0.2 million decrease in temporarily donor restricted funds; a $1.3 million decrease in cash, funded depreciation, and investments; an increase of $0.9 million in deposits and other assets; a decrease of $0.3 million in supplies; an increase of $0.6 million in prepaid expenses and other assets; and a decrease of $6.5 million in net pension assets. The increase of $5.1 million for deferred outflows is related to the partial refunding of the Series 2008 Bonds and the pension asset. The decrease of $5.4 million in capital assets in 2016 over 2015 stems from the net effect of the capital additions ($6.1 million), less the net change of accumulated depreciation ($11.5 million) recognized in 2016.
The approximately $2.3 million decrease in current and long-term debt outstanding in fiscal year 2016 is due to the annual bond payment on the 2008 and 2014 Bonds of approximately $1.3 million and $0.7 million, respectively; and a decrease in long-term capital lease obligations of $0.3 million. Other current and long-term liabilities decreased $1.0 million due to a decrease of $1.8 million for accounts payable and accrued expenses; offset by an increase in third-party payables of $0.3 million; and an increase in other current liabilities of $0.5 million. Finally, as seen in Table 1, fiscal year 2016 total net position decreased $3.2 million to $106 million, down from $109.2 million in fiscal year 2015. The change in net position results primarily from $3.2 million in net operating and nonoperating loss.
2015 Compared to 2014
The decrease of $14.8 million in current and other long-term assets in fiscal year 2015, compared to 2014, is due to a $8.2 million increase in accounts receivable; a $2.4 million increase in cash collateral from the swaps; a $3.6 million decrease in cash, funded depreciation, and investments; a decrease of $0.1 million in deposits and other assets; a decrease of $0.2 million in supplies; a decrease of $1.4 million in prepaid expenses and other assets; and an increase of $1.0 million in net pension assets. The decrease of $1.2 million for deferred outflows is related to the partial refunding of the Series 2008 Bonds and the pension asset. The decrease of $7.6 million in capital assets in 2015 over 2014 stems from the net effect of the capital additions ($4.4 million), less the net change of accumulated depreciation ($12.0 million) recognized in 2015.
The approximately $2.1 million decrease in current and long-term debt outstanding in fiscal year 2015 is due to the annual bond payment on the 2008 and 2014 Bonds of approximately $1.2 million and $.06 million, respectively; a decrease in long-term capital lease obligations of $0.4 million; offset by an increase of $0.1 million due to the amortization of original issue discounts. Other current and long-term liabilities increased $6.3 million due to an increase of $8.9 million for accounts payable and accrued expenses; offset by a decrease in deferred revenue swap of $1.4 million; a decrease in third-party payables of $0.1 million; a decrease in other current liabilities of $0.6 million; and a decrease in other liabilities of $0.5 million. Finally, as seen in Table 1, fiscal year 2015 total net position decreased $28.0 million to $109.2 million, down from $137.2 million in fiscal year 2014. The change in net position results primarily from $28.0 million in net operating and nonoperating loss.
Sources of Revenue
Operating Revenue
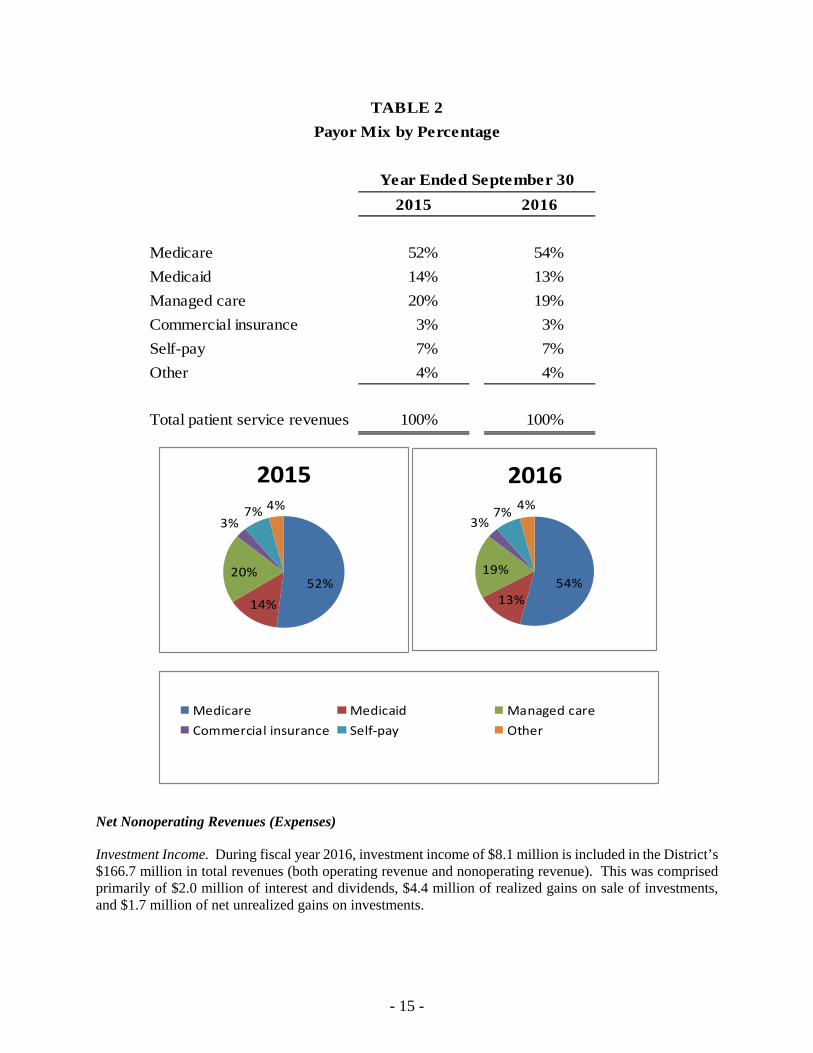
During fiscal year 2016, the District derived approximately 87.0% of total revenues from operations and approximately 13.0% from nonoperating activities. Operating revenues include revenues from the Medicare and Medicaid programs, third-party insurance carriers, and patients. Table 2 presents the relative percentages of gross charges billed for patient services by payor for the fiscal years ended September 30, 2016 and 2015.
- 15 -
2015 2016
Medicare 52% 54%
Medicaid 14% 13%
Managed care 20% 19%
Commercial insurance 3% 3%
Self-pay 7% 7%
Other 4% 4%
Total patient service revenues 100% 100%
Year Ended September 30
TABLE 2
Payor Mix by Percentage
52%
14%
20%
3%7% 4%
2015
54%13%
19%
3%7%
4%
2016
Medicare Medicaid Managed care
Commercial insurance Self‐pay Other
Net Nonoperating Revenues (Expenses)
Investment Income. During fiscal year 2016, investment income of $8.1 million is included in the District’s $166.7 million in total revenues (both operating revenue and nonoperating revenue). This was comprised primarily of $2.0 million of interest and dividends, $4.4 million of realized gains on sale of investments, and $1.7 million of net unrealized gains on investments.

- 16 -
Net Other Nonoperating Expenses. During fiscal year 2016, the District incurred approximately $7.7 million of net nonoperating loss from the activities of NBMS. Within other nonoperating revenue are certain income and/or expenses of the Center; Florida Health Network, a joint venture; and physician recruitment activities.
The District’s net other nonoperating expenses during 2016 approximated the same results from 2015. We have 38 employed physicians as of September 30, 2016. The net loss from physician practices was reduced by approximately $1.0 million compared to 2015. During 2016, our total active medical staff increased by 1; our total active medical staff at September 30, 2016 and 2015, was 100 and 99, respectively.
Summary of Revenues, Expenses, and Changes in Net Position
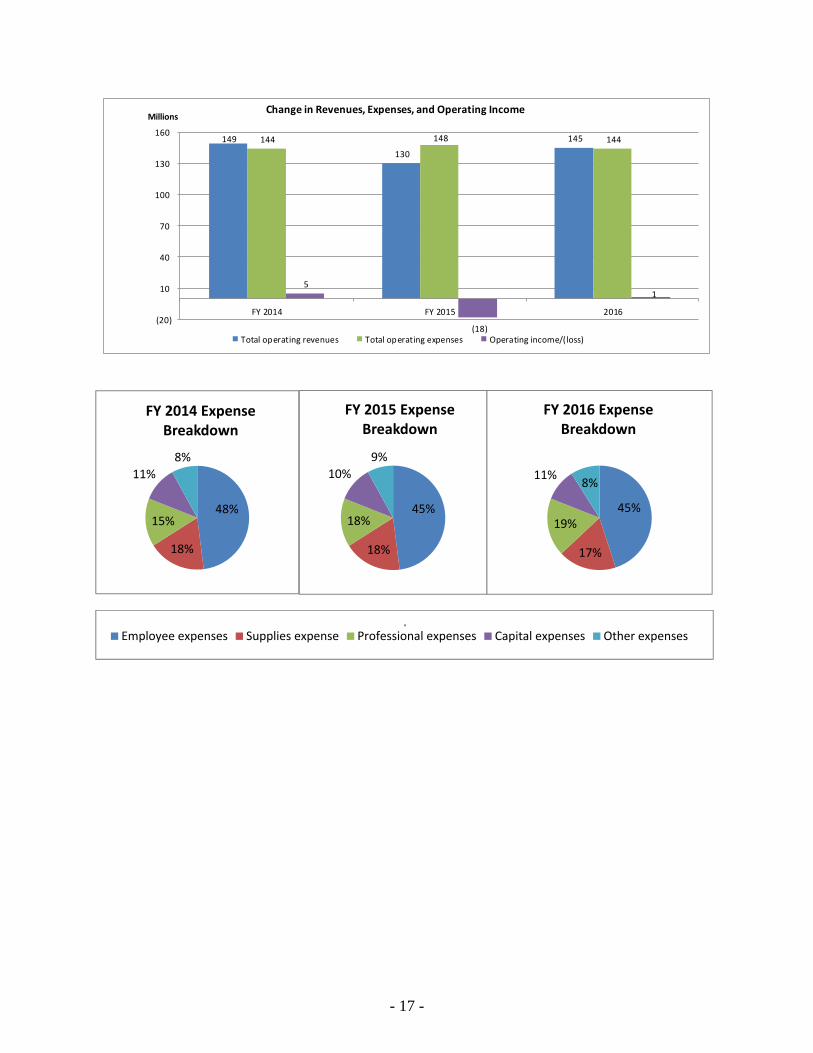
The following table presents a summary of the District’s historical revenues and expenses for each of the fiscal years ended September 30, 2014, 2015, and 2016:
FY 2014As Restated FY 2015 FY 2016
FY15 vs. FY16 Dollar Change
Total % Change
Net patient service revenue 146,705$ 127,883$ 142,149$ 14,266$ 11.2 %Other operating revenues 2,226 1,985 2,924 939 47.3 %Total operating revenues 148,931 129,868 145,073 15,205 11.7 %
Employee expenses 68,433 66,123 65,665 (458) (0.7)%Supplies expense 26,286 26,971 24,543 (2,428) (9.0)%Professional expenses 21,995 27,098 27,370 272 1.0 %Capital expenses 15,531 14,135 15,251 1,116 7.9 %Other expenses 11,857 13,786 11,841 (1,945) (14.1)%Total operating expenses 144,102 148,113 144,670 (3,443) (2.3)%Operating income (loss) 4,829 (18,245) 403 18,648 (102.2)%Nonoperating expense - net (9,055) (9,910) (4,658) 5,252 (53.0)%
Loss before capital contributions (4,226) (28,155) (4,255) 23,900 (84.9)%Capital contributions 70 166 1,094 928 559.0 %
Change in net position (4,156) (27,989) (3,161) 24,828 (88.7)%Total net position - beginning of year 141,306 137,150 109,161 (27,989) (20.4)%
Total net position - end of year 137,150$ 109,161$ 106,000$ (3,161)$ (2.9)%
Changes in Net Position(in thousands)
Condensed Statements of Revenues, Expenses, and TABLE 3
- 17 -
149
130
145 144 148 144
5
(18)
1
(20)
10
40
70
100
130
160
FY 2014 FY 2015 2016
MillionsChange in Revenues, Expenses, and Operating Income
Total operating revenues Total operating expenses Operating income/(loss)
48%
18%
15%
11%
8%
FY 2014 Expense Breakdown
45%
18%
18%
10%
9%
FY 2015 Expense Breakdown
45%
17%
19%
11%8%
FY 2016 Expense Breakdown
Employee expenses Supplies expense Professional expenses Capital expenses Other expenses

- 18 -
OPERATING AND FINANCIAL PERFORMANCE
Table 4 presents the volume indicators for the years ended September 30, 2016 and 2015, as well as the 2016 budget:
Actual 2015 Actual 2016 Budget 2016
Admissions 6,919 6,748 7,218Patient Days 29,244 30,769 29,593Average Length of Stay 4.23 4.56 4.10Adjusted Admissions 19,257 18,429 18,735Adjusted Patient Days 81,229 83,772 76,811Inpatient Surgery and Special 2,295 2,385 2,276Outpatient Surgery and Special 3,600 3,552 3,865Emergency Room Visits 44,529 44,028 45,066Outpatient Diagnostic Visits 66,208 62,194 65,783
Hospital Volume Indicators
Year Ended September 30
TABLE 4
Admissions. The decrease of 171 admissions from the prior year was due to several factors. The change is primarily isolated to the following specialties:
Increases
Cardiology – 184 cases Internal Medicine – 145 cases Pulmonary – 27 Cases
Decreases
Family Practice – 83 cases Hospitalist – 159 cases Nephrology – 59 cases OB/GYN – 64 cases General Surgery – 56 cases Orthopedics – 16 cases Pediatrics – 19 cases Oncology – 35 cases
Surgery Procedures. Inpatient surgery and special procedures in fiscal year 2016 increased by 3.9%, or 90 procedures, compared to fiscal year 2015. Outpatient surgery and special procedures decreased by 1.3%, or 48 procedures, in fiscal year 2016. The following specialties had an increase in fiscal year 2016, as compared to 2015: Cardiology, Gastroenterology and Oncology. The following specialties had a decrease in fiscal year 2016, as compared to 2015: General Surgery, OB/GYN, Ophthalmology and Orthopedics.
Emergency Room Visits. Emergency room visits decreased by 501 visits, or 1.1%, in fiscal year 2016, compared to fiscal year 2015. When compared to the fiscal year 2016 budget, emergency room visits were 2.3%, or 1,038 below budget. The decrease in emergency room visits is primarily due to changes in the uninsured population.

- 19 -
Outpatient Diagnostics. In fiscal year 2016, outpatient diagnostic visits decreased 6.1%, or 4,014 visits, from fiscal year 2015. In addition, compared to the fiscal year 2016 budget, outpatient diagnostic visits were below budget by 3,589, or 5.5%. Parrish Healthcare Center in Port St. John, which opened in 2007, had a decrease in volumes compared to 2015 by 8.5%, or 1,725. In addition, compared to the fiscal year 2016 budget, volumes were below budget by 8.8%, or 1,798. The decrease is mainly due to a shift to the Parrish Medical group, low cost, outpatient diagnostic.
The urgent care center we opened in collaboration with MedFast Urgent Care physicians in June 2010 adds volume to the diagnostic center in Port St. John. In fiscal year 2016, urgent care visits decreased 1.7%, or 158 visits (9,122 in 2016 compared to 9,280 in 2015).
In May 2014, Parrish Medical Group opened the second collaboration with MedFast Urgent Care physicians, this one in Titusville. In fiscal year 2016, urgent care visits increased 27.4%, or 1,896 visits (8,827 in 2016 compared to 6,931 in 2015).
Both Urgent Care Center locations are assisting the community by providing another cost-effective alternative to the emergency room for the community. The physicians that staff the Urgent Care Center are all board-certified emergency room physicians, which is a major differentiator from other urgent care centers.
In 2016, the Urgent Care Centers combined referred 287 patients to PMC, with 73 of them (25.4%) admitted either as inpatient or for observation and the other 214 patients were treated in the emergency room. The 287 patients generated over $2.7 million in gross charges and approximately $1.0 million in net revenue, as the payor mix of the patients transferred is significantly better than the traditional payor mix at PMC.
The following summarizes the District’s Statements of Revenues, Expenses, and Changes in Net Position between 2016 and 2015, as presented in Table 3:
Net Patient Service Revenue: Net patient service revenue increased $14.3 million, or 11.2%, in 2016. Total outpatient surgery and special procedure volume increased 0.7%, and outpatient diagnostic visits decreased 6.1%. Fiscal year 2016 inpatient gross revenue increased 6.7%, and outpatient gross revenue increased by 3.6% from fiscal year 2015. We continue to qualify for the State of Florida’s Medicaid disproportionate share, intergovernmental transfers, and low-income pool programs. We received approximately $4.5 million in 2016, .vs $6.3 million in 2015. The state of Florida is phasing out the low-income pool program, and it is likely that we will be receiving less in future years. Finally, fiscal year 2016 combined bad debt and community care decreased $5.7 million from fiscal year 2015 ($35.6 million in fiscal year 2016 vs. $41.3 million in fiscal year 2015). The combined bad debt and community care, as a percentage of gross revenue, was 5.8% in fiscal year 2016 compared to 7.0% in fiscal year 2015.
Total cash collections on patient accounts increased by $5.7 million compared to fiscal year 2015. The total cash collections of $135.9 million represent 95.6% of the net patient service revenue. Disproportionate share, Low Income Pool funding, and other cost report settlements make up the difference between patient cash and net revenue.
Employee Expenses. Employee expenses decreased $0.5 million, or 0.7%, in 2016, which is a combination of salary and benefit costs. Salary costs decreased $1.5 million, or 3.1%. This was a result of market adjustments, internal promotions, and a decrease of 6.0%, or approximately 62 FTEs, compared to 2015. Employee benefits increased $1.1 million, or 6.6%, primarily because of an increase of $1.2 million in the minimum required pension contribution, a decrease in payroll taxes of $0.1 million related to the decrease in FTEs, and a decrease in other employee benefits of $0.1 million offset by an increase in group health claims paid of $0.1 million.
- 20 -
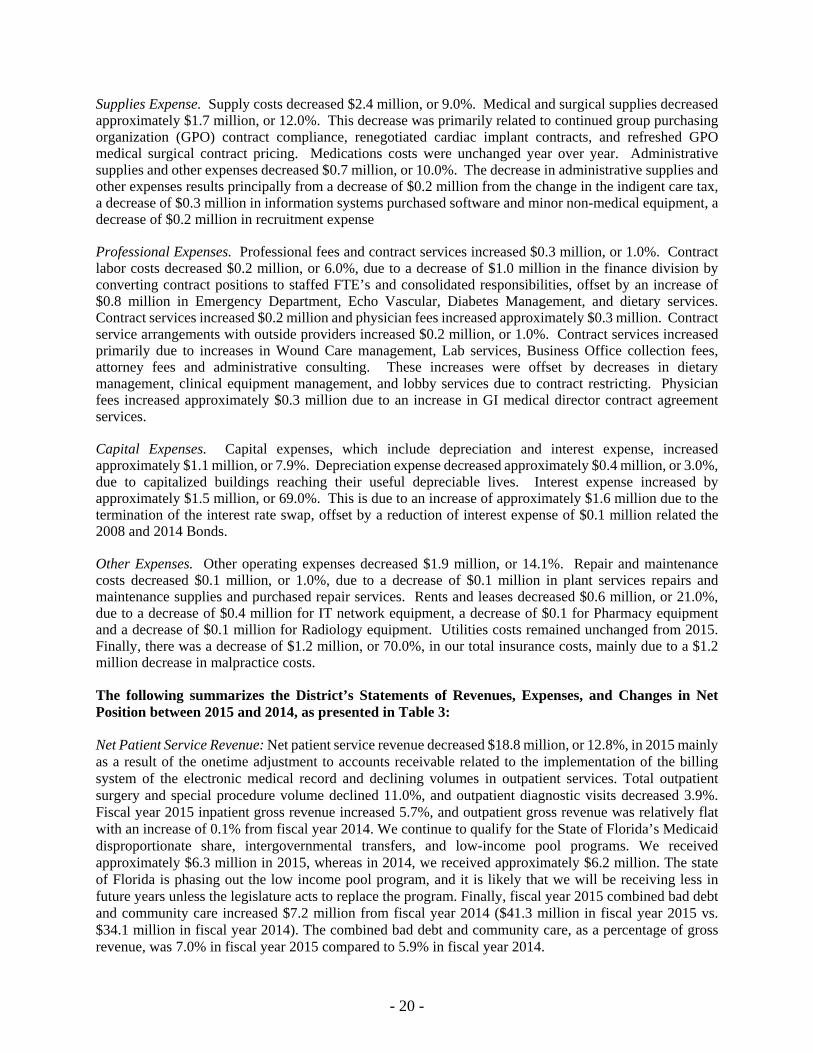
Supplies Expense. Supply costs decreased $2.4 million, or 9.0%. Medical and surgical supplies decreased approximately $1.7 million, or 12.0%. This decrease was primarily related to continued group purchasing organization (GPO) contract compliance, renegotiated cardiac implant contracts, and refreshed GPO medical surgical contract pricing. Medications costs were unchanged year over year. Administrative supplies and other expenses decreased $0.7 million, or 10.0%. The decrease in administrative supplies and other expenses results principally from a decrease of $0.2 million from the change in the indigent care tax, a decrease of $0.3 million in information systems purchased software and minor non-medical equipment, a decrease of $0.2 million in recruitment expense
Professional Expenses. Professional fees and contract services increased $0.3 million, or 1.0%. Contract labor costs decreased $0.2 million, or 6.0%, due to a decrease of $1.0 million in the finance division by converting contract positions to staffed FTE’s and consolidated responsibilities, offset by an increase of $0.8 million in Emergency Department, Echo Vascular, Diabetes Management, and dietary services. Contract services increased $0.2 million and physician fees increased approximately $0.3 million. Contract service arrangements with outside providers increased $0.2 million, or 1.0%. Contract services increased primarily due to increases in Wound Care management, Lab services, Business Office collection fees, attorney fees and administrative consulting. These increases were offset by decreases in dietary management, clinical equipment management, and lobby services due to contract restricting. Physician fees increased approximately $0.3 million due to an increase in GI medical director contract agreement services.
Capital Expenses. Capital expenses, which include depreciation and interest expense, increased approximately $1.1 million, or 7.9%. Depreciation expense decreased approximately $0.4 million, or 3.0%, due to capitalized buildings reaching their useful depreciable lives. Interest expense increased by approximately $1.5 million, or 69.0%. This is due to an increase of approximately $1.6 million due to the termination of the interest rate swap, offset by a reduction of interest expense of $0.1 million related the 2008 and 2014 Bonds.
Other Expenses. Other operating expenses decreased $1.9 million, or 14.1%. Repair and maintenance costs decreased $0.1 million, or 1.0%, due to a decrease of $0.1 million in plant services repairs and maintenance supplies and purchased repair services. Rents and leases decreased $0.6 million, or 21.0%, due to a decrease of $0.4 million for IT network equipment, a decrease of $0.1 for Pharmacy equipment and a decrease of $0.1 million for Radiology equipment. Utilities costs remained unchanged from 2015. Finally, there was a decrease of $1.2 million, or 70.0%, in our total insurance costs, mainly due to a $1.2 million decrease in malpractice costs.
The following summarizes the District’s Statements of Revenues, Expenses, and Changes in Net Position between 2015 and 2014, as presented in Table 3:
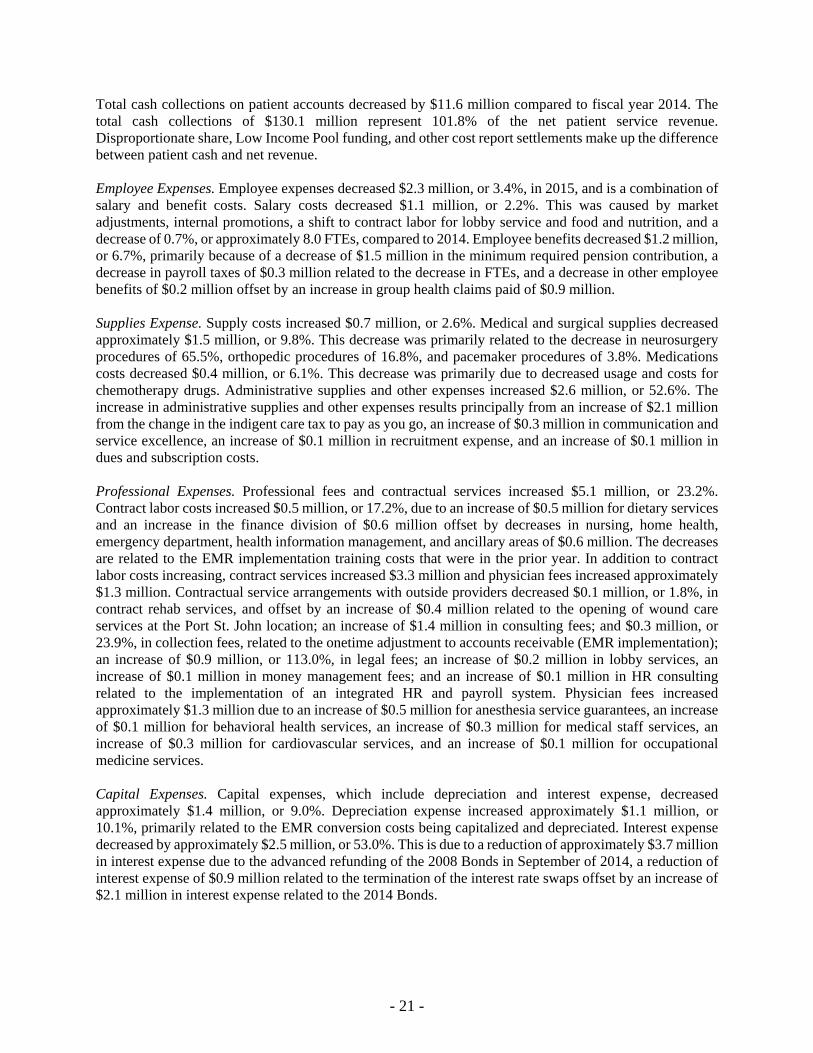
Net Patient Service Revenue: Net patient service revenue decreased $18.8 million, or 12.8%, in 2015 mainly as a result of the onetime adjustment to accounts receivable related to the implementation of the billing system of the electronic medical record and declining volumes in outpatient services. Total outpatient surgery and special procedure volume declined 11.0%, and outpatient diagnostic visits decreased 3.9%. Fiscal year 2015 inpatient gross revenue increased 5.7%, and outpatient gross revenue was relatively flat with an increase of 0.1% from fiscal year 2014. We continue to qualify for the State of Florida’s Medicaid disproportionate share, intergovernmental transfers, and low-income pool programs. We received approximately $6.3 million in 2015, whereas in 2014, we received approximately $6.2 million. The state of Florida is phasing out the low income pool program, and it is likely that we will be receiving less in future years unless the legislature acts to replace the program. Finally, fiscal year 2015 combined bad debt and community care increased $7.2 million from fiscal year 2014 ($41.3 million in fiscal year 2015 vs. $34.1 million in fiscal year 2014). The combined bad debt and community care, as a percentage of gross revenue, was 7.0% in fiscal year 2015 compared to 5.9% in fiscal year 2014.
- 21 -
Total cash collections on patient accounts decreased by $11.6 million compared to fiscal year 2014. The total cash collections of $130.1 million represent 101.8% of the net patient service revenue. Disproportionate share, Low Income Pool funding, and other cost report settlements make up the difference between patient cash and net revenue. Employee Expenses. Employee expenses decreased $2.3 million, or 3.4%, in 2015, and is a combination of salary and benefit costs. Salary costs decreased $1.1 million, or 2.2%. This was caused by market adjustments, internal promotions, a shift to contract labor for lobby service and food and nutrition, and a decrease of 0.7%, or approximately 8.0 FTEs, compared to 2014. Employee benefits decreased $1.2 million, or 6.7%, primarily because of a decrease of $1.5 million in the minimum required pension contribution, a decrease in payroll taxes of $0.3 million related to the decrease in FTEs, and a decrease in other employee benefits of $0.2 million offset by an increase in group health claims paid of $0.9 million. Supplies Expense. Supply costs increased $0.7 million, or 2.6%. Medical and surgical supplies decreased approximately $1.5 million, or 9.8%. This decrease was primarily related to the decrease in neurosurgery procedures of 65.5%, orthopedic procedures of 16.8%, and pacemaker procedures of 3.8%. Medications costs decreased $0.4 million, or 6.1%. This decrease was primarily due to decreased usage and costs for chemotherapy drugs. Administrative supplies and other expenses increased $2.6 million, or 52.6%. The increase in administrative supplies and other expenses results principally from an increase of $2.1 million from the change in the indigent care tax to pay as you go, an increase of $0.3 million in communication and service excellence, an increase of $0.1 million in recruitment expense, and an increase of $0.1 million in dues and subscription costs. Professional Expenses. Professional fees and contractual services increased $5.1 million, or 23.2%. Contract labor costs increased $0.5 million, or 17.2%, due to an increase of $0.5 million for dietary services and an increase in the finance division of $0.6 million offset by decreases in nursing, home health, emergency department, health information management, and ancillary areas of $0.6 million. The decreases are related to the EMR implementation training costs that were in the prior year. In addition to contract labor costs increasing, contract services increased $3.3 million and physician fees increased approximately $1.3 million. Contractual service arrangements with outside providers decreased $0.1 million, or 1.8%, in contract rehab services, and offset by an increase of $0.4 million related to the opening of wound care services at the Port St. John location; an increase of $1.4 million in consulting fees; and $0.3 million, or 23.9%, in collection fees, related to the onetime adjustment to accounts receivable (EMR implementation); an increase of $0.9 million, or 113.0%, in legal fees; an increase of $0.2 million in lobby services, an increase of $0.1 million in money management fees; and an increase of $0.1 million in HR consulting related to the implementation of an integrated HR and payroll system. Physician fees increased approximately $1.3 million due to an increase of $0.5 million for anesthesia service guarantees, an increase of $0.1 million for behavioral health services, an increase of $0.3 million for medical staff services, an increase of $0.3 million for cardiovascular services, and an increase of $0.1 million for occupational medicine services. Capital Expenses. Capital expenses, which include depreciation and interest expense, decreased approximately $1.4 million, or 9.0%. Depreciation expense increased approximately $1.1 million, or 10.1%, primarily related to the EMR conversion costs being capitalized and depreciated. Interest expense decreased by approximately $2.5 million, or 53.0%. This is due to a reduction of approximately $3.7 million in interest expense due to the advanced refunding of the 2008 Bonds in September of 2014, a reduction of interest expense of $0.9 million related to the termination of the interest rate swaps offset by an increase of $2.1 million in interest expense related to the 2014 Bonds.

- 22 -
Other Expenses. Other operating expenses increased $1.9 million, or 16.3%. Repair and maintenance costs increased $0.2 million, or 2.6%, due to an increase of $0.2 million in the lab, an increase of $0.1 million in pharmacy repairs, an increase of $0.1 million in plant services, an increase of $0.1 million for OR repairs, and a decrease of $0.3 million in software and hardware maintenance costs. Rents and leases increased $0.5 million, or 20.0%, due to an increase of $0.3 million for IT network equipment and an increase of $0.2 million for surgical equipment. Utilities costs remained unchanged from 2014. Finally, there was an increase of $1.2 million, or 258.1%, in our total insurance costs, mainly due to a $1.0 million increase in malpractice costs and an increase of $0.2 million in liability and property insurance.
CURRENT BUDGET
The District prepares an annual operating budget, approved by its Board of Directors. The budget is in effect for the entire fiscal year, which begins October 1 and ends on September 30. Significant changes are possible during the year to fund unplanned programs approved by the Board. A fiscal year 2016 budget comparison and analysis is presented monthly in the District’s interim financial statements. A comparison of actual revenues and expenses to the approved budget is summarized in Table 5 below:
Actual Budget Over %2016 2016 (Under) Difference
Net patient service revenue 142,149$ 145,090$ (2,941)$ -2.0%Other operating revenue 2,924 1,761 1,163 66.0%
Total operating revenues 145,073 146,851 (1,778) -1.2%
Employee expenses 65,665 64,043 1,622 2.5%Supplies expense 24,543 24,672 (129) -0.5%Professional expenses 27,370 24,155 3,215 13.3%Capital expenses 15,251 16,210 (959) -5.9%Other expenses 11,841 13,188 (1,347) -10.2%
Total operating expenses 144,670 142,268 2,402 1.7%
Operating income 403 4,583 (4,180) -91.2%
Nonoperating revenue (expenses), net (4,658) (8,079) 3,421 -42.3%
(Loss) before capital contributions (4,255) (3,496) (759) 21.7%
Capital contributions 1,094 - 1,094 100.0%
Change in net position (3,161)$ (3,496)$ 335$ -9.6%
Budget vs. ActualRevenues and Expenses
TABLE 5
(in thousands)
The District completed its fiscal year with a favorable variance of a $0.3 million increase in net position, compared to budget. The following significant variances and their impact on operations are noted below:

- 23 -
Net Patient Service Revenue. Net patient service revenue was under budget by $2.9 million, or 2.0%. The most significant cause for this was a decline in admissions of 6.5%, lower than budgeted outpatient procedures and an increase in length of stay.
Other Operating Revenue. Other operating revenue exceeded budget by $1.2 million, or 66.0%. The increase over budget was principally due to the gain on the sale of the Home Health program. In connection with the sale, NBMS became a 25% owner in the program.
Employee Expenses. Employee expenses were $1.6 million, or 2.5%, over budget. Employee expenses include both salaries and benefits. Salaries exceeded budget by $0.1 million, or 0.2%, and benefits were over budget $1.5 million, or 9.5%. Salaries exceeded budget due to the implementation of the total rewards program. Benefits were over budget by $1.5 million, or 82.0%, due to the higher-than-expected pension expense related to the adoption of GASB 68.
Supplies Expense. Total supply costs were lower than expected by $0.1 million, or 0.5%, compared to budget. Medical and surgical supplies were under budget by $0.4 million, or 3.4%, due to a decrease in Orthopedic and cardio implant costs of $0.4 million, or 5.2%, related to outpatient surgical and diagnostic volume decreases from budget. Medications were at budget for the year. Other supply costs, such as administrative supplies, were above budget ($0.3 million, or 3.7%). This increase is primarily related to an increase of $0.2 million, or 31.0%, in marketing and communication expenses and an increase of $0.1 million in administrative supplies and subscriptions.
Professional Expenses. Professional fees and contract services were $3.2 million, or 13.3%, above budget. Contract labor, which was over budget by approximately $1.8 million, or 129.2%, was due to unbudgeted interim positions in the ER, the cath lab, Echovascular and dietary. Total contract service fees were above budget by approximately $0.7 million, or 3.2%. Legal fees exceeded budget by $1.5 million, consulting fees exceeded budget by $0.5 million related to continued collection efforts of the accounts receivable, offset by reductions in contract management services below budgeted expenses by $1.5 million. Physician fees were $0.7 million, or 39.5%, over budget. Anesthesia support increased $0.4 million and the cath lab medical services fees increased $0.3 million.
Capital Expenses. Capital expenses, which include interest and depreciation, were $1.0 million, or 5.9%, over budget. Interest expense exceeded budget $0.7 million, or 23.4%, related to the termination of the interest rate swap. Depreciation expense was $1.7 million, or 12.7%, below budget, caused by timing differences of assets reaching their fully depreciated state.
Other Expenses. Other operating expenses were under budget by $1.3 million, or 10.2%. Utilities, which include electricity, gas, and water were under budget by $0.1 million. Rents were below budget by $0.6 million, or 21.2%. Repairs and maintenance were under budget by approximately $0.4 million, or 5.2%, due to lower than expected plant maintenance and radiology maintenance costs. Insurance costs were lower than budget by $0.2 million, or 30.9% due to a reduction in medical malpractice insurance.
Nonoperating Revenue/(Expense). Net nonoperating expense was less than budget by $3.4 million, or 42.2%. While in a loss position, the loss from the physician practices is significantly less than in prior year. Compared to budget, the net loss from physician practices exceeded budget by $1.7 million. This loss is offset by investment gains which exceed budget by $3.9 million, or 91.0%, and net other nonoperating expenses being less than budget by $1.2 million, or 18.0%.

- 24 -
CAPITAL ASSETS
During fiscal year 2016, the District invested approximately $7.5 million in capital assets included in Table 6 below:
Dollar Total %FY2015 FY2016 Change Change
Land $ 9,840 $ 9,946 $ 106 1.08 %Land improvements 2,115 3,075 960 45.39 %Buildings and improvements 135,885 138,346 2,461 1.81 %Equipment 85,967 86,959 992 1.15 %Subtotal 233,807 238,326 4,519 1.93 %
Less: accumulated depreciation (146,212) (157,689) (11,477) 7.85 %Construction in progress 3,534 5,134 1,600 45.27 %
Net capital assets $ 91,129 $ 85,771 $ (5,358) (5.88)%
Capital AssetsTABLE 6
(in thousands)
Net property, plant, and equipment decreased $5.4 million, or 5.9%, due to the net effect of capital assets purchased and depreciation expense recognized. Capital expenditures for the year were $7.5 million and were funded by cash flows from operations offset by retirements of $1.4 million and net accumulated depreciation of $12.5 million. The breakdown of the $7.5 million in capital expenditures is approximately $3.3 million for the purchase and renovation of the cancer center; $0.9 million for the software and renovation for the Teletracking and Mission Control project; $2.0 million for the Health Village East project; and $1.3 million in routine capital equipment replacement. More information about the District’s capital assets is presented in the Notes to Basic Financial Statements. LONG-TERM DEBT AND CAPITAL LEASE OBLIGATION
On July 30, 2008, due to the auction rate bond market turmoil, the Hospital issued $99,975,000 in Revenue Refunding Bonds, Series 2008, maturing October 1, 2043. The Series 2008 Bonds’ proceeds were used for the purpose of (i) financing all or a portion of the acquisition, construction, and equipping of an outpatient healthcare center; a cardiac catheterization lab; and certain routine capital projects; (ii) refunding the District’s outstanding Auction Rate Revenue Bonds, Series 2000, and outstanding Auction Rate Revenue Bonds, Series 2005; (iii) funding a reserve fund; and (iv) paying certain costs with respect to the issuance of the Series 2008 Bonds. The Series 2008 Bonds bear a fixed interest rate of 5.69%.
On September 24, 2014, the Hospital completed its refunding of a portion of the Revenue Refunding Bonds, Series 2008 (the “Series 2008 Bonds”) and issued $70,000,000 in Refunding Bonds, Series 2014 (the “Series 2014 Bonds”), maturing October 1, 2043. The proceeds from the Series 2014 Bonds were used for the purpose of (i) refunding a portion ($62,575,000) of the Series 2008 term bonds maturing in 2028, 2038, and 2043 through defeasance; and (ii) establishment of an escrow account with TD Bank, National Association, as escrow agent, sufficient to pay when due the interest and principal on the bonds, at a price equal to 100% of the principal amount thereof (the “Redemption Price”) together with accrued interest thereon to October 1, 2018 (the “Redemption Date”). The Series 2014 Bonds bear a fixed interest rate of 3.0% through October 1, 2029. The interest rate on the Series 2014 Bonds will be remarketed after October 1, 2029, based on then prevailing rates.

- 25 -
The District recognized a deferred outflow related to the defeasance of a portion of the Series 2008 Bonds of approximately $11,571,000. This represents the difference between the amounts funded into the escrow account and the carrying value of principal and associated bond discounts. Deferred outflows on defeasance of approximately $10,765,000 and $11,164,000 at September 30, 2016 and 2015, respectively, are presented net of accumulated amortization of approximately $806,000 and $407,000, respectively.
The Master Indenture requires the Hospital to maintain certain financial ratios and places restrictions on various activities, such as the transfer of assets and incurrence of additional indebtedness. At September 30, 2015, the Hospital was not in compliance with the required debt service coverage. For the year ended September 30, 2016, the District was in compliance with all such covenants.
Under the terms of the related Master Indenture dated as of July 1, 2008, an event of default would not be declared unless the District was not in compliance with the required debt service coverage ratio for two consecutive fiscal year-ends. The District has notified the trustee of the violation, as required by the Master Indenture, and the District has hired a management consultant to provide recommendations for changing operating policies designed to maintain the required bond covenants. The violation is not considered to be an event of default per the terms of the related Master Indenture. Accordingly, the bonds have been classified according to their scheduled maturities.
As a means to manage interest rate exposure, the Hospital had entered into separate interest rate swap agreements on January 29, 2009 and on May 20, 2010 (collectively, the “Swap Agreements”), respectively, with RJ Capital Services, Inc. (the “Interest Rate Swap Counterparty”) in connection with the Series 2008 Bonds, each for one-half the outstanding principal balance.
On September 16, 2015, the Hospital terminated the Swap Agreements. The net proceeds after expenses were approximately $4,250,000 and were reflected in the nonoperating revenues (expenses) section of the statements of revenues, expenses, and changes in net position.
Under the terms of the Swap Agreements, the Hospital had paid the Interest Rate Swap Counterparty the weighted average of the weekly interest rates of the Securities Industry and Financial Markets Association (“SIFMA”) and received a payment computed at 68% of the three-month London InterBank Offered Rate (“LIBOR”), plus a mark-up of 108.5 and 51.75 basis points, respectively.
During the year ended September 30, 2015, the District recognized a reduction of interest expense of approximately $1,461,000, related to the Swap Agreements.
The District has entered into certain lease and loan agreements to finance the purchase of certain operating equipment and construction upgrades. The lease is payable in varying installments through 2023, with rates ranging from 3.8% to 6.0%. The leases have been recognized as capital leases. At September 30, 2016 and 2015, the District’s leased assets of approximately, $2,502,000 are recorded net of accumulated depreciation of approximately $1,946,000 and $1,595,000, respectively.
At September 30, 2016, the Hospital had $98.7 million in short-term and long-term debt and capital lease obligations. Of this amount, $29.6 million was the Series 2008 Bonds offering, $68.7 million was the Series 2014 Bonds issued September 24, 2014, $0.4 million was unamortized bond discount on the Series 2008 Bond issue, and $1.0 million was the capital lease obligation. The principal payment of approximately $1.3 million on the Series 2008 Bonds was due October 1, 2015, and is classified as a current liability on the 2015 Balance Sheet. A more detailed description of the bonds and information about the Hospital’s long-term debt is presented in the Notes to Basic Financial Statements.

- 26 -
ECONOMIC FACTORS AND NEXT YEAR’S BUDGET
The District’s Board and management considered many factors when establishing the fiscal year 2016 budget. Of primary importance was the status of the economy, which takes into account market forces and environmental factors, such as the following:
Medicare and Medicaid legislation; Security legislation (HIPAA); Competitive factors in the District’s market area; Workforce shortages; Impact of the tightening of the credit markets and its impact on the District’s access to capital
funds; Impact of the significant fluctuations in the stock market and its impact on pension fund assets; Impact of the fixed income markets on the District’s $92,000,000 investment portfolio; New insurance products that allow for high deductibles; Physician recruitment; Parrish Healthcare Center at Port St. John expanded services; Impact of turning over the operations of the Community Medical Clinic to Brevard Health
Alliance; Increasing pressure to determine/establish the appropriate physician alignment strategy; Dealing with the impacts of the healthcare reform on operations of the Hospital, as well as
providing health insurance to Hospital employees; Increasing costs of health insurance and pension costs; Managed care penetration; Attesting to Stage II meaningful use; Physician competition with free-standing, ambulatory surgery center; and Employed physician practices continuing to operate at a loss.
The other major consideration was to understand the dynamics of the District’s potential for increasing bad debt and community care costs, while maintaining control of the cost structure necessary to support operations given the impact from the economy on hospital volumes. The desire of the Board and Executive Management is to establish the appropriate physician alignment strategy, to meet the needs of our medical staff, and be in compliance with federal regulations. This is a very sensitive issue, yet critical to successfully meeting the healthcare needs in our community.
CONTACTING THE DISTRICT’S FINANCIAL MANAGER
This financial report is intended to provide our citizens, customers, and creditors with a general overview of the District’s finances and to demonstrate the District’s accountability for its funding. If you have any questions about this report or need additional financial information, please contact the District’s Finance Department at 951 North Washington Avenue, Titusville, Florida 32796.

- 27 -
NORTH BREVARD COUNTY HOSPITAL DISTRICT
BALANCE SHEETSSEPTEMBER 30, 2016 AND 2015
2016 2015
ASSETS
CURRENT ASSETS: Cash and cash equivalents - Note 3 6,758,894$ 8,716,354$ Restricted assets - Held by trustee and required for current liabilities - Note 3 2,177,964 2,144,976 Patient accounts receivable - net of estimated uncollectibles of $16,172,820 and $18,031,602, respectively - Note 10 18,443,454 17,933,161 Supplies 2,292,624 2,599,340 Prepaid expenses and other assets 6,097,084 5,491,215
Total current assets 35,770,020 36,885,046
RESTRICTED ASSETS - Note 3: Temporarily donor-restricted net position 300,988 519,836 Funded depreciation 68,437,543 69,230,545 Held by trustee - Note 5 3,010,919 3,010,845
Total restricted assets, less current portion 71,749,450 72,761,226
OTHER ASSETS: Net pension asset - Note 6 - 6,526,197 Deposits and other assets 2,069,955 1,162,939 Investments - Note 3 16,731,493 15,279,434
Total other assets 18,801,448 22,968,570
CAPITAL ASSETS - Note 4: Land 9,946,078 9,840,078 Improvements to land 3,074,797 2,114,810 Buildings and improvements 138,345,550 135,884,994 Equipment 86,958,898 85,967,120 Construction in progress 5,134,333 3,534,239
243,459,656 237,341,241 Less accumulated depreciation (157,688,679) (146,212,654)
Net capital assets 85,770,977 91,128,587
DEFERRED OUTFLOWS Pension 7,872,482 2,336,088 Series 2008 Bond refunding 10,765,257 11,164,254
Total deferred outflows 18,637,739 13,500,342
TOTAL ASSETS AND DEFERRED OUTFLOWS 230,729,634$ 237,243,771$
(Continued)
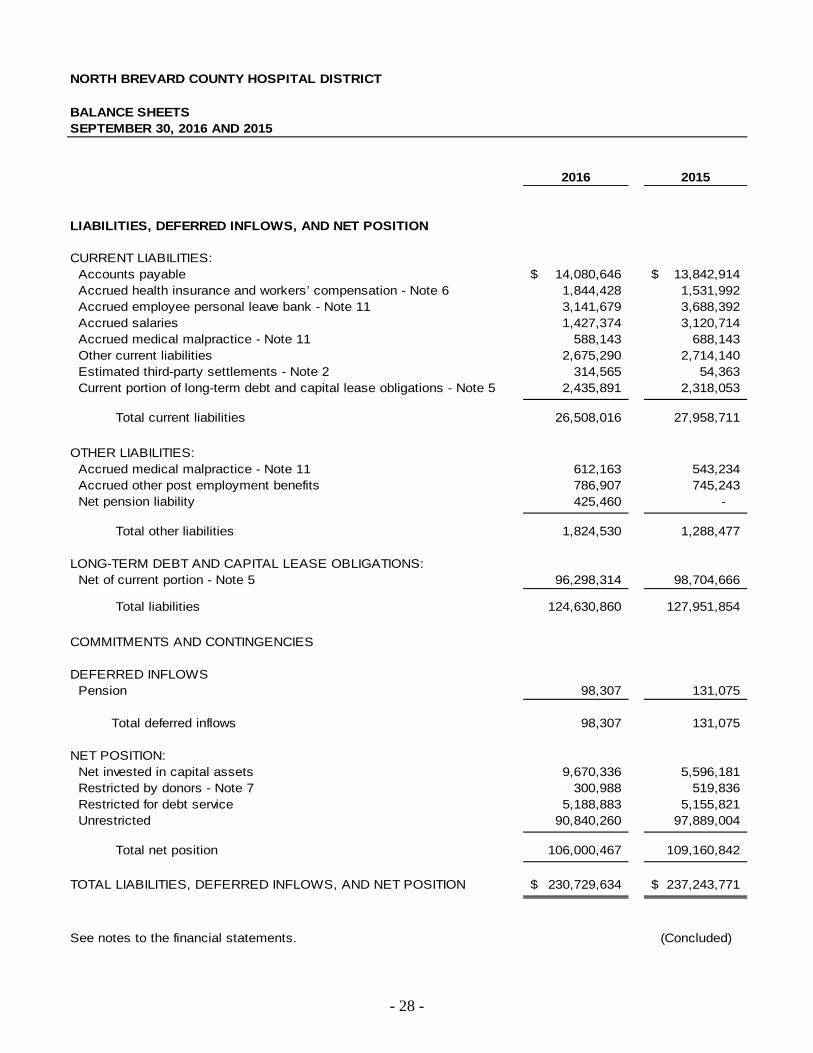
- 28 -
NORTH BREVARD COUNTY HOSPITAL DISTRICT
BALANCE SHEETS SEPTEMBER 30, 2016 AND 2015
2016 2015
LIABILITIES, DEFERRED INFLOWS, AND NET POSITION
CURRENT LIABILITIES: Accounts payable 14,080,646$ 13,842,914$ Accrued health insurance and workers’ compensation - Note 6 1,844,428 1,531,992 Accrued employee personal leave bank - Note 11 3,141,679 3,688,392 Accrued salaries 1,427,374 3,120,714 Accrued medical malpractice - Note 11 588,143 688,143 Other current liabilities 2,675,290 2,714,140 Estimated third-party settlements - Note 2 314,565 54,363 Current portion of long-term debt and capital lease obligations - Note 5 2,435,891 2,318,053
Total current liabilities 26,508,016 27,958,711
OTHER LIABILITIES: Accrued medical malpractice - Note 11 612,163 543,234 Accrued other post employment benefits 786,907 745,243 Net pension liability 425,460 -
Total other liabilities 1,824,530 1,288,477
LONG-TERM DEBT AND CAPITAL LEASE OBLIGATIONS: Net of current portion - Note 5 96,298,314 98,704,666
Total liabilities 124,630,860 127,951,854
COMMITMENTS AND CONTINGENCIES
DEFERRED INFLOWS Pension 98,307 131,075
Total deferred inflows 98,307 131,075
NET POSITION: Net invested in capital assets 9,670,336 5,596,181 Restricted by donors - Note 7 300,988 519,836 Restricted for debt service 5,188,883 5,155,821 Unrestricted 90,840,260 97,889,004
Total net position 106,000,467 109,160,842
TOTAL LIABILITIES, DEFERRED INFLOWS, AND NET POSITION 230,729,634$ 237,243,771$
See notes to the financial statements. (Concluded)

- 29 -
NORTH BREVARD COUNTY HOSPITAL DISTRICT
STATEMENTS OF REVENUES, EXPENSES, AND CHANGES IN NET POSITIONYEARS ENDED SEPTEMBER 30, 2016 AND 2015
2016 2015
OPERATING REVENUE: Net patient service revenue - net of provision for bad debt of $23,757,661 and $30,797,841, respectively - Note 2 142,149,493$ 127,882,559$ Other operating revenue 2,923,529 1,985,366
Total operating revenue 145,073,022 129,867,925
OPERATING EXPENSES: Salaries and wages 48,078,122 49,621,836 Employee benefits 17,586,927 16,501,428 Medications and supplies 24,543,182 26,971,055 Professional fees and contractual services 27,370,032 27,097,534 Other operating expenses 11,840,622 13,785,946 Depreciation 11,517,505 11,926,039 Interest expense 3,733,760 2,208,818
Total operating expenses 144,670,150 148,112,656
OPERATING INCOME (LOSS) 402,872 (18,244,731)
NONOPERATING REVENUES (EXPENSES): Investment income, net - Note 3 8,100,599 3,565,655 Other nonoperating expenses, net - Note 1 (12,758,707) (13,475,750)
Total nonoperating revenue (expenses), net (4,658,108) (9,910,095)
LOSS BEFORE CAPITAL CONTRIBUTIONS (4,255,236) (28,154,826)
CAPITAL CONTRIBUTIONS 1,094,861 165,590
CHANGE IN NET POSITION (3,160,375) (27,989,236)
NET POSITION: Beginning of year 109,160,842 137,150,078
End of year 106,000,467$ 109,160,842$
See notes to the financial statements.

- 30 -
NORTH BREVARD COUNTY HOSPITAL DISTRICT
STATEMENTS OF CASH FLOWSYEARS ENDED SEPTEMBER 30, 2016 AND 2015
2016 2015
CASH FLOWS FROM OPERATING ACTIVITIES: Receipts from third-party payors and patients 141,899,402$ 136,004,240$ Other receipts and payments, net 2,923,529 1,985,366 Payments to employees (49,771,462) (50,790,826) Payments to suppliers and contractors (80,259,817) (72,983,376)
Net cash provided by operating activities 14,791,652 14,215,404
CASH FLOWS FROM INVESTING ACTIVITIES: Interest, dividends, and net realized gains on investments 6,395,427 6,285,072 Change in funded depreciation and investments (8,792,718) 7,449,319
Net cash (used in) provided by investing activities (2,397,291) 13,734,391
CASH FLOWS FROM NONCAPITAL FINANCING ACTIVITIES: Other nonoperating expenses (2,553,939) (11,743,969) Depreciation - nonoperating 982,272 972,306
Net cash used in noncapital financing activities (1,571,667) (10,771,663)
CASH FLOWS FROM CAPITAL AND RELATEDFINANCING ACTIVITIES:
Proceeds on sale of property and equipment 432,878 - Purchases of property and equipment (7,800,953) (5,341,024) Interest paid on long-term debt (4,198,631) (4,240,683) Principal payments on long-term debt (1,978,000) (1,847,000) Principal payments on capital lease obligation (330,309) (331,148) Capital grants and contributions 1,094,861 165,590
Net cash used in capital and related financing activities (12,780,154) (11,594,265)
CHANGE IN CASH AND CASH EQUIVALENTS (1,957,460) 5,583,867
CASH AND CASH EQUIVALENTS - Beginning of year 8,716,354 3,132,487
CASH AND CASH EQUIVALENTS - End of year 6,758,894$ 8,716,354$
(Continued)

- 31 -
NORTH BREVARD COUNTY HOSPITAL DISTRICT
STATEMENTS OF CASH FLOWSYEARS ENDED SEPTEMBER 30, 2016 AND 2015
2016 2015
RECONCILIATION OF OPERATING INCOME (LOSS) TO NET CASH PROVIDED BY OPERATING ACTIVITIES:
Operating income (loss) 402,872$ (18,244,731)$ Adjustments to reconcile income (loss) from operations to net cash provided by operating activities: Depreciation 11,517,505 11,926,039 Amortization of bond discounts 19,795 60,488 Provision for bad debts 23,757,661 30,797,841 Interest expense considered capital financing activity 4,198,631 4,240,683 (Gain) Loss on disposal of property and equipment (37,054) 37,712 Increase in patient accounts receivable (24,267,954) (22,608,623) Decrease in supplies 306,716 173,580 (Increase) Decrease in prepaid expenses and other assets (605,869) 1,382,923 Decrease in temporarily donor restricted funds 218,848 25,047 Decrease (Increase) in net pension asset 957,035 (43,883) (Increase) Decrease in deposits and other assets (907,016) 121,172 Increase in accounts payable 500,694 8,523,746 Increase (Decrease) in accrued health insurance and workers’ compensation 312,436 (524,725) (Decrease) Increase in accrued employee personal leave bank (546,713) 8,389 Decrease in accrued salaries (1,693,340) (1,168,990) (Decrease) Increase in accrued medical malpractice (31,071) 97,688 Increase (Decrease) in estimated third party settlements 260,202 (67,537) Increase in other post employment benefits 41,664 41,772 Increase in net pension liability 425,460 - Decrease in other current liabilities (38,850) (563,187)
NET CASH PROVIDED BY OPERATING ACTIVITIES 14,791,652$ 14,215,404$
SUPPLEMENTAL DISCLOSURE OF NONCASH FINANCINGAND INVESTING ACTIVITIES:
Assets acquired but unpaid for and included in accounts payable 409,379$ 146,417$
See notes to the financial statements. (Concluded)

- 32 -
NORTH BREVARD COUNTY HOSPITAL DISTRICT NOTES TO BASIC FINANCIAL STATEMENTS YEARS ENDED SEPTEMBER 30, 2016 AND 2015
1. REPORTING ENTITY AND SUMMARY OF SIGNIFICANT ACCOUNTING POLICIES
Reporting Entity - The North Brevard County Hospital District (the “District”) was created under the laws of the state of Florida in 1953 and operates Parrish Medical Center (the “Hospital”), a community hospital providing inpatient and outpatient healthcare services in North Brevard County, Florida. The basic financial statements of the District include the balances of North Brevard Medical Support, Inc. (“NBMS”), a not-for-profit, non-stock corporation and blended component unit of the District, organized under the laws of the state of Florida solely to benefit and further the interests of the District through physician recruitment and the provision of medical goods and services.
The District’s primary activity is the operation of a general acute care hospital licensed for 210 beds.
The District has entered into employment agreements with certain local physicians to ensure that adequate professional and medical services are available in its service area. The District managed a total of 16 physicians’ practices with 38 physicians as of September 30, 2016, and 17 physicians’ practices with 37 physicians as of September 30, 2015.
During 2003, NBMS entered into a letter of agreement with Physicians Professional Liability Risk Retention Group (“PPLRRG”) to purchase 500,000 shares of PPLRRG’s Class E common stock. The purpose of this investment is to provide local physicians practicing at the Hospital with an alternative and affordable primary layer of malpractice insurance coverage (see Note 3).
The District may levy taxes upon all real and personal taxable property in the District for operating purposes and debt service, not to exceed five mills for all purposes. Effective September 19, 1994, the Board of Directors adopted a tax rate of zero mills; subsequently, no taxes have been assessed, including fiscal years 2016 and 2015.
During fiscal year 1995, the Florida Legislature approved an amendment to the District’s enabling legislation, which allowed the District to participate with other hospitals and healthcare providers to provide services within and beyond the boundaries of the District. The District is expressly prohibited from using any funds derived from the assessment of ad valorem taxes on property within the District to support any such joint participation beyond the boundaries of the District.
All intercompany balances and transactions between the Hospital and NBMS have been eliminated.
Basis of Presentation - The District applies the provisions of Governmental Accounting Standards Board (“GASB”) pronouncements. The GASB has established standards for external financial reporting for all state and local governmental entities, which include a balance sheet, a statement of revenue and expenses, a statement of changes in net position, and a direct method statement of cash flows. Net position is classified into three components: net invested in capital assets, restricted, and unrestricted. These classifications are defined as follows:
Net Invested in Capital Assets: This component of net position consists of capital assets, including restricted capital assets, net of accumulated depreciation and reduced by the outstanding balances of any bonds, mortgages, notes, or other borrowings that are attributable to the acquisition, construction, or improvement of those assets.

- 33 -
Restricted: This component of net position consists of contributed assets whose use is restricted through external constraints imposed by creditors (such as through debt covenants), grantors, contributors, or laws or regulations of other governments, or constraints imposed by law through constitutional provisions or enabling legislation.
Unrestricted: This component of net position consists of net position that do not meet the definition of “restricted” or “net invested in capital assets.”
Enterprise Fund Accounting - The District uses enterprise fund accounting. Revenues and expenses are recognized on the accrual basis using the economic resources measurement focus.
Use of Estimates - The preparation of financial statements in conformity with accounting principles generally accepted in the United States of America requires management to make estimates and assumptions that affect the reported amounts of assets and liabilities and disclosure of contingent assets and liabilities at the date of the basic financial statements, and the reported amounts of revenues and expenses during the reporting period. The more significant areas subject to management estimates include estimated reserves for professional liability, workers’ compensation and health insurance claims, net pension asset/liability, allowances for uncollectible patient accounts receivable, and third-party payor settlements. Actual results could differ from those estimates.
Cash and Cash Equivalents - Cash and cash equivalents include investments in highly liquid debt instruments with an original maturity of three months or less and excludes otherwise qualifying amounts which are internally designated by the Board of Directors for a specific purpose and reported in restricted assets.
Supplies - Supplies are stated at the lower of cost or market, determined by the first-in, first-out method.
Restricted Assets - Cash, investments, and pledges receivable limited in substance under terms of debt indentures, trust agreements, or other similar arrangements, and internally designated assets set aside by the Board of Directors for future capital improvements (“funded depreciation”), over which the Board retains control and may, at its discretion, subsequently use for other purposes, are considered to be restricted assets. Investments, consisting of marketable debt securities, are carried at fair value. Amounts required to meet current liabilities of the District are presented as current assets in the balance sheets.
Investments - Marketable securities included in the District’s investment portfolios are carried at fair value based on quoted market prices (see Note 3). Changes in fair value are included in investment income in the statements of revenues, expenses, and changes in net position.
Derivative Instruments - The District’s derivative instruments consisting of interest rate swap agreements were terminated on September 16, 2015 (see Note 5).
Capital Assets - Capital assets are recorded at cost, except for donated assets, which are recorded at fair value at the time of donation. Expenditures, which materially increase values, change capacities, or extend useful lives, are capitalized, as is interest cost during the period of construction. Depreciation is computed using the straight-line method over the estimated useful lives of the various assets. Equipment under capital lease obligations is amortized using the straight-line method over the shorter period of the lease term or the estimated useful life of the asset. Amortization is included in depreciation in the statements of revenues, expenses, and changes in net position. Gains and losses on dispositions are recorded in the year of disposal and are included in other nonoperating revenues (expenses) in the statements of revenues, expenses, and changes in net position. Estimated useful lives used in computing depreciation range as follows:
Improvements to land 5 to 20 yearsBuildings and improvements 5 to 40 yearsEquipment 3 to 15 years
The Hospital has a policy of funding depreciation on certain assets. The funds are held in cash and investment accounts and recorded as part of restricted assets (see Note 3).

- 34 -
The District considers impairment whenever indicators of impairment are present, such as when the decline in service utility of the capital asset is large in magnitude and unexpected. Pursuant to these guidelines, management has determined that no impairments of capital assets existed at September 30, 2016 and 2015.
Capitalized Interest - The District capitalizes the interest cost of restricted, tax-exempt borrowings less any interest earned on temporary investment of the proceeds of those borrowings from the date of borrowing until the specified qualifying assets acquired with those borrowings are ready for their intended use. As a result, the balance sheets reflect an increase of approximately $88,000 and $55,000 to construction in progress, representing net interest expense capitalized for the years ended September 30, 2016 and 2015, respectively.
Deferred Outflows / Deferred Inflows - In addition to assets, the District reports a separate section for deferred outflows of resources on its balance sheets. Deferred outflows of resources represent a consumption of net position that applies to future periods and will not be recognized as an outflow of resources until then. The District has two items that qualify for reporting as deferred outflows of resources.
Deferred Outflow on Partial Refunding of the Series 2008 Bonds – The defeasance costs related to the partial refunding of the Series 2008 Bonds are included in deferred outflows and are being amortized over the period the bonds are outstanding. Amortization expense related to these costs is included in other nonoperating expenses as interest expense.
Deferred Outflow Related to Pensions - These deferred outflows of resources are an aggregate of items related to pensions as calculated in accordance with GASB No. 68, Accounting and Financial Reporting for Pension – an amendment of GASB Statement No. 27 (“GASB No. 68”). The deferred outflows related to pensions will be recognized as either pension expense or a reduction in net pension asset in future reporting years. Details on the composition of the deferred outflows of resources related to pension are further discussed in Note 8.
In addition to liabilities, the District reports a separate section for deferred inflows of resources on its balance sheets. Deferred inflows of resources represent an acquisition of net position that applies to future periods and will not be recognized as an inflow of resources until then. The District has one item that qualifies for reporting as deferred inflows of resources.
Deferred Inflows Related to Pensions - These deferred inflows of resources are an aggregate of items related to pensions as calculated in accordance with GASB 68. The deferred inflows related to pensions will be recognized as a reduction to pension expense or a change in net pension asset/liability in future reporting years (see Note 8).
Risk Management - The District is exposed to various risks of loss from torts; theft of, damage to, and destruction of assets; business interruption; errors and omissions; and natural disasters. Commercial insurance coverage is purchased for claims arising from such matters. Settled claims have not exceeded this commercial coverage for the prior three years. The Hospital is self-insured for medical malpractice and employee health and workers’ compensation benefits. The estimated liabilities for such self-insured programs include estimates of the ultimate costs for both reported claims and claims incurred but not reported.
Statements of Revenues, Expenses, and Changes in Net Position - For purposes of display, transactions deemed by management to be ongoing, major, or central to the provision of healthcare services are reported as operating revenue or operating expenses. Nonoperating revenues (expenses) represent the net operations of activities or transactions incidental or peripheral to the direct care of patients within the Hospital setting and primarily include the District’s funding of NBMS, physician practices, health and fitness center, rental activities, and investment income. Approximately $7,725,000 and $8,731,000 of net loss related to the physician practice operations, $5,259,000 and $4,685,000 of other nonoperating expenses, and $225,000 and $60,000 of net income from health and fitness is included in other net nonoperating expenses in the 2016 and 2015 statements of revenues, expenses, and changes in net position, respectively. When an expense is incurred for purposes which there are both restricted and unrestricted net position available, it is the District’s policy to apply those expenses to restricted net position, to the extent such are available.

- 35 -
Net Patient Service Revenue - Net patient service revenue is reported at estimated net realizable amounts from patients, third-party payors, and others when services are rendered, including estimated retroactive adjustments under reimbursement agreements with third-party payors. Retroactive adjustments are accrued on an estimated basis in the period the related services are rendered and adjusted in future periods as final settlements are determined. Bad debts are reported as a component of net patient service revenue.
Charity Care - The District provides care to patients who meet certain criteria under its charity care policy without charge or at amounts less than its established rates. Because the District does not pursue collection of amounts determined to qualify as charity care, they are not reported as net patient service revenue.
Contributed Resources - Resources restricted by donors for specific operating purposes are held as restricted funds until expended for the intended purpose and are reported as other operating revenue. Resources restricted by donors for additions to property and equipment, which are reported as capital contributions, are held as restricted funds until expended, at which time they are reported as transfers to unrestricted net position. Gifts, grants, and bequests not restricted by donors are initially reported as other operating revenue regardless of the use for which they might be designated by the Board of Directors.
Income Taxes - NBMS has been recognized by the Internal Revenue Service as a tax-exempt organization, as described in Section 501(c)(3) of the Internal Revenue Code. Income earned in furtherance of the District’s tax-exempt or governmental purpose is exempt from federal and state income taxes. The Internal Revenue Code provides for taxation of unrelated business income under certain circumstances. Management has determined that the District has no significant unrelated business income. Accordingly, these financial statements include no provision or liability for income taxes.
Fair Value of Financial Instruments - The carrying value of net accounts receivable, accrued liabilities, and accounts payable approximates fair value due to the short-term nature of these accounts.
Accrued Public Assessment Assistance - The District is required to make quarterly payments to The Public Medical Assistance Trust Fund (“PMATF”) based on a prescribed percentage (1.5% for inpatient and 1.0% for outpatient) of prior period revenue, as prescribed by the Agency for Health Care Administration. The District has elected to recognize a liability for the PMATF based on the calculated amount currently due, representing the District’s estimate of the termination liability.
Other Postemployment Benefits - The GASB requires state and local governmental employers to account for and report their annual cost of postemployment healthcare and other non-pension benefits (“OPEB”) and the outstanding obligations and commitments related to OPEB in essentially the same manner as they currently do for pensions. Annual OPEB costs are based on actuarially determined amounts that, if paid on an ongoing basis, generally would provide sufficient resources to pay benefits as they become due. As described in Note 6, the District’s defined-benefit pension retirement plan includes a health insurance subsidy benefit of $100 per month. The District’s net OPEB obligation was approximately $787,000 and $745,000 as of September 30, 2016 and 2015, respectively, which is included within the other liabilities section of the balance sheets. The District has elected to fund the OPEB obligation on a pay-as-you-go basis.
Subsequent Events - The District evaluated subsequent events for recognition and disclosure through January 6, 2017, which is the date the basic financial statements were issued.
In December 2016, the District sold the Dialysis program to a third party for a sales price of approximately $2.9M. The Dialysis program will be a 40% joint venture of NBMS.

- 36 -
2. NET PATIENT SERVICE REVENUE
The Hospital has agreements with third-party payors that provide for payments to the Hospital at amounts different from its established rates. Major third-party payors are summarized below:
Medicare - Inpatient acute care services and certain outpatient services rendered to Medicare program benefi-ciaries are paid at prospectively determined rates per discharge. These rates vary according to a patient classification system that is based on clinical, diagnostic, and other factors. Inpatient non-acute services and use of capital related to Medicare beneficiaries are paid based on a cost-reimbursement methodology. The Hospital is reimbursed for cost-reimbursable items at a tentative rate, with final settlement determined after submission of annual cost reports by the Hospital and audits thereof by the Medicare Fiscal Intermediary (reports audited through 2013). The Hospital’s classification of patients under the Medicare program and the appropriateness of their admission are subject to an independent review by a peer review organization.
Reimbursement for Medicare Outpatient services is made in accordance with the Ambulatory Payment Classification (“APC”) system called for under the Outpatient Prospective Payment System. Unlike the Inpatient Prospective Payment System (“DRG”), with one DRG payment per inpatient discharge, each outpatient encounter under the APC system could result in the assignment of multiple APC payments. Regulations allow providers to reduce or waive the beneficiary’s co-insurance, as well as provide for additional payments for new devices, drugs, or biologicals. The Hospital has determined not to reduce or waive beneficiary co-insurance during 2016 and 2015.
Medicaid - Inpatient and outpatient services rendered to Medicaid program beneficiaries are reimbursed under a cost-reimbursement methodology. The Hospital is paid at a prospective tentative rate based upon the most recent cost report available at the time of the rate setting. Such rates are based on specific services, adjusted for inflation, and subject to regional cost limitations. After submission of annual cost reports by the Hospital and audits thereof by the Medicaid Fiscal Intermediary (reports audited through 2010), a final rate is determined. Claims paid at prospective rates are reprocessed using the final audited rates and a settlement is computed.
Final determination of amounts earned pursuant to the Medicare and Medicaid programs for open years is subject to review by appropriate governmental authorities or their agents. It is management’s opinion that settlements for cost reporting years after 2013 for Medicare and 2010 for Medicaid, when reached, will not vary significantly from the estimated amounts. During 2016 and 2015, the Hospital received additional assessments and reimbursement from the Medicare and Medicaid programs, primarily related to increased reimbursement levels and funding for disproportionate share services. The increase to historically claimed reimbursements were processed and approved by the various Intermediaries through lump-sum settlements and retroactive rate adjustments during the current year. In 2016 and 2015, the Hospital recorded a decrease to net patient service revenue of approximately $150,000 and an increase of $542,000, respectively, relating to prior-year, estimated third party settlement, and other payment issues. The net estimated third-party payable to Medicare and Medicaid as of September 30, 2016 and 2015, of approximately $315,000 and $54,000, respectively, is recorded in estimated third party settlements in the current liabilities section of the balance sheet.
Other Third-Party Payors - The Hospital also has various payment arrangements for inpatient and outpatient services rendered to commercial insurance carriers, health maintenance organizations, and preferred provider organizations. These agreements include prospectively determined discharge rates, per diems, and discounts from established rates.

- 37 -
Following is a summary of net patient service revenue for fiscal years 2016 and 2015:
2016 2015
Gross patient service revenue 615,620,033$ 587,772,791$ Less provision for contractual adjustments (437,854,275) (418,562,105) Less provision for charity adjustments (11,858,604) (10,530,286)
Less provision for bad debt (23,757,661) (30,797,841)
Net patient service revenue 142,149,493$ 127,882,559$
3. CASH, CASH EQUIVALENTS, INVESTMENTS, AND OTHER
Investments are stated at fair values, which are estimated based upon quoted market prices for those or similar instruments. The composition of the District’s cash and cash equivalents, investments, and restricted assets at September 30, 2016 and 2015, is as follows:
2016 2015Restricted AssetsRestricted cash and cash equivalents: Temporarily donor-restricted net position 300,988$ 519,836$ Held by trustee - net of current portion 3,010,919 3,010,845
Total restricted cash and cash equivalents 3,311,907 3,530,681
Cash and investments for funded depreciation: Cash and cash equivalents - 141,905 Marketable securities 68,251,274 68,811,430 Accrued interest receivable 186,269 277,210
Total cash and investments for funded depreciation 68,437,543 69,230,545
Total restricted assets - noncurrent portion 71,749,450 72,761,226 Current portion included in current assets - cash held by trustee 2,177,964 2,144,976
Total restricted assets 73,927,414$ 74,906,202$
Other Assets - InvestmentsMarketable securities 16,681,979$ 15,218,252$ Accrued interest receivable 49,514 61,182
Total other assets - investments 16,731,493$ 15,279,434$

- 38 -
The composition of the Hospital’s marketable securities as of September 30, 2016 and 2015, are as follows:
Market One year More ThanSeptember 30, 2016 Value or Less 1–5 Years 6–10 Years 10 YearsU.S. Government Obligations 3,656,984$ -$ 445,850$ 891,531$ 2,319,603$ Municipal Obligations 1,176,488 493,289 683,199 - - Corporate Bonds 13,266,649 1,542,243 8,250,312 2,392,423 1,081,671 U.S. Agency Mortgage-Backed Securities 5,281,420 - - 849,540 4,431,880 Collateralized Mortgage Obligations 307,991 - - 307,991 -
23,689,532 2,035,532$ 9,379,361$ 4,441,485$ 7,833,154$
Domestic Equities 36,910,375 International Equities 4,152,551 Mutual Funds: Short Term Bond Fund 3,735,198 Intermediate Term Bond Fund 11,466,318 Alternative Investments - Real Estate 2,471,396 Real Estate EFTs 2,743,666
Total Marketable Securities 85,169,036$
AAA AA A BBB <BBB Not RatedU.S. Government Obligations 3,656,984$ -$ -$ -$ -$ -$ Municipal Obligations - 647,607 252,008 - - 276,873 Corporate Bonds - 1,017,395 6,011,419 5,939,228 97,750 200,857 U.S. Agency Mortgage-Backed Securities 5,281,420 - - - - - Collateralized Mortgage Obligations 307,991 - - - - - Domestic Equities - - - - - 36,910,375 International Equities - - - - - 4,152,551 Mutual Funds - - - - - 15,201,516 Alternative Investments - Real Estate - - - - - 2,471,396 Real Estate EFTs - - - - - 2,743,666
Total Marketable Securities 9,246,395$ 1,665,002$ 6,263,427$ 5,939,228$ 97,750$ 61,957,234$
Investment Maturities
Ratings

- 39 -
Market One year More ThanSeptember 30, 2015 Value or Less 1–5 Years 6–10 Years 10 YearsU.S. Government Obligations 3,094,416$ -$ 699,671$ 2,394,745$ -$ Municipal Obligations 4,463,458 924,811 3,053,156 485,491 - Corporate Bonds 14,170,510 3,010,381 7,305,072 1,795,708 2,059,349 U.S. Agency Mortgage-Backed Securities 3,348,903 - - 1,769,618 1,579,285 Collateralized Mortgage Obligations 362,280 - - 362,280 -
25,439,567 3,935,192$ 11,057,899$ 6,807,842$ 3,638,634$
Domestic Equities 26,689,339 International Equities 6,132,849 Mutual Funds: Collateralized Mortgage Obligations 1,628,403 Corporate Bonds 8,606,364 Asset-Backed Securities 2,752,388 U.S. Agency Mortgage-Backed Securities 5,413,974 U.S. Government Obligations 2,653,783 Alternative Investments - Real Estate 2,257,886 Real Estate EFTs 2,232,872 Other Investments - Foreign Currency 222,257
Total Marketable Securities 84,029,682$
AAA AA A BBB <BBB Not RatedU.S. Government Obligations 3,094,416$ -$ -$ -$ -$ -$ Municipal Obligations - 1,239,804 2,506,222 341,103 - 376,329 Corporate Bonds 837,301 461,855 5,963,743 6,378,481 463,500 65,630 U.S. Agency Mortgage-Backed Securities 3,348,903 - - - - - Collateralized Mortgage Obligations 362,280 - - - - - Domestic Equities - - - - - 26,689,339 International Equities - - - - - 6,132,849 Mutual Funds - - - - - 21,054,912 Alternative Investments - Real Estate - - - - - 2,257,886 Real Estate EFTs - - - - - 2,232,872 Bank Deposits - - - - - 222,257
Total Marketable Securities 7,642,900$ 1,701,659$ 8,469,965$ 6,719,584$ 463,500$ 59,032,074$
Investment Maturities
Ratings
The District adopted generally accepted accounting standards for Fair Value Measurements which provides a single definition of fair value and established a three-tier hierarchy, which prioritizes the inputs used in measuring fair value. The hierarchy gives the highest priority to unadjusted quoted prices in active markets for identical assets or liabilities (Level 1 measurements) and the lowest priority to unobservable inputs (Level 3 measurements).
The three levels of the fair value hierarchy are described below: Level 1 Unadjusted quoted prices in active markets for identical assets or liabilities Level 2 Inputs other than quoted prices in active markets within Level 1 that are either directly or indirectly
observable Level 3 Significant unobservable inputs for the asset or liability in which little or no market data exists

- 40 -
A financial instrument’s level within the fair value hierarchy is based on the lowest level of any input that is significant to the fair value measurement. The following is a description of the valuation methodologies used for instruments measured at fair value. If available, quoted market prices are used to value investments. U.S. Government obligations, Municipal Obligations, Corporate Bonds, U.S. Agency Mortgage-Backed Securities, Collateralized Mortgage Obligations, Domestic Equities, International Equities, and Real Estate ETFs are valued at the closing price reported on the major market on which the individual securities are traded. Mutual funds and alternative investments – real estate are valued using a market approach at the recorded closing net asset value (“NAV”) of the funds. The NAV is based on the fair value of the underlying investments. The District’s bonds payable are valued at quoted prices considering yields for the same or similar types of borrowings, taking into account the underlying terms.
September 30, 2016
Assets:Level 1 Level 2 Level 3 Total
U.S. Government Obligations 3,656,984$ -$ -$ 3,656,984$ Municipal Obligations 1,176,488 - - 1,176,488 Corporate Bonds 13,266,649 - - 13,266,649 U.S. Agency Mortgage-Backed Securities 5,281,420 - - 5,281,420 Collateralized Mortgage Obligations 307,991 - - 307,991 Domestic Equities 36,910,375 - - 36,910,375 International Equities 4,152,551 - - 4,152,551 Mutual Funds 15,201,516 - - 15,201,516 Alternative Investments - Real Estate - - 2,471,396 2,471,396 Real Estate ETFs 2,743,666 - - 2,743,666
Marketable debt securities 82,697,640$ -$ 2,471,396$ 85,169,036$
Liabilities:
Bonds payable -$ 101,299,000$ -$ 101,299,000$
September 30, 2015
Assets:Level 1 Level 2 Level 3 Total
U.S. Government Obligations 3,094,416$ -$ -$ 3,094,416 Municipal Obligations 4,463,458 - - 4,463,458 Corporate Bonds 14,170,510 - - 14,170,510 U.S. Agency Mortgage-Backed Securities 3,348,903 - - 3,348,903 Collateralized Mortgage Obligations 362,280 - - 362,280 Domestic Equities 26,689,339 - - 26,689,339 International Equities 6,132,849 - - 6,132,849 Mutual Funds 21,054,912 - - 21,054,912 Alternative Investments - Real Estate - - 2,257,886 2,257,886 Real Estate ETFs 2,232,872 - - 2,232,872 Bank Deposits 222,257 - - 222,257
Marketable debt securities 81,771,796$ -$ 2,257,886$ 84,029,682$
Liabilities:
Bonds payable -$ 103,906,000$ -$ 103,906,000$
Fair Value Measurements
Fair Value Measurements
Credit Risk - State of Florida Statutes, Section 218.415, provides for each unit of local government or political sub-division to adopt investment policies that are commensurate with the nature and size of public funds within their custody. These policies must include consideration for safety of capital, liquidity of funds, diversification of investments, investment income, maturity requirements, and performance measurement. Section 218.415, Florida Statutes, authorizes the District to invest in (1) the Local Government Surplus Funds Trust Fund, which is administered by the State Board of Administration; (2) obligations of, or obligations for which the principal and interest are unconditionally guaranteed by the U.S. Government; (3) interest-bearing time deposits or savings accounts in banks and savings and loans organized under laws of the United States of America; (4) obligations of the Federal Farm Credit Banks, the Federal Home Loan Mortgage Corporation, the Federal Home Loan Bank, the Federal National Mortgage Association, and obligations guaranteed by the Government

- 41 -
National Mortgage Association; and (5) other investments authorized by resolution by the governing board of a special district.
The District has a Board-approved policy for the investment of funds. The District has investment management agreements which provide for selected investment managers to invest and manage the District’s board-designated and excess operating funds in accordance with the District’s investment policy. The funds are pooled and invested according to established investment criteria and the nature of intended use. Long-term designation of investments is based on the maturity dates underlying investments and/or the intent of management to hold the investments for long-term purposes. Investment securities are classified as available for sale, as the investment managers have the ability to liquidate investments in order to avoid losses from changes in market conditions. Funds held under the Bond Indenture are required to be invested in qualified investments, as defined in the Bond Indenture. All other funds are required to be invested according to the District’s investment policy, which was updated in November 2016. The objectives of the District’s investment policy are prioritized in the following order: (1) safety of principal, (2) liquidity, (3) generation of income, (4) inflation protection, (5) return on investment/yield, and (5) understanding of risk.
Concentration of Credit Risk - Investments in any one issuer that represent 5% or more of an entity’s investment portfolio are required to be disclosed. Investments issued or explicitly guaranteed by the U.S. Government, and investments in mutual funds, external investment pools, and other pooled investments, are excluded from this requirement. Based on the nature of the District’s investments, no concentration of credit risk exists for the District.
Custodial Credit Risk - As of September 30, 2016 and 2015, all of the District’s cash and cash equivalents are held in the name of the District or NBMS. Accordingly, no custodial credit risk exists for the District.
Deposit Risk - In addition to insurance provided by the Federal Deposit Insurance Corporation, all of the District’s demand deposits are held in banking institutions approved by the state of Florida state treasurer to hold public funds. Under the Florida Statutes, Chapter 280, Florida Security for Public Deposits Act (“Chapter 280”), the state treasurer requires all qualified public depositories to deposit with the treasurer or another banking institution eligible collateral equal to amounts ranging from 50% to 125% of the average daily balance for each month of all public deposits in excess of any applicable deposit insurance held. The percentage of eligible collateral (generally, U.S. Government and Agency Securities, state or local government debt, or corporate bonds) to public deposits is dependent upon the depository’s financial history and its compliance with Chapter 280. In the event of a qualified public depository failure, the remaining public depositories would be responsible for covering any resulting losses in excess of amounts insured and collateralized. Amounts held by the bank are insured or fully collateralized by Government Securities.
Interest Rate Risk - The District’s investment policy includes certain limitations on investment maturities; however, the District’s primary means of managing exposure to fair value losses arising from increasing interest rates is based upon the composition of its investment portfolio, which includes marketable securities, which are unconditionally guaranteed by the U.S. Government and have limited interest rate variability.
The effective yield earned on the District’s investments as of September 30, 2016 and 2015, was approximately 2.3% and 2.7%, respectively.

- 42 -
Investment income, net consisted of the following for the years ended September 30, 2016 and 2015:
2016 2015
Investment income (loss): Interest and dividends earned on investments 2,000,915$ 2,432,523$ Realized gain on marketable securities 4,394,512 3,865,443 Realized derivative gain - 4,249,960 Change in unrealized gain/(loss) on marketable securities 1,705,172 (4,592,870) Change in net unrealized derivative loss - (2,389,401)
Investment income, net 8,100,599$ 3,565,655$
During the year ended September 30, 2003, NBMS purchased $500,000 of Class E common stock of PPLRRG to create an alternative malpractice insurance vehicle in which the medical staff could obtain malpractice insurance at more affordable rates than commercially available in the local market. Seven local physicians are currently taking advantage of the program as of September 30, 2016. This investment is recorded at cost in deposits and other assets in the balance sheets. The Class E common stock of PPLRRG is nonvoting, and NBMS owns approximately 6% of the total outstanding common stock of PPLRRG. As a Class E shareholder of PPLRRG, NBMS has certain rights and obligations, as defined under the PPLRRG Articles of Incorporation.
4. CAPITAL ASSETS
A summary of changes in capital assets during 2016 and 2015 is as follows:
Beginning Additions/ Retirements/ EndingBalance Transfers Transfers Balance
Land 9,840,078$ 106,000$ -$ 9,946,078$ Improvements to land 2,114,810 959,987 - 3,074,797 Building and improvements 135,884,994 2,809,430 (348,874) 138,345,550 Equipment 85,967,120 2,062,478 (1,070,700) 86,958,898 Construction in progress 3,534,239 1,600,094 - 5,134,333
Total capital assets 237,341,241 7,537,989 (1,419,574) 243,459,656
Less accumulated depreciation (146,212,654) (12,499,776) 1,023,752 (157,688,678)
Capital assets - net 91,128,587$ (4,961,787)$ (395,822)$ 85,770,978$
Beginning Additions/ Retirements/ EndingBalance Transfers Transfers Balance
Land 9,840,078$ -$ -$ 9,840,078$ Improvements to land 2,114,810 - - 2,114,810 Building and improvements 134,193,611 1,691,383 - 135,884,994 Equipment 84,051,880 2,840,543 (925,303) 85,967,120 Construction in progress 2,759,226 775,013 - 3,534,239
Total capital assets 232,959,605 5,306,939 (925,303) 237,341,241
Less accumulated depreciation (134,201,900) (12,898,345) 887,591 (146,212,654)
Capital assets - net 98,757,705$ (7,591,406)$ (37,712)$ 91,128,587$
2015
2016

- 43 -
Depreciation expense for 2016 and 2015 was approximately $12,500,000 and $12,900,000, respectively, and has been included in operating and nonoperating expenses in the statements of revenues, expenses, and changes in net position based on the District’s policy for reporting related activities, as defined in Note 1. At September 30, 2016, the District had fully depreciated capital assets of approximately $4,900,000 that were still in use.
5. LONG-TERM DEBT AND CAPITAL LEASE OBLIGATION
On July 30, 2008, the Hospital completed its refunding of the Auction Rate Revenue Bonds, Series 2000 (the “Series 2000 Bonds”), and Auction Rate Revenue Bonds, Series 2005 (the “Series 2005 Bonds”), and issued $99,975,000 in the Revenue Refunding Bonds, Series 2008 (the “Series 2008 Bonds”) . The proceeds from the Series 2008 Bonds were used for the purpose of (i) financing all or a portion of the acquisition, construction, and equipping of an outpatient healthcare center, a cardiac catheterization lab, and certain routine capital projects; (ii) refunding the District’s outstanding Auction Rate Revenue Bonds, Series 2000, and outstanding Auction Rate Revenue Bonds, Series 2005; (iii) funding a reserve fund; and (iv) paying certain costs with respect to the issuance of the Series 2008 Bonds. The Series 2008 Bonds bear a fixed interest rate of 5.695%.
On September 24, 2014, the Hospital completed its refunding of a portion of Series 2008 Bonds and issued $70,000,000 in Refunding Bonds, Series 2014 (the “Series 2014 Bonds”), maturing October 1, 2043. The proceeds from the Series 2014 Bonds were used for the purpose of (i) refunding a portion ($62,575,000) of the Series 2008 term bonds maturing in 2028, 2038, and 2043 through defeasance and (ii) establishment of an escrow account with TD Bank, National Association, as escrow agent, sufficient to pay when due the interest and principal on the bonds, at a price equal to 100% of the principal amount thereof (the “Redemption Price”) together with accrued interest thereon to October 1, 2018 (the “Redemption Date”). The Series 2014 Bonds bear a fixed interest rate of 3.0% through October 1, 2029. The interest rate on the Series 2014 Bonds will be remarketed after October 1, 2029, based on then prevailing rates.
The District recognized a deferred outflow related to the defeasance of a portion of the Series 2008 Bonds of approximately $11,571,000. This represents the difference between the amounts funded into the escrow account and the carrying value of principal and associated bond discounts. Deferred outflows on defeasance of approximately $10,765,000 and $11,164,000 at September 30, 2016 and 2015, respectively, are presented net of accumulated amortization of approximately $806,000 and $407,000, respectively. The Series 2014 and Series 2008 Bonds are collateralized by and are payable solely from an obligation issued under the master trust indenture (the “Master Indenture”) between TD Bank, as Master Trustee (the “Master Trustee”), and the Hospital, as well as certain monies held under the trust indenture governing the Series 2008 Bonds (the “Bond Indenture”). The obligation issued under the Master Indenture is collateralized by a pledge of and a security interest in the Net Revenues of the District and any future member of the Obligated Group that is a Governmental Unit and the Net Revenue and Accounts of any future member of the Obligated Group that is a corporation or other business entity. Currently, the Hospital is the sole member of the Obligated Group.
Under the terms of the Bond Indenture, various amounts are being held on deposit with the Master Trustee, as trustee, for bond redemption, interest payments, a debt service reserve, and certain construction expenditures. Such amounts are not available for current operations of the Hospital. The Master Indenture requires the Obligated Group to maintain sinking fund deposits equal to the maximum annual debt service requirement of the Series 2008 Bonds. Amounts on deposit in the sinking fund as of September 30, 2016 and 2015, were approximately $3,011,000, respectively. In addition, the Master Indenture requires the Obligated Group to maintain certain financial ratios and places restrictions on various activities, such as the transfer of assets and incurrence of additional indebtedness. At September 30, 2016, the Hospital was in compliance with all such covenants.
For the year ended September 30, 2015, the District was not in compliance with the required debt service coverage ratio. Under the terms of the related Master Indenture dated as of July 1, 2008, an event of default would not be declared unless the District was not in compliance with the required debt service coverage ratio for two consecutive fiscal year-ends. The District has notified the trustee of the violation, as required by the

- 44 -
Master Indenture, and the District has hired a management consultant to provide recommendations for changing operating policies designed to maintain the required bond covenants. At September 30, 2016, the Hospital was in compliance with all such covenants, and thus, the violation is not considered to be an event of default per the terms of the related Master Indenture. Accordingly, the bonds have been classified according to their scheduled maturities.
As a means to manage interest rate exposure, the Hospital had entered into separate interest rate swap agreements on January 29, 2009 and on May 20, 2010 (collectively, the “Swap Agreements”), respectively, with RJ Capital Services, Inc. (the “Interest Rate Swap Counterparty”) in connection with the Series 2008 Bonds, each for one-half the outstanding principal balance.
On September 16, 2015, the Hospital terminated the Swap Agreements. The net proceeds after expenses were approximately $4,250,000 and were reflected in the nonoperating revenues (expenses) section of the statements of revenues, expenses, and changes in net position.
Under the terms of the Swap Agreements, the Hospital had paid the Interest Rate Swap Counterparty the weighted average of the weekly interest rates of the Securities Industry and Financial Markets Association (“SIFMA”) and received a payment computed at 68% of the three-month London InterBank Offered Rate (“LIBOR”), plus a mark-up of 108.5 and 51.75 basis points, respectively.
During the year ended September 30, 2015, the District recognized a reduction of interest expense of approximately $1,461,000 related to the Swap Agreements.
The District has entered into certain lease and loan agreements to finance the purchase of certain operating equipment and construction upgrades. The lease is payable in varying installments through 2023, with rates ranging from 3.8% to 6.0%. The leases have been recognized as capital leases. At September 30, 2016 and 2015, the District’s leased assets of approximately $2,502,000 are recorded net of accumulated depreciation of approximately $1,946,000 and $1,595,000, respectively.
Long-term debt and capital lease obligations as of September 30, 2016 and 2015, consist of the following:
2016 2015
Revenue Refunding Bonds, Series 2008, principal payable in variable annual installments beginning 2009 through 2043,interest payable October 1 and April 1 at the average couponrate of 5.695%. 29,555,000$ 30,835,000$
Refunding Bonds, Series 2014, principal payable monthly
beginning 2014 through 2043, interest payable monthly at the
fixed rate of 3.0%. 68,675,000 69,373,000
Capital lease obligation 984,906 1,315,215
Principal maturities 99,214,906 101,523,215
Unamortized bond discount (480,701) (500,496)
Total long-term debt 98,734,205 101,022,719
Less current installments (2,435,891) (2,318,053)
Long-term portion 96,298,314$ 98,704,666$

- 45 -
A summary of changes in long-term debt and capital lease obligations during 2016 and 2015 is as follows:
Amounts
Beginning Ending Due Within
Balance Additions Repayments Balance O ne Year
Series 2008
Fixed rate refunding bonds 30,835,000$ -$ 1,280,000$ 29,555,000$ 1,345,000$
Series 2014
Fixed rate refunding bonds 69,373,000$ -$ 698,000$ 68,675,000$ 728,000$
Capital lease obligations 1,315,215$ -$ 330,309$ 984,906$ 362,891$
Amounts
Beginning Ending Due Within
Balance Additions Repayments Balance O ne Year
Series 2008
Fixed rate refunding bonds 32,055,000$ -$ 1,220,000$ 30,835,000$ 1,280,000$
Series 2014
Fixed rate refunding bonds 70,000,000$ -$ 627,000$ 69,373,000$ 698,000$
Capital lease obligations 1,646,363$ -$ 331,148$ 1,315,215$ 340,053$
2016
2015
As of September 30, 2016, the District has the following outstanding bonds, which were funded by the placement of assets in an irrevocable trust to be used for satisfying debt service requirements; therefore, the debt and related assets are not reported in the financial statements.
Description of Obligation Fiscal Year
Defeased Original Issue Amount
Outstanding
Series 2008 Fixed Rate Bonds 2014 $ 62,575,000 $ 62,575,000
Annual scheduled principal maturities and interest on long-term debt and capital lease obligations as of September 30, 2016, are as follows:
Fiscal Year Ending September 30, Principal Interest
2017 2,435,891$ 3,708,751$ 2018 2,523,247 3,600,526 2019 3,313,940 3,473,387 2020 2,358,038 3,395,264 2021 2,441,630 3,303,671
2022-2026 13,400,160 15,125,752 2027-2031 15,837,000 12,486,281 2032-2036 18,941,000 9,252,493 2037-2041 22,736,000 5,290,903 2042-2044 15,228,000 803,129
99,214,906$ 60,440,157$
The annual scheduled interest requirements included above related to the Series 2014 Bonds are based on a fixed rate of 3.0% per annum, and the Series 2008 Bonds are based on a fixed average interest rate of 5.695% per annum.

- 46 -
The total future lease payments on the capital lease included in the schedule above is approximately $985,000; the interest portion is $84,000.
6. EMPLOYEE BENEFIT PLANS
Employees’ Retirement System
Plan Freeze – Effective September 30, 2016, the District’s defined benefit pension plan was frozen. All benefit accruals under that plan ceased; therefore, average monthly earnings shall not be considered after September 30, 2016. Continuous service will continue to be credited to participants after September 30, 2016 for vesting purposes, for purposes of determining normal and early retirement date and for purposes of eligibility for disability benefits. Effective October 1, 2016, the hospital will contribute to a 403b defined contribution plan with an employer discretionary match and discretionary non-contributory employer contribution.
Plan Description - The Hospital contributes to a noncontributory, single-employer, defined-benefit pension retirement plan, Parrish Medical Center, Inc. Pension Plan (“the Plan”), administered by The Pension Administrative Committee. The Plan was established under the authority of the District’s Board of Directors. Additionally, all amendments and changes to the Hospital’s obligation to contribute to the Plan are covered by this authority. The average rating for investments held in the Plan’s portfolio is an average of AA. Separate financial statements are not available for the Plan.
Benefits Provided - The Plan covers all permanent full-time Hospital employees and all permanent part-time employees who customarily work at least 20 hours per week and five months per year and who complete at least 1,000 hours of service per year, after completion of one year of continuous service. The plan was frozen effective September 30, 2016. Normal retirement age is determined as earlier of:
1. Age 65, regardless of continuous service; 2. Age 60 and 25 years of continuous service; or 3. 30 years of continuous service, regardless of age.
Normal retirement benefits are determined as 1.75% of average monthly earnings up to $1,000, plus 1.50% of average monthly earnings in excess of $1,000, times continuous service.
Early retirement age is determined as age 55 and 20 years of continuous service. Early retirement accrued benefits are reduced 6.67% for each of the first five years and 3.33% for each of the next five years by which the benefit Commencement Date precedes age 65.
The vesting schedule is as follows:
Years of Service Vested Percentage
Less than 5 None 5 50% 6 60% 7 70% 8 80% 9 90%
10 or more 100%
Members will receive the vested portion of his/her accrued benefit payable at otherwise early age (reduced) or age 65.
Disability benefits are based on the normal retirement benefit accrued to the date of disability. Employees are eligible after 10 years of continuous service. Death benefits are based on the accrued benefit as of the date of death and payable as a lump sum. Employees are eligible after 5 years of continuous service.

- 47 -
Plan Membership - The Plan membership was as follows as of October 1, 2014 (date of actuarial valuation):
Inactive Plan members or beneficiaries currently receiving benefits 64 Inactive Plan members entitled but not yet receiving benefits 148 Active Plan members 800 1,012
Funding Policy - The Hospital contributes the amount necessary to meet the minimum required employer contribution, as calculated by the actuary. Employee contributions are not permitted.
Assumptions and Other Inputs - Total Pension Liability was determined by an actuarial valuation as of October 1, 2014, updated to September 30, 2015, using the following actuarial assumptions:
Inflation 2.80% Salary Increases 3.80% - 4.90% Discount Rate 8.00% Investment Rate of Return 8.00%
Mortality Rate: RP2000, Combined Healthy, with projection to the valuation date using Scale AA. This assumption is utilized for benefits paid in the form of annuities only. The actuarial assumptions used in the October 1, 2014, valuation were based on the results of an actuarial experience study for the period 2007-2013. The Long-Term Expected Rate of Return on the Plan’s investments was determined using a building-block method in which best-estimate ranges of expected future real rates of return (expected returns, net of the Plan’s investment expenses and inflation) are developed for each major asset class. These ranges are combined to produce the Long-Term Expected Rate of Return by weighting the expected future real rates of return by the target asset allocation percentage and by adding expected inflation. Best estimates of arithmetic real rates of return for each major asset class included in the Plan's target asset allocation as of September 30, 2015, are summarized in the following table:
Asset Class Target Allocation
Long Term ExpectedReal Rate of Return
Large Cap Equity 35% 10%
Mid and Small Cap 20% 10%
International Equity 5% 10%
Alternatives 10% 10%
Fixed Income 30% 4%
100%
Discount Rate - The Discount Rate used to measure the Total Pension Liability was 8.00 percent. The projection of cash flows used to determine the Discount Rate assumed that Plan member contributions will be made at the current contribution rate and that District contributions will be made at rates equal to the difference between actuarially determined contribution rates and the member rate. Based on those assumptions, the Plan's Fiduciary Net Position was projected to be available to make all projected future benefit payments of current Plan members. Therefore, the Long-Term Expected Rate of Return on Plan investments was applied to all periods of projected benefit payments to determine the Total Pension Liability.
Pension Liabilities, Pension Expense, and Deferred Outflows of Resources and Deferred Inflows of Resources Related to Pensions - The District’s Net Pension Asset was measured as of September 30, 2015. The Total Pension Liability used to calculate the Net Pension Asset was determined as of that date.

- 48 -
Total PensionLiability
(a)
Plan FiduciaryNet Position
(b)
Net Pension(Asset) Liability(a)-(b)
Pension Expense
Balances at September 30, 2015 52,647,353$ 59,173,550$ (6,526,197)$ Changes for a Year:
Service Cost 1,836,604 - 1,836,604 1,836,604 Interest 4,207,238 - 4,207,238 4,207,238 Differences Between Expected and Actual Experience 1,059,852 - 1,059,852 - Changes of Assumptions - - - 92,014 Administrative Expense - - - - Contributions - Employer - 1,691,990 (1,691,990) - Contributions - Employee - - - - Contributions - Buy Back - - - - Current Year Amortization of Experience Difference - - - 132,481 Current Year Amortization - - - 1,205,239 Net Investment Income - (1,539,953) 1,539,953 (4,650,086) Benefit Payments, Including Refunds
of Employee Contributions (3,786,952) (3,786,952) - - Administrative Expense - - - - Other Changes - - - -
Net Changes 3,316,742 (3,634,915) 6,951,657 2,823,490 Balances at September 30, 2016 55,964,095$ 55,538,635$ 425,460$ 2,823,490$
Increase (Decrease)
Total PensionLiability
(a)
Plan FiduciaryNet Position
(b)
Net PensionAsset(a)-(b)
Pension Expense
Balances at September 30, 2014 50,047,844$ 55,608,683$ (5,560,839)$ -$ Changes for a Year:
Service Cost 1,998,932 - 1,998,932 1,998,932 Interest 3,998,329 - 3,998,329 3,998,329 Differences Between Expected and Actual Experience - - - - Changes of Assumptions 736,112 - 736,112 92,014 Changes of Benefit Terms - - - - Contributions - Employer - 3,126,488 (3,126,488) - Contributions - Employee - - - - Contributions - Buy Back 1,474 1,474 - - Net Investment Income - 4,572,243 (4,572,243) (4,408,400) Benefit Payments, Including Refunds
of Employee Contributions (4,135,338) (4,135,338) - - Administrative Expense - - - - Other Changes - - - (32,768)
Net Changes 2,599,509 3,564,867 (965,358) 1,648,107 Balances at September 30, 2015 52,647,353$ 59,173,550$ (6,526,197)$ 1,648,107$
Increase (Decrease)

- 49 -
On September 30, 2016 and 2015, the District reported Deferred Outflows of Resources and Deferred Inflows of Resources related to pensions from the following sources:
DeferredOutflows of Resources
DeferredInflows of Resources
Balances at September 30, 2015 2,336,088$ 131,075$
Differences Between Expected and Actual Experience 1,059,852 -
Changes of Assumptions (224,495) -
Net Difference Between Projected and Actual Earnings
on Pension Plan Investments 6,190,039 -
Current Year Amortization (1,238,007) (32,768)
Contributions - Employer (1,691,990) -
Employer Contributions Subsequent to the Measurement Date 1,440,995 -
Balances at September 30, 2016 7,872,482$ 98,307$
September 30, 2016
DeferredOutflows of Resources
DeferredInflows of Resources
Differences Between Expected and Actual Experience -$ -$
Changes of Assumptions 644,098 -
Net Difference Between Projected and Actual Earnings
on Pension Plan Investments - 131,075
Employer Contributions Subsequent to the Measurement Date 1,691,990 -
Balances at September 30, 2015 2,336,088$ 131,075$
September 30, 2015
At September 30, 2016, $1,440,995 of Deferred Outflows of Resources related to pensions resulting from the employer contributions subsequent to the measurement date will be recognized as a reduction of the net pension asset in the year ending September 30, 2017. Other amounts reported as Deferred Outflows of Resources and Deferred Inflows of Resources related to pensions will be recognized in Pension Expense as follows:
Year Ended September 30:
2017 $1,429,734 2018 $1,429,734 2019 $1,429,734 2020 $1,462,504 2021 $ 224,496 Thereafter $ 356,978

- 50 -
Sensitivity of the Net Pension Asset to Changes in the Discount Rate - The following presents the District’s proportionate share of the net pension liability (asset) calculated using the discount rate of 8.00%, as well as what the District’s proportionate share of the net pension liability (asset) would be if it were calculated using a discount rate that is 1 percentage point lower (7.00%) or 1 percentage point higher (9.00%) than the current rate:
1% Decrease Rate 1% Increase
7.00% 8.00% 9.00%
At September 30, 2016
Sponsor's Net Pension Liability (Asset) 8,321,439$ 425,460$ (6,214,046)$
At September 30, 2015
Sponsor's Net Pension Liability (Asset) 983,867$ (6,526,197)$ (12,826,469)$
Current Discount
Pension Plan Fiduciary Net Position - Detailed information about the pension Plan’s fiduciary net position is available in the separately issued Plan financial report.
Employee Health Plan
The Hospital has established a self-insured program for health benefits covering substantially all employees. During both 2016 and 2015, the plan covers healthcare services up to $185,000 per claim and provides unlimited commercial insurance coverage for cases exceeding these amounts for each covered employee or dependent. Health insurance expense, which includes medical expense provided by outside providers, dental and life benefits, and administrative costs (net of employee contributions), was approximately $10,202,000 and $10,100,000 in 2016 and 2015, respectively. Medical services provided to covered employees at the Hospital are recorded as a contractual adjustment when service is provided. Contractual adjustments under this plan amounted to approximately $8,536,000 and $8,325,000 in 2016 and 2015, respectively. At September 30, 2016 and 2015, the liability for reported and estimated unreported employee health plan claims incurred was approximately $454,000 and $172,000, respectively, and is included as a component of accrued health insurance and workers’ compensation in the accompanying balance sheets.
Workers’ Compensation Plan
The Hospital has established a self-insured program for workers’ compensation benefits covering all employees. The plan covers employees up to $650,000 per claim for 2016 and 2015, respectively, and is limited to approximately $3.0 million per year in the aggregate for 2016 and 2015, respectively, and provides for commercial insurance relating to cases exceeding these amounts. Workers’ compensation insurance expense, which includes payments for administrative fees, wages, and outside medical services, amounted to approxi-mately $389,000 and $494,000 in 2016 and 2015, respectively. Medical services provided by the Hospital under this plan are recorded as contractual adjustments when the service is provided. These services amounted to approximately $141,000 and $245,000 in 2016 and 2015, respectively. At September 30, 2016 and 2015, the liability for reported and estimated unreported workers’ compensation claims incurred was approximately $1,390,000 and $1,360,000, respectively, and is included as a component of accrued health insurance and workers’ compensation liabilities in the balance sheets. The total accrual includes estimates of the ultimate costs of both reported claims and claims incurred but not reported, as determined by an actuary in 2015 and discounted at 4%, and are actuarially determined every other year.

- 51 -
Other Postemployment Obligations
The District provides postemployment healthcare benefits to all employees who retire from the District under the plan after 20 or more years of service and age 55, or after 30 years of service. Premiums paid by retirees are based on the projected average plan cost of the District’s self-insured health benefit program for the year. The plan is funded on a pay-as-you-go basis. The District may make additional contributions as desired. No additional contributions have been made to date.
The District’s annual OPEB cost is calculated based on the Annual Required Contribution of the employer (“ARC”), an amount actuarially determined. The ARC represents a level of funding that, if paid on an ongoing basis, is projected to cover normal costs each year and amortize any unfunded actuarial liabilities (or funding excess) over a closed period not to exceed 30 years. The following table shows the components of the District’s annual cost for the year, the amount actually contributed to the plan, and changes in the District’s net OPEB obligation to the plan:
2016 2015
Annual required contribution 89,013$ 89,552$ Interest on net OPEB obligation 29,810 28,139 Adjustment to annual required contribution (44,468) (41,292)
Annual OPEB cost 74,355 76,399 Contributions made (32,691) (34,627)
Increase in net pension obligation 41,664 41,772 Net OPEB obligation - beginning of year 745,243 703,471
Net OPEB obligation - end of year 786,907$ 745,243$
The net OPEB obligation is included with employee compensation and benefits payable in the balance sheets. The District’s annual OPEB cost, the percentage of annual OPEB cost contributed to the plan, and the net OPEB obligation for 2016 were as follows:
Fiscal Year Annual OPEB Percentage of Net OPEBEnding Cost (AOC) AOC Contributed Obligation
September 30, 2016 $ 74,355 44.0% $ 786,907September 30, 2015 $ 76,399 45.3% $ 745,243September 30, 2014 $ 126,719 54.4% $ 703,471
Three-Year Trend Information
Actuarial valuations of an ongoing plan involve estimates of the value of reported amounts and assumptions about the probability of occurrence of events far into the future. Examples include assumptions about future employment, mortality, and the healthcare cost trend. Amounts determined regarding the funded status of the plan and the annual required contributions of the employer are subject to continual revision, as actual results are compared with past expectations and new estimates are made about the future. The schedule of funding progress presents trend information about whether the actuarial value of plan assets is increasing or decreasing over time relative to the actuarial accrued liabilities for benefits.
Projections of benefits for financial reporting purposes are based on the substantive plan (the plan understood by the employer and the plan members) and include the types of benefits provided at the time of each valuation and the historical pattern of sharing of benefit costs between the employer and the plan members to that point. The actuarial methods and assumptions used include techniques that are designed to reduce the effects of short-term volatility in actuarial accrued liabilities and the actuarial value of the assets, consistent with the long-term perspective of the calculations.

- 52 -
In the October 1, 2015 actuarial valuation (the most recent calculation available), the Entry Age Normal Actuarial Cost Method was used. The actuarial assumptions included a 4.0% discount rate and an annual healthcare cost trend rate of 7.25%, which is expected to decrease 0.75% each year until the ultimate rate of 4.5% in fiscal 2020. The funded ratio was 0.0% as the plan is unfunded and, thus, the unfunded actuarial accrued liability of approximately $787,000 is equal to the actuarial accrued liability. Covered payroll under the plan was approximately $40,343,000, resulting in a ratio of 1.8% as compared to the unfunded actuarial liability.
The following is a summary of the activity in the accrued health insurance, workers’ compensation, and OPEB accounts for the years ended September 30, 2016 and 2015:
Beginning EndingBalance Additions Reductions Balance
2016 2,277,235$ 7,480,156$ 7,126,056$ 2,631,335$ 2015 2,760,188$ 7,315,671$ 7,798,624$ 2,277,235$
7. DONOR-RESTRICTED NET POSITION
Donor-restricted net position is available for the following programs at September 30, 2016 and 2015:
2016 2015
Cancer Programs 89,798$ 106,897$ Women's Services - Lactate/Birthing 49,021 1,021 Diabetes 47,124 48,633 Education/Training 33,789 33,789 Chain of Lakes - Health Village 30,884 48,894 Stereotactic Breast Biopsy 17,931 17,931 Emergency Preparedness 6,502 2,755 ASPR 5,815 24,439 Circle of Giving 4,092 22,390 Foundation 300 65,296 PMC Clinic - 76,356 Auxiliary - 55,399 All Other 15,732 16,036
300,988$ 519,836$
8. CHARITY AND OTHER UNREIMBURSED CARE
The District’s mission is to provide high-quality, affordable healthcare to the community. In pursuing its commitment to serve all members of the community, the District provides services to the financially disadvantaged, despite the lack or adequacy of payment for those services. The District maintains records to identify and monitor the level of charity care it provides. These records include the amount of charges forgone for services and supplies furnished under its charity care policy. The District also provides a charity care revenue deduction for those with billed charges equal to or greater than 125% of their annual salary. Charges forgone, based upon established rates, due to the provision of charity care to patients, amounted to approximately $11,859,000 and $10,530,000 in 2016 and 2015, respectively. Associated costs to provide charity care to patients amounted to approximately $2,913,000 and $2,601,000 in 2016 and 2015, respectively. Charity care is also provided through reduced price services and fee programs offered throughout the year based upon activities and services, which the District believes will serve a community health need. These activities include the Brevard Health Alliance, wellness programs, community education programs, and health fairs.

- 53 -
9. RELATED-PARTY TRANSACTIONS AND RELATIONSHIPS
North Brevard Medical Support, Inc. - Other than earnings on investments, NBMS has no other material sources of revenue with which to continue its operations or meet its obligations as they become due. However, NBMS receives funding from the Hospital in the form of grants. NBMS can obtain grants from the Hospital in any fiscal year equal to the lesser of the net patient service revenue of the Hospital for its preceding fiscal year, or 2.5% of the Hospital’s gross revenue for its preceding fiscal year. The Hospital funded a grant of approximately $2,799,000 in 2016 for NBMS to meet its fiscal year 2016 obligations and a grant of $1,310,000 in 2015 for NBMS to meet its fiscal year 2015 obligations, which is recorded in other net nonoperating expenses in the statements of revenues, expenses, and changes in net position. The grant is eliminated in consolidation. The operating activities of NBMS are included in other net nonoperating expenses in the statements of revenues, expenses, and changes in net position for the years ended September 30, 2016 and 2015.
Florida Health Network, Inc. - In March 2007, Florida Health Network, Inc. (the “Network”) was formed. The primary purpose of the Network is to create a community network with clinical integration, which combines the resources, strengths, knowledge, and expertise of our local healthcare providers in order to offer the community exceptional, comprehensive care. The Network is a wholly-owned subsidiary of NBMS.
The operating activities of the Network are included in other net nonoperating expenses in the statements of revenues, expenses, and changes in net position for the years ended September 30, 2016 and 2015.
Jess Parrish Medical Foundation, Inc. - The Jess Parrish Medical Foundation, Inc. (the “Foundation”) is a separate Florida 501(c)(3) corporation, which raises money to support the District’s programs and for the general advancement of healthcare organizations and objectives. The District has determined that the Founda-tion’s financial statements are immaterial for inclusion in the District’s financial statements. As such, the District has elected to exclude the Foundation’s activities from the District’s financial statements.
Home Health Program. - In September 2016, the District sold its home health program (the “Program”) to a third party and recognized a gain of approximately $1.6 million. The operations of the Program prior to the sale are included in net patient service revenue and the gain on sale of the Program is in other operating revenue in the statements of revenues, expenses, and changes in net position for the years ended September 30, 2016 and 2015.
Effective September 2016, NBMS has a 25% joint venture interest in the Program. The operating activities of the Program after this date are included in other net nonoperating expenses in the statements of revenues, expenses, and changes in net position for the year ended September 30, 2016.
10. CONCENTRATIONS OF CREDIT RISK
Financial instruments that potentially subject the District to credit risk consist principally of patient accounts receivable. Patient accounts receivable consist of amounts due from Medicare, Medicaid, insurance companies, and self-pay patients.
The District grants credit without collateral to its patients, most of who are local residents and are insured under third-party payor agreements. The mix of receivables from patients and third-party payors at September 30, 2016 and 2015, is as follows:

- 54 -
2016 2015
Medicare 36.5 % 35.8 % Medicaid 8.2 % 10.1 % Commercial and other 48.2 % 46.1 % Self-pay 7.1 % 8.0 %
100.0 % 100.0 %
All balances, net of related contractual discounts and collectability allowances, are expected to be collected within the subsequent fiscal year.
11. COMMITMENTS AND CONTINGENCIES
Operating Leases - The District leases certain office space and equipment under noncancellable operating leases, expiring in various years through 2019. Payments under these obligations, which are not subject to cancellation, are based on fixed monthly amounts. The following is a summary, by year, of the approximate future minimum lease payments for the operating leases:
2017 1,148,000$ 2018 547,000 2019 237,000
1,932,000$
Total rental expense was approximately $2,222,000 and $2,824,000 in 2016 and 2015, respectively.
Accrued Medical Malpractice - Prior to July 1987, the Hospital maintained malpractice coverage through the Florida Hospital Trust Fund and the Florida Hospital Excess Trust Fund B for the purpose of paying malpractice claims against the Hospital. On July 21, 1987, the Hospital elected to rely on sovereign immunity with respect to liability claims against the Hospital, subject to the limited waiver provisions of Section 768.28, Florida Statutes ($200,000 per claim, $300,000 per incident) for both 2016 and 2015. The Hospital terminated its participation in the Florida Hospital Trust Fund and Florida Hospital Excess Trust Fund B, purchased insurance coverage for non-reported acts prior to July 22, 1987, and engaged an actuary for the purpose of projecting future malpractice liability on a self-insured basis. Based upon the actuary’s analysis and the possibility of a special act of the Florida Legislature, as provided in Section 768.29(5), Florida Statutes, the Hospital has recorded a total accrued liability for reported and unreported claims of approximately $1,200,000 and $1,231,000 (net of claims paid) for the period July 22, 1987, through September 30, 2016 and 2015, respectively. The total accrual includes estimates of the ultimate costs of both reported claims and claims incurred but not reported and are discounted at 4%.
The following is a summary of the activity in the accrued medical malpractice liability accounts for the years ended September 30, 2016 and 2015:
Beginning EndingBalance Additions Reductions Balance
2016 1,231,377$ 116,000$ 147,071$ 1,200,306$ 2015 1,133,689$ 301,692$ 204,004$ 1,231,377$

- 55 -
At September 30, 2016 and 2015, the estimated current portion of the total accrued liability was approximately $588,000 and $688,000, respectively. The statements of revenues, expenses, and changes in net position reflects an approximate $31,000 decrease and $54,000 increase in other operating expenses for 2016 and 2015, respectively, representing a change in estimate of the liability for medical malpractice claims incurred in the prior years.
Excess Insurance - Effective June 13, 2014, the Hospital purchased a claims-made umbrella policy with a $5 million limit covering the Hospital and employed physicians. The umbrella policy is excess over the sovereign immunity limits of $200,000/$300,000. If sovereign immunity does not apply, the policy is excess over a professional liability limit of $1.0 million/$3.0 million, which is the self-insured retention. Effective May 30, 2014, the Hospital purchased a claims-made professional liability excess policy for contract physicians working in the Florida Health Network. These physicians carry their own underlying insurance policy for the first $250,000 per claim and $750,000 per physician. The excess policy covers an additional $750,000 per claim and $2.25 million per physician, bringing the total coverage to $1 million/$3 million limits. Both policies were purchased as a result of membership in the Mayo Clinic Care Network.
Accrued Employee Personal Leave Bank - The Hospital provides a benefit program entitled “Personal Leave Bank.” This program allows all eligible employees to earn personal leave in lieu of traditional sick days, vacation days, or holidays. Accrual of personal leave time is based upon length of service with the Hospital. The personal leave bank is charged for hours taken off from work. All employees may request payment for all or part of earned personal leave at two specified times during the fiscal year. Payment is made at the employee’s current pay rate. The accrued liability under this program amounted to approximately $3,142,000 and $3,688,000 at September 30, 2016 and 2015, respectively.
Litigation - The District is involved in litigation arising in the course of business. After consultation with legal counsel, management estimates that these matters will be resolved without a material, adverse effect on the future financial position, results of operations, or cash flows of the District.
* * * * * *

REQUIRED SUPPLEMENTARY INFORMATION FOR THE YEAR ENDED SEPTEMBER 30, 2016

- 56 -
NORTH BREVARD COUNTY HOSPITAL DISTRICT
SUPPLEMENTARY INFORMATION - UNAUDITED SCHEDULE OF CHANGES IN NET PENSION ASSET AND RELATED RATIOS
FOR THE YEARS ENDED SEPTEMBER 30,
2016 2015 2014
Total Pension Liability
Service Cost 1,836,604$ 1,998,932$ 1,850,863$ Interest 4,207,238 3,998,329 3,796,320
Differences Between Expected and Actual Experience 1,059,852 - - Changes of Assumptions - 736,112 -
Changes of Benefit Terms - - - Contributions - Buy Back - 1,474 -
Benefit Payments, Including Refunds of Employee Contributions (3,786,952) (4,135,338) (2,404,947)
Net Change in Total Pension Liability 3,316,742 2,599,509 3,242,236
Total Pension Liability - Beginning 52,647,353 50,047,844 46,805,608 Total Pension Liability - Ending (a) 55,964,095$ 52,647,353$ 50,047,844$
Plan Fiduciary Net PositionContributions - Employer 1,691,990$ 3,126,488$ 3,166,212$
Contributions - Employee - - - Contributions - Buy Back - 1,474 -
Net Investment Income (1,539,953) 4,572,243 6,113,059 Benefit Payments, Including Refunds
of Employee Contributions (3,786,952) (4,135,338) (2,404,947) Administrative Expense - - (497)
Other Changes - - - Net Change in Plan Fiduciary Net Position (3,634,915) 3,564,867 6,873,827
Plan Fiduciary Net Position - Beginning 59,173,550 55,608,683 48,734,856
Plan Fiduciary Net Position - Ending (b) 55,538,635$ 59,173,550$ 55,608,683$
Net Pension Liability (Asset) - Ending (a) - (b) 425,460$ (6,526,197)$ (5,560,839)$
Plan Fiduciary Net Position as a Percentage of 99.24% 112.40% 111.11%
the Total Pension Liability
Covered Employee Payroll 38,851,076$ 32,463,253$ 36,159,641$
Net Pension Asset as a Percentage of
Covered Employee Payroll 1.10% -20.10% -15.38%
Notes: The District implemented GASB Statement No. 68 for the fiscal year ended September 30, 2015, including a restatement as of September 30, 2014. Information for prior years is not available.
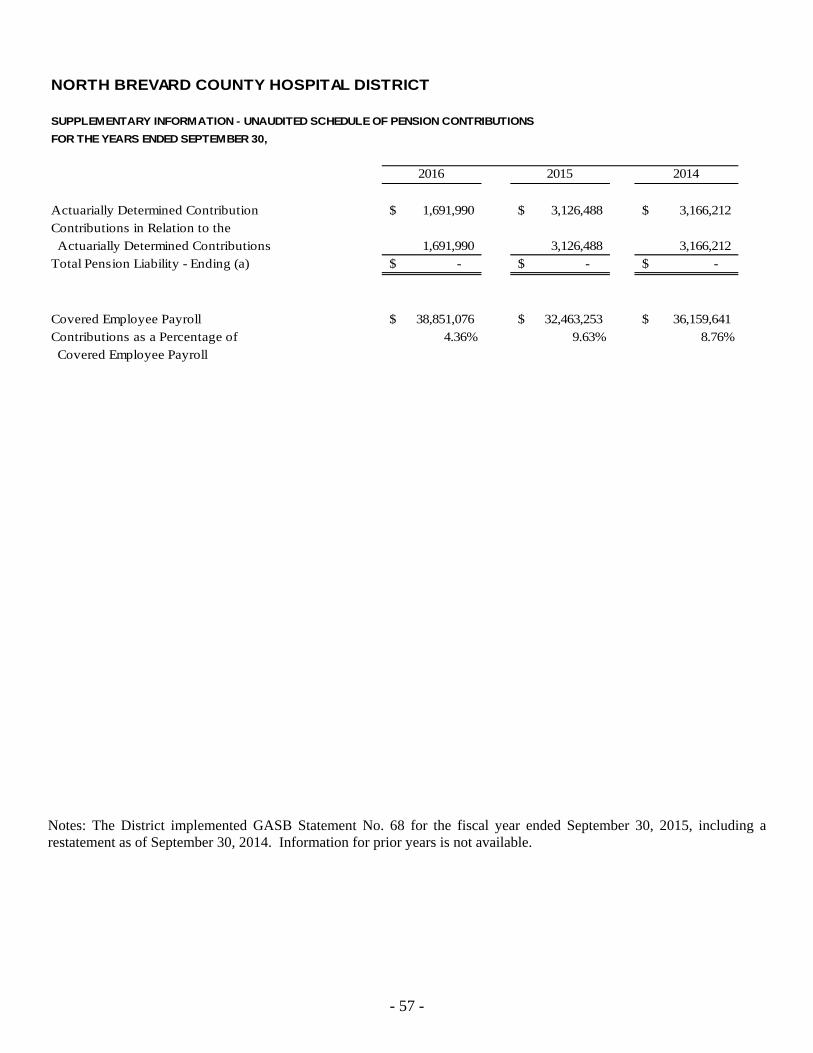
- 57 -
NORTH BREVARD COUNTY HOSPITAL DISTRICT
SUPPLEMENTARY INFORMATION - UNAUDITED SCHEDULE OF PENSION CONTRIBUTIONS
FOR THE YEARS ENDED SEPTEMBER 30,
2016 2015 2014
Actuarially Determined Contribution 1,691,990$ 3,126,488$ 3,166,212$ Contributions in Relation to the Actuarially Determined Contributions 1,691,990 3,126,488 3,166,212 Total Pension Liability - Ending (a) -$ -$ -$
Covered Employee Payroll 38,851,076$ 32,463,253$ 36,159,641$ Contributions as a Percentage of 4.36% 9.63% 8.76% Covered Employee Payroll
Notes: The District implemented GASB Statement No. 68 for the fiscal year ended September 30, 2015, including a restatement as of September 30, 2014. Information for prior years is not available.

- 58 -
NORTH BREVARD COUNTY HOSPITAL DISTRICT
SUPPLEMENTARY INFORMATION - UNAUDITED SCHEDULE OF FUNDING PROGRESS - OPEB
YEAR ENDED SEPTEMBER 30, 2016
ActuarialAccrued
Acturial Liability (AAL) Unfunded UAAL as aActuarial Value of - Entry Age AAL Funded Covered Percentage ofValuation Assets Interest (UAAL) Ratio Payroll Covered Payroll
Date (a) (b) (b-a) (a/b) (c) ((b-a)/c)
October 1, 2006 -$ 3,511,441$ 3,511,441$ 0.0% 31,378,457$ 11.2%October 1, 2010 -$ 1,480,384$ 1,480,384$ 0.0% 46,585,080$ 3.2%October 1, 2012 -$ 1,259,205$ 1,259,205$ 0.0% 40,478,347$ 3.1%October 1, 2014 -$ 744,662$ 744,662$ 0.0% 40,343,088$ 1.8%

- 59 -
NORTH BREVARD COUNTY HOSPITAL DISTRICT NOTES TO REQUIRED SUPPLEMENTARY INFORMATION (UNAUDITED) YEARS ENDED SEPTEMBER 30, 2016 AND 2015
Pension Assumptions
Valuation Date: 10/01/2015
Actuarially determined contribution rates are calculated as of October 1, two years prior to the end of the fiscal year in which contributions are reported.
Methods and assumptions used to determine contribution rates:
Cost Method Aggregate Cost Method.
Actuarial Value of Assets Valuation assets are calculated using a smoothed market value over a period of five (5) years, as prescribed under Internal Revenue Procedure 2000-40. The asset value determined under this method will be adjusted to be no greater than 120% and no less than 80% of the fair market value.
Price Inflation: 2.8% per year compounded annually.
Payroll Growth Assumption: None necessary for amortization purposes under the Aggregate Actuarial Cost Method.
Salary Increases: See table on following page.
Investment Earnings: 8.00% per year compounded annually gross of investment expenses.
Lump Sum Assumptions: The minimum guaranteed lump sum is based on the Plan-specific 1971 Group Annuity Mortality Table for Males and an assumed PBGC discount rate as of each October 1 of the valuation year (currently 0.75% per annum) compounded annually. The base lump sum is based on the long term discount rate of 8.0% per annum compounded annually and the mortality table prescribed by the Secretary of the Treasury (the “Secretary”) in accordance with Section 417(e)(3)(A)(ii)(I) of the Internal Revenue Code applicable for the year in which the valuation is performed. All benefits to participants are assumed to be paid as lump sums, except for those who already terminated or retired as of the valuation date and who did not yet receive lump sum payouts.
Supplemental Income: Since all benefits for active employees are assumed to be paid in the form of a lump sum, no supplemental income payments of $100 per month are assumed to be made.
Retirement Ages: See table on following page.
Turnover Rates: See table on following page.
Disability Rates: See table on following page.
Mortality Rates: See table on following page.

- 60 -
Pension Assumptions (Continued)
Rate Tables:
Age
Annual Employment
Annual Disability
Annual Mortality Rates
20 23.6% 0.07% 0.02% 25 16.6% 0.09% 0.02% 30 12.9% 0.11% 0.03% 35 10.1% 0.14% 0.05% 40 8.4% 0.19% 0.07% 45 7.5% 0.30% 0.11% 50 7.1% 0.51% 0.16% 55 7.4% 0.96% 0.27% 60 9.2% 1.66% 0.52% 65 11.0% - 0.99%
Years Since Eligible for
Retirement Rates Eligibility*
Years of Service
Annual Salary Increase
1 50.0% 0 10.50% 2 5.0% 5 6.80% 3 25.0% 10 5.60% 4 10.0% 15 5.20% 5 10.0% 20 4.50% 10 10.0% 25 4.50% 15 10.0% 30 4.50%
*Overridden by age-based rates of 25.00% at ages 62 and 65 except at first eligibility.

OTHER SUPPLEMENTARY INFORMATION FOR THE YEARS ENDED SEPTEMBER 30, 2016 AND 2015
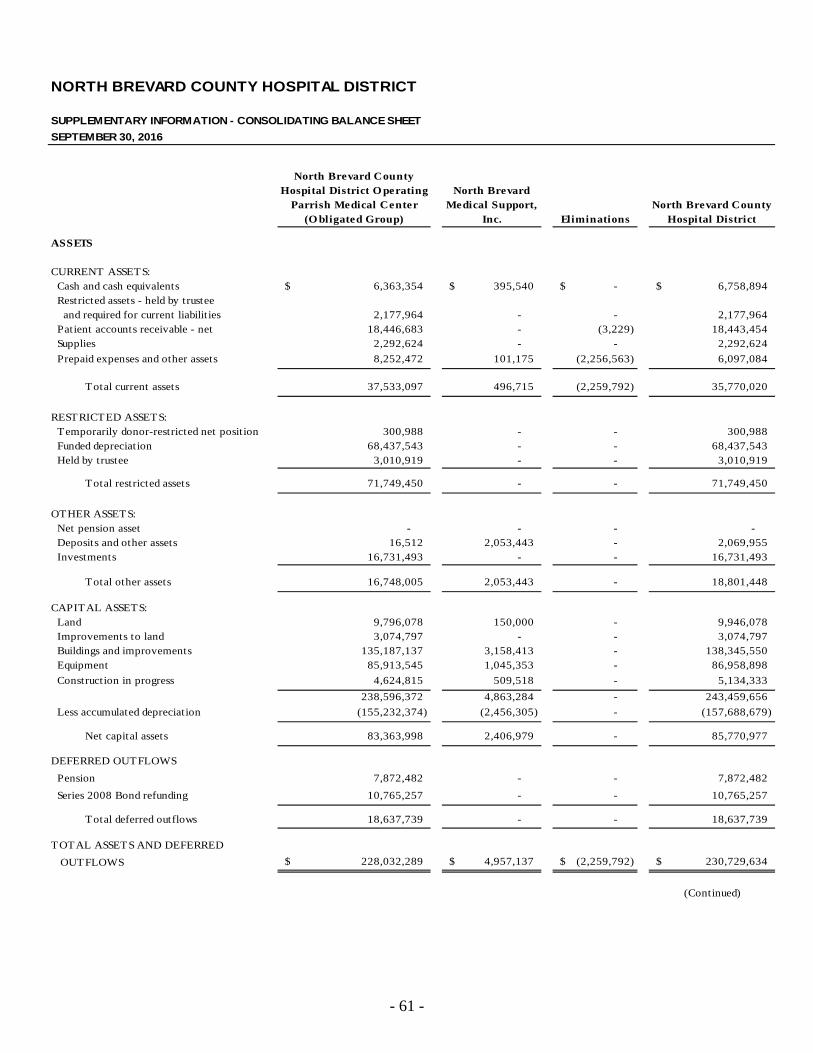
- 61 -
NORTH BREVARD COUNTY HOSPITAL DISTRICT
SUPPLEMENTARY INFORMATION - CONSOLIDATING BALANCE SHEET
SEPTEMBER 30, 2016
North Brevard CountyHospital District O perating North Brevard
Parrish Medical Center Medical Support, North Brevard County(O bligated Group) Inc. Eliminations Hospital District
ASSETS
CURRENT ASSETS: Cash and cash equivalents 6,363,354$ 395,540$ -$ 6,758,894$ Restricted assets - held by trustee and required for current liabilit ies 2,177,964 - - 2,177,964 Patient accounts receivable - net 18,446,683 - (3,229) 18,443,454 Supplies 2,292,624 - - 2,292,624
Prepaid expenses and other assets 8,252,472 101,175 (2,256,563) 6,097,084
Total current assets 37,533,097 496,715 (2,259,792) 35,770,020
RESTRICTED ASSETS: Temporarily donor-restricted net position 300,988 - - 300,988 Funded depreciation 68,437,543 - - 68,437,543 Held by trustee 3,010,919 - - 3,010,919
Total restricted assets 71,749,450 - - 71,749,450
OTHER ASSETS: Net pension asset - - - - Deposits and other assets 16,512 2,053,443 - 2,069,955 Investments 16,731,493 - - 16,731,493
Total other assets 16,748,005 2,053,443 - 18,801,448
CAPITAL ASSETS: Land 9,796,078 150,000 - 9,946,078 Improvements to land 3,074,797 - - 3,074,797 Buildings and improvements 135,187,137 3,158,413 - 138,345,550 Equipment 85,913,545 1,045,353 - 86,958,898
Construction in progress 4,624,815 509,518 - 5,134,333
238,596,372 4,863,284 - 243,459,656
Less accumulated depreciation (155,232,374) (2,456,305) - (157,688,679)
Net capital assets 83,363,998 2,406,979 - 85,770,977
DEFERRED OUTFLOWS
Pension 7,872,482 - - 7,872,482
Series 2008 Bond refunding 10,765,257 - - 10,765,257
Total deferred outflows 18,637,739 - - 18,637,739
TOTAL ASSETS AND DEFERRED
OUTFLOWS 228,032,289$ 4,957,137$ (2,259,792)$ 230,729,634$
(Continued)

- 62 -
NORTH BREVARD COUNTY HOSPITAL DISTRICT
SUPPLEMENTARY INFORMATION - CONSOLIDATING BALANCE SHEET
SEPTEMBER 30, 2016
North Brevard CountyHospital District Operating North Brevard
Parrish Medical Center Medical Support, North Brevard County(Obligated Group) Inc. Eliminations Hospital District
LIABILITIES AND NET POSITION
CURRENT LIABILITIES:
Accounts payable 13,993,830$ 2,346,608$ (2,259,792)$ 14,080,646$
Accrued health insurance and
workers’ compensation 1,844,428 - - 1,844,428
Accrued employee personal leave bank 3,141,679 - - 3,141,679
Accrued salaries 1,427,374 - - 1,427,374
Accrued medical malpractice 588,143 - - 588,143
Other current liabilities 2,675,290 - - 2,675,290
Estimated third party settlements 314,565 - - 314,565
Current portion of long-term debt & capital lease obligations 2,402,803 33,088 - 2,435,891
Total current liabilities 26,388,112 2,379,696 (2,259,792) 26,508,016
OTHER LIABILITIES:
Accrued medical malpractice 612,163 - - 612,163
Accrued other post employment benefits 786,907 - - 786,907
Net pension liability 425,460 425,460
Total other liabilities 1,824,530 - - 1,824,530
LONG-TERM DEBT AND CAPITAL LEASE OBLIGATIONS:
Net of current portion 96,060,553 237,761 - 96,298,314
Total liabilities 124,273,195 2,617,457 (2,259,792) 124,630,860
COMMITMENTS AND CONTINGENCIES
DEFERRED INFLOWS
Pension 98,307 - - 98,307
Total deferred inflows 98,307 - - 98,307
NET POSITION:
Net invested in capital assets 7,263,358 2,406,978 - 9,670,336
Restricted by donors 300,988 - - 300,988
Restricted for debt service 5,188,883 - - 5,188,883
Unrestricted 90,907,558 (67,298) - 90,840,260
Total net position 103,660,787 2,339,680 - 106,000,467
TOTAL LIABILITIES AND NET POSITION 228,032,289$ 4,957,137$ (2,259,792)$ 230,729,634$
See Report of Independent Certified Public Accountants. (Concluded)

- 63 -
NORTH BREVARD COUNTY HOSPITAL DISTRICT
SUPPLEMENTARY INFORMATION - CONSOLIDATING BALANCE SHEET
SEPTEMBER 30, 2015
North Brevard CountyHospital District O perating North Brevard
Parrish Medical Center Medical Support, North Brevard County(O bligated Group) Inc. Eliminations Hospital District
ASSETS
CURRENT ASSETS: Cash and cash equivalents 8,414,648$ 301,706$ -$ 8,716,354$ Restricted assets - held by trustee and required for current liabilit ies 2,144,976 - - 2,144,976 Patient accounts receivable - net 17,933,176 - (15) 17,933,161 Supplies 2,599,340 - - 2,599,340
Prepaid expenses and other assets 6,892,694 30,912 (1,432,391) 5,491,215
Total current assets 37,984,834 332,618 (1,432,406) 36,885,046
RESTRICTED ASSETS: Temporarily donor-restricted net position 519,836 - - 519,836 Funded depreciation 69,230,545 - - 69,230,545 Held by trustee 3,010,845 - - 3,010,845
Total restricted assets 72,761,226 - - 72,761,226
OTHER ASSETS: Net pension asset 6,526,197 - - 6,526,197 Deposits and other assets 15,497 1,147,442 - 1,162,939 Investments 15,279,434 - - 15,279,434
Total other assets 21,821,128 1,147,442 - 22,968,570
CAPITAL ASSETS: Land 9,690,078 150,000 - 9,840,078 Improvements to land 2,114,810 - - 2,114,810 Buildings and improvements 132,815,619 3,069,375 - 135,884,994 Equipment 84,981,095 986,025 - 85,967,120
Construction in progress 3,012,986 521,253 - 3,534,239
232,614,588 4,726,653 - 237,341,241
Less accumulated depreciation (144,077,566) (2,135,088) - (146,212,654)
Net capital assets 88,537,022 2,591,565 - 91,128,587
DEFERRED OUTFLOWS
Pension 2,336,088 - - 2,336,088
Series 2008 Bond refunding 11,164,254 - - 11,164,254
Total deferred outflows 13,500,342 - - 13,500,342
TOTAL ASSETS AND DEFERRED
OUTFLOWS 234,604,552$ 4,071,625$ (1,432,406)$ 237,243,771$
(Continued)
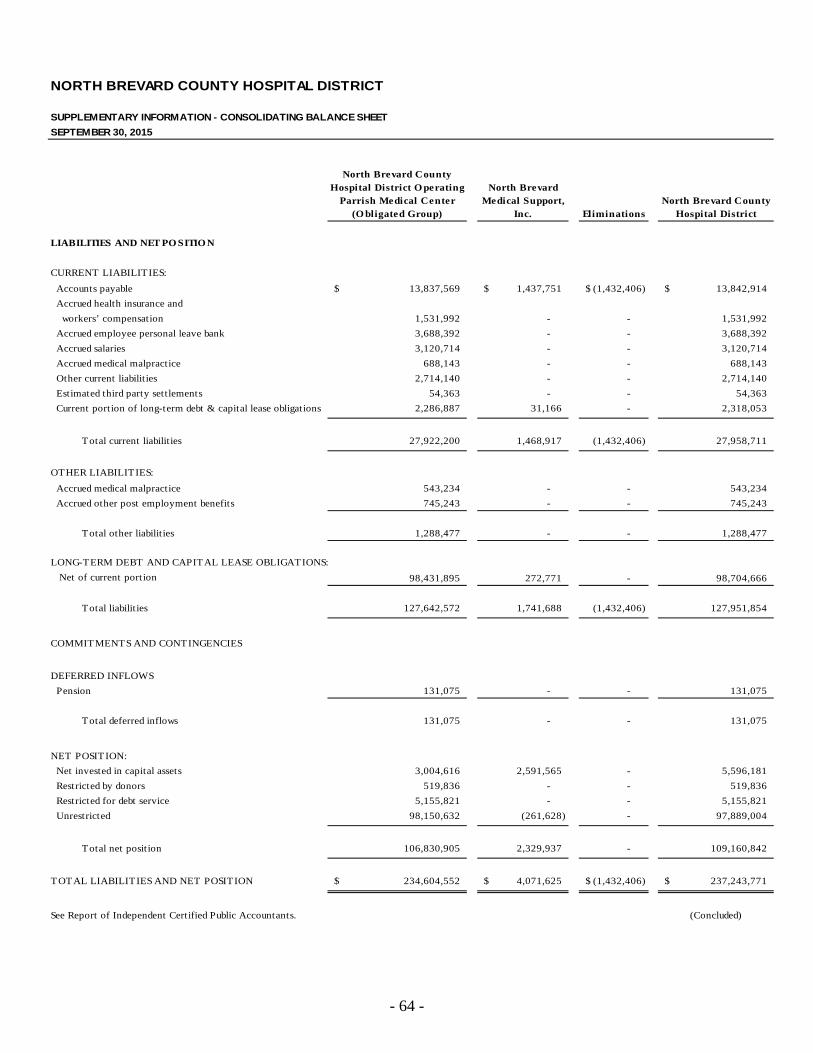
- 64 -
NORTH BREVARD COUNTY HOSPITAL DISTRICT
SUPPLEMENTARY INFORMATION - CONSOLIDATING BALANCE SHEET
SEPTEMBER 30, 2015
North Brevard CountyHospital District O perating North Brevard
Parrish Medical Center Medical Support, North Brevard County(O bligated Group) Inc. Eliminations Hospital District
LIABILITIES AND NET PO SITIO N
CURRENT LIABILITIES:
Accounts payable 13,837,569$ 1,437,751$ (1,432,406)$ 13,842,914$
Accrued health insurance and
workers’ compensation 1,531,992 - - 1,531,992
Accrued employee personal leave bank 3,688,392 - - 3,688,392
Accrued salaries 3,120,714 - - 3,120,714
Accrued medical malpractice 688,143 - - 688,143
Other current liabilities 2,714,140 - - 2,714,140
Estimated third party settlements 54,363 - - 54,363
Current portion of long-term debt & capital lease obligations 2,286,887 31,166 - 2,318,053
Total current liabilities 27,922,200 1,468,917 (1,432,406) 27,958,711
OTHER LIABILITIES:
Accrued medical malpractice 543,234 - - 543,234
Accrued other post employment benefits 745,243 - - 745,243
Total other liabilities 1,288,477 - - 1,288,477
LONG-TERM DEBT AND CAPITAL LEASE OBLIGATIONS:
Net of current port ion 98,431,895 272,771 - 98,704,666
Total liabilities 127,642,572 1,741,688 (1,432,406) 127,951,854
COMMITMENTS AND CONTINGENCIES
DEFERRED INFLOWS
Pension 131,075 - - 131,075
Total deferred inflows 131,075 - - 131,075
NET POSITION:
Net invested in capital assets 3,004,616 2,591,565 - 5,596,181
Restricted by donors 519,836 - - 519,836
Restricted for debt service 5,155,821 - - 5,155,821
Unrestricted 98,150,632 (261,628) - 97,889,004
Total net posit ion 106,830,905 2,329,937 - 109,160,842
TOTAL LIABILITIES AND NET POSITION 234,604,552$ 4,071,625$ (1,432,406)$ 237,243,771$
See Report of Independent Certified Public Accountants. (Concluded)

- 65 -
NORTH BREVARD COUNTY HOSPITAL DISTRICT
SUPPLEMENTARY INFORMATION - CONSOLIDATING STATEMENT OF REVENUES, EXPENSES, AND CHANGES IN NET POSITION
YEAR ENDED SEPTEMBER 30, 2016
North Brevard CountyHospital District O perating North Brevard
Parrish Medical Center Medical Support, North Brevard County(O bligated Group) Inc. Eliminations Hospital District
OPERATING REVENUE: Net patient service revenue 142,149,493$ -$ -$ 142,149,493$
Other operating revenue 2,923,529 - - 2,923,529
Total operating revenue 145,073,022 - - 145,073,022
OPERATING EXPENSES: Salaries and wages 48,078,122 - - 48,078,122 Employee benefits 17,586,927 - - 17,586,927 Medications and supplies 24,543,182 - - 24,543,182 Professional fees and contractual services 27,370,032 - - 27,370,032 Other operating expenses 11,840,622 - - 11,840,622 Depreciation 11,517,505 - - 11,517,505
Interest expense 3,733,760 - - 3,733,760
Total operating expenses 144,670,150 - - 144,670,150
OPERATING (LOSS) 402,872 - - 402,872
NONOPERATING REVENUES (EXPENSES): Investment income, net 8,100,599 - - 8,100,599 Other nonoperating expenses, net (9,968,963) (2,789,744) - (12,758,707)
Internal grants (2,799,488) 2,799,488 - -
Total nonoperating revenues (expenses), net (4,667,852) 9,744 - (4,658,108)
LOSS BEFORE CAPITAL CONTRIBUTIONS (4,264,980) 9,744 - (4,255,236)
CAPITAL CONTRIBUTIONS 1,094,861 - - 1,094,861
CHANGE IN NET POSITION (3,170,119)$ 9,744$ -$ (3,160,375)$
See Report of Independent Certified Public Accountants.

- 66 -
NORTH BREVARD COUNTY HOSPITAL DISTRICT
SUPPLEMENTARY INFORMATION - CONSOLIDATING STATEMENT OF REVENUES, EXPENSES, AND CHANGES IN NET POSITION
YEAR ENDED SEPTEMBER 30, 2015
North Brevard CountyHospital District O perating North Brevard
Parrish Medical Center Medical Support, North Brevard County(O bligated Group) Inc. Eliminations Hospital District
OPERATING REVENUE: Net patient service revenue 127,882,559$ -$ -$ 127,882,559$
Other operating revenue 1,985,366 - - 1,985,366
Total operating revenue 129,867,925 - - 129,867,925
OPERATING EXPENSES: Salaries and wages 49,621,836 - - 49,621,836 Employee benefits 16,501,428 - - 16,501,428 Medications and supplies 26,971,055 - - 26,971,055 Professional fees and contractual services 27,097,534 - - 27,097,534 Other operating expenses 13,785,946 - - 13,785,946 Depreciation 11,926,039 - - 11,926,039
Interest expense 2,208,818 - - 2,208,818
Total operating expenses 148,112,656 - - 148,112,656
OPERATING (LOSS) (18,244,731) - - (18,244,731)
NONOPERATING REVENUES (EXPENSES): Investment income, net 3,552,762 12,893 - 3,565,655 Other nonoperating expenses, net (12,084,445) (1,391,305) - (13,475,750)
Internal grants (1,310,064) 1,310,064 - -
Total nonoperating revenues (expenses), net (9,841,747) (68,348) - (9,910,095)
LOSS BEFORE CAPITAL CONTRIBUTIONS (28,086,478) (68,348) - (28,154,826)
CAPITAL CONTRIBUTIONS 165,590 - - 165,590
CHANGE IN NET POSITION (27,920,888)$ (68,348)$ -$ (27,989,236)$
See Report of Independent Certified Public Accountants.

OTHER REPORT

- 67 -
INDEPENDENT AUDITOR’S REPORT ON INTERNAL CONTROL OVER FINANCIAL REPORTING AND ON COMPLIANCE AND OTHER MATTERS BASED ON AN AUDIT OF
FINANCIAL STATEMENTS PERFORMED IN ACCORDANCE WITH GOVERNMENT AUDITING STANDARDS
Board of Directors and Audit Committee North Brevard County Hospital District Titusville, Florida We have audited, in accordance with the auditing standards generally accepted in the United States of America and the standards applicable to financial audits contained in Government Auditing Standards issued by the Comptroller General of the United States, the financial statements of North Brevard County Hospital District (the “District”) as of and for the year ended September 30, 2016, and the related notes to the financial statements, which collectively comprise the District’s basic financial statements, and have issued our report thereon dated January 6, 2017. Internal Control Over Financial Reporting In planning and performing our audit, we considered the District’s internal control over financial reporting (internal control) to determine the audit procedures that are appropriate in the circumstances for the purpose of expressing our opinion on the financial statements, but not for the purpose of expressing an opinion on the effectiveness of the District’s internal control. Accordingly, we do not express an opinion on the effectiveness of the District’s internal control. A deficiency in internal control exists when the design or operation of a control does not allow management or employees, in the normal course of performing their assigned functions, to prevent, or detect and correct, misstatements on a timely basis. A material weakness is a deficiency, or combination of deficiencies, in internal control, such that there is a reasonable possibility that a material misstatement of the entity’s financial statements will not be prevented, or detected and corrected, on a timely basis. A significant deficiency is a deficiency, or a combination of deficiencies, in internal control that is less severe than a material weakness, yet important enough to merit attention by those charged with governance. Our consideration of internal control over financial reporting was for the limited purpose described in the first paragraph of this section and was not designed to identify all deficiencies in internal control over financial reporting that might be material weaknesses or significant deficiencies. Given these limitations, during our audit we did not identify any deficiencies in internal control over financial reporting that we consider to be material weaknesses. However, material weak-nesses may exist that have not been identified.

Board of Directors and Audit Committee North Brevard County Hospital District
- 68 -
Compliance and Other Matters As part of obtaining reasonable assurance about whether the District’s financial statements are free of material misstatement, we performed tests of its compliance with certain provisions of laws, regulations, contracts, and grant agreements, noncompliance with which could have a direct and material effect on the determination of financial statement amounts. However, providing an opinion on compliance with those provisions was not an objective of our audit and, accordingly, we do not express such an opinion. The results of our tests disclosed no instances of noncompliance or other matters that are required to be reported under Government Auditing Standards. Pursuant to the provisions of Chapter 10.500, Rules of the Auditor General, we reported certain matters to management of the District in an Independent Auditor’s Management Letter dated January 6, 2017. Purpose of this Report The purpose of this report is solely to describe the scope of our testing of internal control and compliance and the results of that testing, and not to provide an opinion on the effectiveness of the entity’s internal control or on compliance. This report is an integral part of an audit performed in accordance with Government Auditing Standards in considering the District’s internal control and compliance. Accordingly, this communication is not suitable for any other purpose. MOORE STEPHENS LOVELACE, P.A. Certified Public Accountants Tampa, Florida January 6, 2017

INDEPENDENT AUDITOR’S MANAGEMENT LETTER Board of Directors and Audit Committee North Brevard County Hospital District Titusville, Florida Report on the Financial Statements
We have audited the financial statements of North Brevard County Hospital District (the “District”) as of and for the fiscal year ended September 30, 2016, and have issued our report thereon dated January 6, 2017. Auditor’s Responsibility We conducted our audit in accordance with auditing standards generally accepted in the United States of America; and the standards applicable to financial audits contained in Government Auditing Standards issued by the Comptroller General of the United States of America and Chapter 10.550, Rules of the Florida Auditor General. Other Reports
We have also issued our Independent Auditor’s Report on Internal Control Over Financial Reporting and Compliance and Other Matters Based on an Audit of Financial Statements Performed in Accordance with Governmental Auditing Standards; Independent Auditor’s Report on Compliance with Bond Covenants; and Independent Accountant’s Report on an examination conducted in accordance with AICPA Professional Standards, Section 601, regarding compliance requirements in accordance with Chapter 10.550, Rules of the Auditor General. Disclosures in those reports, which are dated January 6, 2017, should be considered in conjunction with this management letter. Prior Audit Findings
Section 10.554(1)(i)1., Rules of the Auditor General, requires that we determine whether or not corrective actions have been taken to address findings and recommendations made in the preceding annual financial audit report. The previous recommendation identified as 2015 – 1: Revenue Refunding Bonds, Series 2008 (“Series 2008 Bonds”) has been implemented and is considered to be resolved.
Official Title and Legal Authority
Section 10.554(1)(i)4., Rules of the Auditor General, requires that the name or official title and legal authority for the primary government and each component unit of the reporting entity be disclosed in this management letter, unless disclosed in the notes to the financial statements. The District was established under the laws of the state of Florida in 1953 under an original act

Board of Directors and Audit Committee North Brevard County Hospital District Page 2 included in Chapter 28924, House Bill 1370, and operates Parrish Medical Center, a community hospital providing inpatient and outpatient healthcare services in North Brevard County, Florida. The legal authority is disclosed in the notes to the financial statements. Financial Condition
Section 10.554(1)(i)5.a. and 10.556(7), Rules of the Auditor General, require that we apply appropriate procedures and report the results of our determination as to whether or not the District has met one or more of the conditions described in Section 218.503(1), Florida Statutes, and identification of the specific condition(s) met. In connection with our audit, we determined that the District did not meet any of the conditions described in Section 218.503(1), Florida Statutes. Pursuant to Sections 10.554(1)(i)5.c. and 10.556(8), Rules of the Auditor General, we applied financial condition assessment procedures. It is management’s responsibility to monitor the District’s financial condition, and our financial condition assessment was based, in part, on representations made by management and the review of financial information provided by same. For the year ended September 30, 2016, we noted that the District had negative trending on certain financial condition assessment indicators from the Auditor General’s website. The negative indicators are generally caused by non-cash adjustments, such as depreciation and bad debt allowances, that result in reported financial losses and a decline in unrestricted net position. However, the District continues to generate significant cash flows from operations. Additionally, the District engaged an independent third party, Berkeley Research Group, to assist in identifying operational efficiencies and cost saving opportunities. Many of the recommendations are expected by the District’s Management to have a positive impact on the upcoming fiscal year. The District’s Management, as part of its analysis of the District’s financial condition, highlighted the following in its analysis:
(a) Continued positive cash flows in operations; (b) Positive current ratio and working capital positions; (c) Overall balance sheet that includes liquidity and long-term reserves; and (d) A sustainable long-term debt repayment schedule.
Annual Financial Report
Section 10.554(1)(i)5.b. and 10.556(7), Rules of the Auditor General, require that we apply appropriate procedures and report the results of our determination as to whether the annual financial report for the District for the fiscal year ended September 30, 2016, filed with the Florida Department of Financial Services pursuant to Section 218.32(1)(a), Florida Statutes, is in agreement with the annual financial audit report for the fiscal year ended September 30, 2016. In connection with our audit, we determined that these two reports were in agreement.

Board of Directors and Audit Committee North Brevard County Hospital District Page 3 Special District Component Units
Section 10.554(1)(i)5.d., Rules of the Auditor General, requires that we determine whether or not a special district that is a component unit of a county, municipality, or special district, provided the Financial information necessary for proper reporting of the component unit, within the audited financial statements of the county, municipality, or special district in accordance with Section 218.39(3)(b), Florida Statutes. The District is a primary government, and thus, this is not applicable to the financial statements of the District. Other Matters
Section 10.554(1)(i)2., Rules of the Auditor General, requires that we address in the management letter any recommendations to improve financial management. In connection with our audit, we did not have any such recommendations. Section 10.554(1)(i)3., Rules of the Auditor General, requires that we address noncompliance with provisions of contracts or grant agreements, or abuse, that have occurred, or are likely to have occurred, that have an effect on the financial statements that is less than material but which warrants the attention of those charged with governance. In connection with our audit, we did not have any such findings. The previous finding identified as 2015 – 1: Revenue Refunding Bonds, Series 2008 (“Series 2008 Bonds”) has been resolved and was not applicable to the year ended September 30, 2016. Purpose of this Letter
Our management letter is intended solely for the information and use of the Legislative Auditing Committee, members of the Florida Senate and the Florida House of Representatives, the Florida Auditor General, Federal and other granting agencies, the Board of Directors, and applicable management, and is not intended to be, and should not be, used by anyone other than these specified parties. MOORE STEPHENS LOVELACE, P.A. Certified Public Accountants Tampa, Florida January 6, 2017
INDEPENDENT ACCOUNTANT’S REPORT Board of Directors and Audit Committee North Brevard County Hospital District Titusville, Florida We have examined the North Brevard County Hospital District’s (the “District”) compliance with the requirements of Section 218.415, Florida Statutes, during the fiscal year ended September 30, 2016. Management is responsible for the District’s compliance with those requirements. Our responsibility is to express an opinion on the District’s compliance based on our examination. Our examination was conducted in accordance with attestation standards established by the American Institute of Certified Public Accountants and, accordingly, included examining, on a test basis, evidence about the District’s compliance with those requirements and performing such other procedures as we considered necessary in the circumstances. We believe that our examination provides a reasonable basis for our opinion. Our examination does not provide a legal determination on the District’s compliance with specified requirements. In our opinion, the District complied, in all material respects, with the aforementioned requirements for the fiscal year ended September 30, 2016. MOORE STEPHENS LOVELACE, P.A. Certified Public Accountants Tampa, Florida January 6, 2017


