+ All Categories
Home > Documents > NORTH DAKOTA GEOLOGICAL SURVEY Organic Geochemical Patterns in the

NORTH DAKOTA GEOLOGICAL SURVEY Organic Geochemical Patterns in the

Date post: 03-Feb-2022
Category:
Upload: others
View: 2 times
Download: 0 times
Share this document with a friend
1
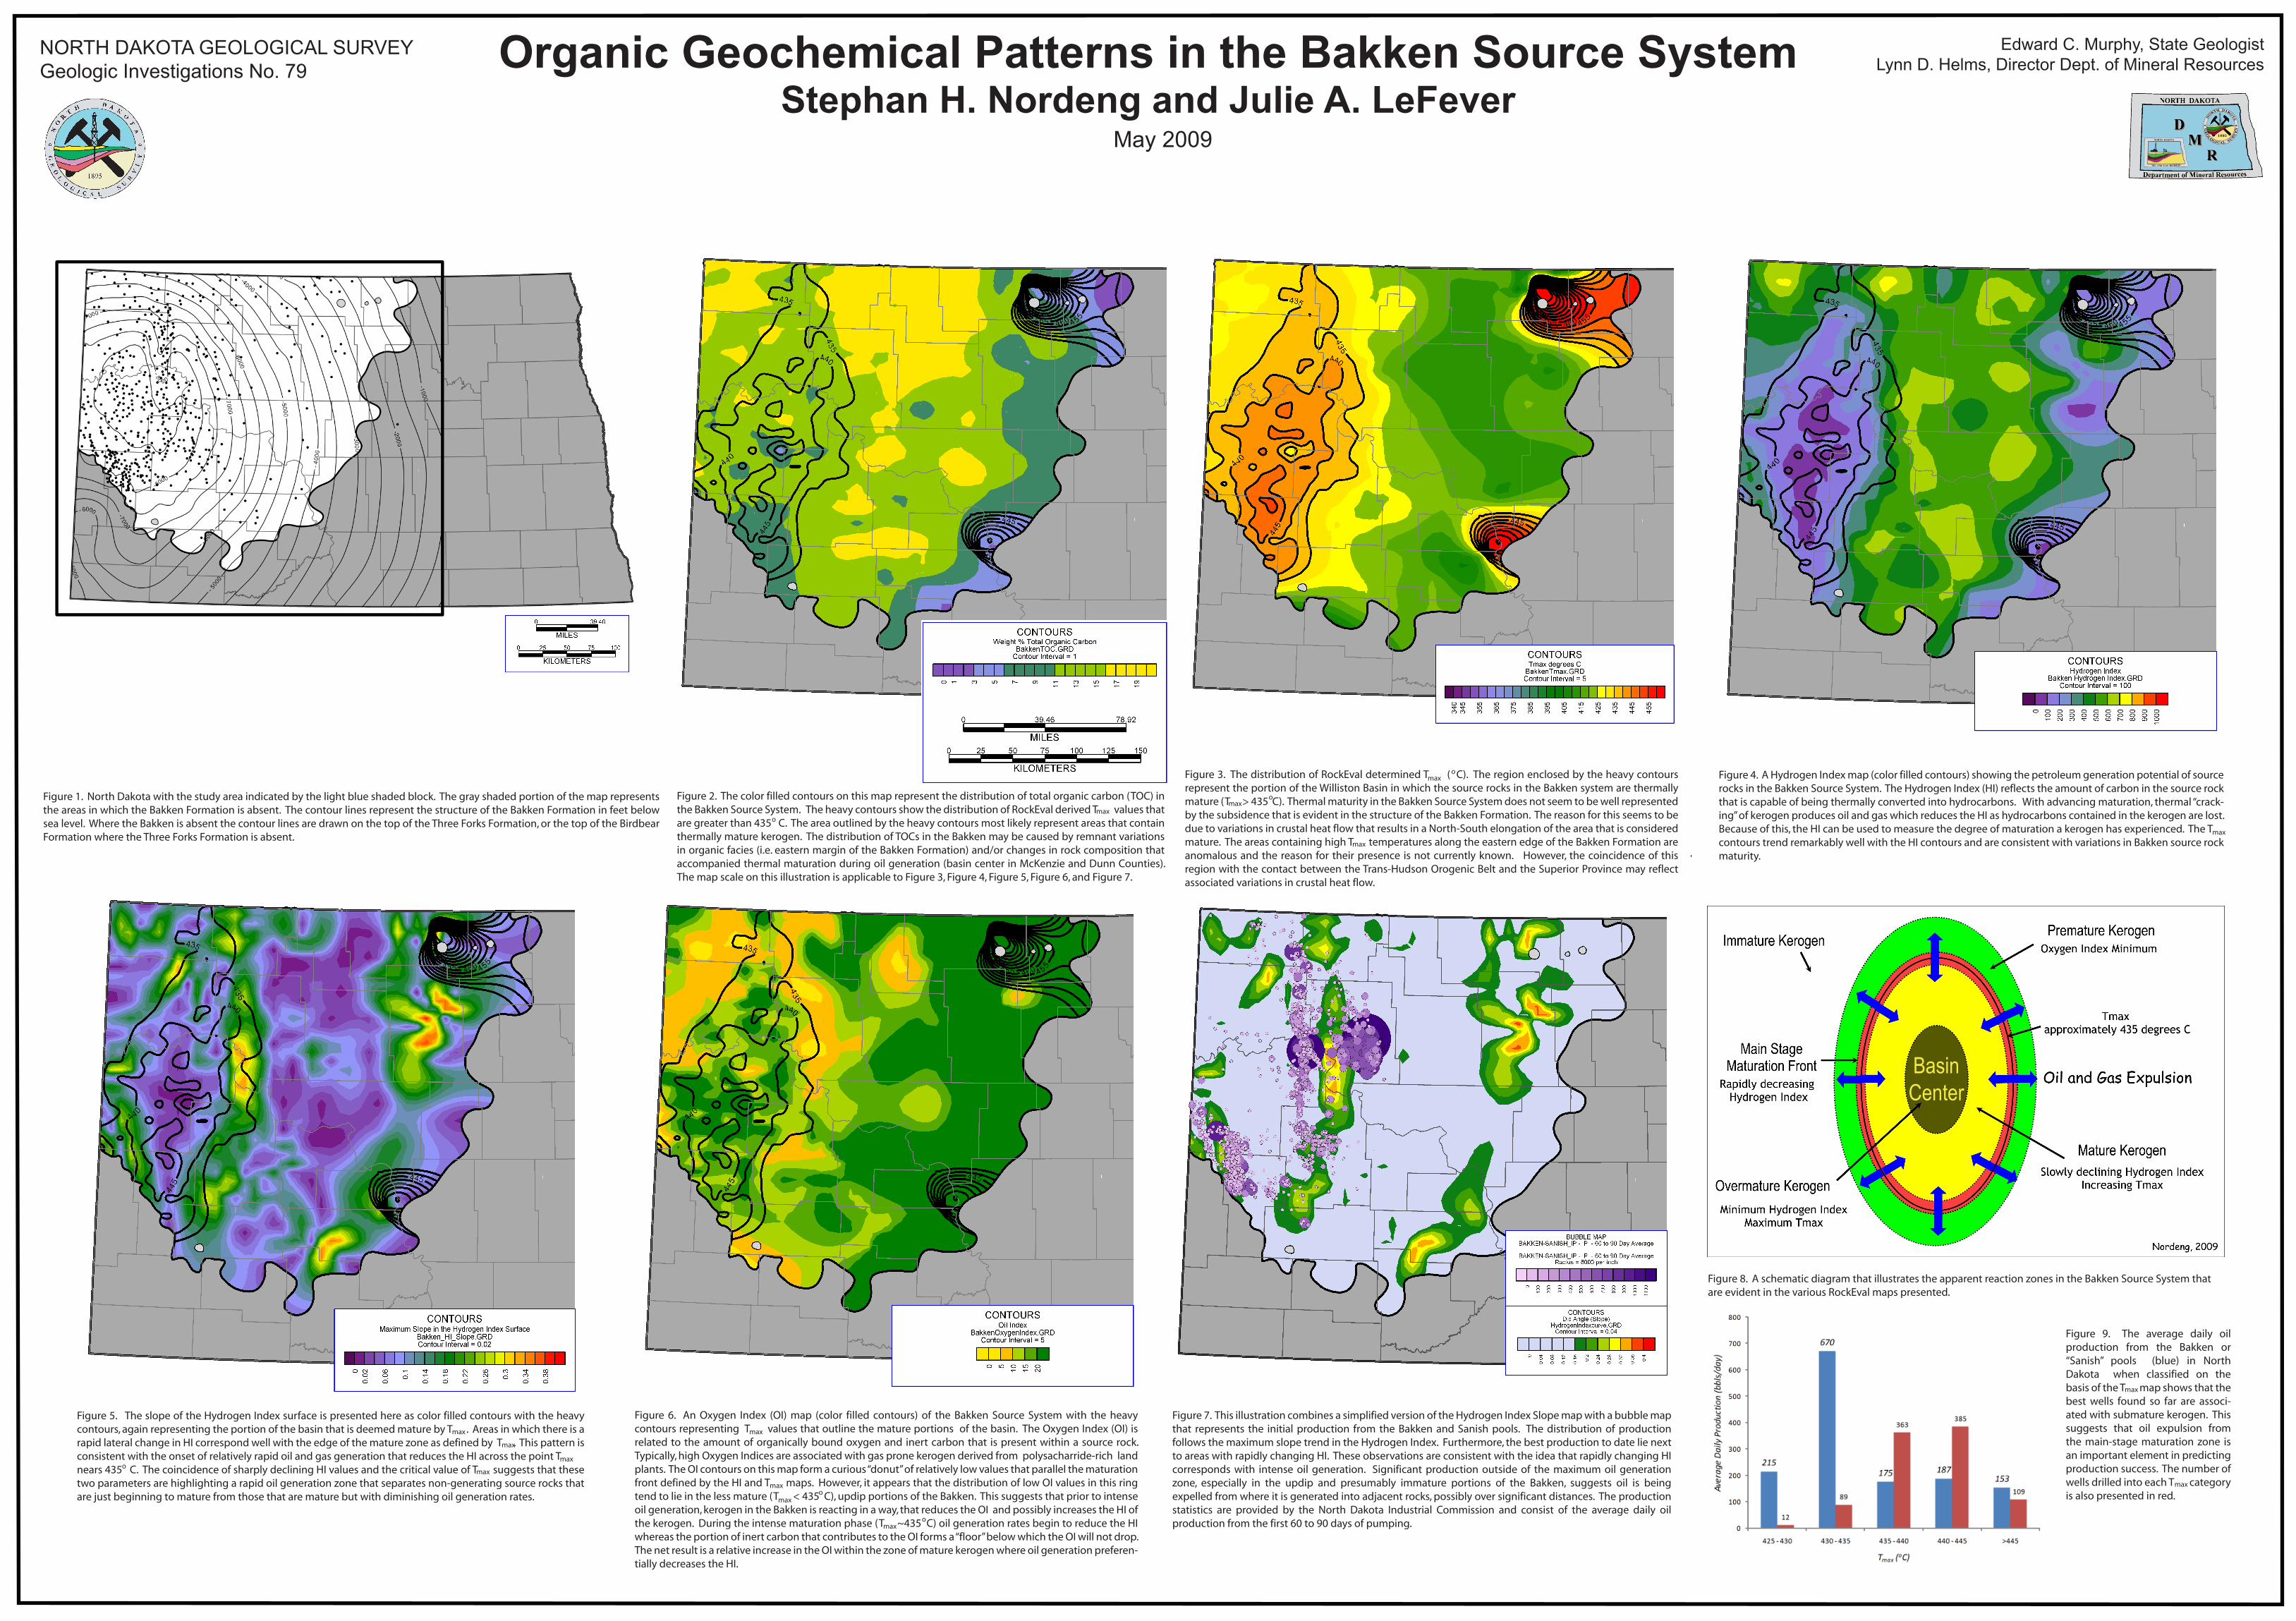
Organic Geochemical Patterns in the Bakken Source System Stephan H. Nordeng and Julie A. LeFever NORTH DAKOTA GEOLOGICAL SURVEY Geologic Investigations No. 79 Figure 1. North Dakota with the study area indicated by the light blue shaded block. The gray shaded portion of the map represents the areas in which the Bakken Formation is absent. The contour lines represent the structure of the Bakken Formation in feet below sea level. Where the Bakken is absent the contour lines are drawn on the top of the Three Forks Formation, or the top of the Birdbear Formation where the Three Forks Formation is absent. Figure 2. The color filled contours on this map represent the distribution of total organic carbon (TOC) in the Bakken Source System. The heavy contours show the distribution of RockEval derived T values that are greater than 435 C. The area outlined by the heavy contours most likely represent areas that contain thermally mature kerogen. The distribution of TOCs in the Bakken may be caused by remnant variations in organic facies (i.e. eastern margin of the Bakken Formation) and/or changes in rock composition that accompanied thermal maturation during oil generation (basin center in McKenzie and Dunn Counties). The map scale on this illustration is applicable to Figure 3, Figure 4, Figure 5, Figure 6, and Figure 7. Figure 3. The distribution of RockEval determined T ( C). The region enclosed by the heavy contours represent the portion of the Williston Basin in which the source rocks in the Bakken system are thermally mature (T > 435 C). Thermal maturity in the Bakken Source System does not seem to be well represented by the subsidence that is evident in the structure of the Bakken Formation. The reason for this seems to be due to variations in crustal heat flow that results in a North-South elongation of the area that is considered mature. The areas containing high T temperatures along the eastern edge of the Bakken Formation are anomalous and the reason for their presence is not currently known. However, the coincidence of this region with the contact between the Trans-Hudson Orogenic Belt and the Superior Province may reflect associated variations in crustal heat flow. Figure 5. The slope of the Hydrogen Index surface is presented here as color filled contours with the heavy contours, again representing the portion of the basin that is deemed mature by T . Areas in which there is a rapid lateral change in HI correspond well with the edge of the mature zone as defined by T . This pattern is consistent with the onset of relatively rapid oil and gas generation that reduces the HI across the point T nears 435 C. The coincidence of sharply declining HI values and the critical value of T suggests that these two parameters are highlighting a rapid oil generation zone that separates non-generating source rocks that are just beginning to mature from those that are mature but with diminishing oil generation rates. Figure 6. An Oxygen Index (OI) map (color filled contours) of the Bakken Source System with the heavy contours representing T values that outline the mature portions of the basin. The Oxygen Index (OI) is related to the amount of organically bound oxygen and inert carbon that is present within a source rock. Typically, high Oxygen Indices are associated with gas prone kerogen derived from polysacharride-rich land plants. The OI contours on this map form a curious “donut” of relatively low values that parallel the maturation front defined by the HI and T maps. However, it appears that the distribution of low OI values in this ring tend to lie in the less mature (T < 435 C), updip portions of the Bakken. This suggests that prior to intense oil generation, kerogen in the Bakken is reacting in a way, that reduces the OI and possibly increases the HI of the kerogen. During the intense maturation phase (T ~435 C) oil generation rates begin to reduce the HI whereas the portion of inert carbon that contributes to the OI forms a “floor” below which the OI will not drop. The net result is a relative increase in the OI within the zone of mature kerogen where oil generation preferen- tially decreases the HI. Figure 8. A schematic diagram that illustrates the apparent reaction zones in the Bakken Source System that are evident in the various RockEval maps presented. Figure 4. A Hydrogen Index map (color filled contours) showing the petroleum generation potential of source rocks in the Bakken Source System. The Hydrogen Index (HI) reflects the amount of carbon in the source rock that is capable of being thermally converted into hydrocarbons. With advancing maturation, thermal “crack- ing” of kerogen produces oil and gas which reduces the HI as hydrocarbons contained in the kerogen are lost. Because of this, the HI can be used to measure the degree of maturation a kerogen has experienced. The T contours trend remarkably well with the HI contours and are consistent with variations in Bakken source rock maturity. Figure 7. This illustration combines a simplified version of the Hydrogen Index Slope map with a bubble map that represents the initial production from the Bakken and Sanish pools. The distribution of production follows the maximum slope trend in the Hydrogen Index. Furthermore, the best production to date lie next to areas with rapidly changing HI. These observations are consistent with the idea that rapidly changing HI corresponds with intense oil generation. Significant production outside of the maximum oil generation zone, especially in the updip and presumably immature portions of the Bakken, suggests oil is being expelled from where it is generated into adjacent rocks, possibly over significant distances. The production statistics are provided by the North Dakota Industrial Commission and consist of the average daily oil production from the first 60 to 90 days of pumping. max o o o max max max max max max max max o max max max max o o Figure 9. The average daily oil production from the Bakken or “Sanish” pools (blue) in North Dakota when classified on the basis of the T map shows that the best wells found so far are associ- ated with submature kerogen. This suggests that oil expulsion from the main-stage maturation zone is an important element in predicting production success. The number of wells drilled into each T category is also presented in red. max max Edward C. Murphy, State Geologist Lynn D. Helms, Director Dept. of Mineral Resources May 2009 Basin Center
Transcript

Organic Geochemical Patterns in the Bakken Source SystemStephan H. Nordeng and Julie A. LeFever

NORTH DAKOTA GEOLOGICAL SURVEYGeologic Investigations No. 79

Figure 1. North Dakota with the study area indicated by the light blue shaded block. The gray shaded portion of the map represents the areas in which the Bakken Formation is absent. The contour lines represent the structure of the Bakken Formation in feet below sea level. Where the Bakken is absent the contour lines are drawn on the top of the Three Forks Formation, or the top of the Birdbear Formation where the Three Forks Formation is absent.

Figure 2. The color filled contours on this map represent the distribution of total organic carbon (TOC) in the Bakken Source System. The heavy contours show the distribution of RockEval derived T values that are greater than 435 C. The area outlined by the heavy contours most likely represent areas that contain thermally mature kerogen. The distribution of TOCs in the Bakken may be caused by remnant variations in organic facies (i.e. eastern margin of the Bakken Formation) and/or changes in rock composition that accompanied thermal maturation during oil generation (basin center in McKenzie and Dunn Counties). The map scale on this illustration is applicable to Figure 3, Figure 4, Figure 5, Figure 6, and Figure 7.

Figure 3. The distribution of RockEval determined T ( C). The region enclosed by the heavy contours represent the portion of the Williston Basin in which the source rocks in the Bakken system are thermally mature (T > 435 C). Thermal maturity in the Bakken Source System does not seem to be well represented by the subsidence that is evident in the structure of the Bakken Formation. The reason for this seems to be due to variations in crustal heat flow that results in a North-South elongation of the area that is considered mature. The areas containing high T temperatures along the eastern edge of the Bakken Formation are anomalous and the reason for their presence is not currently known. However, the coincidence of this region with the contact between the Trans-Hudson Orogenic Belt and the Superior Province may reflect associated variations in crustal heat flow.

Figure 5. The slope of the Hydrogen Index surface is presented here as color filled contours with the heavy contours, again representing the portion of the basin that is deemed mature by T . Areas in which there is a rapid lateral change in HI correspond well with the edge of the mature zone as defined by T . This pattern is consistent with the onset of relatively rapid oil and gas generation that reduces the HI across the point T nears 435 C. The coincidence of sharply declining HI values and the critical value of T suggests that these two parameters are highlighting a rapid oil generation zone that separates non-generating source rocks that are just beginning to mature from those that are mature but with diminishing oil generation rates.

Figure 6. An Oxygen Index (OI) map (color filled contours) of the Bakken Source System with the heavy contours representing T values that outline the mature portions of the basin. The Oxygen Index (OI) is related to the amount of organically bound oxygen and inert carbon that is present within a source rock. Typically, high Oxygen Indices are associated with gas prone kerogen derived from polysacharride-rich land plants. The OI contours on this map form a curious “donut” of relatively low values that parallel the maturation front defined by the HI and T maps. However, it appears that the distribution of low OI values in this ring tend to lie in the less mature (T < 435 C), updip portions of the Bakken. This suggests that prior to intense oil generation, kerogen in the Bakken is reacting in a way, that reduces the OI and possibly increases the HI of the kerogen. During the intense maturation phase (T ~435 C) oil generation rates begin to reduce the HI whereas the portion of inert carbon that contributes to the OI forms a “floor” below which the OI will not drop. The net result is a relative increase in the OI within the zone of mature kerogen where oil generation preferen-tially decreases the HI.

Figure 8. A schematic diagram that illustrates the apparent reaction zones in the Bakken Source System that are evident in the various RockEval maps presented.

Figure 4. A Hydrogen Index map (color filled contours) showing the petroleum generation potential of source rocks in the Bakken Source System. The Hydrogen Index (HI) reflects the amount of carbon in the source rock that is capable of being thermally converted into hydrocarbons. With advancing maturation, thermal “crack-ing” of kerogen produces oil and gas which reduces the HI as hydrocarbons contained in the kerogen are lost. Because of this, the HI can be used to measure the degree of maturation a kerogen has experienced. The T contours trend remarkably well with the HI contours and are consistent with variations in Bakken source rock maturity.

Figure 7. This illustration combines a simplified version of the Hydrogen Index Slope map with a bubble map that represents the initial production from the Bakken and Sanish pools. The distribution of production follows the maximum slope trend in the Hydrogen Index. Furthermore, the best production to date lie next to areas with rapidly changing HI. These observations are consistent with the idea that rapidly changing HI corresponds with intense oil generation. Significant production outside of the maximum oil generation zone, especially in the updip and presumably immature portions of the Bakken, suggests oil is being expelled from where it is generated into adjacent rocks, possibly over significant distances. The production statistics are provided by the North Dakota Industrial Commission and consist of the average daily oil production from the first 60 to 90 days of pumping.

maxo

o

o

max

max

max

max

max

max

max

maxo

max

max

max

max

o

o

Figure 9. The average daily oil production from the Bakken or “Sanish” pools (blue) in North Dakota when classified on the basis of the T map shows that the best wells found so far are associ-ated with submature kerogen. This suggests that oil expulsion from the main-stage maturation zone is an important element in predicting production success. The number of wells drilled into each T category is also presented in red.

max

max

Edward C. Murphy, State GeologistLynn D. Helms, Director Dept. of Mineral Resources

May 2009

BasinCenter

Recommended