21
North Essex Parking Partnership Annual Report 2014/15

North Essex
Parking Partnership
Annual Report
2014/15

Page 2 of 21
North Essex Parking Partnership Annual Report 2014/15: Issue 1.0 (final version) © North Essex Parking Partnership
www.parkingpartnership.org email: [email protected] Telephone 01206 282316
Data contained herein may be reproduced with the prior permission of the lead authority. This report follows guidance issued by the Department for Transport, British Parking Association and The Traffic Penalty Tribunal. Version date: Monday, 07 December 2015
Page 3 of 21
Annual Report 2014/15
Executive Summary
This fourth Annual Report of the North Essex Parking Partnership considers the financial
year ending 31 March 2015, providing an overview of operational performance. This report
includes all financial and statistical data, which is recommended in the operational guidance
issued under TMA2004.
As I have said in previous years, the Parking Partnership has taken great care always to
base its service on the core principles of fairness, transparency and consistency operating in
a fair, reasonable and responsible manner with each case being treated individually on its
own merits. In particular, enforcement action is focussed on dangerous, careless and
negligent parking.
These principles were the basis of the legislative changes which took effect early in 2015 and
we have contributed to consultative approach led by Department for Transport in those
changes and the Partnership has planned carefully and continuously its service so that few
changes were necessary to update our policy in line with latest guidance.
A review of the off-street operational service has been conducted and concluded during the
year, delivering efficiencies and streamlining the service to be able to support the Traffic
Regulation service effectively.
The Partnership has continued to operate its enforcement service without any financial
support and we have been able to invest in technology and hardware to ensure the future
performance of the operations. The combined enforcement operation and processing
function operates, reports to the Joint Committee.
The overall Partnership performance during the year was successful with a small surplus
being saved for future years and the operation is again set to continue to deliver efficient
services in the North Essex area.
Cllr Robert Mitchell
Chair,
North Essex Parking Partnership
Deputy Cabinet Member for Place, Braintree District Council
October 2015

Page 4 of 21
Introduction
This report includes the main details of changes to the service, projects being undertaken and plans for the future.
The service’s Development Plan follows contains much of the information previously carried in the Annual Report preface, and can be found online, at www.parkingpartnership.org
Main Issues from 2014/15 and Projects undertaken
Development Plan
The NEPP was formed in 2011 and when it started it adopted a three-year Business Plan; this set out how the service would operate and become financially independent by the end of the third financial year.
With the Business Plan successfully implemented by the end of 2013/14, a new Development Plan was written, and this was presented to the Joint Committee and agreed in outline at its AGM on 26 July 2014. The Plan was updated following the conclusion of the Technical Team Review, and adopted in full at the Joint Committee Meeting on 12 March 2015.
Park Safe Car
Introduced towards the end of 2013/14, the ParkSafe car was scheduled to operate for a year on trial in order to gather data and information for a future decision on how to proceed.
The car is primarily provided as a school clearway safety vehicle, and a wide-ranging communication programme was run alongside in order to promote the ParkSafe car.
The communication strategy which partners the vehicle is of equivalent importance, and the vehicle supports this with enforcement activity.
The ParkSafe car’s job is to provide a more effective deterrent against motorists taking the chance of parking on school zig-zag markings. Being mobile, it can cover more sites more effectively, and has been marketed effectively – if a motorist contravenes safety restrictions outside schools, the car raises the chance of being caught.
The ParkSafe car provided sufficient data to enable a further report to be prepared to be considered in 2015 for a permanent vehicle to be purchased and operated by the Partnership.
The statistics are given in the appendix.
Cash Outsourcing
Due to safety and transport concerns, plus the requirement to vacate the building previously used for cash counting in Colchester, the decision was made to go to market by tender.
The process to outsource the cash collection to successful bidder, G4S completed in October 2014 which resulted in a parallel reorganisation of the Technical service.

Page 5 of 21
Technical Team reorganisation
As a result of the outsourcing of cash collection, the Technical and Operations team was reorganised into a new singe Technical Team, with officers trained in both TRO and machine maintenance work; the cash collection process was outsourced.
MiPermit – Online Parking Account
MiPermit is an online parking account which is accessible using telephone landline, mobile phone, smart phone and Internet through a computer or tablet.
The MiPermit Project
The range of car parks and parking places where the system was available was extended during 2013/14, and now includes all resident permit annual permits, the option to purchase resident visitor permits online and season tickets for car parks beside cashless parking in car parks.
Users can have a single online account for both resident permits and car park stays. There are now 68 sites where users can purchase a parking stay, or include parking when visiting another site and all resident parking schemes will be included in the system by September 2015.
Braintree and Uttlesford Resident Permits were transferred to the MiPermit service with renewals being sent from February 2015 for a March start. The peak is represented in the graph below with a large number of visitor permits sold to accounts from February 2015, with permits becoming valid from March the main renewal month.
Annual Resident Parking Permits
Daily Visitor Parking Permits

Page 6 of 21
At first, all annual resident permit renewals were included on the system as this is a purchase which can be made on the assisted service or by the resident over the Internet. All annual visitor permits are now administered this way.
The choice was given to residents whether to keep purchasing scratch-cards or to sign up to online resident visitor vouchers, with the idea that the scratch cards would eventually be phased out. Initially around 60% of resident visitor purchases transferred to the MiPermit system at the same time and this has since increased to almost three quarters of all visitor permit transactions out of the expected 90,000 transactions each year – a very large saving in terms of permit production, sales and distribution costs.
It has now been agreed that the scratch-cards will continue to be available and in 2014/15 the Joint Committee decided to make the price reflect better the costs when a price differential was introduced, with scratch cards being 50% (50p) more expensive than the digital equivalent to cover the costs of production and postage. The price of visitor permits covers both the true costs of provision and represents the value of parking in residential areas.
The Table below shows the success of the digital system but also that there is an ongoing demand for scratch-cards.
Month
Number of books sold
MiPermit Digital
Paper Scratch cards
2014/15 April 14 392 33
May 14 416 203
June 14 393 174
July 14 482 205
August 14 443 238
September 14 419 188
October 14 395 205
November 14 434 180
December 14 500 179
January 15 423 175
February 15 413 175
March 15 553 182
Financial – Budget Review
As part of the review of off-street services carried out under Agreement with other authorities, a zero-based budget review was requested by the Joint Committee. The work involved investigating the scale of the actual work in each district compared to the level of contribution each area has been making.
The committee decided to make no changes in the forthcoming financial year, however the results of the exercise showed that the balance between what some of the partners were paying had diverged from base budgets supplied to the partnership. The outputs provided
On Street operations were budgeted to break even, and the out-turn showed that the service continued to provide a small in-year surplus.

Page 7 of 21
Staffing
The service focussed on four areas during the first four years of operation: People, Performance, Policy and Process. It has been important to focus on all four of these areas in order to maintain a balanced and achieving service.
The People strand has been acknowledged as the most important area and has been given a high priority in 2014/15, informally dubbed the “Year of People” by the Group Manager. The drive towards greater inclusion has spawned a number of topic-specific Focus Groups in addition to the usual management meetings, team meetings, staff 1 to 1s and appraisals.
Staff from all areas and at all levels have been included in the various groups, each tasked with improving the service in a particular area. Some groups have resolved a particular issue, others have provided a consistent input into other areas; for example, the Communications Focus Group which has produced material for internal and external newsletters and the blog.
Focus Group topics include:
Communications
Vehicles/fleet
Training/induction
Policy update
Blue Badges
Lone Worker system
Communications
The NEPP is supported by a part time Communications officer who has developed a project plan to cover regular communication activities and projects – alongside the usual reactive media responses. Part of the project work is handled through a Communications Focus Group which has representatives from all areas of the service. The Focus Group provides material for the Newsletter and the successful Parking Blog which was started this year. A Staff Charter was developed and communicated.
NEPP responded to an increasing number of media enquiries during the year. A summary of the number of enquiries received is shown in the Table, below:
Number of NEPP Media Enquiries
Month 2014 2015
January 7 5
February 3 2
March 1 16
April 12 3
May 10 5
June 1 12
July 6 10
August 1
September 4
October 6
November 2
December 0
TOTAL 53 53 to date
(Aug 2015)

Page 8 of 21
Beside the Press Releases issued, and Reactive Media Enquiries, the Communications Officer also assists with the service’s other Social Media presence including posting items on Twitter: (@YourColchester), Facebook: (Enjoy Colchester), the NEPP’s Linked In account.
Blog
An innovation this year has been the introduction of the Blog.
The Blog (short for ‘web-log’) is an Internet-based series of topical explanations written in an informal style, in the pen-name Anna Tendant. The blog aims to shed light on Anna’s day-to-day experiences as a CEO and offers advice as well as answering and clarifying common parking questions.
The blog is presented instead of less accessible “Frequently Asked Questions” or FAQ and has proved to be very popular and well-received by motorists. The posts on Blog are roughly weekly and have now received in excess of a total of 2000 views.
Topics covered have included issues such as the dangers of leaving dogs in hot cars, parking action alerts for enforcement outside schools and on bank holidays, changes to the DVLA rules on selling cars, road closures for cycling events and the new Park & Ride service in Colchester.
Anna’s Blog can be read at https://northessexparkingpartnership.wordpress.com/
Recruitment
The North Essex Parking Partnership has filled a number of vacancies in the year, although the overall enforcement team still needs to fill further vacant posts. There has been some turnover of staff in-year and as a result a new “Assessment Day” has been developed both to help select suitable staff, but also let applicants know the full range and of the job roles on offer.
Traffic Regulation Orders (TROs)
The TRO service has processed a large number of schemes in the time since formation. The full details are listed in one of the Joint Committee Reports for 29th October 2015.
With the presence of NEPP, there is now a simpler and more consistent way to apply for a new TRO scheme, with the central point of contact being the Technical Team. The

Page 9 of 21
introduction of additional Guidance by the Department for Communities and Local Government has also been included in the new NEPP Policy, enabling petitions to the council where changes are requested to the overall policy for parking and pattern of restrictions already in an area.
Extensive information is given in the new policy document: http://www.parkingpartnership.org/policies/2015 09 TRO.pdf
Penalty Charge Notices
The following Table shows the number of PCNs issued by area over the last five years. There are lots of factors which affect the number of PCNs issued – however this
Parking Returns
Local Authority parking providers are now required to publish statistics relating to the number of bays, charges and income. Where these are available, a summary is shown for the Partnership and its client authorities, below. Some authorities publish their own off-street information separately.
Braintree Off-Street Car Park Returns Table 1. 2014/15 2013/14 2012/13 2011/12
Revenue collected from off-street parking (i.e. fees and charges from tickets at the machine, permits or season tickets)
Not given
Revenue collected from off-street parking enforcement notices (i.e. Penalty Charge Notices)
Not given
Table 2. 2014/15 2013/14 2012/13 2011/12
The number of marked out controlled off street parking spaces.
1,456 1,456
The number of free parking spaces provided directly by the local authority.
0 0

Page 10 of 21
Colchester Off-Street Car Park Returns Table 1. 2014/15 2013/14 2012/13 2011/12
Revenue collected from off-street parking (i.e. fees and charges from tickets at the machine, permits or season tickets)
Not given
Revenue collected from off-street parking enforcement notices (i.e. Penalty Charge Notices)
Not given
Table 2. 2014/15 2013/14 2012/13 2011/12
The number of marked out controlled off street parking spaces.
3,948 3,948
The number of free parking spaces provided directly by the local authority.
125 125
Epping Forest Off-Street Car Park Returns Table 1. 2014/15 2013/14 2012/13 2011/12
Revenue collected from off-street parking (i.e. fees and charges from tickets at the machine, permits or season tickets)
Not given
Revenue collected from off-street parking enforcement notices (i.e. Penalty Charge Notices)
Not given
Table 2. 2014/15 2013/14 2012/13 2011/12
The number of marked out controlled off street parking spaces.
1,513 1,754
The number of free parking spaces provided directly by the local authority.
149 0
Harlow Off-Street Car Park Returns Table 1. 2013/14 2012/13 2011/12
Revenue collected from off-street parking (i.e. fees and charges from tickets at the machine, permits or season tickets)
Not given
Revenue collected from off-street parking enforcement notices (i.e. Penalty Charge Notices)
Not given
Table 2. 2013/14 2012/13 2011/12
The number of marked out controlled off street parking spaces.
698 698
The number of free parking spaces provided directly by the local authority.
0 0

Page 11 of 21
Uttlesford Off-Street Car Park Returns Table 1. 2014/15 2013/14 2012/13 2011/12
Revenue collected from off-street parking (i.e. fees and charges from tickets at the machine, permits or season tickets)
£975,856 £943,861 £928,570 £797,370
Revenue collected from off-street parking enforcement notices (i.e. Penalty Charge Notices)
£48,124 £77,208 £55,310 £61,440
Table 2. 2014/15 2013/14 2012/13 2011/12
The number of marked out controlled off street parking spaces.
1,112 1,112
The number of free parking spaces provided directly by the local authority.
0 0
Highway Parking Returns – across the whole of North Essex Table 1. 2014/15 2013/14 2012/13 2011/12
Revenue collected from on-street parking (i.e. fees and charges from tickets at the machine, permits or season tickets)
£619,000 £595,000 £540,000* £364,000*
Revenue collected from on-street parking enforcement notices (i.e. Penalty Charge Notices)
£1,512,000 £1,649,000 £1,482,000* £1,215,000*
* - Epping Forest operations merged with NEPP mid-2012/13, bringing more streets into NEPP operations, which had previously been shown separately (i.e. the NEPP PCN issues and income reflects a larger area in 2013/14 onwards).
Table 2. 2014/15 2013/14 2012/13 2011/12
The number of marked out controlled on street parking spaces.
2,968* 8,334†
2,968* 8,334†
The number of free parking spaces provided on the highway directly by the local authority.
660* 4,365†
660* 4,365†
Breakdown of how revenue from parking charges is spent or used
Parking Income is used for the funding of Parking Operational Services, Maintenance of machines, and the Resident Parking Service with any additional funds passing to a ring-fenced fund.
Breakdown of how revenue from enforcement activities is spent or used
Enforcement Income is used for the funding of Operational Enforcement Services, with any additional funds passing to a ring-fenced fund.

Page 12 of 21
On-Street Parking (Highway) Returns for North Essex
Type of bay / Number of bays
Braintree District
Colchester Borough
Epping Forest District
Harlow District
Tendring District
Uttlesford District
Total
Free of charge (includes limited wait and Blue Badge)
432 660 603 394 1972 304 4,365
Controlled bays (paid-for bays, including permit places)
901 2,968 787 2,872 561 245 8,334
More information
Correspondence and the Business Unit The Partnership processed 15,962 items of correspondence including 5,365 web challenges, 2,268 paper challenges, 168 web reps, 1,359 scanned representations (this includes those for where the registered keeper was not the owner of the vehicle at the time of the contravention, lease companies replying, etc). There were 27,535 items of correspondence sent out relating to PCNs including 4,937 Charge Certificates, 7,834 Notices to Owners, 4,350 Orders for Recovery and 871 Postal PCNs.
Split of incoming Correspondence by digital/paper
0
2000
4000
6000
8000
10000
12000
Web Paper Web Reps ScannedReps
Other
Incoming correspondence by year
2012/13
2013/14
2014/15

Page 13 of 21
Traffic Penalty Tribunal “Appeal” statistics The table below describes the 25 cases which were taken to Appeal (in front of an Independent Parking Adjudicator) and the outcomes of the cases. Just 0.02% of all PCNs issued (25 out of 59,517) ended up at formal Appeal.
Authority Total to Appeal
Allowed No
Contest Dismissed
Order by Consent
Pending
Braintree 5 3 2 0 0 0 Colchester 7 0 2 4 1 0 Harlow 4 1 2 1 0 0 Tendring 4 1 2 1 0 0 Uttlesford Epping
3 2
1 0
2 2
0 0
0 0
0 0
Totals 25 6 12 6 1 0
Totals for
motorist 18 for council 7
0%
10%
20%
30%
40%
50%
60%
70%
80%
90%
100%
2012/13 2013/14 2014/15
Paper
Web
0
2000
4000
6000
8000
10000
12000
14000
16000
18000
20000
NtO CC OFR Postal Camera Other
Outgoing Correspondence by year
2012/13
2013/14
2014/15

Page 14 of 21
Statistical information for Bus Lane and Moving Traffic PCNs It is not required to report on these since this organisation does not undertake any of the enforcement described.
Statistical Returns for Enforcement Activity
Local Authority parking providers are required to publish statistics relating to their enforcement activity. The rows shown in bold blue text are statutory indicators, and the rows in black text are additional indicators recommended to be given. These details are given in the tables on the pages below. The statistics, when balanced out by the number of employees, have remained quite static for a third year.

Page 15 of 21
Table 1
ISSUED PCNs
Comparison with 2013/14
report year
2014/15 figures
Description
On Street
2013/14
Off Street
2013/14
CCTV On
Street 2014/15
Off Street
2014/15
CCTV
Total 2012/13
Total 2013/14
2014-15
(included in columns to the left)
(included in
columns to the left)
Number of PCNs Issued 59,517 72,055 61,674
51,534 20,379 142 45,159 16,515 326
Number of higher level PCNs issued 38,056 43,060 37,789
41,412 1,506 142 36,226 1563 326
Number of lower level PCNs issued 21,351 28,995 23,885
10,122 18,873 0 8,933 14,952 0
Percentage of higher level PCNs issued 52.80% 59.76% 61.27%
80.36% 7.39% 100.00% 80.22% 9.47% 100%
Percentage of lower level PCNs issued 48.53% 40.24% 38.73%
19.64% 92.61% 0.00% 19.78% 90.53% 0
Number of Reg 9 PCNs issued 58,172 70,161 61,348
49,858 20,303 0 44,833 16,515 0
Number of Reg 10 PCNs issued 1145 1752 1609
1,676 76 0 1,522 87 326

Page 16 of 21
Table 2
PCNs PAID
Comparison with 2013/14
report year
2014/15 figures
Description On
Street 2013/14
Off Street
2013/14
CCTV On Street
2014/15
Off Street
2014/15
CCTV
Total
2012/13 Total
2013/14
2014-15
(included in columns to the left)
(included in columns to the left)
Number of PCNs paid 38,988 54,996 46,561
38,952 16,008 36 34,000 12,497 64
Number of PCNs paid which were issued at the lower band
7,970 22,852 18,549
7,970 14,882 0 7,138 11,411 0
Number of PCNs paid which were issued at the higher band
31,018 32,144 28,012
30,982 1,126 36 26,862 1086 64
Percentage of PCNs paid which were issued at the lower band
37.33% 41.55% 39.84%
78.74% 75.85% 0.00% 20.99% 91.31% 0.00%
Percentage of PCNs paid which were issued at the higher band
81.51% 58.45% 60.16%
74.81% 74.77% 100.00% 79.01% 8.69% 100.00%
Number of PCNs paid at discount rate (i.e. within 14 days)
34,159 48,319 40,627
34,129 14,160 30 29,664 10,902 61
Number of PCNs paid at full rate 3708 5141 4571
3,708 1,433 0 3,344 1,227 0
Number of PCNs paid after Charge Certificate served (i.e. at increased rate)
1096 1501 1342
1093 405 3 974 365 3
Percentage of PCNs paid at Charge Certificate 1.84% 2.73% 2.88%
2.81% 2.53% 8.33% 2.86% 2.92% 4.69%
Number of PCNs paid at another rate (e.g. negotiated with bailiff, etc).
22 31 21
22 9 0 18 3 0
Percentage of PCNs paid 65.51% 76.33% 75.50%
75.56% 78.55% 25.35% 75.29% 75.67% 19.63%
Percentage of PCNs paid at discount rate 57.39% 87.86% 87.26%
87.61% 88.45% 83.33% 87.25% 87.24% 95.31%

Page 17 of 21
Table 3
PCNs CHALLENGED
Comparison with 2013/14
report year
2014/15 figures
Description On
Street 2013/14
Off Street
2013/14
CCTV On
Street 2014/15
Off Street
2014/15
CCTV
Total
2012/13 Total
2013/14
2014-15
(included in
columns to the left)
(included in
columns to the left)
Number of PCNs cancelled as a result of an informal or a formal representation
3,071 5,174 4,129
3038 2136 2,215 1,914 15
Number of PCNs against which an informal or formal representation was made
11,336 17,084 15,209
10,886 6,198 9,832 5,377 24
Number of PCNs where informal representations are made
9,243 14,217 12,741
8,982 5,235 7,984 4,757 4
Number of formal representations received N/A 2,532 2,468
1,904 628 1,848 620 20
No of NTOs issued 11,842 13,329 13,694
10,101 3,228 10,366 3,328 0
Percentage of PCNs cancelled at any stage. 12.39% 7.18% 6.69%
4.90% 11.59% 4.60%
Number of PCNs written off for other reasons (e.g. CEO error or driver untraceable)
2,741 5,318 4,803
3,385 1,418
31
(213 others
not issued)
Number of vehicles immobilised 0 0 0
0 0 0 0 0 0
Number of vehicles removed. 0 0 0
0 0 0 0 0 0
Percentage of PCNs written off for other reasons (e.g. CEO error or driver untraceable)
9.50% 7.38% 7.79%
7.50% 8.60% 14.00%

Page 18 of 21
Table 4
APPEALS TO THE TRAFFIC PENALTY TRIBUNAL
Comparison with 2013/14
report year
2014/15 figures
Description On
Street 2013/14
Off Street
2013/14
CCTV On
Street 2014/15
Off Street
2014/15
CCTV
Total
2012/13 Total
2013/14
2014-15
(included in
columns to the left)
(included in
columns to the left)
Number of appeals to adjudicators 25 58 103
50 8 0 71 32 0
Number of appeals refused 6 16 29
13 3 0 20 9 0
Number of appeals non-contested (i.e. NEPP does not contest)
12 24 50
21 3 0 31 19 0
Percentage of cases to appeal 0.01% 0.08% 0.17%
0.10% 0.04% 0 0.16% 0.19% 0
Percentage of formal representations that go to appeal
N/A 2.29% 4.17%
2.63% 1.27% 0 3.84% 5.16% 0
Percentage of appeals allowed in favour of the appellant
52.00% 31.03% 23.30%
24.00% 25.00% 0 28.17% 12.50% 0
Percentage of appeals dismissed 24.00% 27.59% 28.16%
26.00% 37.50% 0 28.17% 28.13% 0
Percentage of appeals to Traffic Penalty Tribunal that are not contested and reasons
48.00% 41.38% 48.54%
42.00% 37.50% 0 43.66% 59.38% 0
Page 19 of 21
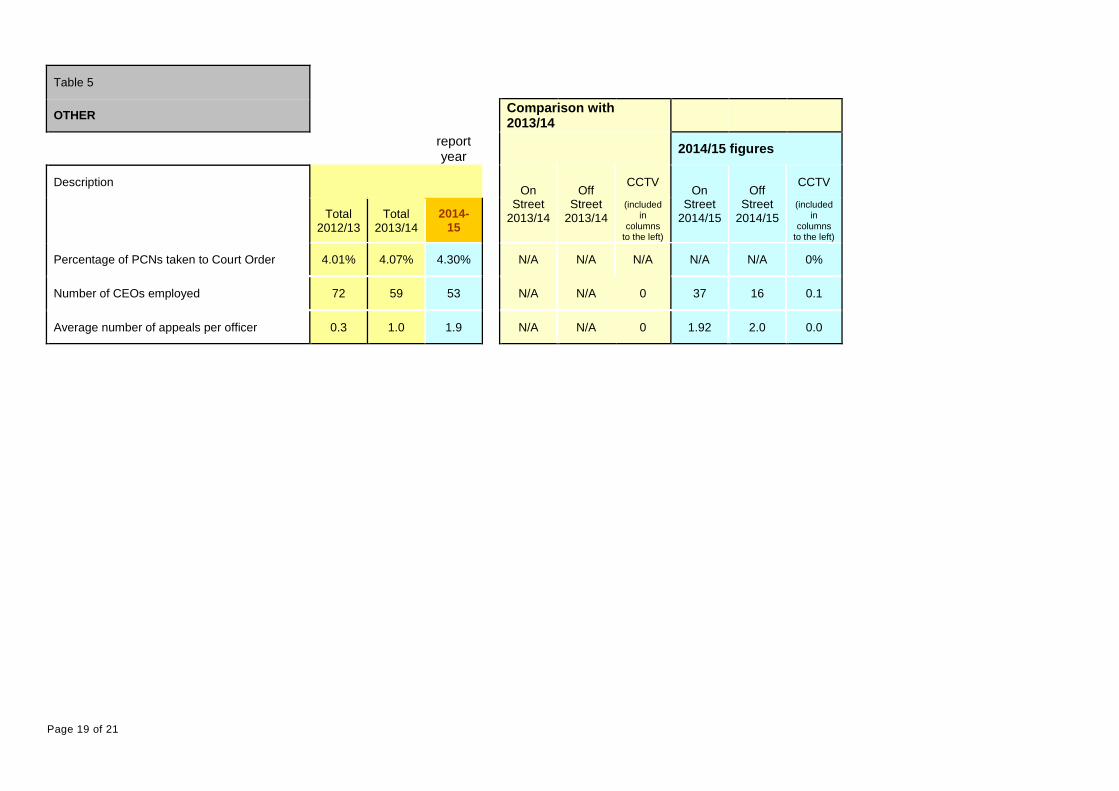
Table 5
OTHER
Comparison with 2013/14
report year
2014/15 figures
Description On
Street 2013/14
Off Street
2013/14
CCTV On
Street 2014/15
Off Street
2014/15
CCTV
Total
2012/13 Total
2013/14
2014-15
(included in
columns to the left)
(included in
columns to the left)
Percentage of PCNs taken to Court Order 4.01% 4.07% 4.30%
N/A N/A N/A N/A N/A 0%
Number of CEOs employed 72 59 53
N/A N/A 0 37 16 0.1
Average number of appeals per officer 0.3 1.0 1.9
N/A N/A 0 1.92 2.0 0.0

Page 20 of 21
NEPP: Outturn 2014/2015 & Budget 2015/16 Appendix A
On-street Account 2014/2015 2014/2015 2014/2015 2015/16
Actual
out-turn
Budget to
out-turnVariance Budget
Note
Expenditure
Direct costs
Employee costs:
Management 58 63 73 (10) 58 Parking Services Mgt Team staff costs
CEOs & Supervision 1,031 992 1,069 (78) 1,129 CEOs & Supervisor staff costs
Back Office 266 265 257 8 274 Back Office staff costs
TRO's 80 83 84 (1) 78 TRO team staff costs
Premises costs 10 19 8 11 13 R&M budget (small expenditure anticipated)
Transport costs (running costs) 29 36 36 - 38 Fuel, public transport etc
Supplies & Services 195 178 195 (17) 161 General expenditure
Third Party Payments 41 39 35 4 35 Chipside and TEC bureau costs
1,711 1,674 1,758 (83) 1,785
Non-direct costs
Accommodation 62 33 58 (25) 39 Accommodation
Other Support Services 133 156 148 8 171 Accountancy, HR, insurance, HoS, etc
Cash Office & Receipting & Postage 45 29 32 (3) 24 Cash Office & postage
Communications 14 14 18 (5) 18 Communications
Fleet contract hire 54 41 45 (3) 55 Fleet costs
IT 73 115 66 49 109 IT costs
382 387 367 21 415
Total Expenditure 2,093 2,062 2,124 (62) 2,200
Income
Penalty Charges (PCNs) (1,649) (1,512) (1,531) 19 (1,603) PCNs
Parking Permits/Season Tickets (431) (462) (401) (61) (417) Visitor Permits / Season tickets
Parking Charges (P&D etc) (158) (157) (168) 11 (180) Pay & Display charges
Other income (6) (1) - (1) - Misc reimbursements from partners
Total Income (2,245) (2,133) (2,100) (32) (2,200)
Deficit / (Surplus) (152) (71) 24 (94) -
transfer to reserve
2013/14 Actual
Page 21 of 21
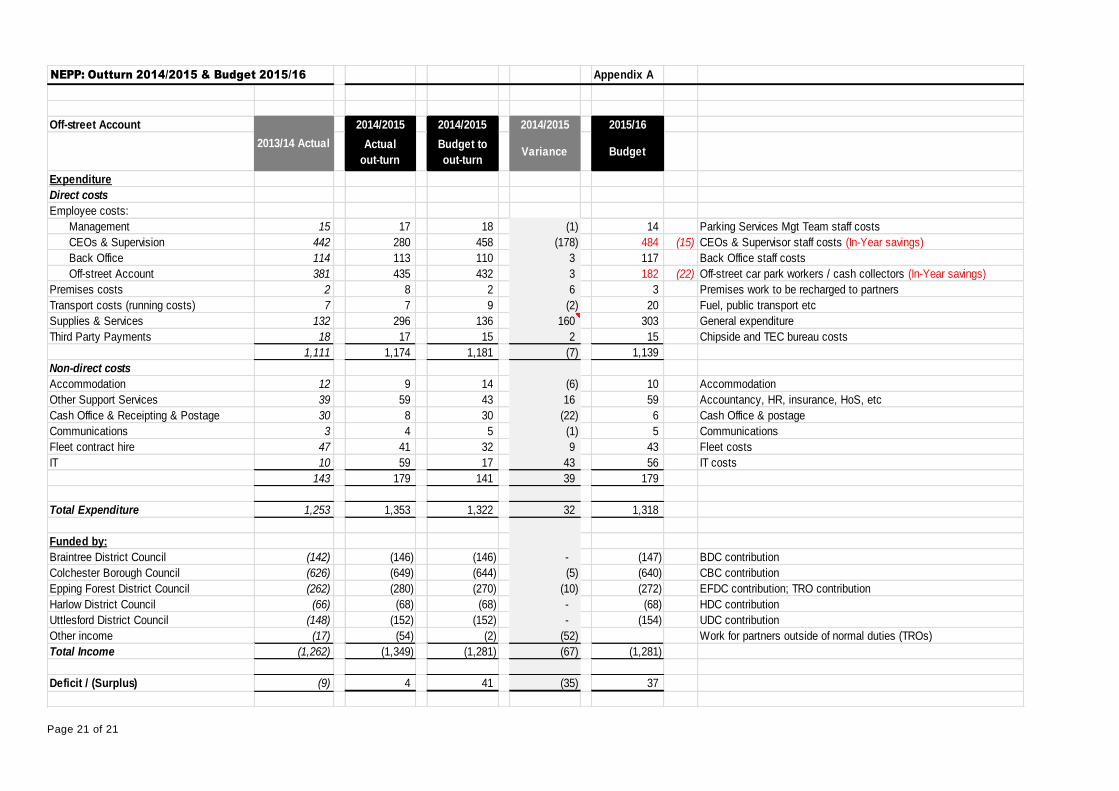
NEPP: Outturn 2014/2015 & Budget 2015/16 Appendix A
Off-street Account 2014/2015 2014/2015 2014/2015 2015/16
Actual
out-turn
Budget to
out-turnVariance Budget
Expenditure
Direct costs
Employee costs:
Management 15 17 18 (1) 14 Parking Services Mgt Team staff costs
CEOs & Supervision 442 280 458 (178) 484 (15) CEOs & Supervisor staff costs (In-Year savings)
Back Office 114 113 110 3 117 Back Office staff costs
Off-street Account 381 435 432 3 182 (22) Off-street car park workers / cash collectors (In-Year savings)
Premises costs 2 8 2 6 3 Premises work to be recharged to partners
Transport costs (running costs) 7 7 9 (2) 20 Fuel, public transport etc
Supplies & Services 132 296 136 160 303 General expenditure
Third Party Payments 18 17 15 2 15 Chipside and TEC bureau costs
1,111 1,174 1,181 (7) 1,139
Non-direct costs
Accommodation 12 9 14 (6) 10 Accommodation
Other Support Services 39 59 43 16 59 Accountancy, HR, insurance, HoS, etc
Cash Office & Receipting & Postage 30 8 30 (22) 6 Cash Office & postage
Communications 3 4 5 (1) 5 Communications
Fleet contract hire 47 41 32 9 43 Fleet costs
IT 10 59 17 43 56 IT costs
143 179 141 39 179
Total Expenditure 1,253 1,353 1,322 32 1,318
Funded by:
Braintree District Council (142) (146) (146) - (147) BDC contribution
Colchester Borough Council (626) (649) (644) (5) (640) CBC contribution
Epping Forest District Council (262) (280) (270) (10) (272) EFDC contribution; TRO contribution
Harlow District Council (66) (68) (68) - (68) HDC contribution
Uttlesford District Council (148) (152) (152) - (154) UDC contribution
Other income (17) (54) (2) (52) Work for partners outside of normal duties (TROs)
Total Income (1,262) (1,349) (1,281) (67) (1,281)
Deficit / (Surplus) (9) 4 41 (35) 37
2013/14 Actual


