North Sea Flow Measurement Workshop 2005 Volker Herrmann, Toralf Dietz, Andreas Ehrlich, SICK MAIHAK Peter Stoll, Heiko Slawig, Verbundnetz Gas AG The use of an Ultrasonic „Transfer reference meter“ to investigate differences of two gas meters in series in fiscal natural gas measurement. Custody transfer meter station design often requires the use of two gas flow meters: The duty meter, and the reference meter. Both meters have to meet custody transfer requirements and therefore have a low measurement uncertainty. These type of installations ensure availability, redundancy and the on-line verification of the measurement. The standard installation procedure for such meter stations includes a high-pressure calibration for both meters that normally should provide a “zero” difference between the readings. Even at proper station design in a few cases unacceptable deviations can be found directly after field installation of the meter. If there is not a simple reason, often the only appropriate measure is nowadays to check the high pressure calibration of the meters in an official laboratory. Even this extremely expensive and time consuming measure does not always guarantee success since possible installation effects will not be detected this way. Another possibility is to define a “transfer reference meter package”, using one or two different state-of-the-art gas flow meters. A “transfer reference meter” is considered to be a calibrated meter with the highest achievable insensitivity to installation effects and long term stability. This paper introduces the use of an Ultrasonic 8 path „Transfer reference meter“ and a reference meter of another technology to investigate differences as high as 0,8% in a German custody transfer station. This method can be used much more effectively since none of the meters under question needs to be taken out of operation or sent back. Additionally, using the more detailed profile information gained from an 8 path meter it is possible to investigate installation effects and detect sources of the deviations. First results of the investigation of the above mentioned station will be shown and discussed. Possible ways of using transfer reference meters of different technologies and their advantages and drawbacks are also considered. 113
Transcript
North Sea Flow Measurement Workshop 2005
Volker Herrmann, Toralf Dietz, Andreas Ehrlich, SICK MAIHAK
Peter Stoll, Heiko Slawig, Verbundnetz Gas AG
The use of an Ultrasonic „Transfer reference meter“ to investigatedifferences of two gas meters in series in fiscal natural gas measurement.
Custody transfer meter station design often requires the use of two gas flow meters: The dutymeter, and the reference meter. Both meters have to meet custody transfer requirements andtherefore have a low measurement uncertainty. These type of installations ensure availability,redundancy and the on-line verification of the measurement.
The standard installation procedure for such meter stations includes a high-pressurecalibration for both meters that normally should provide a “zero” difference between thereadings. Even at proper station design in a few cases unacceptable deviations can be founddirectly after field installation of the meter. If there is not a simple reason, often the onlyappropriate measure is nowadays to check the high pressure calibration of the meters in anofficial laboratory. Even this extremely expensive and time consuming measure does notalways guarantee success since possible installation effects will not be detected this way.
Another possibility is to define a “transfer reference meter package”, using one or twodifferent state-of-the-art gas flow meters. A “transfer reference meter” is considered to be acalibrated meter with the highest achievable insensitivity to installation effects and long termstability.
This paper introduces the use of an Ultrasonic 8 path „Transfer reference meter“ and areference meter of another technology to investigate differences as high as 0,8% in a Germancustody transfer station. This method can be used much more effectively since none of themeters under question needs to be taken out of operation or sent back. Additionally, using themore detailed profile information gained from an 8 path meter it is possible to investigateinstallation effects and detect sources of the deviations.
First results of the investigation of the above mentioned station will be shown and discussed.Possible ways of using transfer reference meters of different technologies and theiradvantages and drawbacks are also considered.
113
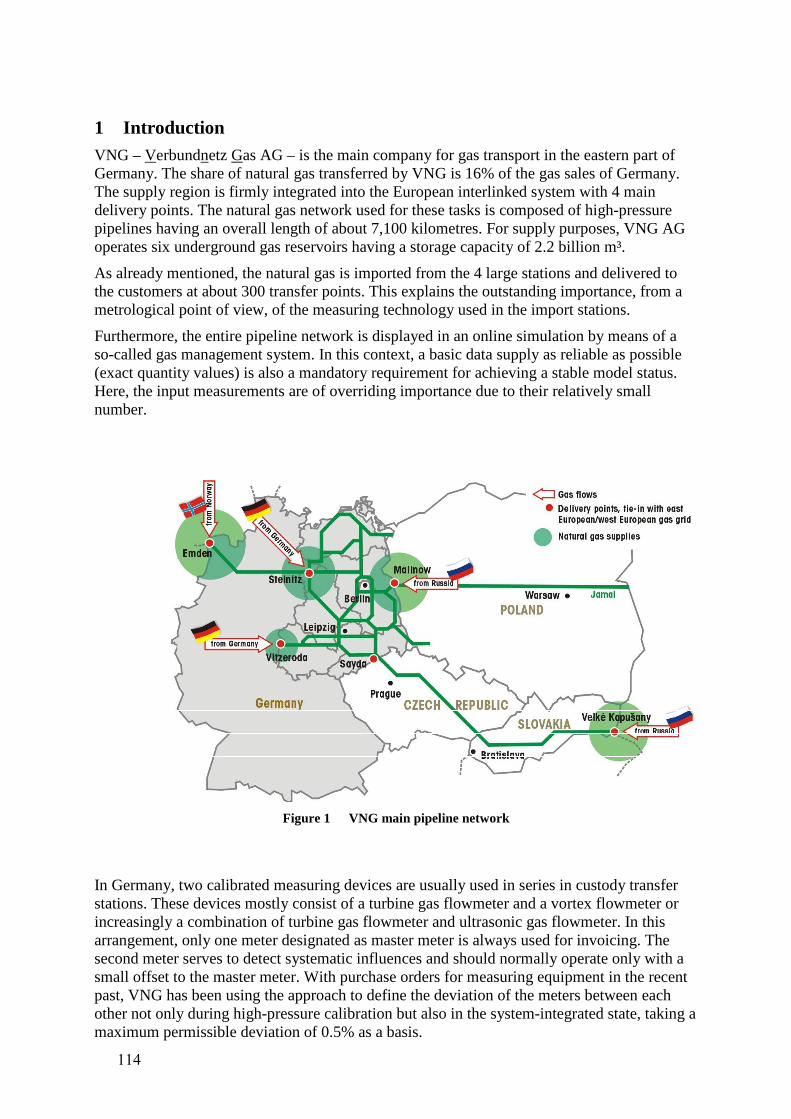
1 IntroductionVNG – Verbundnetz Gas AG – is the main company for gas transport in the eastern part ofGermany. The share of natural gas transferred by VNG is 16% of the gas sales of Germany.The supply region is firmly integrated into the European interlinked system with 4 maindelivery points. The natural gas network used for these tasks is composed of high-pressurepipelines having an overall length of about 7,100 kilometres. For supply purposes, VNG AGoperates six underground gas reservoirs having a storage capacity of 2.2 billion m³.
As already mentioned, the natural gas is imported from the 4 large stations and delivered tothe customers at about 300 transfer points. This explains the outstanding importance, from ametrological point of view, of the measuring technology used in the import stations.
Furthermore, the entire pipeline network is displayed in an online simulation by means of aso-called gas management system. In this context, a basic data supply as reliable as possible(exact quantity values) is also a mandatory requirement for achieving a stable model status.Here, the input measurements are of overriding importance due to their relatively smallnumber.
Figure 1 VNG main pipeline network
In Germany, two calibrated measuring devices are usually used in series in custody transferstations. These devices mostly consist of a turbine gas flowmeter and a vortex flowmeter orincreasingly a combination of turbine gas flowmeter and ultrasonic gas flowmeter. In thisarrangement, only one meter designated as master meter is always used for invoicing. Thesecond meter serves to detect systematic influences and should normally operate only with asmall offset to the master meter. With purchase orders for measuring equipment in the recentpast, VNG has been using the approach to define the deviation of the meters between eachother not only during high-pressure calibration but also in the system-integrated state, taking amaximum permissible deviation of 0.5% as a basis.
114
-2-
In the present case, this value is not kept over the entire measuring range in a measuringinstallation. Deviations occur that represent either too large an offset or a non-linearbehaviour of the meters. It is assumed that these are the result of system influences whichaffect the primary measurement, despite compliance with all statutory requirements.
In the previous course of diagnosing such deviations, it has turned out to be very difficult todetect the affected meter in measuring installations and - even more important - to convincethe supplier of a possible malfunction, if applicable. Depending on the „know how“ or thewillingness of individual firms, troubleshooting and fault detection thus develops into a verylengthy process in most cases.
To date, the next most obvious action in such a case was to retest the meters under high-pressure conditions at a test lab and to calibrate them again. Depending on the magnitude ofthe system influence, however, satisfactory results can be achieved only very rarely, inaddition to the very high cost.
At this stage, the only remaining solution is:
1) to ignore the error, unless it is relevant with regard to invoicing, or
2) to apply other meter technologies at a high cost.
In this context, the logic is to use a kind of portable calibration package for natural gas forfault detection and/or fault assessment, similar to the approach with liquids, e.g. oil.
1.1 Approach to Problem Solution
The possible solution of the above-mentioned problems, presented here, is a „referencemeter section“ that is in this case installed instead of a control section downstream of theprimary measurement.
The basic principle was the detection, or elimination, of possible system influences since insuch a case no improvement of the measuring characteristics can be expected from therenewed high-pressure tests. With respect to possible system influences, special attention hasbeen given to the flow pattern (asymmetry, swirl) and pulsations. Resulting from thisinformation, a selection of the gas meter technologies to be applied was made.
Alternative variants, such as examinations of flow, pulsation and profile, do not constitute anyalternative, neither in terms of time nor in terms of costs, except in simple cases.
As a result of the pro's and con's shown in table 1, the decision was made to use both theultrasonic-type and the Coriolis gas flowmeter for the set-up of the portable reference metersection. During the first investigation phase, a turbine gas flowmeter was temporarily used as3rd measuring system for referencing and plausibility analysis, of the results. This will not berequired anymore in the final state of the reference meter section.
The reasons for the use of the ultrasonic gas flowmeter are primarily to be found in its well-known stability with undisturbed conditions, as compared to a turbine gas flowmeter, and inits outstanding diagnostic capabilities. Thus, the selected 8-path design allows a very specificstatement as to swirl and flow pattern. Furthermore, it is now possible to compare themeasured sound velocity of the ultrasonic gas flowmeter with those calculated from the gascomposition, provided by a gas chromatograph.
A Coriolis meter was selected for the second measuring method. To date, only very limitedexperiences has been gained on its use in natural gas; however, this is acceptable within thescope of this investigation. This meter commends itself because of its also very compact fittedlength and the expected accuracy.
115
-3-
Overloadwithstandcapability
Flowpattern,swirl
Pulsation,mech.vibrations
Gascontami-nation
Remarks
Orificeplate � � � �
long upstream lengthrequired,small measuring range
Vortexflowmeter ☺ � � �
long upstream lengthrequired
Turbinegas meter � � � �
Established measuringsystem, multiple years ofpractical experience,extensively researched
Ultrasonicgas meter ☺ � ☺ ☺
4-path design can compen-sate for asymmetry andswirl, but only 8-path designallows quantitativediagnosis
Coriolisgas flowmeter
☺ ☺ ☺ �abrasive influences of thegas flow, mechanical
changes
Table 1 Technology overview and weighting from a user's point of view
The „reference meter section“ installed at VNG is shown below. All three meters mentionedabove were installed at the mounting location in the position of a vortex flowmeter (Figure 2)belonging to a control section. The old control section was completely removed and replacedby the reference meter section (Figure 3).
Figure 2 Meter section with vortex flowmeterprior to modification
Figure 3 Installed reference meter section withCoriolis, ultrasonic and turbine gasmeters (from left to right)
116
-4-
2 Technology and Calibration of the Reference Meters
2.1 8-Path Ultrasonic Flow Measuring System
2.1.1 Description
Standard components of the FLOWSIC 600 gas meter series were used for the 8-pathultrasonic measuring system. The arrangement of 4 additional measuring paths was inparticular enabled by the meter body’s symmetric construction, which was selected for thestability of the meter body geometry with respect to pressure and temperature (Figure 4).Miniaturised ultrasonic sensors ensure that the flow in the measuring section is influenced to aminimum extent only.
Figure 4 Arrangement of the 8 ultrasonicmeasuring paths
Figure 5 Distribution of measuring path levelsover the cross section
The geometric position of the measuring path levels (Figure 5) has been maintained,exclusively to the FLOWSIC 600, since this layout provides a very good compensation for theflow pattern [1]. This completely symmetric 8-path arrangement creates 2 paths on exactly thesame path level, and thus measurements are taken on the same level in the flow pattern. Dueto the fact that the path angles are inverse to each other, tangential components are recordedwith opposite sign. This enables a precise and transparent computation of these components.The additional measuring paths make it possible do show precise detailed information onlocal gas velocity components and to detect the possible causes of deviating measurements.As will be shown hereinafter, the FLOWSIC 600 may thus be calibrated on completely thesame standard on air test stands under ambient conditions as well as under high-pressureconditions. The main focus within the scope of this paper, however, has been put on the usefor diagnostic purposes.
The measuring result of an ultrasonic path is determined by the local velocity components inaxial and tangential direction within the integration range of the ultrasonic signals. Figure 6 issupposed to serve for elucidation. The axial component, in the direction of the pipe axis, is theessential velocity component. Its value is determined by the gas transport. The tangentialcomponent is rectangular to the axial one. Tangential components represent swirl-subjected,rotating flows. This rotation is virtually always caused by the customary pipe fitting elements
117
-5-
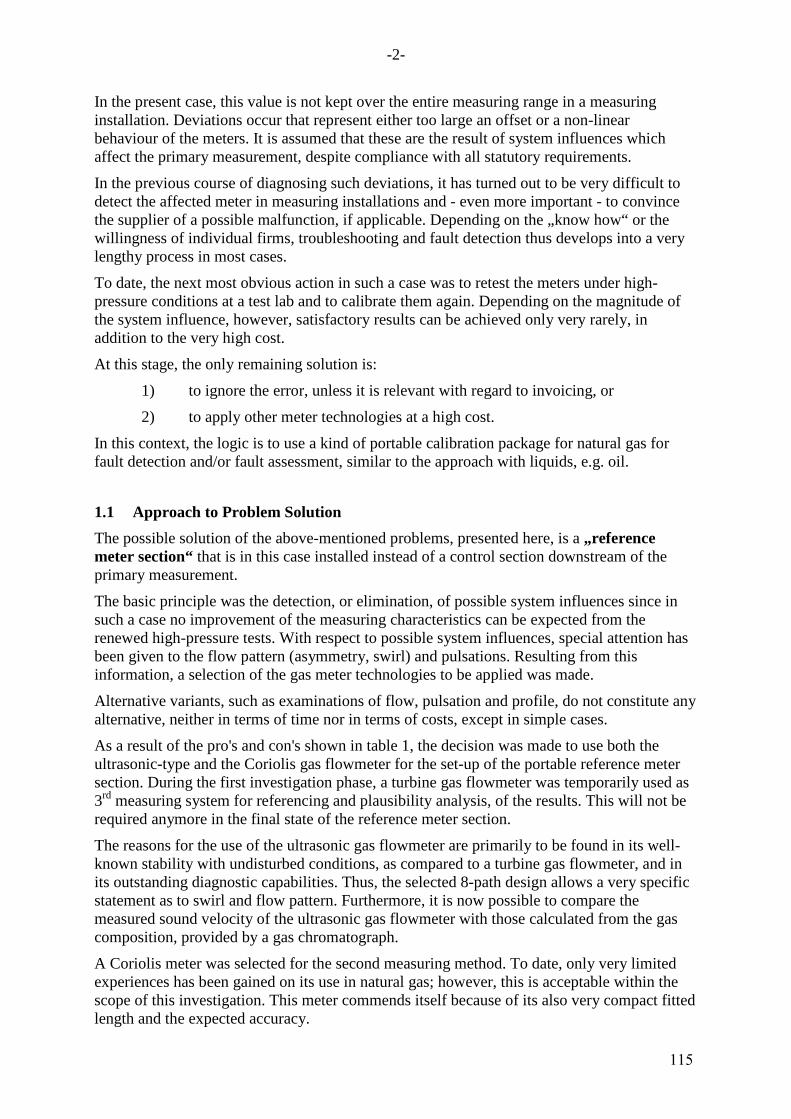
(double elbows out of plane, U-turns, T-fittings), but may be dampened effectively by suitablemeasures such as flow straighteners).
flow
Vtangential
VaxialVsound
Vsound
meter body bore 2.A
1.A 2.B
1.B
α
α
Figure 6 Schematic diagram
Referring to Figure 6, the following is to illustrate the influence of the tangential velocitycomponent. The ultrasonic sensors of the system 1 (sensor 1.A and 1.B) are arranged at anangle α to the pipe axis. The distance between the sensor membranes defines the length of themeasuring path (L1). Accordingly, system 2 is characterised by the sensors 2.A and 2.B,angle α to the pipe axis, and the length of the measuring path L2. As is well known, thetransmitted signals propagate at the sound velocity of the medium. Taking account of thetangential velocity component, as shown in the figure, the signal transit time between thesystem 1 sensors is then defined by:
))tan(()cos( tangential
11,1 αα ⋅+⋅±
=vvv
Lt
axialsoundbaab
For system 2, comparable conditions are the result, only the sign of the tangential velocitycomponent is changed. Consequently, the signal transit time for system 2 is defined by:
))tan(()cos( tangential
22,2 αα ⋅−⋅±
=vvv
Lt
axialsoundbaab
By calculating the signal transit time difference, it can then be demonstrated for the flowvelocity of system 1 that the following is valid:
When this logic is applied to all four measuring paths it is possible to demonstrate theasymmetry and swirl of the flow pattern and to use them for diagnostic purposes.
2.1.2 Calibration
In order to be able to use the reference meter section as universally as possible, it isparticularly interesting to perform the calibration in a wide Reynolds' number range. This canbe achieved when the flowmeter is calibrated both on a low-pressure test stand (air, ambientconditions) and a high-pressure test stand. If a relation of the low-pressure and high-pressurecharacteristic curves can be established, it will be possible to retest the reference meter sectionmore cost-effectively in the future. The retest on a low-pressure test stand would then besufficient to deduce the high-pressure characteristic curve.
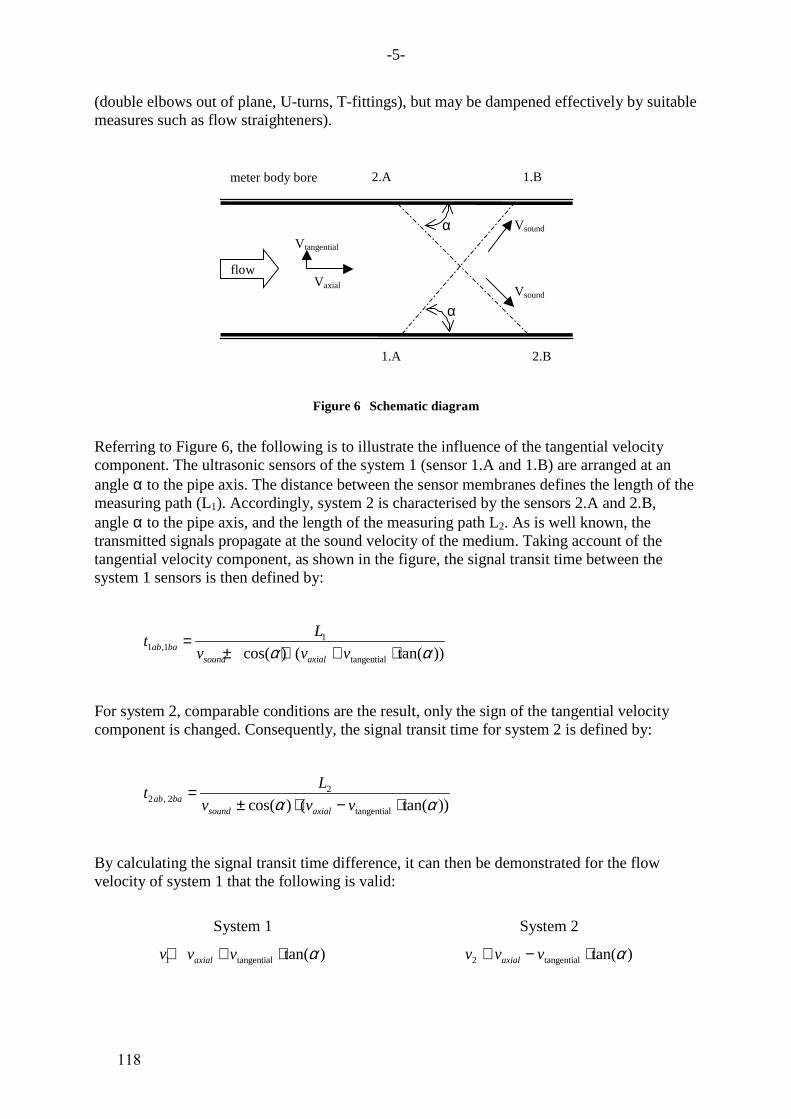
For ensuring that only measurement errors allocated to the flow pattern are identified duringflow calibration, the sound velocity has to be verified in advance. Only if the set geometricand time parameter values correspond to reality the measured sound velocity will be in linewith the velocity computed theoretically. This would ensure independence from gas type andgas state (in this case air and natural gas). The determined deviations between the measuredsound velocities, seen in relation to those computed theoretically from the gas analysis, aredepicted in Figure 7 for the tested ultrasonic measuring system. The SonicWare softwarewas used to compute the theoretical sound velocity. The set of formulae has been standardisedand documented in the A.G.A. Report No. 10.
Velocity of Sound Deviation
-0.15
-0.10
-0.05
0.00
0.05
0,.0
0.15
0 500 1000 1500 2000 2500
flow rate [m³/h]
devi
atio
n [%
]
NG @ 50bar, 391m/s Air @ ambient, 345m/s
Figure 7 Illustration of the relative deviation ofthe measured sound velocity from thatcomputed theoretically
Final Acceptance Test FLOWSIC600SN #05188708, Air VoS th = 345.07m/s
-0.10
-0.05
0.00
0.05
0.10
devi
atio
n V
oS [%
]
System 1 -0.01 0.04 0.03 -0.01
System 2 -0.02 0.02 0.01 -0.03
Path 1 Path 2 Path 3 Path 4
Figure 8 Illustration of the relative deviation of thesound velocity measurement during finalinspection prior to delivery
All determined deviations between the measured and the theoretically computed soundvelocities are in a range of ±0.1%, at average sound velocities of 345m/s (air) and 391m/s(natural gas). Thus, the stability of the geometric and time parameters over a wide workingrange has been proven.
119
-7-
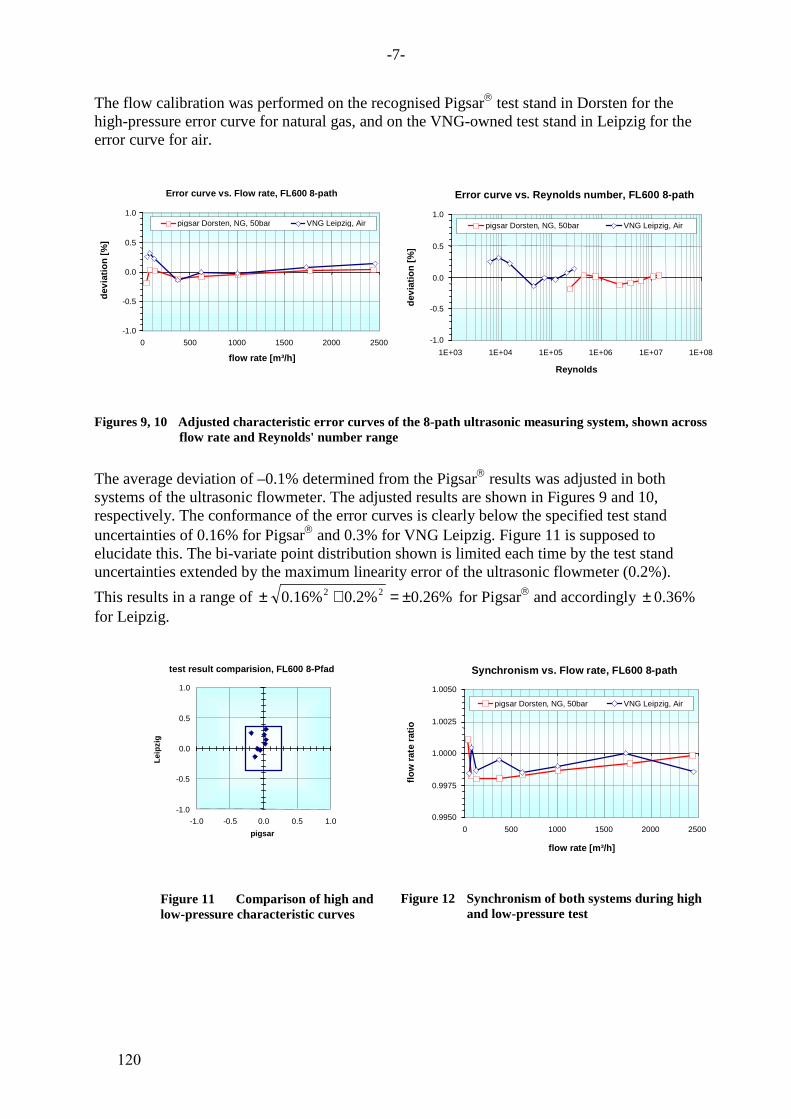
The flow calibration was performed on the recognised Pigsar test stand in Dorsten for thehigh-pressure error curve for natural gas, and on the VNG-owned test stand in Leipzig for theerror curve for air.
Error curve vs. Flow rate, FL600 8-path
-1.0
-0.5
0.0
0.5
1.0
0 500 1000 1500 2000 2500
flow rate [m³/h]
devi
atio
n [%
]
pigsar Dorsten, NG, 50bar VNG Leipzig, Air
Error curve vs. Reynolds number, FL600 8-path
-1.0
-0.5
0.0
0.5
1.0
1E+03 1E+04 1E+05 1E+06 1E+07 1E+08
Reynolds
devi
atio
n [%
]
pigsar Dorsten, NG, 50bar VNG Leipzig, Air
Figures 9, 10 Adjusted characteristic error curves of the 8-path ultrasonic measuring system, shown acrossflow rate and Reynolds' number range
The average deviation of –0.1% determined from the Pigsar results was adjusted in bothsystems of the ultrasonic flowmeter. The adjusted results are shown in Figures 9 and 10,respectively. The conformance of the error curves is clearly below the specified test standuncertainties of 0.16% for Pigsar and 0.3% for VNG Leipzig. Figure 11 is supposed toelucidate this. The bi-variate point distribution shown is limited each time by the test standuncertainties extended by the maximum linearity error of the ultrasonic flowmeter (0.2%).
This results in a range of %26.0%2.0%16.0 22 ±=+± for Pigsar and accordingly %36.0±for Leipzig.
test result comparision, FL600 8-Pfad
-1.0
-0.5
0.0
0.5
1.0
-1.0 -0.5 0.0 0.5 1.0
pigsar
Leip
zig
Figure 11 Comparison of high andlow-pressure characteristic curves
Synchronism vs. Flow rate, FL600 8-path
0.9950
0.9975
1.0000
1.0025
1.0050
0 500 1000 1500 2000 2500
flow rate [m³/h]
flow
rat
e ra
tio
pigsar Dorsten, NG, 50bar VNG Leipzig, Air
Figure 12 Synchronism of both systems during highand low-pressure test
120
-8-
2.2 Coriolis Gas Meter
Due to the experience already gained by the Emerson company in the field of gasmeasurement, a CMF400 of the Micro Motion Elite series was selected as the Coriolis gasmeter. Its outstanding features are its compact construction, very good repeatability and thespecifications that are very suitable for this type of application. The topics of zero drift,temperature and pressure sensitivity were intensively discussed in advance. The result of thisdiscussion was that these influences could be excluded as not being relevant. Furtherinformation may be found in [3] and [6].
The meter used was repeatedly calibrated on a water test stand in Veenendall (uncertainty <0.003%). Both tests performed produced an approximately identical result (<0.1%). Themeasuring range of 1:50 (Qmin/Qmax) required for the reference meter section has also beenadhered to with an adequate uncertainty.
Figure 13 Water calibration, calibration certificate
At the time, no further high-pressure calibration with natural gas was carried out. The resultsseem to support the possibility of such an approach. In the later course of the series ofmeasurements it is planned to verify the behaviour found in the 1st testing series both on ahigh-pressure test stand with natural gas and on an air test stand.
2.3 Turbine Gas Flowmeter
Since the turbine gas meter technology is well known, we have refrained from a detaileddescription within the scope of this paper. Detailed information on the turbine gas meter canbe found in [4].
In our case, the description of the calibration results are of more interest. The turbineflowmeter also was tested both in air and under high-pressure condition. Again, the adjustedfinal result of the calibration is shown. The average deviation of 0.34% determined in thehigh-pressure test was adjusted by changing the pulse significance.
121
-9-
Error curve vs. Flow rate, Turbine meter
-2.0
-1.5
-1.0
-0.5
0.0
0.5
1.0
1.5
2.0
0 500 1000 1500 2000 2500
flow rate [m³/h]
devi
atio
n [%
]
pigsar Dorsten, NG, 50bar Air @ ambient
Error curve vs. Reynolds number, Turbine meter
-2.0
-1.5
-1.0
-0.5
0.0
0.5
1.0
1.5
2.0
1E+03 1E+04 1E+05 1E+06 1E+07 1E+08
Reynolds
devi
atio
n [%
]
pigsar Dorsten, NG, 50bar Air @ ambient
Figures 14, 15 Adjusted characteristic error curve of turbine gas flowmeter, shown across flow rate andReynolds' number range
3 Signal Conditioning, Data AcquisitionAcquisition and conditioning of signals were done in different ways. First, each meter wasequipped with its own flow computer ([5], Figure 16). Through the archiving function ofthese flow computers, the measured data is available for remote data readout. In order to havea basis of comparison for the meters to each other, all values were related to the convertedvolume at base conditions. For the ultrasonic meter and the turbine meter, the standardvolume conversion is used, based on the gas state readings of a processed gas chromatograph(PGC). The PGC also provided the current value of the standard density required for theconversion of the mass information from the Coriolis gas meter. The station is equipped with2 PGCs that showed only minimum deviations during the test period.
Figure 16 Quantity weight converter and measured value registration for theremote data inquiry of the reference meter section
In parallel with this, the measuring and diagnostic data was recorded and archived via theserial interfaces of the ultrasonic measuring system.
122
-10-
4 ResultsIn Germany, larger stations are generally split into a primary and a secondary section wherethe primary and secondary meters – as described in chapter 1 – must be within the deviationband defined by the operator. If there are deviations in the installation between primary andsecondary meters, these can be diagnosed by means of the reference meter package described.The use of two additional independent measuring technologies allows conclusions to bedrawn as to which of the installed meters is out of specification and thus a targeted and cost-effective improvement of the situation is made possible.
This approach has been implemented within the scope of this project. Since the data collectedand conclusions drawn are not the sole property of VNG and SICK, they are not describedhere in detail. The installed reference meter section has clearly proven successful in thediagnosis of the deviations. The following will therefore address the technical observationsthat were obtained in the examination of the reference meter section while disregarding theprimary section.
The main part of the measuring results shown herein was recorded in the months of Augustand September. A period of about 2 weeks was needed until commissioning was satisfactory.During this period, primarily first statements as to the zero point stability and the signaloutput of the Coriolis gas meter as well as to the synchronism and/or the signal processing ofthe two ultrasonic meter electronics were made.
At the beginning of the measurement, a clear diurnal variation of the meters between eachother could be identified. The temperature, to be more precise, the not representativetemperature measurement, very quickly turned out to be one of the greatest influencingfactors. Among other things, for instance, the arrangement of the sensors between the turbinegas meter and the ultrasonic measuring system is not ideal. Even so, all these influencingvariables allowed the measurements to work within the required ±0.5% range so that theactual measuring programme could be started.
4.1 Plausibility Check of Sound Velocity
After commissioning of the „reference meter section“, the measured velocity of sound wasverified against the theoretical velocity of sound . On the first day , a provable differencebetween the velocities was established. A diurnal variation was also clearly identified in thedifference. This variation correlated very well with the direct solar radiation on the referencemeter section (Figure 17, 6th Sept. 2005). The protection of the temperature measuringlocation against direct solar radiation by an insulating mat produced a distinct improvement,although a diurnal variation in the measuring set-up is still visible (Figure 17, from 7th Sept.2005 onwards). While there were deviations of up to –0.15% caused by diurnal variation, thesmall deviation of less than ±0.05% observed earlier on the test stands were also reached inthe field operation after applying the insulation.
123
-11-
Velocity of Sound Trend
427.0
427.5
428.0
428.5
429.0
429.5
430.0
06.0
9.20
0506
:00
06.0
9.20
0518
:00
07.0
9.20
0506
:00
07.0
9.20
0518
:00
08.0
9.20
0506
:00
08.0
9.20
0518
:00
Vel
ocity
of S
ound
[m/s
] FLOWSIC 600 Gas analysis
Figure 17 Comparison of measured to theoreticalvelocity of sound
Velocity of Sound Deviation
-0.2
-0.1
0.0
0.1
0.2
06.0
9.20
05
06:0
0
06.0
9.20
0518
:00
07.0
9.20
05
06:0
0
07.0
9.20
05
18:0
0
08.0
9.20
0506
:00
08.0
9.20
05
18:0
0
rel.
devi
atio
n [%
]
Figure 18 Relative deviation between measured totheoretically computed velocity of sound
4.2 Flow Pattern, Swirl
For an effective and fast assessment it is necessary to convert the offered, path-position-related detailed information on the axial and tangential velocity components into adimensionless characteristic number. The swirl number Kν described in [2] is suitable for thispurpose. Taking the numeric weighting of the path positions into account, the general swirlnumber definition specified herein can be modified for the ultrasonic meter as follows:
==
=⋅
⋅⋅=
∑
∑
=
=
3and2for3618.0
4and1for1382.0
)( 24
1
4
1tangentiali
i
iw
vw
vvwK i
iaxiali
iaxiali
i
i
ν
Amongst other things, the characteristic numbers specified in the table were determined in [2]by systematic velocity profile measurements using the laser doppler anemometry. These canbe used to easily assess and classify the flow situation present.
From Figure 19 it can clearly be concluded that, on the test stands as well as in theinstallation, the swirl components are below those of disturbed flow situations by orders ofmagnitude. Virtually, a swirl-free flow can be assumed for the ultrasonic measuring system.
4.3 Comparison of Measuring Results
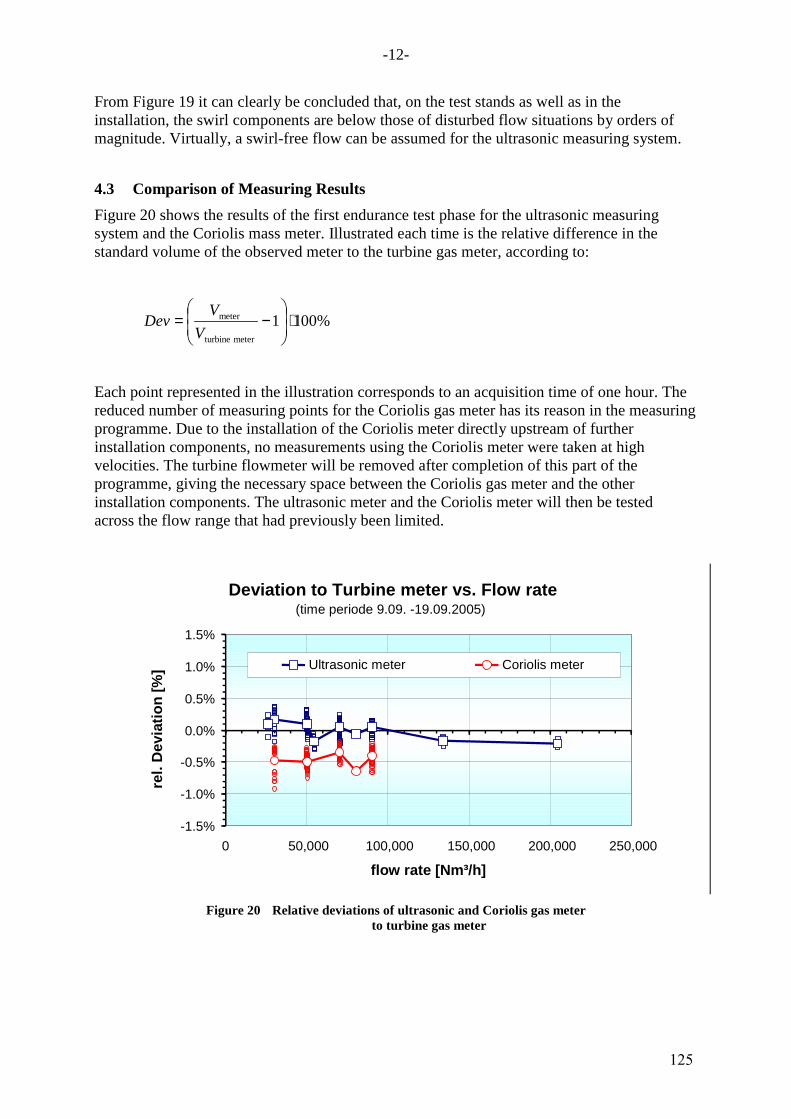
Figure 20 shows the results of the first endurance test phase for the ultrasonic measuringsystem and the Coriolis mass meter. Illustrated each time is the relative difference in thestandard volume of the observed meter to the turbine gas meter, according to:
%1001meterturbine
meter ⋅
−=
V
VDev
Each point represented in the illustration corresponds to an acquisition time of one hour. Thereduced number of measuring points for the Coriolis gas meter has its reason in the measuringprogramme. Due to the installation of the Coriolis meter directly upstream of furtherinstallation components, no measurements using the Coriolis meter were taken at highvelocities. The turbine flowmeter will be removed after completion of this part of theprogramme, giving the necessary space between the Coriolis gas meter and the otherinstallation components. The ultrasonic meter and the Coriolis meter will then be testedacross the flow range that had previously been limited.
Deviation to Turbine meter vs. Flow rate(time periode 9.09. -19.09.2005)
-1.5%
-1.0%
-0.5%
0.0%
0.5%
1.0%
1.5%
0 50,000 100,000 150,000 200,000 250,000
flow rate [Nm³/h]
rel.
Dev
iatio
n [%
]
Ultrasonic meter Coriolis meter
Figure 20 Relative deviations of ultrasonic and Coriolis gas meterto turbine gas meter
125
-13-
Taking account of the uncertainty still present at the current stage with respect to therepresentative temperature measurement , the following statements can be made:
1. Ultrasonic and turbine gas meter show the characteristic error curve determined duringthe joint calibration. The average deviations to each other are in the range of ±0.2%.
2. First of all, a stable offset of –0.5% to the turbine and ultrasonic gas meter must be statedfor the Coriolis flowmeter. In this context, it should be mentioned again at this point thatthis meter, as a mass meter, was calibrated with water only. An offset correction wasintentionally not made since the question of which meter has to be corrected in whichway can not be answered at present. A remedy would be the calibration of the Coriolismeter on a high pressure or low pressure test stand for natural gas. The clarification of theoffset will form part of the further programme. A retest on the SICK-MAIHAK air teststand in Dresden is planned at least for the reference meter section of ultrasonic andCoriolis flowmeters. There, the spatial and metrological conditions are available in orderto test the entire reference meter section.
In summary it can be said that the target requirements were complied with and „almost better“than expected performance by the reference meter section under adverse metrologicalconditions were achieved. All people involved assume that this meter section at this operatingsite may be used to 100% as a reference for other measurements!
As mentioned before, the crucial influence on the stability of the reference meter section isexercised by the temperature. Even with a temporary solution using makeshift insulation, theinfluence of temperature is still recognisable. This means that all meters, together with theirinlet lines, will have to be insulated when this reference meter section is to be used foroutdoor measurement. Moreover, the temperature measurement will have to be arranged closeto the relevant meter.
Using the diagnostic data from the ultrasonic gas meter, statements as to the flow and profilebehaviour within the reference meter section could be made and verified using appropriateevaluation methods. It has thus become possible to assess or evaluate system influences thatcannot be recorded during a high-pressure test, directly in the installation.
Due to the unique situation of being able to examine three meters, which are based physicallyon most different principles, simultaneously in one meter section, a great deal of data has beenrecorded, archived, and evaluated. Of course, a final evaluation without further work is notfeasible at present, as constantly new considerations also keep on raising new questions. Withthe time frame available, it was unfortunately not yet possible to answer all identifiedquestions. These would be, for example:
- Cause of the stable offset between ultrasonic/turbine gas meter and Coriolis gas meter
- Optimal arrangement of the temperature measuring points and reducing the influencecaused by the difference between gas temperature (about 22 °C) and fluctuatingambient temperature
- Diagnostic opportunities through „acoustic“ temperature computation based on themeasured sound velocities (temperature layering of the gas)
- Proof of system influences (none were identified in this case) or detection of normallyignored influences
- Which accuracy or reproducibility is attainable in the future, taking account of theaspects of long-term stability and portability of the reference meter section?
- Development of new re-calibration concepts for high-pressure natural gas facilities
126
-14-
On the part of VNG it can be stated that during the tests series no restrictions whatsoever as tothe Coriolis gas meter were recognisable. This means for the future that the permanent seriesconnection of ultrasonic and Coriolis meters will be an absolutely conceivable measuringapproach, particularly for bi-directional measurements.
5 Conclusion / OutlookThe use of a reference meter section integrating different measuring technologies fordiagnosing installation-conditional deviations under operational conditions has proven to bevery successful. The combination of metrological experience of the manufacturers, theapplication-engineering competence of the operator, and the utilisation of the diagnosticcapabilities of state-of-the-art measuring methods, such as the ultrasonic and the Coriolismeasuring technique, allows an in depth study of the behaviour of the measuring section.Taking this as a basis, it is possible to optimise station layouts, reduce the cost for additionalhigh-pressure calibrations, and ensure reliable operation.
The plan for the future is to examine the offset between ultrasonic/turbine gas meter andCoriolis gas meter by extended tests. Among other things, the entire package will be testedonce again both under high-pressure and low-pressure conditions. At the same time, astatement will be made as to the long-term behaviour of the relative deviations.
As an additional intellectual approach, the idea has arisen to examine whether a sole low-pressure calibration and/or water calibration for meters may be sufficient in the future.
6 Literature[1] K. J. Zanker “The effects of Reynolds number, wall roughness, and profile
asymmetry on single- and multi- path ultrasonic meters” NSFMW Oct 1999
[2] Mickan, B; Wendt, G.; Kramer, R. and Dopheide, D. (1996). Systematicinvestigation of pipe flows and installation effects using laser doppler anemometry;Part II: „The effect of disturbed flow profiles on turbine gas meters – a describingimpirical model“, Flow Meas. Instrum., Vol. 7, (1996), No. 3/4, pp. 151-160
[3] Bas van Ravenswaaij, „AGA Report No. 11 Expands Market For Proven MeteringConcept“, 22nd North Sea Flow Measurement Workshop 26 – 29 October 2004
[4] RMG Messtechnik GmbH, manual „Operating Instructions for the TRZ 03 / TRZ03-K / TRZ 03-L Turbine Meters“
[5] FLOWCOMP Systemtechnik GmbH, data sheet “gas-net F1”