150
NORTHEAST CORRIDOR MAJOR INVESTMENT STUDY FINAL REPORT Charlotte Area Transit System 600 East Fourth Street Charlotte, NC 28202 September 25, 2002

NORTHEAST CORRIDOR
MAJOR INVESTMENT STUDY
FINAL REPORT
Charlotte Area Transit System 600 East Fourth Street Charlotte, NC 28202
September 25, 2002


i
Acknowledgements Elected and advisory officials (serving 2002), board members, professionals and citizens who helped make this study possible.
Metropolitan Transit Commission
City of Charlotte Patrick McCrory, Mayor Pam Syfert, City Manager
Mecklenburg County H. Parks Helms, Chairman Harry Jones, County Manager Board of County Commissioners Town of Cornelius Carson Cato, Mayor Robert Race, Town Manager Town of Davidson Randall Kincaid, Mayor Leamon Brice, Town Administrator Town of Huntersville
Kim Phillips, Mayor Jerry Cox, Town Manager Town of Matthews
R. Lee Myers, Mayor Kay Thompson, Acting Town Manager Town of Mint Hill Ted H. Biggers, Mayor R. Todd Lamb, Town Administrator Town of Pineville George Fowler, Mayor Mary Ann Creech, Town Administrator Non-Voting Regional Representatives City of Gastonia City of Monroe
Bill Powers, City Council Member Judy Davis, Mayor Town of Mooresville City of Concord Al Jones, Mayor Scott Padgett, Mayor NC Dept. of Transportation SC Dept. of Transportation Marion Cowell, Member Bayles Mack, Member City of Rock Hill Doug Echols Jr., Mayor
ii
Citizens Transit Advisory Group City of Charlotte Mecklenburg County Jeff Brown, Co-Chair Jerry Blackmon, Co-Chair In addition, we sincerely thank the thousands of Charlotte-Mecklenburg citizens who provided input throughout the study process. City and County Agencies Charlotte Area Transit System Charlotte Department of Transportation Charlotte-Mecklenburg Planning Commission City of Charlotte Corporate Communications We also gratefully acknowledge the contributions of the technical staff from the Towns of Cornelius, Davidson, Huntersville, Matthews, Mint Hill and Pineville, the City of Mooresville and the NC Department of Transportation, as well as other City and County departments that provided information and assistance. Consultants HDR Engineering, Inc. Gannett Fleming, Inc. Parsons Brinckerhoff Quade and Douglas HNTB/LDR International Delcan Corporation The Hoyt Company Jim Polk McCormick Rankin, Inc. Mattson, Alexander and Associates PBS&J RTKL Associates, Inc.

iii
TABLE OF CONTENTS
1 PURPOSE AND NEED ...........................................................................................1
1.1 Study Purpose and Background............................................................................3
1.1.1 Public Involvement Process...............................................................................3
1.2 Planning Context ...................................................................................................5
1.2.1 Previous and Related Studies ...........................................................................5
1.2.2 Role of MIS in Decision Making and Next Steps ...............................................8
1.2.3 Policies, Tools, and Other Initiatives..................................................................8
1.3 Goals and Objectives ..........................................................................................12
1.3.1 Overview of Transit Planning and Land Use Vision and Growth Patterns.......13
1.3.2 Land Use Goals and Objectives ......................................................................14
1.3.3 Transit Goals and Objectives...........................................................................17
1.3.4 MIS Goals and Corridor Objectives .................................................................18
1.3.5 Evaluation Criteria ...........................................................................................20
1.4 Study Corridor .....................................................................................................22
1.4.1 Regional Context .............................................................................................22
1.4.2 Description of the Study Corridor.....................................................................22
1.5 Description of Existing Corridor-Wide Land Use and Future Growth Trends......27
1.5.1 Population and Household Growth Trends......................................................27
1.5.2 Employment Growth ........................................................................................29
1.5.3 Land Use Trends .............................................................................................31
1.6 Transportation Facilities and Services in the Corridor.........................................34
1.6.1 Roadways and Traffic ......................................................................................34
1.6.2 Public Transit System ......................................................................................39
1.6.3 Railways ..........................................................................................................41
1.7 Need for Transportation Improvements...............................................................42
2 ALTERNATIVES, RIDERSHIP AND COSTS .......................................................44
2.1 Screening and Selection Process .......................................................................44
2.1.1 Summary of Previous System Planning Activities ...........................................45
2.1.2 Technologies Considered ................................................................................46
2.1.3 Alignments Considered....................................................................................50
2.1.4 Station Locations and Types Considered ........................................................51
2.1.5 Screening and Refinement of Alternatives ......................................................56
2.2 Definition of Alternatives......................................................................................59
2.2.1 NE-1: Baseline Alternative..............................................................................59
2.2.2 Alternative NE-3: BRT on I-85 ........................................................................63
2.2.3 Alternative NE-4: LRT via Brevard and US-29................................................63
2.2.4 Alternative NE-5: LRT on North Tryon with Dedicated Right-of-Way .............63
2.2.5 Alternative NE-6: North Tryon Streetcar & Bus Rapid Transit on Graham/Research Park/US-29 .......................................................................64
2.2.6 Alternative NE-7: LRT on Brevard to UNCC plus US 29 BRT ........................67
2.3 Projected Ridership .............................................................................................69
2.3.1 Ridership Results.............................................................................................69
2.3.2 Mobility Consequences....................................................................................72
2.4 Capital and Operating and Maintenance Costs...................................................75
2.4.1 Capital Costs ...................................................................................................75
2.4.2 Operating and Maintenance Costs ..................................................................77

iv
3 AFFECTED ENVIRONMENT AND CONSEQUENCES........................................79
3.1 Transportation .....................................................................................................79
3.1.1 Baseline Conditions .........................................................................................79
3.1.2 Transportation Consequences.........................................................................82
3.2 Land Use and Economic Activity.........................................................................84
3.2.1 Existing and Future Development Potential by Alternative..............................85
3.2.2 Consequences of Alternatives .........................................................................88
3.2.3 Comparison of Alternatives to Each Other.......................................................97
3.3 Property Consequences......................................................................................99
3.3.1 Property Acquisitions .....................................................................................100
3.3.2 Properties with Access Affected by Transit....................................................102
3.4 Visual and Aesthetic Conditions........................................................................102
3.4.1 Existing Conditions ........................................................................................103
3.4.2 Consequences...............................................................................................104
3.5 Air Quality..........................................................................................................105
3.5.1 Existing Conditions ........................................................................................105
3.5.2 Consequences...............................................................................................106
3.6 Noise .................................................................................................................106
3.6.1 Existing Conditions ........................................................................................106
3.6.2 Consequences...............................................................................................107
3.7 Ecosystems .......................................................................................................108
3.7.1 Existing Conditions ........................................................................................109
3.7.2 Consequences...............................................................................................110
3.8 Water Resources...............................................................................................112
3.8.1 Existing Conditions ........................................................................................112
3.8.2 Consequences...............................................................................................113
3.9 Cultural Resources............................................................................................114
3.9.1 Existing Conditions ........................................................................................114
3.9.2 Consequences...............................................................................................116
3.10 Contamination Sites and Hazardous Materials Review.....................................118
3.10.1 Existing Conditions ........................................................................................118
3.10.2 Consequences...............................................................................................119
3.11 Environmental Justice .......................................................................................120
3.11.1 Existing Conditions ........................................................................................121
3.11.2 Consequences...............................................................................................121
3.12 Summary of Affected Environment Analysis .....................................................123
4 COMPARATIVE BENEFITS AND COSTS .........................................................125
4.1 Evaluation Criteria .............................................................................................125
4.2 Evaluation of Project Alternatives......................................................................128
4.2.1 Land Use, Community Development & Economic Development...................128
4.2.2 Mobility and Operations .................................................................................130
4.2.3 Environmental Effects....................................................................................132
4.2.4 Financial ........................................................................................................134
4.2.5 System Development/Center City..................................................................136
4.2.6 Community Involvement Response ...............................................................137
4.2.7 Equity.............................................................................................................138
4.3 Discussion of Trade-Offs...................................................................................138
4.4 Next Steps.........................................................................................................141

v
LIST OF FIGURES Figure 1-1. Map of Centers and Corridors Concept for Charlotte-Mecklenburg Region ........2
Figure 1-2. Station Area Development Character ................................................................16
Figure 1-3. Process for Developing CATS Goals and Criteria .............................................21
Figure 1-4. Map of Study Corridor ........................................................................................24
Figure 1-5. Existing Land Use ..............................................................................................28
Figure 1-6. Northeast Corridor Land Use Change 2000-2025 .............................................30
Figure 1-7. Market Sub-areas Contained in Study Corridor .................................................32
Figure 2-1. Map of NE-3 Alignment......................................................................................61
Figure 2-2. Map of NE-4 Alignment......................................................................................62
Figure 2-3. Map of NE-5 Alignment......................................................................................65
Figure 2-4. Map of NE-6 Alignment......................................................................................66
Figure 2-5. Map of Hybrid Alternative NE-7 Alignment.........................................................68
Figure 3-1. Example of Station Area Analysis Station Area Opportunities & Constraints Salome Church (LRT) ....................................................................................................89
Figure 3-2. Total Corridorwide Station Area Development Opportunities ............................90
Figure 3-3. Example of Station Area Analysis 2025 Station Area Potential Salome Church (LRT/BRT)......................................................................................................................91
Figure 3-4. Example of Station Area Analysis Station Area Conceptual Scenario Sugar Creek (LRT) ...................................................................................................................92
Figure 3-5. Alternative NE-3, 2000 to 2025 Development Potential Comparisons (within one-half mile of station areas)........................................................................................93
Figure 3-6. Alternative NE-4, 2000 to 2025 Development Potential Comparisons (within one-half mile of station areas)........................................................................................94
Figure 3-7. Alternative NE-5, 2000 to 2025 Development Potential Comparisons (within one-half mile of stations) ................................................................................................95
Figure 3-8. Alternative NE-6, 2000 to 2025 Development Potential Comparisons (within one-half mile of stations) ................................................................................................96
Figure 3-9. Alternative NE-7, 2000 to 2025 Development Potential Comparisons (within one-half mile of stations) ................................................................................................97
Figure 3-10. Comparison of 2000 and 2025 Potential Jobs and Households for Northeast Corridor Alternatives ......................................................................................................98

vi
LIST OF TABLES Table 1-1. Adopted Evaluation Criteria for Major Investment Studies..................................23
Table 1-2. 2000-2025 Households * in Northeast Corridor ..................................................29
Table 1-3. 2000-2025 Employment* in Northeast Corridor ..................................................29
Table 1-4. I-85 LOS Analysis Results ..................................................................................36
Table 1-5. Existing Arterial Roadway Critical Peak Hour LOS Analysis Results..................37
Table 1-6. Existing Intersection Capacity Analysis (2001) ...................................................38
Table 1-7. Transit Performance, Existing Northeast Corridor Bus Routes...........................40
Table 2-1. Screening Factors Used to Refine Alternatives...................................................44
Table 2-2. Northeast Corridor Alternatives: Recommended Disposition.............................52
Table 2-3. Northeast Corridor Stations.................................................................................55
Table 2-4. Projected Ridership and Performance Measures, 2025......................................71
Table 2-5. Corridor Transit Trip Origin/Destinations.............................................................71
Table 2-6. Capital Cost Estimates ($2002 in Millions)..........................................................76
Table 2-7. Operating Statistics by Alternative ......................................................................77
Table 2-8 Transit Service Characteristics.............................................................................78
Table 2-9. Operating and Maintenance Costs by Alternative...............................................78
Table 3-1. Year 2025 Baseline Freeway LOS Analysis Results...........................................80
Table 3-2. Year 2025 Future Baseline Arterial Roadway Critical Peak Hour LOS Analysis Results ...........................................................................................................................81
Table 3-3. Year 2025 Baseline Intersection Capacity Analysis............................................82
Table 3-4. Year 2025 At Grade Rail Crossing Feasibility .....................................................83
Table 3-5. Percent of Year 2000 Development Served by Alternatives (within one-half mile of station areas) .............................................................................................................88
Table 3-6. Comparison of Year 2000 and Year 2025 (Potential) Development within one-half mile of Northeast Candidate Stations*.....................................................................97
Table 3-7. 2000 to 2025 Development Potential Comparisons, by Alternative ....................99
Table 3-8. Estimated Property Acquisitions........................................................................100
Table 3-9. Estimated Number of Properties with Access/Curb Cuts Affected....................102
Table 3-10. Project-Generated Noise Levels .....................................................................107
Table 3-11. Potential Noise Consequences in Northeast Corridor.....................................108
Table 3-12. Federally Listed Protected Species.................................................................110
Table 3-13. Potential Acres of Wetlands Affected in the Northeast Corridor......................111
Table 3-14. Potential Floodplain Consequences in the Northeast Corridor .......................113
Table 3-15. Historic Resources in the Northeast Corridor..................................................115
Table 3-16. Consequences on Historic Resources in the Northeast Corridor....................117
Table 3-17. Potential Hazardous Waste Sites in the Northeast Corridor ...........................119
Table 3-18. Affected Low-Income and Minority Block Groups ...........................................121
Table 3-19. Transit Dependent Persons Near Alternative Alignment Stations...................122
Table 3-20. Summary Matrix of the Consequences Associated with Project Build Alternatives ..................................................................................................................124
Table 4-1. Adopted Evaluation Criteria for Major Investment Studies................................127
Table 4-2. Evaluation of Alternatives by Land Use, Community Development and Economic Development Criteria ...................................................................................................129
Table 4-3. Evaluation of Alternatives According to Mobility and Operations Criteria .........131
Table 4-4. Evaluation of Alternatives According to Environmental Criteria ........................133
Table 4-5. Evaluation of Alternatives According to Financial Criteria.................................135

vii
Table 4-6. Evaluation of Alternatives According to System Development /Center City Criteria..........................................................................................................................136
Table 4-7. Comparative Summary of Differentiating Evaluation Measures........................140

Charlotte Corridor Major Investment Studies Northeast Corridor Final Report
September 25, 2002
1
1 PURPOSE AND NEED
Chapter Summary
This chapter documents the roles and needs for integrated land use/transit improvements in the corridor and outlines the purposes that the improvements are intended to serve.
The Charlotte-Mecklenburg region is thriving, with people and jobs coming to the area in record numbers. In order to encourage that growth in a way that will enhance rather than detract from the region’s economy and appeal, land use decisions and transportation improvements must be carefully evaluated and planned.
In the past decade local elected officials in both the City and County have been focused on encouraging development in ways that sustain the economic growth and vitality of the region. Based on a vision of “Centers and Corridors,” a comprehensive guide for development, the 2025 Integrated Transit/Land Use Plan, was completed in 1998. As shown in Figure 1-1, five specific corridors in the area were identified under the Centers and Corridors vision as warranting further study regarding investments in rapid transit:
• North Corridor
• Northeast (University) Corridor
• South Corridor
• Southeast (Independence) Corridor
• West (Airport) Corridor
Building on the 2025 Integrated Transit/Land-Use Plan, Major Investment Studies (MISs) are being prepared for the North, Northeast/University, Southeast and West corridors according to Federal Transit Administration (FTA) regulations. The purpose of each corridor MIS is to evaluate possible transit improvements and select a Locally-Preferred Alternative (LPA) for implementation. In 1999, an MIS was conducted for the South Corridor that resulted in selection of a light rail transit project for that corridor.
This report summarizes the analysis and findings of the Northeast Corridor MIS.

Charlotte Corridor Major Investment Studies Northeast Corridor Final Report
September 25, 2002
2
Figure 1-1. Map of Centers and Corridors Concept for Charlotte-Mecklenburg Region

Charlotte Corridor Major Investment Studies Northeast Corridor Final Report
September 25, 2002
3
Public involvement is key to a project’s success.
1.1 Study Purpose and Background
The Charlotte Area Transit System (CATS) and the Charlotte-Mecklenburg Planning Commission are undertaking this study to define the need for and the nature of transit improvements in the corridor, and the associated land use policies that support the investment.
In the corridor studies there are five specific goals that are linked to the 2025 Integrated Transit/Land-Use Plan and the Centers and Corridors vision. These goals form the basis of the comprehensive approach to both transit investments and land use policies.
MIS Goals
• Land Use: Locate stations to sustain local neighborhoods and to maximize development opportunities.
• Land Use: Help implement the Centers and Corridors vision by coordinating growth and transportation
• Operations: Improve access and mobility in the corridor and throughout the region.
• Environment: Preserve and protect the environment.
• Financial: Provide effective and efficient transit operations.
This MIS report is the culmination of a process that included technical analyses, stakeholder and public input, and evaluation of alternatives. A number of technical memoranda and other reports support the various parts of this MIS of the Northeast Corridor.
1.1.1 Public Involvement Process
A comprehensive public involvement plan was developed as part of the Northeast Corridor MIS process. The purpose of the public involvement plan was to educate, inform, and gain input from the public to create a regional transit system and associated land use plan for the Northeast Corridor. As described in Chapter 2, comments from meetings with the public and public officials in September and October 2000 were incorporated into the formulation of the long list of technology and alignment alternatives. Additional sessions with members of the public, elected officials and decision-makers held in January 2001 provided additional comment and assisted in the development of the short list of refined alternatives.

Charlotte Corridor Major Investment Studies Northeast Corridor Final Report
September 25, 2002
4
Outreach efforts included presentations to neighborhood associations.
The goals of the public involvement plan were to:
• Define issues or concerns surrounding transit and land use in the Charlotte-Mecklenburg regional community.
• Inform and educate citizens in a factual and objective manner about the transit and land use plan and its associated opportunities and challenges.
• Proactively seek the participation and views of the broader community so that transit and land use improvements reflect the needs of the community.
• Incorporate citizen feedback and input at all levels of the decision-making process.
• Ensure that all public involvement activities identify and address the needs of area minority and low-income populations.
Stakeholders for the entire corridor including the North Tryon Street businesses and residents, the University Research Park area and the University of North Carolina Charlotte and other interest groups were also included as part of the public involvement process. These included:
• Residents, neighborhood associations, churches, and businesses along or adjacent to the corridor;
• Other members of the community including transit users, commuters, special interest groups, minority communities, citizens with disabilities, and elderly or non-English speaking residents; and
• Federal, state, regional and local government agencies, together with elected and appointed officials and staff.
To date, more than 150 people have attended 7 public meetings. More than 600 people from neighborhood associations, social organizations and business groups met with the Northeast Corridor team members during presentations and dialogues. The mailing list used to send Transitions newsletters and invitations to public meetings increased to more than 4,900 names over the duration of the study. Also, the number of times that citizens accessed the transit planning web page increased 13-fold in hits in one year.
Outreach Efforts Specific outreach efforts in the project included a variety of participation techniques, including:
• Stakeholder interviews.
• Corridor study public meetings.
• Presentations to neighborhood associations in the Corridor.
• Presentations to local clubs, business organizations and other interest groups.

Charlotte Corridor Major Investment Studies Northeast Corridor Final Report
September 25, 2002
5
• One public hearing, scheduled for discussion on the Corridor’s choice of a preferred alternative.
• Information booth events, “Wheels of Change” kiosks, and comment boxes displayed at various key local sites.
• Database and direct mailings to inform and correspond.
• A Transitions newsletter sent out quarterly to all stakeholders on the public outreach database.
• A web site (www.ridetransit.org) to publicize project information or activities regarding the project.
• Media tools such as television, radio and newspaper articles.
• City/County phone number with recorded messages that summarized the Northeast Corridor MIS.
• Transit Talk panel discussions.
1.2 Planning Context
The Northeast Corridor MIS is one part of an overall regional strategy that integrates land use and transportation planning to improve regional mobility. As an important step in the planning process, the Northeast Corridor MIS fulfills a major requirement of FTA’s project development process. It is through this process that the MTC may receive capital funding from FTA for transit improvements as part of the New Starts Program.
1.2.1 Previous and Related Studies
From 1977 to 1993 a number of studies examined the potential for future transit ways and corridors in Charlotte and the surrounding areas. The approval of the Centers and Corridors vision in 1994 marked the beginning of the current regional transportation and land use planning program. A chronology of the major events and reports leading to this Northeast Corridor MIS are provided in the following paragraphs.
City of Charlotte Historic Trolley Project In June 1998, Charlotte City Council approved a $19.7 million project to implement vintage trolley service in the portion of the South Corridor between the South End/ Wilmore areas and Center City Charlotte. In April 2000, the MTC approved adding $8.2 million to the historic trolley project to construct elements such as track work, partial up fitting of the Charlotte Convention Center, pedestrian safety improvements, and grading of the right-of-way required for the South Corridor LRT line. Advanced construction of these items will minimize future costs and disruption of trolley service for South Corridor LRT work. Trolley construction began in Fall 2000 and should be completed by year 2003.
Charlotte Corridor Major Investment Studies Northeast Corridor Final Report
September 25, 2002
6
2025 Integrated Transit/Land-Use Plan Following a ten-year planning process, the 2025 Integrated Transit/Land-Use Plan for Charlotte-Mecklenburg was the result of an intensive six-month planning effort completed in October 1998. The plan proposes a rapid transit system as a means of supporting land use initiatives to attain the Centers and Corridors vision established in 1994. The Plan identifies five major transportation and development corridors [North, Northeast (University), South, Southeast (Independence), and West (Airport)] extending from the Center City of Charlotte to the county’s border and beyond. The Plan incorporates technical analysis, public education, outreach, and hands-on public involvement. It puts forth recommendations for improving the transportation system in the region by introducing rapid transit as an alternative method to improve the travel opportunities in Charlotte-Mecklenburg. The individual MISs of the five corridors were initiated as a direct result of the 2025 Integrated Transit/Land Use Plan.
Center City 2010 Vision Plan The City of Charlotte, Mecklenburg County, and Charlotte Center City Partners completed the Center City 2010 Vision Plan in 1999. It represents a collective effort of Charlotte residents, government staff, developers, landowners, public officials, and national planning experts to set a determined and visionary path for the future. The plan’s vision statement was to create a livable and memorable Center City of distinct neighborhoods connected by unique infrastructure. In the area of transportation, the Center City 2010 Vision Plan recommends development of a system of transportation modes and services offering alternatives to commuters. The plan also stresses development of urban design solutions to maximize the livability, beauty, and distinctiveness of each transportation element. Although the vision plan was completed in 1999, numerous small area planning studies for the Center City have been initiated from the 2010 Plan and are being carried out concurrently with the MISs.
South Corridor Preliminary Engineering/Environmental Impact Statement In September 2000, CATS received approval from the FTA to initiate Preliminary Engineering (PE) and preparation of the Draft and Final Environmental Impact Statements (EISs) for the South Corridor. During this phase CATS will refine the design of the LPA, an 11.5-mile Light Rail Transit (LRT) line extending from Center City Charlotte to the Town of Pineville. This project includes the preparation of plans up to a 30 percent level of design. Because this project involves the first LRT line in the Charlotte region, it includes establishment of LRT design criteria and preparation of selected technical documents required by the FTA.
Countywide Transit Services Study From February 2000 to August 2001, CATS performed the Countywide Transit Services Study to provide a “blueprint” for the year-by-year expansion of CATS transit services throughout Mecklenburg County over the next five years. The study identified hub and mini-hub locations and regional transit opportunities. The study includes an analysis of service delivery options for the elderly and disabled in Charlotte-Mecklenburg and opportunities for improved coordination. The study further addresses standards for evaluating and monitoring transit performance, and resulted in a new fare policy for CATS. As part of this study, CATS staff conducted over 80 public meetings between Fall 2000 and Spring 2001 to obtain citizen input on service design and development. In August 2001, the MTC approved the study and adopted the five-year development program.
Urban Land Institute Corridor Panels The Business Committee for Regional Transportation Solutions (BCRTS), a consortium of chambers of commerce and civic officials from the 13 counties in the Charlotte region

Charlotte Corridor Major Investment Studies Northeast Corridor Final Report
September 25, 2002
7
sponsored panel members from the Urban Land Institute (ULI) to review land use planning in the five corridors from the Centers and Corridors vision. BCRTS received funding from NCDOT to convene these panels. For each corridor, the ULI panel focused on one to two development nodes in each county, resulting in six to eight nodes in all.
Long Range Transportation Plan Update MUMPO recently updated the urban area’s Long Range Transportation Plan (LRTP) to a horizon year of 2025. The U.S. Department of Transportation approved the Mecklenburg – Union 2025 LRTP and air quality determination on April 15, 2002. The LRTP includes a financially-constrained transit improvement plan based on the recommendations of the 2025 Integrated Transit/Land use Plan.
Charlotte Multi-Modal Station Project In July 2002 NCDOT completed an engineering feasibility study of an improved rail and transportation center located on West Trade Street in Center City Charlotte. The study included an analysis of the number of tracks serving the station, the location of grade separations and whether these separations are feasible, and the right-of-way needs for the station. The study also assessed the preliminary space needs for intercity rail, intercity bus, commuter rail, local bus, and other uses. It includes a cost analysis, determination of the project's timeframe, and potential environmental impacts resulting from multi-modal station construction. NCDOT will begin preliminary engineering for the multi-modal station in early 2003.
Chronology of Events and Studies
1994 City of Charlotte and Mecklenburg County approve Centers and Corridors vision. Committee of 100, a cross-section of representatives from 30 communities in the region, appointed.
Committee of 100 recommends five high-capacity transit corridors.
1996 Committee of 10 appointed and reaffirms Centers and Corridors vision, and recommends sales tax funding.
1998 Completion of 2025 Integrated Transit/Land use Plan in support of Centers and Corridors vision.
Citizens approve ½ percent sales tax to support the plan.
1999 Creation of Transit Governance Interlocal Agreement and formation of MTC.
1999/2000 City of Charlotte carries out South Corridor MIS and selects light rail transit for South Corridor.
2000 CATS initiates studies for remaining four corridors: North, Northeast, West and
Southeast; begins preliminary engineering in South Corridor.

Charlotte Corridor Major Investment Studies Northeast Corridor Final Report
September 25, 2002
8
1.2.2 Role of MIS in Decision Making and Next Steps
In Fall 2000, CATS and Charlotte-Mecklenburg Planning Commission initiated four MISs including the Northeast Corridor MIS. The results of the technical analysis and evaluation as presented in this document, along with the MIS documents for the North, Southeast, and West corridors, will be submitted to the communities and local leaders for consideration and comment. The MISs evaluate land use, mobility, and environmental benefits, costs and impacts of the land use and transportation alternatives. The expected outcome of the MISs will be the definition of a system plan by the MTC. The selection of the system plan will be based on both how each corridor investment addresses corridor-level needs and how they work together as part of the overall regional system.
The MIS phase of the project development process is a prerequisite to the selection by elected officials of LPAs for implementation. The MIS defines and evaluates alternative investments and transit improvements in each corridor and compares their performance with an established baseline system. The baseline system includes all reasonable and programmed transit improvements that do not involve major investments in capital facilities such as a light rail or bus rapid transit system. The definition of the system plan, which will include the selection of a LPA for each corridor by the MTC, will be the result of this MIS process. After the system plan is chosen, the MTC will determine the order in which the four corridors will be implemented.
The LPAs then must be included in MUMPO’s Transportation Improvement Program (TIP) that will allow specific transit development projects to move forward as part of MUMPO’s overall strategy for mobility and air quality improvements. The actions by MUMPO will represent major milestones in the FTA’s process for project funding. Only after MUMPO’s TIP is amended by including each LPA will the FTA consider a request to begin the environmental phase. Upon completion of the Draft Environmental Impact Statement (DEIS), an application will be submitted to FTA to proceed into PE. In PE, precise route alignments and station locations are confirmed, detailed cost estimates are made, financial plans are approved, and the final environmental impact documents are prepared. Throughout the PE/FEIS stage, there is continued dialogue with residents and businesses in the corridor, and with elected officials.
Final design and construction, the last two stages in the project development process, are authorized by FTA with the approval of a Full Funding Grant Agreement.
1.2.3 Policies, Tools, and Other Initiatives
Numerous policies, tools and initiatives have been adopted or proposed by the City of Charlotte and the participating towns that further the goals of the 2025 Integrated Transit/Land-Use Plan.
These efforts promote concentrations of development around existing development centers, in regional transit corridors, and at proposed station areas. These are briefly described and are followed by specific zoning regulations and initiatives that are in process to begin the implementation of the plans and policies.
City of Charlotte
� 2025 Integrated Transit/Land-Use Plan Recommendations
The 2025 Integrated Transit/Land-Use Plan is the primary guidance document for the required changes in the policy structures for the City of Charlotte and the participating communities. Among the recommendations are the land use changes, early land use

Charlotte Corridor Major Investment Studies Northeast Corridor Final Report
September 25, 2002
9
actions and a new series of regulatory tools for implementing station area plans and promoting transit-oriented development.
• The Plan recommended as a series of land use changes:
o Office. Concentrate major office development at stations, along the alignments and in Center City, to serve as a key land use strategy supporting transit to enable more people to ride transit as an alternative to driving.
o Multi-Family Residential. Focus multi-family residential development at stations along the alignments and Center City rather than dispersing it throughout Mecklenburg County.
• The Plan also set forth a set of early land use actions:
o Revise land use plans/ordinances.
o Encourage continued jobs and housing growth in Center City Charlotte and other key corridor locations.
o Create incentive packages for station development.
o Acquire key parcels around selected stations.
o Initiate development of priority sites.
� Progress Since the 2025 Integrated Transit/Land-Use Plan
Numerous plans and policies have been adopted that further the goals of the 2025 Integrated Transit/Land-Use Plan and promote concentrations of development around existing development centers, in regional transit corridors, and at proposed station areas. These are briefly described below and are followed by specific zoning regulations and actions that have begun to implement these policies. These are followed by some of the funding available for the implementation of transit-supportive plans.
• Transit-Supportive Plans and Policies
Updated and Revised General Development Policies (GDP). The GDP provide the policy framework that is used to guide future growth and development in Charlotte-Mecklenburg. The GDP were adopted in 1990 and are being updated to reflect new policy direction, particularly as provided in Centers and Corridors (1994), the 2025 Integrated Transit/Land-Use Plan, and the Smart Growth Principles. The current update of the GDP will, among other items, revise current policies that allow the dispersal of multi-family development, redirecting much of this development to major activity centers and transit corridors. The update effort has resulted in the adoption of general policies for station area development that serve as the basis for station area planning such as establishing minimum densities of 15 dwelling units per acre in the one-quarter- to one-half-mile area and 20 dwelling units per acre within the one-quarter-mile area. One of the main purposes of the updated GDP is to provide guidance for managing growth according to smart growth principles by focusing development where infrastructure can best support it. Four key policy areas area currently being developed:
o Transit Station Area Principles (completed and adopted in 2001). These call for minimum densities, and a range of higher intensity uses, including residential, office, service-oriented and civic uses that are transit-supportive.
o Residential Location and Design Policies

Charlotte Corridor Major Investment Studies Northeast Corridor Final Report
September 25, 2002
10
o Mixed/Multi-Use Retail-Oriented Centers Policies
o Plan Amendment Process
• Smart Growth Principles
The City of Charlotte’s Smart Growth Principles, adopted by the City Council in February 2001, strongly support infill development and redevelopment, especially in Center City and along the transit corridors. The Principles are:
o Maintain land use planning capacity,
o Sustain effective land use decisions,
o Strengthen community through healthy neighborhoods,
o Build a competitive economic edge,
o Design for livability,
o Safeguard the environment,
o Expand transportation choices, and
o Advance public investment as a catalyst.
• Joint Development Principles (JDP) The purpose of these Principles is to provide a framework to be used by local governments to promote and support development at transit stations. These principles will help achieve selected public policy objectives and priorities in a manner consistent with the Centers and Corridors vision and the 2025 Integrated Transit/Land-Use Plan, and will further support pedestrian-oriented urban design. The MTC, Charlotte City Council, Mecklenburg County Board of Commissioners and the Town Boards of Davidson, Cornelius, Huntersville and Matthews have adopted the JDP listed below. The City of Charlotte is currently working on joint development policies that will adhere to these Principles, and the expectation is that other jurisdictions will prepare parallel policies. The JDPs cover:
o Maintain land use planning capacity,
o Public Facilities. Encourage complementary public facilities (such as schools, parks/open space, libraries and social service organizations) at or near transit stations to serve both transit users and surrounding neighborhoods.
o Public Infrastructure. Provide the basic public infrastructure within available jurisdiction resources in station areas (such as water and sewer and sidewalk facilities) needed to serve transit-supportive development. At selected stations or in selected portions of the station areas, prioritize and provide for additional infrastructure improvements to serve as a catalyst for new transit-supportive development.
o Housing. Support the development of housing which is affordable to a broad cross-section of the workforce and community, providing a variety of housing choices near transit stations.
o Joint Public/Private Development. Develop public/private partnerships aimed at promoting TOD, zoning, and land use in transit station areas to enhance transit system ridership and provide services for those living and working around transit stations.
Charlotte Corridor Major Investment Studies Northeast Corridor Final Report
September 25, 2002
11
o Private Sector Development Incentives. Provide incentives, establish partnerships with the private sector, encourage targeting of incentives to promote significant demonstration projects, and remove barriers to allow for appropriate TOD in station areas.
o Market Place Venues. Encourage the location and retention of a healthy mix of private transit-supportive businesses in stations.
• Street Design Guidelines
The City is developing a new hierarchy of streets that will be overlaid on the City’s existing, and more traditional, street classification. Two street types that will be utilized heavily in the transit station areas are “main streets” and “local access streets”. These categories of streets will have street design that is strongly oriented toward easy pedestrian circulation and low automobile speeds. In addition, pedestrian amenities such as street trees and pedestrian scale lighting will be emphasized.
� Zoning/Implementation
Zoning is fundamental to implementing station area plans and promoting compact, walkable, transit-oriented development. The following existing and proposed zoning districts provide the City with a strong array of implementation tools.
• Uptown Mixed Use District (UMUD). It is the most intensive of Charlotte’s zoning districts and is applied primarily to the Uptown area. The main purpose of this district is “to strengthen the high density core of the central city”. This district has no maximum Floor Area Ratio (FAR) or height, allows a range of transit-supportive uses, and has resulted in the construction of numerous mid-rise and high-rise structures. All of the properties located along the portion of the South Transit Corridor that runs through Uptown are zoned UMUD.
• Mixed Use Development District (MUDD). This is also a transit-supportive district, similar to UMUD. As with UMUD, the MUDD district has no FAR limitation and permits a range of transit-oriented uses. Building heights are limited to 120 feet. Many property owners along the rail line in the South End area have requested and received MUDD zoning for their properties.
• Pedestrian Overlay District (PED). In March 2000, the Charlotte City Council approved this new zoning district. This district is designed to allow a mixture of transit-supportive uses developed in a pedestrian-friendly manner. The development standards for this district allow a significant increase over the amount of development that is feasible under the more suburban zoning districts. For example, there is no maximum FAR for this district and, under certain conditions, building heights can be up to 100 feet.
• Transit Overlay Zoning District (TOD). New zoning districts designed specifically for transit station areas are being developed. These new districts will be adopted and applied around the South Corridor station areas in 2003. These districts will be one of the implementing regulations for the South Corridor station area plans and eventually the station plans for all the transit corridors. These zoning districts will be based on specific station area plans, as well as the Transit Station Area Principles. In most cases, these new districts will designate minimum densities/intensities. Existing urban zoning districts, such as MUDD and PED, which encourages more

Charlotte Corridor Major Investment Studies Northeast Corridor Final Report
September 25, 2002
12
intense development are available to be used until transit overlay zoning is implemented.
• Interim Transit Overlay Zoning District. An Interim Transit Overlay District (ITOD) is being developed, and adoption of this district is expected in 2003. This proposed zoning district disallows a number of automobile-oriented uses that are not transit-supportive, sets minimum densities/intensities, significantly reduces building setbacks, and requires transit and pedestrian-friendly design. The City of Charlotte will apply this zoning district at key station areas along the four MIS transit corridors while station area planning is underway. When station area plans are completed, it is expected that the station areas will be rezoned to the specific TOD that best implement station area plans.
� Funding to Support Plans and Policies
Capital Improvement Budget for Transit-Supportive Infrastructure. The City’s FY2003 Capital Improvement budget includes over $20 million for implementation of infrastructure improvements outlined in the seven draft transit station plans for the South Corridor. This is a model that the city expects to implement for the other transit corridors as they move toward implementation. These improvements are in addition to the improvements that will be made by CATS as part of the construction of the transit system. This funding will be finalized through a November 2002 bond vote. The intent is to consider another $30 million bond vote to complete the improvements. This approach is a model for future corridors. These funds will finance:
• Infrastructure improvements that will increase sewer, water and storm water capacity to support TOD.
• Sidewalk improvements and bicycle facilities to enhance the pedestrian-friendly character of these areas.
• Intersection improvements that facilitate pedestrian movement.
• Streetscape improvements.
• Roadway realignments or extensions, and new street connections.
Additional Funding. The City of Charlotte has identified $2 million annually for pedestrian enhancements. Economic Development funding has been approved for joint development projects at transit stations. The Charlotte City Council approved the creation of a revolving fund that will provide $2 million per year for the next five years to be used for joint development projects around stations.
1.3 Goals and Objectives
Goals and objectives for the transit system improvements and land use policies form the foundation for the development, selection and evaluation of alternatives. They also provide a context for understanding the various trade-offs among the factors that are considered. These goals began with the goals developed during the preparation of the 2025 Integrated Transit/Land-Use Plan and continued CATS goals and corridor related transit and land use goals were used to guide the definition and evaluation of alternatives. The following sections describe the origin and development of the goals and objectives for this Northeast Corridor MIS.

Charlotte Corridor Major Investment Studies Northeast Corridor Final Report
September 25, 2002
13
1.3.1 Overview of Transit Planning and Land Use Vision and Growth Patterns
To ensure the continued economic vitality of Charlotte’s core areas, while accommodating growth throughout the region, Charlotte-Mecklenburg established a Centers and Corridors vision as its preferred land use and development pattern. This vision, adopted by the Charlotte City Council and Mecklenburg County Board of Commissioners in 1994, identified five major transportation and development corridors extending from Center City Charlotte to Mecklenburg County’s border and beyond. This vision was re-affirmed by the Mecklenburg-Union Metropolitan Planning Organization (MUMPO) and included in the 2025 Transportation Plan for the region.
In support of the Centers and Corridors vision, the 2025 Integrated Transit/Land-Use Plan for Charlotte-Mecklenburg was completed in 1998. The plan calls for the development of a regional rapid transit system that would improve mobility, encourage balanced growth, and support the proposed land use initiatives in each of the region’s five growth corridors. A range of alternative transit options and land use scenarios were evaluated for each of the five major corridors (South, North, Northeast, Southeast and West).
In addition to its support for the Centers and Corridors vision, the 2025 Integrated Transit/Land-Use Plan includes two overarching goals. They are:
• To sustain the economic growth and vitality of Charlotte-Mecklenburg, and
• To build a transit system that, in the long run, supports the region beyond Charlotte-Mecklenburg.
The 2025 Integrated Transit/Land-Use Plan has six specific goals to accomplish the first goal of sustained economic growth:
• To concentrate development in downtown Charlotte and at station sites in the five corridors;
• To introduce rapid transit technology and enhance the existing transit system;
• To link key employment and regional centers;
• To combine transit and roadway investment strategies;
• To phase implementation to provide an impact in each corridor in each five year period; and
• To involve the citizens of the region.
Figure 1-1 illustrates the five growth corridors in which rapid transit and land use initiatives are to be implemented.
On April 1, 1999, a half-cent sales tax became effective in Mecklenburg County. The tax increase, approved by Charlotte-Mecklenburg County voters in November 1998, provides funding to implement the 2025 Integrated Transit/Land-Use Plan.

Charlotte Corridor Major Investment Studies Northeast Corridor Final Report
September 25, 2002
14
Building on the 2025 Integrated Transit/Land Use Plan, MISs are being prepared for the North, Northeast (University), Southeast (Independence), and West (Airport) corridors. A previously prepared MIS for the South Corridor resulted in a light rail transit project for that corridor. These projects are being implemented in accordance with the project development process outlined by FTA for major transit capital investments and in accordance with EPA rules and regulations specified under the National Environmental Policy Act (NEPA). This process requires that a full range of alternatives be reviewed during the scoping phase to ensure that all reasonable alternatives are evaluated with respect to relative costs, impacts, benefits and trade-offs, and according to requirements of FTA and the Transportation Equity Act of 21st Century (TEA-21).
1.3.2 Land Use Goals and Objectives
Land use and development patterns are essential components in creating a successful transit system. Charlotte-Mecklenburg’s adopted Centers and Corridors vision, which identified five major transportation and development corridors, and the 2025 Integrated Transit/Land-Use Plan provide the policy framework for promoting more compact development of Charlotte-Mecklenburg. In support of the Centers and Corridors vision, the 2025 Integrated Transit/Land-Use Plan identified three key changes in existing transit corridor land use patterns that must be achieved in order for any corridor improvements to work effectively:
• Promote more compact, pedestrian-friendly developments
• Encourage a mix of multi- and single-family residential development
• Develop areas that include a mix of residential, shopping, and employment opportunities in close proximity
Enhanced accessibility, environmental quality, pedestrian friendliness and public safety are vital to successful transit systems and to the long-term health of Charlotte-Mecklenburg. The primary benefit of congregating housing, jobs, shops and other activities along transit corridors is to increase the convenience of transit, and build more livable, less auto-dependent communities.
Transit-Oriented Development One of the ways that local governments and agencies in Charlotte-Mecklenburg are working together is to create attractive and vibrant mixed-use, pedestrian-oriented built environments that are conducive to transit ridership and also provide an alternative to dispersed low-density development. This concept is commonly known as transit-oriented development (TOD). While increased transit ridership is one of the primary objectives of TOD, it is not the sole objective. Also important are the formation or reinforcement of strong community ties, the promotion of affordable housing, increased social interaction and cultural diversity, and the creation of new economic opportunities. Some of the guiding principles of effective transit-oriented development are:
• Provide a pattern of mixed land uses as an alternative to the large-lot, auto-only served, dispersed, single-use pattern of development with a pattern of mixed land uses. The mixing of uses at the neighborhood scale can promote more pedestrian activity and provide the convenience of having complementary services located in close proximity.
• Provide convenient transfer between different modes of transportation at station areas. A transit station provides a gateway to not only the immediate station area but, also, to

Charlotte Corridor Major Investment Studies Northeast Corridor Final Report
September 25, 2002
15
the larger surrounding area. Feeder bus, shuttle service, pedestrian and bicycle access and in some cases, station-related parking, are all important for establishing good intermodalism and making TODs successful.
• Match compact development with increased station area amenities. While higher levels of development are generally assumed within TODs than in other areas, also important are neighborhood amenities such as parks, plazas, quality streetscapes with wide sidewalks, landscaping, pedestrian-oriented signage and lighting, street furniture, public art, and bicycle facilities.
• Promote a variety of housing options. A variety of housing and non-residential development options respond to the growing diversity of American households including the rise of smaller households, older householders, empty-nesters, and individuals living alone. A mix of housing options can better meet the needs of these groups.
• Make parking a secondary use. The objective is to maximize on-street parking and place limited surface parking behind buildings. Structured parking is also appropriate. This treatment of parking can be complemented by having little or no building setbacks and retail uses on the ground floor. This can promote a more attractive and pedestrian-oriented environment.
Figure 1-2 Station Area Development Character depicts an example of the scale and design of TOD uses that can be accommodated at most stations in this corridor and that matches the development intensity assumptions used in calculating year 2025 land use data for the alternatives.

C
harlott
e C
orr
idor
Majo
r In
vestm
ent S
tudie
s
Nort
heast
Corr
idor
Fin
al R
eport
S
epte
mber
25,
2002
16
Fig
ure
1-2
. S
tati
on
Are
a D
evelo
pm
en
t C
hara
cte
r

Charlotte Corridor Major Investment Studies Northeast Corridor Final Report
September 25, 2002
17
1.3.3 Transit Goals and Objectives
In November 2000, the Metropolitan Transit Commission (MTC) adopted a mission statement, vision, and strategic goals for services operated by CATS. The MTC is the public transit system governing board established in the 1999 Transit Governance Interlocal Agreement. MTC voting members include the Mayor of Charlotte, the Chairman of the Mecklenburg County Commission, the mayors of the six incorporated towns in Mecklenburg County, and the respective city, town, and county managers. The MTC was created to provide policy direction to transit system development and operation and to oversee transit management activities.
CATS’ mission statement is:
To improve the quality of life for everyone in the greater Charlotte region by providing outstanding community-wide public transportation services while proactively contributing to focused growth and sustainable regional development.
This MIS was undertaken in the context of the overall adopted vision and goals of the MTC/CATS transit program as stated below.
CATS’ Vision Statement
Successful accomplishment of the CATS Mission will mean that the following conditions are realized:
• A steadily increasing share of transit competitive travel markets in the Charlotte region choose to use public transportation on a regular basis.
• The citizens of the region perceive public transportation as an important public service, which benefits the community as a whole by consistently providing exemplary service that meets diverse individual needs.
• Public transportation employees are seen, and see themselves, as committed, competent, and motivated members of the region’s premier public service.
• CATS is recognized, both locally and nationally, for its contribution to effective, innovative and community-focused regional development.

Charlotte Corridor Major Investment Studies Northeast Corridor Final Report
September 25, 2002
18
Summary of CATS’ Strategic Goals
• Customer Service Focus: Provide safe, dependable high-quality transportation services to all customers, and support CATS employees in that endeavor.
• System Development: Expand and re-organize public transportation services to retain current customers and attract new ones by providing services that meet customer and community needs while supporting transit-oriented and pedestrian-friendly land use patterns.
• Fiscal Responsibility: Ensure cost-effective and efficient use of resources and aggressively pursue funding partnerships to supplement local resources.
• Community Benefits: Provide social, economic, and environmental benefits to the community through system operations and improvements, and promote community awareness of these contributions.
• Prepare for the Future: Pursue process improvements, business practices, and technologies that will support cost-effective and customer-friendly service delivery in the future.
• Invest in Employees: Provide training and career development support that enhances employees’ ability to perform their jobs and be prepared for promotional opportunities.
1.3.4 MIS Goals and Corridor Objectives
Consistent with the transportation planning and land use vision and the goals and objectives described above, the following six goals for the Northeast Corridor MIS were established, including a series of objectives and, to the extent possible, quantifiable measures for comparing the alternatives under consideration:
Goal 1: Improve access and mobility in the corridor and throughout the region.
Objectives
• Provide access to major activity centers, such as hospitals, UNCC, University Research Park, etc.
• Enhance competitiveness of transit as compared to the automobile.
• Provide regional connections with existing and planned transportation facilities.
• Provide transit connections from other communities through the “wedges.”
• Encourage transit use by non-traditional riders.
• Improve neighborhood-to-neighborhood transit connections.

Charlotte Corridor Major Investment Studies Northeast Corridor Final Report
September 25, 2002
19
• Improve transit service to special events and attractions, such as Verizon Amphitheater, Speedway, etc.
• Enhance opportunities for residents to access jobs.
• Improve transit service to the high volume tourist market wanting to visit key attractions in the corridor.
• Reduce travel delays caused by incidents by providing reliable transit facilities.
• Maximize accessibility of transit service to the transit dependent.
• Reduce auto dependency by creating TOD opportunities (bike, walk access).
• Enhance pedestrian and bicycle access to transit stops.
• Design stations that facilitate seamless transfers.
• Do not preclude eventual system expansion to serve Cabarrus County commuters into Mecklenburg County.
Goal 2: Help implement the Centers and Corridors by coordinating growth and
transportation.
Objectives
• Serve a high proportion of existing development.
• Shift a high proportion of expected corridor growth to rapid transit and important feeder alignments.
• Treat key feeder routes as part of the transit-related land use strategy; create opportunities for them to absorb some of corridor growth.
• Coordinate transit with redevelopment needs within Charlotte.
• Distribute jobs and housing to maximize reverse commuting.
• Specify what public sector actions are needed to attract station area development investments where market driven demand is not strong enough.
Goal 3: Locate stations to sustain local neighborhoods and maximize development
opportunities This goal focuses on details of land use planning around specific stations. The primary focus of such actions would be within the 1/2-mile radius around rapid transit stations. Nevertheless, many of these measures can also be implemented along key feeder routes and in other areas that may have direct access to other transit services.
Objectives
• Locate stations at or near active centers; avoid out of the way, less accessible sites.

Charlotte Corridor Major Investment Studies Northeast Corridor Final Report
September 25, 2002
20
• Use transit stations as catalysts for creating “town center” and “village center” environments in the more suburban half of the corridor.
• In redevelopment areas, merge station area planning into broader comprehensive local plans that address specific housing and economic development issues.
• Create higher intensity development (especially for employment) around transit stops where such developments can be supported by local infrastructure.
• Where appropriate, mix residential, employment and convenience services around transit stops.
• Establish urban design standards and invest in public infrastructure that will ensure a high quality pedestrian friendly environment.
Goal 4: Preserve and protect the environment.
Objectives
• Improve air quality by reducing mobile emissions and pollutants.
• Minimize impacts to sensitive areas, such as parks, historical sites, wildlife habitats, historic and cultural sites, and wetlands, etc.
• Minimize right-of-way takings and displacement of homes and businesses.
• Reduce fuel consumption.
• Integrate transit improvements into the neighborhoods transit passes through.
• Preserve more open space by encouraging more compact development.
Goal 5: Provide effective and efficient transportation options.
Objectives
• Achieve cost-effectiveness based on FTA criteria.
• Increase employment opportunities outside of Charlotte by improving transit access.
• Improve the people-carrying capacity of the existing roadway and transit system.
• Increase transportation options for east-west travel between activity centers and jobs.
1.3.5 Evaluation Criteria
The various corridor goals and system plan principles listed above lead to the development of a set of evaluation criteria to help in determining the degree to which the various transit improvement alternatives address these needs. Figure 1-3 and Table 1-1 show the relationship between these goals and criteria. The actual application of these criteria to the Northeast Corridor alternatives is depicted in Chapter 4.

Charlotte Corridor Major Investment Studies Northeast Corridor Final Report
September 25, 2002
21
Centers
and
Corridors
Vision
2025 Plan� Concentrate Development
� Introduce Rapid Transit
� Link City Sectors
� Combine Transit and
Roadway Investment
Strategies
� Phase Implementation in
Each Corridor
� Involve Citizens
Corridor MIS� Land Use: Stations to aid
Development and
Redevelopment
� Land Use: Coordinate Growth
and Transportation
� Operations: Improve Access
and Mobility
� Environment: Preserve and
Protect the Environment
� Financial: Effective and
Efficient Transit Operations
System Plan� Support Centers and Corridors
Vision
� Support Corridor and System Needs
� Serve Priority Travel Markets
� Integrate Corridors in Center City
� Relate to Overall Transportation
System
� Improve Quality of Life
� Promote Air Quality Goals
� Minimize Adverse Impacts
� Be Achievable within Desired
Timeframe
� Financially Sustain Operations,
Maintenance and Construction
MTC Evaluation Criteria� Land Use: Existing Land Use Patterns, Existing
Development Character, Potential TOD Sites,
Existing Land Use Policies, Future Land Use
Patterns, Enhance Center City & Core Area
Growth
� Mobility/Operations: Ridership, Travel Time
Savings, Change in Vehicle Miles of Travel,
Transit Dependent Access, Change in Transfers,
Service Reliability, Connections to Special
Generators
� Environment: Displacements, Noise Affected
Receivers, Local Traffic Effects, Cultural or Natural
Resources Affected, Properties with Access
Affected, Water Resources Affected
� Financial: Capital Costs, Incremental Cost per
New Rider, Operating & Maintenance Costs
� System Development/Center City: Synergy with
Other Corridors, Operating Efficiency, Balance
Use of System Capacity
CATS Vision
Statement
CATS Strategic
Goals
Figure 1-3. Process for Developing CATS Goals and Criteria

Charlotte Corridor Major Investment Studies Northeast Corridor Final Report
September 25, 2002
22
1.4 Study Corridor
The following section briefly describes the context and setting of this MIS. It provides an overview of the economy and population of the region, and profiles the land use, roadway and transit characteristics of the Northeast Corridor.
1.4.1 Regional Context
The Charlotte region boasts one of the most robust economies in the United States. It has become not only the commercial capital of the Carolinas but also the nation’s second-largest banking center. While Charlotte’s center city has developed into the region’s premier financial and business center, major activity centers located throughout the area also have attracted substantial business growth. Based on recent projections, job growth will continue with Mecklenburg County’s employment increasing from 530,000 in 1997 to 777,000 in 2025, a 45 percent increase. During the same timeframe, Charlotte-Mecklenburg’s population is estimated to grow by 345,000 residents, a 57 percent increase. The expansion of the regional economy also has resulted in a larger seven-county regional population of 1.4 million residents. Although much of this population increase has occurred within the city of Charlotte, residential growth throughout Mecklenburg and adjoining counties has been significant.
1.4.2 Description of the Study Corridor
Figure 1-4 shows the extent of the corridor study area. The corridor spans northeast from
Center City Charlotte to the Cabarrus County line, a distance of approximately 14 miles. The Northeast Corridor study area, like the other four corridors, includes all of Center City Charlotte inside the freeway loop. The boundaries of the corridor outside Center City are: beginning at the Brookshire Freeway and North Graham Street, northerly along North Graham Street, north along Sugar Creek Road, northeast along Mallard Creek Road and Odell School Road to the Cabarrus County Line. From there the boundaries run southeasterly along the county line to the Norfolk Southern Rail Road (NSRR) main line (actually owned by the North Carolina Railroad) and then return along the railroad alignment to Center City Charlotte. I-85 to the north and NC-49 to the east are the highway boundaries of the corridor, although development to the north of I-85 is included in the corridor definition.
Population and employment growth in the Northeast Corridor is expected to be robust, with a 40 percent growth in households and a 44 percent growth in employment forecast by 2025.
The land use characteristics in the Northeast Corridor divide logically into two sections—the older urban inner corridor and the newer highly suburban outer corridor.

23
Charlott
e C
orr
idor
Majo
r In
vestm
ent S
tudie
s
Nort
h C
orr
idor
Fin
al R
eport
S
epte
mber
25,
2002
Tab
le 1
-1. A
do
pte
d E
valu
ati
on
Cri
teri
a f
or
Majo
r In
vestm
en
t S
tud
ies
Ob
jecti
ve
Lo
cally P
refe
rred
Alt
ern
ati
ve S
ele
cti
on
O
vera
ll S
yste
m O
pti
miz
ati
on
Im
ple
men
tati
on
Ph
asin
g
Lan
d U
se
•
Exis
ting
corr
idor
& s
tatio
n a
rea la
nd
use
pa
ttern
s
•
Exis
ting
corr
idor
& s
tatio
n a
rea d
evelo
pm
ent ch
ara
cte
r
•
Po
tential T
ransit-O
rie
nte
d D
evelo
pm
ent
(TO
D)
sites
Exis
ting
lan
d u
se p
olic
ies &
to
ols
for
sta
tio
n a
rea
&
corr
idor
•
Futu
re c
orr
idor
& s
tatio
n a
rea la
nd
use
patt
ern
s
•
En
han
ce
Cen
ter
City &
core
are
a g
row
th
Maxim
izes o
pp
ort
unity t
o m
ee
t C
en
ters
&
Corr
idors
La
nd U
se
Vis
ion/2
02
5 T
ransit-L
an
d
Use P
lan
•
Ne
ar-
term
op
port
unitie
s t
o s
hap
e e
merg
ing
g
row
th/r
ed
evelo
pm
en
t
•
La
nd u
se p
olic
ies in
pla
ce
Mo
bilit
y/
Op
era
tio
ns
•
Rid
ers
hip
– t
ota
l a
nd n
ew
•
Tra
vel tim
e s
avin
gs
•
Ch
ang
e in v
ehic
le m
iles o
f tr
avel
•
Tra
nsit d
ep
end
ent
acce
ss
•
Ch
ang
e in tra
nsfe
rs
•
Serv
ice
relia
bili
ty
•
Co
nn
ectio
ns t
o a
ctivity c
ente
rs,
sp
ecia
l even
t &
cultura
l sites
•
Rid
ers
hip
– t
ota
l a
nd n
ew
•
Ab
ility
to a
ttra
ct
desir
ed t
ravel m
ark
ets
•
Tra
vel tim
e s
avin
gs
•
Imm
edia
te n
ee
d t
o im
pro
ve a
ccess t
o e
mp
loym
ent
(Cen
ter
City &
revers
e c
om
mute
locatio
ns)
•
Imm
edia
te n
ee
d f
or
co
ng
estio
n r
elie
f
•
Op
port
unity t
o im
ple
ment
inte
rim
(T
SM
-typ
e)
serv
ice
impro
vem
ent
En
vir
on
men
t •
Dis
pla
cem
ents
•
Nois
e a
ffecte
d r
eceiv
ers
•
Lo
cal tr
aff
ic e
ffects
•
Cultura
l or
natu
ral re
so
urc
es a
ffecte
d
•
Pro
pert
ies w
ith a
ccess a
ffecte
d
•
Wate
r re
so
urc
es a
ffecte
d
•
Min
imiz
e d
isru
ption
s (
com
munitie
s,
na
tura
l
are
as, cultura
l re
so
urc
es,
etc
.)
•
Air
qu
alit
y im
pro
vem
ents
(m
ob
ile s
ourc
e
em
issio
n r
ed
uction
s,
Lo
ng
Ra
ng
e P
lan &
TIP
co
nfo
rmity)
•
Envir
onm
enta
l Ju
stice (
eq
uity in
dis
trib
utio
n o
f b
en
efits
an
d c
osts
, p
ast in
vestm
ents
rela
tive
to E
J p
op
ula
tio
ns)
•
Min
imiz
e d
isru
ption
s (
com
munitie
s,
na
tura
l are
as,
cultura
l re
so
urc
es,
etc
.)
•
Air
qu
alit
y im
pro
vem
ents
(m
ob
ile s
ourc
e e
mis
sio
n
red
uctio
ns,
Lo
ng
Rang
e P
lan &
TIP
co
nfo
rmity)
•
Envir
onm
enta
l Ju
stice (
eq
uity in
dis
trib
utio
n o
f b
en
efits
an
d c
osts
, p
ast in
vestm
ents
rela
tive t
o E
J p
op
ula
tio
ns)
Fin
an
cia
l •
Cap
ital costs
•
Incre
men
tal co
st p
er
new
rid
er
•
Op
era
ting
& m
ain
tena
nce c
osts
•
Tota
l syste
m c
ost re
lative t
o f
un
din
g c
ap
acity
(cap
ital cost,
op
era
ting
& m
ain
tena
nce
sub
sid
y)
•
Ab
ility
to a
ttra
ct fe
dera
l a
nd
sta
te f
un
ds
•
Op
port
unitie
s t
o levera
ge o
ther
so
urc
es
•
Inte
rim
syste
m c
ost re
lative t
o f
un
din
g c
ap
acity (
cap
ital
cost,
op
era
ting
& m
ain
ten
an
ce
sub
sid
y)
•
Ab
ility
to a
ttra
ct fe
dera
l a
nd
sta
te f
un
ds
•
Op
port
unitie
s t
o levera
ge o
ther
so
urc
es
Sy
ste
m
Dev
elo
pm
en
t/
Cen
ter
Cit
y
•
Synerg
y w
ith
oth
er
corr
idors
(th
roug
h-s
erv
ice a
nd
co
nn
ectio
ns)
•
Op
era
ting
eff
icie
ncy
•
Bala
nce u
se o
f syste
m c
ap
acity
•
Pa
sseng
er
dis
trib
utio
n in C
en
ter
City
•
Bala
nce u
se o
f syste
m c
ap
acity
•
Resp
onsiv
en
ess t
o u
rban
desig
n &
econ
om
ic
develo
pm
ent
pri
ncip
les
•
Syste
m e
xp
ansio
n c
ap
acity a
nd c
ap
ab
ility
•
Synerg
y w
ith
oth
er
corr
idors
(p
rovid
e s
erv
ice
co
nn
ectio
ns)
•
Ne
ed
to p
hase s
yste
m im
ple
menta
tio
n
•
Corr
idor
rea
din
ess f
or
pro
gra
m im
ple
menta
tion
(re
lative
availa
bili
ty o
f ri
ght-
of-
way a
nd
sta
tio
n a
rea la
nd
, la
nd
use p
olic
ies in p
lace, p
ub
lic a
ccep
tance)

24 Charlotte Corridor Major Investment Studies Northeast Corridor Final Report
September 25, 2002
Figure 1.4
Figure 1-4. Map of Study Corridor

25 Charlotte Corridor Major Investment Studies Northeast Corridor Final Report
September 25, 2002
Inner Half The inner part of the corridor extends from Center City to the US 29 (North Tryon Street) NC 49 (University City Boulevard) split.
Residential: The inner half of the corridor west and north of North Tryon Street has several established residential areas that include the large Hidden Valley neighborhood and Derita, as well as smaller, more isolated residential communities such as Lockwood and Tryon Hills. Along the eastern edge of the corridor are older neighborhoods such as Optimist Park, Belmont, Villa Heights and North Charlotte. The Newell neighborhood between Old Concord Road and North Tryon Street is primarily a low-density collection of single-family developments that marks a transition to the more suburban University City half of the corridor.
Employment Centers: Large rail yards and associated trucking operations dominate much of the area immediately outside Center City along North Tryon Street and Brevard Streets. The inner corridor also has large areas of older light industrial and warehouse-distribution along streets such as Dalton Avenue, North Graham and Atando Avenue. Some heavy industrial uses are mixed with light industrial near Craighead Road and Sugar Creek Road east of North Tryon Street.
The easy access to I-85 and other major regional arterials makes sites within this large employment belt a desirable location for businesses heavily dependent on trucking, or those that need easy access to all of Charlotte-Mecklenburg. Although many of these sites are aging, they are relatively stable and likely to remain devoted to such uses. There is relatively little multi-tenant office development.
North Tryon Street Commercial Corridor: Some limited retail uses occur along North Graham Street and near Sugar Creek and I-85, but North Tryon Street remains the main strip commercial artery for the inner half of the corridor. Much of North Tryon Street is struggling to recover from the out-migration of major retail chains to the University City area. Along North Tryon Street, there are many closed businesses and few major commercial anchor tenants. The large Tryon North Mall site at Sugar Creek Road and North Tryon Street is extremely underused but some new businesses have located there in recent years. The two shopping centers near Eastway and North Tryon Street are more fully occupied but have also suffered from the migration of key anchors to the more suburban sections of the corridor. Most other commercial uses along North Tryon Street are stand-alone businesses or small strip centers.
Redevelopment: Overall, the current land use pattern has long been established, but there are a few centers of redevelopment. The North Charlotte area centered on North Davidson Street is currently the main focus for such new infusions of money and energy. Most notably, the new mixed-use project at the old Highland Park No. 3 textile mill began while this MIS was in progress, and follows on the earlier adaptive reuse of other former mills in the area. Old commercial properties have been shifting to new uses such as restaurants and small arts and crafts businesses. Much of the residential areas in North Charlotte remain little changed, but houses are gradually being upgraded.
Although not changing as dramatically as North Charlotte, several older established neighborhoods such as Belmont, Villa Heights, Optimist Park, and Lockwood may be next to attract significant attention.

26 Charlotte Corridor Major Investment Studies Northeast Corridor Final Report
September 25, 2002
Transit Oriented Development Opportunities: Most transit-oriented development (TOD) opportunities within the inner half of the Northeast Corridor will likely be enhancements of the existing land use context or tied to redevelopment initiatives. A few localities east of Derita (e.g. near Mineral Springs Road) are absorbing some new single-family residential development. Nevertheless, few large undeveloped parcels remain for either new housing or new nonresidential uses. There are numerous vacant or underused commercial or light industrial sites that could be candidates for more mixed-use developments oriented to potential transit stations. Consequently, those sites became a main focus of the land use planning work of this MIS within this half of the Northeast Corridor.
University City Area The outer part of the corridor includes and surrounds the University of North Carolina at Charlotte (UNCC) and the University Research Park areas and extends out to the Mecklenburg-Cabarrus County boundary.
Residential: Many new residential developments in the University City area have been designed as self-contained communities with little connectivity between neighborhoods. Numerous new multifamily developments have sprung up near UNCC and the University Research Park, especially along W.T. Harris Boulevard, Mallard Creek and Mallard Creek Church Roads, University City Boulevard and Old Concord Road. The high proportion of multifamily housing within the overall residential mix is likely to continue as the expansion of UNCC will create more demand for such units.
“Suburban” Environments: This portion of the corridor has grown rapidly in the last 20 years and highly “suburban” patterns of development prevail. Much of this area is a coarse-grained pattern of single-use developments at low gross acreage intensities, highly dispersed local retail centers, and office centers developed as highly independent low-density “campuses.” These traits make the outer half of the corridor very auto dependent. Some changes in this pattern are now under consideration, including the mixed use Kings Grant proposal adjacent to the large Concord Mills regional mall. On the whole, however, most new development remains consistent with the patterns of the past decade.
The traffic impacts of such patterns of development are especially noticeable at peak commuting times when access points to the main roads back up for many traffic signal cycles. Such problems are also acute at mid-day when many nearby office park workers try to drive to popular lunchtime locations and stores at centers such as University Place.
Employment Centers: The University City area contains many very large, important, individual activity centers such as UNCC, the new TIAA-CREF complex, University Hospital, and the First Union and IBM complexes in University Research Park. These are substantial developments and most are expected to grow even further. The University, for example, now has 17,000 students and will expand to 25,000 within the next ten years. These centers are often set apart and poorly connected to one another, a trait with significant impacts on developing rapid transit options for this corridor.
Retail: Most retail in this half of the corridor is in self-contained, auto-oriented commercial centers. There is some mixing of retail and other employment in a few of the centers (e.g. along McCullough Drive) and the large University Place Center at US-29 and W.T. Harris Boulevard mixes substantial retail with multifamily housing and other employment. But there are no commercial streets such as North Davidson or stretches of North Tryon Street in the other half of the corridor.

27 Charlotte Corridor Major Investment Studies Northeast Corridor Final Report
September 25, 2002
Transit Oriented Development Opportunities: The development patterns of the University City area contrast sharply with those in the inner half of the corridor, and create different challenges for transit-related land use planning. The land use characteristics of the University City area stand in sharp contrast to many of the key planning ad design principles for Transit Oriented Development.
Along such streets as North Davidson or much of North Tyron, commercial development is more tightly gathered and there is potential for using transit to help redefine these areas as traditional Main Street environments easily accessible to adjacent residential neighborhoods. In the outer half, these possibilities are very limited. For example, main roads such as US 29 (North Tryon Street), I-85, W.T. Harris Boulevard, and University City Boulevard (NC49) function as high-speed, limited access arterials rather than traditional streets. Adjacent development is therefore not oriented to a common right-of-way.
There are few internal connections between different properties, forcing residents and employees to use these arterials for short trips between otherwise closely spaced sites. As high volume, often high-speed arterials and collector roads, the main thoroughfares in the University City area are uninviting pedestrian environments. Locating transit station in such environments will need to pay close attention to such “connectivity” and “walkability” issues.
Current land use patterns in the Northeast Corridor are summarized in a generalized land use map
Figure 1-5.
1.5 Description of Existing Corridor-Wide Land Use and Future Growth Trends
The Northeast Corridor is a highly dynamic mix of urban and suburban land use. Both halves of the corridor currently have their own development or redevelopment needs and market characteristics. Transit implementation will therefore have different potential land use impacts depending on local development trends.
1.5.1 Population and Household Growth Trends
As seen in Table 1-2, data from the City of Charlotte for 2000 estimates 22,000 households in the Northeast Corridor, divided into 4,000 single family and 18,000 multifamily households. By 2025 CDOT expects there will be more than 30,000 Northeast Corridor households, a growth rate of 36 percent. The 2025 household split will be 5,000 single family and 25,000 multifamily. The CDOT estimates show that the Northeast corridor will continue to contain a high proportion of multi-family households, about 83 percent. Estimates for 2025 project a growth rate of 20 percent for single-family households and 39 percent for multi-family households.

28 Charlotte Corridor Major Investment Studies Northeast Corridor Final Report
September 25, 2002
Figure 1-5. Existing Land Use

29 Charlotte Corridor Major Investment Studies Northeast Corridor Final Report
September 25, 2002
Table 1-2. 2000-2025 Households * in Northeast Corridor
Households 2000 2025 Increase % Change
Single-family 4,000 5,000 1,000 20%
Multi-family 18,000 25,000 7,000 39%
Total Households 22,000 30,000 8,000 36%
1.5.2 Employment Growth
In 2000, CDOT estimated 58,000 jobs in the Northeast Corridor, with 29,000 office jobs, 11,000 retail jobs and 18,000 jobs in the other category. Table 1-3 shows the breakdown by office, retail and “other” employment. CDOT expects employment will grow significantly to more than 83,000 in 2025. This is a growth rate of 43 percent. Total 2025 employment will include 48,000 office jobs, 14,000 retail jobs and 21,000 jobs in the other category. Existing office employment accounts for more than half of all corridor jobs. By 2025, this is forecasted to increase to 58 percent.
Table 1-3. 2000-2025 Employment* in Northeast Corridor
Employment 2000 2025 Increase % Change
Office 29,000 48,000 19,000 66%
Retail 11,000 14,000 3,000 27%
Other 18,000 21,000 3,000 17%
Total Employment 58,000 83,000 25,000 43%

30 Charlotte Corridor Major Investment Studies Northeast Corridor Final Report
September 25, 2002
The following Figure 1-6 summarizes the year 2000 existing development and compares it to CDOT 2025 trends projections for the overall corridor. These data demonstrate that much new growth is expected within the Northeast Corridor. These data are presented for five main land uses: single-family households, multi-family households, office space, retail space, and other employment-related land uses. These are the five land use categories used to develop estimates for the 2025 land use potential associated with candidate stations.
Figure 1-6. Northeast Corridor Land Use Change 2000-2025
Figure 1.5: Northeast Corridor Land Use Change 2000-2025
25,000
4,000
18,000
48,000
29,000
11,000
18,000
5,000
21,000
14,000
0
10,000
20,000
30,000
40,000
50,000
60,000
Single-family Multi-family Office Retail Other
2025 Households 2000 Households 2025 Jobs 2000 Jobs

31 Charlotte Corridor Major Investment Studies Northeast Corridor Final Report
September 25, 2002
1.5.3 Land Use Trends
To better understand current trends, the land use consultants conducted a “market reconnaissance” that examined a number of development factors including historical growth trends, recent market activity, current development patterns and dominant land uses, and site availability. Particular attention was paid to market trends for multi-family and office development because of their ability to concentrate more potential transit riders on less land.
The market reconnaissance provided an initial assessment of expected future demand for various types of residential and non-residential development in the corridor. The results of this market reconnaissance indicate that recent development patterns and current market trends vary within the corridor. Indeed there was enough variation within each half described above to divide them into smaller market sub-areas. As a result, the corridor was segmented into four market sub-areas to better reflect these variations (Figure 1-7). Market sub-areas ”a” and “b” cover the inner half and sub-markets “b” and “c” cover the University City area.
Residential Trends Areas closer to the Center City (sub-areas a and b) have not grown significantly, but concerted efforts to stabilize neighborhoods such as Hidden Valley have limited migration out of established residential areas. The multi-family market has in effect been dormant for the past ten years.
In contrast, the upper half of the Northeast Corridor (sub-areas c and d), spurred largely by the growth of the University Research Park and UNCC, is in the midst of a rapid increase in households. Such expansion is expected to continue. Much of this growth is in typical low density, single-family developments although the University City area does have a high concentration of multi-family housing in such locations as the Mallard Creek Church corridor. Numerous new multifamily developments have sprung up near UNCC and the University Research Park, especially along W.T. Harris Boulevard, Mallard Creek and Mallard Creek Church Road, University City Boulevard and Old Concord Road. The high proportion of multifamily units within overall residential growth is likely to continue, as the expansion of UNCC will create more demand for such units. This area will likely remain attractive to multi-family developers throughout the 25-year forecast period of this MIS; however, much of this demand may locate beyond the edges of the corridor as available and appropriately zoned land runs out.
An analysis of recent absorption trends of multi-family units in the Northeast Corridor reveals marked differences among the market sub-areas. Projecting recent market activity indicates that only the outer sub-areas (“c” and “d”) would be expected to add new units, and that public sector interventions are needed to offset these current market dynamics if sub-areas “a” and “b” are to share in such growth.

32 Charlotte Corridor Major Investment Studies Northeast Corridor Final Report
September 25, 2002
Figure 1-7. Market Sub-areas Contained in Study Corridor

33 Charlotte Corridor Major Investment Studies Northeast Corridor Final Report
September 25, 2002
Employment Trends Retail Sector Employment: In the southern half of the Corridor (sub-areas “a” and “b”), there has been little new retail development. In fact, recent years have seen a marked migration of retail to the University City area (sub-area “c” and “d”) and beyond, with a proliferation of new regional and community auto-oriented retail and service centers. This retail development has been supported by the rapid household growth in the University City area. The 1.4 million square foot Concord Mills regional mall situated just beyond the boundary in Cabarrus County will continue to capture a substantial proportion of auto-dependent retail demand generated by corridor residents for the foreseeable future.
Non Retail Employment: Sub-areas “a” and b are closer to Center City and have retained a significant light industrial and warehouse distribution employment base, but many of these properties are small and underused. Their proximity to I-85 and I-77 benefits such uses, and there is little market pressure to replace them with other employment uses, such as office parks. Similar to multi-family growth, recent office market activity has varied greatly by market sub-area. While little new office development has occurred in sub-areas “a” and “b”, the University Research Park (in sub-area 6) has continued to expand.
Many of the sites within the University Research Park (in sub-area 6) are for single tenants (e.g., TIAA-CREF, Duke Power, Solectron, Wall Street Journal) but the multi-tenant market is rapidly expanding in this corridor. With the conversion of over 1.2 million square feet of former IBM space, the office inventory jumped to over 3.5 million square feet by the end of 2000. This represents approximately 17 percent of the total Charlotte area suburban multi-tenant office market.
At the end of 2000, approximately 275,000 square feet of multi-tenant space was under construction, with an additional 325,000 square feet proposed. The main focal point of office development activity in recent years has been the Mallard Creek area.
A unique employment generator is UNCC with its combination of academic and research offices. The proposed technology center adjacent to US-29 is expected to add approximately 1.5 million square feet of office and institutional space during the forecast period of this MIS.
Land Use Changes A number of future land use and growth management policy changes will influence implementation of transit-land use strategies within the corridor. Those expected to occur over the next 25 years include:
• Annexation of the entire Corridor within the City of Charlotte.
• Extension of appropriate infrastructure (e.g., upgraded roads) to all these areas, enabling them to support development at urban densities.
• The continued attraction of economic development to the University City area.
• Continued expansion of UNCC as an academic and research institution.
• Significant development in the Concord Mills and Lowe’s Motor Speedway areas in nearby Cabarrus County.

34 Charlotte Corridor Major Investment Studies Northeast Corridor Final Report
September 25, 2002
I-85 is approaching its capacity and experiencing severe congestion.
• Significant residential growth of the areas on either side of the new I-485.
• Focused redevelopment of the North Davidson (“NoDa”) area, such as the current mixed-use revitalization of the former Highland Park Mill No. 3 site.
• Shifting of the Amtrak station to the Gateway area of Center City and the shifting of many multi-modal transport activities to sites near Charlotte-Douglas International Airport.
• The implementation of specific economic development policies, and the formulation of workable strategies aimed at promoting redevelopment of sites now occupied by marginal uses in the inner half (market sub-areas a and b) of the Corridor.
1.6 Transportation Facilities and Services in the Corridor
1.6.1 Roadways and Traffic
Existing Roadways Major roadway facilities serving the Northeast Corridor include:
Interstate 85. I-85 is the major carrier of traffic through the study area. It is primarily an eight-lane facility between I-77 and the US-29/NC-49 split just northeast of the Sugar Creek Road exit. Beyond the US-29/NC-49 split, it is a four-lane facility.
Interstate 485. I-485 in the Northeast study area currently exists between I-85 and NC-49 only. Once completed, I-485 will form a complete loop around the City of Charlotte.
W.T. Harris Boulevard (Harris). Harris is a major four-lane divided facility. In the Northeast Corridor it runs predominantly west from Old Concord Road, south of the UNCC. It intersects with NC-49, US-29, I-85, Mallard Creek Road, Sugar Creek Road, Statesville Avenue/ Road, and I-77.
North Tryon Street (US-29). This roadway starts within the corridor at I-277 (Brookshire Freeway), just outside the outer limits of Center City Charlotte and goes eastward toward University City and Lowe’s Motor Speedway in Cabarrus County. It is a heavily-traveled four-lane, primarily undivided arterial with frequently spaced traffic signals (an average of one to two signals per mile) and available turning bays at major intersections.
Graham Street. For the Northeast Corridor, Graham Street also starts at I-277 (Brookshire Freeway), just outside the outer limits of Center City Charlotte and goes northeast, beside the existing NSRR, crosses I-85 and meets Sugar Creek Road near Derita. It is a four-lane undivided roadway carrying heavy truck traffic serving the many commercial and industrial warehousing facilities along the corridor. Traffic signals are closely spaced, averaging two per mile.
35 Charlotte Corridor Major Investment Studies Northeast Corridor Final Report
September 25, 2002
Sugar Creek Road (Charlotte Route 4). Sugar Creek Road is primarily a north-south road starting at the NSRR rail line and crossing North Tryon Street, I-85, Mallard Creek Road, and W.T. Harris Boulevard. It is a four-lane undivided roadway with traffic signals at major intersections except between N. Graham and W.T Harris Boulevard, where it is a two-lane facility.
Mallard Creek Road. Mallard Creek Road begins at Sugar Creek Road in the Derita area and traverses northeast through University Research Park and into Cabarrus County. It is a two-lane undivided road with no turning lanes, except for a section between Harris and Mallard Creek Church/ Prosperity Church Road that has four lanes plus a wide median and turning lanes.
Mallard Creek Church Road. Mallard Creek Church Road starts at NC-49 and intersects with US-29, I-85, and Mallard Creek Road before becoming Prosperity Church Road and is two-lane undivided between US-29 and NC-49. It is primarily a four-lane divided roadway with generously spaced traffic signals (less than one signal per mile) serving the University City and the surrounding area.
University City Boulevard (NC-49). University City Boulevard splits off of North Tryon Street just south of W.T. Harris as a four-lane divided facility along the south side of UNCC and parallel to US-29.
Most of these major roadways serving the Northeast Corridor carry a tremendous amount of traffic. The freeway (I-85) is congested throughout the day and peak hour congestion is severe, lasting several hours. Also, development in and around the UNCC and University Research Park makes W.T. Harris Boulevard the primary connector crossing I-85, but it remains congested most of the day, especially between NC-49 and Mallard Creek Church Road. Due to traffic demand in the area, several improvements are underway, and others are being planned in the Northeast Corridor.
Planned Roadway Improvements Recognizing existing and anticipated growth, the City of Charlotte, the North Carolina Department of Transportation (NCDOT), and local planning agencies have taken initial steps to meet the traffic demand in the Northeast Corridor. NCDOT has identified several projects in its annual Transportation Improvement Program (TIP), and Charlotte has programmed several projects in its Capital Investment Plan. Some of the major TIP projects that are being considered within the Northeast study area are:
• Widening of I-85 to eight-lane section between City Boulevard and Speedway Boulevard exits and six-lane cross section north of Speedway Boulevard to Poplar Tent Road,
• Completion of interstate loop I-485, and
• Signal coordination/Intelligent Transportation Systems (ITS)/ reversible lane options on US-29
Existing Conditions Analysis CDOT provided Average Annual Daily Traffic (AADT) numbers for existing conditions based on historic volume counts taken between 1998 and 2001. Level of service (LOS) analyses were conducted for both roadway segments and intersections within the

36 Charlotte Corridor Major Investment Studies Northeast Corridor Final Report
September 25, 2002
Northeast Corridor study area to determine the overall level of congestion along the roadways. Peak period congestion categories range from Minimal (operating well under design capacity) to Overwhelming (operating over 40 percent above design capacity). The results show the facility volume to capacity (V/C) ratio, which gives an indication of how close to or how much over design capacity the facility is operating at. The V/C ratios below 1.00 represent minimal traffic congestion and V/C ratios higher than 1.00 represents high to overwhelming congestion.
Freeway LOS is dependent on several factors such as directional traffic split, peak hour demand, traffic mix, observed free flow speeds, and the terrain and driver population. I-85 is in the study area and currently is approaching capacity and experiencing severe congestion during peak hours. Table 1-4 indicates that the eight-lane sections are operating at minimal levels of service, and the four-lane sections are operating at minimal to Overwhelming LOS.
Table 1-4. I-85 LOS Analysis Results
Freeway Segment 2000 AADT Total Lanes
V/C Ratio LOS
I-77 to US-29/ NC49 split 84,800-114,700 8 0.67-0.91 Minimal
US-29/ NC49 to Speedway Blvd. 55,100-67,600 4 0.87- 1.06
Minimal to Overwhelming
NOTE: Level of service is defined as follows:
<0.85=minimal, <1.01=Moderate, <1.16=High, <1.31=Severe, <1.40=Extreme, >=1.40=Overwhelming
Table 1-6 presents the results of the major arterial roadway analysis. It shows the critical peak hour LOS by comparing the existing AADT volume to the output table derived exclusively for the given arterial. Currently, over half of the major arterial roadways in the Northeast Corridor are operating at an unacceptable LOS and exhibit significant congestion. The section of North Tryon Street between W.T. Harris and Salome Church Road, and the section of Sugar Creek Road between North Tryon Street and I-85, are shown as having particularly high congestion primarily due to major delays experienced at intersections.

37 Charlotte Corridor Major Investment Studies Northeast Corridor Final Report
September 25, 2002
Table 1-5. Existing Arterial Roadway Critical Peak Hour LOS Analysis Results
Roadway Segment Estimated AADT (2000)
Total Lanes
Critical Peak Hour LOS
North Tryon Street
Between I-277 and Sugar Creek Road 22,100 – 27,100 4 Minimal to High
Sugar Creek Road to W.T. Harris 17,300 – 34,300 4 Minimal to Extreme
W.T. Harris to Salome Church Road 32,000 – 37,000 4 High
Mallard Creek Church Road
NC-49 to US-29 4,800 – 16,400 4 Minimal
US-29 to Mallard Creek Road 16,400 4 Minimal
Prosperity Church Road 13,500 2 Severe
University City Boulevard (NC-49)
I-85 to US-29/NC-49 Split 48,200 4 Overwhelming
US-29 to W.T. Harris 27,000 4 Minimal
W.T. Harris to Cabarrus Co. Line 23,800 – 31,600 4 Minimal
Sugar Creek Road
Eastway to North Tryon Street 26,000 4 Minimal to Moderate
North Tryon Street to I-85 33,300 4 High
I-85 to Graham 10,600 4 Minimal
Graham Street to Eastfield Road 7,700 – 15,500 2 Minimal to Moderate
W.T. Harris Boulevard
NC49 to Mallard Creek Road 28,200 – 50,000 4 High to Extreme
MCR to Old Statesville Road 21,000 – 28,200 4 Minimal
Old Statesville to I-77 15,700 – 20,300 4 Minimal to High
I-77 to Vance Road 6,500 2 Minimal
NOTE: Level of service is defined as follows:
<0.85=minimal, <1.01=Moderate, <1.16=High, <1.31=Severe, <1.40=Extreme, >=1.40=Overwhelming
Arterial capacity varies with roadway characteristics and time of day. For example, arterial segments with the same geometry may have different capacities depending on the number of signalized intersections, area type, observed travel speeds, the percentage of heavy vehicles, lane width or other varying traffic conditions.
The following arterial analysis is based on a planning methodology developed by Florida DOT, which is widely accepted by many transportation planning agencies. The methodology takes into consideration, among other variables, the traffic characteristics (K-factor, D-factor, PHF, flow rates), roadway characteristics (area type, length, turning bays), and signalization characteristics (number of signals, through g/C ratio, signal type). The methodology then outputs a table showing the maximum traffic volume that the arterial in question could handle for a given lane configuration and a desired LOS during the critical peak hour.
Roadway capacities are limited by the operational effectiveness of the associated intersections. Therefore, selected intersections (limited by location importance and the availability of turning movement count data) were studied in the Northeast Corridor.

38 Charlotte Corridor Major Investment Studies Northeast Corridor Final Report
September 25, 2002
Intersection capacity analysis for this project was based on the methodology suggested in the 1997 Highway Capacity Manual. Synchro, a widely accepted capacity analysis software, was used to determine the V/C ratios and the corresponding LOS. The descriptive LOS designations were also used to describe the results as summarized in Table 1-6.
The majority of the intersections are currently operating at or over capacity. Level of service during the evening (PM) peak hour is worse than the morning (AM) peak hour. Only one intersection (36th & North Tryon Street) is operating under capacity during both the peak periods.
Table 1-6. Existing Intersection Capacity Analysis (2001)
AM Peak PM Peak
Intersection V/C Ratio
LOS V/C Ratio
LOS
W.T. Harris Blvd. & Sugar Creek Rd. 1.27 Severe 1.19 Severe
W.T. Harris & North Tryon Street. 1.11 High 1.64 Overwhelming
W.T. Harris & Mallard Creek Rd. 1.16 Severe 1.17 Severe
Eastway Dr. & North Tryon Street. 0.77 Minimal 0.94 Moderate
MCCR & North Tryon Street/ US-29 1.01 High 1.32 Extreme
W.T. Harris & Medical Park Dr. 1.13 High 0.95 Moderate
W.T. Harris & Research Dr. 0.84 Minimal 1.41 Overwhelming
MCCR & Univ. Blvd/ NC49 0.96 Moderate 1.18 Severe
W.T. Harris & I-85 SB ramp 0.54 Minimal 1.83 Overwhelming
30th Street. & North Tryon Street. 0.99 Moderate 1.27 Severe
Sugar Creek Road. & North Tryon Street. 0.93 Moderate 1.01 High
W.T. Harris & J.M. Keynes & University Exec Park 0.96 Moderate 1.58 Overwhelming
7th ST. & Brevard Street. 0.63 Minimal 0.54 Minimal
36th St. & North Tryon Street. 0.56 Minimal 0.74 Minimal
JW Clay & North Tryon Street. 0.78 Minimal 0.83 Minimal
Old Concord Rd. & North Tryon Street. 0.91 Moderate 0.86 Moderate
Mallard Creek Church Road. & Mallard Creek Road. 1.20 Severe 1.93 Overwhelming
NOTE: Level of service is defined as follows:
<0.85=minimal, <1.01=Moderate, <1.16=High, <1.31=Severe, <1.40=Extreme, >=1.40=Overwhelming
Major Problems and Deficiencies Table 1-6 indicates that intersections along W.T. Harris exhibit high to severe traffic congestion in the morning peak and overwhelming in the evening peak hour. Recognizing that this problem will continue into the future, the City and State have programmed various highway and intersection improvements in their long-range plans, including widening North Tryon Street, University City Boulevard and W. T. Harris. These improvements and the future year traffic analysis will be discussed in Chapter 3 of this report.

39 Charlotte Corridor Major Investment Studies Northeast Corridor Final Report
September 25, 2002
CATS is the primary local public transit operator in the Charlotte-Mecklenburg area
1.6.2 Public Transit System
Regional System Overview CATS is the local transit operator and is responsible for public transportation in the Charlotte-Mecklenburg area. The bus network in the area tends to be largely radial, providing service from Center City to outlying neighborhoods and suburban areas. A number of circumferential routes also exist to offer supporting cross-town connections. CATS currently operates a fleet of over 350 buses and para-transit vehicles which serves an average of 50,000 riders per day. Average annual transit ridership in the area increased by about 3.6 percent in fiscal year 2002, and the system is currently transporting 14.7 million passenger trips per year.
Transit service types in the region include: 43 local and 14 express routes, four neighborhood-based services, four shuttles for business parks and two local towns, as well as 76 vanpools. The network consists of local routes which operate between 5:30 a.m. and 1:30 a.m. Monday through Saturday, with 6:30 a.m. to 1:30 a.m. service on Sundays. Express routes provide transportation with limited stops from the suburbs to the Center City area.
Local route fares are $1.00 and express fares are $1.40. Transfers between local bus services are free with a $0.40 transfer from local to express bus services. Various multiple ride passes are available: weekly / local ten ride ($10), monthly ($40) and express ten ride ($14), or express monthly ($56).
Existing Northeast Corridor Transit Service Services that are present in the system and applicable to the Charlotte Northeast Corridor include:
• Three local bus routes - Bus Route 11, a high ridership route, serves the inner portion of the North Tryon Street Corridor and the Hidden Valley Neighborhood. Bus Route 22 follows the industrial corridor along Graham Street and the Tryon Hills/Derita neighborhoods as well as the Wachovia Customer Information Center (CIC) in the University Research Park. Bus Route 39, also a well-used route, follows a generally radial route and serves UNCC.
• Three express routes are also present in the Northeast Corridor. The Concord Express (80X) serves commuters between Cabarrus County and Charlotte, and

40 Charlotte Corridor Major Investment Studies Northeast Corridor Final Report
September 25, 2002
Express Bus Route 54X is a commuter route for University Research Park. In addition, Express Route 81X is an express shuttle funded by Wachovia to transport employees between the Center City Wachovia buildings and the Wachovia CIC in University Research Park.
• Bus 29 is a cross-town service that connects several of the major economic centers in the region, such as South Park, Cotswold Shopping Center, Eastland Mall, UNCC and the University Research Park.
• Uni-Park Rider is a free demand response circulator service that operates in the University Research Park employment district.
Table 1-7 lists the existing transit services in the Northeast Corridor and also shows their system wide performance and service characteristics.
Table 1-7. Transit Performance, Existing Northeast Corridor Bus Routes
Route Number and Name
Hours/Days of Service Frequency Annual
Ridership
System-Wide
Ranking*
11 – North Tryon/ Sugar Creek (Local)
5am – 2 am, Mon. – Sat.6am – 2 am, Sun
10 – 20 min., M-F15 – 35., Sat. Hourly, Sun.
916,000 2
22 – Graham Street (Local)
5am – 2am, M – F6am – 2am., Sat-Sun
40 min., M-F50 min, Sat., Hourly, Sun.
214,000 21
29 – UNCC / South Park (Cross-town)
6am – 11pm,Mon. – Fri. Hourly, M-F 77,000 28
39 – UNCC/ Uptown (Local)
6am – 2am., Mon. – Sat.
30 - 60 min., M-F, Hourly, Sat.
366,000 14
54X – University Research Park Express
6am – 9am &4pm – 7pm, M-F
15 - 20 min. 56,000 3
80X – Concord Express
6am – 9am &4pm – 7pm, M-F
20 – 30 min. 38,000 6
81X – Wachovia CIC Express Shuttle
7am – 7pm, Mon. – Fri. Hourly, M-F NA --
* System Ranking out of 43 Local Routes or 13 Express Routes
Source: CATS, 2002
Near Term Improvements A recently completed short-term transit plan recommends improvements to the countywide transit system over the next five years. For the Northeast Corridor, the report recommends that CATS institute a new Route 11 limited-stop service to UNCC along with the current Route 11 local service. The proposed routing from Center City is via current Route 11 to North Tryon Street, left on McCullough Street, right on University Executive Drive, right on W.T. Harris, and left on University City Boulevard to UNCC. The use of McCullough Street provides closer service to several hotels and a potential Transit Center site at W.T. Harris and University Executive Drive. CATS is also considering combining 11S and 11T to improve the frequency through the Hidden Valley neighborhood.

41 Charlotte Corridor Major Investment Studies Northeast Corridor Final Report
September 25, 2002
1.6.3 Railways
The Northeast Corridor is traversed by several railroad lines with widely varying characteristics. At the extreme northern side of the corridor a portion of the Norfolk Southern (NS) “O” Line, from its origin at the NS main line in the vicinity of Ninth Street to the point where the “O” Line diverges from running parallel to North Graham Street near the community of Derita, lies on the boundary of the Northeast Corridor and the North Corridor. The CSX line that was formerly the Seaboard Coast Line runs across the corridor, just north of the Brookshire Freeway at the southern end of the corridor, and crosses under the Brookshire near the ADM plant just north of the beginning of the “O” Line. The NS main line between Washington and Atlanta forms the southeastern boundary of the corridor. The Aberdeen Carolina and Western turns eastward from the NS main line in the vicinity of North Charlotte and continues southeast of the corridor to Aberdeen where it connects with the CSX route from Raleigh to Columbia, South Carolina.
NS “O” Line The “O” Line is a single-track main line that diverges from the NS Atlanta-Washington main line at the ADM plant and proceeds north through Huntersville, Cornelius, Davidson, and Mooresville to join the NS route between Asheville and Salisbury at Barber Junction, east of Statesville. The portion of the line between the ADM plant and the Statesville Road crossing is out of service, and the crossing of the CSX track just south of Seaboard Street has been removed. Access from Charlotte to the “O” Line currently exists via a cutoff track which leaves the NS Charlotte Yard just north of 30th Street and proceeds west, parallel and to the south of 36th Street, to Atando Junction at North Graham Street and Atando Avenue. The line is basically used in light-density freight service. Customers between Davidson and Charlotte are served by a road switcher out of Charlotte; customers north of Davidson by a road switcher from Barber. The major shipper on the line, Ameristeel, typically receives service from Charlotte six days a week. The service from Barber is less frequent, serving a customer north of Mooresville two or three times per week. However, the Barber switcher travels to Davidson to pick up empty cars set off there by the Charlotte switcher.
Amtrak uses the cutoff track between Charlotte Yard and Atando Junction to turn the Carolinian, which terminates in Charlotte, in the early mornings. The Piedmont, sponsored by NCDOT but operated by Amtrak, which arrives from Raleigh in mid-morning and returns to Raleigh in late afternoon, is turned at midday. The wye (where two tracks meet) at Atando Junction enables the Amtrak crew to make the turnaround. Atando Junction is the nearest point to the current Charlotte Amtrak station where this maneuver can be accomplished.
CSX Line A CSX single-track main line runs through the Northeast Corridor between the “O” Line and the NCRR line, roughly paralleling I-277 and continuing in a northwesterly direction to Mt. Holly Junction and easterly through Matthews to Monroe. The CSX line crosses the NS main line at a diamond crossing a few hundred feet east of the former diamond crossing between the “O” Line and the CSX track. Traffic through the crossing is controlled by a NS dispatcher at a remote location. Continuing east of the crossing, the CSX line passes by the former Seaboard Air Line passenger station, crosses the NCRR at grade in the vicinity of Brevard and 12th Streets, and continues in a southeasterly direction toward Matthews. In the vicinity of the former seaboard station there are several yard tracks in addition to the main line.

42 Charlotte Corridor Major Investment Studies Northeast Corridor Final Report
September 25, 2002
The CSX route, although not as heavily traveled as the NS main line, handles an average of 20 train movements a day. It is not uncommon to observe a CSX train waiting for clearance to cross the NS line. Eastbound trains waiting for clearance may currently block the former “O” Line crossing location; westbound trains likewise block the NCRR/CSX crossing.
Consideration is being given to grade separation of the CSX/NS crossing at Graham Street in conjunction with the Multi-Modal Station project. Preliminary concept plans show the CSX line depressed and the NS main line elevated above present grade. The yard near the seaboard station is expanded to the north and east, with the plan depicting no less than four tracks crossing the NCRR right-of-way at grade.
NS Main Line The NS main line from Atlanta to Washington passes through virtually the entire length of the Northeast Corridor. For most of the corridor, the line is at or near the eastern boundary. The line carries heavy freight traffic, with an average of 30-35 train movements per day. In addition, Amtrak operates the Crescent between New York and New Orleans via Charlotte and Atlanta, the Carolinian between New York and Charlotte, and the Piedmont between Raleigh and Charlotte, all on daily schedules. At present the Amtrak passenger station is located on the west side of the Charlotte Yard, with street access from North Tryon Street. As noted above, plans are being developed to relocate the passenger station to the Multi-Modal Station, along the NS main line in the vicinity of Trade Street.
Aberdeen Carolina and Western The Aberdeen Carolina and Western (ACW) departs the NS main line to the east in the vicinity of East 36th Street, North Charlotte. The line is a lightly-used freight route between Charlotte and Aberdeen. Like the NS main line, this facility would be affected by construction of an overpass to carry the LRT tracks over the NS line in Alternatives NE-4 and NE-7.
1.7 Need for Transportation Improvements
During the past several decades, growth in the Charlotte-Mecklenburg region has been significant. Future growth projections for the region indicate that this trend will continue. It is estimated that the population will increase 43 percent and that employment will increase 50 percent by the year 2025. The Northeast Corridor is also being affected by this growth. Growth in population and employment produces increased demand for travel and thus placing increased strain on the existing transportation system.
The suburbanization of the County’s population and employment has led to a significant increase in automobile use. Because of the dispersal of jobs and residences, the automobile accounts for a large percent of travel in the urbanized areas. Rapid growth in automobile travel has produced congested traffic conditions and regional air quality problems and has affected the mobility of travelers and commuters desiring access to employment opportunities and activity centers in the Charlotte Mecklenburg area.

43 Charlotte Corridor Major Investment Studies Northeast Corridor Final Report
September 25, 2002
Some of the main transportation needs that are applicable to the northeast corridor include:
• A number of roadways within the corridor experience very high traffic volumes with poor levels of service. For example a number of the roadway sections on I-85, NC-49, US-29 and W.T. Harris Boulevard operate above capacity at overwhelming levels of service.
• The congestion on roadways in the corridor is expected to increase through 2025 because of the rapid population and employment growth that has been projected for the County and which will directly impact travel demand within and through the corridor.
• Northeast Corridor contains a high number of office, education and retail employment generators such as the University Research Park, UNCC, University Memorial Hospital, and Concord Mills making the study area a focal point of activity for employees, shoppers and students as well as local residents and businesses that use local routes to access the area. Traffic on I-85 and US 29 is particularly bad because they not only serve as feeders into downtown Charlotte, but also carry through-commuters to employment centers in the corridor.
• Existing roadway network creates weak connectivity and limits access. There are only a few major arterials with very minimal cross-town connections. W.T. Harris Boulevard is really the only major arterial that connects the northeast corridor with the other corridor and adjacent wedges within the county. Also, roadways in the business research parks are curvilinear creating insulated conditions with limited access opportunities.
• Much of the existing land use pattern, with inwardly oriented office parks and retail complexes does not encourage transit or pedestrian travel, thus further disadvantaging other travel modes and increasing automobile congestion.
• Current land use patterns and congestion makes effective bus service difficult. Transit, forced to operate in general-purpose lanes, is subjected to similar delays as a result of poor levels of service thus offering no significant travel time advantage over the private automobile.
• Lack of good transit service to the core employment areas creates few usable alternatives to the private automobile, increasing demand for additional roadway and parking facilities.
• One of the resultant effects of high traffic volumes is poor air quality. Historically, Mecklenburg County has consistently violated the federal standard for ozone levels. The region has currently attained moderate maintenance air quality status, but in order to maintain this levels of air quality attainment, the County has stipulated various policies that would reduce the use of single occupant vehicles, the single most important source of ozone.
• High traffic volumes and congestion also contribute to higher vehicle collision rates thus reducing road safety in the corridor.

44 Charlotte Corridor Major Investment Studies Northeast Corridor Final Report
September 25, 2002
2 ALTERNATIVES, RIDERSHIP AND
COSTS
Chapter Summary Chapter 2 discusses the criteria and process used in the initial screening of alternatives. Descriptions of the transit technologies, alignment alternatives and station types considered in the screening are provided, as well as an overview of public input on the alternatives. The product of the screening of alternatives as described in Chapter 2 is a short list of five refined alternatives. These are evaluated further in Chapters 3 and 4.
2.1 Screening and Selection Process
There are several possible courses of action for addressing the land use, mobility and environmental goals of the region and the Northeast Corridor. The selection of alternatives to be carried forward for more detailed analysis was based on a two-level screening process. This methodology involved identifying a long list of alternatives, screening out alternatives that are not feasible based on a predetermined set of criteria, and evaluating the final set of alternatives based on more detailed criteria. The sections that follow describe the process of screening the alternatives for the Northeast Corridor.
The initial screening process assessed the universe of identified alternatives against the transportation and development goals established for the Northeast Corridor. The study team then eliminated the alternatives displaying fatal flaws – either negative effects, or a clear inability to meet established goals and objectives. The screening process enabled the study team to focus on the remainder of the MIS to focus on the most promising alternatives.
CATS staff, Planning Commission staff and the corridor consultants developed the screening criteria. The screening criteria were consistent with those used in the West, North and Southeast Corridor MISs. They are presented below in Table 2-1. The level of detail corresponds to the specificity of data available for the defined alternatives at this stage in the MIS.
Table 2-1. Screening Factors Used to Refine Alternatives
1. Environmental and engineering issues, including available right-of-way, potential traffic
effects, environmental issues, and environmental justice.
2. Public scoping, including evaluation of comments and issues identified during the scoping process.
3. Redevelopment opportunities, to determine which alignments might not serve areas with opportunities for redevelopment.
4. Development opportunities, to determine which alignments serve areas for future development.

45 Charlotte Corridor Major Investment Studies Northeast Corridor Final Report
September 25, 2002
5. Potential displacements, to determine which alignments have the potential for a high number of residential and business displacements.
6. Activity centers served, to determine which current and future activity centers the alignment may serve.
7. Support of local goals, to determine which alignments serve the adopted neighborhood plans and long range transportation plans, among others.
8. Customer satisfaction, to determine if the alignment would benefit customers in terms of time or dollar savings, and to determine if the service would “make sense” to those who
would use it.
9. Appropriate (dominant) mode, to determine if the mode would meet the transportation needs of the corridor and would fit with the character of the corridor and the overall regional system.
In general, the factors listed above help in determining how much each of the alternatives considered for this MIS help support the 2025 Integrated Transit/Land-Use Plan preferred vision of land use development and transit in the region and the corridor. This part of the planning process included examining to what extent each alternative offer a way to evaluate the extent to which desired mobility improvements – such as faster travel speeds, reduced congestion and improved connectivity between major destinations – might be achieved by the alternatives. They also allow for inclusion of public, community and government input on the alternatives, and consideration of technical/environmental issues.
2.1.1 Summary of Previous System Planning Activities
Rapid transit for the Northeast Corridor has been under consideration for at least a decade. All key initiatives have stressed the need to closely coordinate transit implementation decisions with changes in land use policies to promote more compact, efficient development patterns.
In 1989, The Charlotte Department of Transportation (CDOT) produced a Transit Corridors Study as part of the 2005 Transportation Plan. In that document, the Northeast Corridor was one of eight reviewed as potential transit corridors. A key conclusion of this study was that, similar to other corridors with an existing rail right-of-way, transit could be a viable transportation option provided that low density, dispersed development patterns happening at the time changed to make more efficient use of the extensive large undeveloped tracts along such rights-of way.
After the Centers and Corridors vision was established, a Committee of 100 was formed to develop a transportation and land use vision for the region. In its 1994 report, the Committee of 100 called for official adoption of the Centers and Corridors concept (which made the Northeast Corridor one of the five major corridors), and for identifying and beginning to purchase rights–of-way for fixed guideway transit.
The 2025 Integrated Transit/Land-Use Plan examined both rail and Bus Rapid Transit (BRT) alternatives. The plan recommended a system of BRT primarily along North

46 Charlotte Corridor Major Investment Studies Northeast Corridor Final Report
September 25, 2002
Graham Street, I-85, and Mallard Creek Church Road, ending within the UNCC campus. BRT was the 2025 Integrated Transit/Land-Use Plan recommendation largely because the activity centers to be served were so dispersed. BRT’s routing flexibility was deemed its key advantage. The plan-preferred alternative did not serve the Corridor beyond the University area and advised that any extension of transit should be deferred in the hope that land use and transit coordination along the preferred BRT alignment would result in a pattern of denser development in the University City area.
An important aspect of the 2025 Integrated Transit/Land-Use Plan was that the recommendation of an alternative for the Northeast Corridor and the phasing of its implementation was closely coordinated with the implementation of transit improvements in the other four corridors. Also, the plan explicitly linked the rapid transit recommendations to key feeder bus links and a vast expansion of local bus services throughout the Northeast Corridor.
2.1.2 Technologies Considered
The 2025 Integrated Transit/Land use Plan for Charlotte – Mecklenburg recommended various rapid transit technologies that were then analyzed as part of this MIS, to determine the best-fit modes for the Charlotte Northeast Corridor. Three rapid transit technologies were considered to hold the most merit for further investigation: BRT, commuter rail, and LRT.
Later in the Northeast Corridor study process, a decision was also made to exclude commuter rail and instead focus the Northeast Corridor MIS analysis on BRT and LRT technology alternatives. This decision to omit commuter rail was due to several reasons:
• Right-of-way location is not central to the Corridor. The NCRR / NS alignment is almost at the eastern boundary of the corridor and not readily accessible to key activity centers within the study area, notably the major employment centers west of I-85.
• There would be too few stop locations for good service to existing and probable future land uses. Commuter rail lines typically are used for longer trip lengths, and performance characteristics of the vehicles used would not be compatible with the desire to serve key land uses with frequent, closely-spaced stops.
• Heavy freight traffic volumes on the existing tracks make it likely that new trackage would be needed in order to realize any additional high-speed services.
• The MIS is constrained to consider alternatives only within Mecklenburg County, making the maximum commuter line length about 14 miles. Typical commuter rail line lengths range from 25-60 miles and beyond.
Basic characteristics for BRT, commuter rail, and LRT technologies are described in greater detail below. Actual routings or alignments for various project alternatives will be described in Section 2.2, Definition of Alternatives.
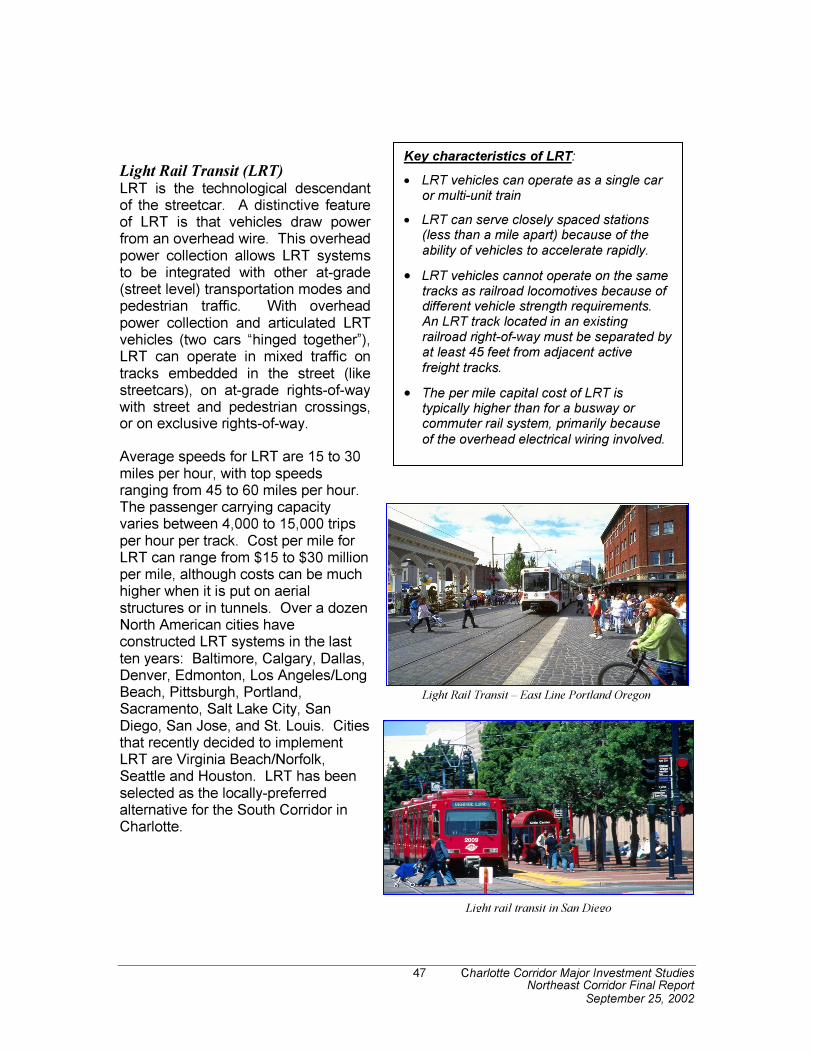
47 Charlotte Corridor Major Investment Studies Northeast Corridor Final Report
September 25, 2002
Light Rail Transit (LRT) LRT is the technological descendant of the streetcar. A distinctive feature of LRT is that vehicles draw power from an overhead wire. This overhead power collection allows LRT systems to be integrated with other at-grade (street level) transportation modes and pedestrian traffic. With overhead power collection and articulated LRT vehicles (two cars “hinged together”), LRT can operate in mixed traffic on tracks embedded in the street (like streetcars), on at-grade rights-of-way with street and pedestrian crossings, or on exclusive rights-of-way.
Average speeds for LRT are 15 to 30 miles per hour, with top speeds ranging from 45 to 60 miles per hour. The passenger carrying capacity varies between 4,000 to 15,000 trips per hour per track. Cost per mile for LRT can range from $15 to $30 million per mile, although costs can be much higher when it is put on aerial structures or in tunnels. Over a dozen North American cities have constructed LRT systems in the last ten years: Baltimore, Calgary, Dallas, Denver, Edmonton, Los Angeles/Long Beach, Pittsburgh, Portland, Sacramento, Salt Lake City, San Diego, San Jose, and St. Louis. Cities that recently decided to implement LRT are Virginia Beach/Norfolk, Seattle and Houston. LRT has been selected as the locally-preferred alternative for the South Corridor in Charlotte.
Light rail transit in San Diego
Key characteristics of LRT:
• LRT vehicles can operate as a single car or multi-unit train
• LRT can serve closely spaced stations (less than a mile apart) because of the
ability of vehicles to accelerate rapidly.
• LRT vehicles cannot operate on the same tracks as railroad locomotives because of different vehicle strength requirements. An LRT track located in an existing railroad right-of-way must be separated by at least 45 feet from adjacent active
freight tracks.
• The per mile capital cost of LRT is typically higher than for a busway or commuter rail system, primarily because
of the overhead electrical wiring involved.
Light Rail Transit – East Line Portland Oregon

48 Charlotte Corridor Major Investment Studies Northeast Corridor Final Report
September 25, 2002
Key characteristics of Commuter rail:
• Vehicles can operate alone or in trains of
up to three vehicles.
• Station spacing tends to be further apart
than for LRT.
• Commuter rail can have a much higher
top speed than LRT.
• The capital cost for commuter rail typically is lower than for LRT because they generally operate in existing railroad rights-of-way, preferably on tracks used by other rail operators, and the overhead
power system is not required.
• Commuter rail vehicles cannot negotiate
tight curves or steep grades like LRT.
DMU Commuter rail - Amtrak Flexliner
Locomotive Hauled Commuter rail - MARC Diesel
Commuter Rail Commuter rail refers to express rail transit operating over conventional railroad tracks. Commuter rail can be trains of passenger coaches pulled or pushed by a diesel or electric locomotive, or advanced DMUs where passenger cars are self propelled and powered by diesel motors mounted on the cars. This system is often used to serve medium to lower density passenger environments. Lines are typically up to 30 miles in length with stations spaced two to five miles apart, and link city centers and mid-size towns with suburban surroundings. Trips tend to be longer, and are mostly journey-to-work trips. Therefore, in some corridors, commuter rail service is only provided during the peak commuting periods in the peak direction.
Average speeds range from 20 to 45 miles per hour, with top speeds reaching 45 to 75 miles per hour. Passenger carrying capacity can range from 1,000 to 20,000 trips per hour per track, depending on frequency of trains and the number of cars per train.
Commuter rail is an attractive option where an available railroad exists and where the tracks can be shared with freight trains. While sharing trackage reduces the capital cost (as compared to building new tracks), commuter rail train schedules and the amount of service provided can be compromised by having to share tracks with intercity passenger and rail freight trains. Locomotive propelled commuter rail can operate at the same time as freight or intercity passenger trains. DMUs do not have adequate vehicle strength to operate concurrently with freight trains [a Federal Railroad Administration (FRA) safety requirement].
Many metropolitan areas have commuter rail systems, including Boston, New York/New Jersey/ Connecticut, Philadelphia/ Wilmington, Baltimore/Washington, Miami, Chicago, Dallas/ Fort Worth, San Francisco/San Jose/ Sacramento, and Los Angeles. Numerous cities are considering commuter rail, and several of these are considering the use of DMUs. DMUs are

49 Charlotte Corridor Major Investment Studies Northeast Corridor Final Report
September 25, 2002
Busway in Ottawa – BRT lanes adjacent to General
Purpose Lanes
Key characteristics of BRT:
• BRT can combine the use of existing
roadways and new bus-only facilities.
• Because a range of vehicle capabilities is feasible, service frequencies can be
matched to travel demand patterns.
• BRT can serve corridor volumes ranging from 1,000-2,000 passengers per hour
up to 20,000 passengers per hour.
• BRT does not require a continuous guideway like rail. It can operate on
existing streets where necessary.
typically higher-performance (better acceleration and deceleration) than locomotive-propelled commuter rail equipment. However, none of the modern, high-performance DMUs meets FRA standards for crashworthiness, and therefore cannot share track with freight trains. Currently there are no modern DMU systems operating in the U.S. However, because of its potential cost savings, several manufacturers are developing vehicles for the U.S. market. The Flexliner, which visited Charlotte-Mecklenburg in early 1998, is one example of a DMU.
Bus Rapid Transit (BRT) This option consists of buses operating in exclusive busways with on-line stations similar to a LRT system, or on roads with improvements to allow buses to bypass traffic congestion. On-line BRT stations can have off-vehicle fare collection, which speeds up service by allowing all doors of the bus to be used for loading.
A key attribute of a BRT system is the ability to employ express buses that combine collection, line-haul, and distribution functions. With a BRT system, a bus could loop through a neighborhood picking up passengers within walking distance of their homes. It then could enter the busway via a special busway ramp and serves on-line stations just like a rail rapid transit vehicle. It then leaves the busway via another busway ramp and circulates through an employment center.
BRT also can make use of high occupancy vehicle (HOV) lanes built as part of the highway program. These are lanes that are open to vehicles carrying more than a designated number of passengers. HOV facilities are included in the region’s adopted LRTP and could be used by buses.
Modern BRT also is beginning to make use of new low floor hybrid technology buses that can operate under both electric and diesel or natural gas power in different parts of the corridor.

50 Charlotte Corridor Major Investment Studies Northeast Corridor Final Report
September 25, 2002
North Shore Busway – BRT in Separate Guideway
In North America, busways have been constructed in Ottawa and Pittsburgh. An arterial street busway developed in Curitiba, Brazil, features fully enclosed, weather-protected and air-conditioned stations with ticket platforms that are level with the floor of the bus. This type of station decreases passenger boarding and exiting times, thereby reducing overall travel time. It also offers passengers a more comfortable and secure waiting environment that is similar to many rail transit stations.
Some communities are using a modification of BRT – called Enhanced Bus/Rapid Bus -- as an early investment strategy. Enhanced Bus/Rapid Bus offers a level of transit above what would be considered local express service with fewer stops, more sophisticated shelters and signs, and real-time passenger information. Enhanced Bus/Rapid Bus, however, has overall less capital investment than BRT, since Enhanced Bus/Rapid Bus usually does not include a dedicated transitway separated from other vehicular traffic. Like BRT, Enhanced Bus/Rapid Bus can serve as a stepping stone to rail transit by building ridership in an alignment. Los Angeles, for example, is using Enhanced Bus/Rapid Bus initially at the end of its new Metro Rail lines. Vancouver and Phoenix also utilize Enhanced Bus/Rapid Bus services on busy corridors with rail potential.
2.1.3 Alignments Considered
Based on the long list of alternatives developed in the 2025 Integrated Transit/ Land-Use Plan, this list was expanded, as shown in Table 2-2, to incorporate suggestions from the public and to accommodate additional knowledge on the mobility needs and issues in the Northeast Corridor.
When the Northeast Corridor MIS began, the Federal Transit Administration (FTA) required consideration of “No-Build” and “Transportation System Management (TSM)” alternatives for every MIS. No-Build means that no action would be taken in the Corridor. TSM includes low cost actions taken to make existing facilities work more efficiently (such as changing the timing of traffic signals to make intersections flow more smoothly or adding more bus service to an existing route), rather than implementing major new transportation projects.
In December 2000, after the Northeast Corridor MIS was underway, the FTA altered MIS requirements and terminology. Now the No-Build and TSM alternatives are replaced by a “Baseline” alternative. The Baseline Alternative was developed because, realistically, some improvements will be made to the existing Northeast Corridor over the next 25 years, so studying a No-Build option would not be particularly valuable.

51 Charlotte Corridor Major Investment Studies Northeast Corridor Final Report
September 25, 2002
Table 2-2 summarizes the long list of alternatives in the Northeast Corridor and highlights the alternatives that were carried forward for more detailed analysis. Note that alternatives were re-numbered in order to maintain the numeric sequence in the next stage of analysis.
The alternatives were screened based on a set of criteria that measure how well each of the alternatives meets the project goals. These criteria are both quantitative and qualitative, and allow decision-makers to quickly compare the advantages and disadvantages of each alternative.
During the first level of screening, a small number of measures that could be readily applied were used. These measures were based on existing and easily obtainable data and information. During the second level of screening, the full array of quantitative and qualitative measures was used based on the data derived from the subsequent analysis.
2.1.4 Station Locations and Types Considered
One of the five overriding goals of the MIS focuses on land use: “to locate stations to sustain local neighborhoods and maximize development opportunities.” Hence a “Station Typology Guide” was created for all the MIS corridor studies to provide for consistency in the design and siting of stations. The station areas are defined by functional category as neighborhood, community, district or regional, based upon their locational context. Each would have a different footprint on the surrounding area and would generate a different level of activity today and in the future. Design elements - such as landscaping, special paving/crosswalks, signage, lighting, shelter, street furniture, public art and civic plazas – would add considerably to the appeal and functionality of the station. Each of the station area types is described and illustrated below.
Neighborhood Stations
Neighborhood stations would be located largely in residential neighborhoods where the potential for pedestrian and bicycle access is high. These stations would offer transit accessibility to a service area where there generally would be limited local bus service and no station-related parking. Neighborhood stations create a center for the immediate area with a high level of walkability and pedestrian-friendly features.
Community Stations
Community stations likely would be located near commercial corridors and/or minor collector or arterial streets where they can be served by the local or feeder bus network. With some parking facilities, they serve several adjacent neighborhoods and beyond. Drop off lanes at the station will be included for “kiss-and-ride” passengers. Because the community station areas will accommodate a mix of residential uses, retail services and offices, they can be developed with a high level of walkability and pedestrian-friendly features. Community stations also offer other TOD, redevelopment and adaptive re-use opportunities.
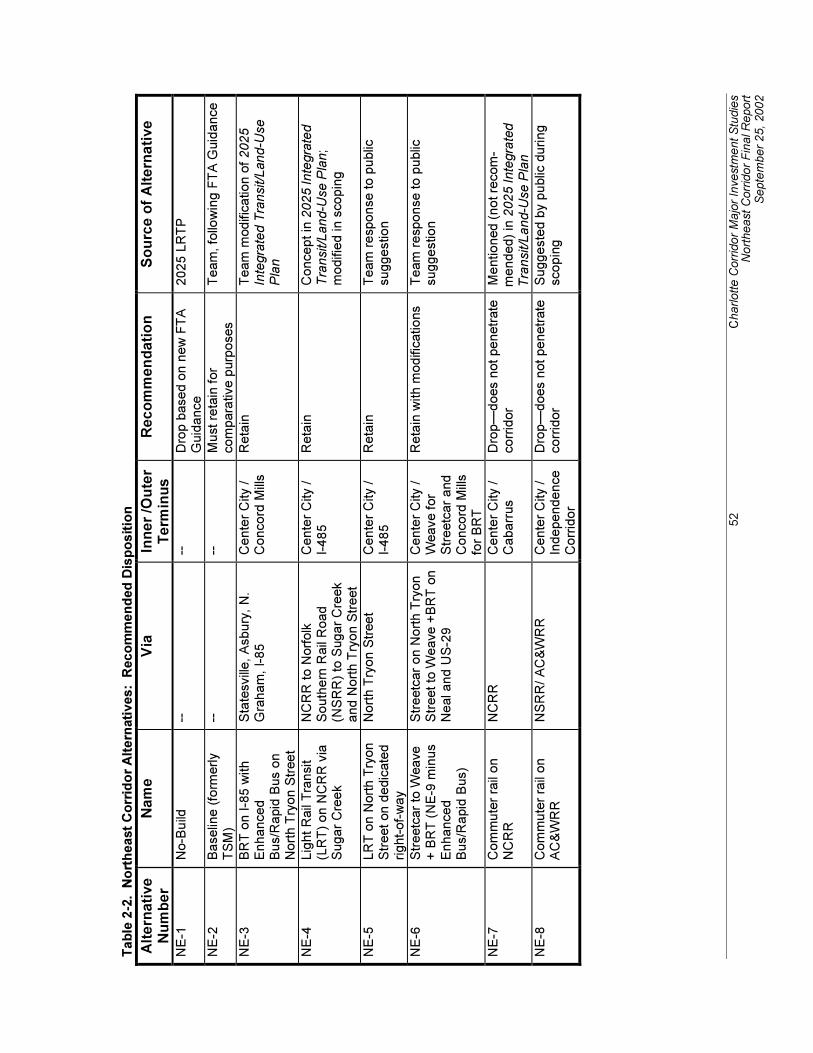
52
Charlott
e C
orr
idor
Majo
r In
vestm
ent S
tudie
s
Nort
heast
Corr
idor
Fin
al R
eport
S
epte
mber
25,
2002
Tab
le 2
-2. N
ort
heast
Co
rrid
or
Alt
ern
ati
ves:
Reco
mm
en
ded
Dis
po
sit
ion
Alt
ern
ati
ve
Nu
mb
er
Nam
e
Via
In
ner /O
ute
r
Term
inu
s
Reco
mm
en
dati
on
S
ou
rce o
f A
ltern
ati
ve
NE
-1
No-B
uild
--
--
D
rop b
ased o
n n
ew
FT
A
Guid
ance
2025 L
RT
P
NE
-2
Baselin
e (
form
erly
TS
M)
--
--
Must re
tain
for
com
para
tive p
urp
oses
Team
, fo
llow
ing F
TA
Guid
ance
NE
-3
BR
T o
n I-8
5 w
ith
Enhanced
Bus/R
apid
Bus o
n
Nort
h T
ryon S
treet
Sta
tesvill
e,
Asbury
, N
. G
raham
, I-
85
Cente
r C
ity /
Concord
Mill
s
Reta
in
Team
modific
ation o
f 2025
Inte
gra
ted T
ransit/L
and-U
se
Pla
n
NE
-4
Lig
ht
Rail
Tra
nsit
(LR
T)
on N
CR
R v
ia
Sugar
Cre
ek
NC
RR
to N
orf
olk
S
outh
ern
Rail
Road
(NS
RR
) to
Sugar
Cre
ek
and N
ort
h T
ryon S
treet
Cente
r C
ity /
I-485
Reta
in
Concept in
2025 Inte
gra
ted
Tra
nsit/L
and-U
se P
lan;
modifie
d in s
copin
g
NE
-5
LR
T o
n N
ort
h T
ryon
Str
eet
on d
edic
ate
d
right-
of-
way
Nort
h T
ryon S
treet
Cente
r C
ity /
I-485
Reta
in
Team
response t
o p
ublic
suggestion
NE
-6
Str
eetc
ar
to W
eave
+ B
RT
(N
E-9
min
us
Enhanced
Bus/R
apid
Bus)
Str
eetc
ar
on N
ort
h T
ryon
Str
eet to
Weave +
BR
T o
n
Neal and U
S-2
9
Cente
r C
ity /
Weave f
or
Str
eetc
ar
and
Concord
Mill
s
for
BR
T
Reta
in w
ith m
odific
ations
Team
response t
o p
ublic
suggestion
NE
-7
Com
mute
r ra
il on
NC
RR
N
CR
R
Cente
r C
ity /
Cabarr
us
Dro
p—
does n
ot penetr
ate
corr
idor
Mentioned (
not re
com
-m
ended)
in 2
025 I
nte
gra
ted
Tra
nsit/L
and-U
se P
lan
NE
-8
Com
mute
r ra
il on
AC
&W
RR
N
SR
R/
AC
&W
RR
C
ente
r C
ity /
Independence
Corr
idor
Dro
p—
does n
ot penetr
ate
corr
idor
Suggeste
d b
y p
ublic
during
scopin
g

53
Charlott
e C
orr
idor
Majo
r In
vestm
ent S
tudie
s
Nort
heast
Corr
idor
Fin
al R
eport
S
epte
mber
25,
2002
Tab
le 2
-2. N
ort
heast
Co
rrid
or
Alt
ern
ati
ves:
Reco
mm
en
ded
Dis
po
sit
ion
(co
nti
nu
ed
)
Alt
ern
ati
ve
Nu
mb
er
Nam
e
Via
In
ner /O
ute
r
Term
inu
s
Reco
mm
en
dati
on
S
ou
rce o
f A
ltern
ati
ve
NE
-9
BR
T o
n U
S-2
9/N
eal
Rd.
with E
nhanced
Bus/R
apid
Bus o
n
Nort
h T
ryon S
treet
Sta
tesvill
e,
Asbury
, G
raham
, U
niv
ers
ity C
ity
Blv
d E
xte
nsio
n, N
eal
Road/U
S-2
9 legs
Cente
r C
ity /
Concord
Mill
s
Inte
gra
ted in m
odifie
d
NE
-6
Concept in
2025 Inte
gra
ted
Tra
nsit/L
and-U
se P
lan;
modifie
d in s
copin
g
NE
-10a
LR
T+
BR
T (
NE
-3)
AC
&W
RR
to C
raig
head
to N
ort
h T
ryon S
treet
Cente
r C
ity /
I-485
Dro
p—
LR
T d
oes n
ot
serv
e h
eart
of corr
idor;
B
RT
stu
die
d in a
ltern
ative
NE
-3
Team
response t
o p
ublic
suggestion
NE
-10b
LR
T+
BR
T (
NE
-3)
AC
&W
RR
to E
astw
ay t
o
Nort
h T
ryon S
treet
Cente
r C
ity /
I-485
Dro
p—
LR
T d
oes n
ot
serv
e h
eart
of corr
idor;
B
RT
stu
die
d in a
ltern
ative
NE
-3
Team
response t
o p
ublic
suggestion
NE
-11a
Str
eetc
ar
to S
ugar
Cre
ek +
BR
T (
NE
-3)
Str
eetc
ar
on N
ort
h T
ryon
Str
eet to
Sugar
Cre
ek +
B
RT
on I-8
5 (
NE
-3)
Cente
r C
ity /
Sugar
Cre
ek
for
Str
eetc
ar
and C
oncord
M
ills f
or
BR
T
Dro
p a
s r
edundant: N
E-3
te
sts
BR
T a
nd N
E-6
tests
str
eetc
ar
Team
response t
o p
ublic
suggestion
NE
-11b
Str
eetc
ar
to W
eave
+ B
RT
(N
E-3
)
Str
eetc
ar
on N
ort
h T
ryon
Str
eet to
Weave +
BR
T
on I-8
5 (
NE
-3)
Cente
r C
ity /
Weave f
or
Str
eetc
ar
and
Concord
Mill
s
for
BR
T
Dro
p a
s r
edundant: N
E-3
te
sts
BR
T a
nd N
E-6
tests
str
eetc
ar
Team
response t
o p
ublic
suggestion
NE
-12
Str
eetc
ar
to S
ugar
Cre
ek +
BR
T (
NE
-9
min
us E
nhanced
Bus/R
apid
Bus)
Str
eetc
ar
on N
ort
h T
ryon
Str
eet to
Sugar
Cre
ek+
BR
T o
n N
eal and
US
-29
Cente
r C
ity /
Sugar
Cre
ek
for
Str
eetc
ar
and C
oncord
M
ills f
or
BR
T
Dro
p in f
avor
of better
serv
ice in N
E-6
T
eam
response t
o p
ublic
suggestion

54 Charlotte Corridor Major Investment Studies Northeast Corridor Final Report
September 25, 2002
District Stations
District stations are situated at or near major collector or arterial streets and/or intersections where they can be served by several major bus routes – and perhaps a bus transfer facility. Drawing from a large sub-region and well connected to major roads, they require more parking (including a park-and-ride facility) than community stations. District stations need strong walkability and pedestrian-friendly features. New development around district stations is envisioned to be multi-level and multi-use with retail employment and multi-family housing.
Regional Stations
Regional transit stations outside of the Center City would include a major park-and-ride facility and be serviced by transit or automobile. Regional stations also may serve as major bus transfer facilities, and may be located at or near regional interstate highway interchanges. Typically associated with regional destinations such as major mixed-use centers or special travel generators such as stadiums or universities, development around these stations is expected to be multi-level and multi-use.
Once candidate stations were located and their function within the alternative determined, they were assigned one of the following hierarchical designations: neighborhood, community, district or regional. This reflects, in ascending order, the presumed direct ridership catchment of the station, whether it would be served by local bus routes, whether it would have significant park and ride functions and whether it is associated with a major special generator. Table 2-3 lists the stations by mode and station typology/type for the Northeast Corridor.
In addition to the direct comments from the public and agencies, station location selection involved input from several other sources. Candidate station locations in the Northeast that evolved throughout the development of the final four Build alternatives were carried through to the end of the MIS process.
Because the number and location of candidate stations identified during the MIS process are highly tentative, the criteria used to locate candidate stations stressed general opportunities and constraints rather than site-specific conditions. Most candidate station locations are based on one or more of the following considerations:
• Major development or redevelopment opportunities in progress. These included the Kings Grant BRT stations (adjacent to the large Concord Mills center) and the 36th Street LRT station in North Davidson (“NoDa”), an area that is already attracting significant redevelopment.
• The location of major specific single users with large ridership potential, such as the TIAA-CREF office campus, the Wachovia complex west of I-85, or the proposed UNCC technology center on US-29.

55 Charlotte Corridor Major Investment Studies Northeast Corridor Final Report
September 25, 2002
Table 2-3. Northeast Corridor Stations
Mode Station Code
Station Type*
BB 16th Community
CC 27th Community
DD North Charlotte Community
EE Sugar Creek District
FF Eastway District
GG Tom Hunter Community
HH City Boulevard District
II McCullough District
JJ W.T. Harris-Hospital District
KK UNCC Regional
LL Mallard Creek Church/US-29 Community
MM Salome Church/I-485 Regional (Park and Ride)
NTA Dalton Community
NTB 28th/North Tryon Street Community
Rail
NTC 36th/North Tryon Street Community
b. Greenville Community
c. Kohler Community
d. Newland Community
ee. Atando Community “(Emp.)
ff. I-85/N Graham District
gg. Derita Community
hh. Spring Crossing Neighborhood
ii. Neal Road Neighborhood
jj. IBM-First Union Community
kk. W.T. Harris District
ll. Research Park Community (Emp.)
mm. Daniel Burnham Community (Emp.)
nn. TIAA-CREF Community (Emp.)
oo. Mallard Creek Church/I-85 District
pp. I-485/I-85 Regional (P&R)
qq. Kings Grant South Community
rr. Kings Grant North Community
zz. Concord Mills Regional
ss. City Boulevard District
tt. McCullough District
uu. Hospital-University Way District
vv. UNCC District
ww. Mallard Creek Church/US-29 District
xx. Pavilion Community (Special Generator
yy. Salome Church District (Special Generator/P&R)
a85. I-85/Sugar Creek Community
b85. I-85/City Boulevard District
c85 I-85/IBM Perimeter Community (Emp.)
BRT
d85. I-85/W.T. Harris District

56 Charlotte Corridor Major Investment Studies Northeast Corridor Final Report
September 25, 2002
• Key locations that already have significant concentrations of mixed use or employment activity, such as McCullough Drive.
• Locations that could be significant redevelopment centers but have yet to attract significant private sector investments, such as the highly underused North Tryon Mall.
• Key highway intersections or interchanges where stations could be easily served by major feeder connections to other areas of the corridor. This consideration was especially important for locating candidate stations for the BRT alternative along I-85.
• Locations within Charlotte very accessible to existing residential neighborhoods, such as the 16th and 27th Street and Tom Hunter LRT stations.
• Potential access by automobile when the main or an important function of the station is to serve a significant park and ride need—e.g., at I-485.
• Special traffic generators such as the Verizon Amphitheater and the nearby Lowe’s Motor Speedway.
While not intended to be site-specific, candidate station locations shown for the alternatives did respond to the following constraints:
• Locations had to be as visible and as accessible to pedestrians as possible.
• Locations had to be free of any major engineering fatal flaws, such as sharp curves on rail alignments.
2.1.5 Screening and Refinement of Alternatives
The screening process consisted of two levels of screening. In the initial screening process or the “first level screening” the study assessed the universe of identified alternatives against the transportation and development goals established for the Northeast Corridor. The study team then eliminated the alternatives displaying fatal flaws – either negative effects, or a clear inability to meet established goals and objectives. During the second level of screening, the study could concentrate on this refined list of alternatives to trade-off benefits and costs and provide the MTC with sufficient materials to make an informed choice on a LPA.
First Level Screening The first level screening was based on existing data and information, extensive fieldwork, a ”windshield” survey of environmental conditions, and the likely ability of the alternatives to meet the corridor mobility and land use goals and objectives. At the completion of the first level screening, five alternatives were carried forward for more analysis and are listed in Table 2-2.
The first level screening process included examining each alternative for the following:
• Presence of engineering or environmental “fatal flaws” that would eliminate an alternative from further consideration.

57 Charlotte Corridor Major Investment Studies Northeast Corridor Final Report
September 25, 2002
• The potential to serve existing land uses and to support future TOD or redevelopment at likely station areas.
• The ability to link major activity/employment/residential centers within the Northeast Corridor and to other centers in Charlotte-Mecklenburg and, therefore, to attract ridership.
• The potential to minimize displacements (relocating businesses or residents to make room for transit improvements).
• The likelihood of capital costs being in an acceptable range.
• The ability to provide equitable service to all people in the corridor.
• The ability of the alternative to provide transit to known transit-dependent communities in the corridors.
Second Level Screening The second level screening was applied to the final alternatives carried forward for more detailed technical analysis. This screening step was based on detailed data and information obtained by preparing conceptual engineering plans; developing capital, operating, and maintenance cost estimates; conducting more detailed environmental analyses covering all typical environmental categories; conducting land use/community development and economic development analyses; meeting extensively with the various publics; and preparing a cost effectiveness analysis using FTA guidance. The results of the second level screening will be considered by the MTC to select a LPA at the end of the MIS process. This consideration will include an assessment of how well each alternative performs with respect to the goals established for this corridor. This assessment will include both quantitative measures of effectiveness and cost effectiveness, and a qualitative assessment of financial feasibility and equity considerations. The sources of these measures are:
• Information needs of the MTC to make an informed decision on a preferred alternative.
• FTA New Starts Criteria (in anticipation of applying for federal discretionary Section 5309 capital funds).
• Corridor-specific needs and issues.
A discussion of the measures used in screening and the application of the process is presented in Chapter 4 of this report.
Public Input on Alternatives An important element of the screening process was the consideration of information obtained during the public involvement activities conducted throughout the study. The input received from many citizens was used to define and refine the alternatives for further consideration in the Northeast Corridor. Meetings were held with various groups including the Northeast Corridor Technical Team, the general public, civic groups, neighborhood and business associations, and stakeholders (parties such as local small business owners with a large “stake” in the decisions made for the Corridor).

58 Charlotte Corridor Major Investment Studies Northeast Corridor Final Report
September 25, 2002
As a result of an extensive public involvement program conducted for the scoping phase of the Northeast Corridor MIS project, a significant amount of public comments, suggestions, and feedback was obtained from the communities in the study area. This public input was considered in the analysis of the range of alternatives being considered, and incorporated in the refinement of the alignments (routes), modes (types of transit), and station locations for the proposed transit corridor. Many issues and concerns were raised throughout the study process. The most prevalent concerns that were raised in the public process included:
• Land use and TOD issues, such as how station locations would affect development and economic revitalization. Participants were also interested in the amenities that would be available at stops, and added that large park-and-rides are unattractive. Northeast Corridor citizens were also concerned about increasing density. They wanted to know the locations where densities would likely increase and to what degree.
• Connectivity and access to other corridors were stressed by many people. They wanted to be able to ride transit to other destinations in the county, not just in the Corridor.
• Citizens wanted to be educated on the differences between the modes. They were interested in trip-times, examples in other cities, and impacts on congestion. Another key point was that no matter which technology was chosen, they wanted “local” and “express” service. As many people expressed in other corridors, Northeast Corridor residents said that there is a “stigma” attached to buses that makes the alternative unattractive; however, they agreed that BRT offers flexibility that LRT doesn’t.
Following is a summary of the additions or modifications that were made to the alternatives carried forward in the MIS process as result of public and agency comments:
• NE-5: Alternative NE-5 was developed in response to UNCC‘s request that high frequency transit service, and in particular, LRT, be considered along US-29, providing good access to both the students and staff of the university. This alternative does not penetrate the campus, at the request of the Chancellor’s office.
• NE-5: As a result of concerns from the Hidden Valley community regarding potential reduction in quality of life because of high density/apartment developments at stations near the neighborhood, two options emerged. First, the alternative that places transit service along North Tryon Street, adjacent to the community, can locate stations at a distance from Hidden Valley. A second option was to retain an alternative that completely bypasses the community by using the NCRR right-of-way.
• NE-6: Interest from the business community to redevelop North Tryon Street between Center City and Sugar Creek Road resulted in the development of a streetcar-type system along that segment of North Tryon Street, causing minimum displacements while providing opportunities for redevelopment at stations.
• NE-6: Increased concerns with traffic and congestion in the University Research Park area resulted in developing a BRT alternative that penetrates the Research Park as well as provides service along US-29. It was merged with the streetcar option to accommodate the North Tryon Street business community.
• NE-3 and NE-6: Interest from Cabarrus County in providing good access to jobs in Mecklenburg resulted in developing an end-of-line station just beyond the county line at Concord Mills.

59 Charlotte Corridor Major Investment Studies Northeast Corridor Final Report
September 25, 2002
• NE-7: The commuter rail alternative along the NCRR corridor was eliminated because it did not meet the goals and objectives of serving appropriate existing and future land uses of TOD. In addition, this rail corridor has been identified as the potential corridor for the Southeast High Speed Rail project.
• NE-4: The public recommended this alternative during the scoping meetings because of the potential availability of right-of-way. It was dropped from further consideration since it does not meet the criteria for the first level screening, including the public desire to have a new form of public transit penetrate the corridor and provide more direct access to locations where people live and work.
These comments were also used to help develop goals and objectives for the Northeast Corridor that reflected these concerns, and the alternatives were refined to make them consistent with community input.
2.2 Definition of Alternatives
The long list of alternatives was reduced to a set of six alternatives that was then evaluated in greater detail. Four “Build” alternatives were recommended for further analysis along with the Baseline Alternative. LRT and BRT technologies were considered.
The four Build alternatives that were studied in more detail are LRT (two alignment variations), BRT, and a combination of LRT operating in a streetcar mode and BRT. These alternatives offered acceptable capital costs, good linkage of centers, minimum displacements, and equitable service. They also appeared to offer opportunities for TOD to serve transit-dependent populations. They presented no fatal flaws and thus met all of the criteria established for the initial analysis.
The alternatives were given designations wherein the letter indicates the corridor (NE for Northeast) and the number represents a particular alternative in that corridor. The 2025 No-Build alternative was designated as “1,” and the TSM alternative as “2”. The Build alternatives in each corridor start at “3”. After this numbering system was developed, it was decided to proceed with a single Baseline alternative rather than separate No-Build and TSM alternatives. For consistency, the numbering was not changed. The new Baseline alternative is “1,” and there is no alternative “2.” The alternatives beginning with “3” and higher designate the Build alternatives.
In the Northeast Corridor, there are two LRT alignment options. The first follows a rail right-of-way and an arterial road median (Alternative NE- 5) and the second is located entirely in arterial road rights-of-way (Alternative NE-4). There are also two BRT alternatives, one of which has a single busway alignment (Alternative NE-3), and the other of which combines a two-alignment busway system with LRT operating in a streetcar mode in mixed traffic (Alternative NE-6).
2.2.1 NE-1: Baseline Alternative
The Baseline Transit Network is the combined No-Build/TSM network. Each of the Build alternatives also includes all the non-express routes in the baseline network as its background and feeder bus service. For each Build network, the Baseline express routes are modified as noted in the descriptions of the Build alternatives.

60 Charlotte Corridor Major Investment Studies Northeast Corridor Final Report
September 25, 2002
The development of the 2025 Baseline Alternative began with expanding bus services on the existing CATS bus network, assuming a continuation of current trends and adoption of the proposed service policies for the ongoing Countywide Transit Services Study. This alternative includes an increased number of transit hubs, expanded express services, and general increases in service to keep pace with passenger demand. The baseline network also includes LRT service in the South Corridor.
To minimize the number of passengers transferring in the Center City, all non-express routes serving Center City Charlotte are through-routed (individual routes are inter-connected). CATS’ routes that are already interconnected remain unchanged. New combined routes were created for route pairs serving corridors on opposite sides of the Center City. The new through-routed bus services are limited to a round trip operating time of approximately 180 minutes. This round trip operating time was achieved by shortening selected routes to serve a series of transit hubs that are also served by a network of local bus routes that do not travel downtown. Express routes operate only during peak periods, with inbound service in the morning and outbound service in the afternoon.
The baseline network consists of LRT service from Pineville to Center City, 18 through-routed trunk routes serving the Center City, 4 circumferential routes linking major passenger generators, 20 local routes providing local service only, and 12 express routes operating to Center City. The peak period service frequencies are:
• 15 minutes on local routes 1, 3, 7, 8, and 12
• 30 minutes on local routes 2, 4, 5, 6, 9, 10, 11 Northeast and 13 to 18 and on express routes 223,240,241 280, 281 and 284.
• 10 minutes on all express routes 200, 201 and 242 to 245 and on local route 11 South,
• 15 minutes for South Corridor LRT service
• 30 minutes for all circumferential routes
• 5 minutes on local route 367
• 10 minutes on local route 364
• 15 minutes on local routes 305 and 365
• 30 minutes on local routes 302, 309, 343 to 345, 348, 349, 363 and 369
• 60 minutes on local routes 303, 306, 347, 362, 366, 370 and 380.
Based on these headways and excluding paratransit vehicles, CATS current bus fleet of 281 vehicles would increase to 346 buses and 14 LRT vehicles by 2025.
The assumed operating speeds including stops for the bus services range from 8 miles per hour in Center City to 20 miles per hour in the outer suburbs. For freeway bus operations the assumed speeds range from 25 to 50 miles per hour. The LRT operating speeds in the South Corridor are consistent with those assumed for the PE/EIS phase of rapid transit planning/design in this corridor. Within the Northeast Corridor there are nine trunk routes serving the Center City, three circumferential routes linking major passenger generators, and one express route operating to Center City.

61 Charlotte Corridor Major Investment Studies Northeast Corridor Final Report
September 25, 2002
Figure 2-1. Map of NE-3 Alignment
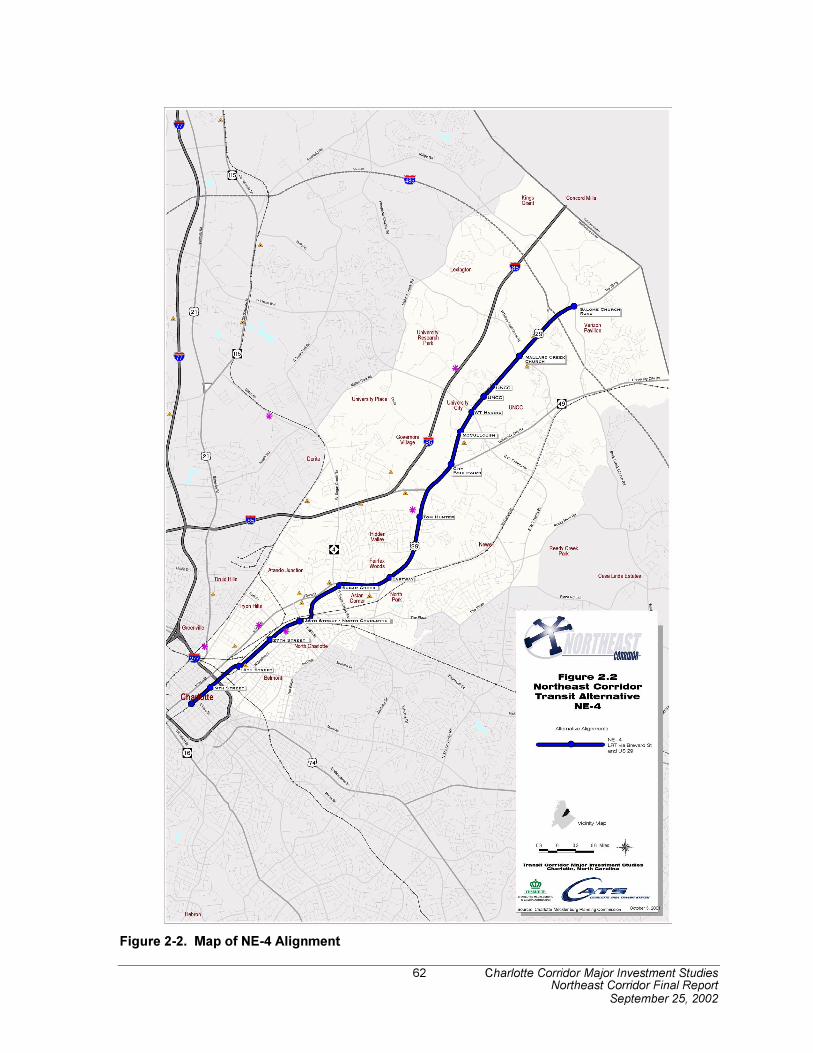
62 Charlotte Corridor Major Investment Studies Northeast Corridor Final Report
September 25, 2002
Figure 2-2. Map of NE-4 Alignment

63 Charlotte Corridor Major Investment Studies Northeast Corridor Final Report
September 25, 2002
LRT in NE-5 would be within its own dedicated
right of way in North Tryon Street.
2.2.2 Alternative NE-3: BRT on I-85
In this alternative, BRT non-express buses from the Charlotte Transportation Center (CTC) would follow Trade Street to the West Trade Multi-Modal Station, then Graham Street in mixed traffic, into an at-grade exclusive busway along the west side of Statesville Avenue, parallel to the railroad tracks. Because of the limited right-of-way, the busway width would be decreased by making it a guided busway and thus avoid taking travel lanes. Buses would continue to just north of LaSalle Street, which they would share with BRT buses in the North Corridor. From Statesville Avenue and LaSalle Street, the buses would operate on a busway alignment next to Asbury Avenue to Graham Street. They would operate in a guided bus alignment between the rail line and Graham Street as far as I-85. At this point the buses would enter shoulder bus lanes on I-85 to just south of I-485, where they would enter an exclusive busway through Kings Grant to a new transit hub at the Concord Mills Mall. There would be 16 stations outside the Center City generally at the locations shown in Figure 2.1. BRT buses would be scheduled every three minutes in peak periods, every six minutes in the midday, and every 15 minutes in the evening. The average operating speed, including station stops, would be 29 miles per hour. Typical in-vehicle travel time between I-485 and the CTC would be 26 minutes.
Four express bus routes would supplement the all-stops service in the peak periods. These express services would follow the same routes as in the Baseline Alternative NE-1, except that they use the busway once they enter the I-85 corridor. The in-vehicle express bus travel time from I-485 to Center City is 22 minutes.
2.2.3 Alternative NE-4: LRT via Brevard and US-29
This alternative would use LRT technology on a double track alignment from the CTC, following the NCRR right-of-way through Center City, skirting the east side of the Charlotte Intermodal Yard, then proceeding on a new alignment to the median of North Tryon Street just south of Sugar Creek Road. The alignment would continue in the median of North Tryon Street and US-29 to the vicinity of I-485. No travel lanes would be taken. As shown in Figure 2.2, there are 12 stations outside the Center City.
The LRT trains would operate every 15 minutes throughout the day. The average operating speed including station stops would be 29 miles per hour. Typical in-vehicle travel time between I-485 and the CTC would be 23 minutes. Four express bus routes would be operated in this alternative.
2.2.4 Alternative NE-5: LRT on North Tryon with Dedicated Right-of-Way
This alternative is similar to Alternative NE-4 except that the LRT technology operates in-street within the street median North Tryon Street and US-29 from the Center City to I-485. The section on North Tryon Street requires purchasing right-of-way to avoid taking travel lanes.
The alignment and the location of the 12 stations outside the Center City are shown in Figure 2.3.

64 Charlotte Corridor Major Investment Studies Northeast Corridor Final Report
September 25, 2002
The average operating speed including station stops of 26 miles per hour is slightly slower than Alternative NE-4 because of the additional in-street running. Typical in-vehicle travel time between I-485 and the CTC would be 24 minutes.
To complement the Atando variation described in Alternative N-3 in the North Corridor MIS Report, Alternative NE-5 provides for an additional optional station at North Tryon Street and the railway overpass. The presence of this optional station is estimated to add about half a minute to the in-vehicle travel time.
2.2.5 Alternative NE-6: North Tryon Streetcar & Bus Rapid Transit on Graham/Research Park/US-29
In this alternative, the BRT service described in Alternative NE-3 would be expanded to provide greater coverage between North Graham Street and I-85 and I-485, as shown in Figure 2.4.
Between Center City and North Graham Street/I-85, the busway alignment would be the same as that of Alternative NE-3. At that point, instead of entering shoulder bus lanes on I-85, the BRT all-stops buses would continue across I-85 in an exclusive busway between the rail track and Graham Street. The busway would follow the proposed extension of University City Boulevard to Neal Road, where it would divide into two separate busways. One busway would serve the University Research Park before entering the I-85 corridor north of Louis Rose Place. The other busway leg would continue on University City Boulevard in a new alignment between US-29 and I-85 to US-29 at McCullough Drive, which it would follow to Salome Church Road and Kings Grant. Both busways would rejoin at Salome Church Road and I-85, and continue as a single facility through Kings Grant to the proposed Concord Mills transit hub.
There would be 24 stations outside the Center City: seven on the inner single busway, eight on the Research Park/I-85 leg, six on the University City Boulevard/US-29 leg, and three on the single busway through Kings Grant. Two all-stops BRT routes would operate in this alternative via the Research Park/I-85 leg and the University City Boulevard/US-29 segment, respectively. Buses would be scheduled every 5 minutes on the University City Boulevard/US-29 segment and every 6 minutes on the Research Park/I-85 segment during peak periods. In the midday, and in the evening buses would be scheduled every 15 and 20 minutes on both busway segments. The combined service headway would be just under three minutes peak, 7.5 minutes midday, and 10 minutes evening on the single busway sections. The average operating speed, including station stops, of the BRT route that serves the Research Park would be 27 miles per hour. Average operating speed for the BRT route serving US-29 and the UNCC would be 28 miles per hour. The typical in-vehicle travel times between I-485 and the CTC via both routes would be 28 minutes.

65 Charlotte Corridor Major Investment Studies Northeast Corridor Final Report
September 25, 2002
Figure 2-3. Map of NE-5 Alignment

66 Charlotte Corridor Major Investment Studies Northeast Corridor Final Report
September 25, 2002
Figure 2-4. Map of NE-6 Alignment

67 Charlotte Corridor Major Investment Studies Northeast Corridor Final Report
September 25, 2002
Four express bus routes would supplement the all-stops service during peak periods. These express services would follow the same routes as in the Baseline Alternative NE-1 except that they would use the busway. The in-vehicle express bus travel time from I-485 to the CTC via both the Research Park route and the US-29 route would be 24 minutes.
In addition to the BRT service in this alternative, there would be LRT service operating every 15 minutes in a streetcar mode on North Tryon Street between Center City and a terminal station at Tom Hunter Road. Streetcar mode refers to operating the LRT in existing travel lanes in mixed traffic, which would tend to slow transit during congested periods. The in-vehicle travel time from Tom Hunter Road to the CTC would be 21 minutes. Average operating speed of the streetcar service would be 18 miles per hour.
2.2.6 Alternative NE-7: LRT on Brevard to UNCC plus US 29 BRT
As shown in Figure 2.5, this “hybrid” alternative NE-7 combines elements of the LRT alignment in Alternative NE-4 with elements of the busway alignment in Alternative NE-6. In NE-7 the LRT alignment is identical to that in NE-4 except that the LRT terminates at the proposed UNCC station on North Tryon Street and the section between UNCC and Salome Church Road is eliminated. Supplementing this LRT alignment is a busway service that serves the University Research Park area and provides a connection between the LRT and Concord Mills. This busway service is similar to that assumed in Alternative NE-6 in the area north of University City Blvd. No busway is provided south of this point in Alternative NE-7 as it is assumed that all busway passengers destined to places like Center City will transfer to the LRT.
From Concord Mills the busway alignment in NE-7 follows the same alignment as NE-6 through Kings Grant serving a major park and ride in the vicinity of I-485 before joining I-85 in the form of shoulder bus lanes. It continues as shoulder bus lanes with stations at Mallard Creek Church Road and TIAA-CREF to a point just north of W.T. Harris Blvd where it connects via exclusive bus ramps to a busway in the vicinity of Daniel Burnham Way. It follows the same busway alignment through the Research Park as in Alternative NE-6 as far as University City Boulevard and Neal Road. At this location instead of continuing to the west and eventually to Center City as in Alternative NE-6, the busway alignment follows University City Boulevard in an at-grade median alignment toward North Tryon Street so as to provide a connection to the LRT at the LRT station at University City Blvd. The median busway terminates west of the University City Boulevard ramps to and from North Tryon Street and the busway buses would operate in mixed traffic with queue jump and signal priority to join North Tryon Street.
On North Tryon Street it is proposed that the buses be co-located with the LRT between the University City Boulevard Station and the UNCC station in a shared LRT/guided busway median alignment. To provide as much operational flexibility as possible and to minimize the need for passengers to make multiple transfers, the busway all-stops service will operate in both directions in a loop from and to Concord Mills via the busway alignment described above, North Tryon Street, Mallard Creek Church Rd, the I-85 shoulder bus lanes and the busway through Kings Grant. Bus operations on North Tryon Street north of the UNCC station and on Mallard Creek Church Road will be in mixed traffic with queue jump and signal priority at major intersections. Express bus routes will be uni-directional services to and from the University City Boulevard LRT station.

68 Charlotte Corridor Major Investment Studies Northeast Corridor Final Report
September 25, 2002
Figure 2-5. Map of Hybrid Alternative NE-7 Alignment

69 Charlotte Corridor Major Investment Studies Northeast Corridor Final Report
September 25, 2002
2.3 Projected Ridership
Estimates of ridership on each of the alternatives were obtained from the regional travel demand model used by the Charlotte DOT. The model has previously been used in the Regional Air Quality analysis and the development of the update to the Regional Long Range Transportation Plan. The multiple travel demand model runs included combinations of alternatives from each of the four corridors being evaluated as part of this MIS process. LRT was used in the South Corridor in all of the regional packages because it is currently the subject of further evaluation in the ongoing Preliminary Engineering/DEIS project. Regional travel on both the highway and the transit systems were estimated and the evaluation of the estimates looked at both.
The range of transit estimates for each of the corridors takes into consideration that the ridership in one corridor is dependent on the transit options and alignments in that corridor as well as the connections to and similar choices in the other corridors. Additional model runs will be performed with the selected corridor alternatives subsequent to this evaluation. Further, ridership was estimated for three components (modes) of transit: base or background bus network; express bus network; and the rapid transit network of guideway or tracks.
2.3.1 Ridership Results

70 Charlotte Corridor Major Investment Studies Northeast Corridor Final Report
September 25, 2002
Table 2-4 includes ridership estimates and other measures of performance for each of the alternatives. The “Daily Guideway Boardings” are those segments of travelers’ transit trips that use the transit services operating on the guideway component of the transit system. “New System Transit Trips” measure those new trips attracted not only by the guideway improvements but also by the other service improvements in the corridor or adjoining sections of the wedges that are part of the overall corridor alternative. Therefore, an alternative’s new transit trips can be nearly equal or even exceed the alternative’s guideway boardings. “Daily Travel Time Savings” are the number of hours of personal travel time saved per day as a result of each alternative. “Transit Dependent Access” refers to the number of riders that could access the alternative based on auto ownership and age.
The most significant result of the evaluation is that all of the BRT options have higher ridership ranges than their rail counterparts. This is because of the higher level of service provided on the BRT guideway (with effective headways in the three to six minute range) and the ability of feeder/support bus routes to use the guideway to eliminate transfers and reduce travel times into the Center City.

71 Charlotte Corridor Major Investment Studies Northeast Corridor Final Report
September 25, 2002
Table 2-4. Projected Ridership and Performance Measures, 2025
Alternatives Transit Mode
Total Daily Boardings
New System Transit Trips
2 Daily Travel Time Savings (hours)
NE-1: Future Baseline1
(enhanced bus service) Bus 6,000 N/A N/A
BRT 16,000-19,000
Rail N/A NE-3: BRT on I-85
Bus3 7,000
13,940 600
BRT N/A
Rail 10,000-12,000 NE-4: LRT on Brevard & US-29
Bus3 6,000
11,940 600
BRT N/A
Rail 9,000-11,000 NE-5: LRT on North Tryon Street w/Dedicated ROW
Bus3 5,000
11,940 100
BRT 17,000-19,000
Rail 2,000-3,000 NE-6: 6: North Tryon Street Streetcar & US-29 BRT
Bus3 7,000
13,940 700
BRT 7,000-10,000
Rail 6,000-8,000 NE-7: LRT on Brevard & US-29 plus US-29 BRT
Bus3 4,000
11,940 1,200
1For Future Baseline, number of daily boardings on bus routes serving corridor
2Over Future Baseline Alternative
3Local and feeder bus service serving corridor
Another important factor in the analysis of the transit alternatives is understanding the origins and destinations of the transit trips. Center City trips are significant because they are more likely to be home based work trips, which are more transit-competitive than other trip types. However, intracorridor trips are also significant since the more intracorridor trips, the greater the balance of transit use along the corridor. Table 2-5 shows the percent of corridor transit trips for the major differing origin-destination markets for each alternative.
Table 2-5. Corridor Transit Trip Origin/Destinations
Percent of Corridor Transit Trips Alternative
To Center City Intracorridor Remainder*
NE-1: Future Baseline (enhanced bus)
16% 40% 44%
NE- 3: Bus Rapid Transit (BRT) on I-85
12% 38% 50%
NE- 4: Light Rail Transit (LRT) via Brevard & US 29
12% 39% 49%
NE- 5: LRT on North Tryon with Dedicated Right-of-Way
13% 40% 47%
NE- 6: BRT on Graham Street/Research Park/ US 29***
10% 37% 53%
NE- 7: LRT with BRT Loop 10% 38% 52%
*Includes trips to other corridors and areas outside of the corridors

72 Charlotte Corridor Major Investment Studies Northeast Corridor Final Report
September 25, 2002
As seen in the above table, most of the build alternatives in the Northeast Corridor have between 10 and 16 percent of their trips serving the Center City and between 37 and 40 percent of their transit trips beginning and ending in the corridor. In all alternatives, about half of the transit trips are to areas other than the corridor and the Center City.
2.3.2 Mobility Consequences
Future Baseline. Under Future Baseline conditions, transit service expands somewhat in terms of geographic coverage, to serve new population and employment growth in presently-unserved parts of the corridor. The new services are typically feeders or local-area circulators that enable residents and employees to access existing line-haul or express routes. Where travel demand forecasts indicate a need, existing service is increased to accommodate growth of demand. Linkage is also created between the North Corridor suburban towns and employment opportunities in the University Research Park / US 29 corridor areas.
This type of service expansion is necessary to maintain transit’s market share and degree of accessibility. To the extent the expansion can be coordinated with development plans it can assist in promotion of Transit Oriented Development and other techniques to improve regional mobility. However, in the absence of fixed guideways and other evidence of permanent commitment to transit service, its ability to assist in TOD is limited. With most of the transit service on general-purpose streets and highways, schedule speeds will not be competitive relative to private autos. Therefore, except for the few situations where preferential treatment can exist, such as the existing Independence Boulevard service, transit’s attractiveness as an alternative to private auto use will be quite limited.
Build Alternatives – General Observations. All the Build alternatives attract more riders than the Future Baseline, and individual trip lengths appear somewhat longer in many cases. This probably reflects the fact that with the improvements in transit provided by the Build alternatives, more origin-destination pairs are accessible by transit, especially for longer, inter-corridor or corridor-wedge trips. In general, BRT provides a one-seat ride for more users than the rail modes, although transfer rates for all Build alternatives appear to be higher than for the Future Baseline. From this we may infer that more users find transit more attractive in the Build alternatives despite the transfer.
Alternative NE-3: BRT on I-85. BRT services to the Northeast Corridor would operate in mixed traffic from the West Trade Multi-Modal Center to an at-grade exclusive busway along Statesville Avenue. Between N. Graham Street and LaSalle Street, minor streets intersecting Statesville Avenue would be restricted to “right-in, right-out” operation, with turning movements across the guideway permitted only at controlled intersections. From Statesville Avenue and LaSalle Street, the buses would operate on a busway alignment next to Asbury Avenue to Graham Street. They would operate in a guided bus alignment between the rail line and Graham Street as far as I-85. An underpass will be provided to cross the busway under the rail line. Similar restrictions on turning movements across the guideway would apply on these segments, with added enforcement automatically occurring along the guided busway segment north of Atando Avenue as a result of the guide curbs. However, there are no intersecting streets alongside Asbury Avenue and relatively few in the N. Graham Street portions of the alignment. At I-85 and N. Graham Street the buses would enter shoulder bus lanes on I-85 to just south of I-485, where they would enter an exclusive busway through Kings Grant to a new transit hub at the Concord Mills Mall.

73 Charlotte Corridor Major Investment Studies Northeast Corridor Final Report
September 25, 2002
Some minor interference with the flow of general vehicular traffic may occur in the vicinity of BRT park-and-ride lots and stations at I-85 ramps, depending on actual locations. BRT will operates in the shoulder lanes, and preferential signal treatment at the off-ramps will help mitigate the interference, as will creation of cut-outs for buses to stop on the on-ramps out of the flow of on-bound general traffic. Preferential treatment of buses at the diamond interchange intersections may have to be minimal in order not to unduly restrict auto flows, but this must be balanced against person-per-hour flow rates that can be achieved by preferential treatment for buses.
This alternative is predicted to attract 7,700 new transit trips in the corridor on an average weekday, and a total of 18,600 daily BRT boardings.
Alternative NE-4: LRT on Brevard and US 29. The LRT alignment in NE-4 operates along the North Carolina Railroad right-of-way from Center City to the vicinity of North Charlotte. The only roadway crossing the railroad right-of-way at grade in that segment is East 16th Street. The LRT operation will be gate-protected and may cause slight delays to traffic on 16th Street, which is a lightly-traveled street. The LRT is planned to cross E. 36th Street on structure, and then turn to cross the Norfolk Southern main line on structure, thus avoiding any conflict with rail traffic. (The LRT will cross under the CSX line east of 11th Street in this alternative.) Further studies are needed to determine if a grade separation will be required at the Sugar Creek Road crossing. Beyond Sugar Creek Road, the alignment passes the Sugar Creek station, then transitions into the median of North Tryon Street (US 29) and continues to I-485.
Stations at 28th and 36th Streets provide excellent transit access to the redeveloping North Charlotte area, and the alignment also reduces travel time for travelers destined to stops along US 29 in the University City and UNCC areas.
The average weekday number of new transit riders in this alternative is 5,800. LRT boardings are predicted at 11,100 on an average weekday.
Alternative NE-5: LRT on North Tryon with dedicated right-of-way. The LRT alignment transitions to North Tryon Street while still in Center City, and continues in a dedicated right-of-way alongside North Tryon Street to the vicinity of Sugar Creek Road, where the tracks transition to the wide median. There are relatively few streets east of North Tryon Street along the portion of the alignment where the tracks will be at the side of the roadway, so conflicts between LRT and autos can be minimized with proper crossing protection. Likewise, few streets cross US 29 in the section where LRT is in the median.
Despite improved access to existing and future development in the University City/UNCC areas, predicted new weekday ridership in this alternative is only 5,400. LRT average weekday boardings are estimated at 9,800.
Alternative NE-6: North Tryon Streetcar & US 29 BRT. BRT service in this alternative operates on the same exclusive guideway leaving Center City as in Alternative NE-3, but continues north of the I-85 crossing of N. Graham Street to the vicinity of Neal Road. At that point the guideway branches, with one alignment continuing through the University Research Park. From there it reaches I-85 north of Harris Blvd. and continues to Kings Grant and Concord Mills. The other branch operates along University City Boulevard and a new alignment to US 29 in the vicinity of McCullough Drive. From there it continues north on US 29 to Salome Church Road and returns to I-85 to rejoin the first branch.
74 Charlotte Corridor Major Investment Studies Northeast Corridor Final Report
September 25, 2002
In this alternative, BRT service reaches many destinations more than in NE-3. Direct access is provided to attractors in the University Research Park; new development planned in the University City area, such as that along McCullough Drive; UNCC; and University Memorial Hospital as well as Concord Mills and the Kings Grant residential development. Trunk route service frequency will be as high as five minutes. This alternative results in 7,800 new average weekday transit trips in the corridor, and an estimated 17,500 daily BRT boardings.
The North Tryon Street Streetcar operates in the middle of North Tryon Street between Center City where it connects with the South LRT line, and a terminus at Tom Hunter Road in the Hidden Valley area. It would operate in much the same fashion as the old-time streetcars, with mid-street platforms and little or no preferential treatment vis-à-vis private autos and trucks. Although it would provide good accessibility to residents and workers along its route, trip times would be relatively long due to on-street congestion.
The lack of a direct link to University Research Park and University City/UNCC is a deterrent to high usage.
Alternative NE-7: LRT on Brevard to UNCC plus US 29 BRT. Alternative NE-7 comprises the LRT alignment from NE-4, only the north terminus is at UNCC rather than Concord Mills. The BRT alignment is essentially the NE-6 BRT alignment(s), but only in the area north of University City Boulevard. It does not extend to Center City; it is assumed that passengers traveling to/from Center City destinations will transfer to the LRT at UNCC. The BRT shares the LRT alignment for a portion of the route, between University City Boulevard and the UNCC terminal of the LRT near J. W. Clay Boulevard.
The BRT outer terminus is at Concord Mills. The route proceeds inbound through Kings Grant, then enters shoulder lanes on I-85 and continues to Daniel Burnham Way. From there it goes through the University Research Park to University City Boulevard, then turns outbound on reaching the LRT alignment and continues outbound on US 29 past the LRT terminus, then returns to I-85 and Concord Mills via Mallard Creek Church Road and the I-85 shoulder lane. The route also operates in the opposite direction, inbound via I-85, Mallard Creek Church Road, and US 29 to University City Boulevard, then west to Neal Road, outbound through University Research Park and return to I-85 and Concord Mills. Portions of the route will be operated in mixed traffic: along JW Clay Boulevard and Daniel Burnham Way in the vicinity of University Village, and along Mallard Creek Church Road between US 29 and I-85.
NE-7 attracts 6,500 new average weekday transit trips in the corridor. BRT ridership, as measured by weekday boardings, is slightly more than half as much as for the BRT alternatives that operate through to Center City, while LRT boardings are lower than for either LRT alternative that operates to a terminus at I-485.
LRT interactions with vehicular traffic and rail operations are as discussed in NE-6, except that the line simply ends with a tail track in the middle of US 29 by J. W. Clay Boulevard, and special operating rules will have to be created and enforced in the alignment portions shared by LRT and BRT. (This situation is not without precedent: buses and LRT vehicles share the Pittsburgh South Hills tunnel.)
75 Charlotte Corridor Major Investment Studies Northeast Corridor Final Report
September 25, 2002
2.4 Capital and Operating and Maintenance Costs
A major factor in determining the effectiveness of the proposed transit investments is the cost of the project. Long term financial plans include both the costs associated with building the project (capital costs) and also the annual expense of running a transit system (operating and maintenance costs).
2.4.1 Capital Costs
Rail and Bus capital costs were estimated by establishing unit costs. These were then adjusted for local conditions and applied to each typical section according to the basic design specifications for the technology to be used in each corridor. Alignments were laid out and typical sections identified for the full length of each line.
Private property acquisitions that would be needed for transportation purposes were mapped and their square footage estimated. Individual parcels were not counted. Right-of-way costs were developed by using the average square-foot costs for the vicinity and type of land use involved. Quantity take-offs were then developed and the cost per running foot for each typical section was applied to establish the cost of trackwork, structures, etc.1 Lump sum costs per station and for the yard and shop complex were developed, and costs per track foot were established for systems. The operating plan, adjusted to reflect ridership forecasts, was used to determine rolling stock (buses, train cars) requirements. Contingencies for each cost category, appropriate to the level of uncertainty for that category, were applied to the basic construction cost estimates. “Soft costs,” including design, construction management, start-up, insurance, and agency administrative costs, were estimated as a percent of construction costs.
Capital costs includes a rolled up sum of the following elements:
• Guideway Elements - Drainage, subgrade, retaining walls, aerial structures, subway structures, trackwork (for rail), paving (for BRT)
• Storage and Maintenance Facilities – Vehicle storage and maintenance buildings, trackwork for rail vehicle storage, maintenance of way facilities, office support areas, major shop equipment, operations control center. Expansion of bus facilities if needed.
• System Elements - Signals and control systems, grade crossing protection, communications, electrification, fare collection equipment.
• Stations - Station buildings, platforms and canopies, station parking and driveways
• Vehicles – Revenue and non-revenue vehicles (rail and bus). BRT, LRT, Commuter rail or DMU transit vehicles based on current market rates.
• Special Conditions - Allowances for utilities relocation, demolition, roadway modifications, environmental mitigation
• Right of Way – Costs of buying land that is required for the various transit build alignments. Land acquisition, relocation, permanent and temporary easements, business damages
1 Quantity take-offs refers to the process of quantifying a project element by a designated measurement, i.e. linear feet
of double track rail.

76 Charlotte Corridor Major Investment Studies Northeast Corridor Final Report
September 25, 2002
• “Soft” Costs - Engineering, project management, project insurance, agency project administration costs.
Table 2-6 summarizes and compares the estimated capital costs by category for each alternative. A description of each category is described above. The table shows that NE-6 has the highest capital costs, estimated at $654 million, which is a combined cost of BRT and LRT alignments. But this is largely because the alternative is a combination of two modes. NE-3 with BRT on I-85 has the lowest costs which are estimated at $210 million. In NE-4 the high LRT costs are primarily attributable to the aerial structure that carries the tracks over the “weave” area where North Tryon Street and University City Boulevard merge and diverge. This structure, needed to avoid adverse impacts on vehicular traffic and to maintain high reliability and average speed for the LRT service, is approximately six-tenths of a mile long. Vehicle requirements amount to $33.4 million, about 9 percent of the total estimated capital cost.
Table 2-6. Capital Cost Estimates ($2002 in Millions)
NE-3: I-85
NE-4: Brevard &
US 29
NE-5: North Tryon
w/Dedicated ROW
NE-6: North Tryon & US 29
NE-7: Brevard & US 29
Capital Cost Item
BRT LRT LRT BRT LRT Total BRT LRT Total
Guideway Elements
$86.4 $119.8 $121.3 $218.8 $73.3 $292.1 $74.5 $96.6 $171.1
Storage & Maint. Facilities
$1.6 $10.4 $11.5 $2.8 $9.2 $12.0 $0.5 $8.1 $8.6
System Elements
$5.6 $50.9 $51.6 $7.4 $25.4 $32.8 $3.8 $40.6 $44.4
Stations $23.2 $33.4 $31.0 $39.7 $11.3 $51.0 $21.9 $26.4 $48.3
Vehicles $14.8 $23.6 $26.3 $13.9 $21.0 $34.9 $2.3 $18.4 $20.7
Special Conditions
$15.3 $28.1 $32.2 $13.5 $16.5 $30.0 $7.0 $22.6 $29.6
Right-of-Way $10.5 $8.7 $8.2 $29.9 $0.0 $29.9 $0.0 $7.0 $7.0
Soft Costs $46.7 $94.2 $108.5 $98.8 $54.2 $153.0 $37.7 $75.3 $113.0
TOTAL $205.4 $369.0 $378.8 $424.9 $210.9 $635.7 $147.6 $294.9 $442.7

77 Charlotte Corridor Major Investment Studies Northeast Corridor Final Report
September 25, 2002
2.4.2 Operating and Maintenance Costs
Operating and Maintenance (O&M) costs were estimated by using the resource build-up cost approach favored by the FTA. The bus cost model was based on CATS experience. Independent variables are peak vehicles, platform hours, vehicle revenue miles, and unlinked passenger trips.
Operating statistics for the Future Baseline and Build Transit Network were derived from the Visum based network model.
Table 2-7. Operating Statistics by Alternative
Alternative Number
Mode Type
Total Peak Vehicles
Total Vehicle Hours
Total Vehicle Miles
Route Direction
Miles
Bus 52 182,000 2,380,000 229 NE-1: Future Baseline Rail - - - -
Bus 99 312,000 5,116,000 398 NE- 3: Bus Rapid Transit (BRT) on I-85
Rail - - - -
Bus 79 246,000 3,250,000 378 NE- 4: Light Rail Transit (LRT) via Brevard & US 29
Rail 7 31,000 749,000 23
Bus 70 236,000 3,048,000 324 NE- 5: LRT on North Tryon Street with Dedicated Right-of-Way
Rail 9 38,000 764,000 23
Bus 103 329,000 5,594,000 436 NE- 6: BRT on Graham/ Research Park/ US 29
Rail 6 16,000 254,000 12
Bus 88 291,000 4,071,000 360 NE-7: LRT with BRT Loop Rail 6 24,000 567,000 17
Table 2-7 shows the annual operating statistics that apply for bus and rail type services in the various project alternatives. The total number of total annual vehicle service hours, which includes garage pull-outs and an allowance for extra service when required, varies from a low of 182,000 hours in NE-1 and 274,000 hours in NE-4, the lowest build alternative to a high of 345,000 hours in NE-6, the highest build alternative. Alternative NE-6 includes both a trolley service and a 2-corridor BRT and thus has more combined service hours than either rail only alternatives NE-4 and alternative NE-5 or alternative NE-3 (BRT only), In terms of the service provided to the public, expressed in the number of revenue miles of service and directional route miles, the “best” alternatives are Alternative NE-3 (BRT only) at 5.1 million annual miles and 398 directional miles of service and Alternative NE-6 (BRT/Trolley) at 5.8 million annual miles and 448 directional miles of service. This datum is based on the service policies summarized in Table 2-8 with adjustments for ridership.

78 Charlotte Corridor Major Investment Studies Northeast Corridor Final Report
September 25, 2002
Table 2-8 Transit Service Characteristics
Headways Mode Span of
Service
Days of
Operation Peak Midday Eve
Train
Consists
LRT 20 Hours 7 days/week 15 15 15 2 pk/1offpeak
BRT 20 Hours 7 days/week 3-15 6-30 15-30
NA
Bus Network Varies Varies 60-5 60-30 60 NA
Table 2-9 shows the annual operating and maintenance costs that apply for bus and rail type services in the various project alternatives. The future baseline (NE-1) is estimated to be $11.7 million. General Administration is estimated at $3.4 million of this total. The bus O&M costs have been calibrated to the existing CATS operation and the general administration share of this total at 29 percent is probably high, as much of this cost is a function of the current rapid transit work now underway and arguably would not apply to a future No-build network or the bus components of any of the build alternatives.
The data in Table 2-9 show that the O&M cost of all the build alternatives is twice or more than that of the future baseline alternative, when the incremental cost of the Build alternative is added to the baseline cost. Among the build alternatives the lowest cost alternatives are those with either rail or BRT but not both. When the rapid transit modes are combined the resulting O&M costs are significantly higher.
Table 2-9. Operating and Maintenance Costs by Alternative
Cost Categories
Mode/ Range Type
NE-1 NE-3 NE-4 NE-5 NE-6 NE-7
Bus $6.0 $4.9 $2.3 $1.9 $5.6 $3.9 Vehicle Operation Costs Rail N/A N/A $2.0 $2.3 $0.9 $1.5
Bus $2.3 $2.9 $1.1 $0.7 $4.6 $3.1 Maintenance Costs Rail N/A N/A $4.9 $5.1 $2.2 $3.7
Bus $3.4 $3.1 $1.6 $1.1 $3.3 $2.3 General Administration Cost Estimates Rail N/A N/A $0.6 $0.7 $0.5 $0.5
Bus $11.7 $10.9 $4.9 $3.7 $13.5 $9.3 Total Operating and Maintenance Cost Estimates
Rail N/A N/A $7.5 $8.1 $3.5 $5.7
Total O&M Cost $11.7 $10.9 $12.4 $11.8 $17.0 $15.0

Charlotte Corridor Major Investment Studies Northeast Corridor Final Report
September 25, 2002
79
3 AFFECTED ENVIRONMENT AND
CONSEQUENCES
Chapter Summary
This chapter lists the transportation, land use and environmental data for the various LRT and BRT alternatives that are used to evaluate the alternatives in chapter 4
One of the goals of the Northeast Corridor MIS is to preserve and protect the environment. Therefore, each of the alternatives identified in the screening process described in Chapter 2 were studied in more detail to identify substantive environmental issues and concerns that may affect the pending decision on the selection of a preferred alternative. This analysis is not a technical assessment of all the environmental conditions in the corridor, but a screening to highlight issues that will be important in the MIS decision process, and to provide information that facilitates a comparison between the proposed alternatives.
The information contained in this chapter will contribute to the evaluation of alternatives and the selection of a LPA. Future development of the preferred investment strategy will require environmental review consistent with the NEPA. This chapter summarizes the results of the analysis. Thirteen specific impact areas have been analyzed as described in the sections that follow.
3.1 Transportation
This section of the MIS Report focuses on evaluation of traffic conditions during the year 2025.
3.1.1 Baseline Conditions
Future year traffic analysis was performed for all intersections discussed in the Existing Conditions section of this report. The analysis of morning and evening peak hour traffic volumes at each intersection under existing conditions was performed using existing turning movement volumes for each intersection approach. The existing conditions turning movements were based on traffic counts obtained by the City of Charlotte. Forecast year 2025 turning movements were estimated by applying growth factors as determined from a comparison of 2000 and 2025 traffic model assignments. Forecast year freeway traffic volumes were also estimated based on applying the growth between the 2000 and 2025 freeway traffic model assignments. The analysis of 2025 conditions for the future baseline and other build alternatives under consideration assumed that planned and programmed highway, intersection and other improvements are in place by 2025.
Major improvements assumed to be in place for the baseline condition by the year 2025 are as follows:

Charlotte Corridor Major Investment Studies Northeast Corridor Final Report
September 25, 2002
80
• I-85 is widened from a 4-lane to 8-lane cross section between City Boulevard and Speedway Boulevard exits and from 4-lane to 6-lane cross section north of Speedway Boulevard to Poplar Tent Road,
• North Tryon Street (between Craighead and Sugar Creek and also University City Boulevard to I-485) is widened to a 6-lane cross section,
• Prosperity Church Road is widened to a 4-lane cross section between Mallard Creek Road and Dearmon Road,
• University City Boulevard is widened to a 6-lane cross section between US-29 and I-485,
• W.T. Harris Boulevard is widened to a 6-lane cross section between NC-49 to US-29 and also between I-77 and Vance Road,
• Mallard Creek Church Road is realigned and widened to a 4-lane cross section between NC-49 and US-29,
• Interstate loop I-485 is assumed to be completed and in operation,
• I-77 is widened and HOV lanes in place, and
• South corridor LRT is in place
Future year analysis results are tabulated in Table 3-1. During the peak periods, Interstate I-85 is expected to be highly congested south of the University City Boulevard intersection and it would operate at moderate congestion level north of University City Boulevard intersection.
Table 3-1. Year 2025 Baseline Freeway LOS Analysis Results
Interstate Segment 2025 AADT Total Lanes
V/C Ratio LOS
I-77 to US-29/ NC49 split 108,000-181,000 8 0.85-1.42 Moderate to Overwhelming
US-29/ NC49 to Speedway Blvd. 108,000-120,000 8 0.70-0.93
Minimal to Moderate
Table 3-2 lists other major roadways (arterials) in the study area and their 2025 baseline operating conditions. Capacity analysis was performed using the same methodology as was used for the existing conditions analysis. Some roadway segments were further subdivided to reflect the programmed roadway improvements in the 2025 Long Range Plan. Future travel conditions on most arterials are expected to be severely congested. However, some roadway segments benefit from the widening recommended in the 2025 Long Range Plan. But congestion remains severe on W.T. Harris even with widening recommended between NC-49 and Mallard Creek Road and also west of I77 to Vance Road.

Charlotte Corridor Major Investment Studies Northeast Corridor Final Report
September 25, 2002
81
Table 3-2. Year 2025 Future Baseline Arterial Roadway Critical Peak Hour LOS Analysis Results
Roadway Segment Range of 2025 AADT
Total Lanes
Critical Peak Hour LOS
North Tryon Street
Between I-277 and Craighead Road 33,100-38,600 4 Severe to Overwhelming
Craighead Road and Sugar Creek Road 34,000 6 Moderate
Sugar Creek Road to W.T. Harris 30,500-50,200 4 High to Overwhelming
W.T. Harris to I-485 40,500 6 Moderate
I-485 to Salome Church Road 44,000-67,400 6 Moderate
Mallard Creek Church Road
NC-49 to US-29 36,800 4 Overwhelming
US-29 to Mallard Creek Road 32,400-41,000 4 High to Extreme
Prosperity Church Road 37,200 4 Overwhelming
University City Boulevard (NC-49)
I-85 to US-29 19,800 4 Minimal
US-29 to W.T. Harris 38,200 6 Moderate to High
W.T. Harris to Cabarrus Co. Line 45,000-52,000 6 High
Sugar Creek Road
Eastway to North Tryon Street 30,700-30,800 4 Moderate to High
North Tryon Street to I-85 41,200 4 Extreme
I-85 to Graham 18,900 4 Severe to Extreme
Graham Street to Eastfield Road 15,900-19,900 2 Severe to Extreme
W.T. Harris Boulevard
NC49 to Mallard Creek Road 41,800-58,400 6 Extreme to Overwhelming
MCR to Old Statesville Road 27,200-31,100 4 Moderate to High
Old Statesville to I-77 25,600-43,200 4 High to Overwhelming
I-77 to Vance Road 52,400 6 Severe
NOTE: Level of service is defined as follows:
<0.85=minimal, <1.01=Moderate, <1.16=High, <1.31=Severe, <1.40=Extreme, >=1.40=Overwhelming
Table 3-3 summarizes the LOS at key intersections. Capacity analysis was performed using the same methodology as was used for the existing conditions analysis. It appears that, under the 2025 baseline scenario, travel condition at a majority of the intersections would be severe to overwhelming (V/C ratios above 1.00).

Charlotte Corridor Major Investment Studies Northeast Corridor Final Report
September 25, 2002
82
Table 3-3. Year 2025 Baseline Intersection Capacity Analysis
2025 AM Peak 2025 PM Peak
Intersection V/C Ratio
LOS V/C Ratio
LOS
Harris/Sugar Creek 4.45 Overwhelming 1.6 Overwhelming
Harris/ North Tryon Street 1.2 Severe 1.68 Overwhelming
Harris/Mallard Creek Rd. 1.88 Overwhelming 1.71 Overwhelming
Eastway Dr./ North Tryon Street 1.05 High 1.3 Severe
MCCR/Tryon Street/US-29 1.77 Overwhelming 2.77 Overwhelming
MCCR/NC49/University Blvd. 1.33 Extreme 1.73 Overwhelming
Harris/I-85 SB Ramp 0.6 Minimal 1.99 Overwhelming
30th/Tryon Street 1.28 Severe 1.54 Overwhelming
I-85 NB ramp/Sugar Creek 1.58 Overwhelming 2.01 Overwhelming
Sugar Creek/ North Tryon Street 1.31 Extreme 1.35 Extreme
Harris/JM Keynes/Univ Exec Park 1.18 Severe 2.06 Overwhelming
7th/Brevard 1.28 Severe 0.89 Moderate
36th/North Tryon Street 0.81 Minimal 1.07 High
JW Clay/North Tryon Street 1.2 Severe 1.99 Overwhelming
Old Concord Rd/North Tryon Street 1.33 Extreme 1.19 Severe
NOTE: Level of service is defined as follows:
<0.85=minimal, <1.01=Moderate, <1.16=High, <1.31=Severe, <1.40=Extreme, >=1.40=Overwhelming
3.1.2 Transportation Consequences
The five build alternatives under consideration for the Northeast Corridor are as follows:
• NE-3: Bus Rapid Transit on I-85 plus Enhanced Bus/Rapid Bus
• NE-4: LRT on NCRR to North Tryon Street via Sugar Creek
• NE-5: LRT on North Tryon Street with dedicated ROW
• NE-6: Streetcar on North Tyron to the Weave plus BRT on US-29 and I-85
• NE-7: LRT on NCRR to North Tryon Street via Sugar Creek terminating at UNCC plus BRT on US-29 and I-85
An evaluation was undertaken to evaluate the extent of traffic consequences in the corridor. This evaluation used three factors:
• Number of traffic lanes impacted i.e. if any existing traffic lanes would be used to realize the particular alternative and thereby reduce roadway capacity.
• Left turns eliminated on local through streets or at major intersections.

Charlotte Corridor Major Investment Studies Northeast Corridor Final Report
September 25, 2002
83
• The number of street closures that would occur as a result of the rapid transit alternative.
The light rail alternatives, NE-4 and NE-5, both operate in the median of North Tryon Street/US-29 to I-485. They vary only in how they enter the Center City. Alternative NE-4 makes use of the existing NCRR right-of-way and NE-5 remains on surface streets. NE-5 eventually uses the NCRR between 9th street and the CTC. Both LRT alternatives, especially NE-5 on North Tryon Street, maintain the existing roadway capacity by acquiring adjacent properties where ROW is not adequate. Roadway capacity could be impacted due to signal pre-emption, and high volume of turning vehicles accessing station/park-and-ride locations. These impacts and appropriate mitigation measures will be explored in detail in the next phase of the study.
At this stage in the MIS study, impacts of rail alternatives were evaluated using the guideline provided in ITE publication “Light Rail Transit Grade Separation Guidelines,” March 1992. The ITE guideline takes into account the train frequency and cross street traffic volume to determine if at-grade crossing is feasible or if more detailed evaluation is required as the study progresses into the design phase. Table 3-4 lists the locations evaluated and recommendations for the rail alternatives. Table 3-4. Year 2025 At Grade Rail Crossing Feasibility
Cross Street Location Peak Hour Volume
# of Lanes
Volume per Lane
Assessment
30th Street N. Tryon St. 1,430 2 715 Needs Further
Evaluation
36th Street N. Tryon St. 820 2 410 Current set up should
work
W. Craighead N. Tryon St. 430 2 215 Current set up should work
Sugar Creek Rd. N. Tryon St. 4,390 4 1,098 Requires Improvements
Eastway Dr. N. Tryon St. 2,510 4 628 Needs Further Evaluation
Old Concord Rd. N. Tryon St. 1,220 2 610 Needs Further Evaluation
Rocky River Rd. N. Tryon St. 670 2 335 Current set up should work
W.T. Harris Blvd. N. Tryon St 6,460 4 1,615 Requires Improvements
Mallard Creek Church Rd.
N. Tryon St 2,340 4 585 Needs Further Evaluation
Pavillion Blvd. N. Tryon St 1,030 2 515 Needs Further Evaluation
Source: “Light Rail Transit Grade Separation Guidelines.” ITE Technical Council Committee
In the northeast corridor traffic lanes are not impacted, since transit build alignments have been accommodated within the existing roadway or railroad right-of-way. In a few cases, for example NE-5 along North Tryon Street, additional right-of-way would be acquired to maintain the existing traffic lanes. The BRT alternative alignments are also designed to use existing right-of-way to minimize impact on traffic lanes. However roadway capacity could potentially be impacted as a result of frequent stops (especially

Charlotte Corridor Major Investment Studies Northeast Corridor Final Report
September 25, 2002
84
without bus bays) signal priority, and high volume of turning vehicles accessing station/ park-and-ride locations. These impacts and appropriate mitigation measures will be explored in detail in the next phase of the study.
The various LRT or BRT alternatives are not expected to remove any existing left turns. However, at certain intersections, some through-traffic and cross-street traffic would likely experience delays as result of rail pre-emption and BRT signal-priority. A few business or private properties are likely to have some accessibility impacts as a result of minor-street or driveway closures. For example on North Graham Street, the BRT alignment on guided right-of-way recommends the closure of Starita Road and Toal Street.
There are two alternatives in the Northeast Corridor that utilize both LRT and BRT technologies. NE-6 uses a LRT operating as a streetcar, on North Tryon Street (NC-29), between the CTC and Tom Hunter Road. The streetcar would operate in mixed-traffic along with other vehicles. Alternative NE-6 also proposes the use of BRT on I-85 shoulders, US-29 median, and through the University Research Park area. The streetcar would not require any additional ROW, but would operate in mixed flow, and frequent stops may contribute to some additional traffic consequences. BRT would not have adverse impact on traffic on I-85 since it would operate on shoulders and have separated off ramps and stations. However, along US-29 and through the University Research Park, there could be some additional ROW required. Alternative NE-7 is similar to NE-4 except that the LRT terminates at UNCC and BRT is more focused around the University Research Park and does not serve the Center City area. As in the other LRT and BRT alternatives, these alternatives, maintain the existing roadway capacity by acquiring adjacent properties where ROW is not adequate.
Generally, traffic consequences for most of the Northeast Corridor build alternatives are minimal. Alternative NE-3 the BRT alignment on I-85, exhibits the lowest traffic consequences. Alternative NE-5, NE-6 and NE-7 exhibit low-medium traffic impacts. NE-5 LRT alternative exhibits comparatively higher traffic impacts because although it is in its own dedicated guideway on North Tryon Street for the majority of the alignment, it will affect left turning movements.
Key traffic issues to be examined in the next phase will include:
• Establishing the degree of segregation between local traffic and the busway.
• Determining the impact of curbside operations on access to local neighborhood and businesses.
• The impact of median operation on traffic circulation within the community.
• Operation of local buses on the busway.
• The right-of-way impacts of maintaining left and right turns.
3.2 Land Use and Economic Activity
The intent of this section is to gain an understanding of each alternative’s existing and future development potential. The approach is designed to provide an understanding of

Charlotte Corridor Major Investment Studies Northeast Corridor Final Report
September 25, 2002
85
the current conditions for the alternatives and the development potential within a one-half mile radius of the candidate stations. The methodology for determining the development potential is summarized. Finally, the land use consequences of each alternative are documented, and a comparison of the alternatives is provided. The result of these analyses is intended to help rate the strengths of each alignment’s land use potential in support of a Locally Preferred alternative for the Northeast Corridor.
3.2.1 Existing and Future Development Potential by Alternative
As part of the MIS process, the land use consultants analyzed the development or redevelopment potential of each alternative by studying the half-mile area surrounding each candidate station. Such an analysis provides the best gauge of how well each alternative may meet the goals of serving a high proportion of existing development, as well as attracting a high proportion of expected future corridor growth.
Differences of “2025 Station Area Development Potential” Data from the Official
CDOT “Trends” Forecasts The quantification of potential land use changes for each alternative presented in this section stems from work specific to this MIS and does not constitute any official forecast or set of growth projections. Consequently, these estimates are not used for other MIS related processes, such as estimation of ridership that must be based on officially adopted forecasts. In Charlotte-Mecklenburg, the allocation of land uses, population, and employment are the 2025 “Trends” forecasts that the Charlotte Department of Transportation (CDOT) prepared in 2001.
When developing the trends forecasts, CDOT staff participated in a projections process that included staff from the CMPC and the other local jurisdictions. The Trends projections had to be based on control totals for the region, policies in place, current zoning, and other factors that limit the conditional aspects of projections to a minimum. The official distribution of future household and job growth within each Corridor had to take into account the overall distribution of jobs and growth within the region. Arbitrary allocations of growth to specific locations were precluded by “zero sum” assumptions used and the technique by which overall control totals would be “disaggregated” to local areas.
In contrast, the land use consultants were not as constrained and could assume optimal policy, financial, and regulatory conditions for transit-related development. This included assuming that all station areas would have appropriate zoning to allow the uses and intensities needed to meet the land use goals of the MIS. Furthermore, in redevelopment areas, where current market demand to build new housing or employment space is weak, the consultants assumed implementation of all key public sector interventions needed to attract private sector investments in transit-oriented development.
Consequently, while the study used official projections to estimate existing (year 2000) households and jobs around candidate stations, all 2025 conditions referred to in the following land use sections were generated as part of this study.
Methods Used to Estimate Future Development Potential by Alternative: Each of the alternatives varies in the total potential year 2025 households and jobs located within one-half mile of the candidate stations associated with that alternative.
Charlotte Corridor Major Investment Studies Northeast Corridor Final Report
September 25, 2002
86
These differences stem from a variety of factors including number of stations, amount of existing development, land available for future development or redevelopment, uses and intensities appropriate to the specific location, established long term policies and foreseeable market demand for such uses.
Since the Baseline Alternative is not an actual alignment, but rather improvements to the existing bus service to be implemented by 2025, it has not been included in the following consequences tables. In general, the Baseline Alternative will deliver improved transit service and improved circulation. However, this alternative does not significantly contribute to specific growth plans, nor is it expected to have direct impacts on land uses or zoning.
To estimate the potential 2025 land use benefits around the candidate stations for each alternative the MIS land use consultants used the following process.
• Through an initial “opportunities and constraints” analysis, the land use consultants estimated the total potential capacity for development and redevelopment around each station for each alternative. Figure 3-1 is the opportunities and constraints summary for the candidate station at Salome Church Road. This illustrates how existing conditions and the designation of development or redevelopment “opportunity sites” were documented for each candidate station.
• Figure 3-2—Total Corridor Station Area Development Opportunities—shows the overall distribution of these sites throughout the corridor along the alternative alignments.
• The next step was to divide this potential capacity among the five land categories: single family and multi-family housing, and office, retail, and “other” employment. Current land use patterns, market trends, and established local plans or committed projects all influenced the land uses and their location around each station. Figure 3-3 is an example of the potential Year 2025 land use for the candidate station at Salome Church Road.
• Figure 3-4 is an example of a more detailed station area “scenario” for the Sugar Creek LRT candidate station. Such scenarios were created for a few selected stations to illustrate in more detail the potential 2025 station area programs, and to show how key urban design and pedestrian walkability objectives cited in Chapter 1 above might be achieved.
• Most stations had more development capacity than was likely to be used by 2025. Consequently, the land use consultant team used a market demand analysis and examined expected growth trends to determine how much new housing and employment development could reasonably be expected by 2025. This means the 2025 land use data is not “build out” data. growth
• Using assumed typical station area yield factors for each land use type2, the land use consultants then translated the presumed demand into total dwelling units or jobs for each station area. These assumed yields were used for all alignments
2 The assumed yield factors were developed for all corridor MIS projects. The resulting assumed yields per gross acre
are: single family households = 6 dwelling units (du)/acre; multi-family =20 du/acre; office employment = 60 employees/acre; retail employment = 25 employees/acre; other employment = 11 employees/acre.

Charlotte Corridor Major Investment Studies Northeast Corridor Final Report
September 25, 2002
87
and in all four corridors with active MIS projects to ensure that the land use benefits of transit implementation in all the corridors could be easily compared.
• Because assessing station area potential at the MIS stage must be very preliminary, all data for jobs and households has been rounded off the increments of the nearest 1,000.
Existing Development One of the evaluation measures used to assess the land use benefits of each alternative is the degree to which it would serve existing households and employment within the Northeast corridor. Table 3-5 shows estimated year 2000 household and employment development within one half mile of the candidate stations for Alternatives NE-3, NE-4, NE-5, NE-6, and NE-7. This table also shows the percentage of the total existing (year 2000 corridor development) that these alternatives would serve.

Charlotte Corridor Major Investment Studies Northeast Corridor Final Report
September 25, 2002
88
Table 3-5. Percent of Year 2000 Development Served by Alternatives (within one-half mile of station areas)
Households* Employment
Alternative
Total Single-Family
Multi-Family Total Office Retail Other
NE- 3: Bus Rapid Transit (BRT) on I-85
4,000 (17%)**
1,000 (25%)
3,000 (15%)
19,000 (33%)
6,000 (21%)
8,000 (73%)
5,000 (28%)
NE- 4: Light Rail Transit (LRT) via Brevard & US 29
6,000 (25%)
1,000 (25%)
5,000 (25%)
16,000 (28%)
5,000 (17%)
6,000 (55%)
5,000 (28%)
NE- 5: LRT on North Tryon Street with Dedicated Right-of-Way
4,000 (17%)
0 (0%)
4,000 (20%)
19,000 (33%)
5,000 (17%)
6,000 (55%)
8,000 (44%)
NE- 6: BRT on Graham/ Research Park/ US 29***
5,000 (21%)
1,000 (25%)
4,000 (20%)
35,000 (60%)
19,000 (66%)
9,000 (82%)
7,000 (39%)
NE- 7: LRT with BRT Loop
5,000 (21%)
1,000 (25%)
4,000 (20%)
34,000 (59%)
19,000 (65%)
10,000 (91%)
5,000 (28%)
All Northeast Corridor 24,000 4,000 20,000 58,000 29,000 11,000 18,000
Source: CDOT
*All data for alternatives has been rounded off to the nearest increment of 1000. **Percentages are of the corridor total (bottom row of table) for each land use.
3.2.2 Consequences of Alternatives
The following sections describe the results of applying the process to each of the alternatives and compare the year 2025 results to the year 2000 level of development. These sections also summarize the basic relationships of each alignment to corridor land uses, and they present the data results for each of the five basic land use categories: Single Family, Multi-Family, Office, Retail, and Other Employment. The following descriptions and discussions of the four alignments and their constituent stations highlight the 2000 to 2025 development potential for households and employment. Key stations are identified.
Alternative NE-3: BRT on I-85 This alternative generally confines transit service to the immediate I-85 corridor with the majority of stations located at key interchanges or intersections along this Interstate. The main exception to this orientation to the Interstate is a segment of the alternative that serves parts of the Statesville Avenue and North Graham Street corridors. Alternative NE-3 passes by some of the key University City activity centers that are adjacent to I-85 such as the TIAA-CREF corporate campus and terminates at the Concord Mills super regional mall. NE-3, however, does not directly serve some key corridor centers such as UNCC. It does provide some transit access to potential redevelopment areas such as portions of the Greenville and Druid Hills neighborhoods.

C
harlott
e C
orr
idor
Majo
r In
vestm
ent S
tudie
s
Nort
heast
Corr
idor
Fin
al R
eport
S
epte
mber
25,
2002
89
Fig
ure
3-1
. E
xam
ple
of
Sta
tio
n A
rea A
naly
sis
S
tati
on
Are
a O
pp
ort
un
itie
s &
Co
nstr
ain
ts S
alo
me C
hu
rch
(L
RT
)

Charlotte Corridor Major Investment Studies Northeast Corridor Final Report
September 25, 2002
90
Figure 3-2. Total Corridorwide Station Area Development Opportunities

C
harlott
e C
orr
idor
Majo
r In
vestm
ent S
tudie
s
Nort
heast
Corr
idor
Fin
al R
eport
S
epte
mber
25,
2002
91
Fig
ure
3-3
. E
xam
ple
of
Sta
tio
n A
rea A
naly
sis
2025 S
tati
on
Are
a P
ote
nti
al
Salo
me C
hu
rch
(L
RT
/BR
T)

C
harlott
e C
orr
idor
Majo
r In
vestm
ent S
tudie
s
Nort
heast
Corr
idor
Fin
al R
eport
S
epte
mber
25,
2002
92
Fig
ure
3-4
. E
xam
ple
of
Sta
tio
n A
rea A
naly
sis
S
tati
on
Are
a C
on
cep
tual S
cen
ari
o S
ug
ar
Cre
ek (
LR
T)

93 Charlotte Corridor Major Investment Studies Northeast Corridor Final Report
September 25, 2002
The accompanying Figure 3-5 reflects the summary differences in development potential (DP) for households and employment between 2000 and 2025 for NE-3.
Figure 3-5. Alternative NE-3, 2000 to 2025 Development Potential Comparisons (within one-half mile of station areas)
Key stations in Alternative NE-3 include:
• Concord Mills: provides transit access to super regional mall and will be a major park and ride opportunity for Cabarrus County
• TIAA-CREF: serves large single user corporate campus with ultimate potential for 10,000 plus jobs
• W.T. Harris: closest transit access to University Place mixed use center
• IBM Perimeter: closest access to major employers south of W.T. Harris
• Kohler and Greenville: would support current and future redevelopment efforts in neighborhoods either side of Statesville Avenue
Alternative NE-4: LRT via Brevard and US-29 This alternative would connect the University City area to Center City via the middle section of the North Tryon Street corridor and North Charlotte. It would end just beyond I-485 where bus feeder connections to such special generators as the Lowe’s Motor Speedway and Verizon Pavilion would be possible. NE-4 serves more directly the growing UNCC campus via its planned technology center on US-29. NE-4 would also be accessible to such centers as University Place, the hospital at W.T. Harris and the McCullough Drive mixed use areas. Unlike the BRT alternatives, NE-4 would also provide direct rapid transit service to such neighborhoods as Hidden Valley or North Charlotte. Furthermore NE-4 would serve currently stressed commercial and employment areas along North Tryon Street and Brevard Road and could help spark interest in redevelopment in such areas.
The accompanying Figure 3-6 reflects the summary differences in development
potential (DP) for households and employment between 2000 and 2025 for Alternative NE-4.
HOUSEHOLDS
0
1000
2000
3000
4000
5000
6000
7000
8000
9000
10000
S IN GLE FA M I LY M U LTI - FA M ILYU N I TS
2000
2025
DP 2000
2025
DP
EM PLOYM ENT
0
5000
10000
15000
20000
25000
OFFI C E R ETA I LJ OB S
2000
2025
DP 2000
2025
DP 2000
2025
DP
OTH ER

94 Charlotte Corridor Major Investment Studies Northeast Corridor Final Report
September 25, 2002
Figure 3-6. Alternative NE-4, 2000 to 2025 Development Potential Comparisons (within one-half mile of station areas)
Key stations in alternative NE-4 include:
• UNCC: site of the planned UNCC technology center and link to the main campus
• McCullough: access to large office and commercial users along McCullough
• Eastway and Sugar Creek: sites of large aging shopping centers that could convert to TOD mixed use
• 36th Street: would serve North Davidson (“NoDa”) area that currently is attracting much revitalization investment
Alternative NE-5: LRT on North Tryon Street The outer 2/3rds of this alternative serves the same land uses as NE-4, the only difference in the alternatives being NE-5 remaining on North Tryon Street south of Sugar Creek Road. This routing provides transit service to such neighborhoods as Tryon Hills and Lockwood as well as employment sites on North Tryon Street south of 36th Street and along Dalton.
The accompanying Figure 3-7 reflects the summary differences in development potential (DP) in Households and Employment between 2000 and 2025 for Alternative NE-5.
Key stations in alternative NE-5 include:
• UNCC; McCullough, Eastway and Sugar Creek as in NE-4
• 28th Street: station could be key redevelopment anchor for this section of North Tryon Street
HOUSEHOLDS
0
1000
2000
3000
4000
5000
6000
7000
8000
9000
S I N GLE FA M ILY M U LTI - FA M ILYU N I TS
2000
2025
DP 2000
2025
DP
EM PLOYM ENT
0
2000
4000
6000
8000
10000
12000
14000
16000
OFFI C E R ETA I LJ OB S
2000
2025
DP 2000
2025
DP 2000
2025
DP
OTH ER

95 Charlotte Corridor Major Investment Studies Northeast Corridor Final Report
September 25, 2002
Figure 3-7. Alternative NE-5, 2000 to 2025 Development Potential Comparisons (within one-half mile of stations)
Alternative NE-6: BRT via Research Park and US-29 This alternative includes some of the BRT stations along I-85 that are part of I-85. But NE-6 more directly serves key University City activity centers by routing one right-of-way section through a large part of the University Research Park and another section along most of US-29 north of the new City Boulevard connection to I-85. This alternative also provides transit service to predominantly residential areas near Derita and Neal Road.
The dual alignments of NE-6 provide direct BRT service to such key single users as the First Union (now Wachovia) corporate campus south of W.T. Harris Boulevard, UNCC’s planned technology park and TIAA-CREF as well as multi-user, mixed use areas such as McCullough. This configuration gives NE-6 a substantial existing job base –especially for office employment--that is expected to continue to grow. Furthermore, this alternative could benefit if the Research Park added more mixed use or residential development.
Unlike the rail alternatives, this alternative limits transit service in the bottom half of the Northeast corridor to its western edge.
The accompanying Figure 3-8 reflects the summary differences in development potential (DP) for households and employment between the 2000 and 2025 for Alternative NE-6.
HOUSEHOLDS
0
2000
4000
6000
8000
10000
12000
14000
S IN GLE FA M I LY M U LTI - FA M ILYU N I TS
20002025
DP 2000
2025
DP
EM PLOYM ENT
0
5000
10000
15000
20000
25000
30000
35000
40000
OFFIC E R ETA ILJ OB S
2000
2025
DP 2000
2025
DP 2000
2025
DP
OTH ER

96 Charlotte Corridor Major Investment Studies Northeast Corridor Final Report
September 25, 2002
HOUSEHOLDS
0
2000
4000
6000
8000
10000
12000
14000
S IN GLE FA M I LY M U LTI - FA M ILYU N I TS
20002025
DP 2000
2025
DP
EM PLOYM ENT
0
5000
10000
15000
20000
25000
30000
35000
40000
OFFIC E R ETA ILJ OB S
2000
2025
DP 2000
2025
DP 2000
2025
DP
OTH ER
Figure 3-8. Alternative NE-6, 2000 to 2025 Development Potential Comparisons (within one-half mile of stations)
Key stations in alternative NE-6 include:
• Concord Mills, TIAA-CREF: as in NE-3
• UNCC, McCullough, W.T. Harris: as in NE-4 and NE-5
• City Boulevard: potential BRT station would be more centrally located within one of few largely undeveloped areas south of W.T. Harris
• IBM-First Union: would directly serve major employment areas west of I-85 and south of W.T. Harris
• Daniel Burnham: would directly serve major employment areas west of I-85 and north of W.T. Harris as well as University Place
• Kohler and Greenville: as in NE-3
Alternative NE-7: LRT via Brevard and US-20 with US-29 BRT Loop This alternative emerged as a hybrid in the later stages of the MIS process and is a means to provide key land use benefits of Alternatives NE-4 and NE-6 while reducing overall costs. In effect NE-7 resolves the difficulties of serving the two distinct halves of the Northeast Corridor. NE-7 combines transit support for stabilization and redevelopment along North Tryon Street and in North Charlotte with transit access to many of the key activity centers in the University City area. This alternative does not provide any transit connections to the Northeast Corridor from Derita or the Statesville Avenue or North Graham areas and it does not provide LRT service past UNCC. Nevertheless the existing and potential households and jobs served are close to the NE-6 totals—slightly fewer for households and slightly more for employment.
The accompanying
Figure 3-9 reflects the summary differences in development potential (DP) for households and employment between the 2000 and 2025 for Alternative NE-7.

97 Charlotte Corridor Major Investment Studies Northeast Corridor Final Report
September 25, 2002
HOUSEHOLDS
0
2000
4000
6000
8000
10000
12000
14000
S IN GLE FA M I LY M U LTI - FA M ILYU N I TS
20002025
DP 2000
2025
DP
EM PLOYM ENT
0
5000
10000
15000
20000
25000
30000
35000
40000
OFFIC E R ETA ILJ OB S
2000
2025
DP 2000
2025
DP 2000
2025
DP
OTH ER
Figure 3-9. Alternative NE-7, 2000 to 2025 Development Potential Comparisons (within one-half mile of stations)
Key stations in alternative NE-7 include many of those cited for the other alternatives:
• Concord Mills, TIAA-CREF: as in NE-3
• UNCC, McCullough, Eastway, Sugar Creek and 36th Street; as in NE-4 and NE-5
• City Boulevard, IBM-First Union and Daniel Burnham: as in NE-6
3.2.3 Comparison of Alternatives to Each Other
Upon documenting the potential 2025 station area land use potential for each alternative, it became possible to compare the quantitative land use benefits for households and jobs of each alternative to the others. Table 3-6 summarizes the year 2025 station area potential for each of the alternatives and compares these results to the year 2000 estimates for each alternative. Figure 3-10 presents these findings in a bar chart format.
Table 3-6. Comparison of Year 2000 and Year 2025 (Potential) Development within one-half mile of Northeast Candidate Stations*
Households Employment Alternative** 2000
Total 2025 Total
Change 2000 Total
2025 Total
Change
NE- 3: BRT on I-85 4,000 12,000 8,000 19,000 37,000 18,000
NE- 4: LRT via Brevard & US 29
5,000 11,000 6,000 16,000 27,000 11,000
NE- 5: LRT on North Tryon Street with Dedicated Right-of-way
5,000 10,000 5,000 20,000 30,000 10,000
NE- 6: BRT on Graham/ Research Park/ US 29
5,000 16,000 11,000 35,000 55,000 20,000
NE- 7: LRT with BRT Loop 4,000 11,000 7,000 34,000 56,000 22,000 *Data are rounded off to the nearest increment of 1,000 ** Does not include data for Center City stations.

98 Charlotte Corridor Major Investment Studies Northeast Corridor Final Report
September 25, 2002
Figure 3-10. Comparison of 2000 and 2025 Potential Jobs and Households for Northeast Corridor Alternatives
Table 3-6 provides some of the key land use data used in the evaluation of the alternatives described in Chapter 4 of this Summary Report. The evaluation process compares many factors, and the numbers presented in this analysis are combined with other qualitative evaluations to reach a decision regarding overall land use benefits. A full discussion of the evaluation for land use and other issues is contained in Chapter 4. Nevertheless, it is appropriate here to highlight some of the more significant implications of the estimates described above.
• The first two LRT alternatives are quite similar in their land use benefits for both households and jobs.
• The primary difference between NE-4 and NE-5 (compared to NE-7) is the shorter length of the LRT component of NE-7, and the use of UNCC as the LRT terminus for NE-7. The BRT component that is part of NE-7 would provide service to the more outlying areas of the corridor.
• The BRT-only alternatives differ significantly when compared to each other, primarily because of the greater number of stations in NE-6, compared to NE-3.
• By being confined largely within the I-85 right of way, NE-3 does not serve key developments within the University Research Park as directly as does NE-6.
12,00011,000
10,000
16,000
11,000
4,0005,000 5,000 5,000
4,000
37,000
27,000
30,000
54,00056,000
19,000
16,000
20,000
35,00034,000
0
10,000
20,000
30,000
40,000
50,000
60,000
Northeast
3
Northeast 4
Northeast
5
Northeast
6
Northeast 7
Jobs/H
ouseholds
Housing 2025 Housing 2000 Jobs 2025 Jobs 2000

99 Charlotte Corridor Major Investment Studies Northeast Corridor Final Report
September 25, 2002
• Compared to the two LRT-only alternatives (NE-4 and NE-5), the BRT alignments have the potential to serve a greater amount of existing and future employment. This is because the BRT would run closer to large University Research Park employers such as TIAA-CREF and Wachovia. However, much of this development is expected to occur with or without transit. (In effect, this is development that could be expected as part of the Baseline alternative.)
• In contrast, much of the household and employment growth associated with the LRT options would stem from redevelopment efforts at many of the LRT stations, a benefit less likely to occur at such sites without transit.
• By adding the BRT loop option to the modified LRT option, alternative NE-7 combines the stabilization and redevelopment potential of the LRT in the inner half of the corridor with BRT’s ability to serve many of the more dispersed key activity centers of the University City area in the upper half of the corridor.
Total and Post-2025 Development Potential Another means to evaluate the alternatives is to compare the total potential TOD capacity (measured in acres), by calculating the amount used up between 2000 to 2025 and the remaining post-2025 development capacity of each alignment. Transit is a long-term investment, and its land use benefits will extend well beyond the 2025 horizon year used for this MIS. Measuring total capacity as well as estimating that remaining after 2025 provides a quantitative factor in evaluating the potential TOD benefits of each alternative that was is part of the evaluation described in Chapter 4.
Table 3-7 describes the total development and redevelopment capacity in acres for each
alternative in terms of the amount absorbed by 2025 as well as the amount that would presumably be available for post-2025 station area development.
Table 3-7. 2000 to 2025 Development Potential Comparisons, by Alternative
Alternative Total Capacity (Acres)
Capacity Absorbed by 2025
(Acres)
Capacity Remaining Post
2025 (Acres)
NE- 3: BRT on I-85 1,523 958 (63%) 565 (37%)
NE- 4: LRT via Brevard & US-29
1,395 759 (54%) 636 (46%)
NE- 5: LRT on North Tryon with Dedicated Right-of-way
1,438 679 (47%) 759 (53%)
NE- 6: BRT on Graham/ Research Park/US-29
2,355 1,267 (54%) 1,088 (46%)
NE- 7: LRT with BRT Loop 1,994 1,017 (55%) 837 (45%)
3.3 Property Consequences
Property may be affected in a number of ways. One of these relates to direct property acquisitions as a result of right-of-way requirements. The other relates to access and mobility impacts as a result of the new rapid transit system.

100 Charlotte Corridor Major Investment Studies Northeast Corridor Final Report
September 25, 2002
3.3.1 Property Acquisitions
Acquisition of property will be necessary to implement any of the proposed alternatives for the Northeast Corridor. The property required is dependent upon the design and operational requirements for each particular mode and alignment. The proposed alignments for the alternatives in the Northeast Corridor use existing rights-of-way of highway, major arterial and railroad corridors for the major portion of the proposed alignments. This provides an opportunity to minimize the impacts to properties, residences, and businesses adjacent to the alternatives.
This assessment of impacts is based on conceptual engineering efforts and considers only the property acreage necessary for the estimated right-of-way needed for the proposed transit alternative alignments, along with some station area requirements. It does not provide estimates of additional acquisitions including displacements of residences, businesses, or other structures that may be necessary to address indirect impacts (such as access for construction vehicles) to properties along the proposed alignments. It is likely that in addition to the estimates of property acquisitions contained in this analysis, there would be property acquisitions and displacements of buildings as a result of construction activities and other disturbances and encroachments during project implementation for any of the alternatives. A more detailed assessment of the total acquisition and relocation impacts of the alternatives would be conducted as part of the later phases of project development.
Table 3-8 lists the total acreages estimated for property acquisitions based on the land to be
acquired for the proposed right-of-way, station parking, and bus terminal areas for each alternative.
The Future Baseline Alternative would not require commercial or residential acquisitions or displacements.
Table 3-8. Estimated Property Acquisitions
Alternative Potential ROW Acquisition (in acres)
NE-3: BRT on I-85 40 – 50
NE-4: LRT – Brevard 28 – 35
NE-5: LRT on North Tryon Street 16 – 20
NE-6: North Tryon Street Streetcar & BRT on Graham/ Research Park /US-29
65 – 75
NE-7: LRT with BRT Loop 50 – 60
Alternative NE-3 involves the operation of BRT service along the existing I-85 corridor for the majority of the proposed alignment, and along major arterials near Center City Charlotte, thereby minimizing the impacts along the project corridor. Approximately 30 to 35 acres of property would be acquired in very small amounts along certain portions of these arterial roadways and at highway interchanges to accommodate the BRT alignment and maintain existing traffic lanes. Property acquisitions for station area parking and bus terminal facilities could require an additional 10 to 15 acres for a total of 40 to 50 acres of property acquisition for Alternative NE-3. Most of the affected properties are in industrial and warehouse uses or vacant parcels.

101 Charlotte Corridor Major Investment Studies Northeast Corridor Final Report
September 25, 2002
Alternatives NE-4 and NE-5 have similar impacts regarding property acquisitions since they use the existing North Tryon Street corridor for a major portion of their alignments.
Alternative NE-4 would require property acquisitions along the intermodal rail yard and within a primarily industrial and manufacturing area in the southern portion of this corridor. Approximately 20 to 25 acres could be required for the alignment of Alternative NE-4. Most of the affected properties are industrial or vacant parcels. In addition to the property acquisitions for the rail alignments, property would be required for parking and bus transfer areas at some of the proposed light rail transit stations, which could require an estimated eight to ten acres to accommodate the station area elements. The total property acquisition for Alternative NE-4 is estimated to be 28 to 35 acres.
Alternative NE-5 would require property acquisitions along North Tryon Street to accommodate the light rail facility and to maintain traffic lanes. Approximately eight to ten acres could be required for this alignment. Most of the affected properties are in industrial and commercial uses or vacant parcels. Alternative NE-5 could also require an estimated eight to ten acres for the station area parking and bus terminal elements. The total property acquisition for Alternative NE-5 is estimated to be 16 to 20 acres.
Alternative NE-6 would require property acquisitions along existing arterial roadways and would require property to construct the BRT facility on a new alignment within the Derita and University City and University Research Park areas. The streetcar component of this alternative would use the existing North Tryon Street corridor for the majority of its alignment. Approximately 45 to 50 acres of property acquisition could be required for Alternative NE-6. In addition, an estimated 20 to 25 acres could be needed for the station area parking and bus terminal facilities. A total of 65 to 75 acres of property acquisition could be required for Alternative NE-6. The majority of properties that would be affected are undeveloped parcels and properties in industrial/warehouse and office uses.
Alternative NE-7 would require property acquisitions for the light rail portion along the intermodal rail yard and within a primarily industrial and manufacturing area in the southern section of this corridor. The BRT component of Alternative NE-7 would require property acquisitions along existing arterial roadways and would require property to construct the BRT facility on a new alignment within University City and University Research Park areas. Approximately 30 to 35 acres could be required for the alignment of Alternative NE-7. Most of the affected properties are industrial or vacant parcels. In addition to the property acquisitions for the BRT and rail alignments, property would be required for parking and bus transfer areas at some of the proposed stations, which could require an estimated 20 to 25 acres to accommodate the station area elements. The total property acquisition for Alternative NE-7 is estimated to be 50 to 60 acres.
Several measures are available to minimize the adverse impacts to properties and landowners as a result of right-of-way acquisitions for any of the alternatives. During the design refinements of the project, efforts would be made to minimize the amount of right-of-way required. Relocation assistance would be provided to residents and business displaced in accordance with Federal Uniform Relocation Assistance and the Real Property Acquisitions Act to assist landowners and tenants affected by the project right-of-way requirements.
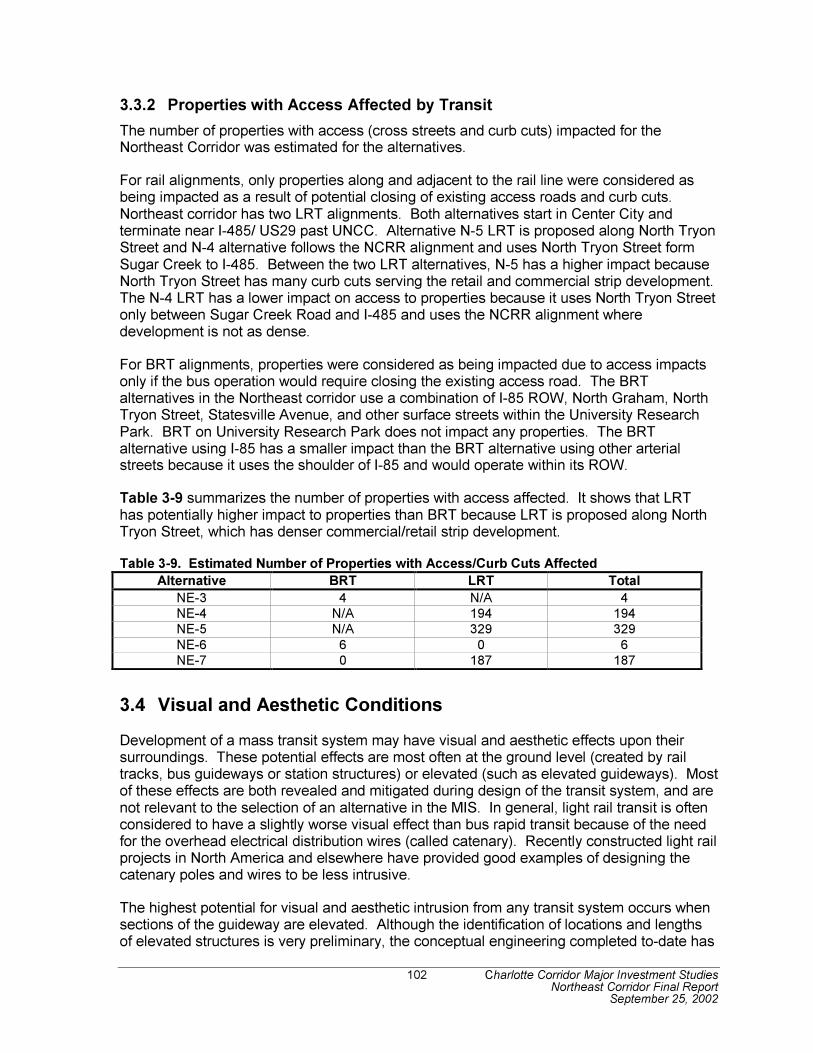
102 Charlotte Corridor Major Investment Studies Northeast Corridor Final Report
September 25, 2002
3.3.2 Properties with Access Affected by Transit
The number of properties with access (cross streets and curb cuts) impacted for the Northeast Corridor was estimated for the alternatives.
For rail alignments, only properties along and adjacent to the rail line were considered as being impacted as a result of potential closing of existing access roads and curb cuts. Northeast corridor has two LRT alignments. Both alternatives start in Center City and terminate near I-485/ US29 past UNCC. Alternative N-5 LRT is proposed along North Tryon Street and N-4 alternative follows the NCRR alignment and uses North Tryon Street form Sugar Creek to I-485. Between the two LRT alternatives, N-5 has a higher impact because North Tryon Street has many curb cuts serving the retail and commercial strip development. The N-4 LRT has a lower impact on access to properties because it uses North Tryon Street only between Sugar Creek Road and I-485 and uses the NCRR alignment where development is not as dense.
For BRT alignments, properties were considered as being impacted due to access impacts only if the bus operation would require closing the existing access road. The BRT alternatives in the Northeast corridor use a combination of I-85 ROW, North Graham, North Tryon Street, Statesville Avenue, and other surface streets within the University Research Park. BRT on University Research Park does not impact any properties. The BRT alternative using I-85 has a smaller impact than the BRT alternative using other arterial streets because it uses the shoulder of I-85 and would operate within its ROW.
Table 3-9 summarizes the number of properties with access affected. It shows that LRT has potentially higher impact to properties than BRT because LRT is proposed along North Tryon Street, which has denser commercial/retail strip development.
Table 3-9. Estimated Number of Properties with Access/Curb Cuts Affected
Alternative BRT LRT Total
NE-3 4 N/A 4
NE-4 N/A 194 194
NE-5 N/A 329 329
NE-6 6 0 6
NE-7 0 187 187
3.4 Visual and Aesthetic Conditions
Development of a mass transit system may have visual and aesthetic effects upon their surroundings. These potential effects are most often at the ground level (created by rail tracks, bus guideways or station structures) or elevated (such as elevated guideways). Most of these effects are both revealed and mitigated during design of the transit system, and are not relevant to the selection of an alternative in the MIS. In general, light rail transit is often considered to have a slightly worse visual effect than bus rapid transit because of the need for the overhead electrical distribution wires (called catenary). Recently constructed light rail projects in North America and elsewhere have provided good examples of designing the catenary poles and wires to be less intrusive.
The highest potential for visual and aesthetic intrusion from any transit system occurs when sections of the guideway are elevated. Although the identification of locations and lengths of elevated structures is very preliminary, the conceptual engineering completed to-date has

103 Charlotte Corridor Major Investment Studies Northeast Corridor Final Report
September 25, 2002
Low Density Suburban-style development
identified the potential locations for elevated structures in the Northeast Corridor for each alternative.
3.4.1 Existing Conditions
The Northeast Corridor study area encompasses a diverse range of visual environments ranging from a highly urbanized Center City of Charlotte to suburban-style development and semi-rural landscapes in the northern part of the Corridor. Along the project corridor, the landscape transitions from an area of predominantly industrial, manufacturing, and warehousing uses to suburban, mid-to-low-density residential and commercial settings.
Although no specific scenic resources have been identified in the Northeast Corridor study area, the visual environment of some properties along the project corridor is considered to be valuable to the communities in this area. The southern half of the study area is a fairly urbanized area of industrial and manufacturing uses, strip commercial types of businesses, and older residential neighborhoods of mixed single-family and multi-family residences and apartments.
The visual landscape of the northern half of the study area transitions from an older, urban setting to a suburban and lower density area of commercial and residential developments and institutional facilities such as the University Research Park, University Hospital, and the UNCC campus.
There are isolated properties along the North Tryon Street and Graham Street corridors that may be considered to have visual and aesthetic qualities, such as the Rosedale Plantation and other potentially historic architectural buildings associated with the industrial activities of the area.

104 Charlotte Corridor Major Investment Studies Northeast Corridor Final Report
September 25, 2002
Numerous vacant commercial properties are along North Tryon Street.
3.4.2 Consequences
In general, the impacts of all the proposed alternatives to the visual character of the study corridor are expected to be minimal since the proposed alignments are for the most part located along or within existing transportation facilities.
The Future Baseline Alternative in particular is likely to have limited impacts, although there are individual locations where visual or aesthetic changes would occur. The scale of physical elements would generally be small, with the largest being bus shelters. Involving community members in the design of the structures could mitigate any negative effects resulting from these small facilities.
Alternative NE-3 involves the operation of BRT along primarily major arterial roadways and I-85, and it is not expected to introduce new physical elements that would be visually intrusive to these transportation corridors. This alternative would be consistent with the existing visual elements along the Statesville and Graham Street corridors as well as I-85. The addition of BRT stations along these corridors would not be expected to create significant adverse visual impacts to these areas, which are highly developed with industrial, commercial, office, and multifamily residential uses. The short portions of the BRT alignment that are located along major arterials would operate similarly to the current bus service in these areas, and would not introduce any significant visual changes to these alignments.
Alternatives NE-4 and NE-5 would involve the operation of the proposed LRT system located primarily along the North Tryon Street corridor. The most significant visual elements that would be new to this corridor would be the introduction of infrastructure associated with the LRT system including the trackway, overhead catenary wiring, stations and signage, and signals and lighting. The continuous overhead catenary system could be considered the most intrusive visual element of these alternatives; however, it is not expected to create a significant adverse impact or be incompatible with the character of the existing streetscape. Currently, some portions of the North Tryon Street and Brevard Street corridors could be considered as urban blight with vacant commercial buildings, marginal types of businesses, and some closed industrial and manufacturing operations. The proposed project is considered to have the potential to induce redevelopment of the area.
The project elements of the LRT systems are generally more consistent with visual elements of commercial streets and major thoroughfares than residential streets. The proposed alignments for Alternatives NE-4 and NE-5 are located along major arterials and not within residential districts, where they would be aesthetically intrusive. A portion of Alternative NE-4 along the Brevard Street alignment as it transitions through the primarily industrial area between 36th Street and Sugar Creek Road would be on an elevated structure to minimize impacts to the creek and floodplain located in this area. The elevated structure would increase the visibility of the rail facility to neighborhoods in this area. However, this part of the corridor is predominantly industrial and non-residential so it is not expected that this would result in significant adverse impacts to the visual quality of the area.

105 Charlotte Corridor Major Investment Studies Northeast Corridor Final Report
September 25, 2002
Alternative NE-6 would involve operation of BRT along both existing arterials and I-85, and would require BRT alignments located along minor arterial roadways and on a new alignment within predominantly residential and commercial areas in the vicinity of the Derita and University City communities. This alternative would introduce new physical elements to the visual environment, including BRT exclusive roadway, stations, and pedestrian connections to this facility, and could be considered to be visually intrusive by area residents. Portions of the BRT alignment would be elevated or depressed as required to minimize impacts to the existing street network and environmental resources along the corridor. These physical elements would result in changes to the visual setting within these areas. The streetcar component of this alternative is similar to Alternative NE-5 and would operate within the North Tryon Street corridor from the Center City of Charlotte to the Tom Hunter station. It is not expected to create adverse visual impacts to this corridor.
Alternatives NE-7 would involve the operation of the proposed LRT system located primarily along the North Tryon Street corridor similar to Alternative NE-4 and feature a BRT loop that includes route elements described in Alternative NE-6. The LRT system for Alternative NE-7 would have the same visual elements as described for Alternative NE-4 but the impact would be slightly less since the length of the proposed line is shorter. The BRT portion of Alternative NE-7 overall would have a lesser impact than that described for Alternative NE-6 due to the shorter routing.
Compatible design concepts would be used to mitigate any visual and aesthetic impacts of the project to better integrate the project’s infrastructure into the community. Complementary design guidelines, materials, landscaping, signing, lighting, and public art would be considered in the station area planning efforts. Architectural elements and vegetative screening could also be used to minimize any changes in views from nearby neighborhoods that may be affected.
3.5 Air Quality
The U.S. Environmental Protection Agency (EPA) has established primary and secondary National Ambient Air Quality Standards (NAAQS) for six criteria air pollutants: carbon monoxide (CO), nitrogen dioxide (NO2), sulfur dioxide (SO2), ozone, particulate matter, and lead. Mecklenburg County was originally declared non-attainment for CO on March 3, 1978. The county was re-designated as a maintenance area for CO on September 18, 1995 based on monitoring continuous attainment from 1990 to 1995. Mecklenburg County was declared non-attainment for ozone on November 15, 1990. The county was re-designated as a maintenance area for ozone on July 5, 1995 based on continuous attainment from 1990 to 1994. The 2025 LRTP for MUMPO modeled rapid transit in each of the five corridors. MUMPO made a conformity finding on the LRTP on April 3, 2002, and USDOT concurred in this ruling on April 15, 2002.
3.5.1 Existing Conditions
The Northeast Corridor study area is located within the Charlotte-Gastonia-Rock Hill air basin. In 1999, Charlotte had 34 days exceeding the NAAQS for daily 8-hour ozone standard.
106 Charlotte Corridor Major Investment Studies Northeast Corridor Final Report
September 25, 2002
3.5.2 Consequences
An overall improvement in air quality in the Charlotte-Gaston-Rock Hill air basin is expected to result from implementation of any of the transit alternatives for the Northeast Corridor when compared to the 2025 Future Baseline alternative. The selection of the BRT and/or LRT transit improvements will not reduce air pollution but instead will reduce the growth in air pollution by reducing the growth in regional vehicle-miles traveled. LRT technology may offer greater air quality benefits than BRT technology (LRT vehicles would be powered electrically, while BRT vehicles likely would be diesel-powered), depending on the technology used to generate the electricity used to power the LRT.
Localized microscale air-quality impacts may result from proposed park-and-ride facilities and changes in traffic volumes at intersections adjacent to stations. Although these effects would occur at different locations under each alternative, no alternative would produce a substantially greater effect than another. Further quantification of microscale impacts will be conducted during preparation of the EIS.
3.6 Noise
The FTA General Noise Assessment procedure outlined in Transit Noise and Vibration Impact Assessment and the associated FTA General Noise Assessment Spreadsheet were
used to determine potential noise effects along each alternative for both BRT and LRT technologies.
3.6.1 Existing Conditions
Noise measurements were taken at 17 locations throughout the study area to establish the existing noise environment in areas with noise-sensitive uses along the proposed corridors. Existing noise levels in the Northeast Corridor range as is typical between suburban and urban areas. Noise levels along the southern half of the Northeast Corridor were typical of noise levels near major roadways, while noise levels along the northern half of this corridor were lower most of the day, but peaked when trains passed by. Major noise sources in the project area included traffic, trains, and aircraft.

107 Charlotte Corridor Major Investment Studies Northeast Corridor Final Report
September 25, 2002
3.6.2 Consequences
Table 3-10 shows the estimated project-generated noise levels at 50 feet for LRT and BRT both at grade and on an aerial structure.
Table 3-10. Project-Generated Noise Levels
At-Grade On Aerial Structure Technology Ldn (dBA)
@ 50 ft Leq (day) (dBA)
@ 50 ft Ldn (dBA)
@ 50 ft Leq (day) (dBA)
@ 50 ft
LRT 58 54 62 58
BRT 59 54 59 54
Source: FTA General Noise Assessment Spreadsheet (FTA, 1997)
Assumptions:
LRT/BRT Speed – 30 mph
LRT Cars per train – 2
LRT Vehicles per hour – 8 daytime and 4 nighttime (15 min/30 min headways)
BRT Vehicles per hour – 12 daytime and 8 nighttime (5 minute/15 min headways)
BRTs are 2-axle buses
According to the FTA Noise Impact Criteria, if the noise generated by the project alone is 62 Ldn (or Leq(h)), consequences would occur if the existing noise exposure at a receiver is less than 67 Ldn (or Leq(h)). If the project is projected to generate 59 Ldn (or Leq(h)), consequences would occur if the existing noise exposure is less then 63 Ldn (or Leq(h)).
The Future Baseline Alternative could possibly have noise impacts associated with additional bus service if noise level increases exceed the threshold criteria. Such impacts would be very localized and associated with acceleration and stopping at transit stops or intersections. There would be no vibration impacts.
Receptors in close proximity to the proposed Build alternatives would experience substantial increases in total noise levels. However, in many parts of the study area the noise exposure that would result from the project would be minor compared to existing noise sources. Therefore, noise impacts under the FTA criteria are only predicted to occur within a very narrow band surrounding the evaluated Build alternatives.
Table 3-11 shows the type and distance of noise impacts for the various alternatives in the Northeast Corridor.

108 Charlotte Corridor Major Investment Studies Northeast Corridor Final Report
September 25, 2002
Table 3-11. Potential Noise Consequences in Northeast Corridor
Type of Impact (Ldn) Distance to Impact (feet)
Alternative Existing
Ldn Minor Impact Major Impact Minor Impact Major Impact
NE 3 57 - 69 56 – 64 62 - 69 45 - 165 20 - 75
NE 4 57 - 69 56 – 63 62 - 69 17 - 50 7 - 20
NE 5 57 - 69 56 – 63 62 - 69 25 - 75 11 - 30
NE 6 57 - 69 56 – 64 62 - 69 13 - 95 5 - 35
NE 7 57 - 69 56 – 64 62 - 69 17 - 50 7 - 20
The impact area for Alternative NE-3 would range between 45 and 165 feet from the centerline of the alignment, depending on the location within the corridor. Along Alternative NE-4 and NE-7, the impact area would extend to between 17 and 50 feet from the centerline. For Alternative NE-5, the impact area would extend to between 25 and 75 feet from the centerline. Along Alternative NE-6, the impact area would extend to between 13 and 95 feet from the centerline.
The area experiencing severe impacts, as defined by the FTA criteria, would generally be small. In most locations it would be between one-third and one-half of the area predicted to experience any impact.
While none of the project alternatives would substantially increase noise levels in most of the study area, there would be an increase in the frequency of train or bus noise. At 50 feet away, the maximum noise level from an LRT vehicle is approximately 80 dBA and for a commuter bus is 85 dBA.3 These noise levels are less than the maximum noise level of approximately 88 dBA from a freight train locomotive at 50 feet. Along the southern half of the Northeast Corridor, there would not be a substantial increase in the frequency of peak noise levels, because of the relatively high volume of train, truck and bus operations that already exists. Along the northern half of this corridor, the maximum noise levels experienced would not increase, but the frequency of noise peaks would increase.
3.7 Ecosystems
The alternative alignments were inspected during field investigations to identify wetlands, streams, and potentially suitable habitat for protected species. Identified wetlands were sketched on topographic mapping and their areas are approximate.
Plant and animal species with federal classifications of Endangered or Threatened are protected under Section 7 of the Endangered Species Act of 1973, as amended (16 USC
3 A decibel (dBA) is a measure of noise. A noise level increase of 3 dBA is barely discernible to the human ear, and
an increase of 5 dBA is a noticeable increase. Because the decibel scale is logarithmic, a doubling of the number of noise
sources, such as traffic volume or train operations, increases noise levels by 3 dBA. A 10-fold increase in the number of noise sources will add 10 dBA. A noise source emitting a noise level of 60 dBA combined with another noise source of 60 dBA yields a combined noise level of 63 dBA, not 120 dBA.

109 Charlotte Corridor Major Investment Studies Northeast Corridor Final Report
September 25, 2002
1531-1543)(Act). The alternative alignments were evaluated with respect to protected species in terms of recorded locations and the consequences of alternatives on potential suitable habitat for protected species.
3.7.1 Existing Conditions
Wetlands Wetlands are under the jurisdiction of the U.S. Army Corps of Engineers and Section 404 of the Clean Water Act, which regulates any actions that would alter the conditions of the jurisdictional wetlands. The National Wetland Inventory Maps prepared by the U.S. Fish and Wildlife Service were reviewed to determine the location and types of wetlands present in the study area. The general wetland categories found in the study area are associated with the floodplain areas along streams in the project corridor and are generally less than 10 acres in size and less than six feet deep. The wetlands present within the vicinity of the proposed alternatives are generally associated with retention basins and seasonally or temporarily flooded areas.
Protected Species The Northeast Corridor study area has undergone tremendous urbanization during the past few decades, and there are few natural areas remaining in the Corridor. Most of the rural setting and agricultural land in Mecklenburg County has been or is currently being altered by commercial, industrial, office and residential development. The few remnants of natural areas in the Corridor are located primarily along floodplains and wetlands and within some of the undeveloped tracts further from the Center City of Charlotte. There are no designated ecologically sensitive areas or nature preserves located in the Northeast Corridor.
The wooded areas in the project area fall into three categories: disturbed, mesic mixed hardwood forest, and pine forest. Much of the wildlife in the project study area likely uses these various communities for forage, cover, and nesting habitat.
This community encompasses several types of habitat that have been or are currently impacted by human disturbance, such as roadside shoulders, maintained yards, and cutover areas. Cutover areas have been clear cut or thinned in the recent past. This habitat is dominated by tree types such as honey locust, white ash, sweetgum, black cherry, shortleaf pine, sassafras, willow oak, hawthorn, and mimosa. Plant life includes blackberry, ragweed, goldenrod, thistle, pokeweed, winged sumac, horse nettle, broomsedge, honeysuckle, wisteria, kudzu and poison ivy.
Dominant hardwoods include blackgum, black locust, sycamore, white ash, green ash, willow oak, southern red oak, Virginia pine, tulip poplar, red maple, and sweetgum. The subcanopy is represented by red cedar, hazelnut, dogwood, black cherry, winged elm, American elm, and red bud. Near wetland areas and stream tributaries, other plant species commonly found are box elder, hickory, American beech, and jack-in-the-pulpit.
Within the project study area, isolated tracts of pine forest exist, characterized by shortleaf pine, Virginia pine and loblolly pine species.
The various types of plants and trees found within the study area have the potential to support many wildlife species. Common mammals found in these habitat types include raccoons, squirrels, white-tailed deer, numerous rodent species, and eastern cottontails.

110 Charlotte Corridor Major Investment Studies Northeast Corridor Final Report
September 25, 2002
Also found within these terrestrial communities are a wide variety of amphibians, reptiles and bird species.
Within Mecklenburg County there are currently four federally-protected endangered species as listed by the U.S. Fish and Wildlife Service, shown on Table 3-12. Also listed in this table
are the species of federal concern that exist in the county, but are not yet classified as threatened or endangered. One species is classified as C1, which indicates that it is under consideration for federal listing as a threatened species.
Table 3-12. Federally Listed Protected Species
Common Name Scientific Name Category
Mecklenburg County
Carolina heelsplitter Lasmigona decorata Endangered
Smooth coneflower Echinacea laevigata Endangered
Schweinitz’s sunflower Helianthus schweinitzii Endangered
Michaux’s sumac Rhus michauxii Endangered
Virginia quillwort Isoetes virginica Federal species of concern
Heller’s trefoil Lotus helleri Federal Species of concern
Carolina creekshell Villosa vaughaniana Federal Species of concern
Tall larkspur Delphinium exaltatum Federal species of concern
Carolina darter Etheostoma collies collis Federal species of concern
Georgia aster Aster georgianus C1
Bald eagle Haliaeetus leucocephalus Threatened
3.7.2 Consequences
Wetlands The Future Baseline Alternative would have no impacts to jurisdictional wetlands. The limited amount of construction for that alternative would occur within existing rights-of-way where no jurisdictional wetlands are known to exist. There would also not be any flooding impacts. No changes in the types of pollutants associated with transportation movements through the corridor are anticipated that would affect water quality.
111 Charlotte Corridor Major Investment Studies Northeast Corridor Final Report
September 25, 2002
Table 3-13. Potential Acres of Wetlands Affected in the Northeast Corridor
Alternative Alignments Acres of Wetlands Affected
NE-3: BRT on I-85 None
NE-4: LRT via Brevard & US 29 None
NE-5: LRT on North Tryon Street with Dedicated Right-of-way
None
NE-6: BRT on Graham Street /Research Park/ US 29
0.752
NE-7: LRT with BRT Loop 0.752
The proposed Build alternatives are located primarily within existing highway and major arterial roadway rights-of-way, and are expected to have minimal encroachment into wetland areas within the study area as shown in Table 3-13.
Alternative NE-3 would follow the existing corridors of I-85 and major arterials for the majority of the alignment and would not impact any wetlands in the study area.
Alternative NE-4 would follow the existing corridors of Brevard Street and North Tryon Street for the major portion of this alignment; however, there would be a new alignment within the area of Little Sugar Creek. This portion of the alignment is proposed to be on a structure and would require the placement of bridge piers within the floodplain. The alignment would not impact any wetlands in the area.
Alternative NE-5 would follow the existing corridor of North Tryon Street for most of the proposed alignment and would not impact any wetlands in the study area.
Alternative NE-6 would follow the existing corridors of I-85 and major arterials for the majority of the proposed alignment and would not impact any wetlands in the study area.
Alternative NE-7 LRT would follow the existing corridors of Brevard Street and North Tryon Street for the major portion of this alignment; however, there would be a new alignment within the area of Little Sugar Creek. This portion of the alignment is proposed to be on a structure and would require the placement of bridge piers within the floodplain. The alignment would not impact any wetlands in the area. Alternative NE-7 BRT would follow the existing corridors of I-85 and major arterials for the majority of the proposed alignment and would not impact any wetlands in the study area.
A more detailed assessment of the extent of wetland impacts of the project would be conducted during later phases of project development to determine appropriate mitigation measures. It is expected that there would not be enough bridge piers and footings placed within floodplain areas and their associated wetlands to affect wetland quality. The piers would not result in any significant adverse impact on the natural and beneficial wetland functions in the affected areas.
Protected Species Wildlife within the project study area would experience minimal impacts as a result of the proposed project. The majority of the alignments of the proposed alternatives are within the existing right-of-way of freeways, major arterials, and railroad corridors. There is no encroachment into areas of significant vegetation or sensitive habitats that would result in loss of significant wildlife populations. Those areas along the proposed alternatives that

112 Charlotte Corridor Major Investment Studies Northeast Corridor Final Report
September 25, 2002
could be cleared of brush or other vegetation as a result of project construction are areas within highly disturbed and urban environments.
A review of the North Carolina Natural Heritage Program database of rare species indicates that one endangered and one species of federal concern were recorded as being present within the project study area. Although specific biological surveys for these species were not conducted as part of this analysis, it is anticipated that the proposed project will have no effect on any federally-protected species given the disturbed nature of the project corridor for all the alternatives. The proposed alternatives are located primarily within the existing right-of-ways of roadway or railroad corridors that do not provide the types of habitat suitable for these rare species. During later phases of project development, a more detailed assessment will be performed to determine whether any rare species are present within the impact zone of the proposed alternative.
3.8 Water Resources
Under Section 401 of the federal Clean Water Act, the NC DWQ requires mitigation for all cumulative stream effects that are greater than 150 linear feet. Construction of a culvert or a bridge with piers in the waterway would be considered a consequence. The alternative alignments were evaluated with respect to stream crossings in terms of linear feet of stream affected by construction.
In accordance with Executive Order 11988 (May 24, 1977), federal agencies shall determine whether a proposed action will occur in a floodplain. For major federal actions significantly affecting the quality of the human environment, the evaluation shall be included in any statement prepared under the National Environmental Policy Act (NEPA). The alternative alignments were evaluated with respect to floodplains and floodways in terms of linear feet crossed.
3.8.1 Existing Conditions
The water resources located in the Northeast Corridor study area lie within the Yadkin-Pee Dee River drainage basin. The major streams within the project corridor are Irwin Creek, Little Sugar Creek, Doby Creek, Mallard Creek, Toby Creek, Stony Creek, and tributaries of Rocky River. All of the previously mentioned streams within the study area above have been assigned a best use classification of “C” by the North Carolina Division of Water Quality. Class C waters are suitable for aquatic life propagation and survival, fishing, wildlife and secondary recreation and agriculture. No streams that are classified as high quality waters and no water supplies are located within the project corridor.
Each of the streams listed above has a regulatory floodway and associated 100-year floodplains as designated by the federal Floodplain Rate Insurance Maps prepared by the Federal Emergency Management Agency. The floodplains along most of the streams and creeks within the project corridor are fairly narrow in most areas and generally follow the stream channels. Mecklenburg County has also designated a stream protection zone, as part of the Surface Water Improvement and Management (SWIM) program, along most of these waterways, to provide a protective buffer area along stream channels in order to minimize environmental degradation and adverse water quality impacts.

113 Charlotte Corridor Major Investment Studies Northeast Corridor Final Report
September 25, 2002
3.8.2 Consequences
Three of the four proposed Build alternatives would require new stream crossings of creeks in the study area, but would not involve any channel modifications of the existing streams. The proposed alternatives generally follow existing transportation facilities such as highways, major arterials and railroad corridors and would result in minimal encroachments into nearby streams. Therefore, it is expected that the all of the proposed alternatives would have minimal impacts to streams and water quality in the study area. Project construction in areas near water resources could cause impacts during clearing and grubbing activities and construction of hydraulic structures such as culverts and drainage pipes. These activities could result in increased sedimentation and siltation from soil erosion, or temporarily muddying local water resources. Mitigation measures to minimize these types of impacts involve the use of best management practices for protection of surface waters and sedimentation control guidelines during construction of the project.
The proposed alternatives are located primarily within the existing rights-of-way of highway, major arterial roadways, and railroad corridors and are expected to involve minimal encroachment into floodplain areas within the study area. Table 3-14 list the potential efffects on floodplains by alternative in the Northeast Corridor
Table 3-14. Potential Floodplain Consequences in the Northeast Corridor
Alternative Alignments Approximate
Floodplains Affected (Acres)
NE-3: BRT on I-85 None
NE-4: LRT via Brevard & US 29 9.173
NE-5: LRT on North Tryon with Dedicated Right-of-way None
NE-6: BRT on Graham/Research Park/ US 29 1.137
NE-7: LRT with BRT Loop 10.31
Alternative NE-3 would impact a portion of the Irwin Creek floodplain as part of the BRT alternative that would be on new alignment. An estimated 0.7 acres of floodplain encroachment could occur as a result of bridge piers and footings being placed in this area in the effort to minimize impacts within the floodplain area.
Alternative NE-4 would impact a portion of the Little Sugar Creek floodplain since part of the LRT alternative would be on a new alignment. The estimated floodplain encroachment of less than 0.2 acres would occur as a result of bridge piers and footings being placed in this area in the effort to minimize impacts within the floodplain area.
Alternative NE-5 is located primarily within the existing right-of-way of North Tryon Street and is not expected to result in any impacts to floodplains within this corridor.
Alternative NE-6 is located primarily within the median of the newly constructed University City Boulevard and, therefore, would not impact the nearby Doby Creek floodplain.
Alternative NE-7 would impact a portion of the Little Sugar Creek floodplain since part of the LRT alternative would be on a new alignment. The estimated floodplain encroachment of less than 0.2 acres would occur as a result of bridge piers and footings being placed in this

114 Charlotte Corridor Major Investment Studies Northeast Corridor Final Report
September 25, 2002
area in the effort to minimize impacts within the floodplain area. Alternative NE-7 would also avoid impacting the Doby Creek floodplain since part of the BRT alternative would be on the newly constructed University City Boulevard alignment.
A more detailed assessment of the extent of floodplain impacts of the project would be conducted during later phases of project development to determine appropriate mitigation measures. It is expected that there would not be enough bridge piers and footings placed within floodplain areas to affect floodway flows, and they would not result in any significant adverse impact on the natural and beneficial floodplain values in the affected areas.
3.9 Cultural Resources
Section 106 of the National Historic Preservation Act of 1966, as amended (36 CFR 800), requires all federal agencies to take into consideration the effect of federally assisted, licensed or permitted projects on these resources. In addition, historic resources are provided protection under Section 4(f) of the Department of Transportation Act of 1966 (set forth in 49 USC 1653(f), amended and codified in 49 USC 303, and expanded in 23 USC 138). The alternative alignments were evaluated with respect to the number of historic resources adjacent to portions of alternative alignments where additional right-of-way would be required.
3.9.1 Existing Conditions
Historic Properties. A Phase I reconnaissance level architectural survey was conducted for the Northeast Corridor in accordance with Section 106. The survey identified all historic properties and those properties fifty years of age or older which appear to merit the Phase II intensive level evaluation needed to determine National Register eligibility. The study area was defined as approximately one-quarter mile on either side of each alternative alignment, and included the areas of direct and indirect effects around proposed transit stations.
Historic properties are defined as those resources that have been added to either the National Register of Historic Places or the North Carolina Study List, which is a list of resources that have had preliminary determinations of eligibility, made by the State Historic Preservation Office (SHPO), or has been designated as local landmarks by the Charlotte-Mecklenburg Historic Landmarks Commission. Table 3-15 lists the historic resources contained in the Northeast Corridor.

115 Charlotte Corridor Major Investment Studies Northeast Corridor Final Report
September 25, 2002
Table 3-15. Historic Resources in the Northeast Corridor
Name Site #1
Type2 Location Alternative Alignments
House (ca. 1920) 1 None 631 Brevard Street NE-4, NE-5, NE-6, NE-7
William Treloar House (1887) 2 Ll 328 Brevard Street NE-4, NE-5, NE-6, NE-7
Commercial Blocks (1925) 3 None 123-125 Brevard Street NE-4, NE-5, NE-6, NE-7
First United Presbyterian Church (ca. 1895)
4 LL 400 N. College Street NE-4, NE-5, NE-6, NE-7
(Former) Philip-Carey Warehouse (Dixie Tavern) ( ca.
1908-1909) 5 NR 301 East Seventh Street NE-4, NE-5, NE-
6, NE-7
(Former) McNeil Paper Company Building (ca. 1910)
6 LL 305 East Eighth Street between the
railroad and Brevard Street NE-4, NE-5, NE-6, NE-7
(Former) Guthery Apartment House (ca. 1925)
7 None North Tryon Street at Eighth Street NE-4, NE-5, NE-6, NE-7
(Former) Stonewall Hotel (ca. 1910)
13 None West Trade Street NE-3, NE-6
Fourth Ward Historic District (ca. 1880 through ca. 1940)
14 LHD Charlotte, NC NE-3, NE-6
(Former) United States Post Office (Charles A. Jonas
Federal Building (ca. 1930) 15 None
W. Trade Street between Mint and Graham Streets
NE-3, NE-6
(Former) Charlotte Cotton Mills (1880-1881)
16 LL 508 West Fifth Street NE-3, NE-6
Warehouse (ca. 1920) 17 None North Graham Street between West Fifth
and West Sixth Streets NE-3, NE-6
Bridge (ca. 1930) 18 None Carrying the Seaboard Railroad over
Sixth Street NE-3, NE-6
Elmwood Cemetery (established 1853)
19 None West Sixth Street, west of Graham Street NE-3, NE-6
Recommended Industrial Historic District (ca. 1925)
20 None 600 Block, West Fifth Street NE-3, NE-6
Recommended Industrial Historic District (ca. 1920)
21 None North and South Sides, Seaboard Street
west of Tenth Street NE-3, NE-6
Seaboard Airline Passenger Station, Railroad Bridge, and
Gas Station 22 LL
North Tryon Street at the Seaboard Airline Railway Corridor
NE-5, NE-6
Railroad Bridge 23 None Carrying the Norfolk Southern Railway
over North Tryon Street at Sixteenth Street NE-5, NE-6
Recommended North Graham Street Historic District (ca. 1920-
ca. 1950) 24 None 1300-1500 Blocks, North Graham Street
NE-3, NE-6
(Former) Ford Motor Company
Plant (1924) 25 None 1801 North Statesville Avenue
NE-3, NE-6
Hebrew Cemetery (1867) 26 None West side, North Statesville Avenue NE-3, NE-6
Western Electric Building 60 SL 2833 North Tryon Street, Charlotte NE-5, NE-6
Espy Watt Brawley House 61 NR Northeast corner of NC-115 and Williams
Street, Mooresville
Chadbourn Mill 62 None 2500 North Brevard Street, Charlotte NE-4, NE-7
Herrin Brothers Ice Company Plant
63 None 36
th Street, just west of NS Railway,
Charlotte NE-4, NE-7
North Charlotte Textile Mill
Historic District 64 NR
Bounded by the NSRR and East 30th
Street, Charlotte NE-4, NE-7
Armory 65 None West side of NC-115, Mooresville
Factory 66 None North Tryon Street, north of 30
th Street
along NSRR, Charlotte NE-5, NE-6
Rosedale Plantation 67 LL 3427 North Tryon Street, Charlotte NE-5, NE-6
Sugaw Creek Presbyterian Church
68 LL North Tryon Street at intersection of
Sugaw Creek Road, Charlotte NE-5, NE-6, NE-7
Park-n-Shop 69 SL North Tryon Street at Sugaw Creek Road,
Charlotte NE-5, NE-6, NE-7

116 Charlotte Corridor Major Investment Studies Northeast Corridor Final Report
September 25, 2002
Name Site #1
Type2 Location Alternative Alignments
W.T. Alexander House 70 LL & NR
pending Mallard Creek Road at US-29, Charlotte NE-4, NE-5, NE-
6, NE-7
Former Alpha Cotton Mill 71 LL 311 East 12th Street, Charlotte NE-4, NE-7
1. MK # = Site designation for sites in Mecklenburg County assigned by the SHPO 2. SL = Study List (Designation just prior to NRHP listing)
NR = National Register historic listing LHD = Locally-designated historic listing LL= Local landmark SP = Surveyed Property more than 50 years old that may or may not be eligible for the National Register. Source: NC State Historic Preservation Office (SHPO)
The Northeast Corridor study areas contained a total of 36 historic or potentially historic architectural resources. Within the total survey population are nineteenth and twentieth century houses, farmsteads, rural and urban communities, industrial buildings, commercial blocks, scholastic architecture, churches, bridges, railroad depots, gas stations, and an ice house. Of these 36 sites, four are listed as National Register properties, seven are designated as being of local historical significance and 25 are considered to be potentially historic and warrant a more detailed investigation that would be considered for later phases of project development.
Archaeological Sites No known archaeological sites are located within the proposed corridors of any of the alternatives. There are a few prehistoric recorded sites within the study area, but none of these sites would be impacted by the proposed alternatives.
Parklands There are several public parks, greenways, and recreational facilities located within the Northeast Corridor study area, and some of these are along the project corridor. Section 4(f) of the Department of Transportation Act prohibits the use of land from publicly owned parks, recreation areas, wildlife refuges or historic sites for any federally-funded projects unless there is no feasible and prudent alternative.
3.9.2 Consequences
Historic Properties Some of the historic and potentially historic sites within the surveyed study area are located adjacent to the proposed alternatives. Although none of the proposed alternatives would directly impact these historic or potentially historic sites through right-of-way acquisition, it is possible that there could be indirect impacts associated with noise, visual, or traffic impacts. These potential effects are summarized in Table 3-16.

117 Charlotte Corridor Major Investment Studies Northeast Corridor Final Report
September 25, 2002
Since the Future Baseline Alternative does not add major new elements to the existing structural environment, it has the lowest potential for impacts to cultural resources.
The most likely indirect impacts to known historic resources could occur along the alignment of Alternatives NE-3 and NE-6, which each have a portion of the BRT alignment located within the Fourth Ward Historic District.
Table 3-16. Consequences on Historic Resources in the Northeast Corridor
Alternative Alignments Potentially Affected Sites
NE-3: BRT on I-85 Fourth Ward (Indirect)
NE-4: LRT via Brevard & US 29 North Charlotte Historic District
NE-5: LRT on North Tryon Street with Dedicated Right-of-way
• Seaboard Airline Passenger Station, Railroad bridge and Gas Station
• NSRR bridge – North Tryon Street and 16th Street
• Western Electric Building – North Tryon & 28th St
• Factory – North Tryon Street & 30th St along NSRR
• Rosedale Plantation building – 3427 North Tryon Street
• Sugar Creek Presbyterian Church – North Tryon & Sugar Creek Rd
NE-6: BRT on Graham/Research Park/ US 29
Fourth Ward (Indirect)
NE-7: LRT with BRT Loop North Charlotte Historic District
Another potential area of impact to an historic resource is located in Alternative NE-4 and NE-7 LRT through the area of the North Charlotte Historic District.
The alignment of Alternative NE-5 is not located within a historic district. However, it passes in close proximity to historic sites such as the Rosedale Plantation building and Sugar Creek Presbyterian Church.
Although the alternatives listed above could have an effect on historic resources, a determination as to whether the impact would be considered an adverse effect according to SHPO standards would be part of a more detailed study in later phases of project development. A comprehensive cultural resources study would be conducted as part of the future planning phases of the project. The study would determine the level of impact to historic resources that would be affected. In consultation with the SHPO agency, the study would identify appropriate mitigation measures to minimize any adverse impacts.
Archaeological Sites No known archaeological sites are located within the proposed corridors of any of the alternatives. There are a few prehistoric recorded sites within the study area, but none of these sites would be impacted by the proposed alternatives.
Parklands and Community Resources None of the proposed alternatives would directly impact the parkland, greenways or public recreational facilities located within the study area as a result of right-of-way acquisition or implementation of the proposed project. Although there are several of these types of

118 Charlotte Corridor Major Investment Studies Northeast Corridor Final Report
September 25, 2002
resources located adjacent to the proposed alternatives, it is not expected that they would be adversely affected by the project, and, therefore, no Section 4(f) impacts would result from implementation of any of the proposed alternatives. It is anticipated that the proposed project would provide improved access to these resources.
3.10 Contamination Sites and Hazardous Materials Review
The US Environmental Protection Agency (EPA) defines hazardous waste as any waste material or combination of waste materials that poses a hazard to human health, welfare, or the environment. Examples of hazardous waste sites include landfills, dumps, pits, lagoons, salvage areas, and storage tanks. The alternative alignments were evaluated with respect to numbers of hazardous and potentially hazardous waste sites adjacent to the alternative alignments that would require additional right-of-way acquisition.
3.10.1 Existing Conditions
A preliminary survey of potentially contaminated and hazardous materials handling and/or storage sites was conducted for the Northeast Corridor to identify the known locations of these types of sites and their proximity to the proposed alignments. This survey included a review of federal and state and local government databases of known sites of environmental contamination, generators of hazardous materials, petroleum products storage, and recorded spills and leaks of hazardous materials. The following sources of information were reviewed in this survey:
• Federal and State National Priority List Sites
• Federal RCRA (Resource Conservation and Recovery Act)
• Federal CORRACTS (RCRA Corrective Actions)
• Federal CERCLIS (Comprehensive Environmental Response, Compensation, and Liability Index ) and CERCLIS-NFRAP (No Further Remedial Action)
• State CERCLIS Listing
• State Solid Waste Disposal Landfill
• State LUST (Leaking Underground Storage Tank)
• Federal TRIS (Toxic Release Inventory System)
• Federal ERNS (Emergency Response Notification System)
• Federal Hazardous Waste Generator
• State Spill Sites
• Facility Index System (FINDS)
• Federal RCRA Violations
In addition, site reconnaissance, interviews, aerial photography and historical records were reviewed as part of this survey.

119 Charlotte Corridor Major Investment Studies Northeast Corridor Final Report
September 25, 2002
3.10.2 Consequences
The results of the records review and field investigations indicate that there are several known sites of recorded contamination and hazardous substances present within the study area. These sites were reviewed to determine those sites that were located within 0.125 mile of the proposed centerline of the alternative alignments, or a total survey corridor of 0.25 mile wide along each of the proposed alternatives. This inventory was then narrowed to include those sites that were located within 100 feet of the alignment alternatives and could potentially be impacted by the proposed project.
Table 3-17 shows the numbers of hazardous waste sites identified during field surveys that potentially would be affected by alternative alignments and the number of affected hazardous material sites from the RCRIS query by alternative alignment.
Table 3-17. Potential Hazardous Waste Sites in the Northeast Corridor
Alternative Alignments Waste Sites Located
Within 200 Feet Potentially Affected
Waste Sites
NE-3: BRT on I-85 4 0
NE-4: LRT via Brevard Street & US 29
2 1
NE-5: LRT on North Tryon Street with Dedicated Right-of-way
11 0
NE-6: BRT on Graham Street /Research Park/ US 29
15 0
NE-7: LRT with BRT Loop 2 1
The Baseline Alternative would have no impacts.
The survey indicates that there are four sites identified from the databases listed above that are located within the 200-foot wide zone along Alternative NE-3, which follows the existing I-85 and major arterial roadway corridors. Of these four sites, three are designated as LUST/ERNS sites, one site is a FINDS sites. These sites are associated with gas stations, dry cleaners, and commercial and industrial activities. All of these sites are located outside of the existing right-of-way of the I-85 corridor and the major arterial roadways that this BRT alignment follows, and are not expected to be impacted by Alternative NE-3.
Alternative NE-4 has two sites located within a 200-foot wide zone along this LRT alignment, the majority of which follows the North Tryon Street corridor. The two sites are designated as LUST/ERNS sites and are associated with gas stations and commercial facilities. One of these sites has the potential to be impacted by the proposed alternative. However, if this site is not affected by right-of-way acquisition for this alternative, then there would not be any impacts expected with this site.
Alternative NE-5 has 11 sites located within a 200-foot wide zone along this LRT alignment, the majority of which follows the North Tryon Street corridor. Of these 11 sites, eight sites are designated as LUST/ERNS sites and are associated with gas stations, dry cleaners, commercial and industrial activities. Two sites are designated as FINDS sites and are

120 Charlotte Corridor Major Investment Studies Northeast Corridor Final Report
September 25, 2002
associated with industrial activities. One site is designated as a LUST/ERNS/FINDS and TRIS site and is associated with industrial and manufacturing activities. All of these sites appear to be located outside of the proposed right-of-way for Alternative NE-5. Therefore, this alternative is not expected to impact the sites identified.
Alternative NE-6 involves the BRT alignment along major arterials and I-85, and some portions of a new alignment in the Derita and University City area. The streetcar component of this alternative follows the same alignment along North Tryon Street as Alternative NE-5 up to the proposed terminus near the US-29/NC-49 weave area. Fifteen sites are located within a 200-foot wide zone along these BRT and streetcar alignments. The 10 sites associated with the streetcar component are the same as those listed for Alternative NE-5 with the exception of one less LUST/ERNS site included in this inventory. The BRT component of Alternative NE-6 has five sites designated as LUST/ERNS, and these are associated with commercial and industrial activities. All 15 sites appear to be located outside of the proposed right-of-way for this alternative and are not expected to be directly impacted by the proposed project.
Alternative NE-7 has two sites located within a 200-foot wide zone along the LRT alignment, the majority of which follows the North Tryon Street corridor. These are the same sites identified in Alternative NE-4. The two sites are designated as LUST/ERNS sites and are associated with gas stations and commercial facilities. One of these sites has the potential to be impacted by the proposed alternative. However, if this site is not affected by right-of-way acquisition for this alternative, then there would not be any impacts expected with this site. The BRT component of Alternative NE-7 has no designated sites.
The findings of the preliminary contamination screening and evaluation are based on preliminary information only and are not intended to replace more detailed studies such as individual site assessments and subsurface soil and groundwater investigations. Rather, the screening is intended to serve as a guide for identifying potential contamination in the proposed project corridors. As part of the subsequent phases of project development, a complete Phase 1 environmental assessment would be conducted to identify in detail the potential impacts related to hazardous materials or contaminated sites that could be associated with the construction and implementation of a particular alternative.
3.11 Environmental Justice
Executive Order 12898 requires federal agencies to develop a strategy for their programs, policies and activities to avoid disproportionate and adverse human health and environmental impacts on minority and low-income populations. The USDOT promotes nondiscrimination in its programs through a department-wide strategy and process that integrates environmental justice principles into existing planning requirements. The Executive Order re-emphasizes the requirement to assess and consider the impacts of transportation projects, not only on the natural environment but also on the people and their communities, through a pro-active engagement with all stakeholders in public involvement activities during program planning as well as in project development.

121 Charlotte Corridor Major Investment Studies Northeast Corridor Final Report
September 25, 2002
3.11.1 Existing Conditions
A review of the year 1990 and 2000 U.S. Census data for the study area was conducted for this assessment of potential environmental justice impacts. A minority population is considered to exist if the percentage of minorities in the affected area is greater than 50 percent, or significantly higher than the minority population percentage in the general area. The total minority population for Mecklenburg County was approximately 36 percent for the year 2000.
The highest population densities within the Northeast Corridor study area are in and around the Center City of Charlotte and concentrations within the University City area. The southern portion of the study area has some of the largest minority populations within the study area and also has areas of low-income households. There are also scattered areas of minority and low-income areas in the Derita and University City communities.
The census data indicates a wide range of socioeconomic and demographic characteristics within the Northeast Corridor study area. Generally, the neighborhoods in the southern portion of the corridor are areas of greater concentrations of minority populations, and households with incomes below the national poverty level.
Of the 32 census block groups within the project study area, 25 block groups have higher than average minority populations, and 5 of those block groups are considered to be low-income areas based on 1990 median household annual income lower than the national poverty level. Income date from the 2000 census was not available at the time of writing.
3.11.2 Consequences
The Future Baseline Alternative would not adversely impact minority areas disproportionately. Implementation of any of the proposed Build alternatives would introduce a new transportation service to the study area and provide a new option for citizens to access employment, schools, and other facilities. Several low-income and minority communities would be affected by all of the proposed alternatives. Table 3-18
shows the number low-income and minority block groups that each alternative alignment passes through.
Table 3-18. Affected Low-Income and Minority Block Groups
Alternative Alignments Number of Low-Income
Block Groups* Number of Minority
Block Groups*
NE-3: BRT on I-85 2 11
NE-4: LRT via Brevard Street & US 29
2 12
NE-5: LRT on North Tryon Street with Dedicated Right-of-way
3 11
NE-6: BRT on Graham Street/Research Park/ US 29
5 19
NE-7: LRT with BRT Loop 2 9
* Low-Income Block Groups based on 1990 Census, Minority Block Groups based on 2000 Census. Effects are the same for BRT and LRT.

122 Charlotte Corridor Major Investment Studies Northeast Corridor Final Report
September 25, 2002
Transit dependent persons were assumed to be those people whose income status was below poverty level. In order to estimate the number of persons below the poverty level within a half-mile of stations along the alternative alignments, it was assumed that low-income people were evenly distributed across the 2000 Census block groups. Table 3-19 shows the transit dependent persons within ½ mile of proposed stations. Based on the information in the table, there will be a slightly greater benefit for transit dependent persons along Alternative NE-6.
Table 3-19. Transit Dependent Persons Near Alternative Alignment Stations
Alternative Alignments Total Number of Transit Dependent Persons* Within
One-Half Mile of Proposed Stations
NE-3: BRT on I-85 3464
NE-4: (LRT via Brevard Street & US 29
4535
NE-5: LRT on North Tryon Street with Dedicated Right-of-way
4074
NE-6: BRT on Graham Street/Research Park/ US 29
7525
NE-7: LRT with BRT Loop 4582
* Persons below the poverty level
Alternative NE-3 would expose homes and business that are located along the BRT route to potential impacts related to noise and visual changes and some property acquisitions along this corridor; however, these impacts are not expected to be significantly adverse. These impacts are documented in Section 4.0 Acquisitions, Section 6.0 Visual Quality and Aesthetics, and Section 8.0 Noise. This alternative could potentially provide transit service to a greater number of low-income and minority communities than Alternatives NE-3 or NE-4, given that the majority of this corridor is located within these areas.
Alternatives NE-4 and NE-5 would also expose homes and businesses that are located along the proposed project corridors to similar potential impacts; however, those impacts are not expected to be significantly adverse. Alternative NE-4 would be located primarily within an existing arterial roadway and would not be expected to result in significantly new types of impacts that do not already occur with the existing transportation facility. The right-of-way acquisitions within the low-income and minority areas are expected to affect a small number of properties.
Alternative NE-5 would also be located primarily along or within major transportation facilities, including a major intermodal rail yard and major arterial roadways. The right-of-way acquisitions within the low-income and minority areas are expected to affect a small number of properties.
Alternative NE-6 would have impacts and benefits similar to NE-3 and NE-5 combined.
Alternatives NE-7 LRT would expose homes and businesses that are located along the proposed project corridors to similar potential impacts of Alternative NE-3; however, those impacts are not expected to be significantly adverse. Alternative NE-7 LRT would be
123 Charlotte Corridor Major Investment Studies Northeast Corridor Final Report
September 25, 2002
located primarily within an existing arterial roadway and would not be expected to result in significantly new types of impacts that do not already occur with the existing transportation facility. The right-of-way acquisitions within the low-income and minority areas are expected to affect a small number of properties. The BRT portion of Alternative NE-7 would have impacts and benefits similar to NE-3 but to a lesser extent due to the shorter routing.
In general, the proposed project would not result in disproportionately adverse impacts on low-income or minority communities in the study area. Among the positive effects of the project for these residents are enhanced mobility options, greater access to regional jobs and non-job opportunities such as educational, shopping, and entertainment activities, as well as potential economic development along the project corridor.
3.12 Summary of Affected Environment Analysis
A summary matrix of the impacts associated with each build alternative is provided in Table 3-20. Several of the impact categories are not affected by the proposed alternatives. This
matrix highlights the alternatives (by mode and alignment) and the level of potential impact for each environmental category based upon a subjective ranking of low, moderate, and high relative impacts. For those impacts categories that are not affected by an alternative, the level of impact is listed as “none”. The summary matrix is presented as an aid to comparing alternatives; however, a ranking of “high” does not necessarily imply that the actual impact is severe, but that the alternative itself rates as relatively “high” for the impact that it creates.
The impacts associated with the project build alternatives. The majority of the screening categories for parklands, communities, visual quality, noise, water quality, wetlands, floodplains, cultural resources, economically sensitive areas, endangered species and hazardous materials sites mostly have none or low impacts for the various build alternatives. In the case of visual quality, alternatives NE-4, NE-5 and NE-6 all have low to moderate impacts, since LRT or streetcar have some visual impacts relating to overhead catenaries. However, with modern LRT and streetcar technologies, these offer sleeker vehicles and catenary requirements, thus with less intrusive visual impacts.
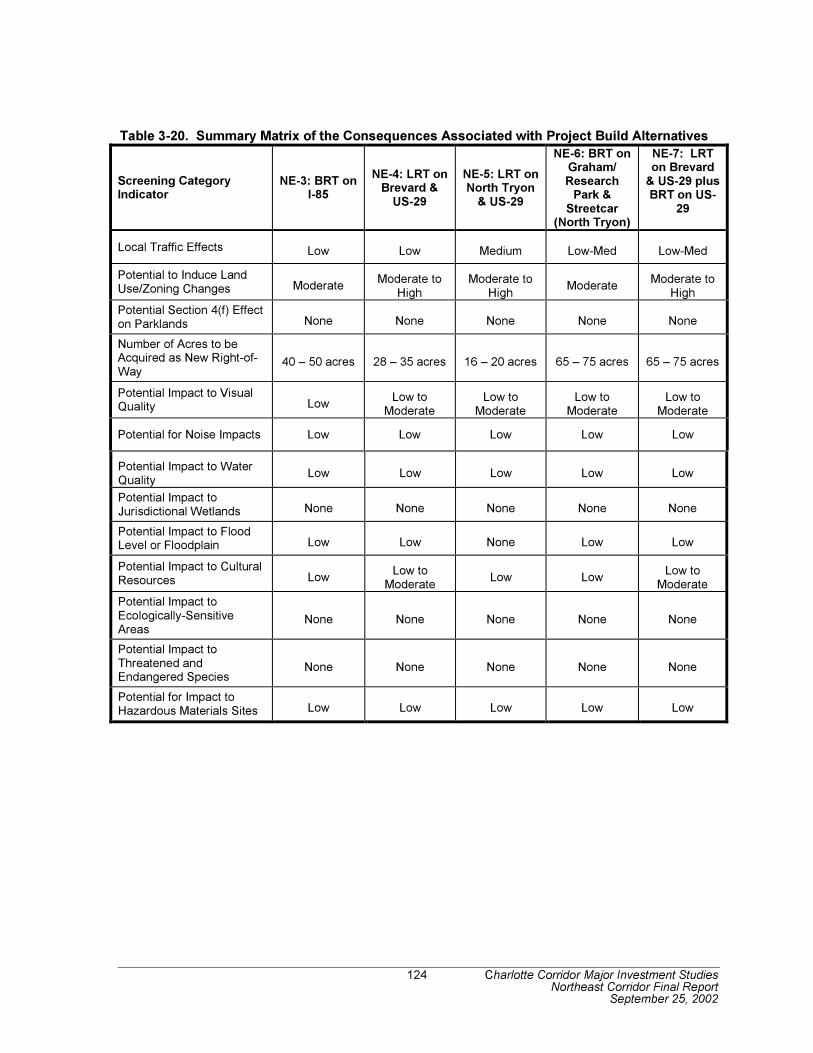
124 Charlotte Corridor Major Investment Studies Northeast Corridor Final Report
September 25, 2002
Table 3-20. Summary Matrix of the Consequences Associated with Project Build Alternatives
Screening Category Indicator
NE-3: BRT on I-85
NE-4: LRT on Brevard &
US-29
NE-5: LRT on North Tryon
& US-29
NE-6: BRT on Graham/ Research
Park & Streetcar
(North Tryon)
NE-7: LRT on Brevard
& US-29 plus BRT on US-
29
Local Traffic Effects Low Low Medium Low-Med Low-Med
Potential to Induce Land Use/Zoning Changes Moderate
Moderate to High
Moderate to High
Moderate Moderate to
High
Potential Section 4(f) Effect on Parklands None None None None None
Number of Acres to be Acquired as New Right-of-Way
40 – 50 acres 28 – 35 acres 16 – 20 acres 65 – 75 acres 65 – 75 acres
Potential Impact to Visual Quality Low
Low to Moderate
Low to Moderate
Low to Moderate
Low to Moderate
Potential for Noise Impacts Low Low Low Low Low
Potential Impact to Water Quality
Low Low Low Low Low
Potential Impact to Jurisdictional Wetlands None None None None None
Potential Impact to Flood Level or Floodplain Low Low None Low Low
Potential Impact to Cultural Resources Low
Low to Moderate
Low Low Low to
Moderate
Potential Impact to Ecologically-Sensitive Areas
None None None None None
Potential Impact to Threatened and Endangered Species
None None None None None
Potential for Impact to Hazardous Materials Sites Low Low Low Low Low

125 Charlotte Corridor Major Investment Studies Northeast Corridor Final Report
September 25, 2002
4 COMPARATIVE BENEFITS AND COSTS
Chapter Summary
This chapter evaluates the transportation, land use and environmental effects of the various light rail and bus rapid transit alternatives that are defined in Chapter and 2.
In this chapter, the benefits, costs and impacts of each of the transit Build alternatives are compared to one another — and to the Future Baseline system that does not entail a major capital investment. All of the technical data, and screening criteria presented earlier in Chapters 2 and 3 are considered in this evaluation.
Section 4.1 begins with a discussion of the goals and evaluation criteria used in this MIS. It also briefly reviews how the MIS criteria mesh with the FTA’s New Starts requirements. Section 4.2 describes the specific criteria and measures used in the evaluation, and the results of the evaluation of the baseline and Build alternatives on land use, community and economic development; mobility and operations; environmental effects; financial considerations; and system development/Center City measures.
Section 4.3 summarizes those measures that differ substantially between the alternatives evaluated. Section 4.4 outlines the next steps required to refine the implementation plan for improving transit in Charlotte and the surrounding area.
4.1 Evaluation Criteria
The purpose of the MIS is to determine the need for and the nature of transit service improvements in the various corridors of the Charlotte region. The various corridor goals and system plan principles listed in Chapter 1, led to the development of a set of evaluation criteria to help determine the degree to which the various transit improvement alternatives address these needs.
The evaluation criteria were developed to provide a comparable level and set of criteria for use as the basis for system development and to provide those data required for FTA New Starts funding evaluation, if desired. These criteria were adopted by the MTC on October 23, 2001 for all corridors. They are presented in Table 4-1.
The table summarizes a procedure that provides for the evaluation of the corridors and system at three levels as depicted by the columns in Table 4-1 as follows:
• LPA – at the Corridor level;
• Overall System Optimization;
• Implementation Phasing
This MIS uses the first set of criteria LPA Selection to evaluate the alternatives for the Northeast Corridor. The other two levels of evaluation criteria will be used for overall system optimization and for determining which alternative will have the best chance at a phased implementation.

126 Charlotte Corridor Major Investment Studies Northeast Corridor Final Report
September 25, 2002
FTA New Starts Criteria All of the MISs use criteria established by the FTA for evaluating the various corridor alternatives. These criteria are utilized to ensure that CATS has the data necessary to apply for Federal funds for design and construction of the locally preferred alternative. The five FTA Project Justification Criteria, which reflect the same criteria and measures as the corridor measures are:
• Mobility Improvements;
• Environmental Benefits;
• Operating Efficiencies;
• Cost Effectiveness; and
• Existing Land Use, Transit Supportive Land Use Policies, and Future Patterns.
In addition, FTA considers “Other Factors” which are:
• Degree of Local Financial Commitment;
• The degree that institutions (local transportation initiatives, parking policies, etc.) are in place as assumed in the forecasts;
• Multi-modal emphasis of the locally preferred investment strategy;
• Environmental justice considerations and equity issues;
• Opportunities for increased access to employment for low-income persons, and welfare to work initiatives;
• Public involvement program activities, including private sector and institutional involvement;
• Livable communities initiatives and local economic development initiatives;
• Consideration of alternative land use development scenarios in local evaluation and decision making for the locally preferred transit investment decision; and
• Consideration of innovative financing, procurement, and construction techniques, including design-build turnkey applications.
Table 4-1 shows the adopted evaluation criteria for the major investment studies.

1
27
Charlott
e C
orr
idor
Majo
r In
vestm
ent
Stu
die
s
Nort
heast
Corr
idor
Fin
al R
eport
S
epte
mber
25,
2002
Tab
le 4
-1. A
do
pte
d E
valu
ati
on
Cri
teri
a f
or
Majo
r In
vestm
en
t S
tud
ies
Ob
jecti
ve
Lo
cally P
refe
rred
Alt
ern
ati
ve S
ele
cti
on
O
vera
ll S
yste
m O
pti
miz
ati
on
Im
ple
men
tati
on
Ph
asin
g
Lan
d U
se
•
Exis
ting
corr
idor
& s
tatio
n a
rea la
nd
use
pa
ttern
s
•
Exis
ting
corr
idor
& s
tatio
n a
rea d
evelo
pm
ent ch
ara
cte
r
•
Po
tential T
ransit-O
rie
nte
d D
evelo
pm
ent
(TO
D)
sites
Exis
ting
lan
d u
se p
olic
ies &
to
ols
for
sta
tio
n a
rea
&
corr
idor
•
Futu
re c
orr
idor
& s
tatio
n a
rea la
nd
use
patt
ern
s
•
En
han
ce
Cen
ter
City &
core
are
a g
row
th
Maxim
izes o
pp
ort
unity t
o m
ee
t C
en
ters
&
Corr
idors
La
nd U
se
Vis
ion/2
02
5 T
ransit-L
an
d
Use P
lan
•
Ne
ar-
term
op
port
unitie
s t
o s
hap
e e
merg
ing
g
row
th/r
ed
evelo
pm
en
t
•
La
nd u
se p
olic
ies in
pla
ce
Mo
bilit
y/
Op
era
tio
ns
•
Rid
ers
hip
– t
ota
l a
nd n
ew
•
Tra
vel tim
e s
avin
gs
•
Ch
ang
e in v
ehic
le m
iles o
f tr
avel
•
Tra
nsit d
ep
end
ent
acce
ss
•
Ch
ang
e in tra
nsfe
rs
•
Serv
ice
relia
bili
ty
•
Co
nn
ectio
ns t
o a
ctivity c
ente
rs,
sp
ecia
l even
t &
cultura
l sites
•
Rid
ers
hip
– t
ota
l a
nd n
ew
•
Ab
ility
to a
ttra
ct
desir
ed t
ravel m
ark
ets
•
Tra
vel tim
e s
avin
gs
•
Imm
edia
te n
ee
d t
o im
pro
ve a
ccess t
o e
mp
loym
ent
(Cen
ter
City &
revers
e c
om
mute
locatio
ns)
•
Imm
edia
te n
ee
d f
or
co
ng
estio
n r
elie
f
•
Op
port
unity t
o im
ple
ment
inte
rim
(T
SM
-typ
e)
serv
ice
impro
vem
ent
En
vir
on
men
t •
Dis
pla
cem
ents
•
Nois
e a
ffecte
d r
eceiv
ers
•
Lo
cal tr
aff
ic e
ffects
•
Cultura
l or
natu
ral re
so
urc
es a
ffecte
d
•
Pro
pert
ies w
ith a
ccess a
ffecte
d
•
Wate
r re
so
urc
es a
ffecte
d
•
Min
imiz
e d
isru
ption
s (
com
munitie
s,
na
tura
l
are
as, cultura
l re
so
urc
es,
etc
.)
•
Air
qu
alit
y im
pro
vem
ents
(m
ob
ile s
ourc
e
em
issio
n r
ed
uction
s,
Lo
ng
Ra
ng
e P
lan &
TIP
co
nfo
rmity)
•
Envir
onm
enta
l Ju
stice (
eq
uity in
dis
trib
utio
n o
f b
en
efits
an
d c
osts
, p
ast in
vestm
ents
rela
tive
to E
J p
op
ula
tio
ns)
•
Min
imiz
e d
isru
ption
s (
com
munitie
s,
na
tura
l are
as,
cultura
l re
so
urc
es,
etc
.)
•
Air
qu
alit
y im
pro
vem
ents
(m
ob
ile s
ourc
e e
mis
sio
n
red
uctio
ns,
Lo
ng
Rang
e P
lan &
TIP
co
nfo
rmity)
•
Envir
onm
enta
l Ju
stice (
eq
uity in
dis
trib
utio
n o
f b
en
efits
an
d c
osts
, p
ast in
vestm
ents
rela
tive t
o E
J p
op
ula
tio
ns)
Fin
an
cia
l •
Cap
ital costs
•
Incre
men
tal co
st p
er
new
rid
er
•
Op
era
ting
& m
ain
tena
nce c
osts
•
Tota
l syste
m c
ost re
lative t
o f
un
din
g c
ap
acity
(cap
ital cost,
op
era
ting
& m
ain
tena
nce
sub
sid
y)
•
Ab
ility
to a
ttra
ct fe
dera
l a
nd
sta
te f
un
ds
•
Op
port
unitie
s t
o levera
ge o
ther
so
urc
es
•
Inte
rim
syste
m c
ost re
lative t
o f
un
din
g c
ap
acity (
cap
ital
cost,
op
era
ting
& m
ain
ten
an
ce
sub
sid
y)
•
Ab
ility
to a
ttra
ct fe
dera
l a
nd
sta
te f
un
ds
•
Op
port
unitie
s t
o levera
ge o
ther
so
urc
es
Sy
ste
m
Dev
elo
pm
en
t/
Cen
ter
Cit
y
•
Synerg
y w
ith
oth
er
corr
idors
(th
roug
h-s
erv
ice a
nd
co
nn
ectio
ns)
•
Op
era
ting
eff
icie
ncy
•
Bala
nce u
se o
f syste
m c
ap
acity
•
Pa
sseng
er
dis
trib
utio
n in C
en
ter
City
•
Bala
nce u
se o
f syste
m c
ap
acity
•
Resp
onsiv
en
ess t
o u
rban
desig
n &
econ
om
ic
develo
pm
ent
pri
ncip
les
•
Syste
m e
xp
ansio
n c
ap
acity a
nd c
ap
ab
ility
•
Synerg
y w
ith
oth
er
corr
idors
(p
rovid
e s
erv
ice
co
nn
ectio
ns)
•
Ne
ed
to p
hase s
yste
m im
ple
menta
tio
n
•
Corr
idor
rea
din
ess f
or
pro
gra
m im
ple
menta
tion
(re
lative
availa
bili
ty o
f ri
ght-
of-
way a
nd
sta
tio
n a
rea la
nd
, la
nd
use p
olic
ies in p
lace, p
ub
lic a
ccep
tance)

128 Charlotte Corridor Major Investment Studies Northeast Corridor FInal Report
September 25, 2002
4.2 Evaluation of Project Alternatives
4.2.1 Land Use, Community Development & Economic Development
The land use criteria included a combination of land use measures discussed in Chapter 3. Existing household and employment patterns, projected future patterns, a bikeability and walkability analysis of station areas, and potential Center City growth in employment and households were assessed. Specifics about each evaluation measure are listed below.
Evaluation Measures
1. Existing corridor and station area land use patterns. This evaluation is measured by the existing households and employment characteristics of each alignment in 2000 within ½ mile of the stations.
2. Existing corridor and station area development character. This is a qualitative measure using three factors: first, rating the land use mix and conditions of existing development patterns that are transit supportive; second, the quality of pedestrian/bicycle access within the station areas of each alignment; and third, the amount of redevelopment land within each alignment.
3. Potential Transit-Oriented Development (TOD) Sites. To measure TOD potential, this criterion considered three land use factors:
• Developed areas that have the potential for evolving or being redeveloped as TOD sites,
• Existing sites that currently have TOD characteristics that could be further enhanced; and
• Potential TOD sites at greenfield (vacant land) sites.
4. Existing land use policies and tools for station area and corridor. The Charlotte-Mecklenburg Planning Commission (CMPC) has updated its General Development Policies (GDP), and they have adopted (November 2001) Transit Station Area Principles to promote transit-supportive land use. These Principles and other regulatory mechanisms are intended to support transit-oriented development in station areas, and are equally applicable to all alignments. Because all of the Northeast Corridor is in the City of Charlotte, these policies and any subsequent transit district zoning derived from them will apply to all of the alternatives.
5. Future corridor and station area land use patterns. Estimates of future growth in households and employment were made based upon Station Area Concepts for each alignment and constituent stations.
6. Enhance Center City and core area growth. This measure considered the projected number of trips beginning or ending in the Center City. The alternative and technology with the highest number of trips to and from the Center City was scored the highest.

129 Charlotte Corridor Major Investment Studies Northeast Corridor FInal Report
September 25, 2002
Table 4-2. Evaluation of Alternatives by Land Use, Community Development and Economic Development Criteria
MEASURES
NE-1: Future
Baseline
NE-3: BRT on
I-85
NE-4: LRT on
Brevard & US-29
NE-5: LRT on
North Tryon w/ dedicated
ROW
NE-6: North
Tryon Streetcar & US-29 BRT
NE-7: LRT on
Brevard & US-29 plus US-29
BRT
Existing corridor & station area land use patterns
N/A Medium Low-Med Medium High High
Existing corridor & station area development character
N/A Low-Med Medium Medium Med-High Med-High
Potential Transit-Oriented Development (TOD) sites
N/A Low-Med Medium Medium Medium Med-High
Existing land use policies & tools for station area & corridor
N/A Medium Medium Medium Medium Medium
Future corridor & station area land use patterns
N/A Med-High Medium Medium High High
Enhance Center City & core area growth
N/A High Medium Medium Low-Med Low-Med
Findings The following summarize the reasons for key rankings cited in the table above:
Existing Corridor and Station Area Land Use Patterns • NE-4 scorers the lowest because it has the least amount of existing households and jobs
within a half-mile radius of its potential stations.
• NE-7 scores the best because it has the highest amount of existing households and jobs within a half-mile radius of its potential stations.
Existing Corridor and Station Area Development Character • NE-3 scores the lowest because this factor is based on both walkability and support for
transit usage. Because of its automobile orientation, existing interstate-related development along I-85 is neither walkable nor supportive of transit usage.
• NE-7 scores the best not only because of the amount but also the location of its stations. Most stations along the LRT alignment will be highly walkable and have good potential market support for transit-oriented development. In addition, in-fill residential development is starting to take place within University Research Park, giving that area more of a mix and density of uses. Examples include W.T. Harris Blvd. at Technology Drive. Other infill is along the periphery including sites along Mallard Creek Road and Mallard Creek Church Road.
Potential Transit-Oriented Development (TOD) Sites • Although it has a significant amount of vacant acreage, the NE-3 alternative scores the
lowest because it does not provide direct, highly accessible service to either University Research Park or the US-29 corridor, both of which have potential for transit-oriented development.
• NE-7 scores the best because it provides service to many University Research Park employment centers and the North Tryon Street redevelopment corridor (in addition to the transit-friendly “NoDa” area centered on 36th and North Davidson streets). This

130 Charlotte Corridor Major Investment Studies Northeast Corridor FInal Report
September 25, 2002
alignment also has the second highest amount of station area development capacity with more market support for transit-oriented development.
Existing Land Use Policies and Tools for Station Area & Corridor • All of the alternative alignments are located within the eventual city limits of Charlotte,
which is in the process of adopting standard transit-supportive land use regulations within all station areas regardless of location.
Future Corridor and Station Area Land Use Patterns • NE-4 scores the lowest because it has the least amount of estimated households and
jobs within a half-mile radius of its potential stations in 2025.
• NE-7 scores the best because it has the highest amount of estimated households and jobs within a half-mile radius of its potential stations in 2025.
Enhance Center City and Core Area Growth • This criteria ranked transit trips to Center City Charlotte.
• The amount of transit riders coming into Center City Charlotte did not vary significantly between the alternatives.
4.2.2 Mobility and Operations
Evaluation Measures The category of Mobility Improvements is another of the six categories of criteria used by FTA to justify projects for New Starts category funding. To describe this category, the two areas of mobility and operations were selected.
Mobility includes mobility and access; two terms that describe the quality of transportation services. Mobility refers to the choices that are available to make trips and access refers to the ability to get to destinations of choice. Each of these terms indicates a different component of the ability of a wide range of persons to get from where they are to where they want to be, when they want to be there. Some persons have little choice in how this takes place and others have a number of choices. Both categories of potential transit system customers are important to the ultimate viability and success of a transit system in fulfilling its mission in a cost effective manner.
The Operations category addresses the way in which a proposed improvement contributes to or detracts from the operating efficiency of the transit system, in terms of vehicle and staff utilization, which also impacts cost effectiveness. This is the “supply side” of the evaluation.
To better measure and compare mobility, access and operations among alternatives a number of specific items were selected from those generated by the ridership forecasts. They are:
1. Total Daily Guideway Boardings: Daily boardings on either express bus routes (for the Future Baseline alternative) or boardings on the LRT or BRT guideway for the year 2025 for each alternative. The guideway boardings are those segments of travelers’ transit trips that use the transit services operating on the guideway component of the transit system.

131 Charlotte Corridor Major Investment Studies Northeast Corridor FInal Report
September 25, 2002
2. New System Transit Trips: Daily riders that can be attributed to the new system (not merely shifts from current transit modes) above the Future Baseline alternative in 2025. New transit trips measure those new trips attracted not only by the guideway improvements but also by the other service improvements in the corridor or adjoining sections of the wedges that are part of the overall corridor alternative.
3. Travel-Time Savings. The average travel time for trips provides an indication of both time savings and changes in the travel delay experienced by users of all modes of travel. The alterative with the highest overall travel time savings over the Future Baseline alternative was ranked best.
4. Transit Dependent Access. Access to transit by those who typically do not have an alternative way to get to where they want to go is an important measure of the success of a transit alternative. It was measured by the total number of households below the federal poverty level in 1990, located within one-half mile of transit stations for each alternative.
5. Service Reliability. Another measure of the efficiency of a transit alternative is the relative likelihood that an alternative will be able to meet its operating schedule. When a system is on an exclusive right-of-way, it has a higher probability of meeting the established schedule than one that is operating in mixed traffic. Alternatives with a high amount of exclusive and partial separation were given higher scores.
6. Connections to Activity Centers, Special Event, and Cultural Sites. The ability of a transit system to link major trip generators and attractors in a corridor is another important mobility measure. Access for "non-work" type trips extends the utility of a transit system and addresses congestion during times that are typically away from the standard peak periods of travel. Examples of these sites include college and university campuses, libraries, transportation centers the sports complexes, major malls, museums and other cultural centers.
Table 4-3. Evaluation of Alternatives According to Mobility and Operations Criteria
MEASURES
NE-1: Future
Baseline
NE-3: BRT on
I-85
NE-4: LRT on
Brevard &
US-29
NE-5: LRT on
North Tryon w/ dedicated
ROW
NE-6: North
Tryon Streetcar & US-29 BRT
NE-7: LRT on
Brevard & US-29 plus US-29
BRT
Total Daily Giudeway Boardings
N/A BRT: 16,000 –
19,000 LRT: 10,000 -
12,000 LRT: 9,000 –
11,000
LRT: 2,000 – 3,000
BRT: 17,000 – 19,000
LRT: 6,000 – 8,000
BRT: 7,000 – 10,000
New Daily Transit Trips N/A 13,940 11,940 11,940 13,940 11,940
Daily travel time savings (hours)
N/A 600 600 100 700 1,200
Transit dependent access (within 0.5 mi.)
N/A 3,464 4,535 4,074 7,201 4,582
Service reliability Low Medium High High Medium High
Connections to activity centers, special event & cultural sites
Medium High High High High High
Findings Table 4-3 summarizes the mobility and operations measures as they compare across the Northeast Corridor alternatives. It shows that alternatives containing a BRT component, i.e. NE-3, NE-6 and NE-7, have the highest total daily riders ranging between 16,000 and 22,000 riders. Alternatives NE-3 and NE-6 also contain the highest number of new daily new transit trips at

132 Charlotte Corridor Major Investment Studies Northeast Corridor FInal Report
September 25, 2002
13,940. The pure LRT alternatives average total daily riders between 9,000 and 12,000. All new build alternatives perform considerably better than the baseline.
The LRT and BRT components work together to serve the multiple markets of the corridor. The LRT line provides a line-haul service from the corridor to Center City Charlotte and to the South Corridor, as well as, serves the reverse trip market consisting of jobs and activities in the University City/Research Park area. The BRT component acts as a local collector-distributor for the LRT service. It also serves the dispersed development pattern of jobs and households in the outer corridor including University City, University Research Park and Kings Grant/Concord Mills.
All build alternatives offer good connectivity to existing systems, and medium to high reliability. Alternative NE-6 offers the best transit dependent access, due to the right-of-way. This is also due to the potential for the streetcar to have numerous stops along the alignment thereby maximizing access for surround transit dependent populations.
4.2.3 Environmental Effects
Evaluation Measures It should be noted that for MIS purposes the review of the environmental and community effects of the alignment alternatives is only an initial assessment of fatal flaws. An EIS would be prepared later in the process as part of the Preliminary Engineering stage.
As stated in Chapter 3, the air quality analysis indicated that all of the alternatives would reduce the number of regional vehicle-miles traveled. Therefore, all would be ranked equally in terms of reducing energy consumption as well as emission levels. As a result, this factor was not included in the evaluation table.
The environmental and community impacts in the evaluation matrix were rated by the following characteristics:
1. Displacements – The number of displacements was derived derive by counting the number of potential acres of right-of-way required where relocations of the residents or tenants might be necessary to construct the transit alignment.
2. Potential for noise impacts – The number and type of potential sensitive receptors exposed to projected noise levels above the FTA impact threshold were evaluated along each alternative.
3. Local traffic effects – The build alternatives were compared against the Future Baseline alternative to measure the change in traffic congestion.
4. Cultural or natural resources affected – This criterion was a cumulative average of the individual ratings for five sub criteria: historic and/or archaeological properties affected; acreage of parkland impacted; the number of community and/or cultural facilities affected; suitable habitat for protected species; and the number of hazardous materials and/or waste sites along the alternative.
5. Properties with access affected – The number of curb cuts (access/egress from public street to private property) along each alternative was counted.
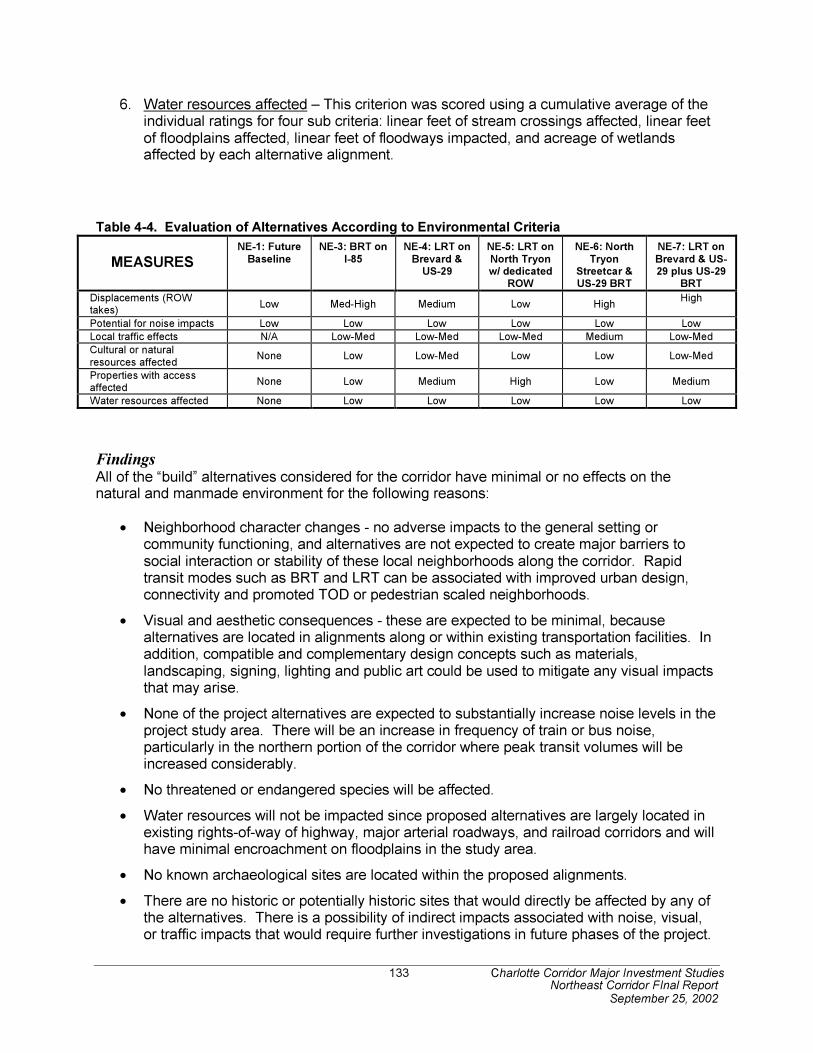
133 Charlotte Corridor Major Investment Studies Northeast Corridor FInal Report
September 25, 2002
6. Water resources affected – This criterion was scored using a cumulative average of the individual ratings for four sub criteria: linear feet of stream crossings affected, linear feet of floodplains affected, linear feet of floodways impacted, and acreage of wetlands affected by each alternative alignment.
Table 4-4. Evaluation of Alternatives According to Environmental Criteria
MEASURES
NE-1: Future
Baseline
NE-3: BRT on
I-85
NE-4: LRT on
Brevard & US-29
NE-5: LRT on
North Tryon w/ dedicated
ROW
NE-6: North
Tryon Streetcar & US-29 BRT
NE-7: LRT on
Brevard & US-29 plus US-29
BRT
Displacements (ROW takes)
Low Med-High Medium Low High High
Potential for noise impacts Low Low Low Low Low Low
Local traffic effects N/A Low-Med Low-Med Low-Med Medium Low-Med
Cultural or natural resources affected
None Low Low-Med Low Low Low-Med
Properties with access affected
None Low Medium High Low Medium
Water resources affected None Low Low Low Low Low
Findings All of the “build” alternatives considered for the corridor have minimal or no effects on the natural and manmade environment for the following reasons:
• Neighborhood character changes - no adverse impacts to the general setting or community functioning, and alternatives are not expected to create major barriers to social interaction or stability of these local neighborhoods along the corridor. Rapid transit modes such as BRT and LRT can be associated with improved urban design, connectivity and promoted TOD or pedestrian scaled neighborhoods.
• Visual and aesthetic consequences - these are expected to be minimal, because alternatives are located in alignments along or within existing transportation facilities. In addition, compatible and complementary design concepts such as materials, landscaping, signing, lighting and public art could be used to mitigate any visual impacts that may arise.
• None of the project alternatives are expected to substantially increase noise levels in the project study area. There will be an increase in frequency of train or bus noise, particularly in the northern portion of the corridor where peak transit volumes will be increased considerably.
• No threatened or endangered species will be affected.
• Water resources will not be impacted since proposed alternatives are largely located in existing rights-of-way of highway, major arterial roadways, and railroad corridors and will have minimal encroachment on floodplains in the study area.
• No known archaeological sites are located within the proposed alignments.
• There are no historic or potentially historic sites that would directly be affected by any of the alternatives. There is a possibility of indirect impacts associated with noise, visual, or traffic impacts that would require further investigations in future phases of the project.

134 Charlotte Corridor Major Investment Studies Northeast Corridor FInal Report
September 25, 2002
• Although there are several public parks, greenways, and recreational facilities located within the Northeast Corridor, none of these will be directly affected by any of the alternatives.
• The results of records review and field investigations indicate that there are several known sites of recorded contamination and hazardous substances present in the study area. None are located inside the proposed rights-of way, and therefore they are not expected to be directly impacted.
As shown in Table 4-4, for most of the environmental categories the impacts are very low and cannot be used as significant differentiators to compare the various build alternatives. The table below contains two environmental criteria that show a difference among the alternatives. These include the “potential acres of right-of-way that would be required” to construct the alternative and the “local traffic impacts” that would be generated by the individual alternatives.
Alternative NE-6 is expected to require the largest amount of right-of-way - between 65 and 75 acres. Clearly, this is because the alternative contains both a BRT option as well as the streetcar along North Tryon Street and is associated with a larger number of park-and-ride facilities. The LRT option in alternative NE-5 requires the least amount of right-of-way, requiring between 16 and 20 acres of land. Alternative NE-3, the BRT on I-85 alignment requires between 40-50 aces, while Alternative NE-4, LRT on Brevard and US-29 requires between 28 and 35 acres for right-of-way.
Local traffic effects for the various alternatives are very minimal. The BRT alternatives have the lowest impacts while the LRT alternatives have a higher impact. Although NE4 and NE-7 are LRT alternatives, they have a low impact on local traffic because they use the NCRR from Center City as they leave the Transportation Center to Craighead and then the alignments cross over Sugar Creek Road and run in the median of North Tryon Street. North of Sugar Creek Road, the LRT option would limit traffic movements at some locations to right-in/ right-out operations.
Other local traffic impacts as a result of operating characteristics including, signal pre-emption, arriving/ existing station and park & ride traffic would be investigated in detail in the next phase of the project.
4.2.4 Financial
Evaluation Measures Capital and operating costs clearly play a significant deciding role in the evaluation and choice of a preferred alternative for the Northeast Corridor. These costs, in conjunction with ridership, are used to estimate the cost-effectiveness of the individual build alternatives. Table 4-65 shows various financial criteria or measures, including capital and annual operating and maintenance costs for the various alternatives. All costs are in 2002 dollars. The capital costs include all engineering, design, construction, facilities, rolling stock and contingency costs required to implement the alternatives.
When each fixed guideway or rapid transit alternative has been implemented, additional funding will be required to operate and maintain that new piece of the system. The annual operating and maintenance (O&M) costs summarized in the table include all the costs related to the fixed guideway component and the supporting non-guideway service component of each alternative.

135 Charlotte Corridor Major Investment Studies Northeast Corridor FInal Report
September 25, 2002
The annual O&M costs are those over and above the cost to operate and maintain the Future Baseline (NE-1) Alternative.
The measure “incremental cost per new rider” also summarized in the table below, is a cost effectiveness measure that provides a means of comparing the benefits of the alternatives being considered relative to the costs of the alternatives. This measure, expressed in 2002 dollars, is based on the total annualized capital investment and annual operating costs divided by the forecasted change in annual transit trips, and compared to the Future Baseline (NE-1) Alternative. It offers an indication of the return of investment in terms of new transit trips being made as a result of the transit improvement.
Table 4-5. Evaluation of Alternatives According to Financial Criteria
MEASURES
NE-1: Future Baseline
NE-3: BRT on I-85
NE-4: LRT on Brevard
& US-29
NE-5: LRT on North Tryon
w/ dedicated ROW
NE-6: North Tryon Streetcar
& US-29 BRT
NE-7: LRT on Brevard & US-
29 plus US-29 BRT
Capital costs N/A $205 M $369 M $379 M $636 M Streetcar:
$211 M BRT: $425M
$443 M LRT: $295M BRT: $148M
Incremental cost per new transit trip
N/A $7.03 $12.32 $12.35 $17.41 $14.92
Operating & maintenance costs
$11.7M $10.9M $12.4M $11.7M $17.0M $14.9M
Findings The capital costs include all engineering, design, construction, facilities, rolling stock and contingency costs required to implement the alternative. Costs for Alternative NE-6 are highest, with total estimated cost of $636 million. However, this alternative incorporates two rapid transit modes along separate alignments i.e. a streetcar along North Tryon Street and a BRT serving North Graham Street, the Research Park and along US-29. BRT along I-85 is the least costly at $205 million since it remains for the most part on I-85 using the existing freeway shoulders, and includes fewer structural improvements, such as special on and off ramps and dedicated right-to-way.
The O&M cost estimates are the highest for Alternative NE-6, which incorporates both BRT and street running LRT service. NE-7 operations and maintenance are just slightly less because the BRT component of the alternative offers less coverage and less service. Alternative NE-3 costs the least to operate and maintain primarily because it only utilizes BRT. Similarly, NE-5, which is the LRT only alternative, has very similar O&M costs as NE-3.
The LRT could be built as an extension of the South Corridor LRT line, therefore improving its operational effectiveness and leveraging public investment. Northeast LRT service would use the tracks, guideway and stations that will be built through Center City Charlotte and the storage, maintenance and operations facility that is being built for the South Corridor.
The lower the cost, the better the cost-effectiveness. Cost per new transit trip is highest for NE-6 even though it carries approximately the same number of riders as NE-3 and NE-7. This is due to the significantly higher capital costs associated with this alternative. The highest cost effectiveness indicator is for Alternative NE-3 because it carries the highest number of passengers with the lowest capital investment.

136 Charlotte Corridor Major Investment Studies Northeast Corridor FInal Report
September 25, 2002
Financing Given that five corridors are being considered for capital and operational funding and will draw on the same funding sources, the financial analysis will be conducted at the system level. The financial feasibility analysis will examine the extent to which sufficient funding is available, or can be developed, to support the construction, operation, and maintenance of an alternative in the context of the other funding needs and obligations of the region.
4.2.5 System Development/Center City
Evaluation Measures Because each corridor’s transit improvement needs to work as part of an overall system coming together in the Center City, the Corridor MIS and system plan evaluations must identify how an alternative can work as part of the overall system/Center City transit plan. Table 4-6 summarizes the evaluation of each alternative using the following three criteria:
1. Synergy with Other Corridors: This criterion measures how well an alternative provides connections to other corridors within the system based on the customer’s perspective. This measurement focuses on inter-connection of corridors using potential travel markets.
2. Operating Efficiency: This factor examines how well each alternative fits within an overall system from an operations perspective. Each alternative is evaluated to determine its potential to provide through service to other corridors, thus avoiding deadhead operations that add to system operating and maintenance costs.
3. Balanced Use of System Capacity: This criterion evaluates how well an alternative takes advantage of existing rail or highway capacity. An alternative that operates on an under-utilized rail line or that uses roadway lanes with low traffic volumes would rate better on this criterion than one that would eliminate well-used traffic lanes in order for it to be implemented.
Table 4-6. Evaluation of Alternatives According to System Development /Center City Criteria
MEASURES
NE-1: Future
Baseline
NE-3: BRT on
I-85
NE-4: LRT on
Brevard & US-29
NE-5: LRT on
North Tryon w/ dedicated
ROW
NE-6: North
Tryon Streetcar & US-29 BRT
NE-7: LRT on
Brevard & US-29 plus US-29
BRT
Synergy with other corridors (through-service and connections)
Low Med-High Med-High Med-High High Med-High
Operating efficiency Low High High High High High
Balance use of system capacity
Low High High Medium Medium High
Findings Synergy defines an alternative’s ability to provide either through service from one corridor to another, or convenient connections that facilitate through service. It also defines an alternative’s ability to serve several travel markets. All alternatives in the Northeast Corridor have relatively convenient connections to other corridor services by being able to transfer at the Transportation Center, the West Trade Street Intermodal Station and/or along Trade Street. The Northeast LRT has a relatively good rating because of the connection to the South Corridor LRT.

137 Charlotte Corridor Major Investment Studies Northeast Corridor FInal Report
September 25, 2002
Operating Efficiency defines an alternative’s ability to operate through services. Once again BRT and rail alternatives do well in this corridor because of their connection to the South Corridor.
System Capacity relates to the ability of an alternative to use existing transportation capacity and/or facilities. Northeast BRT and rail do not need to utilize available capacity and thus get a medium to high rating.
4.2.6 Community Involvement Response
The people who live and work in the Northeast Corridor are the ones most familiar with the corridor’s transportation problems, and best able to evaluate ideas for improvements. Public involvement has been an essential element to the project and various methods have been employed to involve the local community and other stakeholders in the broader MIS process as part of a public involvement plan. This comprehensive public involvement plan was used to define key issues and concerns that exist with regard to transit and land use in the corridor. The participation process was also designed to inform the public of the project and therefore incorporated various information-sharing media to increase public awareness and knowledge of the project. It also served as an important means of obtain valuable local input to proactively seek the participation and views of the broader public and allowed a channel for citizen feedback to be incorporated into the project’s decision-making process.
Numerous outreach efforts and techniques were used as part of the broader public participation process, including stakeholder interviews, public meetings, presentations to neighborhood associations, business organizations and other interest groups in the corridor, newsletters, website and other participation techniques.
Many issues and concerns were raised as a result of the public participation process, some of the most common concerns included:
• A concern for land use and TOD issues, such as how station locations would affect development and economic revitalization. Participants were also interested in the amenities that would be available at stops, and added that large park-and-rides are unattractive. Northeast Corridor citizens were also concerned about increasing density. They wanted to know the locations where densities would likely increase and to what degree.
• Connectivity and accessibility to other corridors was also stressed by many individuals, who wanted to be able to ride transit to other destinations in the county, and not just to have their travel opportunities limited to within the corridor.
• Citizens wanted to be educated on the differences between the modes. They were interested in trip-times, examples in other cities, and impacts on congestion. Another key point was that no matter which technology was chosen, they wanted “local” and “express” service. As many other people expressed in other corridors, Northeast Corridor residents said that there is a “stigma” attached to buses that makes the alternative unattractive; however, they agreed that BRT offers flexibility that LRT doesn’t.
Most of these concerns were addressed during public meetings and by refining each of the alternatives to avoid the negative impacts that were raised. In addition, decision-makers will carefully consider public comments before deciding on a locally preferred alternative for the Northeast Corridor.

138 Charlotte Corridor Major Investment Studies Northeast Corridor FInal Report
September 25, 2002
4.2.7 Equity
Equity considerations generally fall within three classes:
• The extent to which the transit investments improve transit service to various population segments, particularly those that tend to be transit dependent
• The distribution of the cost of the alternatives across population segments through the funding mechanism used to cover the local contribution to construction and operation
• The incidence of any significant environmental effects, particularly in neighborhoods immediately adjacent to proposed facilities
Based on the material presented in Section 3.11, the economic and community development, mobility, and environmental benefits of the Northeast Corridor alternatives accrue to the residents of the corridor as well as to the Charlotte-Mecklenburg region, while the relatively few adverse effects are borne primarily by those persons residing in the corridor.
In general, the BRT and LRT alternatives considered would not result in disproportionately adverse effects on low-income or minority communities in the study area. Among the positive effects of the project for these residents are enhanced mobility options, greater access to regional jobs and non-job opportunities such as educational, shopping, and entertainment activities, as well as potential economic development along the corridor.
Established regional, state, and federal funding mechanisms will be used for construction and operations of any of the alternatives and will be part of the CATS capital and operating budgets, and no new taxes will be required. The use of established federal and regional sources means no one group in the study area or the region receives a disproportionate share of the financial burden of the capital and O&M costs relative to the benefits received. No financial equity considerations are raised by any of the alternatives, either in terms of the source of subsidy or the level of fare payments required of passengers.
4.3 Discussion of Trade-Offs
The trade-offs analysis is an evaluation in which all relevant criteria are considered together, including both quantifiable and non-quantifiable considerations. The relevant criteria include only those measures where discernible and significant differences can be noted between alternatives. While all of the information collected during the study and presented previously was considered in the evaluation of alternatives, some considerations do not distinguish between alternatives. Therefore, only those considerations that were deemed decisive in differentiating alternatives are presented here. Trade-offs refer to the fact that any alternative may have both positive and negative aspects and that selecting a LPA requires balancing these trade-offs.
Within a corridor, a number of types of trade-offs may exist. Examples of the types of trade-offs are:
• Among alignments: one alignment may serve a greater concentration of existing population, for example, while another could better stimulate new development and thus a larger future population.

139 Charlotte Corridor Major Investment Studies Northeast Corridor FInal Report
September 25, 2002
• Among modes: a mode that typically has more stations enables a greater percent of riders to access the service by walking. However, the more stops, the more the market for TOD is divided and more stations mean and an increase in travel time.
All of the transit alternatives examined in the MIS are feasible, but they have varying costs and benefits. To determine how well the Northeast Corridor alternatives meet the project goals and objectives selected by the MTC, an evaluation matrix format was used to summarize key distinguishing data by category (see Table 4.7 and 4.8).
Among the five alternatives that the Northeast Corridor MIS examined in detail, the major differences in land use impacts are between the BRT-based alternatives and the rail-based alternatives. Indeed, the difference between the land use impacts of the first two rail alternatives (NE-4 and NE-5) are minimal as they share all but three of the same station locations.
The BRT alternative NE-6 serves a higher number of existing households and employment. This is in large part due to the number of stations associated with this alternative and the intensive nature of many developments in University Research Park (e.g. Wachovia CIC).
While the BRT based alternative NE-6 serves the mobility needs of the I-85 corridor and University City area very well, it is limited in its ability to promote the type of TOD environments that the 2025 Integrated Transit/Land-Use Plan and the goals of the MIS process seek to create. In assessing the qualitative “development character” of the alternatives, the rail based options –NE-4, NE-5, and to nearly the same degree, NE-7—receive higher rankings due to their advantages regarding pedestrian access, finer grained mix of uses and future TOD potential.
Market support for TOD and the degree to which an alignment supports community growth and redevelopment goals was also higher for the rail alignments. The ranking for the BRT alignments for these criteria is diminished because of the nature of the development environment along I-85 which makes many of the TOD goals cited in Chapter 1 more difficult to achieve. In contrast, many of the potential rail stations are located in more urban environments that have many potential “town center” qualities (e.g. the North Davidson [“NoDa”] area at 36th Street) that support high-density, pedestrian friendly, transit-oriented development.
Because all the alternatives are within the eventual city limits of Charlotte public policy support at a fundamental level is not likely to be a major differentiator. Nevertheless, the redevelopment-oriented stations along rail alternatives would benefit more from application of related existing policies such as the Pedestrian Overlay Zoning District (PED) that would help achieve many of the TOD goals related to pedestrian access and walkability and the overall urban design quality of an area.

140 Charlotte Corridor Major Investment Studies Northeast Corridor FInal Report
September 25, 2002
Table 4-7. Comparative Summary of Differentiating Evaluation Measures
MEASURES
NE-1:
Future Baseline
NE-3: BRT on
I-85
NE-4: LRT on
Brevard & US-29
NE-5: LRT on
North Tryon w/ dedicated
ROW
NE-6: North
Tryon Streetcar &
US-29 BRT
NE-7: LRT on
Brevard & US-29 plus US-29 BRT
Land Use
Existing corridor & station area land use patterns
N/A Medium Low-Med Medium High High
Existing corridor & station area development character
N/A Low-Med Medium Medium Med-High Med-High
Potential Transit-Oriented Development (TOD) sites
N/A Low-Med Medium Medium Medium Med-High
Existing land use policies & tools for station area & corridor
N/A Medium Medium Medium Medium Medium
Future corridor & station area land use patterns
N/A Med-High Medium Medium High High
Enhance Center City & core area growth
N/A High Medium Medium Med-Low Low
Mobility/Operations
Total Daily Guideway Boardings
N/A BRT: 16,000 –
19,000 LRT: 10,000 –
12,000 LRT: 9,000 –
11,000
LRT: 2,000 – 3,000
BRT: 17,000 – 19,000
LRT: 6,000 – 8,000
BRT: 7,000 – 10,000
New Daily Transit Trips N/A 13,940 11,940 11,940 13,940 11,940
Travel time savings N/A 600 600 100 700 1,200
Transit dependent access (within 0.5 mi.)
N/A 3,464 4,535 4,074 7,201 4,582
Service reliability Low Medium High High Medium High
Connections to activity centers, special event & cultural sites
Medium Low High High High High
Environment
Displacements (ROW takes) Low Med-High Medium Low High High
Potential for noise impacts Low Low Low Low Low Low
Local traffic effects N/A Low Low Medium Low-Med Low-Med
Cultural or natural resources affected
None Low Low-Med Low Low Low-Med
Properties with access affected None Low Medium High Low Medium
Water resources affected None Low Low Low Low Low
Financial
Capital costs N/A $205 M $369 M $379 M
$636 M Streetcar: $211 M
BRT: $425M
$443 M LRT: $295M BRT: $148M
Incremental cost per new transit trip
N/A $7.03 $12.32 $12.35 $17.41 $14.92
Operating & maintenance costs $11.7M $10.9M $12.4M $11.7M $17.0M $14.9M
System Development
Synergy with other corridors (through-service and connections)
Low Med-High Med-High Med-High High Med-High
Operating efficiency Low High High High High High
Balance use of system capacity Low High High Medium Medium High
N/A: Not Available

141 Charlotte Corridor Major Investment Studies Northeast Corridor Final Report
September 25, 2002
Although station areas associated with BRT alternatives NE-3 and NE-6 have more total available land to develop than station areas along the rail alternatives, much of the development along I-85 and the University Research Park branch of NE-6 is currently and will likely continue to be contemporary, automobile-oriented “suburban” residential and commercial development. (Exceptions might be the future development at King’s Grant that could benefit from off-line stations within the active uses rather than along I-85.) The LRT recommendation yields more land use and economic redevelopment advantages over the BRT alternatives that would operate along I-85, due in part to the amount of auto-dependent development that has occurred at I-85 interchanges. The BRT option would require departing from the guideway, operating in mixed traffic to capture the transit market, thus reducing travel time savings.
Because of the total available land, existing development patterns and number of candidate stations, the estimated jobs and households added within the station areas are much higher for the BRT alternatives than for the rail alternatives. Land along the I-85 corridor (where most of the potential BRT stations are located) is being developed with retail centers, residential communities, and office parks, most of which are not transit-oriented but (e.g., at the new TIAA-CREF center) will generate many additional jobs and households. From a purely quantitative standpoint then, the two main BRT based alternatives, NE-3 and NE-6, score well. The NE-7 hybrid, however, also picks up many of the key University City activity centers and combines that with service to areas with great redevelopment potential in the inner portion of the corridor.
A partial reason for the lower quantitative ratings for the rail alignments is due to the location of many of the stations in areas that would need to redevelop rather than grow from scratch. The amount of available land for new development is very limited in many areas south of the new City Boulevard extension. The role of TOD planning in such areas has less to do with growth and more to do with stabilization and incremental infill. Transit is one means to help these areas counter strong trends that have been draining them of their economic vitality and ability to compete with the new emerging “suburban” centers of the University City area.
4.4 Next Steps
The Major Investment Studies document the technical information on the various alignments and technologies studied in each corridor and provide comparative analyses of the alternatives. A separate document, the Corridor System Plan, uses the MIS analysis results to develop an overall system plan.
The Corridor System Plan includes:
• The alignment and technology recommendations in each corridor (locally preferred alternative);
• The strategy for weaving together the five corridors in downtown and integrating the existing Transportation Center and proposed West Trade Street Multi-Modal Station; and
The implementation plan that describes the proposed schedule and financing strategy for constructing rapid transit in the corridors.


