30
Northland Power Investor Presentation June 2018 NPI.TO

Northland Power Investor PresentationJune 2018
NPI.TO

1
Forward-Looking Statements Disclaimer
This written and accompanying oral presentation contains certain forward-looking statements which areprovided for the purpose of presenting information about management’s current expectations and plans.Readers are cautioned that such statements may not be appropriate for other purposes. Forward-lookingstatements include statements that are predictive in nature, depend upon or refer to future events orconditions, or include words such as “expects”, “anticipates”, “plans”, “believes”, “estimates”, “intends”,“targets”, “projects”, “forecasts” or negative versions thereof and other similar expressions, or future orconditional verbs such as “may”, “will”, “should”, “would” and “could”. These statements may include,without limitation, statements regarding future adjusted EBITDA or adjusted EBITDA, cash flows anddividend payments, the construction, completion, attainment of commercial operations, cost and output ofdevelopment projects, plans for raising capital, and the future operations, business, financial condition,financial results, priorities, ongoing objectives, strategies and outlook of Northland and its subsidiaries. Thisinformation is based upon certain material factors or assumptions that were applied in developing theforward-looking statements, including the design specifications of development projects, the provisions ofcontracts to which Northland or a subsidiary is a party, management’s current plans, its perception ofhistorical trends, current conditions and expected future developments, as well as other factors that arebelieved to be appropriate in the circumstances.

2
Over 30 years of successfully developing, constructing and operating independent power projects
Well-diversified, 2,458 MW (gross) modern fleet of high-quality assets
Over $10 billion of assets constructed since inception and currently under construction
Overall availability of 95% across 27 operating facilities
550+ MW in development (252 MW Deutsche Bucht in-construction; 300 MW of grid allocation secured in Taiwan)
Enterprise value of approximately $12 billion¹
Significant development opportunities across multiple markets and technologies
Management alignment through a 34% ownership interest
Management experience - Combined over 200 years of power industry experience
Northland Overview
1987-Present
Over 30 Years of Excellence1. As at May 11, 2018

3
1,165%
0
500
1,000
1,500
2,000
2,500
3,000
0%
200%
400%
600%
800%
1,000%
1,200%
1,400%
Renewables (MW)
Clean Gas and Biomass (MW)
Northland Returns (%)
Evolution of Northland
2009 20181997
Founding Merger
1987Private Developer
Publically Listed Income Fund
Private Entity Public Entity
Income Fund IPO
CurrentIncome Fund PhaseEarly Growth Phase
International expansion; Leverage greenfield expertise
into new markets
Canada-wide expansion; new technologies and larger-scale projects
Power generation projects in Ontario, Canada
1. Shareholder returns include capital appreciation and dividend reinvestment
Total GrossCapacity (MW)
2,458 MW
July 16, 2009Merger of NPI
and Income Trust
Northland has grown from a local Canadian developer to an internationally renowned Independent Power Producer
Total Returns1 (%)
April 15, 1997Northland IPO

4
Northland’s Asset Diversification
Under constructionIn operation
Technology: Operating1 Construction1
Thermal 1,001 MW -
Wind 1,326 MW 252 MW
Solar 131 MW -
Total (Gross) 2,458 MW 252 MW
Total (Net)2 2,029 MW 252 MW
1. As of December 31, 20172. Represents Northland’s net economic interest
Geography: Operating1 Construction1
Canada 1,526 MW -
Netherlands 600 MW -
Germany 332 MW 252 MW
Total (Gross) 2,458 MW 252 MW
Total (Net)2 2,029 MW 252 MW

5
Northland’s Successes in the Past Year
FY 2017: Adj. EBITDA of $765 million, a 22% increase over 2016; and Free Cash Flow per share of $1.46, a 4% increase over 2016
FY 2017: Operating income of $632 million, a 24% increase over 2016 Q1 2018: Adj. EBITDA of $290M (47% ) and Free Cash Flow per share of $0.84 (250% ) Increased common share dividend by 11% to $1.20 per share as of December 2017
Operating generating capacity increased to 2,029 MW (net), a 46% increase or 2,458 MW (gross), a 61% increase over 2016
Maintained operational excellence across 27 facilities Continued health and safety track record of no lost time incidents Northland Europe internalized management for strategic and financial reasons
European offshore wind projects totaling €4B achieved project completion:o 600 MW (net 360 MW) Gemini reached commercial operations on Apr. 2017o 332 MW (net 282 MW) Nordsee One reached commercial operations on Dec. 2017
Deutsche Bucht (DeBu) project achieved Financial Close and construction is underway
Secured 300 MW (net 180 MW) of grid allocation under FIT for Taiwan project (Hai Long 2) Advanced and positioned other projects in the development pipeline Established strong international presence with our head office in Toronto plus five
international locations
$ Results
Development
Construction
Operations
6
Gas & Biomass
25%
Onshore Wind
5%
Solar10%
Offshore Wind60%
Gas & Biomass,
80%
Onshore Wind, 20%
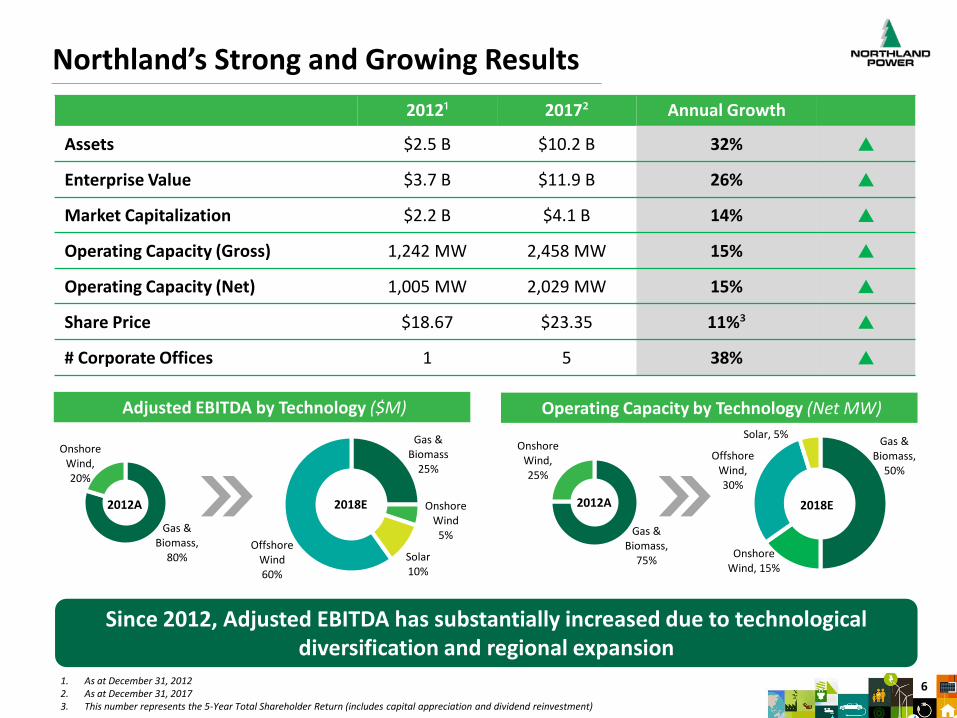
Northland’s Strong and Growing Results
Gas & Biomass,
50%
Onshore Wind, 15%
Offshore Wind, 30%
Solar, 5%
2012¹ 2017² Annual Growth
Assets $2.5 B $10.2 B 32%
Enterprise Value $3.7 B $11.9 B 26%
Market Capitalization $2.2 B $4.1 B 14%
Operating Capacity (Gross) 1,242 MW 2,458 MW 15%
Operating Capacity (Net) 1,005 MW 2,029 MW 15%
Share Price $18.67 $23.35 11%³
# Corporate Offices 1 5 38%
1. As at December 31, 20122. As at December 31, 20173. This number represents the 5-Year Total Shareholder Return (includes capital appreciation and dividend reinvestment)
Operating Capacity by Technology (Net MW)Adjusted EBITDA by Technology ($M)
Gas & Biomass,
75%
Onshore Wind, 25%
2012A 2018E
Since 2012, Adjusted EBITDA has substantially increased due to technological diversification and regional expansion
2012A 2018E
7
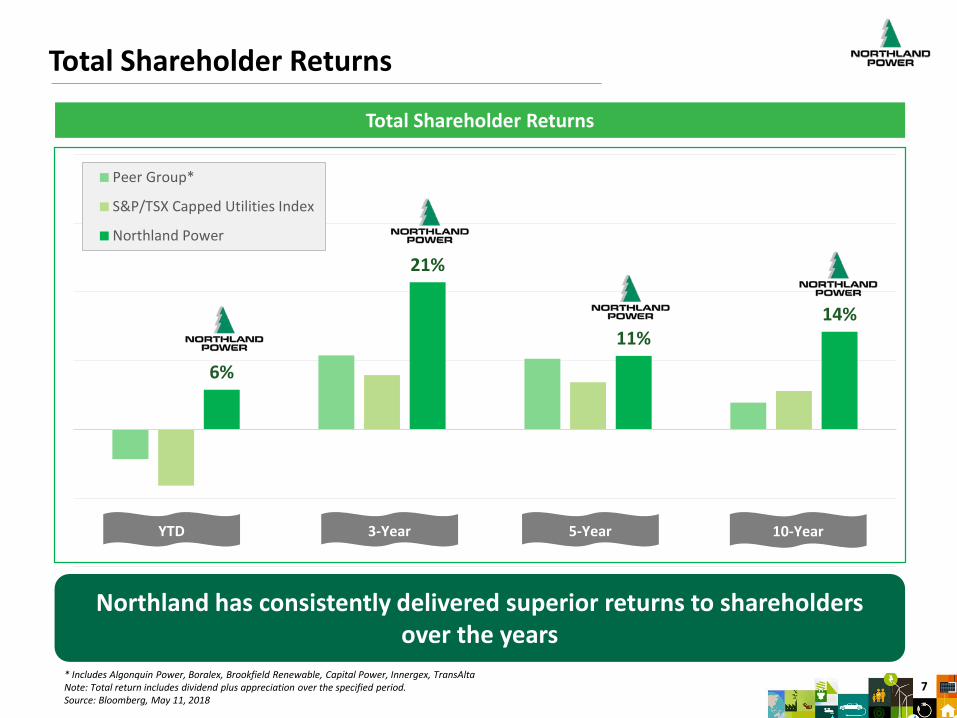
Total Shareholder Returns
6%
21%
11%14%
-20%
-10%
0%
10%
20%
30%
40%
YTD 3-year 5-year 10-year
Peer Group*
S&P/TSX Capped Utilities Index
Northland Power
3-Year 5-Year 10-YearYTD
Total Shareholder Returns
Northland has consistently delivered superior returns to shareholders over the years
* Includes Algonquin Power, Boralex, Brookfield Renewable, Capital Power, Innergex, TransAltaNote: Total return includes dividend plus appreciation over the specified period.Source: Bloomberg, May 11, 2018

8
Note: The above chart is illustrative of Management’s objectives. They are based upon Northland’s operating facilities continuing to perform in a manner consistent with operations in 2017, with additions to Adjusted EBITDA and Free Cash Flow from projects under construction and other adjustments resulting from power contract renewals primarily in Ontario as described in our MD&A and 2017 AIF. The illustrations do not constitute a financial forecast, projection or guidance and are based upon assumptions that are subject to change.
Continued Growth in Financial Results
Significant and visible growth in the future from projects in operationsand in construction
The following chart illustrates Northland’s growing Adjusted EBITDA and Free Cash Flow Per Share profile
Adjusted EBITDA Growth Free Cash Flow Per Share Growth
2012A 2014A 2016A 2018F 2020F 2012A 2014A 2016A 2018F 2020F
Growth ~200% Growth ~80%

9
World Class Offshore Wind Projects
1. Excludes the 17MW opportunity for two additional demonstration turbines utilizing suction bucket foundations. Final Investment Decision is subject to achieving certain development milestones
2. Awarded 300 MW grid allocation for 2024 COD
With the successful completion of Gemini and Nordsee One, Management is focused on construction of Deusche Bucht and development of Hai Long 2
Deutsche Bucht Hai Long 2
332 MW 85% Interest
COD Dec 2017
Gemini
252 MW1
100% Interest COD Late 2019
300 MW2
60% InterestCOD 2024
600 MW 60% InterestCOD Apr 2017
Nordsee One

10
Top Offshore Wind Projects in Operations
Current: Top 15 (Gross MW)
630600
576 573
504
402
332
LondonArray
Gemini Gwynt yMor
Race Bank GreaterGabbard
DudgeonEast
NordseeOne
2nd
15th
Gemini Project Snapshot
COD: • April 2017
Capacity: • 600 MW (gross)
Contract: • 15-year PPA with the Government of Netherlands
Type: • Offshore wind
Ownership: • Northland 60% • Siemens 20%
• Alte Leipziger & Hallesche 10%
• N.V. HVC 10%
Nordsee One Project Snapshot
COD: • December 2017
Capacity: • 332 MW (gross)
Contract: • Approx. 10-year PPA with the Government of Germany
Type: • Offshore wind
Ownership: • Northland 85%• Innogy 15%

11
Location North Sea, Germany
Capacity 252 MW1
Capital Cost €1.3 billion1
Northland Interest 100% (252 MW)
Power Contract 13y FIT subsidy under German REA
Ops & Maintenance MHI Vestas (~13y) – guarantees high op. availability
Commercial Ops Date End of 2019
Deutsche Bucht (DeBu) – Construction Update
Deutsche Bucht Construction Timeline
DeBu Offshore Wind Project
Aug 17 Jan 18 Jan 19 Dec 1920192018
TodayFin Close
Manufacturing
Foundations Installation
Cable Installation
Turbine Installation
Commercial Ops Date
• Monopile = 25%
• T. Pieces = 25%
• Cable = 5%
• Structural Design= 100%
• Electrical Design = 100%
• Offshore Substation = 33%
% Completion2
On-Time, On-Budget
Finish
1. Excludes the 17MW opportunity for two additional demonstration turbines utilizing suction bucket foundations. Final Investment Decision is subject to achieving certain development milestones
2. % completion with respect to manufacturing, transport and installation

12
Deutsche Bucht (DeBu) – Additional Facts
Grid Connection Borwin beta (AC/DC) Existing(TenneT (Utility)- Not Project’s Responsibility to Construct)
2) Van Oord EPCICable Supply & Install
Foundation Supply & Install
OSS Supply & Install
1) MHI Vestas33 Wind TurbinesSupply & Install
Deutsche Bucht Construction Structure (Two Contracts)
Northland continues to expand its leading European offshore wind platform
Capital deployment and returns consistent with Northland’s investment criteria
Opportunity to take advantage of lessons learnt from Gemini and Nordsee One while leveraging common infrastructure to generate operating synergies
Opportunity for two additional demonstration turbines utilizing suction bucket foundations
If built, additional yield of 17MW capacity, resulting in total project cost of €1.4 billion
Highlights
13
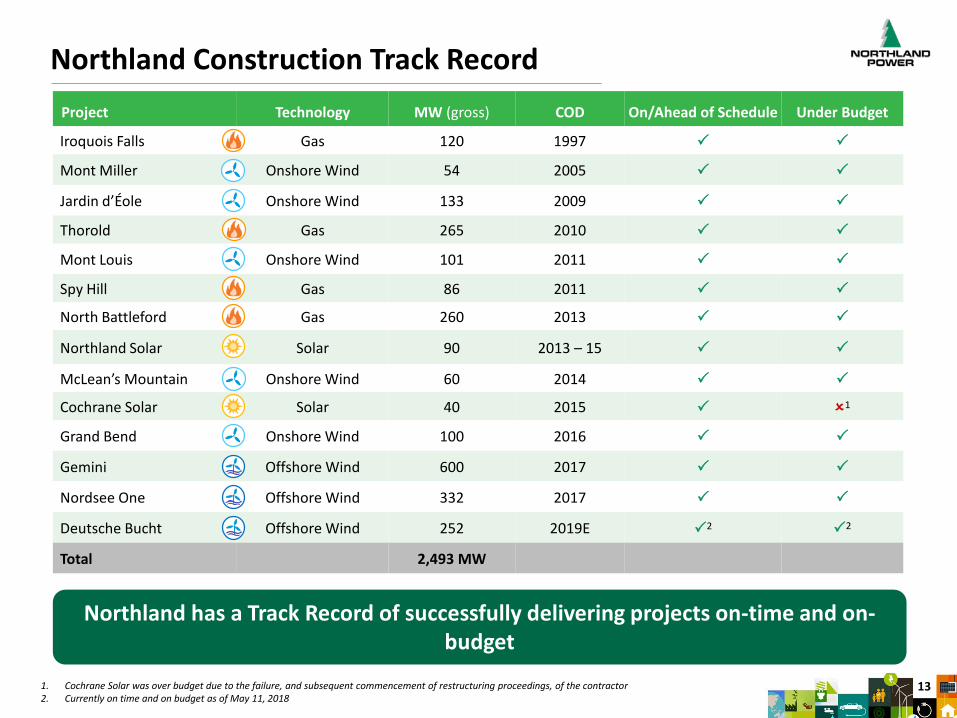
Northland Construction Track RecordProject Technology MW (gross) COD On/Ahead of Schedule Under Budget
Iroquois Falls Gas 120 1997
Mont Miller Onshore Wind 54 2005
Jardin d’Éole Onshore Wind 133 2009
Thorold Gas 265 2010
Mont Louis Onshore Wind 101 2011
Spy Hill Gas 86 2011
North Battleford Gas 260 2013
Northland Solar Solar 90 2013 – 15
McLean’s Mountain Onshore Wind 60 2014
Cochrane Solar Solar 40 2015 1
Grand Bend Onshore Wind 100 2016
Gemini Offshore Wind 600 2017
Nordsee One Offshore Wind 332 2017
Deutsche Bucht Offshore Wind 252 2019E 2 2
Total 2,493 MW
1. Cochrane Solar was over budget due to the failure, and subsequent commencement of restructuring proceedings, of the contractor2. Currently on time and on budget as of May 11, 2018
Northland has a Track Record of successfully delivering projects on-time and on-budget
14
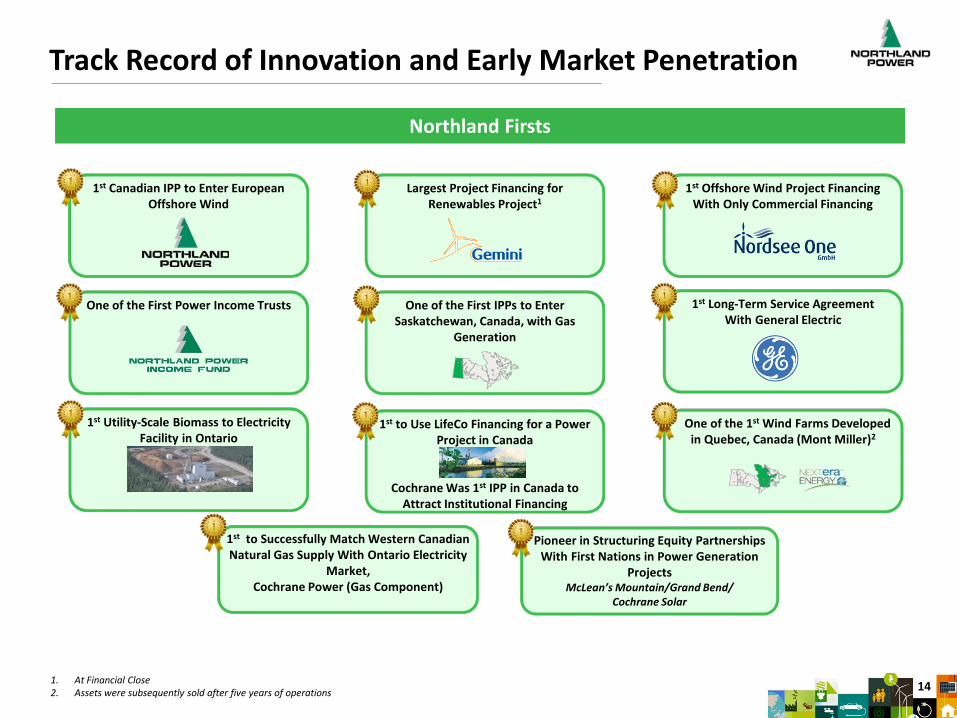
Track Record of Innovation and Early Market Penetration
One of the First IPPs to Enter Saskatchewan, Canada, with Gas
Generation
One of the 1st Wind Farms Developed in Quebec, Canada (Mont Miller)2
One of the First Power Income Trusts
1st to Use LifeCo Financing for a Power Project in Canada
Cochrane Was 1st IPP in Canada to Attract Institutional Financing
1st Utility-Scale Biomass to Electricity Facility in Ontario
Cochrane Power
1st Long-Term Service Agreement With General Electric
1st to Successfully Match Western Canadian Natural Gas Supply With Ontario Electricity
Market,Cochrane Power (Gas Component)
Pioneer in Structuring Equity Partnerships With First Nations in Power Generation
ProjectsMcLean’s Mountain/Grand Bend/
Cochrane Solar
1. At Financial Close 2. Assets were subsequently sold after five years of operations
Largest Project Financing for Renewables Project1
1st Offshore Wind Project Financing With Only Commercial Financing
1st Canadian IPP to Enter European Offshore Wind
Northland Firsts

15
Multiple Development Markets & Technologies
Conducive to Project Finance
Execution
Credit Worthy Off-Takers
Stable Economic and Political Jurisdictions
Long Term Revenue Stability
Attractive Project Returns
Market and Technology Assessment Criteria
Northland Office (Toronto, Mexico City, London, Amsterdam, Hamburg, Taipei)
Potential Markets
JapanSouth Korea
Taiwan
Canada & United States
Asia
Europe
Mexico & Latin America
16
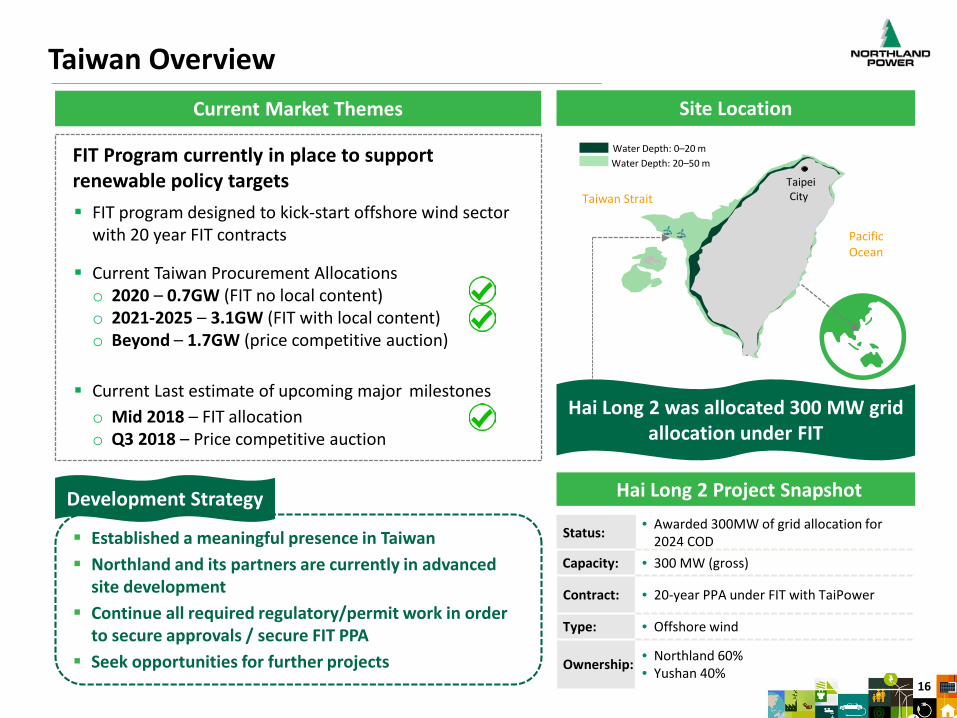
Taiwan Overview
FIT Program currently in place to support renewable policy targets FIT program designed to kick-start offshore wind sector
with 20 year FIT contracts
Current Taiwan Procurement Allocationso 2020 – 0.7GW (FIT no local content)o 2021-2025 – 3.1GW (FIT with local content)o Beyond – 1.7GW (price competitive auction)
Current Last estimate of upcoming major milestoneso Mid 2018 – FIT allocationo Q3 2018 – Price competitive auction
Water Depth: 0–20 mWater Depth: 20–50 m
Pacific Ocean
Taiwan StraitTaipeiCity
Established a meaningful presence in Taiwan Northland and its partners are currently in advanced
site development Continue all required regulatory/permit work in order
to secure approvals / secure FIT PPA Seek opportunities for further projects
Current Market Themes Site Location
Hai Long 2 was allocated 300 MW grid allocation under FIT
Development Strategy Hai Long 2 Project Snapshot
Status: • Awarded 300MW of grid allocation for 2024 COD
Capacity: • 300 MW (gross)
Contract: • 20-year PPA under FIT with TaiPower
Type: • Offshore wind
Ownership: • Northland 60%• Yushan 40%

17
>150 GW
Total Opportunity in Target Markets
Development Pipeline
Construction & Advanced Development
Identify and qualify potential markets with attractive fundamentals
Source and evaluate opportunities that meet our investment criteria
Includes achievement of major milestones / power contracts, supply agreements
finalized and/or project financing secured
>DeBu – 269 MW >Taiwan – 300 MW
Significant Development Opportunities
~6,000 MW
1. Includes the 17MW opportunity for two additional demonstration turbines utilizing suction bucket foundations. Final Investment Decision is subject to achieving certain development milestones
300 MW
269 MW1

18
Power Markets are ChangingOur industry has changed immensely over the past 10 years Supportive Government Policies – Governments have taken real action to reduce carbon Industry Evolution & Technological Advancement – Renewables are now a cost-effective
and feasible alternative to add new power Market Liberalization and Competition – Increased demand has attracted new players
ready to deploy capital in competition with traditional IPPs
The global investment opportunity set for Northland, driven by economic growth and decarbonization, has never been greater

19
Global Movement Towards Sustainability
Source: United Nations Department of Economic and Social Affairs

20
Focusing on clean and green technologies
Delivering strong and sustainable financial results
Generating and distributing economic value
Capitalizing on revenue generating opportunities through the transition to a low-carbon future
Supporting sustainable economies through clean energy and responsible business practices
Investing in our communities
Partnering with First Nations
Preserving the natural environment
Our Sustainability Pillars Northland’s vision is to be a top clean and green power producer, inspiring our people
to achieve a sustainable and prosperous future for all stakeholders
We will achieve this through our three strategic pillars:
Inspired Workforce
Top Clean & Green Power Producer
Prosperity for Stakeholders
Prioritizing health and safety
Fostering our values and culture
Providing meaningful career development opportunities
Hiring locally and providing international opportunities
21
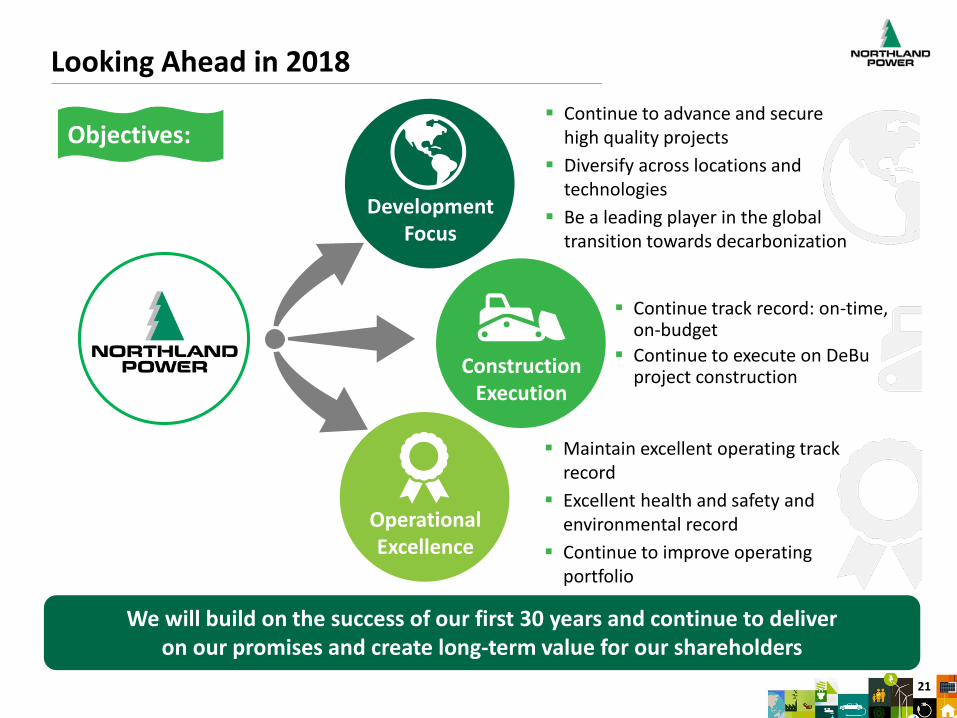
Looking Ahead in 2018
Objectives:
We will build on the success of our first 30 years and continue to deliver on our promises and create long-term value for our shareholders
Continue to advance and secure high quality projects
Diversify across locations and technologies
Be a leading player in the global transition towards decarbonization
Continue track record: on-time, on-budget
Continue to execute on DeBu project constructionConstruction
Execution
Maintain excellent operating track record
Excellent health and safety and environmental record
Continue to improve operating portfolio
Operational Excellence
Development Focus

22
Investor Relations Contacts
Appendix
23
Reporting of Non-IFRS Financial Measures
This investor presentation includes references to Northland’s adjusted EBITDA and free cash flow, measures not prescribed by InternationalFinancial Reporting Standards (IFRS). Adjusted EBITDA and free cash flow, as presented, may not be comparable to other similarly-titledmeasures presented by other publicly-traded companies, as these measures do not have a standardized meaning under IFRS. These measuresshould not be considered in isolation or as alternatives to net income, cash flow from operating activities or other measures of financialperformance calculated in accordance with IFRS. These measures are also not necessarily indicative of operating income or cash flows fromoperating activities as determined under IFRS. Rather, these measures are provided to complement IFRS measures in the analysis ofNorthland’s results of operations, and are used by management to evaluate the performance of the company for internal assessmentpurposes. Management believes that adjusted EBITDA and free cash flow are widely-accepted financial indicators used by investors to assessthe performance of a company. These measures provide investors with additional information to assist them in understanding these criticalcomponents of the company’s financial performance, including its ability to generate cash through its current operations. These measures havebeen applied consistently for all periods presented in this document.
Adjusted EBITDAAdjusted EBITDA provides investors with an indication of Northland’s capacity to generate income from operations and investments beforetaking into account management’s financing decisions and the costs of consuming tangible and intangible capital assets, which vary accordingto asset type and management’s estimate of their useful lives.Adjusted EBITDA is calculated as income (loss) before income taxes adjusted for depreciation of property, plant and equipment, amortization ofcontracts and other intangible assets, net finance costs, Gemini subordinated debt earned by Northland, fair value losses (gains) on derivativecontracts, unrealized foreign exchange losses (gains), elimination of non-controlling interests and finance lease and equity accounting.
Free cash flowFree cash flow is calculated as cash flow provided by operating activities adjusted for net change in non-cash working capital balances, capitalexpenditures, interest paid, scheduled principal repayments on term loans, funds set aside for scheduled principal repayments and for assetpurchases, restricted cash (funding) for major maintenance, write-off of deferred development costs, consolidation of managed facilities,income from equity accounted investments, proceeds from sale of assets, and preferred share dividends. This measure, along with cash flowprovided by operating activities, is considered to be a key indicator for investors to understand Northland’s ability to generate cash flow fromits current operations.
Readers should refer to our MD&As accompanying our financial statements for an explanation of adjusted EBITDA and free cash flow, and for areconciliation of Northland’s reported adjusted EBITDA to its consolidated income (loss) before taxes and a reconciliation of Northland’s freecash flow to its cash provided by operating activities. These are filed from time to time on our company’s website www.northlandpower.ca.

24* Hub height measure from the sea level
Past and Present Wind Turbines
2009 2016 2017 2017 2019E 2022E
Grand BendManufacture: SiemensRated Power: 3.0 MW
Blade Length: 55 mRotor Diameter: 113 m
Hub Height: 115 m
Jardin d’ÉoleManufacture: GE Energy
Rated Power: 1.5 MWBlade Length: 31-37 mRotor Diameter: 77 m
Hub Height: 61 to 85 m
GeminiManufacture: SiemensRated Power: 4.0 MW
Blade Length: 63 mRotor Diameter: 130 m
Hub Height: 90 m *
Nordsee OneManufacture: SenvionRated Power: 6.15 MW
Blade Length: 62 mRotor Diameter: 126 m
Hub Height: 90 m *
Deutsche BuchtManufacture: MHI Vestas
Rated Power: 8.4 MWBlade Length: 80 m
Rotor Diameter: 164 mHub Height: 108 m *
12MW TurbineExpected to
Debut in ~2022
0
100
200
300
Hub
Heig
ht (m
)
The Statueof LibertyHeight: 93 m
Wind Turbine Evolution

25
0 5 10 15 20 25
North Battleford**
Ground Mounted Solar**
Jardin
Germany
Mt Louis
Kirkland*
Cochrane*
Spy Hill
Thorold
Kingston
Iroquois Falls
Producing and Maintaining Stable Cash FlowsRemaining PPA Term for Each Operating Facility
1. Represents Northland’s economic interest in the facility2. The weighted average PPA life is weighted by respective MW capacity. The thickness of each bar represents each facilities respective overall contribution to
2018 forecasted Adjusted EBITDA
Weighted Average Life of
12.6 years2
DeBu
Iroquois Falls
Thorold
Spy Hill
Kirkland Lake1
Jardin
North Battleford
McLean’s Mtn
Grand Bend
Gemini
NordseeOne
Ground-Mount Solar
Mont Louis

26
Operating Facilities
Project LocationGross
CapacityNorthland Ownership Technology PPA Term
Thorold ON, CA 265 MW 100% Natural gas cogeneration 2030
Iroquois Falls ON, CA 120 MW 100% Natural gas cogeneration 2021
Spy Hill SK, CA 86 MW 100% Natural gas peaking plant 2036
Kirkland Lake ON, CA 132 MW 68%¹ Biomass and natural gas combined cycle and peaking 2030
Mont Louis QC, CA 100 MW 100% Onshore Wind 2031
Jardin d’Éole QC, CA 134 MW 100% Onshore Wind 2029
Other Various 24 MW 100% Onshore Wind/Roof-top Solar Various
North Battleford SK, CA 260 MW 100% Natural gas combined cycle 2033
Ground-Mount Solar ON, CA 130 MW 100% (90 MW)62.5% (40 MW) Solar 2033-2035
McLean’s Mountain ON, CA 60 MW 50% Onshore Wind 2034
Grand Bend ON, CA 100 MW 50% Onshore Wind 2036
Gemini Netherlands 600 MW 60% Offshore Wind 2032
Nordsee One Germany 332 MW 85% Offshore Wind 2027
1. Northland has an effective 77% residual economic interest
27
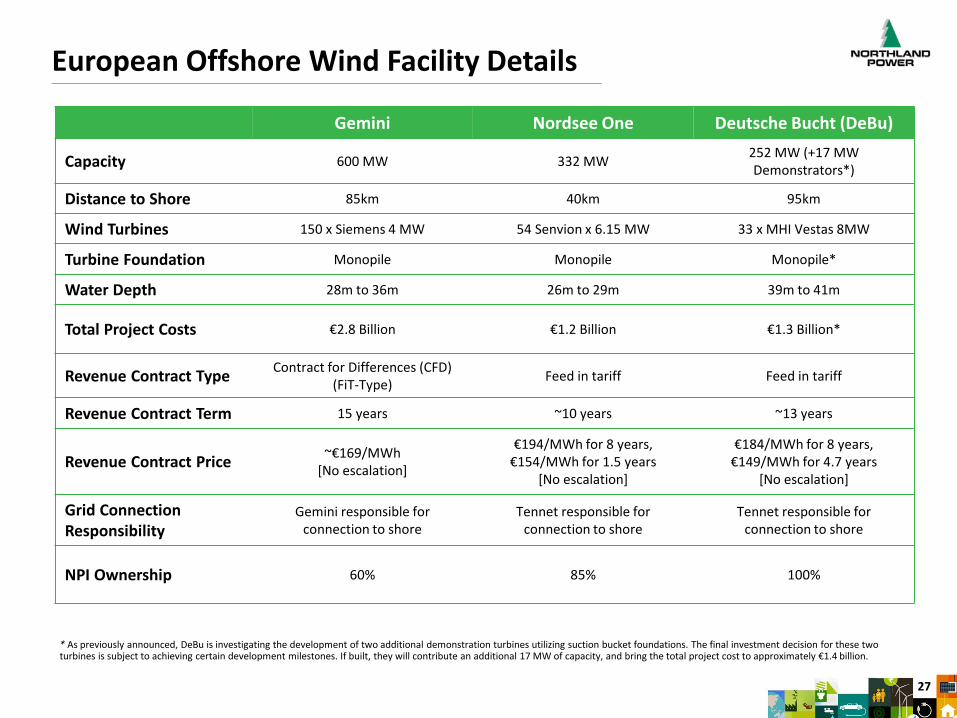
European Offshore Wind Facility Details
Gemini Nordsee One Deutsche Bucht (DeBu)
Capacity 600 MW 332 MW 252 MW (+17 MW Demonstrators*)
Distance to Shore 85km 40km 95km
Wind Turbines 150 x Siemens 4 MW 54 Senvion x 6.15 MW 33 x MHI Vestas 8MW
Turbine Foundation Monopile Monopile Monopile*
Water Depth 28m to 36m 26m to 29m 39m to 41m
Total Project Costs €2.8 Billion €1.2 Billion €1.3 Billion*
Revenue Contract Type Contract for Differences (CFD)(FiT-Type) Feed in tariff Feed in tariff
Revenue Contract Term 15 years ~10 years ~13 years
Revenue Contract Price ~€169/MWh[No escalation]
€194/MWh for 8 years,€154/MWh for 1.5 years
[No escalation]
€184/MWh for 8 years,€149/MWh for 4.7 years
[No escalation]
Grid Connection Responsibility
Gemini responsible forconnection to shore
Tennet responsible forconnection to shore
Tennet responsible forconnection to shore
NPI Ownership 60% 85% 100%
* As previously announced, DeBu is investigating the development of two additional demonstration turbines utilizing suction bucket foundations. The final investment decision for these two turbines is subject to achieving certain development milestones. If built, they will contribute an additional 17 MW of capacity, and bring the total project cost to approximately €1.4 billion.

28
Financial Summary
Key Metrics
Recent¹ Share Price (TSX: NPI) $24.27
Shares (Common + Class A) 176 million
Institutional Ownership ~38%
Management Ownership ~34%
Annual Dividend $1.20
Annual Dividend Yield 4.9%
Total Debt, Net of Cash $6.5 billion
Convertible Debentures (NPI.DB.B, NPI.DB.C) $229 million
Preferred Shares (NPI.PR.A, NPI.PR.B, NPI.PR.C) $261 million
Market Capitalization (Common + Class A) $4.3 billion
Enterprise Value $12.3 billion
Credit Rating (S&P) BBB Stable
1. As of May 11, 2018

29
Investor Relations Contacts
Dhiraj ShangariManager, Corporate Finance647.288.5566
Barb BoklaManager, Investor Relations 647.288.1438


