53
Northwest Interagency Coordination Center Portland, OR Northwest Annual Fire Report 2020

Northwest Interagency
Coordination Center Portland, OR
Northwest Annual Fire Report 2020

Page intentionally left blank

TABLE of CONTENTS | NWCC Mission
-1-
TABLE of CONTENTS
TABLE of CONTENTS............................................................................................................... 1
SUMMARY INFORMATION ..................................................................................................... 3
NWCC Mission................................................................................................................................3
NWCC Annual Fire Report General Information ...............................................................................3
NWCC ACCOMPLISHMENTS ................................................................................................... 4
A Review of 2020 ...........................................................................................................................4
Overview ............................................................................................................................................................... 4
NWCC Staff & Organization .................................................................................................................................. 5
Organization: Administration ................................................................................................................................ 5
FIRE SEASON OVERVIEW ...................................................................................................... 13
Fire Season Climate Summary ....................................................................................................... 13
Seasonal Fire Danger Summary ..................................................................................................... 13
Fire Season Monthly Review ......................................................................................................... 14
March .................................................................................................................................................................. 14
April ..................................................................................................................................................................... 14
May ..................................................................................................................................................................... 15
June ..................................................................................................................................................................... 16
July ...................................................................................................................................................................... 17
August ................................................................................................................................................................. 18
September .......................................................................................................................................................... 19
NW Lightning Summary ...................................................................................................................................... 22
NW Preparedness Review ............................................................................................................. 23
FIRE STATISTICS & MAPS ...................................................................................................... 24
2020 NW Fires & Acres ................................................................................................................. 24
Current & Historical Fires & Acres (Oregon & Washington) ............................................................................... 25
Fires & Acres by Cause ........................................................................................................................................ 27
NW 2020 Incident Summary ......................................................................................................... 29
NW 2020 Large Incident Summary ................................................................................................ 31
NW 2020 Incident Location Maps ................................................................................................. 33
RESOURCE INFORMATION & STATISTICS .............................................................................. 35
NW Incident Management Teams Assignment History .................................................................. 35
All IMTs Total Days Assigned (NIMO, AC, Type 1 & Type 2)................................................................................ 35
Portland NIMO .................................................................................................................................................... 35

TABLE of CONTENTS | NWCC Mission
-2-
Area Command ................................................................................................................................................... 35
Northwest Type 1 ............................................................................................................................................... 35
ODF Type 1 .......................................................................................................................................................... 36
Northwest Type 2 ............................................................................................................................................... 36
Resource Order Summary ............................................................................................................. 37
NW Interagency Hotshot Crews .................................................................................................... 38
NW Smokejumpers....................................................................................................................... 39
North Cascades Smokejumpers .......................................................................................................................... 39
Redmond Smokejumpers .................................................................................................................................... 39
NW Rappel Aircraft ...................................................................................................................... 40
Redmond Air Tanker Base ............................................................................................................ 41
2020 Year End Totals .......................................................................................................................................... 41
APPENDIX............................................................................................................................ 42
Northwest Energy Release Component by PSA .............................................................................. 42
NW Situation Report .................................................................................................................... 44
NW Dispatch Centers .................................................................................................................... 49
NW Federal & State Agency Identifiers ......................................................................................... 50
NW Local Unit Identifiers .............................................................................................................. 50

SUMMARY INFORMATION | NWCC Mission
-3-
SUMMARY INFORMATION
NWCC Mission
The Northwest Interagency Coordination Center (NWCC) is the Geographic Area Coordination Center
(GACC) for the Northwest Region which includes the states of Oregon and Washington. NWCC serves as
the focal point for interagency resource coordination, logistics support, aviation support and predictive
services for all state and federal agencies involved in wildland fire management and suppression in the
geographic area.
NWCC Annual Fire Report General Information
The Northwest Interagency Coordination Center (NWCC) is responsible for compiling fire reports for all
large wildland fires in Oregon and Washington on lands administered by the following five federal
agencies; BLM, BIA, USFS, FWS, NPS, and two state agencies; ODF and DNR (for acronyms, see Appendix,
NW Federal & State Agency Identifiers). A large fire is defined as greater than 100 acres in forest fuel
types, and greater than 300 acres in shrub and grass fuel types. Annual figures of total fire starts,
regardless of size, and acres burned for individual units are also included.
Statistics used in this report were gathered from the Fire and Aviation Management Web Applications
(FAMWEB) system (which includes the Situation Report and Incident
Status Summary (ICS-209) programs) and from the Interagency Resource
Ordering Capability (IROC). The statistics presented here are intended to
provide a geographic area perspective of annual fire activity and may not
reflect official figures for a specific agency.
This document is available electronically at the NWCC web page:
gacc.nifc.gov/nwcc/ under the Intelligence link. Previous year annual
reports can be found under the NWCC Publications link.
Disclaimer: The figures in this report provide general reporting information and overall accuracy cannot
be guaranteed. Any determinations, policy, or subsequent reports using this information should be done
under consultation with appropriate experts. For agency-specific details or official agency figures,
contact the respective agency.
Compiled by:
Northwest Interagency Coordination Center Portland, OR Predictive Services Unit Intelligence Section
Available electronically at gacc.nifc.gov/nwcc/ Publication date: April 9, 2021 Revised date: May 5, 2021
Photos: BLM Public Domain, Inciweb and by permission

NWCC ACCOMPLISHMENTS | A Review of 2020
-4-
NWCC ACCOMPLISHMENTS
A Review of 2020
Overview
he Northwest 2020 Fire Year was like no other in recent history. Fires in Australia over the New
Year’s holiday and into February drew on NW teams and overhead, opening the fire season
considerably earlier than normal. About the time the Australian fire situation began to calm,
the spread of a novel coronavirus (COVID-19) into a pandemic early in the year forced the wildland
community to re-examine incident management business practices, nationally, geographically, and
locally. Uncertainties related to the COVID-19 pandemic pushed the geographic area to Preparedness
Level 2, where we remained until mid-August when wide-spread lightning ignited significant fires along
the Cascades, in Eastern Oregon, and in Washington. Just as the NW began to turn the corner on these
fires, a historic wind event struck just after Labor Day, causing disastrous fire-spread on new and existing
incidents. Millions of acres were affected by fire, impacting many communities, and forcing tens of
thousands of people from their homes.
In the end, though the 3,853 incidents experienced in the NW is relatively normal, over 1.98 million
acres were affected by fire—223% of the ten-year average. Worse, simultaneous active fire seasons
occurred in Rocky Mountain, Southwest, Great Basin, Northern Rockies and both California Geographic
Areas, heavily impacting resource capability.
In all, NW Incident Management Teams (IMTs) mobilized 56 times in the NW and nationally,
accumulating 885 duty days on incidents. This included:
• Ten Type 1 IMT mobilizations;
• Twenty-six Type 2 IMT mobilizations;
• Eleven ODF IMT mobilizations; and
• Nine OSFM IMT mobilizations, for an additional 132 duty days.
Out-of-Area IMTs mobilized to the NW eight times for a total of 117 duty days.
Finally, Area Command Team 1, IC Stutler, mobilized three times for a total of 101 duty days.
If there is a silver lining to 2020, precautionary measures developed for managing COVID-19 on incidents
were highly successful. Working in cooperation, ODF and OSFM established “COVID-19 Modules”
designed to manage COVID-19 issues on incidents in Oregon so that IMTs could focus on managing the
incident. Similarly, WA DNR worked in cooperation with the WA Fire Service to provide individual Health
Liaisons and COVID-19 Responders for NW IMTs working inside and outside of the NW. Dean Vendrasco
and Ed Lewis, assigned as NW COVID-19 Coordinators, worked tirelessly through the late spring and
summer months coordinating COVID-19 Responders in support of NW IMTs and Out-of-Area IMTs
working NW incidents. Because of these efforts, and despite the fact that over 30,000 wildland
firefighters passed through the NW, only 7 positive COVID-19 cases were recorded on NW incidents.
T

NWCC ACCOMPLISHMENTS | A Review of 2020
-5-
Heightened vigilance due to COVID-19 also significantly reduced the spread of colds and flu among
incident personnel and improving firefighter health in general.
NWCC Staff & Organization
Change continues at NWCC:
• Matt Morales, assistant center manager at Puget Sound Communication Center, accepted the
NWCC Forest Service Operations Coordinator position.
• Brandon Poe, assistant center manager at Columbia Cascades Communication Center, accepted
the NWCC BLM Operations Coordinator position.
• Desraye Assali, Forest Service GIS Specialist, fulfilled a 120-Day+ detail serving as the NWCC GIS
Specialist.
• Finally, Dan O’Brien, NWCC Center Manager since 2010, retired at the end of the year.
Organization: Administration
NWCC Center Manager
Throughout 2020, the NWCC Center Manager continued to engage at a number of levels:
Administration
• Completed the 2020 NWCC Operating Plan with operating budget.
• Drafted NWCC COOP for transferring geographic area coordination operations to Central
Oregon Interagency Dispatch Center in the event of a catastrophic disabling event.
• Drafted the NWCC COVID-19 COOP and Operating Plan for safe in-person operations.
• Implemented telework operations for NWCC through the winter/spring months and again in the
fall to minimize potential COVID-19 transmission.
• Supported PNWCG and PNWCG facilitator in meeting scheduling and management.
• Coordinated CY20 to CY23 Interagency Agreement funding the NWCC Public Affairs Specialist
position.
• Coordinated selections panels for Deputy Geographic Area Center Manager vacancies at
Northern California and Southern California Coordination Centers.
Operations
• Provided oversight and guidance for all operations at NWCC.
• Updated the 2020 NW MAC Operations Handbook
o Reorganized NW MAC daily schedule to include TEAMs technology in place of face-to-
face meetings and phone calls.
o Reconfigured the 1600 briefing to improve coordination among the NWCC sections as
well as provide consistent delivery in MS TEAMs.
o Developed COVID-19 assessments for use in incident prioritization.
• Organized and facilitated NW Incident Commander Advisory Council conference calls, providing
a forum for discussing team preparation for operations in the COVID-19 pandemic environment.
• Organized and hosted MAC Support orientation in preparation for the 2020 Fire Season, with
emphasis on greater utilization of virtual technologies.

NWCC ACCOMPLISHMENTS | A Review of 2020
-6-
• Implemented the MAC Daily Schedule during an active fire season:
o Hosted daily conference calls, TEAMs meetings and formal briefings.
o Drafted memos and other correspondence in support of NW MAC administration.
o Hosted and facilitated PNWCG Executive Calls.
• Provided oversight and guidance for the NW MAC Support Staff, including the virtual MAC
Safety Specialist.
• Provided oversight and guidance for the (virtual) PNWCG COVID-19 Coordinators, including
developing mobilization and tracking processes for IMT Health Liaisons and Responders.
• Coordinated mission planning and utilization of the Distributed Real Time Infrared (DRTI) aircraft
in support of incident operations and geographic area ignition detection.
• Planned and facilitated congressional briefing for OR Senators Merkley and Wyden.
National Coordination
• Chair of the National Coordination Center Managers (NCCM) group.
o Coordinated the agenda for the National Coordinators Meeting in conjunction with NICC
and SOPS.
o Represented NCCM at the Coordinating Group Advisory Council (CGAC) meetings and
drafted the NCCM charter which was approved and signed by CGAC and NMAC.
o Coordinated monthly meeting/call agendas and distributed notes.
• Alternate PNWCG representative for CGAC at monthly calls and meetings.
• Member of the Incident Workforce Development Group (IWDG) responsible for developing
future management structure and guidance for incident management teams.
o Hosted the IWDG Workshop in coordination with CGAC and the National Incident
Commander Advisory Council (ICAC).
o Drafted and presented multiple briefing papers providing purpose, scope and detailed
actions for future IMT management for IC’s, coordinating groups and agency
administrators at the 2020 National ICAC meeting in Boise, ID.
o Collected IMT membership data from the different geographic areas.
o Drafting briefing paper on data requirements for a developing incident command
application process (ICAP).
• Chair of the Predictive Services Oversight Group
o Provided direction and guidance for the National Predictive Services Oversight Group
(PSOG), organizing and providing guidance for a multi-agency membership representing
a variety of stakeholder groups.
o Developed monthly meeting/call agendas, staff calls, and reviewed distribute notes.
o Drafted and distributed PSOG memos and directives.
o Drafted and assigned specific PSOG Tasks designed to address Predictive Services
programs and activities.
o Coordinated with NWS, WFIT and other entities in achieving program objectives.
o Coordinated with the Fire Management Board (FMB) liaison to maintain program focus and purpose under the oversight of FMB.

NWCC ACCOMPLISHMENTS | A Review of 2020
-7-
Public Information and Communication
A total of 498 media requests, including 27 virtual media interviews and over 225 public information
calls, were completed through the 2020 fire season by the NWCC Public Information Desk. These were
responding to local, regional, national, and international media-related requests, as well as calls from
private citizens concerned about fire activity, evacuations, smoke, resource availability, hunters,
campers, fire camps, contractors and other general questions.
• The NWCC Fire Blog continued to be the centerpiece of our social media strategy. There were
over 400,000 page views recorded in a 3-month period which is the most views since the
creation of the NWCC Blog. Blog information was also posted on the NWCC Twitter and
Facebook pages.
• The NWCC Twitter account, which complemented the NWCC Facebook webpage and Blog, saw
an increase of over 1,000 new followers.
• Analysis shows use of the main NWCC website had over 6.2 million page views which includes
nearly 2 million first time visitors.
Chart 1: NWCC Web Total Page Views (Jun – Sep)
Chart 2: NWCC Web Number of Visitors (Jun - Sep)
Geographic Information Systems (GIS)
The GIS section provided data management, printed and electronic map products, current situation
analysis, ArcGIS Online mapping applications and feature services and general support across all federal
and state agencies in the Northwest and well as Coordinating Groups, Local Units, Incident Management
Teams and stakeholders. Year-round critical mapping, data analysis, as well as subject matter expertise
and guidance on standards and evolving GIS governance and practice were also provided. Specific 2020
accomplishments include:
• Desraye Assali served in a virtual capacity as the detailed GIS Coordinator through the summer
to provide daily oversight of GIS operations.
• Bryant Mecklem served multiple assignments for onsite GIS support for all NWCC and MAC
operations.
• In coordination with the Intel section, developed the NWCC Situation Page.
• Responded to critical data, analysis requests, and mapping requests across all agencies, regional
fire leadership, IMTs, researchers and the public.
2015 2016 2017 2018 2019 2020
Page Views 6,711, 1,477, 3,622, 2,400, 1,372, 6,238,
01,000,0002,000,0003,000,0004,000,0005,000,0006,000,0007,000,0008,000,000
0
500,000
1,000,000
1,500,000
2,000,000
2,500,000
3,000,000
2015 2016 2017 2018 2019 2020
TotalReturningVisitors
Total FirstTimeVisitors

NWCC ACCOMPLISHMENTS | A Review of 2020
-8-
• Migrated all map documents from ArcGIS to ArcGIS Pro, including many processing tools.
• Created a NWCC GIS Administrator NIFC ArcGIS Online Organization (AGOL) Account.
• Migrated and updated all existing NWCC AGOL Content into the NIFC AGOL.
• Created or migrated two AGOL Groups under the ownership of the NWCC GIS NIFC AGOL
Administrator Account.
o NWCC-Northwest which contains all mapping applications and feature services
maintained by NWCC.
o NWCC 2020 Fire Data Disk Map Service Links which contains base data and maps for the
region.
• Created or updated all NWCC AGOL Applications.
o Northwest Large Fire Interactive Web Map, https://arcg.is/10CWy0, viewed 7,738,602
times between July 10 and Oct 9, 2020.
o NW Current Situation, https://arcg.is/1njzjb, viewed 41,268 times between July 10 and
Oct 9, 2020.
o Current Situation Maps, https://arcg.is/15nXjW, viewed 36,299 between July 10 and Oct
9, 2020.
o Fuels/Fire Danger Applications and maps, two applications and one embedded web map.
Viewed 20,026 times, combined, between July 10 and Oct 9, 2020.
o NWCC Aerial Resource Dashboard-Public, https://arcg.is/1euKfn.
o Structures, https://arcg.is/1OSvL0, dashboard showing graphs for Structures Threatened
or Structures Destroyed per a fire’s previous day 209 fire report.
o NWCC Resources, https://arcg.is/1HyiiP, dashboard of all crews and Type 1 and 2
helicopter status and location.
o NWCC Aerial Resources, two dashboards for internal use for tracking and briefing
presentation of aviation resources. ArcGIS Survey 123 Form for entering new resources.
Editing Application for editing existing features.
• Supported Northwest Geographic Area incident personnel with uploading large fire polygons
into the National Incident Feature Service (NIFS) and troubleshooting technical issues.
• NIFC AGOL technical support and guidance including password resets, group and content
management.
• Provided guidance and training to incident GISS and READ personnel in the uses of NIFC AGOL,
NIFS and Collector.
• Granted NIFC FTP access for the Northwest Geographic Area.
• Granted Avenza Pro access and guidance for USFS employees and partners.
• Continued update and improvement of the NWCC COP (Common Operating Picture) for Google
Earth.
• Compiled and maintained daily operational features including fire locations and perimeters for
approximately 105 individual fires and 3 complexes totaling more than 1.8 million acres burned
across the Northwest Geographic Area.

NWCC ACCOMPLISHMENTS | A Review of 2020
-9-
Organization: Predictive Services
Through a year dominated by COVID-19 impacts and mitigation, Predictive Services continued to provide
decision support services to fire leadership. Predictive Services served as a focal point for intelligence
and situation reporting producing regional fire potential outlooks, compiling and reporting fire
occurrence and resource status information and providing implications of fire analysis to fire leadership
and the field.
The NWCC Predictive Services Unit was engaged with large incident management teams in Washington
and Oregon. Services were provided to a variety of partners, customers and stakeholders during a
season that began with average trends but that had a historically unique and high impact finale,
including:
• Provided daily fire situation and fire potential briefings, analysis and reports. In adapting to a
virtual environment, we utilized new tools to continue our coordination briefings and leveraged
available technology to enhance both content and flow.
• Integrated meteorological services to provide additional insights to aviation managers for
location and distribution of aviation assets during heavy smoke impact events from local and
national wildfire events. Smoke queries were fielded and supported for operational and public
safety outlooks.
• Integrated with NW MAC Support to assist with incident prioritization, developing strategic
intent and transferring intelligence. The full range of decisions and briefings were adapted to
minimize health risks during an active fire season.
• Continued discussion with NW MAC leadership and staff, Predictive Services staff, incident
IMETs and FBANs to understand future meteorological and fire behavior implications.
• Migrated the NWCC Situation Page from Google to the Microsoft environment, maintaining
access to decision support products, key briefings and situational awareness for internal
managers and coordinating groups.
Fire Analysis
• Hosted 6 detailers to assist with Fire Analyst duties from June through October. COVID-19
concerns prompted cancellations of two detailers.
• Conducted fuels status conference calls to provide regional and local perspectives on fuel
conditions in the geographic area.
• Continued to serve as the Northwest Geographic Area Lead for the National Fuel Moisture
Database.
• Served as lead coordinator for the new NFDRS 2016 rollout at the Regional level.
• Continued serving the geographic area as a RAWS coordinator to support field units with
compliance and maintenance. Focused on keeping key RAWS utilized by Predictive Services
online and promptly repaired. Contacted multiple agencies and units to repair stations
transmitting faulty data throughout the year.
• Monitored fuels and fire occurrence levels and implications to provide support to BLM
leadership for long term severity requests.
• Validated status of fuels and needs for fuels and fire behavior advisories in the geographic area.
NWCC ACCOMPLISHMENTS | A Review of 2020
-10-
• Interfaced with FBANs on wildfires and analysts working on decision support at regional centers
to coordinate information.
• Provided IMT analysts contact list information to ensure adjacent IMT fire behavior and
meteorological staff were coordinating. Along with this effort, fuels and updated indices were
provided to incoming IMTs.
• Coordinated with meteorologists to evaluate rare events with potential for prescribed fire
escapes or wind events likely to cause large fire problems.
• Prepared to instruct and support S-491 Intermediate Fire Danger. The course was canceled due
to COVID-19 health guidelines.
• Mobilized to support fire incidents in Australia in January.
Intelligence
• Hosted 5 detailers in the Intelligence Section.
o 2 were new to the Intel support role.
o 3 filled multiple assignments throughout the summer.
o 1 worked through the end of the year to cover the Intelligence section while the Intel
Coordinator was on a detail.
• In coordination with GIS staff:
o Incorporated Firenet365 into the daily workflows at NWCC. Including rebuilding of the
NWCC Situation Page.
o Developed Dashboards to portray resource allocations, structure assessments and
current fire activity.
• Continued to refine and adapt the Intelligence section products in conjunction with the
continued advancements in Intel technologies and the introduction of IROC.
• Provided guidance, support and troubleshooting to Dispatch Centers and IMTs for Famweb ICS-
209 reporting and Situation Reporting.
• Provided data analytical support to Coordinating Groups, Agency Administrators, fire managers
and field resources from multiple agencies and stakeholders with over 30 fire statistical requests
processed.
• Serve as an IROC Report Elevated Role user in support of Northwest reporting requests.
• Member of the SIT-209 change board and Next Generation 209 group.
Meteorology
Like everyone, the meteorology section of Predictive Services dealt with the disruptions of a global
health pandemic in 2020. We re-engineered our daily production routines to run off network in a
telework environment and were fully functional in this mode prior to the Oregon Governor’s Executive
Order No. 20-12 (Oregon's stay-at-home order) that went into effect on March 3rd. Once back in the
office, many adjustments were made in deference to the virus. Nevertheless, the meteorology section
continued to improve and expand its data analysis and processing routines and leveraged the need to
enable fully disconnected telework to streamline and simplify operations. Further process
enhancements are planned.
NWCC ACCOMPLISHMENTS | A Review of 2020
-11-
As a new lightning data vendor started supporting the fire community, we became a regional conduit of
lightning data through the first half of the fire season until data was restored to the Enterprise
Geospatial Portal. In addition to retrieving daily lightning reports for internal use, we relayed the data to
GIS specialists in dispatch centers and the BIA regional office.
Specific and General Accomplishments:
• Conducted routine daily coordination calls with National Weather Service (NWS) offices and
Incident Meteorologists; participated in coordination calls with NICC and the other GACCs.
• Published daily and monthly Significant Fire Potential Outlooks and Fire Activity Forecasts.
• Calculated quality control statistics and provided them to supporting data supply sources.
• Contributed to the publication of NW Mobilization Guide.
• Supported the research community with NFDRS data and analysis provided to a professor at the
University of Washington and automated weather observation data and guidance to a
researcher at the University of Idaho.
• Met with several novel data outages and developed backup data acquisition approaches to
mitigate current and future outages.
Organization: Operations
The NWCC Operations Section continues to ensure coordination of safe and efficient resource
mobilization and provides incident support. More than 20,000 resource orders were processed through
NWCC during the 2020 fire season: mobilizing overhead, crews, equipment and aircraft on fires and all-
hazard incidents in the Northwest, Nationally and Internationally. NWCC Operations recruited the
assistance of 23 individuals to assist with ongoing incidents and carry out Incident and NW MAC support
efforts. The Operations staff continues to maintain constant and unwavering support to all dispatch
centers and incidents within the Northwest. 2020 accomplishments for NWCC Operations are provided
below:
• Staffed and operated the GACC resource desks in support of incident operations through the fire
season.
• The Emergency Operations Manager acts as associate member of the PNWCG Operations
Committee. This individual also serves as a member of the NW Center Managers Advisory Council,
Operations Committee and subject matter expertise for Incident Commander, Smokejumper,
Hotshot, Rappeler and Engine Captain groups.
• The Emergency Operations Manager serves as the chair of the IROC Change Board.
• Maintained support efforts to the Northwest with oversight of the RAC Mob organization.
• Dispatched SORO personnel to incident assignments.
• Prepared and directed publication of the NW Interagency Mobilization Guide.
• Maintained roster and coordinated mobilizations of Portland NIMO.
• Maintained rosters and coordinated multiple mobilizations of the Northwest’s Type 1 & 2 IMTs.
• Provided support to Critical Incident Stress Management (CISM) mobilization and operations.
• Assisted in the mobilization of Agency Administrators to support areas with high fire activity.
• Provided planning and logistical support to the NW Dispatch Workshop.
• Provided instruction for dispatch related courses.

NWCC ACCOMPLISHMENTS | A Review of 2020
-12-
• Participated/presented subject matter at NW IMT conference.
• Maintained consistent communications with agency Duty Officers.
• Coordinated administrative flights for regional and national leaders.
• Due to COVID 19, developed and carried out COOP agreements for offsite work with NWCC
personnel and the Alaska Interagency Coordination Center for virtual support of the operations
floor.

FIRE SEASON OVERVIEW | Fire Season Climate Summary
-13-
FIRE SEASON OVERVIEW
Fire Season Climate Summary
Despite cool and wet periods early in fire season 2020, persistent warmth and very low rainfall in the
second half of the summer boosted fire danger sufficiently to make many areas more susceptible to fires
by late August and early September. While lightning was much less than average during fire season
2020, a few lightning-caused large fires helped set the stage for the fire outbreak that accompanied the
historic windstorm in early September.
Overall, temperature was slightly above average for most of the Pacific Northwest. Rain in western
Washington and northwest Oregon eased drought late in fire season but southwest Oregon and much of
eastern Oregon and eastern Washington remained quite dry.
Seasonal Fire Danger Summary
Energy Release Component (ERC) climbed from a below average values early in fire season 2020 to well
above average by early September. Some reporting regions smashed 30-year record values in the
aftermath of the historic fire outbreak in early September. ERC plunged with the onset of rain in the third
week of September. See Northwest Energy Release Component by PSA Appendix for 2020 ERC graphs.
Chart 4: 2020 Northwest Energy Release Component Trend

FIRE SEASON OVERVIEW | Fire Season Monthly Review
-14-
Fire Season Monthly Review
March
Weather Trends Precipitation was periodic over the region during March 2020, but monthly totals ended up much less
than typical for the great majority of the northwest geographic area. Temperatures averaged at or
below normal for the geographic area.
Snowpack was above average for the higher elevation reporting basins in Washington and northeastern
Oregon. Cool temperatures through March helped preserve the snow on the ground and more was
accumulating in most basins. However, new snow accumulation fell behind average over southwestern
Oregon where totals were roughly 75% of normal for late March.
March Fire Danger Trends
Energy Release Component across the region hovered near normal during March but fell due to wetter
weather at the end of the month.
March Fire Activity Over one hundred fire ignitions were reported in March across the geographic area. The first large fire,
the Sodhouse incident, occurred on March 5th on the Malheur NWR and grew to 1,000 acres. Otherwise,
fires that occurred within the geographic area consumed minimal acres. Agricultural burning was
evident in various sections of the geographic area from satellite detections.
April
Weather Trends Precipitation remained quite low for April across the Northwest Geographic Area, especially in the
Columbia Basin. After the first few days of the month very little precipitation occurred for roughly two
weeks. Periodic precipitation fell in the last week of the month but overall, the monthly rainfall totals
were below normal.
In contrast to March, temperature in April warmed up back to above normal over much of Oregon and
the Washington Cascades. The Columbia Basin and sections of northeastern Oregon remained cooler
than typical for the month.

FIRE SEASON OVERVIEW | Fire Season Monthly Review
-15-
Snowpack at higher elevations remained above average for Washington and northeastern Oregon.
Snowpack was less than typical over the Oregon Cascades and southwest Oregon.
April Fire Danger Trends
NFDRS Energy Release Component values (model G) for the geographic area varied in April, climbing a
bit above average in the middle of the month then falling again late in the month. ERC values reached
record highs for mid-April in some west side PSAs.
April Fire Activity Several small accidental fires were reported in both Oregon and Washington in April, particularly in
central Washington during dry, windy weather. These were doubtlessly aided by the unusually low fuel
moisture reported in the middle of the month.
May
Weather Trends Temperatures across the geographic area were generally above normal for May in western Washington
and most of Oregon. Elsewhere, temperature averaged near normal. Precipitation was generally above
average for the month except for central Washington and sections of eastern Oregon. An outbreak of
wet thunderstorms in mid-month brought days of cloudy, showery weather to much of the geographic
area.
Due to the months of warm and relatively dry weather, snowpack across the region remained unusually
low and continued to decline rapidly. Most reporting basins around the region had less than 25% of
normal snow water equivalent as of late May with many basins in Oregon reporting no snow.

FIRE SEASON OVERVIEW | Fire Season Monthly Review
-16-
June 11th – 12th Lightning Strikes
May Fire Danger Trends
NFDRS Energy Release Component values (model G) for the region hovered near average in early May then went below average most of the month due to wet weather. May Fire Activity Wildfire activity was minimal in May 2020 due to sufficiently wet weather.
June
Weather Trends Precipitation across the Northwest Geographic Area was ample in June due a series of Pacific weather
systems. Most areas received above average rain accumulation except for central Oregon and central
Washington. Temperatures were cooler than usual for June for much of Washington while Oregon was
near normal on average.
June Fire Danger Trends
NFDRS Energy Release Component (model G) for the region hovered near average early in June then fell well below average in the middle of the month and stayed below average for the remainder of the month. June Lightning 6,976 strikes were tabulated by NWCC Predictive
Services in June 2020. This was 44% of the normal of
June strikes (15,797). The most daily strikes occurred
on June 11th with 1,473 strikes.
June Fire Activity The number of wildfires over the geographic area was
less than typical in June 2020 due to the wet and cool
weather.

FIRE SEASON OVERVIEW | Fire Season Monthly Review
-17-
July
Weather Trends Temperature across the region lagged below normal for much of early July but gradually warmed back
to normal during the month. A significant heat wave struck during the last week the month. Overall,
temperatures ended up near normal across the geographic area for July. Overnight humidity recovery
gradually worsened during July over much of the region except western Washington. This helped boost
fire danger.
Precipitation in July was well below normal for the region with the only exceptions being the north
Washington Cascades and northeastern Washington.
July Fire Danger Trends
NFDRS Energy Release Component (model G) for the whole region was below average in the early part of the month but rose steadily. In central Oregon and central Washington (PSAs NW05, NW06, NW07, NW08) tracked at or above average through much of July. July Lightning 2020 continued the trend of below-average lightning activity of the last five Julys. 3,762 strikes were tabulated by NWCC Predictive Services for the month. This was 16% the July average of 23,283 strikes.
The most daily strikes occurred on July 22nd with 897 strikes, mainly over southeastern Oregon.
July Fire Activity The numbers of fires and acreage burned remained well below average for the geographic area for the
first three week of July. In the last week of the month lightning and rising fire danger combined to bring
more ignitions and several large fires requiring incident management teams mainly in central
Washington and central Oregon. Overall, the number of fires and acreage burned for July were below
normal.
July 22nd-23rd Lightning Strikes

FIRE SEASON OVERVIEW | Fire Season Monthly Review
-18-
August
Weather Trends Precipitation was well below normal for the majority of the Northwest Geographic Area in August 2020.
A frontal system around August 21st brought some precipitation to western Washington and sections of
western Oregon but otherwise conditions were quite dry. The debt of precipitation remained acute in
central Washington, central Oregon, and most of southwest Oregon. Temperatures for August ended up
above average despite a cool start to the month. Temperatures warmed well above average during a
hot spell in the middle of the month.
Drought continued to worsen over central Oregon, central Washington, as well as in southwest Oregon.

FIRE SEASON OVERVIEW | Fire Season Monthly Review
-19-
August Fire Danger Trends
August began with Energy Release Component values at or below average due to a brief cool spell that
affected most of the geographic area early in the month. ERC climbed steadily as temperatures grew
warmer and relative humidity dropped. At the middle of the month another weather system brought a
brief dip in ERCs, but fire danger climbed afterwards.
August Lightning
7,805 strikes were tabulated by NWCC Predictive
Services in August, 38% of the average August strike
count of 20,310.
The biggest lightning day of August was the 18th with 1,959 strikes mainly over eastern Oregon. August Fire Activity The numbers of fires and acreage burned remained
below average for the geographic area for the first week
of August. However, a very warm and dry spell in mid-
August boosted fire danger well above average. The
onset of several days of lightning brought scores of fire
starts mainly in central and eastern Oregon and central
Washington. Over a dozen large fires resulted with the
subsequent deployment of Type III, Type II, and Type I incident management teams. The geographic
area elevated to Preparedness Level 3 on August 17th for two days and then to PL 4 on August 19th in
response to the increased firefighting resource demand after having remained at PL 2 during June and
July. Overall, the number of fires and acreage burned for August 2020 was above average; 8% of acres
burned in the geographic area in 2020 occurred during August.
September
Weather Trends The very dry trend observed in July and August 2020 across the region continued for the first half of
September. Daily values of minimum relative humidity and corresponding overnight recoveries
maintained a worsening trend from late August through mid-September, falling steadily below average.
Historic Windstorm on September 7th and 8th
On September 7th and 8th, a strong dry cold front moving south from Canada pushed across the
geographic area bringing record breaking strong winds and low relative humidity to much of the region.
As winds calmed behind the front, smoke from multiple large fires settled into western Oregon and
Washington creating unhealthy air quality and poor visibility that spread over the next ten days and
covered regions on both sides of the Cascades.
Strong winds diminished in the aftermath of the cold front, but the dry air and heavy smoke lingered
until several Pacific frontal systems brought rain on September 18th, and again on the 24th. It was
concentrated mainly where it was most welcome in western Washington and most of northwest
Oregon, where rainfall totals went well above normal for the month. However, eastern Washington,
August 18th-19th Lightning Strikes

FIRE SEASON OVERVIEW | Fire Season Monthly Review
-20-
eastern Oregon, and southwest Oregon did not accumulate as much precipitation and rainfall totals
remained below average for the month.
Air quality improved considerably with the arrival of the Pacific frontal systems. Despite the arrival of
cold fronts, temperatures were above normal for September over the entire Northwest Geographic
Area.
Overall temperatures were above average for the geographic area for September.
September Fire Danger Trends September began with Energy Release Component values above average and rising steadily in every part
of the region. During and after the dry cold front event on September 7th and 8th, Energy Release
Component and Burning Index reached or exceeded extreme values set over the last 3 fire seasons in
several reporting areas. Following the arrival of several wet frontal systems ERC dropped below normal
for late September. Fire danger rose again as warm and dry weather returned at the end of the month.
September Lightning 2,628 strikes were tabulated by NWCC Predictive Services in
September, 31% of the normal total of 8,332 strikes for
September.
The biggest lightning day of September was the 17th, with
1,214 strikes occurring mainly over the Willamette Valley of
Oregon.
September Fire Activity The Northwest Geographic Area was already busy at
Preparedness Level 4 in early September 2020 with a dozen
large incidents receiving support, including Type I, Type II,
and Type III IMTs in both Oregon and Washington. On
September 7th and 8th, a dry cold front swept in from Canada
September 17th-18th Lightning Strikes

FIRE SEASON OVERVIEW | Fire Season Monthly Review
-21-
with strong winds that accelerated the already busy fire activity in the Northwest. Eastern Washington
and the Cascades of western and southern Oregon saw the greatest impacts from this cold front.
The resulting fast-moving firestorms in timber, brush, and grasses burned over 1.76 million acres on new
and existing large fires across the geographic area from September 7th through 13th, during and shortly
after the wind event. The event proved to be an unprecedented disaster for communities and there was
significant resource loss in and near the Oregon Cascades.
Fire activity was well above average for the region for September both in terms of numbers of fires and
acreage burned; 90% of acres burned in the geographic area in 2020 occurred during September.

FIRE SEASON OVERVIEW | NW Lightning Summary
-22-
NW Lightning Summary
21,171 strikes were recorded in the geographic area in June through September of 2020. This was only
31% of the average of 67,723 strikes for a four-month season.
Chart 5: NW Lightning Total Strikes (by Year)
Chart 6: 2020 Northwest Daily Lightning Strikes (June 1 – September 30)
0
500
1000
1500
2000
2500
Jun - 1 Jul - 1 Aug - 1 Sep - 1
FIRE SEASON OVERVIEW | NW Preparedness Review
-23-
NW Preparedness Review
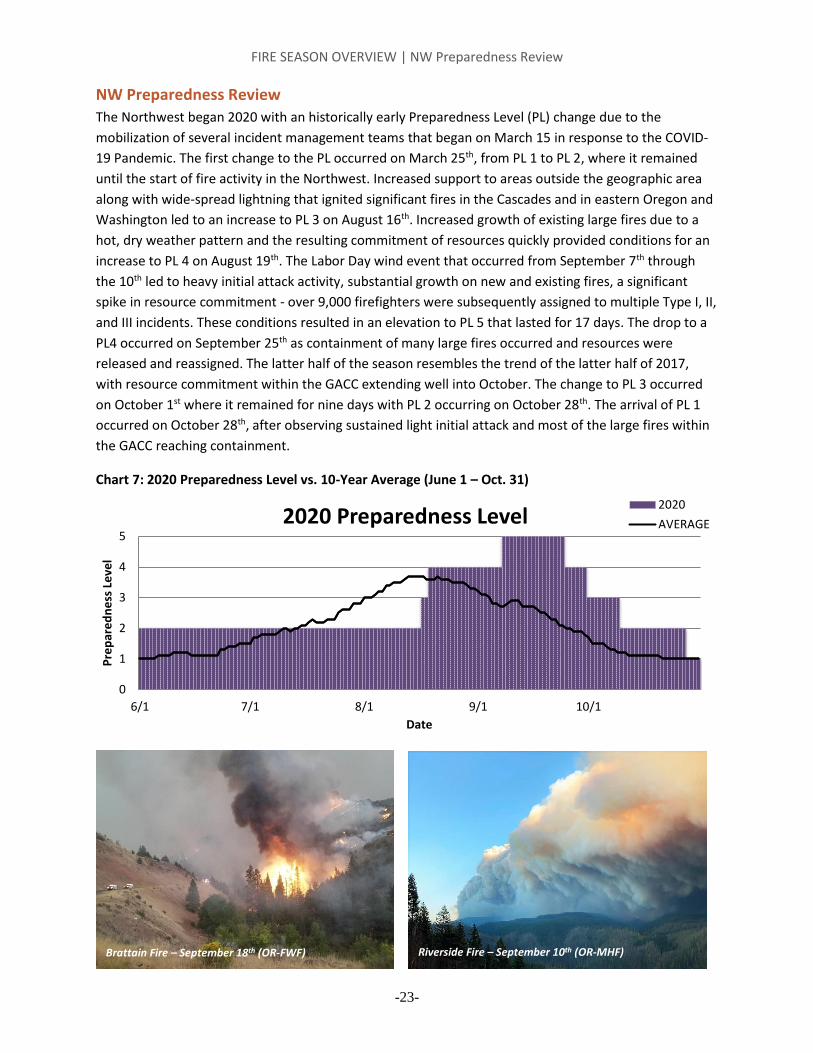
The Northwest began 2020 with an historically early Preparedness Level (PL) change due to the
mobilization of several incident management teams that began on March 15 in response to the COVID-
19 Pandemic. The first change to the PL occurred on March 25th, from PL 1 to PL 2, where it remained
until the start of fire activity in the Northwest. Increased support to areas outside the geographic area
along with wide-spread lightning that ignited significant fires in the Cascades and in eastern Oregon and
Washington led to an increase to PL 3 on August 16th. Increased growth of existing large fires due to a
hot, dry weather pattern and the resulting commitment of resources quickly provided conditions for an
increase to PL 4 on August 19th. The Labor Day wind event that occurred from September 7th through
the 10th led to heavy initial attack activity, substantial growth on new and existing fires, a significant
spike in resource commitment - over 9,000 firefighters were subsequently assigned to multiple Type I, II,
and III incidents. These conditions resulted in an elevation to PL 5 that lasted for 17 days. The drop to a
PL4 occurred on September 25th as containment of many large fires occurred and resources were
released and reassigned. The latter half of the season resembles the trend of the latter half of 2017,
with resource commitment within the GACC extending well into October. The change to PL 3 occurred
on October 1st where it remained for nine days with PL 2 occurring on October 28th. The arrival of PL 1
occurred on October 28th, after observing sustained light initial attack and most of the large fires within
the GACC reaching containment.
Chart 7: 2020 Preparedness Level vs. 10-Year Average (June 1 – Oct. 31)
6/1 7/1 8/1 9/1 10/1
0
1
2
3
4
5
Date
Pre
par
ed
ne
ss L
eve
l
2020 Preparedness Level 2020
AVERAGE
Brattain Fire – September 18th (OR-FWF) Riverside Fire – September 10th (OR-MHF)

FIRE STATISTICS & MAPS | 2020 NW Fires & Acres
-24-
FIRE STATISTICS & MAPS Data in this section comes from the Interagency Situation Report (SIT Report), as reported by NW dispatch offices as of 12/31/2020. The
information represented below display fire statistics based on the protecting agency, not land ownership. SIT reporting for the NW is confined
within the Oregon and Washington state boundaries with small portions of neighboring states (ID, NV and CA) where GA boundaries deviate
from state boundaries. In the NW, Sit Reporting captures state and federally protected wildlands (except DOD and DOE). County & Local (C&L)
detailed reporting is limited for C&L fires, and generally captures only fires greater than 300 acres in size.
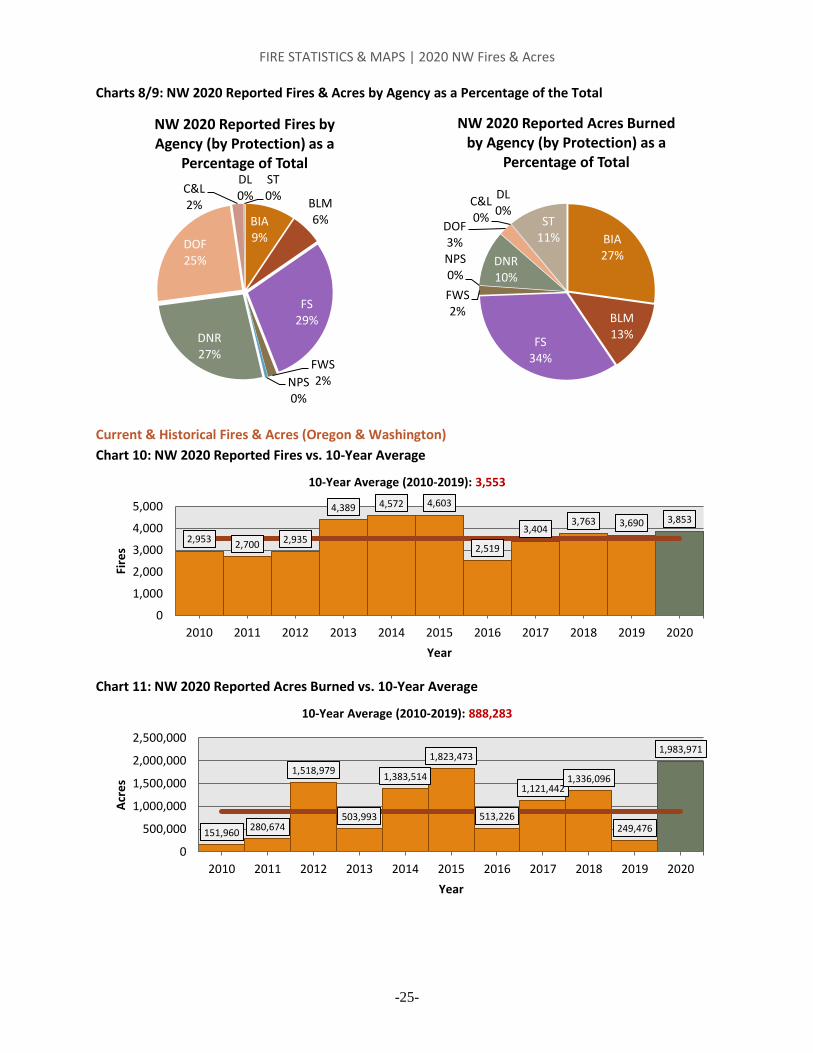
2020 NW Fires & Acres
The table below represents the 2020 fire summary by Agency and State. Like previous years, the total
number of fire occurrences in the Northwest reached near the 10-Year average mark, whereas the total
acres burned was well above, reaching to 223% of the 10-Year average. For the full Year-end Situation
Report by individual Units refer to Appendix, NW Situation Report.
Table 1: 2020 NW Fires & Acres by State & Agency (by Protecting Agency)
Human Lightning Total
State Agency Fires Acres Fires Acres Fires Acres
Idaho FS 0 0 0 0 0 0
Idaho Total 0 0 0 0 0 0
Oregon
BIA 159 2,069 25 213,748 184 215,817
BLM 86 184,205 73 49,842 159 234,047
C&L 5 8 0 0 5 8
DL 0 0 0 0 0 0
DOF 798 44,677 158 3,095 956 47,772
FS 488 447,518 397 194,629 885 642,147
FWS 9 1,021 3 798 12 1,819
NPS 8 1 6 1 14 2
Oregon Total 1,553 679,500 662 462,113 2,215 1,141,613
Washington
BIA 176 324,493 3 4 179 324,497
BLM 68 30,101 2 79 70 30,180
C&L 76 2,656 0 0 76 2,656
DNR 991 204,994 33 144 1,024 205,138
FS 182 25,591 38 4,471 220 30,061
FWS 50 30,924 4 249 54 31,173
NPS 3 84 4 1 7 85
ST 8 218,568 0 0 8 218,568
Washington Total 1,554 837,411 84 4,947 1,638 842,358
Grand Total 3,107 1,516,910 746 467,060 3,853 1,983,971
FIRE STATISTICS & MAPS | 2020 NW Fires & Acres
-25-
Charts 8/9: NW 2020 Reported Fires & Acres by Agency as a Percentage of the Total
Current & Historical Fires & Acres (Oregon & Washington)
Chart 10: NW 2020 Reported Fires vs. 10-Year Average
Chart 11: NW 2020 Reported Acres Burned vs. 10-Year Average
BIA9%
BLM6%
FS29%
FWS2%NPS
0%
DNR27%
DOF25%
C&L2%
DL0%
ST0%
NW 2020 Reported Fires by Agency (by Protection) as a
Percentage of Total
BIA27%
BLM13%
FS34%
FWS2%
NPS0%
DNR10%
DOF3%
C&L0%
DL0%
ST11%
NW 2020 Reported Acres Burnedby Agency (by Protection) as a
Percentage of Total
2,9532,700 2,935
4,389 4,572 4,603
2,519
3,4043,763 3,690 3,853
0
1,000
2,000
3,000
4,000
5,000
2010 2011 2012 2013 2014 2015 2016 2017 2018 2019 2020
Fire
s
Year
10-Year Average (2010-2019): 3,553
151,960280,674
1,518,979
503,993
1,383,514
1,823,473
513,226
1,121,4421,336,096
249,476
1,983,971
0
500,000
1,000,000
1,500,000
2,000,000
2,500,000
2010 2011 2012 2013 2014 2015 2016 2017 2018 2019 2020
Acr
es
Year
10-Year Average (2010-2019): 888,283

FIRE STATISTICS & MAPS | 2020 NW Fires & Acres
-26-
Chart 12: Oregon 2020 Reported Fires vs. 10-Year Average
Chart 13: Oregon 2020 Reported Acres Burned vs. 10-year Average
Chart 14: Washington 2020 Reported Fires vs. 10-Year Average
Chart 15: Washington 2020 Reported Acres Burned vs. 10-Year Average
1,973 1,787 1,599
2,8483,087
2,588
1,245
2,058 2,019
2,295
2,215
0
1,000
2,000
3,000
4,000
2010 2011 2012 2013 2014 2015 2016 2017 2018 2019 2020
Fire
s
Year
10-Year Average (2010-2019): 2,150
91,888260,744
1,290,527
350,786
984,629685,809
219,509
717,219897,263
79,735
1,141,613
0
500,000
1,000,000
1,500,000
2010 2011 2012 2013 2014 2015 2016 2017 2018 2019 2020
Acr
es
Year
10-Year Average (2010-2019): 557,811
976 913
1,336 1,527 1,480
2,013
1,272 1,346
1,744
1,395 1,638
0
500
1,000
1,500
2,000
2,500
2010 2011 2012 2013 2014 2015 2016 2017 2018 2019 2020
Fire
s
Year
10-Year Avg (2010-2019): 1,400
60,072 19,930
228,452 152,603 386,972
1,137,664
293,717 404,223 438,834 169,742
842,358
0
200,000
400,000
600,000
800,000
1,000,000
1,200,000
2010 2011 2012 2013 2014 2015 2016 2017 2018 2019 2020
Acr
es
Year
10-Year Avg (2010-2019): 329,221

FIRE STATISTICS & MAPS | 2020 NW Fires & Acres
-27-
Fires & Acres by Cause
The 2020 fire season observed over 4.1 times the number of human caused fires compared with
lightning caused fires, and over 3.2 times the amount of human caused acres compared with lightning
caused acres. These figures far exceed their counterparts in the 10-year average ratio of fire causes and
acres, where the number of human caused fires is 1.6 times that of lightning caused fires, and 0.5 times
the amount of human caused acres compared with lightning caused acres.
Chart 16: NW 2020 Reported Fires & Cause (by Protecting Agency)
Chart 17: NW 2020 Reported Acres Burned & Cause (by Protecting Agency)
BIA BLM FS FWS NPS DNR DOF C&L DL ST
Lightning 28 75 435 7 10 33 158 0 0 0
Human 335 154 670 59 11 991 798 81 0 8
0
200
400
600
800
1,000
1,200
Fire
s
NW 2020 Total Human Caused Fires = 3,107Total Lightning Caused Fires = 746
BIA BLM FS FWS NPS DNR DOF C&L DL ST
Lightning 213,752 49,921 199,100 1,047 2 144 3,095 0 0 0
Human 326,563 214,306 473,109 31,945 85 204,994 44,677 2,664 0 218,568
0100,000200,000300,000400,000500,000600,000700,000800,000
Acr
es
NW 2020 Total Human Caused Acres = 1,516,910Total Lightning Caused Acres = 467,060

FIRE STATISTICS & MAPS | 2020 NW Fires & Acres
-28-
Charts 18/19: NW 2020 Reported vs 10 Yr. Average Fires & Acres by Cause
76%
24%
2020 NW Human vs. Lightning Acres Burned as a Percentage of Total
Human Acres Lightning Acres
81%
19%
2020 NW Human vs. Lightning Number of Fires as a Percentage of Total
Human Fires Lightning Fires
32%
68%
10 Year Average, NW Human vs. Lightning
Acres Burned
Human Acres Lightning Acres
61%
39%
10 Year Average, NW Human vs. Lightning No. of Fires
Human Fires Lightning Fires

FIRE STATISTICS & MAPS | NW 2020 Incident Summary
-29-
NW 2020 Incident Summary Source: Listed incidents have met any of the ICS-209 reporting criteria (refer to Ch. 60 of NW Mob Guide for criteria). Listed by management
strategy then start date, as reported on the final ICS-209 submitted. Chosen management strategy(ies) may have changed over the duration of
the fire. Individual fires within complexes are not listed. Containment dates are based on best available information. Per the National Mob
Guide, an incident is considered a Large Fire if the fire is 100 acres or larger in timber, 300 acres or larger in grass/brush, or when a Type 1 or
Type 2 IMT is assigned. Incidents listed below are considered Large Fires unless an asterisk (*) is marked after Incident Name. † Unit ID Acronyms see Appendix, Unit Identifiers. ††IMT=Highest level assigned to incident ††† Cause: H=Human, L=Lightning, U=Undetermined. ††††Fuel; B=Brush, G=Grass, T=Timber.
Table 2: Washington Incidents by Management Strategy
Management Strategy
Incident Name Incident Unit ID†
Start Date
Contain Date
IMT†
†
Cau
se†
††
Fue
l††
††
Acreage
PSA
Location
Full Suppression Gibbon WA-SPD 5/31 6/2 3 H G 845 10 8 mi E of Prosser, WA Big Horn WA-SPD 6/30 7/3 3 H G 400 05 7 mi SE of Ellensburg, WA Pothole WA-COA 7/6 7/9 3 H G 351 08 3 mi NE of Omak, WA Saddle Mountain WA-MCR 7/6 7/12 3 H G 8,063 10 19 mi E of Mattawa, WA Road 11 WA-WFS 7/11 7/15 3 U B 9,330 10 8 mi SW of Mansfield, WA Bertschi Road WA-SES 7/16 7/27 2 H T 250 05 5 mi S of Glenwood, WA Greenhouse WA-COA 7/23 8/2 2 U G 5,320 08 1 mi SW of Nespelem, WA Colockum WA-SES 7/24 8/1 3 H B 2,967 10 3 mi SW of Malaga, WA Anglin WA-NES 7/27 8/1 3 H T 1,992 09 10 mi E of Tonasket, WA Green WA-NES 7/27 7/29 3 H G 1,480 08 10 mi NE of Riverside, WA Coulee Meadows WA-SPD 7/30 8/2 3 U B 794 10 18 mi NW of Ephrata, WA Konnowac WA-SPD 8/3 8/12 3 H G 1,083 05 7 mi SE of Yakima, WA North Brownstown WA-YAA 8/6 8/8 4 H G 344 05 10 mi SW of Union Gap, WA Lower Coyote Creek WA-COA 8/9 8/15 3 U T 2,582 08 2 mi SW of Nespelem, WA Badger Lake WA-NES 8/16 8/19 3 H T 244 10 10 mi SW of Cheney, WA Chief Timothy WA-WFS 8/16 8/19 3 H B 1,400 10 6 mi W of Clarkston, WA Taylor Pond WA-MCR 8/17 8/20 3 U G 24,892 10 12 mi E of Yakima, WA Jungle Creek WA-OWF 8/17 9/6 3 L T 588 05 13 mi SW of Cle Elum, WA Palmer WA-SPD 8/18 9/3 2 U T 17,988 08 7 mi SW of Oroville, WA Evans Canyon WA-SES 8/31 9/23 2 U G 75,817 05 8 mi NW of Naches, WA Cold Springs WA-COA 9/6 9/24 3 U G 189,923 08 3 mi S of Omak, WA Inchelium Complex WA-COA 9/7 9/27 2 U T 19,399 08 1 mi N of Inchelium, WA Babb WA-NES 9/7 9/13 2 U G 15,269 10 5 mi NW of Rosalia, WA Customs Road WA-NES 9/7 9/16 3 H G 2,208 09 1 mi W of Curlew, WA Whitney WA-NES 9/7 9/28 2 U G 127,430 10 6 mi NW of Davenport, WA Apple Acres WA-SES 9/7 9/20 2 H G 5,500 10 3 mi E of Chelan, WA Beverly Burke WA-SPD 9/7 9/10 3 H B 920 10 7 mi SE of Vantage, WA Kahlotus WA-SPD 9/7 9/9 4 H G 22,000 10 14 mi E of Connell, WA Manning Rd WA-WFS 9/7 9/13 2 U G 2,685 10 5 mi NW of Colfax, WA Paterson WA-WFS 9/7 9/12 4 U G 1,460 10 1 mi W of Paterson, WA Pearl Hill WA-WFS 9/7 9/28 2 U G 223,730 10 9 mi E of Bridgeport, WA Sumner Grade WA-WFS 9/7 9/15 3 U G 494 10 4 mi W of Sumner, WA Fish WA-SPS 9/8 9/22 3 H T 132 02 5 mi E of Enumclaw, WA Wawawai Canyon WA-WFS 9/12 9/13 3 U G 303 10 14 mi S of Pullman, WA Cold Creek WA-OWF 9/14 11/20 3 H T 564 05 38 mi W of Yakima, WA
Monitor North Brownstown 3 WA-YAA 8/16 8/23 3 H G 5,981 05 10 mi SW of Union Gap, WA
Monitor, Confine Downey Creek WA-MSF 8/16 10/30 4 L T 3,166 01 18 mi NW of Darrington, WA North Brownstown 2 WA-YAA 8/8 8/10 4 H B 884 05 10 mi SW of Union Gap, WA
Monitor, FS East Beach Road* WA_OLP 7/29 10/1 3 U T 84 01 15 mi W of Port Angeles, WA
Confine, Full Suppression
Tule Road WA-YAA 8/16 9/7 4 H B 702 05 4 mi SW Granger, WA
Chikamin WA-OWF 7/31 10/1 3 L T 2,151 05 11 mi NE of Lake Wenatchee, WA
Monitor, Confine, PZP, FS
Big Hollow WA-GPF 9/8 11/13 2 H T 24,995 02 9 mi N of Stabler, WA
Washington Count 42
Total Acres 806,710

FIRE STATISTICS & MAPS | NW 2020 Incident Summary
-30-
Table 3: Oregon Incidents by Management Strategy
Management Strategy
Incident Name Incident Unit ID†
Start Date
Contain Date
IMT†
†
Cau
se†
†
†
Fue
l††
††
Acreage
PSA
Location
Full Suppression Sodhouse OR-MAR 3/5 3/8 3 H G 1,000 12 25 Mi SE of Burns, OR Rock Creek 0103 RN OR-PRD 4/29 4/30 4 H G 1,038 10 14 mi SW of Arlington, OR
Doe Creek OR-FWF 5/29 6/11 3 L T 111 07 19 mi SE of Chemult, OR Teller Flat 0281 OD OR-951S 6/23 6/25 4 H G 948 06 12 mi E of Madras, OR
Milepost 91 OR-WSA 7/9 8/31 4 U G 787 06 15 mi NW of Warm Springs, OR Rosland Road 0429 NE OR-DEF 7/18 7/22 3 H T 393 07 4 mi NE of La Pine, OR
Ben Young OR-982S 7/21 7/31 2 H T 1,249 07 13 mi S of Paisley, OR Krumbo OR-MAR 7/22 7/23 4 L B 329 12 9 mi SW of Diamond, OR
Pine Creek 0480 RN OR-PRD 7/26 7/27 3 U G 307 06 5 mi SW of Ashwood, OR Dragon Rock OR-LAD 7/28 7/31 4 L G 858 12 29 mi E of Christmas Valley, OR
Worthington OR-711S 7/30 8/16 3 L T 761 04 5 mi NE of Eagle Point, OR Fir Mountain OR-954S 8/1 8/13 3 H T 313 06 9 mi S of Hood River, OR
Neals Hill OR-BUD 8/5 8/13 2 L G 3,391 12 20 mi SE of Princeton, OR Mud Creek OR-BUD 8/5 8/27 2 L B 236 12 10 mi E of Frenchglen, OR
Buckhorn Creek OR-952S 8/6 8/8 3 L T 233 11 12 mi NW of Dayville, OR Mosier Creek OR-954S 8/12 8/18 1 H T 985 06 2 mi S of Mosier, OR Green Ridge 0684 CS OR-DEF 8/16 9/1 1 L T 4,338 06 12 mi NW of Sisters, OR
Crane OR-FWF 8/16 9/8 2 L T 2,993 07 10 mi SE of Lakeview, OR Frog 0657 RS OR-OCF 8/16 8/31 2 L T 4,020 06 8 mi S of Post, OR Indian Creek OR-VAD 8/16 9/16 2 U B 48,128 12 9 mi E of Juntura, OR Beachie Creek OR-WIF 8/16 10/28 1 U T 193,573 03 15 mi n of Detroit, OR Lionshead OR-WSA 8/16 11/13 1 L T 204,469 06 20 mi W of Warm Springs, OR P515 OR-WSA 8/16 11/13 1 L T 4,607 06 17 mi W of Warm Springs, OR Trout Creek OR-BUD 8/17 8/20 4 L G 312 12 22 mi SE of Fields, OR
Wildcat OR-BUD 8/17 8/28 3 L B 3,456 12 14 mi W of Burns Junction, OR Anderson Crossing OR-VAD 8/17 8/18 4 L B 531 12 25 mi E of McDermitt, NV Baldy OR-VAD 8/17 8/27 4 L B 3,696 11 6 mi NE of Ironside, OR Little Mud Creek OR-BUD 8/18 8/23 4 L G 424 12 6 mil W of Frenchglen, OR Steet Mountain OR-952S 8/19 8/27 1 L T 699 06 9 mi N of Monument, OR Laurel 0741 PR OR-PRD 8/19 8/31 1 L B 1,257 06 5 mi S of Spray, OR Putnam Springs OR-UMF 8/19 8/27 3 L T 131 11 45 mi S of Heppner, OR Meacham Complex OR-UMF 8/20 9/10 2 U T 765 11 10 mi N of La Grande, OR Sweet Creek MP 2 OR-781S 8/30 9/12 1 H T 307 03 1 mi S of Mapleton, OR Grizzly Creek OR-711S 9/4 9/29 3 H T 325 04 16 mi E of Ashland, OR Echo Mtn. Complex OR-535S 9/7 9/21 1 H T 2,552 02 4 mi E of Lincoln City, OR Clackamas County Fires OR-581S 9/7 9/29 2 U T 2,584 02 1 mi S of Molalla, OR Brattain OR-FWF 9/7 10/6 2 H T 50,951 07 8 mi S of Paisley, OR Two Four Two OR-FWF 9/7 10/10 1 U T 14,473 07 7 mi E of Fort Klamath, OR Wickiup OR-VAD 9/7 9/8 4 H G 751 12 5 mi NW of Annex, OR Holiday Farm OR-WIF 9/7 10/26 1 U T 173,393 03 3 mi W of McKenzie Bridge, OR Almeda Drive OR-711S 9/8 9/14 2 U G 3,200 04 4 mi NW of Ashland, OR S. Obenchain OR-711S 9/8 10/3 2 U T 32,671 04 5 mi E of Eagle Point, OR French Creek OR-733S 9/8 9/22 AC U T 500 04 2 mi NW of Glide, OR Riverside OR-MHF 9/8 12/3 1 H T 138,054 03 8 mi SE of Estacada, OR Archie Creek OR-UPF 9/8 11/16 1 U T 131,542 04 20 mi E of Glide, OR Ritter OR-952S 9/21 9/23 4 L G 676 11 30 mi N of John Day, OR Rose Creek OR-VAD 10/16 10/18 4 H B 1,787 12 7 mi S of Ironside, OR Leslie Gulch OR-VAD 11/5 11/16 4 H B 5,147 12 23 mi NW of Jordan Valley, OR
Confine Marsh OR-KLR 5/28 6/1 4 L G 450 07 23 mi SE of Chemult, OR
Monitor, Full Suppression
White River OR-MHF 8/17 11/13 1 L T 17,442 06 20 mi W of Wamic, OR
PZP, Full Suppression
Thielsen OR-UPF 9/8 11/16 1 U T 9,975 07 166 mi W of Chemult, OR
Oregon Count 51
Total Acres 1,073,118

FIRE STATISTICS & MAPS | NW 2020 Large Incident Summary
-31-
NW 2020 Large Incident Summary Source: ICS-209 Reports.
Per the National Mob Guide, an incident is considered a “Large Fire” if the fire is 100 acres or larger in
timber, 300 acres or larger in grass/brush, or when a Type 1 or Type 2 IMT is assigned. The graphs below
represent only the incidents from Table 2 & 3 that meet these criteria.
The first large incident of 2020 occurred in southeast Oregon. The Sodhouse incident started on March
5th on the Malheur NWR. It was human caused, burned in a grass fuel type and was contained within
four days on March 8th with a final size of 1,000 acres.
The largest incident of 2020 occurred in northeast Washington. The Pearl Hill incident started on
September 7th on land protected by the Washington State Fire Marshall in Douglas County, Washington
and was human caused. The fire burned in brush and grass fuel types and grew to 174,000 acres during
the initial attack phase with extreme fire behavior and wind driven runs observed. A Type 2 IMT was
assigned to the incident for 6 days and it was contained after 22 days on September 28th at 223,730
acres.
The Slater incident originated on the Klamath National Forest in northern California and burned across
the geographic area boundary onto lands under ownership of BLM, USFS and others. It burned a total of
76,414 acres in Oregon; 63,753 acres under USFS ownership, 2,675 acres under BLM ownership and
9,986 acres under private and other ownership. The Slater incident is not calculated in the Northwest
Year-End fire statistics since the protecting unit is in northern California.
Chart 20: NW 2020 Large Incident Summary by State & Agency
BIA BLM FS FWS NPS DOF DNR C&L ST
Washington 9 7 7 2 0 0 9 0 6
Oregon 3 14 15 3 0 15 0 0 0
0
2
4
6
8
10
12
14
16
Fire
s

FIRE STATISTICS & MAPS | NW 2020 Large Incident Summary
-32-
Chart 21: NW 2020 Large Incident Acres Burned Summary by State & Agency
Charts 22/23: NW 2020 Large Incidents by Agency as a Percentage of Total
BIA BLM FS FWS NPS DOF DNR C&L PRI ST
Washington 225,486 44,030 34,936 32,955 0 0 239,015 0 132 230,072
Oregon 209,863 71,083 742,154 1,779 0 48,003 0 0 0 0
0
100,000
200,000
300,000
400,000
500,000
600,000
700,000
800,000A
cre
s
BIA13%
BLM23%
FS24%
FWS6%
NPS0%
DOF16%
DNR10%
C&L0%
PRI1%
ST7%
NW 2020 Large Incidents by Agency, as a Percentage of Total
BIA23%
BLM6%
FS41%
FWS2%
NPS0%
DOF3%
DNR13%
C&L0%
PRI0%
ST12%
NW 2020 Large Incident Acres by Agency, as a Percentage of Total
FIRE STATISTICS & MAPS | NW 2020 Incident Location Maps
-33-
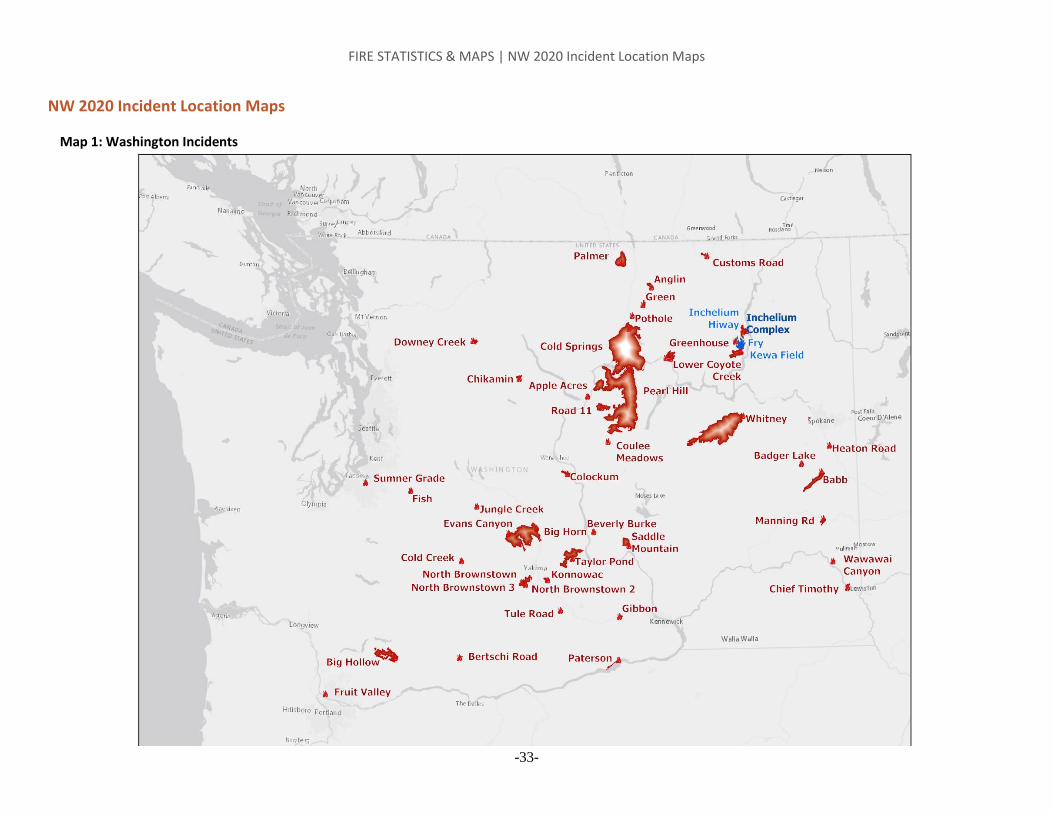
NW 2020 Incident Location Maps
Map 1: Washington Incidents

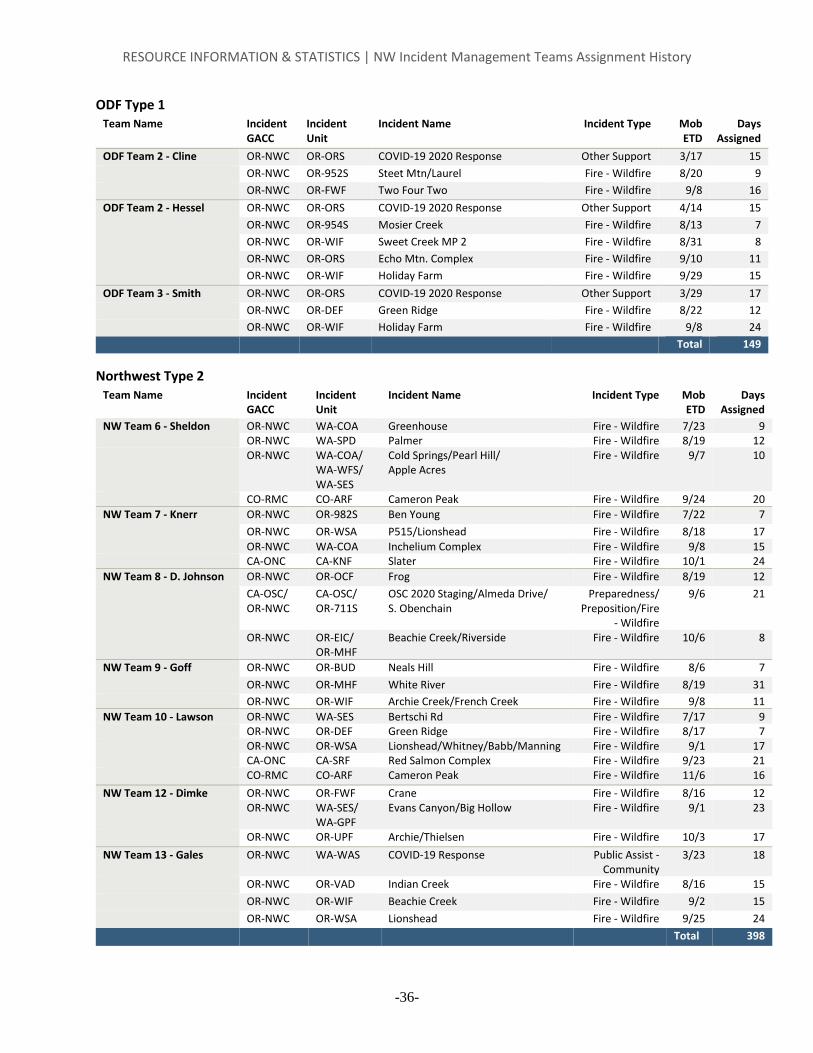
FIRE STATISTICS & MAPS | NW 2020 Incident Location Maps
-34-
Map 2: Oregon Incidents

RESOURCE INFORMATION & STATISTICS | NW Incident Management Teams Assignment History
-35-
RESOURCE INFORMATION & STATISTICS
NW Incident Management Teams Assignment History Source: IROC.
All IMTs Total Days Assigned (NIMO, AC, Type 1 & Type 2)
Northwest IMTs Assigned in GACC Days Assigned: 582
Out of GACC IMTs Assigned in GACC Days Assigned: 117 Total Days IMTs Assigned in GACC: 699
Northwest IMTs Assigned out of GACC Days Assigned: 303
Total Days Northwest IMTs Assigned on Incidents: 885
Portland NIMO Team Name Incident
GACC Incident Unit
Incident Name Incident Type Mob ETD
Days Assigned
Portland NIMO - Day CA-ONC CA-ONC R5 COVID-19 Support Preparedness/ Preposition
3/16 26
CO-RMC CO-ARF Cameron Peak Fire - Wildfire 8/24 20
OR-NWC OR-NWC 2020 R06 Large Fire Support Preparedness/ Preposition
9/13 22
Total 68
Area Command Team Name Incident
GACC
Incident
Unit
Incident Name Incident Type Mob
ETD
Days
Assigned
Area Command - Stutler ID-FCF ID-NIC COVID 19 Response Other Support 3/18 48 OR-NWC OR-MHF/
OR-WIF Riverside/2020 WIF Fire Support Fire – Wildfire/
Other Support 9/9 23
CA-ONC CA-MNF August Complex Fire - Wildfire 10/9 25 Total 96
Northwest Type 1 Team Name Incident
GACC Incident Unit
Incident Name Incident Type Mob ETD
Days Assigned
PNW Team 2 – Allen UT-GBC VI-VIIC Support to Australia Fire - Wildfire 1/16 30
OR-NWC WA-WAS COVID-19 Response Public Assist - Community
3/21 10
CA-OSC CA-LPN Dolan Fire - Wildfire 9/1 22
CA-ONC CA-MNF August Complex Fire - Wildfire 9/29 15
CO-RMC CO-ARF Cameron Peak Fire - Wildfire 10/24 17
PNW Team 3 - Livingston OR-NWC WA-WAS COVID-19 Response Public Assist - Community
4/6 15
OR-NWC OR-NWC NW WFPR Incident Management 2020
Fire - Wildfire 5/5 11
OR-NWC OR-MHF White River/Lionshead/P515 Fire - Wildfire 8/27 23
OR-NWC OR-MHF Riverside Fire - Wildfire 9/23 16
CO-RMC CO-ARF/ WY-MRF
Williams Fork/ East Troublesome
Fire - Wildfire 10/18 15
Total 174
RESOURCE INFORMATION & STATISTICS | NW Incident Management Teams Assignment History
-36-
ODF Type 1 Team Name Incident
GACC Incident Unit
Incident Name Incident Type Mob ETD
Days Assigned
ODF Team 2 - Cline OR-NWC OR-ORS COVID-19 2020 Response Other Support 3/17 15
OR-NWC OR-952S Steet Mtn/Laurel Fire - Wildfire 8/20 9
OR-NWC OR-FWF Two Four Two Fire - Wildfire 9/8 16
ODF Team 2 - Hessel OR-NWC OR-ORS COVID-19 2020 Response Other Support 4/14 15
OR-NWC OR-954S Mosier Creek Fire - Wildfire 8/13 7
OR-NWC OR-WIF Sweet Creek MP 2 Fire - Wildfire 8/31 8
OR-NWC OR-ORS Echo Mtn. Complex Fire - Wildfire 9/10 11
OR-NWC OR-WIF Holiday Farm Fire - Wildfire 9/29 15
ODF Team 3 - Smith OR-NWC OR-ORS COVID-19 2020 Response Other Support 3/29 17
OR-NWC OR-DEF Green Ridge Fire - Wildfire 8/22 12
OR-NWC OR-WIF Holiday Farm Fire - Wildfire 9/8 24 Total 149
Northwest Type 2 Team Name Incident
GACC Incident Unit
Incident Name Incident Type Mob ETD
Days Assigned
NW Team 6 - Sheldon OR-NWC WA-COA Greenhouse Fire - Wildfire 7/23 9 OR-NWC WA-SPD Palmer Fire - Wildfire 8/19 12 OR-NWC WA-COA/
WA-WFS/ WA-SES
Cold Springs/Pearl Hill/ Apple Acres
Fire - Wildfire 9/7 10
CO-RMC CO-ARF Cameron Peak Fire - Wildfire 9/24 20
NW Team 7 - Knerr OR-NWC OR-982S Ben Young Fire - Wildfire 7/22 7
OR-NWC OR-WSA P515/Lionshead Fire - Wildfire 8/18 17
OR-NWC WA-COA Inchelium Complex Fire - Wildfire 9/8 15 CA-ONC CA-KNF Slater Fire - Wildfire 10/1 24
NW Team 8 - D. Johnson OR-NWC OR-OCF Frog Fire - Wildfire 8/19 12
CA-OSC/ OR-NWC
CA-OSC/ OR-711S
OSC 2020 Staging/Almeda Drive/ S. Obenchain
Preparedness/ Preposition/Fire
- Wildfire
9/6 21
OR-NWC OR-EIC/ OR-MHF
Beachie Creek/Riverside Fire - Wildfire 10/6 8
NW Team 9 - Goff OR-NWC OR-BUD Neals Hill Fire - Wildfire 8/6 7
OR-NWC OR-MHF White River Fire - Wildfire 8/19 31
OR-NWC OR-WIF Archie Creek/French Creek Fire - Wildfire 9/8 11
NW Team 10 - Lawson OR-NWC WA-SES Bertschi Rd Fire - Wildfire 7/17 9 OR-NWC OR-DEF Green Ridge Fire - Wildfire 8/17 7 OR-NWC OR-WSA Lionshead/Whitney/Babb/Manning Fire - Wildfire 9/1 17 CA-ONC CA-SRF Red Salmon Complex Fire - Wildfire 9/23 21 CO-RMC CO-ARF Cameron Peak Fire - Wildfire 11/6 16
NW Team 12 - Dimke OR-NWC OR-FWF Crane Fire - Wildfire 8/16 12 OR-NWC WA-SES/
WA-GPF Evans Canyon/Big Hollow Fire - Wildfire 9/1 23
OR-NWC OR-UPF Archie/Thielsen Fire - Wildfire 10/3 17
NW Team 13 - Gales OR-NWC WA-WAS COVID-19 Response Public Assist - Community
3/23 18
OR-NWC OR-VAD Indian Creek Fire - Wildfire 8/16 15
OR-NWC OR-WIF Beachie Creek Fire - Wildfire 9/2 15
OR-NWC OR-WSA Lionshead Fire - Wildfire 9/25 24 Total 398

RESOURCE INFORMATION & STATISTICS | Resource Order Summary
-37-
Resource Order Summary Source: IROC Reports
During 2020, the dispatch community within the Northwest entered 83,169 total requests. Of those,
67,142 were filled which equates to an 81% fill rate.
Table 4: 2020 Northwest All Resource Order Summary *Columns with an asterisk are unable to populate under current IROC reporting configurations.
Request Category Enter Delete* Place Retrieve* Fill Unfill* Reassign Release Cancel Cancel
UTF UTF
Aircraft 4,684 NA 4,684 0 3,741 0 684 2,495 650 293 293
Crew 2,504 NA 2,504 0 1,808 0 404 1,250 530 165 165
Equipment 12,305 NA 12,305 0 9,793 0 1,169 2,955 940 217 217
Overhead 30,834 NA 30,834 0 22,741 0 4,048 17,986 5,039 2,803 2,803
Supply 32,842 NA 32,842 0 29,059 0 111 2,221 2,638 170 170
Summary 83,169 0 83,169 0 67,142 0 6,416 26,907 9,797 3,648 3,648
Chart 24: 2020 Northwest Filled Request as a Percentage of Total
Table 5: 2020 Crew Resource Order Summary *Columns with an asterisk are unable to populate under current IROC reporting configurations.
Category Name
Catalog Item Name
Ente
r
De
lete
*
Pla
ce
Re
trie
ve*
Fill
Un
fill*
Re
assi
gn
Re
leas
e
Can
cel
Can
cel U
TF
UTF
Fire Crew, Type 1 286 0 286 0 182 0 54 119 76 28 28 Crew, Type 1 or 2 IA 101 0 101 0 66 0 16 41 28 7 7 Crew, Type 1 or 2 Any 56 0 56 0 47 0 14 33 9 0 0 Crew, Type 2 IA 546 0 546 0 385 0 104 258 135 25 25 Crew, Type 2 1043 0 1043 0 829 0 167 563 169 45 45 Crew, Type 2 Any 172 0 172 0 136 0 29 94 13 23 23 Crew, Type Any 93 0 93 0 59 0 6 52 31 3 3 Crew, Misc 1 0 1 0 1 0 0 1 0 0 0 Fire, Strike Team
Crew, Strike Team, Type 1 or 2 Any
4 0 4 0 3 0 0 3 1 0 0
Crew, Strike Team, Type 2
2 0 0 0 0 0 0 0 2 0 0
Fire 2,304 0 2,302 0 1,708 0 390 1,164 464 131 131
Non-Fire Crew, Camp 165 0 165 0 70 0 14 56 61 34 34 Crew, Kitchen 8 0 8 0 8 0 0 8 0 0 0
Non-Fire 173 0 173 0 78 0 14 64 61 34 34
Crew Summary 2,477 0 2,475 0 1,786 0 404 1,228 525 165 165
Aircraft6%
Crew3%
Equipment11%
Overhead57%
Supply23%
Big Hollow Fire – September 18th (OR-GPF)

RESOURCE INFORMATION & STATISTICS | NW Interagency Hotshot Crews
-38-
NW Interagency Hotshot Crews Source: IROC Reports, Region 6 Hotshot Crew Lead.
Chart 24: 2020 IHC Days Assigned to Incidents
Table 6: 2020 IHC Days
Assigned & Percentage of Total
by Geographic Area
GACC Days %
Southern Area 0 0%
Eastern Area 0 0%
Northern Rockies
17 1%
Rocky Mountain
112 9%
Great Basin 102 8%
Southwest 157 12%
Northern California
0 0%
Southern California
12 1%
Northwest 730 58%
Alaska 127 10%
Southern Area 0 0%
Total 1,257 100%
Chart 25: 2020 IHC Days Assigned by Geographic Area as a
Percentage of the Total
BakerRiver
EntiatLa
GrandeLakeview Prineville Redmond
RogueRiver
Union ValeWarmSprings
WinemaWolfCreek
Zigzag
Fire - Wildfire 105 113 100 100 119 63 121 99 81 90 85 71 110
Fire - Prescribed 8 0 14 0 15 0 10 0 0 0 0 0 0
0
20
40
60
80
100
120
140
160
Day
s A
ssig
ne
d
All Other GACCs
0%
Northern Rockies
1%
Rocky Mountain
9%Great Basin
8%
Southwest12%
Southern California
1%
Northwest58%
Alaska10%

RESOURCE INFORMATION & STATISTICS | NW Smokejumpers
-39-
NW Smokejumpers
North Cascades Smokejumpers Source: North Cascades Smokejumper Base (NCSB), excerpt. For full report, contact NCSB.
In summary, 11 fires were jumped out of NCSB in 2020, additionally NCSB boosted other bases 2 times
during the season. The first fire jump occurred on July 6th and the last on August 29th. Nationally the
North Cascades Smokejumpers conducted 424 total jumps with 0 loss time injuries.
NCSB filled 56 single resource assignments totaling 953 days, as well as spending 374 person days on
fuels management activities including prescribed burning and thinning.
Chart 26: NCSB Smokejumper’s 10-Year Fire Jump Count
Redmond Smokejumpers Source: Redmond Air Center (RAC), excerpt. For full report, contact RAC.
Out of Redmond, 28 fires were staffed totaling 164 fire jumps. Redmond Smokejumpers and boosters
responded to fires in 7 separate land management areas in the Northwest. The first fire jump occurred
on July 15th and the last on September 10th. The 28 fires are approximately 65% of our 10-year average
of 42 fires and 164 fire jumps is 79% of our 10-year average of 208 fire jumps.
Redmond Smokejumpers filled 28 single resource assignments totaling 476 days, which amounted to
29% of our wildland and prescribed fire activities in 2020.
Chart 27: Redmond Smokejumper’s 10-Year Fire Jump Numbers
41105 109 104 133
487557
596
435 424
6 24 28 30 42 18 37 35 11 110
100
200
300
400
500
600
700
2011 2012 2013 2014 2015 2016 2017 2018 2019 2020
Jumps
Fires
266
165
259
338
260
76
229
172147
164
5228
8264
4811
41 38 37 28
0
50
100
150
200
250
300
350
400
2011 2012 2013 2014 2015 2016 2017 2018 2019 2020
Jumps
Fires

RESOURCE INFORMATION & STATISTICS | NW Rappel Aircraft
-40-
NW Rappel Aircraft Source: Region 6 2020 Aviation Summary. For full report, contact SORO.
Table 7: 2020 Rappel Activity Totals – Region 6
Wenatchee Grande
Ronde #2 Grande
Ronde #1 John Day
Siskiyou Prineville Totals Average
Flight Hours on Fire 225.1 131.1 116 173.3 140 195.1 980.6 818
Flight Hours Other 40.2 10.2 17.2 10.4 15.8 NA 93.8 81.6
Days on Contract 120 143 120 120 172 138 813 135.5
# Initial Attack Count 15 24 40 115 20 13 227 37.4
# Large Fires 5 14 14 2 3 6 44 7.3
Person Days on Fire 1634 505 264 1395 690 682 5170 861.6
Proficiency Rappels 276 149 162 150 223 227 1187 197.8
Operational Rappels 17 52 46 87 30 28 260 43.3
Total Rappels 293 201 208 294 253 255 1504 250.6
Rapp IA's/EA's 4 17 13 23 11 8 76 12.6
Helitack IA's 8 7 18 9 4 2 48 8
Chart 28: 2020 Rappel Flight Hours on Fire
Chart 29: 2020 Rappel Initial Attack Count
Wenatchee225.1
Grande Ronde #2131.1
Grande Ronde #1116.0John Day
173.3
Siskiyou140.0
Prineville195.1
Wenatchee15
Grande Ronde #224
Grande Ronde #140
John Day115
Siskiyou20
Prineville13

RESOURCE INFORMATION & STATISTICS | Redmond Air Tanker Base
-41-
Redmond Air Tanker Base Source: Redmond Air Center (RAC), FY 2020 Accomplishment Report & FY 2021 Program of Work excerpt. For full report, contact RAC.
The USFS Pacific Northwest Air Tanker Base Program consists of the six “large” air tanker bases in the region hosted by area forests. Some also
support MAFFS and VLAT air tankers and other types of incident support aircraft including smoke jumping aircraft, helicopters and other
aircraft. For other Northwest Air Tanker Base figures, contact respective bases.
2020 Year End Totals
RETARDANT
Gallons of Retardant ------------------------------------------------------------------------- 962,622
Loads of Retardant---------------------------------------------------------------------------------- 459
Retardant Cost to Fires -------------------------------------------------------------- $2,752,172.50
Retardant Contract Length ---------------------------------------------------------------- 137 days
Contract Extension (*Pre-Delivery) -------------------------------------------------------- 45 days
Retardant Loads Aborted or Jettisoned ---------------------------------------------------------- 1
Average Turnaround Time -------------------------------------------------------------- 12 minutes
FIRE INFORMATION
Number of Agency Users ----------------------------------------------------------------------------- 7
Number of Fires Worked with Air Tankers ----------------------------------------------------- 72
Number of Initial Attack Fires --------------------------------------------------------------------- 47
Number of Fires Reinforced ----------------------------------------------------------------------- 25
Number of Air Tankers that operated from RDM -------------------------------------------- 23
LANDINGS
Total Number of Landings ------------------------------------------------------------------------ 332
Total Landing Fee Costs (at $3.08 per 1000lbs)---------------------------------- $105,708.68
Types of Air Tankers Making Landings ------------------------------------------------------------ 6
(BAe-146, MD-87, CV-580, DC-7, RJ-85, SEATs)
PEAK OPERATIONS
Max # of Air Tankers Operating in One Day (August 20th) ----------------------------------- 8
Max # of Incidents Worked in One Day (August 20th) ----------------------------------------- 2
Max. # of Loads in One Day (August 20th)*RECORD* - -------------------------------------- 63
Max. # of Gallons Retardant Pumped in One Day (August 20th) ------------------- 107,746
Max # of Landings in One Day (August 20th) -------------------------------------------------- 62
First Air Tanker Mission Flown ------------------------------------------------------------ 04-21-20
Where Flown: “Holcomb Rd”, (Texas State)
Last Air Tanker Mission Flown ------------------------------------------------------------ 10-08-20
Where Flown: “Haystack”, (ODF)

APPENDIX | Northwest Energy Release Component by PSA
-42-
APPENDIX
Northwest Energy Release Component by PSA

APPENDIX | Northwest Energy Release Component by PSA
-43-

APPENDIX | NW Situation Report
-44-
NW Situation Report Source: Interagency Situation Report (SIT Report), as reported by NW dispatch offices on 12/31/2020. DNR = Department of Natural Resources, NF = National Forest, NHP = National Historic Park, NHS = National Historic Site, NM = National Monument, NP = National Park, NRA = National Recreation Area, NSA = National Scenic Area, NWR = National Wildlife Refuge, DOF = Oregon Department of Forestry, ST= Washington State Fire Marshal's Office, DL= Oregon Department of State Lands
NW SIT reporting captures all of Oregon and Washington, in addition to small portions of neighboring states (ID, NV, CA). Reported statistics are for state and federally protected wildlands (except DOD and DOE). In Washington (WA-WFS, Washington State Fire Marshal's Office), reporting is limited, and generally captures only fires greater than 300 acres in size. In some instances, reporting responsibility for a unit is covered by two dispatch offices. In these cases, two entries result with the respective reporting dispatch office listed in parenthesis following the unit name. Added together, both entries account for the unit’s total activity.
Table 8: 2020 NW Fires & Acres by Unit (by Protecting Agency)
2020 NW Fires & Acres by Unit (by Protection Agency)
Agency State Unit Name Human
Fires Human
Acres Lightning
Fires Lightning
Acres Total Fires
Total Acres
BIA Oregon Umatilla Agency 23 11 - - 23 11
Warm Springs Agency (OR-COC) - - - - - -
Warm Springs Agency (OR-WSA) 136 2,058 25 213,748 161 215,806
Oregon Total 159 2,069 25 213,748 184 215,817
Washington Colville Agency (WA-COA) 69 217,705 1 - 70 217,705
Colville Agency (WA-NEC) 1 98,001 - - 1 98,001
Kalispel Tribe 5 6 - - 5 6
Spokane Agency (WA-NEC) 15 357 - - 15 357
Spokane Agency (WA-SPA) 1 - 1 3 2 3
Yakama Agency 85 8,424 1 1 86 8,425
Washington Total 176 324,493 3 4 179 324,497
BIA Total 335 326,563 28 213,752 363 540,315
BLM Oregon Burns District 5 136 9 631 14 767
Coos Bay District (OR-CBD) 1 1 - - 1 1
Coos Bay District (OR-RICC) 2 534 2 - 4 534
Lakeview District 12 40 22 864 34 904
Medford District (OR-RVC) - - - - - -
Northwest Oregon District (OR-EIC) 8 18,579 3 38,641 11 57,220
Prineville District (OR-BMC) - - - - - -
Prineville District (OR-COC) 31 2,168 23 1,576 54 3,744
Roseburg District (OR-RICC) 4 105,904 2 - 6 105,904
Vale District (OR-VAD) 23 56,843 12 8,130 35 64,973
Oregon Total 86 184,205 73 49,842 159 234,047
Washington Spokane District (OR-BMC) - - - - - -
Spokane District (WA-CWC) 61 27,003 2 79 63 27,082
Spokane District (WA-NEC) 7 3,098 - - 7 3,098
Washington Total 68 30,101 2 79 70 30,180
BLM Total 154 214,306 75 49,921 229 264,227
C&L Oregon Black Butte Ranch Rural Fire Protection District - - - - - -
Bend Fire Department 2 2 - - 2 2
Crook County Fire & Rescue 1 1 - - 1 1
C&L Oregon Cloverdale Fire Protection District - - - - - -
Condon Fire Department - - - - - -

APPENDIX | NW Situation Report
-45-
2020 NW Fires & Acres by Unit (by Protection Agency)
Agency State Unit Name Human
Fires Human
Acres Lightning
Fires Lightning
Acres Total Fires
Total Acres
Crescent Rural Fire Protection District - - - - - -
Crooked River Ranch Rural Fire Protection District 1 5 - - 1 5
Dayville Fire Department - - - - - -
Deschutes County Fire District 1 - - - - - -
Deschutes County Fire District 2 - - - - - -
Fossil Volunteer Fire Department - - - - - -
Gilchrist Fire Department - - - - - -
Jefferson County Rural Fire Protection District #1 - - - - - -
Juniper Flat Rural Fire Protection District - - - - - -
Lapine Rural Fire Protection District - - - - - -
Mitchell Volunteer Fire Department - - - - - -
Moro Fire Department - - - - - -
Maupin Fire Department - - - - - -
North Gilliam County Rural Fire Protection District - - - - - -
North Sherman County Rural Fire Protection District
- - - - - -
Redmond Fire & Rescue - - - - - -
Central Oregon Rangeland Protection Association (OR-COC)
- - - - - -
Central Oregon Rangeland Protection Association (OR-LFC)
1 - - - 1 -
South Gilliam County Rural Fire Protection District - - - - - -
Sisters-Camp Sherman Rural Fire Protection District
- - - - - -
Spray Volunteer Fire Department - - - - - -
Sunriver Fire Department - - - - - -
Wasco Fire Department - - - - - -
Warm Springs Fire & Safety - - - - - -
Oregon Total 5 8 - - 5 8
Washington Adams County Fire Districts (WA-CWC) 1 128 - - 1 128
Adams County Fire Districts (WA-NEC) - - - - - -
Benton County Fire Districts 2 599 - - 2 599
Chelan County Fire Districts 5 6 - - 5 6
Douglas County Fire Districts 5 75 - - 5 75
Ferry County Fire Districts 1 2 - - 1 2
Franklin County Fire Districts (WA-CWC) - - - - - -
Franklin County Fire Districts (WA-NEC) - - - - - -
Grant County Fire Districts (WA-CWC) - - - - - -
Grant County Fire Districts (WA-NEC) - - - - - -
Klickitat County Fire Districts - - - - - -
Kittitas County Fire Districts 8 6 - - 8 6
Lincoln County Fire Districts 2 200 - - 2 200
Okanogan County Fire Districts - - - - - -
Pend Oreille County Fire Districts 1 - - - 1 -
Spokane County Fire Districts 22 230 - - 22 230
Spokane Fire Department 4 4 - - 4 4
Stevens County Fire Districts 22 5 - - 22 5
Whitman County Fire Districts 1 1,400 - - 1 1,400
Walla Walla County Fire Districts 1 1 - - 1 1
C&L Washington Yakima County Fire Districts 1 - - - 1 -
Washington Total 76 2,656 - - 76 2,656

APPENDIX | NW Situation Report
-46-
2020 NW Fires & Acres by Unit (by Protection Agency)
Agency State Unit Name Human
Fires Human
Acres Lightning
Fires Lightning
Acres Total Fires
Total Acres
C&L Total 81 2,664 - - 81 2,664
DL Oregon Oregon Department of State Lands (OR-BIC) - - - - - -
Oregon Department of State Lands (OR-COC) - - - - - -
Oregon Total - - - - - -
DL Total - - - - - -
DNR Washington Northeast Region-Department of Natural Resources (WA-CWC)
22 167 1 - 23 167
Northeast Region-Department of Natural Resources (WA-NEC)
493 117,413 20 72 513 117,485
Northwest Region-Department of Natural Resources
66 196 - - 66 196
Olympic Region-Department of Natural Resources 17 12 2 11 19 23
Pacific Cascade Region-DNR 106 336 1 - 107 336
Southeast Region-Department of Natural Resources (OR-BMC)
6 3 2 57 8 60
Southeast Region-Department of Natural Resources (WA-CWC)
121 86,398 6 3 127 86,401
South Puget Sound Region-Department of Natural Resources
160 469 1 1 161 470
Washington State Department of Natural Resources Headquarters
- - - - - -
Washington Total 991 204,994 33 144 1,024 205,138
DNR Total 991 204,994 33 144 1,024 205,138
DOF Oregon Tillamook District 9 779 - - 9 779
Astoria District 17 2 - - 17 2
Forest Grove Unit 17 12 3 - 20 12
Columbia City Unit 13 3 - - 13 3
Philomath Unit 6 2 1 - 7 2
Dallas Unit 11 5 - - 11 5
Toledo Unit 9 2,428 - - 9 2,428
Molalla Unit 24 2,589 - - 24 2,589
Santiam Unit 14 12 - - 14 12
Medford Unit (OR-71C) 101 33,093 6 - 107 33,093
Grants Pass Unit (OR-712C) 165 62 1 - 166 62
Coos Forest Protective Association 31 374 2 - 33 374
Bridge Unit 5 - - - 5 -
Gold Beach Unit 6 20 - - 6 20
North Unit (OR-73S) 22 114 1 - 23 114
South Unit (OR-73S) 29 37 1 - 30 37
Central Unit (OR-73S) 29 542 1 - 30 542
East Lane Unit - ODF 16 3 4 - 20 3
Sweet Home Unit - ODF 35 36 - - 35 36
Western Lane District 50 362 3 - 53 362
Prineville Unit 4 998 6 11 10 1,009
John Day Unit 9 229 51 2,950 60 3,179
Fossil Unit - - - - - -
The Dalles Unit (OR-COC) - - - - - -
The Dalles Unit (WA-CCC) 25 1,426 - - 25 1,426
Sisters Unit 31 13 14 1 45 14
LaGrande District 6 19 12 95 18 114
DOF Oregon Baker Unit 5 2 6 2 11 4
Pendleton Unit (OR-BMC) 7 99 12 28 19 127

APPENDIX | NW Situation Report
-47-
2020 NW Fires & Acres by Unit (by Protection Agency)
Agency State Unit Name Human
Fires Human
Acres Lightning
Fires Lightning
Acres Total Fires
Total Acres
Wallowa Unit 9 7 10 4 19 11
Klamath Unit 42 141 6 - 48 141
Lake Unit 15 1,266 9 1 24 1,267
Walker Ranger Forest Protective Association 36 3 9 3 45 6
Oregon Total 798 44,677 158 3,095 956 47,772
DOF Total 798 44,677 158 3,095 956 47,772
FS Idaho Hells Canyon National Recreation Area - - - - - -
Idaho Total - - - - - -
Oregon Malheur National Forest-Burns Fire Zone - - - - - -
Columbia River Gorge National Scenic Area 11 1 - - 11 1
Deschutes National Forest 135 471 79 4,401 214 4,872
Fremont-Winema National Forest 41 65,444 41 3,142 82 68,586
Malheur National Forest (OR-BIC) 2 2 15 12 17 14
Malheur National Forest (OR-MAF) 14 26 69 29 83 55
Mt. Hood National Forest 90 138,064 5 17,456 95 155,520
Ochoco National Forest 24 21 23 4,038 47 4,059
Rogue River-Siskiyou National Forest 36 62,264 3 - 39 62,264
Siuslaw National Forest 17 4 - - 17 4
Umatilla National Forest (OR-BMC) 5 39 59 398 64 437
Umatilla National Forest (OR-MAF) - - 12 143 12 143
Umpqua National Forest 10 26,160 8 9,953 18 36,113
Willamette National Forest 78 154,863 20 155,007 98 309,870
Wallowa-Whitman National Forest (OR-BMC) 25 159 63 50 88 209
Oregon Total 488 447,518 397 194,629 885 642,147
Washington Colville National Forest 20 9 2 1 22 10
Gifford Pinchot National Forest 41 25,013 2 7 43 25,020
Mt. Baker-Snoqualmie National Forest 28 3 6 3,170 34 3,173
Olympic National Forest 5 1 5 28 10 28
Okanogan-Wenatchee National Forest (WA-CWC) 85 565 14 767 99 1,332
Okanogan-Wenatchee National Forest (WA-NEC) 1 - 1 - 2 -
Umatilla National Forest - Washington 2 - 8 498 10 498
Washington Total 182 25,591 38 4,471 220 30,061
FS Total 670 473,109 435 199,100 1,105 672,208
FWS Oregon Bear Valley National Wildlife Refuge - - - - - -
Klamath Marsh National Wildlife Refuge 2 11 1 466 3 477
Malheur National Wildlife Refuge 6 1,010 1 329 7 1,339
Oregon Coast National Wildlife Refuge Complex - - - - - -
Sheldon-Hart Mountain National Wildlife Refuge Complex
- - 1 3 1 3
Upper Klamath National Wildlife Refuge - - - - - -
Willamette Valley National Wildlife Refuge Complex
1 - - - 1 -
Oregon Total 9 1,021 3 798 12 1,819
Washington Little Pend Oreille National Wildlife Refuge 1 - 1 - 2 -
Mid Columbia National Wildlife Refuge Complex (WA-CWC)
47 30,923 3 249 50 31,172
Nisqually National Wildlife Refuge Complex - - - - - -
Ridgefield National Wildlife Refuge Complex - - - - - -
Turnbull National Wildlife Refuge 2 1 - - 2 1
FWS Washington Willapa National Wildlife Refuge Complex (WA-PCS)
- - - - - -

APPENDIX | NW Situation Report
-48-
2020 NW Fires & Acres by Unit (by Protection Agency)
Agency State Unit Name Human
Fires Human
Acres Lightning
Fires Lightning
Acres Total Fires
Total Acres
Willapa National Wildlife Refuge Complex (WA-PSC)
- - - - - -
Washington Maritime National Wildlife Refuge Complex
- - - - - -
Washington Total 50 30,924 4 249 54 31,173
FWS Total 59 31,945 7 1,047 66 32,992
NPS Oregon Crater Lake National Park 8 1 6 1 14 2
John Day Fossil Beds National Monument - - - - - -
Oregon Caves National Monument - - - - - -
Oregon Total - - - - - 2
Washington Lake Roosevelt National Recreation Area - - - - - -
Mount Rainier National Park - - 1 - 1 -
North Cascades National Park - - - - - -
Olympic National Park 3 84 3 1 6 85
San Juan Island National Historical Park - - - - - -
Whitman Mission National Historic Site - - - - - -
Washington Total 3 84 4 1 7 85
NPS Total 11 85 10 2 21 87
ST Washington Washington State Fire Marshal's Office (OR-BMC) - - - - - -
Washington State Fire Marshal's Office (WA-WSP) 8 218,568 - - 8 218,568
Washington Total 8 218,568 - - 8 218,568
Grand Total 3,107 1,516,910 746 467,060 3,853 1,983,971

APPENDIX | NW Dispatch Centers
-49-
NW Dispatch Centers
Table 9: Washington
Government Level
NWCG ID Unit Name Organizational Level
Federal WA-CCC Columbia Cascade Communications Center Local
WA-CAC Colville Agency Dispatch Center Local
WA-CWC Central Washington Interagency Communication Center Local
WA-NEC Northeast Washington Interagency Communications Center Local
WA-PSC Puget Sound Interagency Coordination Center Local
WA-YAC Yakama Agency Dispatch Center Local
State WA-WAC Washington State Headquarters Dispatch Center (Olympia) State
WA-NDC WAS-Northwest Dispatch Center Local
WA-OLC Olympic Region DNR Local
WA-PCC Pacific Cascade Region DNR Local
WA-SPC South Puget Sound Region DNR Local
Table 10: Oregon
Government Level
NWCG ID Unit Name Organizational Level
Federal OR-NWC Northwest Interagency Coordination Center Regional
OR-BIC Burns Interagency Communication Center Local
OR-BMC Blue Mountain Interagency Dispatch Center Local
OR-COC Central Oregon Interagency Dispatch Center Local
OR-EIC Eugene Interagency Communication Center Local
OR-JDCC John Day Interagency Communication Center Local
OR-LFC Lakeview Interagency Fire Center Local
OR-RICC Roseburg Interagency Communication Center Local
OR-RVC Rogue Valley Interagency Communication Center Local
OR-VAC Vale District Dispatch Center Local
OR-WSC Warm Springs Agency Dispatch Center Local
State OR-ORC ODF State Headquarters Dispatch Center (Salem) State
OR-50C Northwest Oregon Area Dispatch Center Local
OR-70C Southern Oregon Area Dispatch Center Local
OR-71C Medford Dispatch Center Local
OR-712C Grants Pass Dispatch Center Local
OR-954C The Dalles Dispatch Center Local
OR-72C Coos Forest Protection Agency Local
OR-73C Douglas Forest Protection Agency Local
OR-77C South Cascade Dispatch Center Local
OR-78C Western Lane Dispatch Center Local
OR-99C Walker Range Forest Protection Agency Local

APPENDIX | NW Federal & State Agency Identifiers
-50-
NW Federal & State Agency Identifiers
Table 11: Agency Identifiers
Government Level
Department Acronym Name
Federal
Interior BIA Bureau of Indian Affairs
BLM Bureau of Land Management
Agriculture
FWS Fish & Wildlife Service
NPS National Park Service
USFS Forest Service
ODF Oregon Department of Forestry
State --
DNR Washington Department of Natural Resources
OFSM Oregon Office of State Fire Marshal
WFS Washington Office of State Fire Marshal
NW Local Unit Identifiers
DNR = Department of Natural Resources, NF = National Forest, NHP = National Historic Park, NHS = National Historic Site, NM = National Monument, NP = National Park, NRA = National Recreation Area, NSA = National Scenic Area, NWR = National Wildlife Refuge, ODF = Oregon Department of Forestry
Table 12: Federal
Agency State-ID Unit Name
BIA
OR-UMA Umatilla Agency
OR-WSA Warm Springs Agency
WA-COA Colville Agency
WA-SPA Spokane Agency
WA-YAA Yakama Agency
BLM
OR-BUD Burns District
OR-CBD Coos Bay District
OR-EUD Eugene District
OR-KFD Klamath Falls Resource Area
OR-LAD Lakeview District
OR-MED Medford District
OR-PRD Prineville District
OR-ROD Roseburg District
OR-SAD Salem District
OR-VAD Vale District
WA-SPD Spokane District
FWS
OR-BVR Bear Valley NWR
OR-HMR Hart Mountain NWR
OR-KLR Klamath Marsh NWR
OR-MAR Malheur NWR
OR-UKR Upper Klamath NWR
OR-SHR Sheldon-Hart Mountain NWR
WA-LPR Little Pend Oreille NWR
WA-MCR Mid-Columbia NWR Complex
WA-NQR Nisqually NWR
WA-RFR Ridgefield NWR Complex
WA-TBR Turnbull NWR
WA-WLR Washington Maritime NWR
Agency State-ID Unit Name
WA-WLR Willapa NWR Complex
NPS
OR-CLP Crater Lake NP
OR-OCP Oregon Caves NM
WA-LRP Lake Roosevelt NRA
WA-MRP Mount Rainier NP
WA-NCP North Cascades NP
WA-OLP Olympic NP
WA-SJP San Juan Islands NHP
WA-WMP Whitman Mission NHS
USFS
ID-WWF Hells Canyon NRA
OR-CGF Columbia River Gorge NSA
OR-DEF Deschutes NF
OR-FWF Fremont-Winema NF
OR-MAF Malheur NF
OR-MHF Mt. Hood NF
OR-OCF Ochoco NF
OR-RSF Rogue River-Siskiyou NF
OR-SUF Siuslaw NF
OR-UMF Umatilla NF (Oregon)
OR-UPF Umpqua NF
OR-WIF Willamette NF
OR-WWF Wallowa-Whitman NF
WA-COF Colville NF
WA-GPF Gifford Pinchot NF
WA-MSF Mt. Baker-Snoqualmie NF
WA-OLF Olympic NF
WA-OWF Okanogan-Wenatchee NF
WA-UMF Umatilla NF (Washington)

APPENDIX | NW Local Unit Identifiers
-51-
NW Local Unit Identifiers
Table 13: State
Agency State-ID Unit Name
County & Local
OR-OFS Oregon Fire Service
OR-RFPN Central Oregon Rangeland Protection Association
OR-SGIN South Gilliam County Rural Fire Protection District
OR-WASN Wasco Fire Department
WA-WFS Washington State Fire Marshal's Office
DNR WA-NES Northeast Region DNR
WA-NWS Northwest Region DNR
WA-OLS Olympic Region DNR
WA-PCS Pacific Cascade Region DNR
WA-SES Southeast Region DNR
WA-SPS South Puget Sound Region DNR
WA-WAS Washington State Headquarters
ODF OR-510S Tillamook District
OR-520S Astoria District
OR-531S Forest Grove Unit
OR-532S Columbia City Unit
OR-551S Philomath Unit
OR-552S Dallas Unit
OR-553S Toledo Unit
OR-581S Molalla Unit
OR-582S Santiam Unit
OR-711S Medford Unit
OR-712S Grants Pass Unit
OR-721S Coos Unit - Coos FPA
OR-722S Bridge Sub-Unit - Coos FPA
OR-723S Gold Beach Sub-Unit - Coos FPA
OR-731S North Unit - Douglas FPA
OR-732S South Unit - Douglas FPA
OR-733S Central Unit - Douglas FPA
OR-771S East Lane Unit
OR-772S Sweet Home Unit
OR-781S Western Lane District
OR-951S Prineville Unit
OR-952S John Day Unit
OR-954S The Dalles Unit
OR-955S Sisters Unit
OR-971S LaGrande District
OR-972S Baker Unit
OR-973S Pendleton Unit
OR-974S Wallowa Unit
OR-981S Klamath Unit
OR-982S Lake Unit
OR-991S Walker Range FPA


