Online Appendix for Together We Will: Experimental Evidence on Female Voting Behavior in Pakistan by Xavier Giné and Ghazala Mansuri NOT FOR PRINT PUBLICATION Contents: Page 1: OA1. Pakistani Electoral System Page 2: OA2. Partners in the Experiment Page 3: OA3. Visit Script Page 5: OA4. Visual Aids Page 8 OA5. Cluster Probability of assignment to T 1 Page 10: OA6. Robustness Checks Page 11: OA7. Additional Tables (Tables OA1 to OA17) Page 29: OA8. Additional Figures (Figures OA1 to OA3)
Transcript
0
Online Appendix for Together We Will: Experimental Evidence on Female Voting Behavior in Pakistan
by Xavier Giné and Ghazala Mansuri
NOT FOR PRINT PUBLICATION
Contents:
Page 1: OA1. Pakistani Electoral System
Page 2: OA2. Partners in the Experiment
Page 3: OA3. Visit Script
Page 5: OA4. Visual Aids
Page 8 OA5. Cluster Probability of assignment to T1
Page 10: OA6. Robustness Checks
Page 11: OA7. Additional Tables (Tables OA1 to OA17)
Page 29: OA8. Additional Figures (Figures OA1 to OA3)
1
Section OA1. Pakistan’s Electoral System
• The head of the government (the Prime Minister), is elected by the members of the National Assembly
who hold the majority, while the Electoral College, which consists of both houses of Parliament,
together with the four provincial assemblies, elects the head of state (the President), who is a figurehead
under the constitution but has been the de facto head of government during periods of military rule. In
addition to the national parliament and the provincial assemblies, Pakistan also has elected local
governments.
• Elections are conducted under the supervision of the Election Commission of Pakistan. The National
and Provincial assemblies are elected at the same time during a general election. The Pakistan People’s
Party-Parliamentarian (PPP-P) which formed the government in 2008, completed its tenure and held
elections on time. The successor government formed by the Pakistan Muslim League-Nawaz Sharif
Group (PML-N) came to power in 2013.
• In addition to the 272 constituencies, an additional 70 reserved seats for women and minorities,
allocated in proportion to the share of the contested seats won by each party. The lower house thus
consists of 342 seats in all, and a party needs 172 – or 50% plus one to form the government.
2
Section OA2. Partners in the Experiment
The experiment was carried out in collaboration with the Pakistan Poverty Alleviation Fund (PPAF), the
Marvi Rural Development Organization (MRDO), Research Consultants (RCons), ECI and the World Bank.
PPAF is an apex institution created in 2000 with World Bank funding. PPAF provides capacity building and
funding for community based development and microfinance to its partner organizations which are mostly
NGOs. MRDO, a non-partisan organization that works with rural women, is one such NGO. RCons, a survey
firm, helped MRDO implement the awareness campaign and collected the baseline and follow-up data. Each
team consisted of two women: one MRDO staff member and one female enumerator from RCONs.
The RCons team was new to the villages, but MRDO staff had been working in the area, though their
coverage was quite low. Only Around 11 percent of the women in the sample said they were MRDO members
(see Table 1). Despite this, we ensured that MRDO staff did not conduct the campaign in villages where they
had been working previously. They were also not engaged in the collection of follow-up data or voter
verification. When asked informally about whether women in the households they had visited to deliver the
campaign had voted and for whom, they did not know. It is quite unlikely, as such, that MRDO staff had any
influence over village women, due to their previous work in or knowledge of the village.
ECI, a non-partisan local training firm, collaborated in the design of the campaign. ECI had prior
experience with the development of visual aids and pamphlets related to electoral participation and the balloting
process. It was also actively engaged in the training of local election officers nationwide prior to the elections.
3
Section OA3. Visit Script
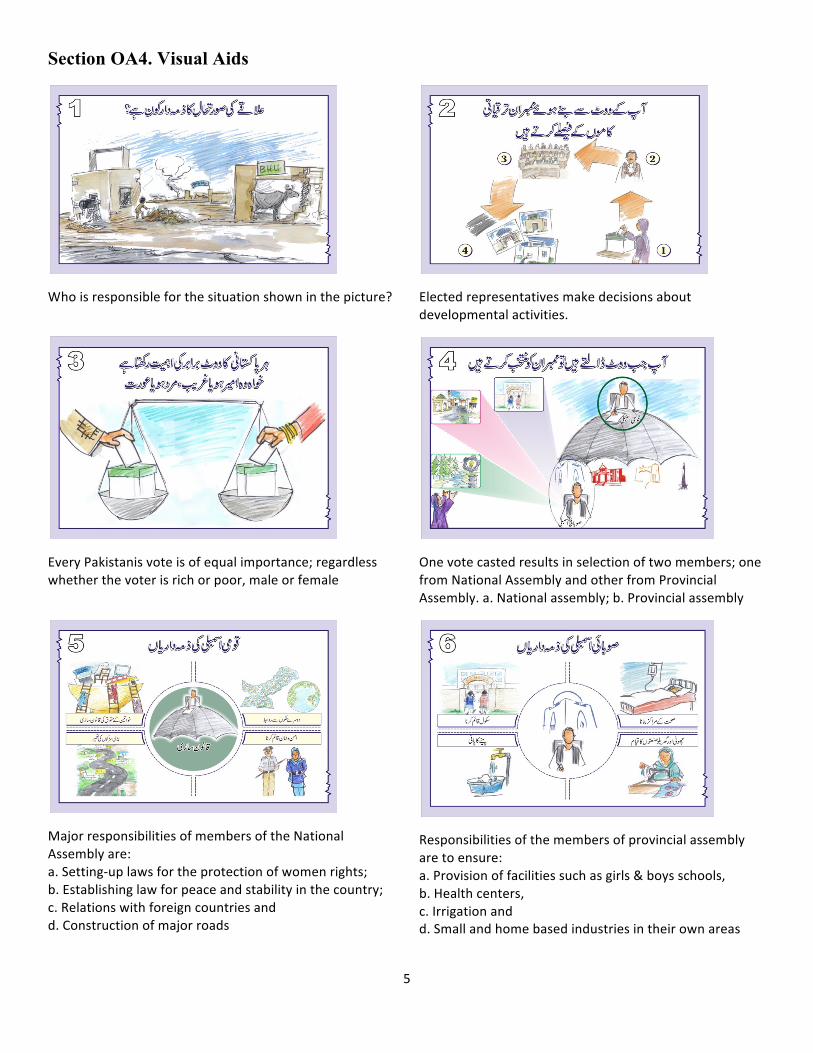
Importance of Voting (T1) Picture 1: Ask “In your opinion, who do you consider responsible for the situation shown in this picture?” If women respond that politician, feudal lords, bureaucrats and influential personalities, etc. then clarify that in fact you may be responsible for this state. Also, responsible are all those who do not cast a vote or choose a wrong candidate. You are the ones who empower them. Hence you need to understand how you can individually affect the decision of who finds solutions to your problems/issues. Do realize your power and importance of your vote? Picture 2: Ask “Could your one vote bring a change in your life?” Explain that your vote is of great importance. Through this vote a representative is elected. It is this elected representative who then sits in the provincial or national Assembly and makes decisions with regard to what facilities are provided in your area with regard to education, health, security, roads, income earning options, etc. Picture 3: Many women think that casting a vote makes no difference. Ask women what they think. If they respond that they are women or are underprivileged and therefore it will make no difference, stress that every Pakistani vote is of equal importance, regardless of whether the voter is rich or poor, male or female. If they as women do not cast their vote then individuals who have no interest in women related issues may get elected. Tell the women that there is a lot of power in their vote. People consider that women are weak. Should all Pakistani women begin to vote, their vote has the power to alter a Government! Picture 4: Ask the women whether they are aware that when they cast a vote in the General Elections, they actually select two members: one for the large assembly, which is known as the “National Assembly” on the green ballot paper; and the second for the small assembly which is “Provincial Assembly” on the white ballot paper. Both the assemblies work separately, with different domains and duties assigned. Picture 5: Explain that the major responsibility of the members of the national assembly is legislation. Like setting-up laws for the protection of women rights; establishing law for peace and stability in the country; relations with foreign countries and construction of major roads. Reiterate that the color of ballot for the member of national assembly is green. Picture 6: Ask women whether they know about the responsibilities of the members of the provincial assembly. Explain that provincial assembly member has a more direct link to the area they live in. It is this member’s responsibility to ensure the provision of facilities such as girl’s and boy’s schools, health centers, irrigation and small and home based industries. Remind women that the color of ballot for the member of provincial assembly is white. Remind women that in the pictures previously shown they must have noted that the members of National and Provincial Assemblies are tasked with a lot of work for local and national progress. Ask women whether they think “good” candidates should have specific qualities in order to be effective at their job. Encourage active participation. Then, show Picture 7 and list the characteristics of an effective candidate: educated, well reputed, respected for their good character and benevolent to poor; interested to promote projects that will reduce poverty; ability to understand problems; not misused national resources in the past; and have a positive attitude. Ask women whether they have information about all the candidates that are contesting elections from their constituency. Show Picture 8 and ask women about their impression. Explain that there may be many women who do not know about the candidates that are contesting in their constituency. How then can they compare the qualities of the candidates in order to decide who is the best candidate? Ask women if they would cast their vote. If “Yes” then ask how they would decide whom to vote for. “Do they have enough information about all the members?” and “Do they really know who the best candidate is?” If “Not” then ask where they would obtain information about the candidates. Show Picture 9 and tell them where information about the candidates could be obtained, e.g. male members within the family (since they are more aware and exposed), neighbors, teachers/respected members of the community and party workers. Picture 10: Ask women what they see. The picture is self explanatory, showing a before and after behavior of a candidate – before the election the candidate is humble and attentive. After the election they just whisk off without even acknowledging your presence! Ask the women if this has happened to them. Highlight that this happens when one does not get correct information about the member and thus one chooses the wrong candidate. Ask women if they ever wonder “why cast a vote when nobody has done anything for us so far? Everyone is the same and all exploit resources.” Tell women that they may have had bad experiences, but it is still important to keep the electoral process alive. Show Picture 11 and explain that one can select the best amongst the lot – and only then will better candidates come forward. This would make clear to the member that you cast your vote sensibly. If this practice continues then soon sincere people would also contest elections and we would vote for them because of their genuine attributes. (As shown in Picture 7).
4
Secrecy of Balloting (T2)
Tell women that we have so far established that voting is important. But does everyone have to vote for the same person? Tell women that even when two sisters go to the market to buy a dress, they generally come away with two different designs, colors, and fabric. Why does this happen? Because people may have different preferences. Explain that secrecy is a legal right and responsibility of every citizen. When you vote, you have the right to keep your vote confidential. No one may see you cast your vote, not even the election commission staff, polling agent, or another voter. It is only if a voter has a disability such as weak eyesight or a physical problem that can prevent you from stamping the ballot paper that you may seek assistance. Otherwise, any other presence would be considered illegal. Lack of ability to read or write does not justify any kind of assistance (since one does not need to read or write to understand the ballot paper). Show Picture 12 and explain the basic process of balloting as follows: (i) Voter enters the polling station; (ii) Polling officer inspects National ID Card; marks thumb with indelible ink and after calling the name and serial number of the voter, marks off her name from electoral list; (iii) The First Presiding Officer issues a ballot paper for the national assembly. She stamps and signs it on the reverse side and marks the counterfoil; (iv) The Second Presiding Officer issues ballot paper for provincial assembly. She stamps and signs it on the reverse side, and marks the counterfoil; (v) Voter goes to the polling booth and stamps on both the ballot papers; (vi) Voter puts her ballot in the specified ballot boxes; (vii) Voter leaves the polling station. Tell the women that to keep voting confidential, all polling stations will be equipped with a Voter Screen. This screen will ensure that no one sees you while stamping the ballot paper. Show Picture 13 and highlight that the Election Commission has undertaken special arrangements to make voting easy for women – e.g. separate polling stations for women, female polling staff, and ensuring that polling stations and polling booths are located in easy to reach places, e.g. nearby schools. Show Picture 14 and explain the right procedure of balloting. Show how the ballot should be stamped and more importantly folded, and then put in the appropriate ballot box i.e. green ballot paper into green ballot box and white ballot paper into the white ballot box. Ask the women, how many of them have voted before? Ask them how they have felt after casting the vote? Some may say nervous or afraid while others may say satisfied. Show Picture 15 and explain that as shown in the picture, once a voter comes out everyone is interested in knowing whom she has voted for. Tell the women that this should not make them anxious or nervous. If they want, they can make everyone happy!
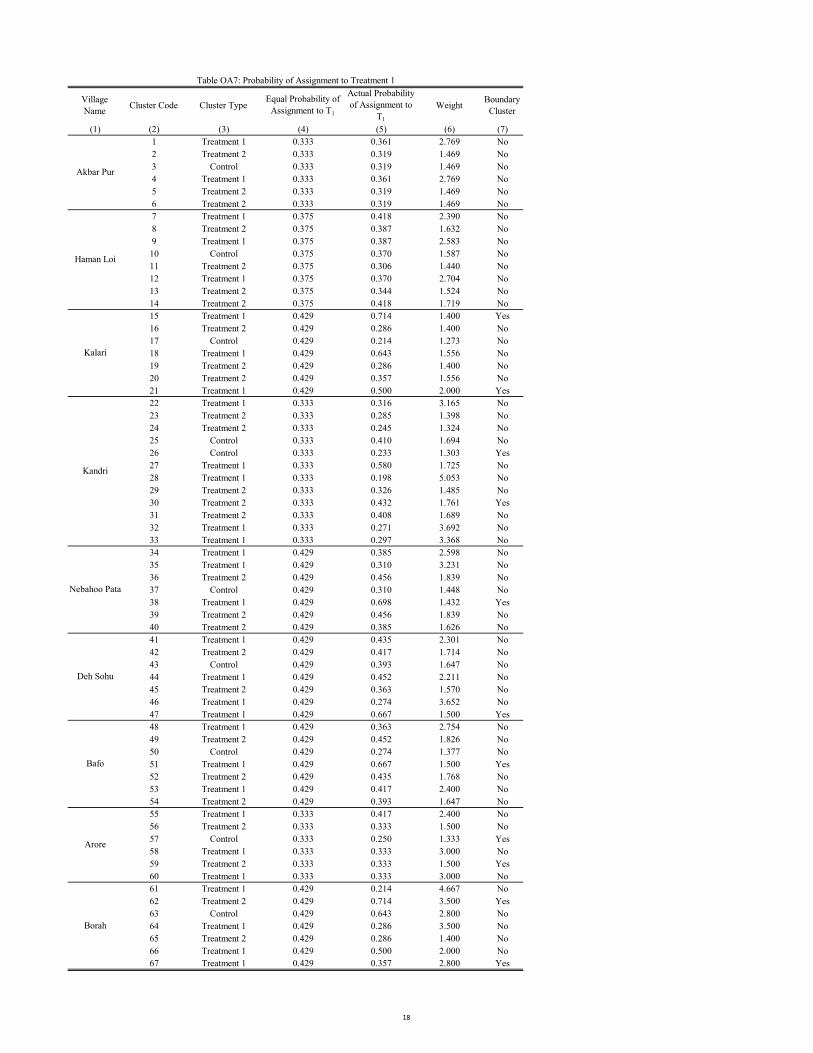
Section OA5. Cluster probability of assignment to T1
In this section we describe how the probability of assignment to T1 for each cluster is computed. We use
as an example village Deh Sohu that has 7 clusters arranged in the following manner (ignoring gap clusters):
1 2 3
4 5 6
7
Columns 1 to 7 of the Online Appendix Table OA4 reports all the possible paths --order in which
clusters could be visited-- that the field team could have taken if clusters were arranged as above. Column 8
reports the probabilities associated with them. As an example, the first ordering is “1 2 3 6 5 4 7” and the
probability is ½*½= ¼, because after visiting cluster 1, the field team could have moved to cluster 2 with a
probability of ½ (instead of moving to cluster 4), and then after cluster 2, the team could have moved to cluster
3 also with a probability of ½ (instead of moving to cluster 5). After cluster 3, then the team had to visit 6, 5, 4
and 7.
Since the first, fourth and seventh clusters visited received T1, while the others were assigned to either
T2 or control with the same probability, columns 8 to 15 record the probability that a given cluster is assigned to
T1 for each path or ordering of clusters. The sum of these probabilities (in bold) yields the actual probability of
assignment of each cluster to T1.
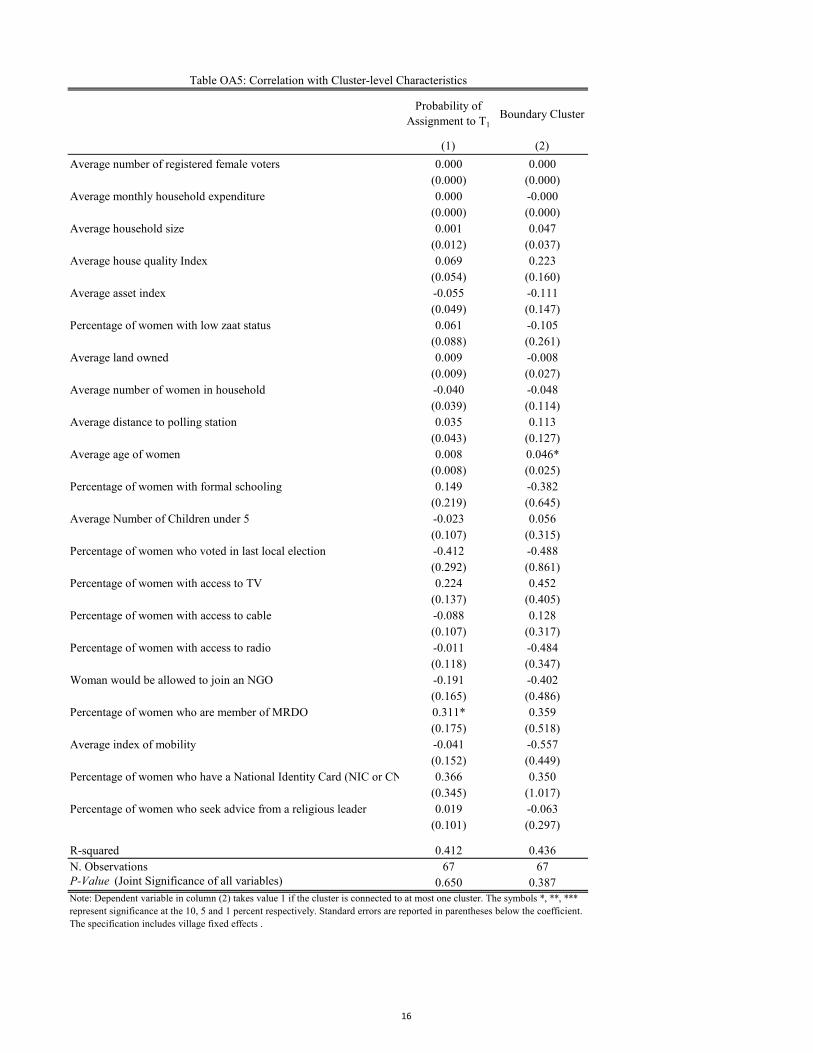
We now check that the probability of assignment to T1 is orthogonal to cluster characteristics. Column 1
of Online Appendix Table OA5 reports that among 21 cluster characteristics, only one is statistically correlated
with the probability of assignment to T1. More formally, we cannot reject that all the coefficients associated to
cluster characteristics are jointly zero (p-value = 0.650).
Boundary Clusters
Given that the probability of assignment to T1 varies by cluster, we assess whether clusters on the village
boundaries are more likely to have probabilities that are different from that if clusters had the same probability
of assignment.
9
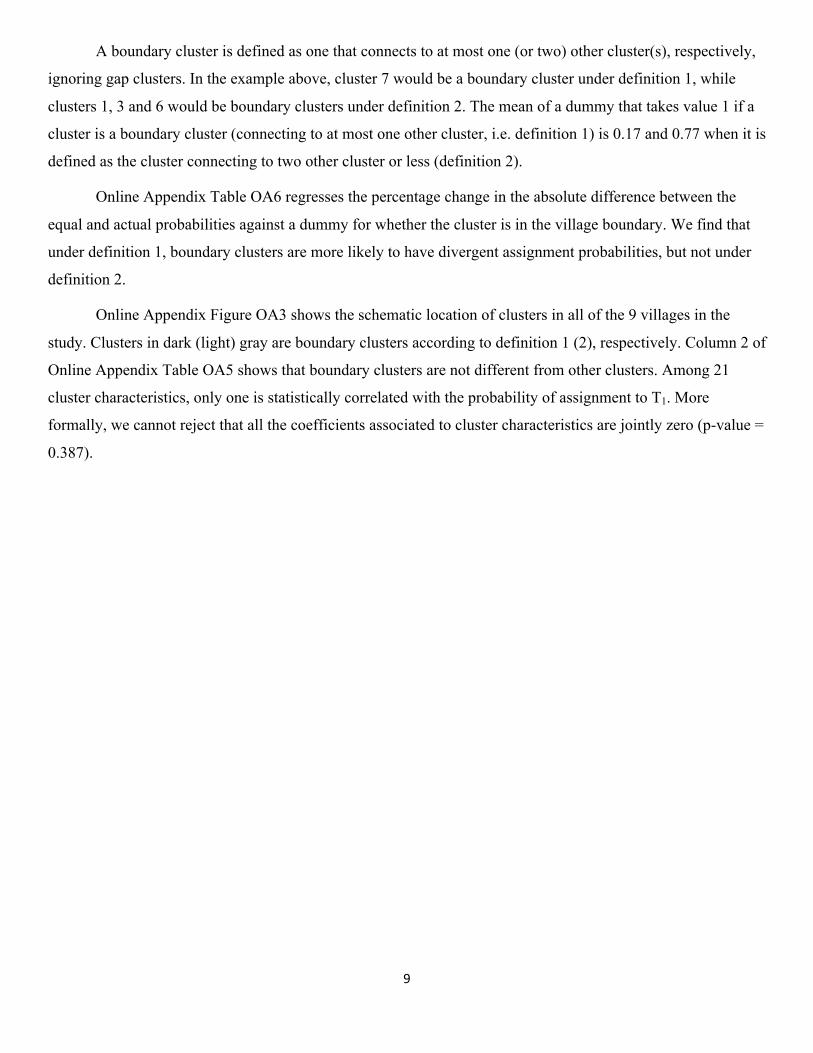
A boundary cluster is defined as one that connects to at most one (or two) other cluster(s), respectively,
ignoring gap clusters. In the example above, cluster 7 would be a boundary cluster under definition 1, while
clusters 1, 3 and 6 would be boundary clusters under definition 2. The mean of a dummy that takes value 1 if a
cluster is a boundary cluster (connecting to at most one other cluster, i.e. definition 1) is 0.17 and 0.77 when it is
defined as the cluster connecting to two other cluster or less (definition 2).
Online Appendix Table OA6 regresses the percentage change in the absolute difference between the
equal and actual probabilities against a dummy for whether the cluster is in the village boundary. We find that
under definition 1, boundary clusters are more likely to have divergent assignment probabilities, but not under
definition 2.
Online Appendix Figure OA3 shows the schematic location of clusters in all of the 9 villages in the
study. Clusters in dark (light) gray are boundary clusters according to definition 1 (2), respectively. Column 2 of
Online Appendix Table OA5 shows that boundary clusters are not different from other clusters. Among 21
cluster characteristics, only one is statistically correlated with the probability of assignment to T1. More
formally, we cannot reject that all the coefficients associated to cluster characteristics are jointly zero (p-value =
0.387).
10
Section OA6: Robustness Checks
The results in tables 4, 5, 7, 8, and 10 in the main text control for the fact that the probability of
assignment to T1 varies from cluster to cluster by running weighted least squares. Online Appendix Tables
OA11 to OA15 provide the following robustness checks to the results in the main text.
First, we run the same specification as in the text but excluding covariates. Second, we run an ordinary
least squares specification that includes as covariate the probability that the cluster is assigned to T1. Third, we
drop from the regression the sample of boundary clusters (using definition 1) and run an ordinary least squares
regression.
By and large we find that the point estimates and significant levels are similar across columns,
suggesting that the inclusion of covariates or sample used do not affect the results and that the probability of
assignment to T1, although varying, are not correlated with outcomes.
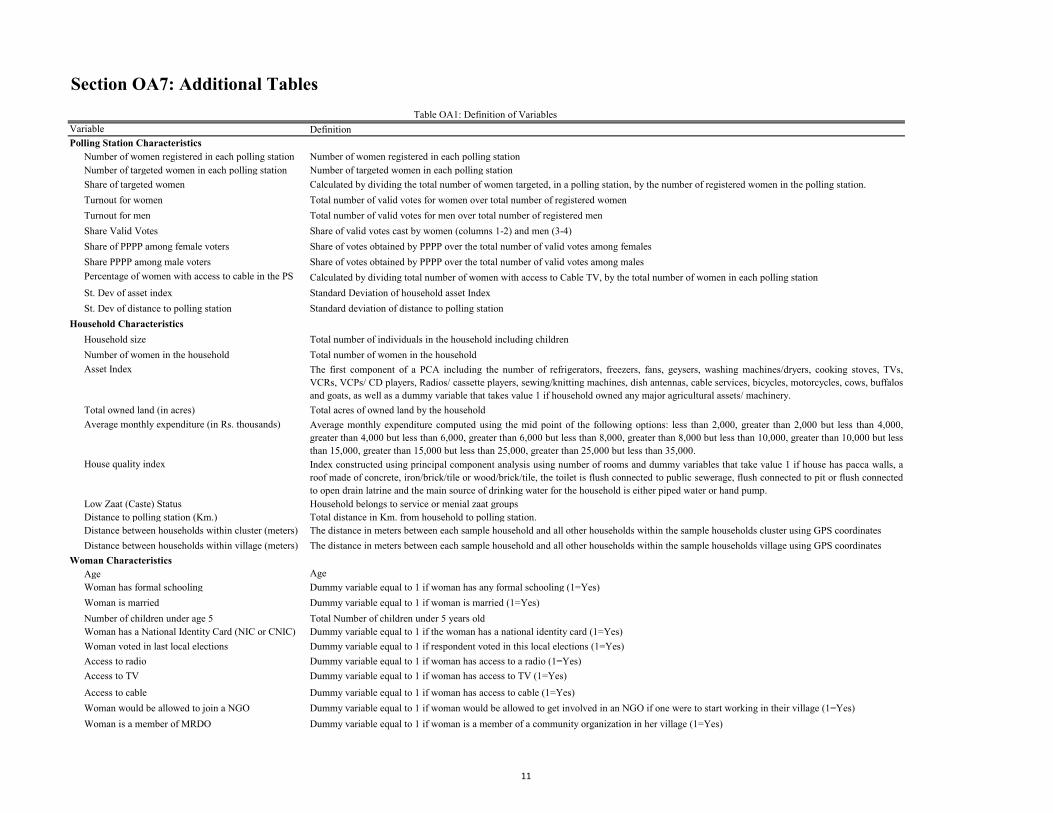
Section OA7: Additional Tables
DefinitionPolling Station Characteristics
Number of women registered in each polling station Number of women registered in each polling stationNumber of targeted women in each polling station Number of targeted women in each polling stationShare of targeted women Calculated by dividing the total number of women targeted, in a polling station, by the number of registered women in the polling station.Turnout for women Total number of valid votes for women over total number of registered womenTurnout for men Total number of valid votes for men over total number of registered menShare Valid Votes Share of valid votes cast by women (columns 1-2) and men (3-4)Share of PPPP among female voters Share of votes obtained by PPPP over the total number of valid votes among femalesShare PPPP among male voters Share of votes obtained by PPPP over the total number of valid votes among malesPercentage of women with access to cable in the PS Calculated by dividing total number of women with access to Cable TV, by the total number of women in each polling stationSt. Dev of asset index Standard Deviation of household asset IndexSt. Dev of distance to polling station Standard deviation of distance to polling station
Household CharacteristicsHousehold size Total number of individuals in the household including childrenNumber of women in the household Total number of women in the householdAsset Index The first component of a PCA including the number of refrigerators, freezers, fans, geysers, washing machines/dryers, cooking stoves, TVs,
VCRs, VCPs/ CD players, Radios/ cassette players, sewing/knitting machines, dish antennas, cable services, bicycles, motorcycles, cows, buffalosand goats, as well as a dummy variable that takes value 1 if household owned any major agricultural assets/ machinery.
Total owned land (in acres) Total acres of owned land by the householdAverage monthly expenditure (in Rs. thousands) Average monthly expenditure computed using the mid point of the following options: less than 2,000, greater than 2,000 but less than 4,000,
greater than 4,000 but less than 6,000, greater than 6,000 but less than 8,000, greater than 8,000 but less than 10,000, greater than 10,000 but lessthan 15,000, greater than 15,000 but less than 25,000, greater than 25,000 but less than 35,000.
House quality index Index constructed using principal component analysis using number of rooms and dummy variables that take value 1 if house has pacca walls, aroof made of concrete, iron/brick/tile or wood/brick/tile, the toilet is flush connected to public sewerage, flush connected to pit or flush connectedto open drain latrine and the main source of drinking water for the household is either piped water or hand pump.
Low Zaat (Caste) Status Household belongs to service or menial zaat groupsDistance to polling station (Km.) Total distance in Km. from household to polling station.Distance between households within cluster (meters) The distance in meters between each sample household and all other households within the sample households cluster using GPS coordinates Distance between households within village (meters) The distance in meters between each sample household and all other households within the sample households village using GPS coordinates
Woman CharacteristicsAge AgeWoman has formal schooling Dummy variable equal to 1 if woman has any formal schooling (1=Yes) Woman is married Dummy variable equal to 1 if woman is married (1=Yes)Number of children under age 5 Total Number of children under 5 years old Woman has a National Identity Card (NIC or CNIC) Dummy variable equal to 1 if the woman has a national identity card (1=Yes)Woman voted in last local elections Dummy variable equal to 1 if respondent voted in this local elections (1=Yes)Access to radio Dummy variable equal to 1 if woman has access to a radio (1=Yes)Access to TV Dummy variable equal to 1 if woman has access to TV (1=Yes)
Access to cable Dummy variable equal to 1 if woman has access to cable (1=Yes)Woman would be allowed to join a NGO Dummy variable equal to 1 if woman would be allowed to get involved in an NGO if one were to start working in their village (1=Yes)Woman is a member of MRDO Dummy variable equal to 1 if woman is a member of a community organization in her village (1=Yes)
Table OA1: Definition of Variables Variable
11
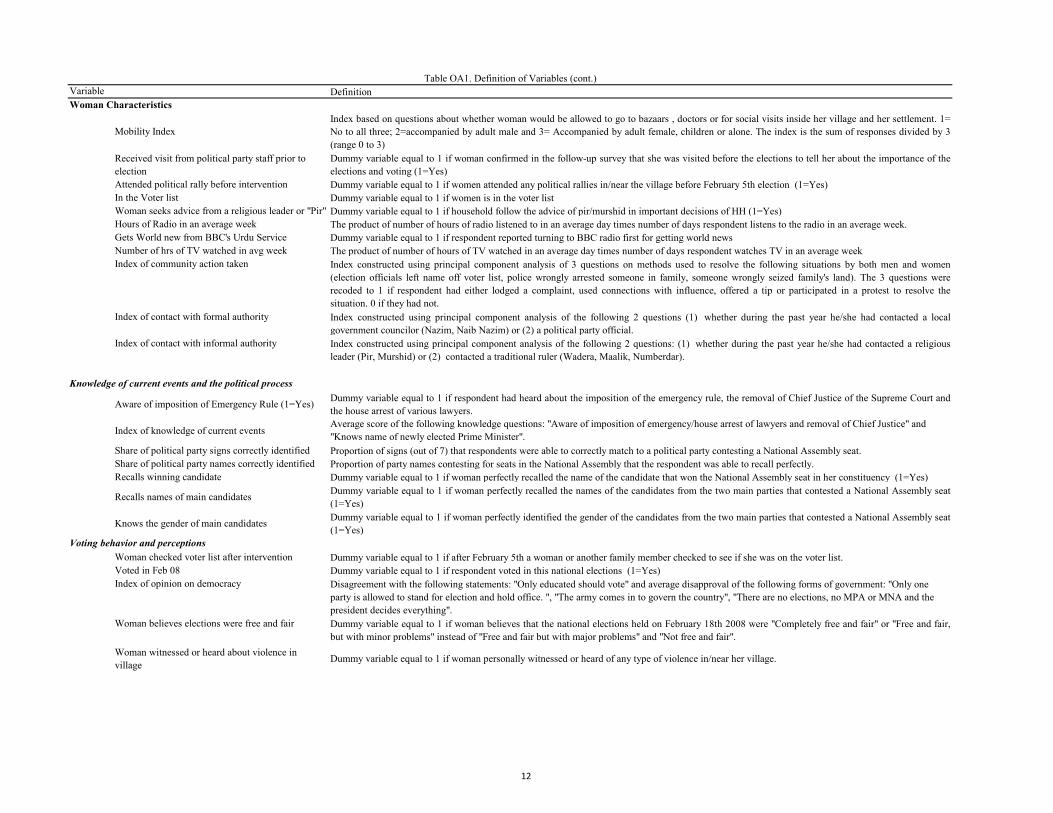
DefinitionWoman Characteristics
Mobility Index Index based on questions about whether woman would be allowed to go to bazaars , doctors or for social visits inside her village and her settlement. 1=No to all three; 2=accompanied by adult male and 3= Accompanied by adult female, children or alone. The index is the sum of responses divided by 3(range 0 to 3)
Received visit from political party staff prior to election
Dummy variable equal to 1 if woman confirmed in the follow-up survey that she was visited before the elections to tell her about the importance of theelections and voting (1=Yes)
Attended political rally before intervention Dummy variable equal to 1 if women attended any political rallies in/near the village before February 5th election (1=Yes)In the Voter list Dummy variable equal to 1 if women is in the voter listWoman seeks advice from a religious leader or "Pir" Dummy variable equal to 1 if household follow the advice of pir/murshid in important decisions of HH (1=Yes)Hours of Radio in an average week The product of number of hours of radio listened to in an average day times number of days respondent listens to the radio in an average week.Gets World new from BBC's Urdu Service Dummy variable equal to 1 if respondent reported turning to BBC radio first for getting world newsNumber of hrs of TV watched in avg week The product of number of hours of TV watched in an average day times number of days respondent watches TV in an average weekIndex of community action taken Index constructed using principal component analysis of 3 questions on methods used to resolve the following situations by both men and women
(election officials left name off voter list, police wrongly arrested someone in family, someone wrongly seized family's land). The 3 questions wererecoded to 1 if respondent had either lodged a complaint, used connections with influence, offered a tip or participated in a protest to resolve thesituation. 0 if they had not.
Index of contact with formal authority Index constructed using principal component analysis of the following 2 questions (1) whether during the past year he/she had contacted a localgovernment councilor (Nazim, Naib Nazim) or (2) a political party official.
Index of contact with informal authority Index constructed using principal component analysis of the following 2 questions: (1) whether during the past year he/she had contacted a religiousleader (Pir, Murshid) or (2) contacted a traditional ruler (Wadera, Maalik, Numberdar).
Knowledge of current events and the political process
Aware of imposition of Emergency Rule (1=Yes) Dummy variable equal to 1 if respondent had heard about the imposition of the emergency rule, the removal of Chief Justice of the Supreme Court andthe house arrest of various lawyers.
Index of knowledge of current eventsAverage score of the following knowledge questions: "Aware of imposition of emergency/house arrest of lawyers and removal of Chief Justice" and "Knows name of newly elected Prime Minister".
Share of political party signs correctly identified Proportion of signs (out of 7) that respondents were able to correctly match to a political party contesting a National Assembly seat.Share of political party names correctly identified Proportion of party names contesting for seats in the National Assembly that the respondent was able to recall perfectly.Recalls winning candidate Dummy variable equal to 1 if woman perfectly recalled the name of the candidate that won the National Assembly seat in her constituency (1=Yes)
Recalls names of main candidates Dummy variable equal to 1 if woman perfectly recalled the names of the candidates from the two main parties that contested a National Assembly seat(1=Yes)
Knows the gender of main candidates Dummy variable equal to 1 if woman perfectly identified the gender of the candidates from the two main parties that contested a National Assembly seat(1=Yes)
Voting behavior and perceptionsWoman checked voter list after intervention Dummy variable equal to 1 if after February 5th a woman or another family member checked to see if she was on the voter list.Voted in Feb 08 Dummy variable equal to 1 if respondent voted in this national elections (1=Yes)Index of opinion on democracy Disagreement with the following statements: "Only educated should vote" and average disapproval of the following forms of government: "Only one
party is allowed to stand for election and hold office. ", "The army comes in to govern the country", "There are no elections, no MPA or MNA and the president decides everything".
Woman believes elections were free and fair Dummy variable equal to 1 if woman believes that the national elections held on February 18th 2008 were "Completely free and fair" or "Free and fair,but with minor problems" instead of "Free and fair but with major problems" and "Not free and fair".
Woman witnessed or heard about violence in village Dummy variable equal to 1 if woman personally witnessed or heard of any type of violence in/near her village.
Table OA1. Definition of Variables (cont.)Variable
12
Female Male
(1) (2) (3) (4)Panel A: Access to Media
Access to Radio (1=Yes) 3,611 0.48 0.42 0.025Number of hours of radio listened to in an average week 1,678 9.66 9.63 0.955Access to TV (1=Yes) 3,611 0.70 0.63 0.004Number of hours of TV watched in an average week 2,354 15.34 11.03 0.000Access to cable TV (1=Yes) 3,611 0.30 0.23 0.001Listens to BBC's Urdu service for world news (1=Yes) 1,669 0.11 0.48 0.000
Panel B: Knowledge of Political Parties and ElectionsShare of political party signs correctly identified 3,611 0.28 0.42 0.000Share of political party names correctly identified 3,611 0.86 0.96 0.000Knows the gender of main candidates (1=Yes) 3,611 0.95 0.98 0.548Share of names of main candidates correctly identified 3,611 0.82 0.86 0.442Recalls winning candidate (1=Yes) 3,611 0.90 0.95 0.200Aware of Emergency Rule (1=Yes) 3,611 0.13 0.51 0.000
Panel C: Participation in Public LifeAttends community meetings (1=Yes) 1,902 0.18 0.52 0.000Attends demonstrations (1=Yes) 1,902 0.12 0.23 0.000Attended political rally before intervention (1=Yes) 1,904 0.05 0.24 0.000Takes action
If name missing in voter list (1=Yes) 1,902 0.76 0.92 0.000If police mistakenly arrest family member (1=Yes) 1,902 0.93 0.98 0.000If family land is seized (1=Yes) 1,902 0.92 0.98 0.000
Index of community action taken 1,902 -0.30 0.69 0.000Contacts local councilor (1=Yes) 1,902 0.25 0.37 0.000Contacts a local political party official (1=Yes) 1,902 0.22 0.38 0.000Index of formal authority contact 1,902 -0.11 0.34 0.000Contacts a religious leader (1=Yes) 1,902 0.66 0.49 0.000Contacts a traditional ruler (1=Yes) 1,902 0.45 0.32 0.0001,902 0.00Index of informal authority contact 1,902 0.13 -0.30 0.000
Note: Data come from follow-up survey. In all panels, male refers to the head of the household. In Panels A and B, female refers to all females in the household. In Panel C, the female selected is the household head's wife. P -values are calculated from a regression of each variable on a gender dummy. All regressions include a village fixed effect. Standard errors are clustered at the geographical cluster level.
Means Table OA2: Gender Differences
P-value (2)-(3)
N. Obs
13
Mean of study
villages
Mean of all draws from
other villages in
study districts
Mean of all draws
from other
villages in Sindh
(1) (2) (3) (4) (5) (6) (7)5th 95th 5th 95th
Total village area 2849.22 3882.29 -3042.67 706.33 4918.39 -8658.44 347.44Percentage cultivated area in village 0.62 0.48 -0.01 0.31 0.33 0.16 0.44Number of settlements in the village 7.22 6.95 -2.67 2.78 9.22 -6.33 1.44Village has a post office 0.22 0.14 -0.11 0.22 0.10 -0.11 0.22Village has at least one primary school for boys 1.00 0.85 0.00 0.44 0.91 0.00 0.22Village has at least one primary school for girls 0.89 0.62 0.00 0.67 0.66 0.00 0.44Any industry in the village 0.00 0.07 -0.33 0.00 0.08 -0.22 0.00Village has all bricked roads 0.00 0.00 -0.11 0.00 0.00 0.00 0.00Village has all "Pacca" houses 0.22 0.08 0.00 0.22 0.03 0.11 0.22At least some households in the village have electricity 1.00 0.85 0.00 0.44 0.84 0.00 0.33Village has at least one retail market 0.11 0.09 -0.11 0.11 0.07 -0.11 0.11Village has a water filtration system/plant 0.22 0.07 0.00 0.22 0.05 0.00 0.22
Table OA3: Characteristics of Sample Villages Compared to All Other Villages in Study Districts and Sindh Province
Difference in mean values at the 5th
and 95th percentile of the distribution in study districts
Difference in mean values at the 5th and 95th percentile of the distribution in all of
Sindh
Note: Source Mouza (Village) Census 2008. Column 1 shows the mean for sample villages of a range of village characteristics; Column 2 shows the mean for all other villages (601) in the same districts as the sample villages and column 5 shows the same mean for all other villages across the province (5274). Columns 3 and 4 and 6 and 7 show the distribution at the 5th and 95th percentile of the difference between the mean of the sample village and the mean of each of 100 random draws of 9 villages each (from either the sample districts or all of Sindh province).
(0.012) (0.037)Average house quality Index 0.069 0.223
(0.054) (0.160)Average asset index -0.055 -0.111
(0.049) (0.147)Percentage of women with low zaat status 0.061 -0.105
(0.088) (0.261)Average land owned 0.009 -0.008
(0.009) (0.027)Average number of women in household -0.040 -0.048
(0.039) (0.114)Average distance to polling station 0.035 0.113
(0.043) (0.127)Average age of women 0.008 0.046*
(0.008) (0.025)Percentage of women with formal schooling 0.149 -0.382
(0.219) (0.645)Average Number of Children under 5 -0.023 0.056
(0.107) (0.315)Percentage of women who voted in last local election -0.412 -0.488
(0.292) (0.861)Percentage of women with access to TV 0.224 0.452
(0.137) (0.405)Percentage of women with access to cable -0.088 0.128
(0.107) (0.317)Percentage of women with access to radio -0.011 -0.484
(0.118) (0.347)Woman would be allowed to join an NGO -0.191 -0.402
(0.165) (0.486)Percentage of women who are member of MRDO 0.311* 0.359
(0.175) (0.518)Average index of mobility -0.041 -0.557
(0.152) (0.449)Percentage of women who have a National Identity Card (NIC or CNIC) 0.366 0.350
(0.345) (1.017)Percentage of women who seek advice from a religious leader 0.019 -0.063
(0.101) (0.297)
R-squared 0.412 0.436N. Observations 67 67P-Value (Joint Significance of all variables) 0.650 0.387
Table OA5: Correlation with Cluster-level Characteristics
Note: Dependent variable in column (2) takes value 1 if the cluster is connected to at most one cluster. The symbols *, **, *** represent significance at the 10, 5 and 1 percent respectively. Standard errors are reported in parentheses below the coefficient. The specification includes village fixed effects .
16
(1) (2)
Boundary Cluster 1 0.177***(0.054)
Boundary Cluster 2 -0.004(0.055)
R-squared 0.437 0.331N. Observations 67 67Note: Boundary Cluster 1 takes value 1 if the cluster is connected to at most one cluster. Boundary Cluster 2 takes value 1 if the cluster is connected to two other clusters or less. Refer to Online Appendix Section OA5. The symbols *, **, *** represent significance at the 10, 5 and 1 percent respectively. Standard errors are reported in parentheses below the coefficient. The specification includes village fixed effects .
Table OA6: Divergent Assignment Probabilities for Treatment 1Percentage Change in the Absolute Difference
between Equal and Actual Probabilities of being assigned to T1
Table OA7: Probability of Assignment to Treatment 1
Akbar Pur
Haman Loi
Kalari
Kandri
Nebahoo Pata
Deh Sohu
Bafo
Arore
Borah
18
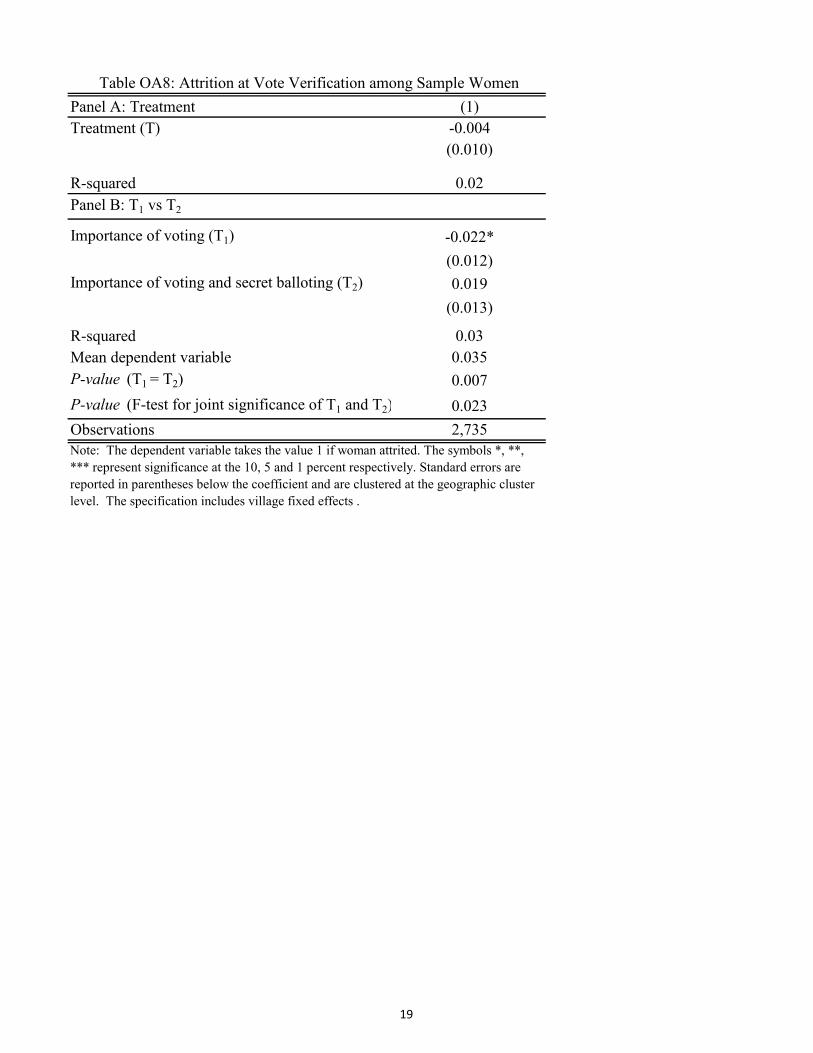
Panel A: Treatment (1)Treatment (T) -0.004
(0.010)
R-squared 0.02Panel B: T1 vs T2
Importance of voting (T1) -0.022*(0.012)
Importance of voting and secret balloting (T2) 0.019(0.013)
R-squared 0.03Mean dependent variable 0.035P-value (T1 = T2) 0.007P-value (F-test for joint significance of T1 and T2) 0.023Observations 2,735
Table OA8: Attrition at Vote Verification among Sample Women
Note: The dependent variable takes the value 1 if woman attrited. The symbols *, **, *** represent significance at the 10, 5 and 1 percent respectively. Standard errors are reported in parentheses below the coefficient and are clustered at the geographic cluster level. The specification includes village fixed effects .
19
Study Rest P-value(1) (2) (1)=(2)
Male 744 774 0.728Female 589 652 0.434
Male 0.485 0.449 0.278Female 0.576 0.306 0.000
Male 0.655 0.686 0.524Female 0.647 0.733 0.065
Table OA9: Turnout, Registered Voters and PPPP vote share by Gender
Note: There are 20 study polling stations and 1254 polling stations in districts Khairpur and Sukkur. Polling stations are mapped to 5 constituencies. Study villages were drawn from 2 of these. Column 1 for Panels A-C refers to the 20 study polling stations. Column 2 in Panel A refers to all other polling stations besides the 20 study polling stations in the 2 study constituencies. Column 2 in Panel B and C refer to only single gendered polling stations (excluding the study polling stations) in the 2 study constituencies.
Across Polling Stations
Panel A: Registered Voters
Panel B: Voter Turnout
Panel C: PPPP Vote share
20
ControlsN. Obs All T1 T2 T1 T2 C
(1) (2) (3) (4) (5) (6) (7)Panel A: Political discussions with women in own household
Discuss political issues (1=Yes, frequently) 2637 0.46 0.43 0.49 0.54 0.46 0.42Issues raised during conversations
Party/Candidate Positions 2122 0.90 0.90 0.91 0.90 0.87 0.91Importance of voting 2122 0.62 0.63 0.63 0.55 0.58 0.61Importance of voting in accordance to own preferences 2122 0.87 0.86 0.86 0.87 0.81 0.89
Panel B: Political discussions with close confidant Discuss political issues (1=Yes, frequently) 2637 0.41 0.38 0.43 0.47 0.35 0.42Issues raised during conversations
Party/Candidate Positions 2215 0.91 0.90 0.93 0.91 0.83 0.92Importance of voting 2215 0.64 0.65 0.64 0.60 0.59 0.64Importance of voting in accordance to own preferences 2215 0.87 0.87 0.88 0.85 0.85 0.89
Notes: Data come from follow-up survey. Columns (1) and (2) provide the number of observations and the sample mean. Columns (3) -(4) report data for targeted women. Columns (5)-(6) report data for untargeted women. Column (8) reports data for women in control clusters.
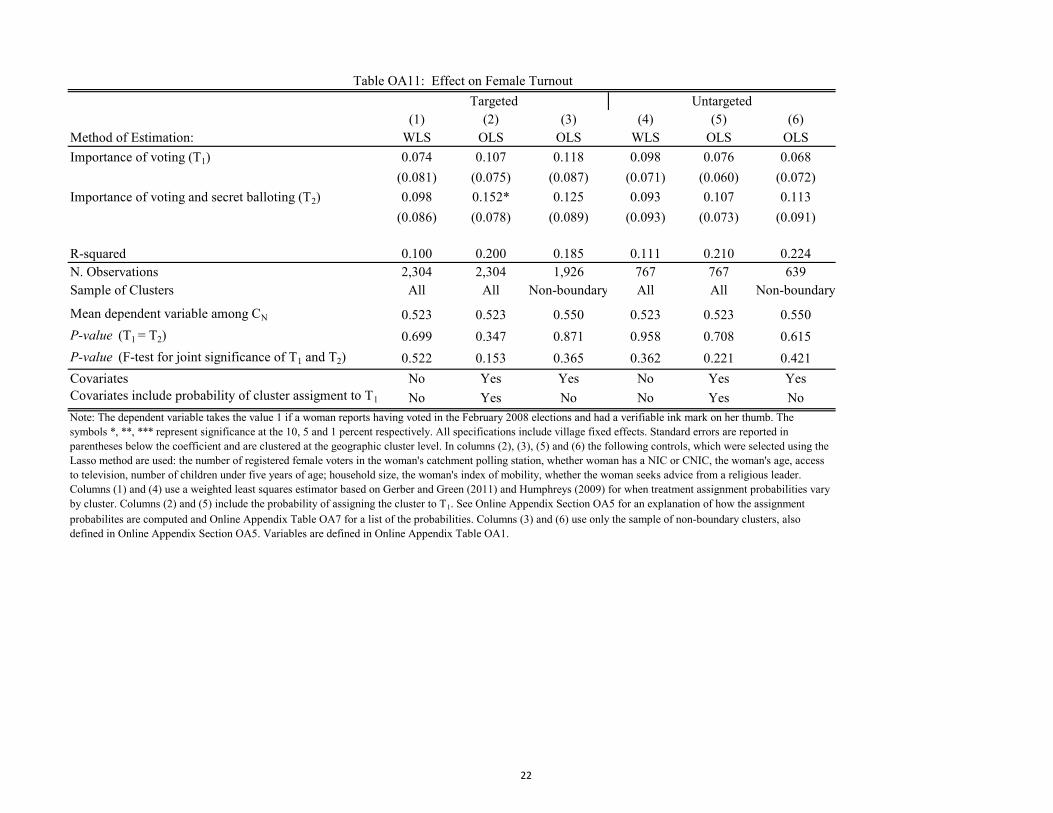
0.100 0.200 0.185 0.111 0.210 0.224N. Observations 2,304 2,304 1,926 767 767 639Sample of Clusters All All Non-boundary All All Non-boundary
Mean dependent variable among CN 0.523 0.523 0.550 0.523 0.523 0.550P-value (T1 = T2) 0.699 0.347 0.871 0.958 0.708 0.615P-value (F-test for joint significance of T1 and T2) 0.522 0.153 0.365 0.362 0.221 0.421Covariates No Yes Yes No Yes YesCovariates include probability of cluster assigment to T1 No Yes No No Yes NoNote: The dependent variable takes the value 1 if a woman reports having voted in the February 2008 elections and had a verifiable ink mark on her thumb. The symbols *, **, *** represent significance at the 10, 5 and 1 percent respectively. All specifications include village fixed effects. Standard errors are reported in parentheses below the coefficient and are clustered at the geographic cluster level. In columns (2), (3), (5) and (6) the following controls, which were selected using the Lasso method are used: the number of registered female voters in the woman's catchment polling station, whether woman has a NIC or CNIC, the woman's age, access to television, number of children under five years of age; household size, the woman's index of mobility, whether the woman seeks advice from a religious leader. Columns (1) and (4) use a weighted least squares estimator based on Gerber and Green (2011) and Humphreys (2009) for when treatment assignment probabilities vary by cluster. Columns (2) and (5) include the probability of assigning the cluster to T1. See Online Appendix Section OA5 for an explanation of how the assignment probabilites are computed and Online Appendix Table OA7 for a list of the probabilities. Columns (3) and (6) use only the sample of non-boundary clusters, also defined in Online Appendix Section OA5. Variables are defined in Online Appendix Table OA1.
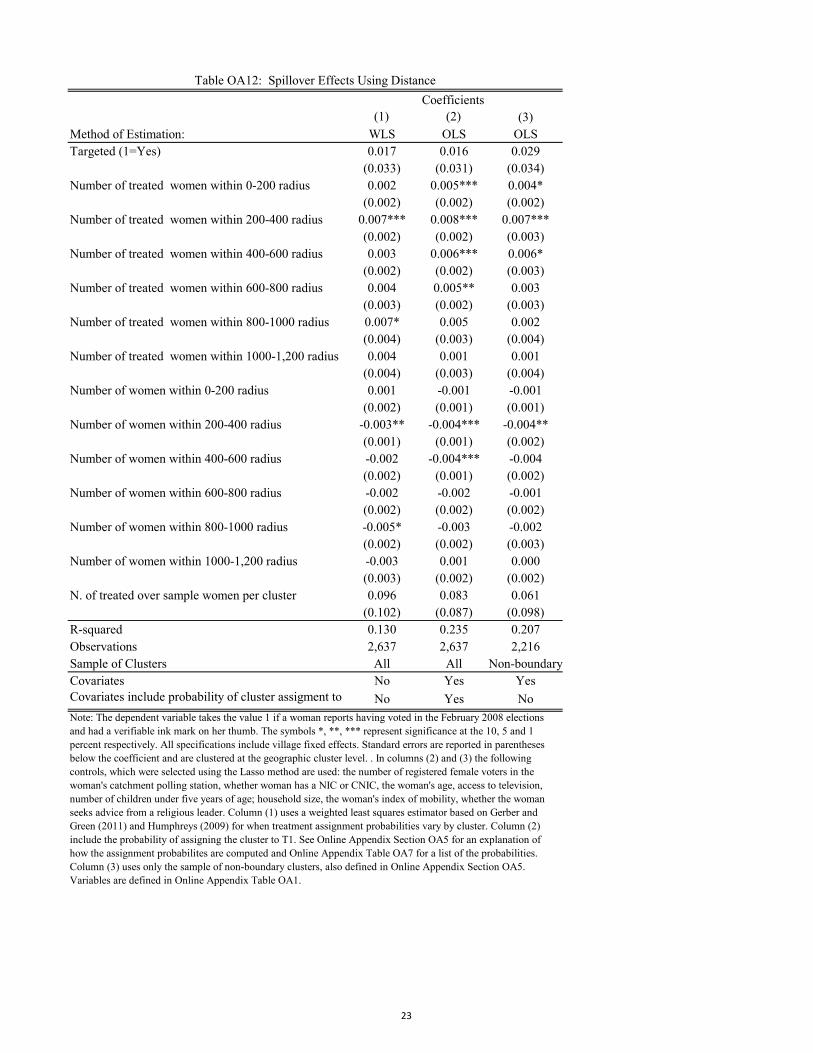
(0.033) (0.031) (0.034)Number of treated women within 0-200 radius 0.002 0.005*** 0.004*
(0.002) (0.002) (0.002)Number of treated women within 200-400 radius 0.007*** 0.008*** 0.007***
(0.002) (0.002) (0.003)Number of treated women within 400-600 radius 0.003 0.006*** 0.006*
(0.002) (0.002) (0.003)Number of treated women within 600-800 radius 0.004 0.005** 0.003
(0.003) (0.002) (0.003)Number of treated women within 800-1000 radius 0.007* 0.005 0.002
(0.004) (0.003) (0.004)Number of treated women within 1000-1,200 radius 0.004 0.001 0.001
(0.004) (0.003) (0.004)Number of women within 0-200 radius 0.001 -0.001 -0.001
(0.002) (0.001) (0.001)Number of women within 200-400 radius -0.003** -0.004*** -0.004**
(0.001) (0.001) (0.002)Number of women within 400-600 radius -0.002 -0.004*** -0.004
(0.002) (0.001) (0.002)Number of women within 600-800 radius -0.002 -0.002 -0.001
(0.002) (0.002) (0.002)Number of women within 800-1000 radius -0.005* -0.003 -0.002
(0.002) (0.002) (0.003)Number of women within 1000-1,200 radius -0.003 0.001 0.000
(0.003) (0.002) (0.002)N. of treated over sample women per cluster 0.096 0.083 0.061
(0.102) (0.087) (0.098)R-squared 0.130 0.235 0.207Observations 2,637 2,637 2,216Sample of Clusters All All Non-boundaryCovariates No Yes YesCovariates include probability of cluster assigment to T1 No Yes No
Table OA12: Spillover Effects Using DistanceCoefficients
Note: The dependent variable takes the value 1 if a woman reports having voted in the February 2008 elections and had a verifiable ink mark on her thumb. The symbols *, **, *** represent significance at the 10, 5 and 1 percent respectively. All specifications include village fixed effects. Standard errors are reported in parentheses below the coefficient and are clustered at the geographic cluster level. . In columns (2) and (3) the following controls, which were selected using the Lasso method are used: the number of registered female voters in the woman's catchment polling station, whether woman has a NIC or CNIC, the woman's age, access to television, number of children under five years of age; household size, the woman's index of mobility, whether the woman seeks advice from a religious leader. Column (1) uses a weighted least squares estimator based on Gerber and Green (2011) and Humphreys (2009) for when treatment assignment probabilities vary by cluster. Column (2) include the probability of assigning the cluster to T1. See Online Appendix Section OA5 for an explanation of how the assignment probabilites are computed and Online Appendix Table OA7 for a list of the probabilities. Column (3) uses only the sample of non-boundary clusters, also defined in Online Appendix Section OA5. Variables are defined in Online Appendix Table OA1.
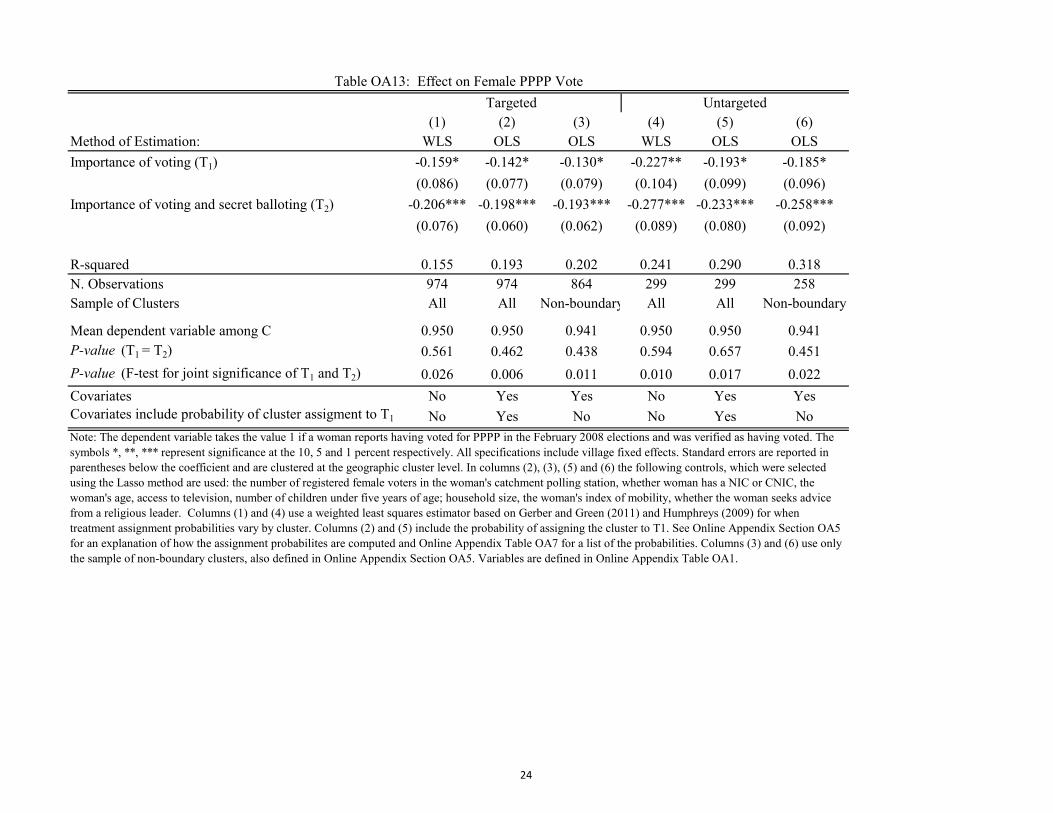
0.155 0.193 0.202 0.241 0.290 0.318N. Observations 974 974 864 299 299 258Sample of Clusters All All Non-boundary All All Non-boundary
Mean dependent variable among C 0.950 0.950 0.941 0.950 0.950 0.941P-value (T1 = T2) 0.561 0.462 0.438 0.594 0.657 0.451P-value (F-test for joint significance of T1 and T2) 0.026 0.006 0.011 0.010 0.017 0.022Covariates No Yes Yes No Yes YesCovariates include probability of cluster assigment to T1 No Yes No No Yes No
Table OA13: Effect on Female PPPP VoteTargeted Untargeted
Note: The dependent variable takes the value 1 if a woman reports having voted for PPPP in the February 2008 elections and was verified as having voted. The symbols *, **, *** represent significance at the 10, 5 and 1 percent respectively. All specifications include village fixed effects. Standard errors are reported in parentheses below the coefficient and are clustered at the geographic cluster level. In columns (2), (3), (5) and (6) the following controls, which were selected using the Lasso method are used: the number of registered female voters in the woman's catchment polling station, whether woman has a NIC or CNIC, the woman's age, access to television, number of children under five years of age; household size, the woman's index of mobility, whether the woman seeks advice from a religious leader. Columns (1) and (4) use a weighted least squares estimator based on Gerber and Green (2011) and Humphreys (2009) for when treatment assignment probabilities vary by cluster. Columns (2) and (5) include the probability of assigning the cluster to T1. See Online Appendix Section OA5 for an explanation of how the assignment probabilites are computed and Online Appendix Table OA7 for a list of the probabilities. Columns (3) and (6) use only the sample of non-boundary clusters, also defined in Online Appendix Section OA5. Variables are defined in Online Appendix Table OA1.
R-squared 0.056 0.076 0.082 0.113 0.147 0.164N. Observations 3200 3,200 2,839 914 914 807Sample of Clusters All All Non-boundary All All Non-boundary
Mean dependent variable among C 0.983 0.983 0.982 0.983 0.983 0.982P-value (T1=T2) 0.533 0.390 0.512 0.767 0.811 0.872P-value (Male Report x T1=Male Report x T2) 0.898 0.688 0.636 0.107 0.065 0.051Covariates No Yes Yes No Yes YesCovariates include probability of cluster assigment to T1 No Yes No No Yes No
Table OA14: Effect on Candidate Choice Using Cross Reports from Family Members
Note: The dependent variable takes the value 1 if a woman's self-report about candidate choice matches the report of the reportee, either another woman in the household or the male head. Each observation is therefore a pair with several observations for each woman. If a reporter believes that a woman did not vote or does not know whom she voted for, the dependent variable is coded as missing.The symbols *, **, *** represent significance at the 10, 5 and 1 percent respectively. All specifications include village fixed effects. Standard errors are reported in parentheses below the coefficient and are clustered at the geographic cluster level. In columns (2), (3), (5) and (6) the following controls, which were selected using the Lasso method are used: the number of registered female voters in the woman's catchment polling station, whether woman has a NIC or CNIC, the woman's age, access to television, number of children under five years of age; household size, the woman's index of mobility, whether the woman seeks advice from a religious leader. Columns (1) and (4) use a weighted least squares estimator based on Gerber and Green (2011) and Humphreys (2009) for when treatment assignment probabilities vary by cluster. Columns (2) and (5) include the probability of assigning the cluster to T1. See Online Appendix Section OA5 for an explanation of how the assignment probabilites are computed and Online Appendix Table OA7 for a list of the probabilities. Columns (3) and (6) use only the sample of non-boundary clusters, also defined in Online Appendix Section OA5. Variables are defined in Online Appendix Table OA1.
Targeted Untargeted
25
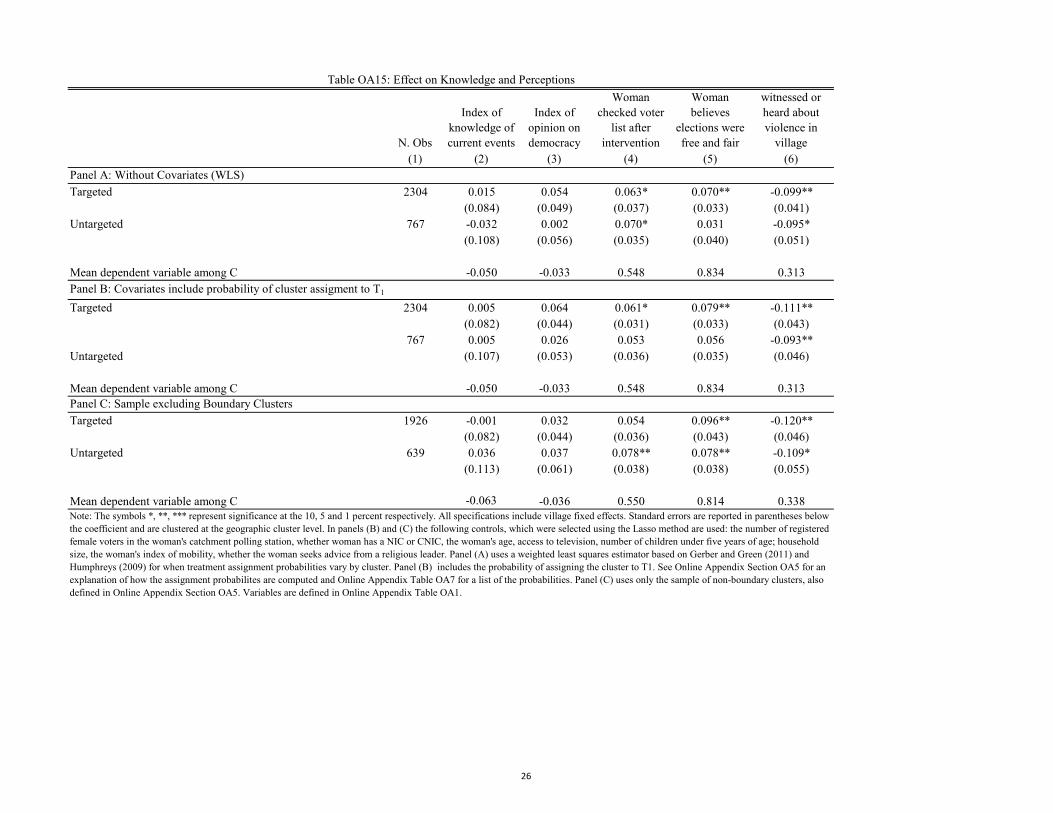
N. Obs
Index of knowledge of current events
Index of opinion on democracy
Woman checked voter
list after intervention
Woman believes
elections were free and fair
Woman witnessed or heard about violence in
village(1) (2) (3) (4) (5) (6)
Panel A: Without Covariates (WLS)2304 0.015 0.054 0.063* 0.070** -0.099**
Mean dependent variable among C -0.063 -0.036 0.550 0.814 0.338
Table OA15: Effect on Knowledge and Perceptions
Targeted
Untargeted
Note: The symbols *, **, *** represent significance at the 10, 5 and 1 percent respectively. All specifications include village fixed effects. Standard errors are reported in parentheses below the coefficient and are clustered at the geographic cluster level. In panels (B) and (C) the following controls, which were selected using the Lasso method are used: the number of registered female voters in the woman's catchment polling station, whether woman has a NIC or CNIC, the woman's age, access to television, number of children under five years of age; household size, the woman's index of mobility, whether the woman seeks advice from a religious leader. Panel (A) uses a weighted least squares estimator based on Gerber and Green (2011) and Humphreys (2009) for when treatment assignment probabilities vary by cluster. Panel (B) includes the probability of assigning the cluster to T1. See Online Appendix Section OA5 for an explanation of how the assignment probabilites are computed and Online Appendix Table OA7 for a list of the probabilities. Panel (C) uses only the sample of non-boundary clusters, also defined in Online Appendix Section OA5. Variables are defined in Online Appendix Table OA1.
Targeted
Untargeted
Targeted
Untargeted
26
WLS - Voted(1)
0.085(0.072)0.120
(0.072)0.099
(0.076)0.096
(0.084)
0.187N. Observations 2637Mean dependent variable among C 0.523P-value (T1=Untargeted x T1) 0.751P-value (T2=Untargeted x T2) 0.870
R-squared
Note: The dependent variable takes the value 1 if a woman reports having voted in the February 2008 elections and had a verifiable ink mark on her thumb. The symbols *, **, *** represent significance at the 10, 5 and 1 percent level respectively. Standard errors are reported in parentheses below the coefficient and are clustered at the geographic cluster level. The regression uses a weighted least squares estimator based on Gerber and Green (2011) and Humphreys (2009) for when treatment assignment probabilities vary by cluster. All specifications include village fixed effects and the following controls, which were selected using the Lasso method: the number of registered female voters in the woman's catchment polling station, whether woman has a NIC or CNIC, the woman's age, access to television, number of children under five years of age; household size, the woman's index of mobility, whether the woman seeks advice from a religious leader. Variables are defined in Online Appendix Table OA1.
Table OA16: Effect on Female Turnout (Pooled)
Importance of voting (T1)
Importance of voting and secret balloting (T2)
Untargeted x T1
Untargeted x T2
27
WLS - Voted for PPPP
(1)
-0.166*(0.083)
-0.232***(0.077)-0.198*(0.107)
-0.212**(0.101)
0.163N. Observations 1133Mean dependent variable among C 0.950P-value (T1=Untargeted x T1) 0.521P-value (T2=Untargeted x T2) 0.644
R-squared
Note: The dependent variable takes the value 1 if a woman reports having voted for PPPP in the February 2008 elections and was verified as having voted. The symbols *, **, *** represent significance at the 10, 5 and 1 percent respectively. Standard errors are reported in parentheses below the coefficient and are clustered at the geographic cluster level. The regression uses a weighted least squares estimator based on Gerber and Green (2011) and Humphreys (2009) for when treatment assignment probabilities vary by cluster. All specifications include village fixed effects and the following controls, which were selected using the Lasso method: the number of registered female voters in the woman's catchment polling station, whether woman has a NIC or CNIC, the woman's age, access to television, number of children under five years of age; household size, the woman's index of mobility, whether the woman seeks advice from a religious leader. Variables are defined in Online Appendix Table OA1.
Table OA17: Effect on Female PPPP Vote (Pooled)
Importance of voting (T1)
Importance of voting and secret balloting (T2)
Untargeted x T1
Untargeted x T2
28
29
Section OA8: Figures
Figure OA1: Section of Village with geographical clusters
Notes: The solid white lines delimit a geographical cluster. Note that the boundaries of clusters do not coincide with the natural boundaries of the village. The dots, squares, diamonds and triangles indicate the location of the study households. A dot denotes a household in a control cluster, a square (diamond) denotes a treated household in a T1 (T2) cluster and a triangle is a control household in a treated cluster (either T1 or T2). These three clusters are mapped to a polling station whose boundary falls outside the map.