24
Sidang Akhbar Prestasi Ekonomi pada Suku Kedua Tahun 2016 Gabenor Bank Negara Malaysia 12 Ogos 2016 Embargo Not for publication or broadcast before 1200 hours on Friday, 12 Aug 2016
Sidang Akhbar Prestasi Ekonomi pada Suku Kedua Tahun 2016
Gabenor Bank Negara Malaysia 12 Ogos 2016
Embargo
Not for publication or broadcast before 1200 hours on Friday, 12 Aug 2016

Sidang akhbar akan meliputi: • Prestasi ekonomi pada suku kedua tahun 2016
• Perkembangan monetari dan kewangan
• Sesi soal jawab
1

2
p Preliminary estimate a Advance estimate r Revised Source: National authorities
Moderate global economic expansion in 2Q 2016
2.2p 1.6
1.2a
6.7
5.2
4.0
3.2a
2.1r
0.7a
-2
-1
0
1
2
3
4
5
6
7
UK
Eur
o ar
ea
US
PR
Chi
na
Indo
nesi
a
Mal
aysi
a
Kor
ea
Sin
gapo
re
C. T
aipe
i
1Q 2016
2Q 2016
Modest growth in the advanced economies amid continued cyclical and structural weaknesses
Moderate growth in Asia, underpinned by domestic demand
Global Real GDP Growth Annual change (%)

3
Note: Figures do not necessarily add-up due to rounding Source: Department of Statistics, Malaysia
The Malaysian economy expanded by 4.0% in 2Q 2016
Domestic demand registered a stronger growth in 2Q 2016
• Higher growth contribution from private consumption and private investment
However, growth was set back by the continued decline in net exports and a drawdown in stocks
• Import growth exceeded exports following stronger investment activity
• Drawdown in stocks was due to lower production of palm oil and manufactured products
Contribution to Growth (percentage point)
2015 1Q 2016 2Q 2016
Real GDP 5.0 4.2 4.0
Domestic demand* 4.7 3.3 5.7
Private consumption 3.1 2.8 3.3
Private investment 1.1 0.4 1.1
Public sector 0.5 0.1 1.4
Change in stocks 0.6 2.0 -1.2
Net exports of G&S -0.4 -1.2 -0.6
*Excluding stocks
Contribution to GDP Growth
4
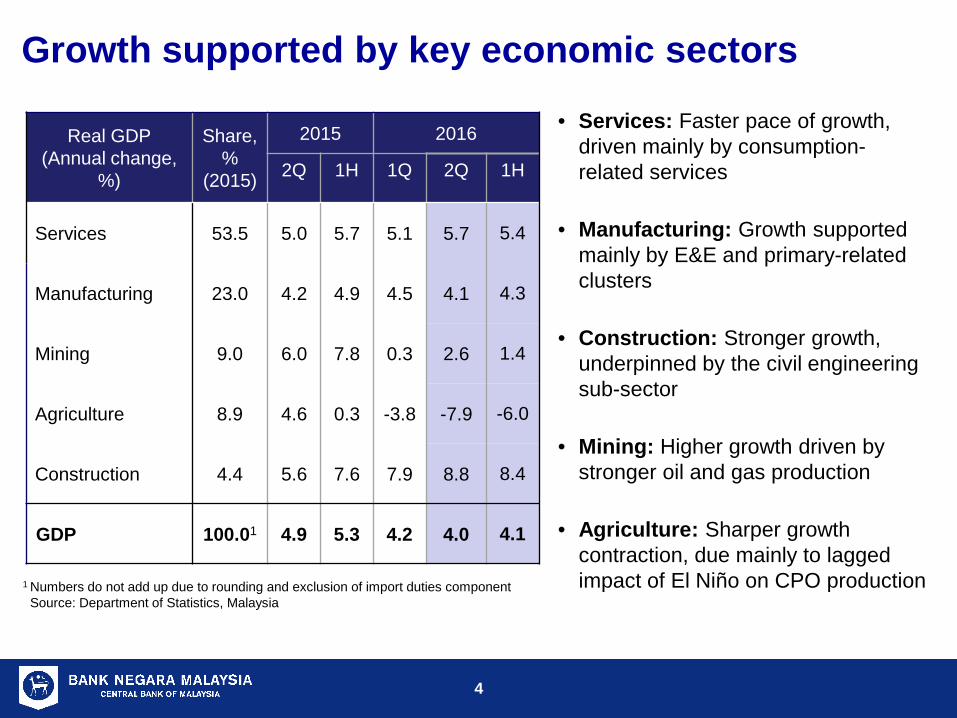
Growth supported by key economic sectors
1 Numbers do not add up due to rounding and exclusion of import duties component 1 Source: Department of Statistics, Malaysia
Real GDP (Annual change,
%)
Share, %
(2015)
2015 2016
2Q 1H 1Q 2Q 1H
Services 53.5 5.0 5.7 5.1 5.7 5.4
Manufacturing 23.0 4.2 4.9 4.5 4.1 4.3
Mining 9.0 6.0 7.8 0.3 2.6 1.4
Agriculture 8.9 4.6 0.3 -3.8 -7.9 -6.0
Construction 4.4 5.6 7.6 7.9 8.8 8.4
GDP 100.01 4.9 5.3 4.2 4.0 4.1
• Services: Faster pace of growth, driven mainly by consumption- related services
• Manufacturing: Growth supported mainly by E&E and primary-related clusters
• Construction: Stronger growth, underpinned by the civil engineering sub-sector
• Mining: Higher growth driven by stronger oil and gas production
• Agriculture: Sharper growth contraction, due mainly to lagged impact of El Niño on CPO production

Real GDP (Annual change, %)
Share, %
(2015)
2015 2016
2Q 1H 1Q 2Q 1H
Domestic demand (excluding stocks) 91.6 4.6 6.3 3.6 6.3 5.0
Private Sector 69.2 5.7 7.6 4.5 6.1 5.4
Consumption 52.4 6.4 7.7 5.3 6.3 5.8
Investment 16.9 3.9 7.4 2.2 5.6 4.0
Public Sector 22.4 0.9 1.8 0.4 6.9 3.6
Consumption 13.5 6.9 5.6 3.8 6.5 5.2
Investment 8.9 -8.1 -3.7 -4.5 7.5 1.1
Net exports of goods and services 8.6 -11.1 -10.5 -12.4 -7.0 -9.8
Exports 72.9 -4.0 -2.4 -0.5 1.0 0.2
Imports 64.3 -3.1 -1.1 1.3 2.0 1.6 Change in stocks (RM billion) -0.2 2.1 -0.6 2.4 -1.1 1.3
GDP (y-o-y) 100.01 4.9 5.3 4.2 4.0 4.1
GDP (q-o-q growth, seasonally adjusted) - 0.9 - 1.0 0.7 -
5
Private sector remained the anchor for growth
1 Numbers do not add up due to rounding 1 Source: Department of Statistics, Malaysia
• Higher domestic demand, driven by improvements in both the private and public sectors
• Private consumption supported by continued wage and income growth, and additional disposable income from Government measures
• Private investment driven by continued capital spending in services and manufacturing sectors
• Net exports registered a decline as real imports grew faster than exports
Source: Department of Statistics, Malaysia and Ministry of Human Resources
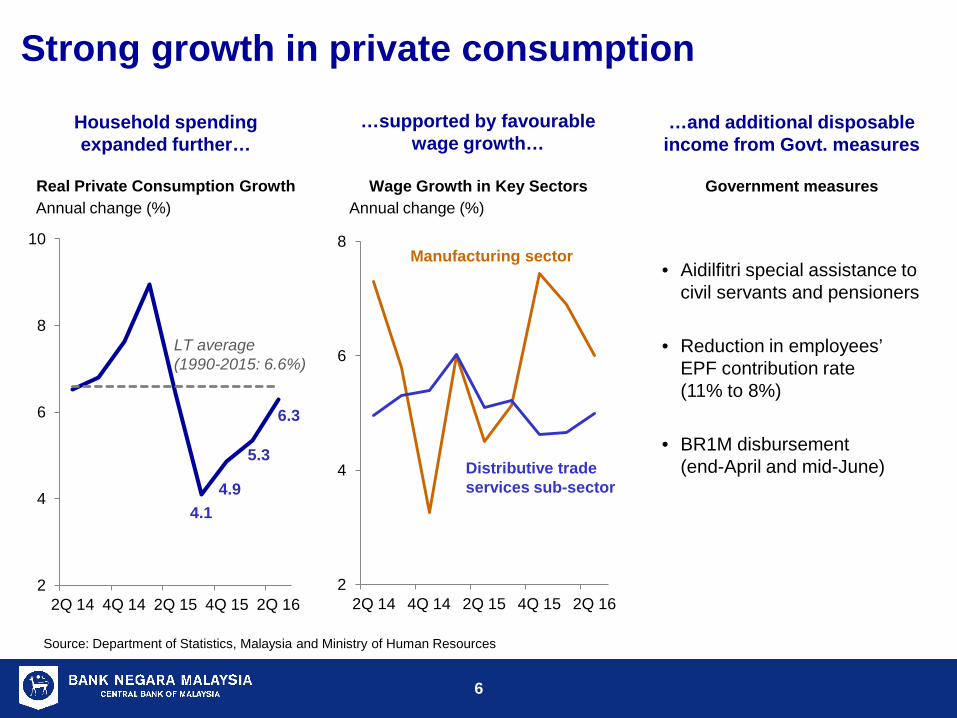
Strong growth in private consumption
Real Private Consumption Growth Annual change (%)
Wage Growth in Key Sectors Government measures Annual change (%)
Household spending expanded further…
…supported by favourable wage growth…
…and additional disposable income from Govt. measures
4.1 4.9
5.3
6.3
2
4
6
8
10
2Q 14 4Q 14 2Q 15 4Q 15 2Q 16 2
4
6
8
2Q 14 4Q 14 2Q 15 4Q 15 2Q 16
Manufacturing sector
Distributive trade services sub-sector
• Aidilfitri special assistance to civil servants and pensioners
• Reduction in employees’
EPF contribution rate (11% to 8%)
• BR1M disbursement
(end-April and mid-June)
LT average (1990-2015: 6.6%)
6

7
Private investment grew at a faster pace of 5.6%
Annual change (%)
Real Private Investment Growth
Higher growth in capital expenditure by the private sector
Source: Department of Statistics, Malaysia and Bank Negara Malaysia
4.9
2.2
5.6
5.9
8.1
-10
-5
0
5
10
15
20
0
2
4
6
8
10
12
14
16
18
20
2Q 14 4Q 14 2Q 15 4Q 15 2Q 16
Real Private Investment Growth (LHS)
Total Real Investment in Structures (RHS)
Total Real Investment in Machinery and Equipment (RHS)
Points
MIER Business Conditions Index (BCI)
Business sentiments have improved
Source: MIER
86.4 87.1
92.9
106.4
60
80
100
120
2Q 14 4Q 14 2Q 15 4Q 15 2Q 16
Optimum threshold (100 points)
Annual change (%)

8
Steady inflows of foreign direct investment
Note: Others comprises of agriculture and construction sector Source: Department of Statistics, Malaysia
RM bn Net FDI inflows in Malaysia
Recent FDI inflows remain above post-GFC averages
15.0
8.8
0
2
4
6
8
10
12
14
16
18
2Q 14 4Q 14 2Q 15 4Q 15 2Q 16
2009 - 2015 quarterly average: RM7.8bn
Bulk of FDI channelled into the manufacturing and services sector
Manufacturing 72%
Services 16%
Mining 11%
Others 1%
Net FDI inflows by Sector 2Q 2016: RM8.8 billion

… and higher net income payments contributed to smaller current account surplus
Smaller current account surplus due mainly to lower trade surplus and higher investment income
1.8 0.6
-9
-6
-3
0
3
6
9
12
-30
-20
-10
0
10
20
30
40
2Q 14 4Q14 2Q15 4Q15 2Q16
Goods Services Primary income Secondary income CAB % of GNI
RM bn % of GNI
Current account balance (RHS)
Source: Department of Statistics, Malaysia
9
23.9
17.9
1.0 1.4
-0.4
3.1
-16
-12
-8
-4
0
4
8
12
16
20
24
28
32
2Q 14 4Q 14 2Q 15 4Q 15 2Q 16 -10
-5
0
5
10
15
20
Imports
Exports
% yoy RM bn
Trade balance (RHS)
Lower trade surplus due mainly to higher imports for investment and production…
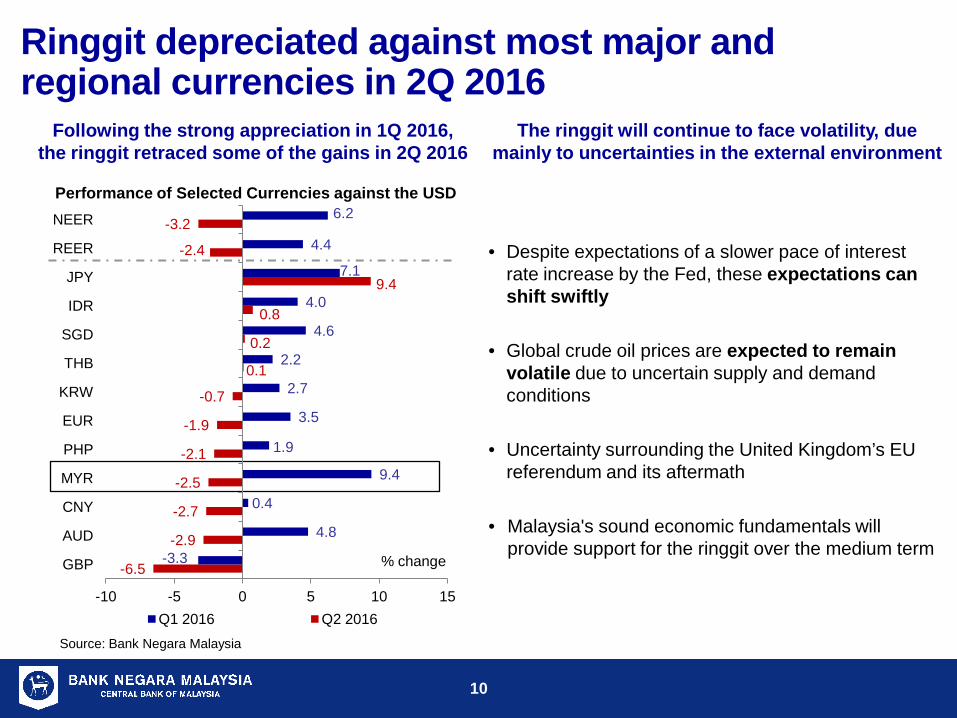
Following the strong appreciation in 1Q 2016, the ringgit retraced some of the gains in 2Q 2016
Performance of Selected Currencies against the USD
Source: Bank Negara Malaysia
• Despite expectations of a slower pace of interest rate increase by the Fed, these expectations can shift swiftly
• Global crude oil prices are expected to remain volatile due to uncertain supply and demand conditions
• Uncertainty surrounding the United Kingdom’s EU referendum and its aftermath
• Malaysia's sound economic fundamentals will provide support for the ringgit over the medium term
10
The ringgit will continue to face volatility, due mainly to uncertainties in the external environment
Ringgit depreciated against most major and regional currencies in 2Q 2016
-6.5
-2.9
-2.7
-2.5
-2.1
-1.9
-0.7
0.1
0.2
0.8
9.4
-2.4
-3.2
-3.3
4.8
0.4
9.4
1.9
3.5
2.7
2.2
4.6
4.0
7.1
4.4
6.2
-10 -5 0 5 10 15
GBP
AUD
CNY
MYR
PHP
EUR
KRW
THB
SGD
IDR
JPY
REER
NEER
Q1 2016 Q2 2016
% change

11
41%
27%
16% 14%
1% 1% 1% 0
20
40
60
80
100
Ass
et M
anag
emen
t
Cen
tral B
ank/
G
over
nmen
t
Ban
ks
Pen
sion
Fu
nds
Insu
ranc
e C
ompa
nies
Nom
inee
s/
Cus
todi
ans
Oth
ers
RM billion
Distribution of Non-resident Holdings in Government Bonds as at end-May’16
31% 34%
0%
5%
10%
15%
20%
25%
30%
35%
0
50
100
150
200
250
300
Jul-14 Jan-15 Jul-15 Jan-16 Jul-16
% NR Holding RM billion
Govt Bond (LHS) % NR of Govt (RHS)
Non-resident holdings of Malaysian government bonds increased to 34% as of July 2016
Majority of non-residents are long-term investors
15 Note: ‘Others’ include individuals, non-financial corporations and unidentified sectors Source: Bank Negara Malaysia
Non-resident holding of Malaysian Government Bonds
Non-resident holdings of Malaysian government bonds have been stable, underpinned by long-term investors

Reserves remain ample while external debt is manageable
International reserves have increased since fourth quarter of 2015
Source: Bank Negara Malaysia
12
External debt is mostly long-term, while foreign-currency exposure is manageable
0
2
4
6
8
10
12
85
95
105
115
125
135
145
Jan-13 Jul-13 Jan-14 Jul-14 Jan-15 Jul-15 Jan-16 Jul-16
USD billion
Net International Reserves Retained import cover (RHS) Reserves/ST ext debt (RHS)
29 July 2016: USD97.3 bn
8.1
1.2
Months/ Times
Total external debt: RM842.2 billion (69.0% of GDP)
Long-term 60.7%
Short-term 39.3%
Foreign Currency
62.0% Ringgit 38.0%
No immediate repayment requirements
By Tenure
Not affected by valuation
Largely hedged and backed by external assets
By Currency Composition

-8.0
-6.0
-4.0
-2.0
0.0
2.0
4.0
6.0
2Q 14 4Q 14 2Q 15 4Q 15 2Q 16
Inflation
Headline inflation Food and non-alcoholic beverages Transport Housing, water, electricity, gas and other fuels
Annual growth, %
Headline inflation declined to 1.9% in 2Q 2016
Source: Department of Statistics, Malaysia and Bank Negara Malaysia
-2.0
-1.0
0.0
1.0
2.0
3.0
4.0
Headline inflation
Food & non-
alcoholic beverages
Housing, water,
electricity, gas &
other fuels
Transport Others
Contribution to Headline Inflation
1Q 2016 2Q 2016
Percentage point
13

• The OPR was reduced by 25 basis points to 3.00% at the July MPC meeting
• The adjustment is to ensure that the domestic economy continues on a steady growth path amid stable inflation
• KLIBOR, Base Rate and fixed deposit rates have declined
3.40 (-25bps)
3.62 (-21bps)
3.00 (-18bps) 3.00
(-25bps)
2.5
2.7
2.9
3.1
3.3
3.5
3.7
3.9
4.1
Jan-15 Apr-15 Jul-15 Oct-15 Jan-16 Apr-16 Jul-16
% Market and Retail Interest Rates
Weighted Average Base Rate (BR)
3-month KLIBOR
Average Fixed Deposit (FD) Rate (1-year and below)
Overnight Policy Rate (OPR)
Reduction in OPR has started to impact market and retail interest rates
14
Source: Bank Negara Malaysia
15
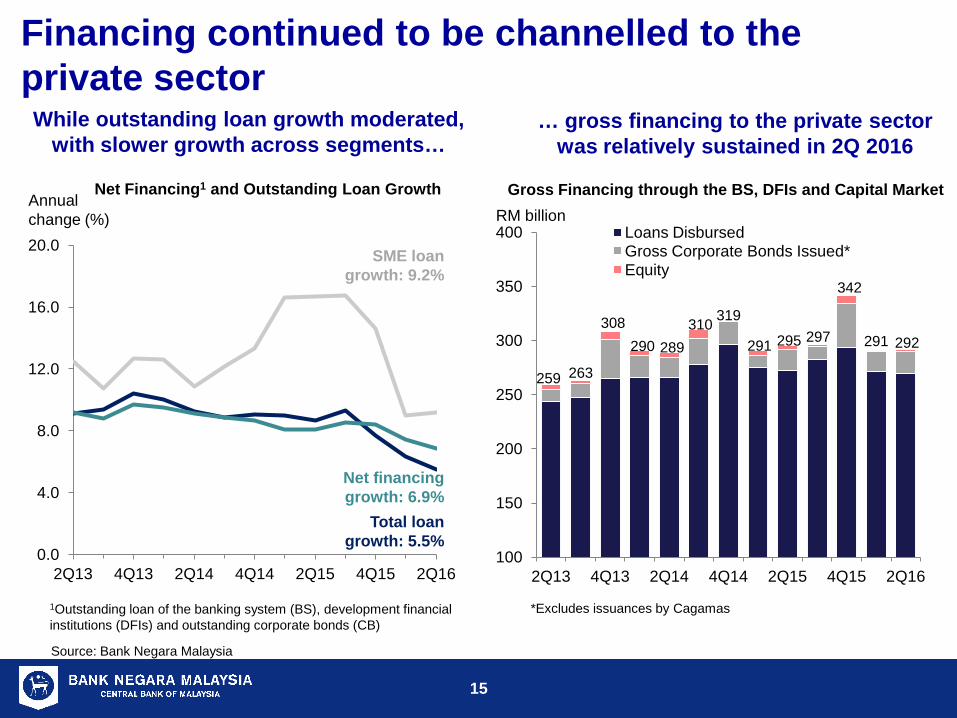
Financing continued to be channelled to the private sector
While outstanding loan growth moderated, with slower growth across segments…
Net Financing1 and Outstanding Loan Growth
1Outstanding loan of the banking system (BS), development financial institutions (DFIs) and outstanding corporate bonds (CB)
*Excludes issuances by Cagamas
Gross Financing through the BS, DFIs and Capital Market Annual change (%) RM billion
0.0
4.0
8.0
12.0
16.0
20.0
2Q13 4Q13 2Q14 4Q14 2Q15 4Q15 2Q16
259 263
308 290 289
310 319
291 295 297
342
291 292
100
150
200
250
300
350
400
2Q13 4Q13 2Q14 4Q14 2Q15 4Q15 2Q16
Loans Disbursed Gross Corporate Bonds Issued* Equity
… gross financing to the private sector was relatively sustained in 2Q 2016
Total loan growth: 5.5%
Net financing growth: 6.9%
SME loan growth: 9.2%
Source: Bank Negara Malaysia
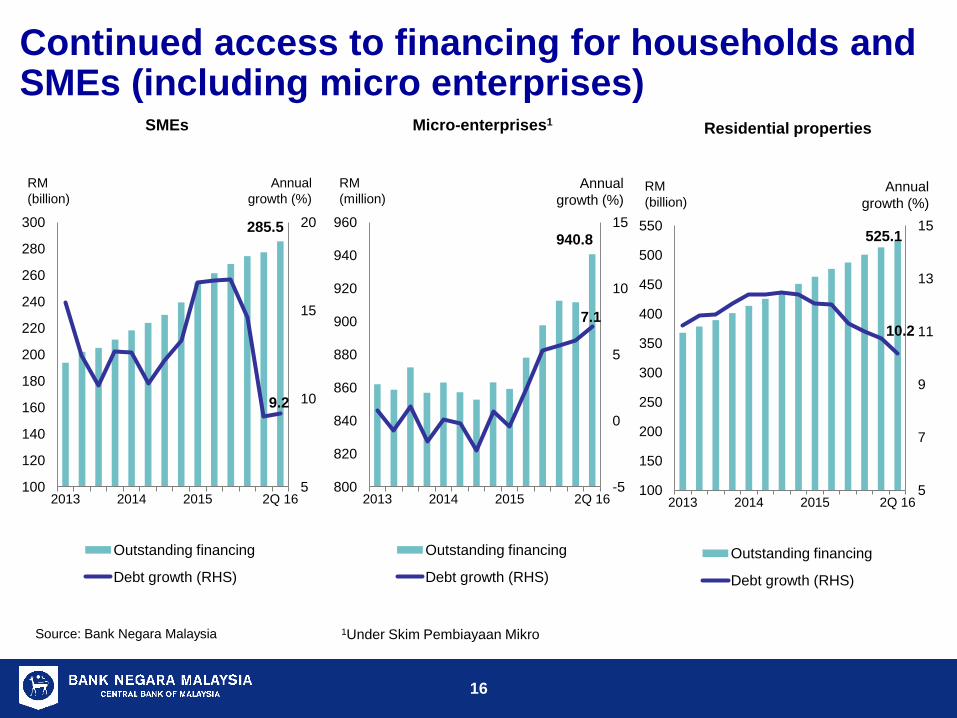
16
Continued access to financing for households and SMEs (including micro enterprises)
Source: Bank Negara Malaysia
9.2
5
10
15
20
100
120
140
160
180
200
220
240
260
280
300
2013 2014 2015 2Q 16
Outstanding financing
Debt growth (RHS)
SMEs
RM (billion)
Annual growth (%)
7.1
-5
0
5
10
15
800
820
840
860
880
900
920
940
960
2013 2014 2015 2Q 16
Outstanding financing
Debt growth (RHS)
RM (million)
Annual growth (%)
940.8
Micro-enterprises1
1Under Skim Pembiayaan Mikro
285.5
10.2
5
7
9
11
13
15
100
150
200
250
300
350
400
450
500
550
2013 2014 2015 2Q 16
Outstanding financing
Debt growth (RHS)
Residential properties
RM (billion)
Annual growth (%)
525.1
Source: Bank Negara Malaysia
17
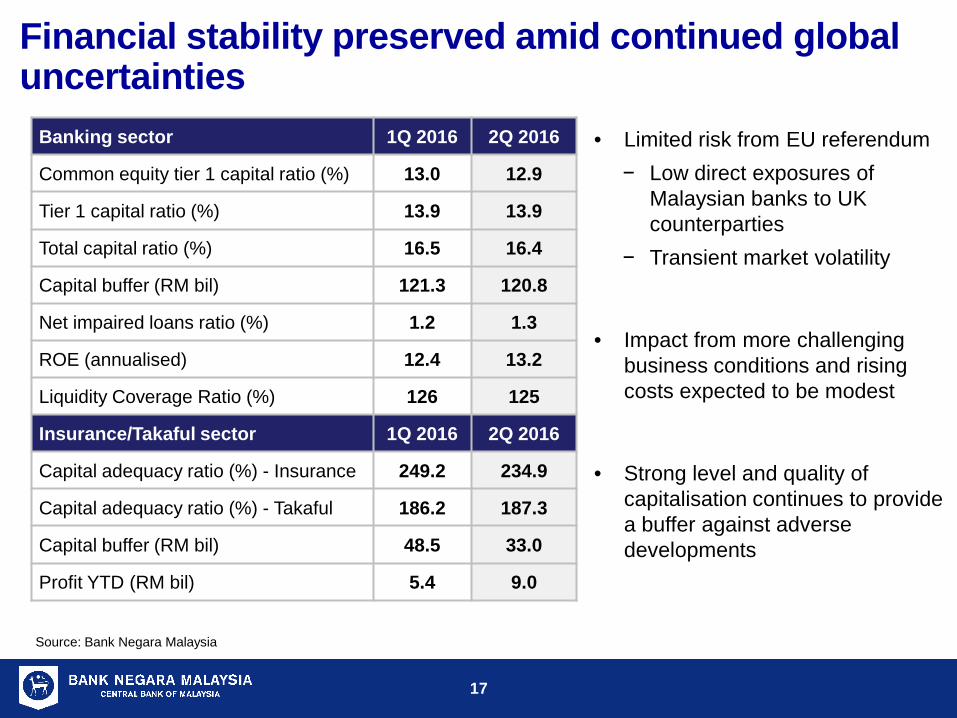
• Limited risk from EU referendum − Low direct exposures of
Malaysian banks to UK counterparties
− Transient market volatility
• Impact from more challenging business conditions and rising costs expected to be modest
• Strong level and quality of capitalisation continues to provide a buffer against adverse developments
Banking sector 1Q 2016 2Q 2016
Common equity tier 1 capital ratio (%) 13.0 12.9
Tier 1 capital ratio (%) 13.9 13.9
Total capital ratio (%) 16.5 16.4
Capital buffer (RM bil) 121.3 120.8
Net impaired loans ratio (%) 1.2 1.3
ROE (annualised) 12.4 13.2
Liquidity Coverage Ratio (%) 126 125
Insurance/Takaful sector 1Q 2016 2Q 2016
Capital adequacy ratio (%) - Insurance 249.2 234.9
Capital adequacy ratio (%) - Takaful 186.2 187.3
Capital buffer (RM bil) 48.5 33.0
Profit YTD (RM bil) 5.4 9.0
Financial stability preserved amid continued global uncertainties

18
Ample liquidity in the banking system
Source: Bank Negara Malaysia
RM178.5 bil
125 %
70%
60
80
100
120
140
0
100
200
300
400
500
2Q 3Q 4Q 1Q 2Q
2015 2016
% RM bil
Banks' surplus liquidity placed with BNM (including SRR) Stock of high quality liquid assets Liquidity Coverage Ratio (LCR, RHS) LCR minimum regulatory requirement (RHS)
Banking system surplus liquidity remained high at RM178.5 billion
2.55
87.8
82.6
73.8
2.0
2.5
3.0
65
70
75
80
85
90
1Q 2Q 3Q 4Q 1Q 2Q 3Q 4Q 1Q 2Q 3Q 4Q 1Q 2Q
%
Average cost of deposit (RHS) Loan-to-deposit ratio Loan-to-fund ratio Loan-to-fund & equity ratio
Banks’ funding structure continued to be supportive of financing activities
2016 2013 2014 2015

19
Manageable credit risk exposures to businesses
41.9
4.2
1.1 0
2
4
6
8
10
36
38
40
42
44
46
48
50
1Q13 3Q13 1Q14 3Q14 1Q15 3Q15 1Q16
Debt-to-equity ratio Interest coverage ratio (RHS) Cash-to-short-term debt (RHS)
% times
Overall debt servicing capacity sustained
Source: Bank Negara Malaysia
2.8
0.4
2.6
0.0
0.5
1.0
1.5
2.0
2.5
3.0
3.5
2Q13 4Q13 2Q14 4Q14 2Q15 4Q15 2Q16
Business: Impaired loans ratio Business: Delinquency ratio SMEs: Impaired loans ratio
%
Delinquencies and impairment remained stable
49%
29%
23%
0
500
1,000
1,500
1998 2008 2012 2013 2014 2015 Jun-16
Domestic Loans Domestic PDS External Debt
RM
Annual growth : 6.7%
Businesses, including SMEs, have continued access to financing

20
Household debt servicing capacity remains intact
Source: Bank Negara Malaysia
1.4
1.6
1.0
1.5
2.0
2.5
3.0
3.5
4.0
4.5
2011 2012 2013 2014 2015 2Q 16
Household: Delinquency ratio
Household: Impairment ratio
Quality of household loans remained strong
%
89
181
126
0
500
1,000
1,500
2,000
-50
0
50
100
150
200
2011 2012 2013 2014 2015 2Q 16
Residential Properties (RHS) Passenger Cars (RHS) Personal Financing (RHS) Credit Cards (RHS) Others (RHS) Debt-to-GDP ratio Financial assets-to-GDP ratio Liquid financial assets-to-GDP ratio
Aggregate household financial assets remained at two times of debt
Ratio %
Outstanding HH Debt RM billion
6.2
3.7
0
5
10
15
0
500
1,000
1,500
2,000
2,500
2011 2012 2013 2014 2015 2Q 16
Debt Financial assets Debt growth (RHS) Financial assets growth (RHS)
Growth in household debt continued to moderate
RM (billion)
Annual growth (%)

21
Agensi Kaunseling dan Pengurusan Kredit (AKPK) has helped individuals manage financial obligations
2015 Jan.-Jun. 2016
No. of borrowers benefitted from AKPK’s financial advice and credit counselling 84,664 55,507
Of which, enrolled into Debt Management Programme (DMP) 22,208 11,444
Insurance/Takaful sector Composition (%)
Credit Card 65.3 Personal Loan 25.8 Hire Purchase 1.8 Housing loan 2.0 Others 5.1 Total 100
DMP Cases by Type of Financing (2015 - Jun. 2016)
Number of Individuals Assisted by AKPK
• Since its establishment in 2006,
AKPK has assisted over 450,000
borrowers through its financial
advice and credit counselling
• Of these, more than 155,000
borrowers who have difficulties in
repaying their loans have
enrolled into Debt Management
Programme (DMP)
Despite the challenging economic environment, the Malaysian economy is expected to remain on the current growth trajectory of 4 – 4.5%, driven by domestic demand
Growth prospects supported by:
− Higher wages for civil servants and upward revision to minimum wages
− Continued implementation of infrastructure projects
− Improved commodities production from the diminishing effect of El Niño
However, the uncertainties in the global environment could weigh on Malaysia’s growth in 2H 2016
Growth performance continued to be resilient amid a challenging environment
22

Q&A Session


