JOSRE | Vol. 6 | No. 1 – 2014 ‘‘Not in My Backyard’’: The Effect of Substance Abuse Treatment Centers on Property Values Authors Claire R. La Roche, Bennie D. Waller, and Scott A. Wentland Abstract Residential treatment centers offer the most intense form of treatment for substance abuse and are often embedded in residential neighborhoods. As a result of the Patient Protection and Affordable Care Act, the number of treatment centers has been forecasted to burgeon. We examine the external effect of residential rehab centers on nearby real estate. As addiction treatment centers are planned, a common response of nearby property owners is ‘‘not in my backyard’’(NIMBY). Using a large MLS dataset from central Virginia, we estimate the impact of substance abuse treatment centers on nearby home prices and liquidity (as measured by time on market). We find that a neighboring treatment center is associated with an 8% reduction in nearby home prices, and that this discount is magnified for treatment centers that specifically treat opiate addiction (as much as 17%). The primary residence is perhaps the greatest single investment made by an individual and the mantra ‘‘location, location, location’’is an ever-present concern of a prospective buyer. Before purchasing a home, a savvy buyer will frequently research the community and the school system, as well as the crime statistics. When homeowners are made aware of an application for a special use permit for the possibility of an addiction treatment center being located in their neighborhood, initial concern for personal and household safety, followed by the stark realization that home values in their neighborhood may be adversely affected, almost always lead homeowners to the universal response of ‘‘not in my backyard’’ (NIMBY). The typical opposition to a proposed substance abuse treatment facility is based on two visceral concerns: an increase in crime risk and a related decrease in property values. The primary purpose of this paper is to examine the latter claim empirically, determining whether there is significant evidence that treatment centers have a negative impact on nearby real estate. Ex ante, it is not clear that substance abuse treatment centers will adversely impact neighboring real estate, which motivates our empirical examination of this externality. On one hand, there may be a priori reasons to suspect that treatment facilities will not have much of an impact on neighboring real estate. Locating addiction treatment centers in residential areas has become commonplace.
Transcript
J O S R E u V o l 6 u N o 1 ndash 2 0 1 4
lsquo lsquoNot in My Backyardrsquo rsquo
The Ef fec t o f Substance Abuse
Treatment Centers on Property
Values
A u t h o r s Claire R La Roche Bennie D Waller and Scott AWentland
A b s t r a c t Residential treatment centers offer the most intense form of treatmentfor substance abuse and are often embedded in residentialneighborhoods As a result of the Patient Protection and Affordable CareAct the number of treatment centers has been forecasted to burgeonWe examine the external effect of residential rehab centers on nearbyreal estate As addiction treatment centers are planned a commonresponse of nearby property owners is lsquolsquonot in my backyardrsquorsquo (NIMBY)Using a large MLS dataset from central Virginia we estimate the impactof substance abuse treatment centers on nearby home prices andliquidity (as measured by time on market) We find that a neighboringtreatment center is associated with an 8 reduction in nearby homeprices and that this discount is magnified for treatment centers thatspecifically treat opiate addiction (as much as 17)
The primary residence is perhaps the greatest single investment made by anindividual and the mantra lsquolsquolocation location locationrsquorsquo is an ever-present concernof a prospective buyer Before purchasing a home a savvy buyer will frequentlyresearch the community and the school system as well as the crime statisticsWhen homeowners are made aware of an application for a special use permitfor the possibility of an addiction treatment center being located in theirneighborhood initial concern for personal and household safety followed by thestark realization that home values in their neighborhood may be adversely affectedalmost always lead homeowners to the universal response of lsquolsquonot in my backyardrsquorsquo(NIMBY) The typical opposition to a proposed substance abuse treatment facilityis based on two visceral concerns an increase in crime risk and a related decreasein property values The primary purpose of this paper is to examine the latterclaim empirically determining whether there is significant evidence that treatmentcenters have a negative impact on nearby real estate
Ex ante it is not clear that substance abuse treatment centers will adversely impactneighboring real estate which motivates our empirical examination of thisexternality On one hand there may be a priori reasons to suspect that treatmentfacilities will not have much of an impact on neighboring real estate Locatingaddiction treatment centers in residential areas has become commonplace
6 4 u L a R o c h e W a l l e r a n d W e n t l a n d
Treatment centers tend to be inconspicuous and may have blackout curtains andminimal signage (or no sign) The housing is often gated and locked at a certaintime of the day Generally clients enrolled in residential treatment programs arenot allowed to interact with the lsquolsquolocalsrsquorsquo of the neighborhood or leave thepremises Under current law (discussed in the next section) despite theirchallenges residential treatment centers have relatively few limitations on wherethey are sited
On the other hand like many negative externalities or NIMBY issues there arereasons to suspect that rehab facilities may adversely impact neighboring realestate Substance abuse is a multifaceted health issue and many patients inresidential treatment have a dual diagnosis a mental health issue and an addiction(Connery 2011) The Substance Abuse Mental Health Services Administration(SAMHSA 2008) surveyed 14423 facilities in 2008 and had a response rate of941 The SAMHSA survey indicated that 39 of the clients in treatment centershad a dual diagnosis In addition concurrent alcohol and drug addiction accountedfor approximately 45 while clients in treatment solely for drug abuse accountedfor 34ndash36 and 18ndash20 of the patients only abused alcohol (SAMHSA2008)
One consequence of locating drug and alcohol rehabilitation centers in residentialareas is that patients in substance abuse treatment programs frequently leave orare administratively discharged before successful completion At some pointexperts say that lsquolsquorelapse is an almost unavoidablemdashand potentially usefulmdashstepin recoveryrsquorsquo (Shaffer 2012) For many intensive residential treatment is a lsquolsquolastresortrsquorsquo A healthy family of an addict will decline to lsquolsquoenablersquorsquo negative behaviorand instead will insist that the alcoholicaddict experience the lsquolsquoconsequencersquorsquoof the decision to use again and refuse treatment In other words the family willoften not offer any form of financial support and the addict will have to fend forhimself or herself In addition to having a substance abuse disorder and possiblya dual diagnosis those who relapse and leave treatment prior to completion oftenhave limited job skills and perhaps even a criminal recordmdashfactors that makeemployment a challenge Thus as a practical matter nearby neighbors may havevalid concerns that the presence of a treatment center will be accompanied byadditional unemployed or even homeless addicts on the street near the area inwhich the treatment center is located This perception of elevated risk in theseareas may then be reflected in the market prices of nearby real estate
The likely occurrence of relapse combined with the probability of criminal chargesandor convictions associated with substance abuse corroborates the argument thatthe presence of a treatment center may bring objectionable consequences into acommunity The purpose of this paper is to use market data to assess whetherthere is substantial evidence of nearby real estate being adversely impacted by thepresence of treatment centers consistent with the potential risks that proximity tothese facilities may bring As a clear-cut NIMBY issue this paper contributes tothe broader literature of examining the market effects of specific externalities orenvironmental factors in real estate Our study contributes to the literature by beingthe first to examine the effect of substance abuse treatment centers on the
lsquo lsquo N o t i n M y B a c k y a r d rsquo rsquo u 6 5
J O S R E u V o l 6 u N o 1 ndash 2 0 1 4
surrounding real estate market and more generally adding to our understandingof external factors that impact home prices
u S u b s t a n c e A b u s e T r e a t m e n t S a l i e n t I s s u e s
R e c e n t T r e n d s a n d R e l a t e d L i t e r a t u r e
It is anticipated that the impact of the July 1 2014 changes to insurance coverageunder the Affordable Care Act (ACA) will cause the number of treatment centersto burgeon and thus a study of the effect of nearby addiction treatment centerson real estate is timely Prior to investigating treatment centersrsquo effects on nearbyreal estate it is crucial to understand the background of substance abuse treatmentand why the current issues motivate the examination of potential real estateexternalities
Although accurate statistics of drug or alcohol disorders are difficult to obtainaccording to a Harvard Medical School Special Health Report between 15 and28 of Americans will have a substance use disorder sometime during theirlifetime and this estimate does not include addiction to nicotine (Shaffer 2012)Residential treatment has become a more common way to treat addiction and likemany areas in healthcare services residential rehabilitation has become a growthindustry
Broadly speaking there are three types of treatment centers intensive outpatientprogram (IOP) inpatient treatment and partial hospitalization program (PHP)Typically IOP treatment centers offer each client nine hours of group therapy onehour of individual therapy and one hour of case management (managing auxiliaryservices) per week IOP clients either live in a halfway house or at home withstrict guidelines established by their primary therapist Although halfway housescan vary greatly they generally have full-time house managers and mandatoryrandom urinalysis Inpatient programs require clients to live at the facility in whichall treatment takes place and may either be freestanding or hospital-based PHPalso known as the lsquolsquoFlorida modelrsquorsquo is a hybrid version of inpatient treatment andintensive outpatient treatment individuals go to a counseling center during theday and after a full day of therapy sessions return to off-site housing located ina neighborhood Behavioral health technicians work at the off-site facilities aroundthe clock
Mandatory addiction treatment (commitment) does not exist under the law Anaddict must choose to be in a recovery program It is interesting to note that allthree of the substance abuse treatment models include the possibility of grouphousing in neighborhood settings
Projected Increase in SUD Treatment Facilities MHPAEA and the
ACA
The Patient Protection and Affordable Care Act (PPACA) also known as ObamaCare made sweeping changes to Mental HealthSubstance Use Disorder
6 6 u L a R o c h e W a l l e r a n d W e n t l a n d
(MHSUD) insurance coverage that went into effect on July 1 2014 Tounderstand the ramifications for residential treatment centers it is necessary tobriefly examine the legislative history of MHSUD insurance coverage Prior toJuly 1 2014 the high cost of MHSUD treatment meant that it was only availableto patients with (or whose families have) considerable means or those whosehealth insurance provided coverage The Mental Health Parity and AddictionEquity Act of 2008 (MHPAEA) attempted to address the unequal treatment ofMHSUD health insurance coverage and legislated equal treatment between MHSUD benefits and medicalsurgical benefits If a plan had MHSUD coveragethen it must be on par with the medicalsurgical benefits offered under that policyThe MHPAEA did not mandate that an insurance policy must cover MHSUDand only applied to group health plans sponsored by employers with 50 or moreemployees Both individual and small employer group policies were specificallyexempted from coverage (MHPAEA Fact Sheet)
The PPACA mandates that MHSUD coverage be included in marketplace healthinsurance policies as an lsquolsquoessential health benefitrsquorsquo as of July 1 2014 (MHPAEAFact Sheet) The effect of inclusion of MHSUD coverage as an essential healthbenefit is that the MHSUD parity rules now apply to non-grandfatheredindividual and small group plans (Beronio Po Skopec and Glied 2013) Withexpansion of the lsquolsquoparity rulesrsquorsquo and inclusion of MHSUD coverage as anessential health benefit under the ACA it is anticipated that the number of patientshaving access to expensive addiction treatment options will grow exponentiallyas will the number of treatment centers
Antidiscrimination Housing Laws
When a proposed treatment center is sited concerned members of the communityfrequently pressure lawmakers or hire attorneys causing treatment centers to fightprotracted legal battles that attempt to prevent the opening of the center Howevernumerous laws hinder such NIMBY efforts providing legal basis for treatmentcenters to be located just about anywhere There are several federal laws thatprohibit discrimination in housing based on a lsquolsquodisabilityrsquorsquo and define disabilityas lsquolsquoAny person who has a physical or mental impairment that substantially limitsone or more major life activities has a record of such impairment or is regardedas having such impairmentrsquorsquo (HUD)
Substance abuse disorders are clearly recognized disabilities and thus are coveredunder fair housing laws Federal housing laws that prohibit disability-baseddiscrimination and ensure equal housing opportunities are briefly discussed below
Fair Housing Act The Fair Housing Act (FHA) was designed to prohibitdiscrimination in housing In 1988 the FHA was amended to include persons withhandicaps to the protected classes under the FHA 42 USC sect3604(f)(3)(B) Thedefinition of lsquolsquohandicaprsquorsquo under the FHA is very broad and drug addiction andalcoholism are considered to be disabilities that are covered The FHA also has aprovision (42 USC sect3604(f)(9)) that permits the exclusion of those lsquolsquowhosetenancy would constitute a direct threat to the health or safety of other individualsor would result in substantial physical damage to the property of othersrsquorsquo Thus
lsquo lsquo N o t i n M y B a c k y a r d rsquo rsquo u 6 7
J O S R E u V o l 6 u N o 1 ndash 2 0 1 4
the FHA does not protect an individual currently using illegal drugs or a personwith a conviction of distributing or illegally manufacturing a controlled substance
The FHA covers almost every aspect of a real estate transaction According to theAct it is illegal to discriminate in the sale or rental of a dwelling against a personwith a disability Thus an alcoholicaddict cannot be denied housing based solelyon his or her addiction The Act does permit lsquolsquoreasonable local State or Federalrestriction regarding the maximum number of occupants permitted to occupy adwellingrsquorsquo 42 USC sect3607(b)(1) This exemption is for living space per occupantand is intended to promote health and safety not exclude group homes fromresidential areas
Although a person with a conviction for dealing or illegally manufacturing acontrolled substance is not protected under the FHA a drug distribution convictiondoes not automatically exclude a person from invoking the Rehabilitation Act orthe Americans with Disabilities Act
Rehabilitation Act sect504 (45 CFR Part 84) of the Rehabilitation Act of 1973prohibits any entity from receiving federal funds from discriminating on the basisof a disability Drug addiction and alcoholism are covered under this act as wellCommunities have attempted to use zoning laws to exclude treatment centersUnder sect504 if a communityrsquos zoning regulation excludes substance abusetreatment centers that community risks losing its federal funds
Americans with Disabilities Act Among other things the purpose of Title II ofthe Americans with Disabilities Act (ADA) is to eliminate discrimination inhousing against people with disabilities This Act has further reach than sect504 ofthe Rehabilitation Act because the receipt of federal funds is not required for TitleII of the ADA to apply
Zoning and Case Law Zoning regulations create perhaps the biggest barrier toentry for a substance abuse center As a practical matter when considering aproposed site for a treatment center the owners prefer to avoid spending a lot oftime and money fighting a protracted court battle associated with a zoningordinance This mindset however did not stop a significant case from beingappealed to the United States Supreme Court by Oxford House a self-supportingresident-run residential treatment program In the landmark case of City ofEdmonds v Oxford House Inc et al 514 US 725 (1995) the City of Edmondsattempted to use an occupancy restriction in a zoning ordinance to excludetreatment centers from residential areas The zoning ordinance in question allowedan unlimited number of related persons to live in a home and attempted to restrictthe number of unrelated persons living in a single-family dwelling to five TheCity of Edmonds claimed that the sect3607(b)(1) exemption to the FHA applied tothe cityrsquos zoning ordinance In a 5ndash4 decision the Supreme Court held that azoning ordinance that defined a family in such a way as to exclude treatmentcenters was unlawful The ordinance was not a maximum occupancy provisionbut a provision describing who may compose a lsquolsquofamilyrsquorsquo and thus it violated theFHA This case was a critical victory for the lsquolsquoOxford House Modelrsquorsquo becausethis community-based treatment program leases houses located in upscaleneighborhoods across the US
6 8 u L a R o c h e W a l l e r a n d W e n t l a n d
The bottom line is that there must be a lsquolsquorational basisrsquorsquo for zoning regulation tobe valid and localities have consistently been prohibited from discriminatingagainst substance abuse treatment centers Absent drastic changes to the lawsoutlined above it is clear that residential centers are here to stay and that ifchallenged in court NIMBY proponents will have an uphill battle Thus giventhe growth trends in this industry the potential risks posed to neighbors and thelaws that protect the treatment centersrsquo rights to locate almost anywhere what isthe consequence for real estate when a treatment center is located in onersquoslsquolsquobackyardrsquorsquo so to speak
Related Literature in Real Estate
Researchers have long recognized that numerous externalities impact themarketing outcomes of residential real estate These externalities may include forexample neighboring pollution1 or even the condition of adjoining or nearbyproperties andor the tenantrsquos behavior living in such properties Real propertyhas intangible benefits or disamenities which are determined largely by publicperception and capitalized into the pricing and marketing duration of residentialproperties Furthermore negative externalities are likely to significantly impact themarketing outcomes of properties in close proximity to the properties beingmarketed for sale as well as impact the desirability of the overall neighborhoodSuch lsquolsquostigmarsquorsquo events are likely to be correlated with an exodus of higher incomeresidents causing a lsquolsquosnowballrsquorsquo effect in declining property values (McCluskeyand Rausser 2003)
There are a number of researchers who analyze the degree to which external orneighborhood factors both positive and negative are capitalized in residentialreal estate marketing outcomes For example Thaler (1978) finds a negativerelationship between neighborhood crime rates and property values Gibbons(2004) finds an inverse relationship between vandalism and property values inLondon As one would expect robbery and aggravated assault rates have asignificant and negative impact on property values (Ihanfeldt and Mayock 2010)Pope (2012) found that decrease in crime rates had a positive effect on propertyvalues particularly in those cities with substantial decreases in crime rates Usinga microspatial approach Rosiers (2002) examined the impact of the visualencumbrance of power lines on property value and finds that on average itnegatively impacts value by approximately 10 but increases to 14 in areaswhere setback in property lines are less
As a result of the recent economic and housing collapse there are several studiesthat have examined the impact of foreclosed properties Foreclosed properties maypresent a variety of negative effects on neighboring properties including (but notlimited to) the lsquolsquoeyesore effectrsquorsquo where neighboring foreclosures that have longbeen vacant adversely impact the aesthetic appeal of the neighborhood Suchstudies include Harding Rosenblatt and Yao (2009) Lin Rosenblatt and Yao(2009) Daneshvary Clauretie and Kader (2011) Daneshvary and Clauretie(2012) and Agarwal Ambrose Chomsisengphet and Sanders (2013) Generallythese studies find negative neighborhood spillovers from foreclosed or distressedproperties
lsquo lsquo N o t i n M y B a c k y a r d rsquo rsquo u 6 9
J O S R E u V o l 6 u N o 1 ndash 2 0 1 4
A review of the literature does not reveal any specific examples of residential drugrehabilitation centers and their impact on neighboring property values Howeverthere is analogous literature of undesirable neighbors impacting property valuesFor example Congdon-Hohman (2013) finds a significant and negative effect onhome values located within one-eighth of a mile of a methamphetamine lab Theeffect dissipates both as time passes after the discovery of and distance from ameth lab Reichert Small and Mohanty (1992) estimate the impact of landfillson nearby real estate finding a negative impact when located within several blocksof an expensive housing area They find an effect that ranges from 55 to 73depending on the distance from the landfill Indeed the authors find that thepercentage impact on older less expensive properties to be significantly less (3ndash4) relative to the more expensive properties Similarly Hite Chern Hitzusenand Randall (2001) find significant differences in property values located within325 miles of a landfill
Other studies have shown that a variety of other external factors affect real estatemarket outcomes Coulson and Leichenko (2001) find that designated propertiesas well as neighboring properties are significantly impacted by historicaldesignations Other examples include the impact of registered sex offenders onthe marketing outcomes of neighboring properties Three recent studies haveexamined the impact as to the proximity of registered sex offenders Most recentlyWentland Waller and Brastow (2014) found that close proximity to sex offendersrendered large price and liquidity effects declining but significant out to one mileThe authors also found amplified effects for homes with more bedrooms a proxyfor children and whether the nearby offender was convicted of a violent sexoffense Linden and Rockoff (2008) found significant reductions in home pricesacross radii of less than 01 miles and 01 to 03 miles when an offender movesin Pope (2008) found properties located within 01 miles of a sex offendersignificantly reduced home values
u D a t a
We use residential real estate data from a multiple listing service (MLS) locatedin central Virginia including Richmond and other surrounding areas MLS dataare critical for any externality study particularly those that analyze both time onmarket and price because it contains both the list date and sell date (or withdrawdate) of residential properties while tax data and other publically available datausually only include the propertyrsquos date of sale This is critical because nearbyamenities or disamenities may be capitalized into a homersquos price liquidity orsome combination of the two In this study we examine both While the expectedsign of living near a potential disamenity is likely negative for the price estimatesthe estimated impact on liquidity is theoretically ambiguous While the disamenitymay lower the arrival rate of potential buyers lengthening the time on marketthe seller may be willing to discount the home in part to counteract this effect
The sample is composed of listings in the residential real estate market overapproximately a decade between 2001 and 2011 The initial housing data contains207793 observations (including both sold and unsold properties) Among others
7 0 u L a R o c h e W a l l e r a n d W e n t l a n d
Levitt and Syverson (2008) point out that MLS data are entered by real estateagents and can be incorrect or incomplete The data were carefully examined inlight of common issues prevalent in the data After culling for incomplete missingor illogical data that suggest data entry errors or extravagant outliers the finaldata set consists of approximately 194983 homes on the market withapproximately 111580 that eventually sold2 The MLS data include numerousproperty characteristics (square footage bedrooms baths age acreage etc) andof course each propertyrsquos location
Our MLS data are a fairly representative housing market in the US whichincludes urban suburban and rural sales Richmond is a medium-sized citylocated in the eastern part of central Virginia and the MLS covers much of thelsquolsquoGreater Richmondrsquorsquo area (or Richmond MSA) The average property in this MLShas a listing and selling price of $263641 and $242116 respectively The averagelisted property was 25 years of age with 2143 square feet 36 bedrooms and24 bathrooms with an average time on market of 85 days During this time periodthere were 36 substance abuse treatment centers located within the broader regionencompassing the listings in our data and nine were located within the city limitsof Richmond specifically3 See Exhibit 1 for additional descriptive statistics
The primary source of the treatment center externality is its proximity to a givenhome on the market Intuitively there is likely an increasing NIMBY sentimentas the proximity to the center is closer in distance Thus we compute the distancefrom a given home in the MLS and each treatment center using address data tocode the longitude and latitude from which the straight-line distance is calculatedusing the great-circle formula While NIMBY does not literally refer to onersquoslsquolsquobackyardrsquorsquo it is usually taken to mean very close proximity but the definition ofwhat qualifies as lsquolsquovery close proximityrsquorsquo may be different depending on the personand the issue Below we examine the effect of nearby substance abuse treatmentcenters on nearby real estate using different spatial proximities (eg 0175 miles015 miles and 0125 miles) as a robustness check4
Empirical Methodology
Our primary goal is to isolate the effect of a treatment center on neighborhoodreal estate outcomes Numerous studies have examined other neighborhoodexternalities using a variety of empirical approaches5 Initially we focus on atreatment centerrsquos effect on the sale price and liquidity of a home utilizing across-sectional OLS hedonic pricing model as the baseline While hedonic pricingmodels are commonly used to determine the value of specific property attributesand surrounding (dis)amenities by estimating marginal effects on the sale price ofthe property6 we also explore a simultaneous equation model to account for thejoint determination of both price and liquidity The purpose of exploring multipleapproaches is to demonstrate that the results are not particularly sensitive to thechoice of modeling technique
Baseline OLS Hedonic Models
Beginning with a simple cross-sectional approach we provide a baseline estimateof the effect of a nearby substance abuse treatment center employing a traditional
lsquo lsquo N o t i n M y B a c k y a r d rsquo rsquo u 7 1
J O S R E u V o l 6 u N o 1 ndash 2 0 1 4
Exhibit 1 u Summary Statistics
Variable Mean Std Dev
List Price ($) 263641 142300
Sale Price ($) 242116 127608
Time on Market (in Days) 8545 7999
Rehab Center (Dummy Var 5 1 if the home is near a rehab center(distance specified in each table) 0 otherwise)
00003 002
Age (in Years) 2499 2616
Acreage 079 191
Square Feet 214329 88825
Bedrooms 360 077
Bathrooms 238 082
Foreclosure (Dummy Var 5 1 if foreclosure 0 otherwise) 002 012
Number of levels 183 065
Pool (Dummy Var 5 1 if the home has a pool 0 otherwise) 005 023
Basement (Dummy Var 5 1 if they have a basement 0 otherwise) 017 038
Short Sale (Dummy Var 5 1 if short sale 0 otherwise) 002 013
Tenant (Dummy Var 5 1 if it has a tenant at listing 0 otherwise) 003 016
Vacant (Dummy Var 5 1 if the home is vacant 0 otherwise) 036 048
Taxes 177995 131174
HOA Fees (Dummy Var 5 1 if it has HOA fees 0 otherwise) 032 047
Listing Density 6441 57740
Competition 58222 106208
Note Location and year fixed effects summary stats omitted
hedonic model that accounts for heterogeneous characteristics of both homes andtheir locations We estimate the following functional forms
SP 5 w (X LOC T TOM ) 1 laquo (1)i P i i i i
and
TOM 5 w (X LOC T LP ) 1 laquo (2)i P i i i i
where SPi is a vector for property selling price7 LPi is a vector for property listingprice Xi is a vector of property specific characteristics8 LOCi is a vector forlocation control using ZIP Codes (see below) Ti the variable of interest equals
7 2 u L a R o c h e W a l l e r a n d W e n t l a n d
1 if a treatment center is located nearby of a given homei and is 0 otherwiseTOMi is the time on market (in days) which the literature also calls marketingduration or a measure of liquidity and laquo is an error term that is heteroskedastic-consistent and clustered by ZIP Code9
Hedonic analysis of the housing market requires some control for spatialheterogeneity because location itself is a key source of differences in housingprices The goal is to disentangle specific proximity to a treatment center frombroader location differences that explain real estate prices Following numerousstudies in the real estate and urban economics literature we chose ZIP Code fixedeffects to control for unobserved heterogeneity across these areas so that theexplanatory variablesrsquo effects are identified from variation within a given area (oreven in a given year as is the case for time fixed effects) In effect our resultsmay then be interpreted as the treatment centerrsquos effect on home prices givencomparable homes within the same ZIP Code but located further away In thissense we are attempting to disentangle the broader location effect from theproximity to a treatment center by essentially comparing homes within a certainZIP Code Further we explore alternative location controls (census tracts blockgroups and blocks) in a similar vein as well as altering the control group itselfby confining it to narrow bands around a rehab facility Appropriate locationcontrols can disentangle the negative externality effect from simply a lsquolsquobadneighborhoodrsquorsquo or lsquolsquobad part of townrsquorsquo effect
Simultaneous Equations Approach System Identification
Numerous studies in real estate and urban economics model price and time onmarket in a simultaneous system (like 2SLS or 3SLS) given likely jointdetermination of these factors A seller can always lower price to increaseliquidity and vice versa Yet a homersquos sale price and time on market aredetermined by virtually identical factors Econometrically this creates anidentification problem because if one wants to model this simultaneity with asystem of equations then by definition such a system could not be identifiedusing identical exogenous variables While a number of empirical studiesacknowledge this simultaneity10 Turnbull and Dombrow (2006) and Zahirovic-Herbert and Turnbull (2008) have identified a novel way of overcoming thisidentification problem through their incorporation of variables that representmarket conditions from other listings on the market Below we summarize asolution to this identification issue as we utilize an adapted form of this approachto model price and liquidity in a simultaneous system
Following Krainerrsquos (2001) search market model one can model a homersquosexpected liquidity E[TOM] (measured as a homersquos marketing duration or timeon market) and expected house sale price E[SP] as simultaneously determinedand implicitly defined as
F(E[SP] E[TOM] T X LOC C) 5 0 (3)
lsquo lsquo N o t i n M y B a c k y a r d rsquo rsquo u 7 3
J O S R E u V o l 6 u N o 1 ndash 2 0 1 4
where T is an indicator of whether a home is near a rehab treatment center Xis a vector of house (and market) characteristics LOC is location controls andC are neighborhood market conditions The latter variable C representsneighborhood market conditions that have an ambiguous external effect on localproperties On one hand when the number of nearby homes that go on the marketincreases the supply of additional homes on the market ought to negatively impactthe price and liquidity of a nearby home (ie lsquolsquoa competition effectrsquorsquo) On theother hand the increased traffic generated from additional nearby homes on themarket could actually positively impact a homersquos price and liquidity which istermed lsquolsquoa shopping externality effectrsquorsquo Empirically the sales price and time onmarket can be represented as separate functions with jointly distributed stochasticerrors laquop and laquoT
SP 5 w (TOM T LOC X C) 1 laquo (4)p p
and
TOM 5 w (SP T LOC X C) 1 laquo (5)T T
The vector C (ie market conditions or neighborhood competition) and anothervector L (ie listing density) are the keys to Turnbull and Dombrowrsquos (2006)solution to over-identifying this system of equations (since equations 3 and 4 arenot yet identified) Neighborhood competition C is a measure that accounts forlsquolsquonearby houses for sale as long as each competing listed house overlaps with theperiod that this house is on the market inversely weighted by the distance betweenthe houses to reflect the assumption that nearby houses will have stronger effectson the sale of this house than houses that are farther awayrsquorsquo (Zahirovic-Herbertand Turnbull 2008)11 Listing density L is similarly defined as lsquolsquothe measureof competing overlapping listings per day on the marketrsquorsquo (Zahirovic-Herbertand Turnbull 2008) where L(i) 5 oj(1 2 D(i j))2min[s(i) s( j)] 2 max[l(i)l( j)]s(i) 2 l(i) 1 1 Essentially both measures capture neighborhood marketconditions by quantifying the marketing overlap of nearby homes on the marketsimultaneously however listing density is weighted by time on market Turnbulland Dombrow (2006) point out that a change in competition while holding sellingtime constant is also the partial derivative with respect to listing density (and itis easy to see that shywp shyC [ shywp shyL) Therefore we can rewrite our system ofequations to reflect
SP 5 w (TOM T LOC X L) 1 laquo (6)p p
7 4 u L a R o c h e W a l l e r a n d W e n t l a n d
and
TOM 5 w (SP T LOC X C) 1 laquo (7)T T
Both L and C vectors uniquely identify the simultaneous system Further wesupplement this approach by using different location controls across equations12
We estimate the system of equations (5) and (6) using three-stage least squares(3SLS) in the next section to generate a coefficient estimate of the effect of anearby treatment center on price and time on market We model simultaneity usinga 3SLS approach because it incorporates an additional step with seeminglyunrelated regression (SUR) estimation to control for correlations between errorterms13
Alternative Specifications and Robustness
While the baseline results include location controls an additional way to isolatethe treatment effect of a rehab facility is by limiting the control group to homescloser to rehab facilities more generally (ie omitting observations sufficiently farfrom any rehab facility) Methodologically the comparison is then between homesthat are near a rehab treatment facility and homes just outside a given rangeSpecifically we explore the effect of a rehab center (within 18 mile) on nearbyreal estate as compared to similar homes further out (ie within 15 miles 1 mileand 23 mile respectively) This approach allows us to further homogenizelocation as a robustness check and to provide additional evidence that the externaleffect is specific to the rehab facility and not simply the part of town in which itis located
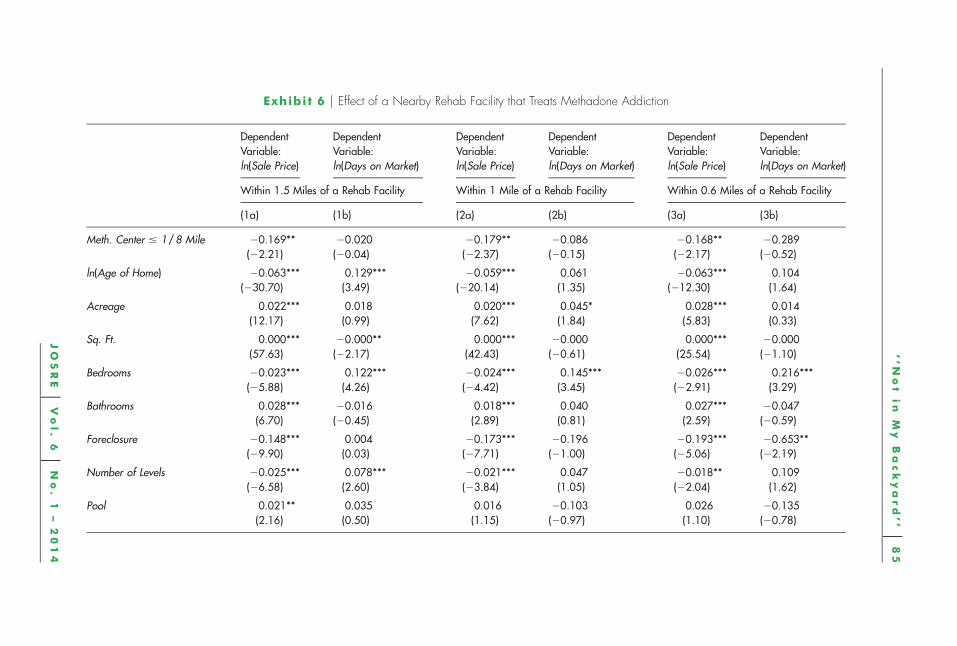
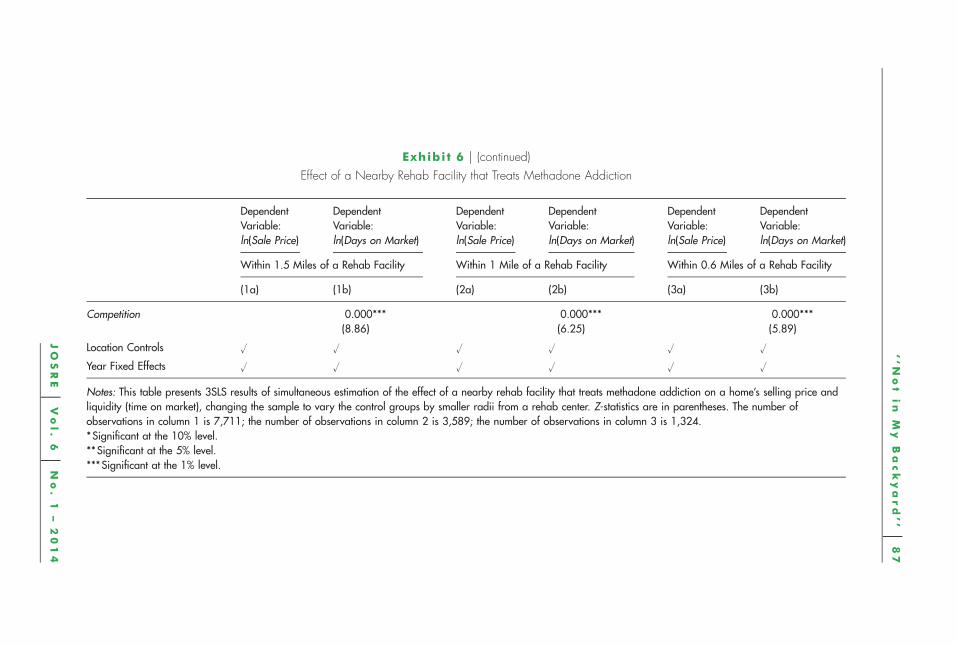
We also examine whether facilities that only treat opiate addicts (commonlyknown as methadone clinics) have a larger impact on nearby real estate Clinicsthat treat heroin or prescription addicts for example often use buprenorphine ormethadone as part of the rehabilitation process Nearby residents may perceivepatients who are still intoxicated albeit at a lower dose as an elevated crime riskApproximately half of the 36 treatment centers in our sample only treat opiateaddiction (hereinafter referred to as methadone clinics) We examine whethernearby real estate is more affected by methadone clinics specifically
u R e s u l t s
Baseline OLS Results
The baseline OLS results provide evidence that nearby treatment centers adverselyimpact surrounding home values but have little if any impact on property liquidityEstimating equations (1) and (2) Exhibit 2 shows that this adverse effect is notqualitatively sensitive to the choice of the definition of lsquolsquonearbyrsquorsquo Column 1 showsthat the presence of a rehab center within 0125 (18) miles is associated with
lsquolsquoN
ot
in
My
Ba
ck
ya
rd
rsquorsquo
u7
5
JO
SR
Eu
Vo
l
6u
No
1
ndash2
01
4
Exhibit 2 u Effect of a Nearby Rehab Center on a Homersquos Price and Liquidity Baseline OLS Results
Dependent Variable ln(Sale Price) Dependent Variable ln(Days on Market)
Notes This table presents results of hedonic OLS models showing the effect of a nearby (ie within 0125 mile 015 mile and 0175 mile) rehab facility on apropertyrsquos sale price and time on market (errors clustered by ZIP Code) T-statistics are in parentheses The number of observation in columns 1ndash3 is 117187 thenumber of observation in columns 4ndash6 is 206420Significant at the 10 levelSignificant at the 5 levelSignificant at the 1 level
lsquo lsquo N o t i n M y B a c k y a r d rsquo rsquo u 7 7
J O S R E u V o l 6 u N o 1 ndash 2 0 1 4
approximately an 8 reduction in home values The corresponding impact ontime on market is not statistically significant at any conventional level providinginitial evidence that the externality is primarily capitalized into home prices ratherthan liquidity Indeed columns 2 and 3 show that homes sold for approximately6 or 5 less if they were located within 015 miles or 0175 miles of a rehabcenter respectively While qualitatively similar these coefficient estimates alsoprovide some evidence that the externality may be diminishing in distance asadditional further properties are included in the latter estimates The regressionstabulated in columns 5 and 6 tell approximately the same story as column 4 inthat there is little evidence that rehab centers have a statistically significant impacton a homersquos liquidity
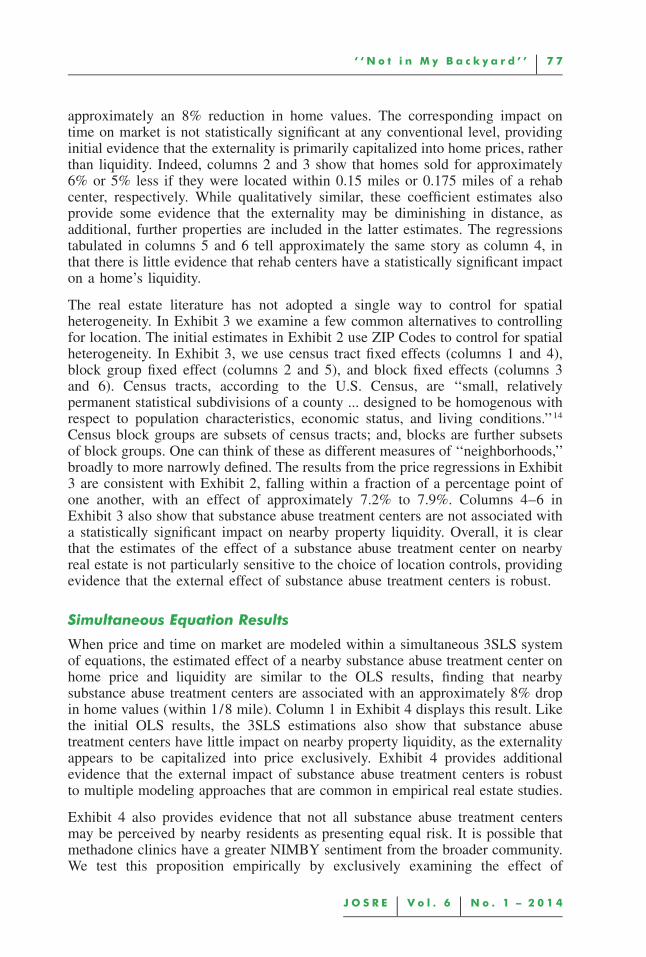
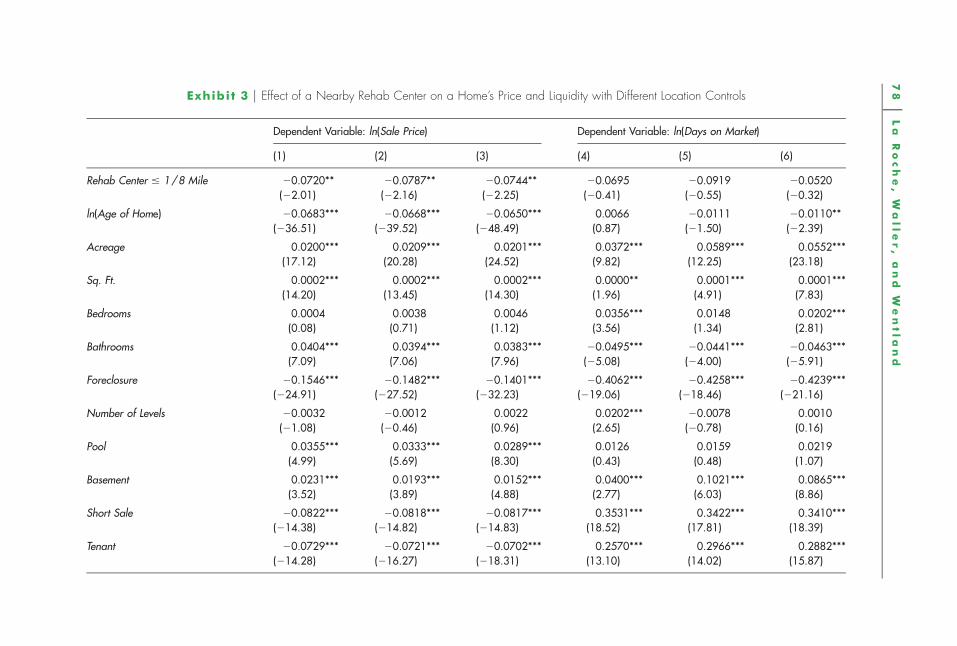
The real estate literature has not adopted a single way to control for spatialheterogeneity In Exhibit 3 we examine a few common alternatives to controllingfor location The initial estimates in Exhibit 2 use ZIP Codes to control for spatialheterogeneity In Exhibit 3 we use census tract fixed effects (columns 1 and 4)block group fixed effect (columns 2 and 5) and block fixed effects (columns 3and 6) Census tracts according to the US Census are lsquolsquosmall relativelypermanent statistical subdivisions of a county designed to be homogenous withrespect to population characteristics economic status and living conditionsrsquorsquo14
Census block groups are subsets of census tracts and blocks are further subsetsof block groups One can think of these as different measures of lsquolsquoneighborhoodsrsquorsquobroadly to more narrowly defined The results from the price regressions in Exhibit3 are consistent with Exhibit 2 falling within a fraction of a percentage point ofone another with an effect of approximately 72 to 79 Columns 4ndash6 inExhibit 3 also show that substance abuse treatment centers are not associated witha statistically significant impact on nearby property liquidity Overall it is clearthat the estimates of the effect of a substance abuse treatment center on nearbyreal estate is not particularly sensitive to the choice of location controls providingevidence that the external effect of substance abuse treatment centers is robust
Simultaneous Equation Results
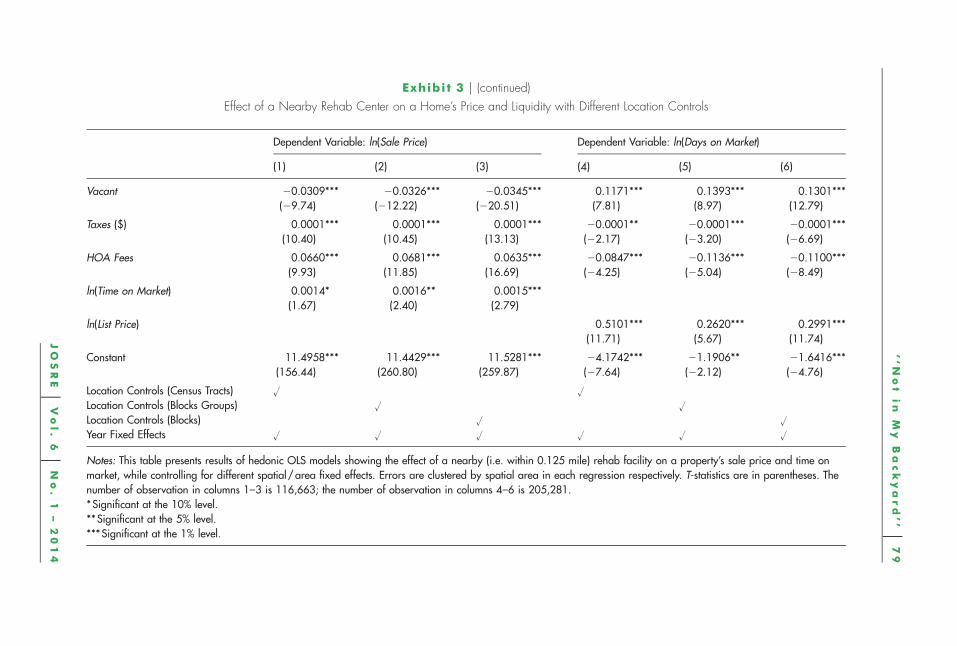
When price and time on market are modeled within a simultaneous 3SLS systemof equations the estimated effect of a nearby substance abuse treatment center onhome price and liquidity are similar to the OLS results finding that nearbysubstance abuse treatment centers are associated with an approximately 8 dropin home values (within 18 mile) Column 1 in Exhibit 4 displays this result Likethe initial OLS results the 3SLS estimations also show that substance abusetreatment centers have little impact on nearby property liquidity as the externalityappears to be capitalized into price exclusively Exhibit 4 provides additionalevidence that the external impact of substance abuse treatment centers is robustto multiple modeling approaches that are common in empirical real estate studies
Exhibit 4 also provides evidence that not all substance abuse treatment centersmay be perceived by nearby residents as presenting equal risk It is possible thatmethadone clinics have a greater NIMBY sentiment from the broader communityWe test this proposition empirically by exclusively examining the effect of
78
uL
aR
oc
he
W
alle
r
an
dW
en
tla
nd
Exhibit 3 u Effect of a Nearby Rehab Center on a Homersquos Price and Liquidity with Different Location Controls
Dependent Variable ln(Sale Price) Dependent Variable ln(Days on Market)
Notes This table presents results of hedonic OLS models showing the effect of a nearby (ie within 0125 mile) rehab facility on a propertyrsquos sale price and time onmarket while controlling for different spatialarea fixed effects Errors are clustered by spatial area in each regression respectively T-statistics are in parentheses Thenumber of observation in columns 1ndash3 is 116663 the number of observation in columns 4ndash6 is 205281Significant at the 10 levelSignificant at the 5 levelSignificant at the 1 level
8 0 u L a R o c h e W a l l e r a n d W e n t l a n d
Exhibit 4 u Effect of a Nearby Rehab and Methadone Treatment Center on a Homersquos Price and
Liquidity
DependentVariableln(Sale Price)
DependentVariableln(Days on Market)
DependentVariableln(Sale Price)
DependentVariableln(Days on Market)
(1) (2) (3) (4)
Rehab Center 18 Mile 20077 20009(2244) (2004)
Meth Center 18 Mile 20174 0192(2235) (033)
ln(Age of Home) 20063 0125 20063 0125(211893) (1089) (211892) (1086)
HOA Fees 0059 20076 0059 20076(4151) (2507) (4150) (2505)
ln(Time on Market) 0050 0050(4552) (4545)
ln(Sale Price) 1254 1248(748) (744)
lsquo lsquo N o t i n M y B a c k y a r d rsquo rsquo u 8 1
J O S R E u V o l 6 u N o 1 ndash 2 0 1 4
Exhibit 4 u (continued)
Effect of a Nearby Rehab and Methadone Treatment Center on a Homersquos Price and Liquidity
DependentVariableln(Sale Price)
DependentVariableln(Days on Market)
DependentVariableln(Sale Price)
DependentVariableln(Days on Market)
(1) (2) (3) (4)
Listing Density 0000 0000(2193) (2195)
Competition 0000 0000(2148) (2150)
Location Controls u u u u
Year Fixed Effects u u u u
Notes This table presents the results of hedonic 3SLS models showing the effect of a nearby (ie within0125 mile) rehab facility and a rehab facility that treats methadone addiction specifically on a propertyrsquossale price and time on market constant omitted here for brevity Z-statistics are in parentheses The numberof observations in columns 1ndash4 is 110361Significant at the 10 levelSignificant at the 5 levelSignificant at the 1 level
methadone clinics Columns 3 and 4 in Exhibit 4 display the results of the same3SLS estimations as columns 1 and 2 but confining the treatment variable to adummy variable that equals one if the home is within 0125 mile of a methadoneclinic The coefficient estimates in Exhibit 4 indicate that homes within 0125miles of a methadone clinic sell for approximately a 17 discount relative tohomes that are located further away holding other factors constant There is littleevidence however that these clinics affect nearby home liquidity Overall Exhibit4 provides evidence that the market differentiates among risks generated by thesepotential externalities and the treatment centers that may be perceived as havinga higher risk to their neighbors have a much greater impact on the surroundingreal estate market
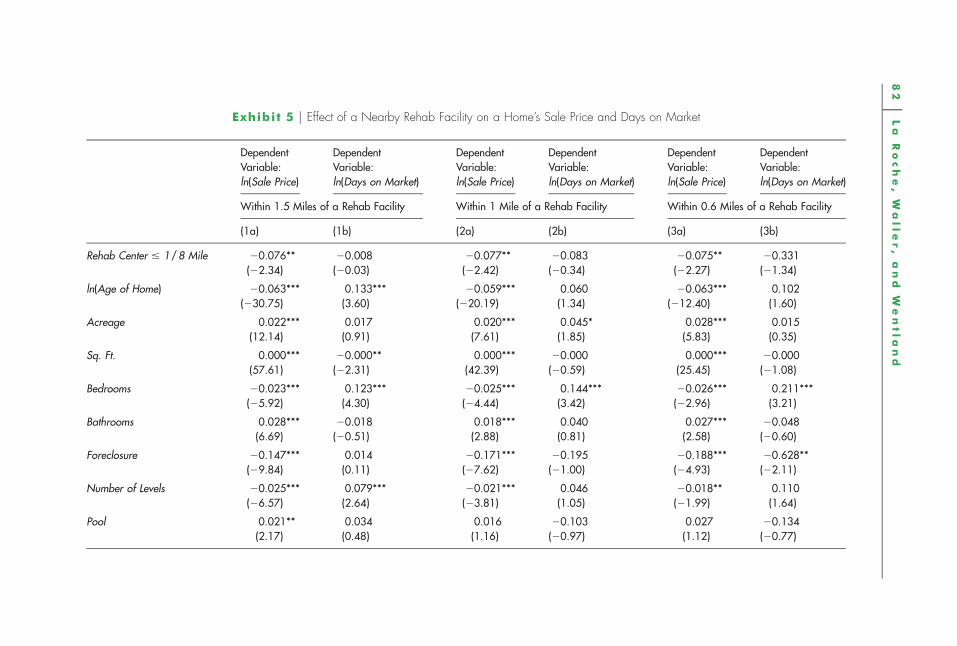
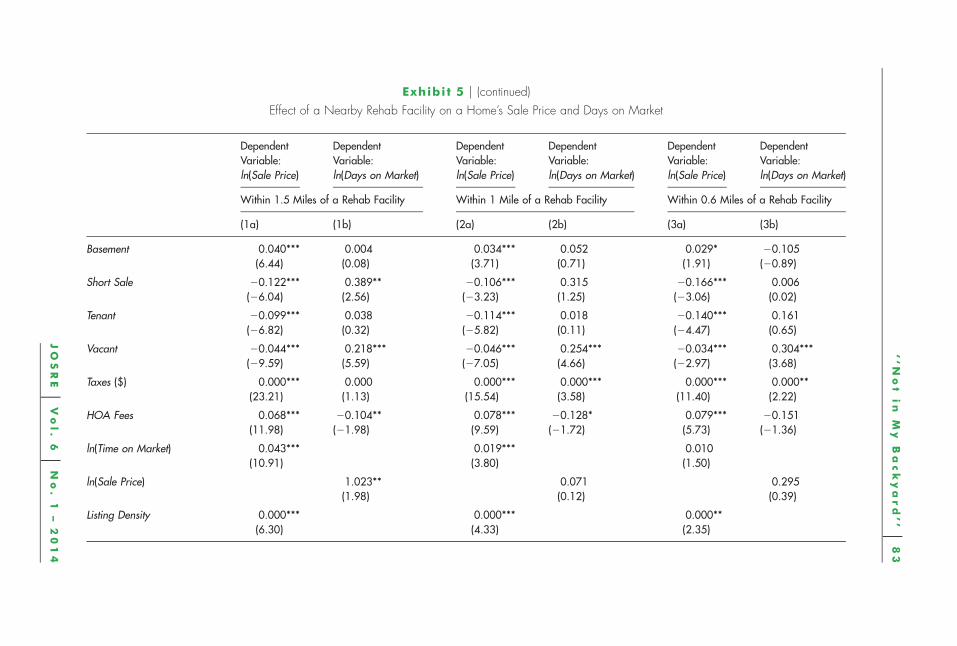
As a robustness check in Exhibit 5 we explore the extent to which the controlgroups matter finding results generally consistent with those in Exhibit 4 Acritique of hedonic models for estimating any externality might be that theinterpretation of the dummy variable essentially defines the control group ashomes not located near (within 0125 miles) the potential externality Defining thecontrol group in this way may present some unobserved spatial heterogeneityissues To address this issue in Exhibits 5 and 6 we estimate the same regressionsas Exhibit 4 but confine the sample to homes that are located within 15 miles1 mile and 06 miles of a rehab facility respectively The results are consistentwith the initial 3SLS estimates in Exhibit 4 and by extension the initial OLSestimates in Exhibits 2 and 3 Both exhibits show that homes near substance abuse
82
uL
aR
oc
he
W
alle
r
an
dW
en
tla
nd
Exhibit 5 u Effect of a Nearby Rehab Facility on a Homersquos Sale Price and Days on Market
DependentVariableln(Sale Price)
DependentVariableln(Days on Market)
DependentVariableln(Sale Price)
DependentVariableln(Days on Market)
DependentVariableln(Sale Price)
DependentVariableln(Days on Market)
Within 15 Miles of a Rehab Facility Within 1 Mile of a Rehab Facility Within 06 Miles of a Rehab Facility
ln(Time on Market) 0043 0019 0010(1091) (380) (150)
ln(Sale Price) 1023 0071 0295(198) (012) (039)
Listing Density 0000 0000 0000(630) (433) (235)
84
uL
aR
oc
he
W
alle
r
an
dW
en
tla
nd
Exhibit 5 u (continued)
Effect of a Nearby Rehab Facility on a Homersquos Sale Price and Days on Market
DependentVariableln(Sale Price)
DependentVariableln(Days on Market)
DependentVariableln(Sale Price)
DependentVariableln(Days on Market)
DependentVariableln(Sale Price)
DependentVariableln(Days on Market)
Within 15 Miles of a Rehab Facility Within 1 Mile of a Rehab Facility Within 06 Miles of a Rehab Facility
(1a) (1b) (2a) (2b) (3a) (3b)
Competition 0000 0000 0000(880) (626) (595)
Location Controls u u u u u u
Year Fixed Effects u u u u u u
Notes This table presents the 3SLS results of simultaneous estimation of the effect of a nearby rehab facility on a homersquos selling price and liquidity (time on market)changing the sample to vary the control groups by smaller radii from a rehab center Z-statistics are in parentheses The number of observations in columns 1ndash2 is7711 the number of observations in columns 3ndash4 is 3589 the number of observations in columns 5ndash6 is 1324Significant at the 10 levelSignificant at the 5 levelSignificant at the 1 level
lsquolsquoN
ot
in
My
Ba
ck
ya
rd
rsquorsquo
u8
5
JO
SR
Eu
Vo
l
6u
No
1
ndash2
01
4
Exhibit 6 u Effect of a Nearby Rehab Facility that Treats Methadone Addiction
DependentVariableln(Sale Price)
DependentVariableln(Days on Market)
DependentVariableln(Sale Price)
DependentVariableln(Days on Market)
DependentVariableln(Sale Price)
DependentVariableln(Days on Market)
Within 15 Miles of a Rehab Facility Within 1 Mile of a Rehab Facility Within 06 Miles of a Rehab Facility
ln(Time on Market) 0042 0020 0012(1081) (393) (167)
ln(Sale Price) 0955 0082 0322(185) (014) (043)
Listing Density 0000 0000 0000(642) (440) (248)
lsquolsquoN
ot
in
My
Ba
ck
ya
rd
rsquorsquo
u8
7
JO
SR
Eu
Vo
l
6u
No
1
ndash2
01
4
Exhibit 6 u (continued)
Effect of a Nearby Rehab Facility that Treats Methadone Addiction
DependentVariableln(Sale Price)
DependentVariableln(Days on Market)
DependentVariableln(Sale Price)
DependentVariableln(Days on Market)
DependentVariableln(Sale Price)
DependentVariableln(Days on Market)
Within 15 Miles of a Rehab Facility Within 1 Mile of a Rehab Facility Within 06 Miles of a Rehab Facility
(1a) (1b) (2a) (2b) (3a) (3b)
Competition 0000 0000 0000(886) (625) (589)
Location Controls u u u u u u
Year Fixed Effects u u u u u u
Notes This table presents 3SLS results of simultaneous estimation of the effect of a nearby rehab facility that treats methadone addiction on a homersquos selling price andliquidity (time on market) changing the sample to vary the control groups by smaller radii from a rehab center Z-statistics are in parentheses The number ofobservations in column 1 is 7711 the number of observations in column 2 is 3589 the number of observations in column 3 is 1324Significant at the 10 levelSignificant at the 5 levelSignificant at the 1 level
8 8 u L a R o c h e W a l l e r a n d W e n t l a n d
treatment centers are still negatively impacted and by approximately the samemagnitudes Indeed the last two columns are particularly striking Given that thisis already a lsquolsquowithin neighborhoodrsquorsquo estimation by controlling for location thefact that the substance abuse treatment center result is robust when the controlgroup is reduced to 1 mile and 06 miles indicates that unobserved spatialheterogeneity is not likely driving the core results of this paper More intuitivelythis provides strong evidence that the substance abuse treatment center effect isnot simply a lsquolsquobad part of town effectrsquorsquo in that we are comparing lsquolsquoapples withapplesrsquorsquo across the dimension of location and the principle characteristicdistinguishing the variation in prices in these areas is the presence of a nearbysubstance abuse treatment center Based on these results we cannot conclude thatthere is a robust impact on property liquidity but there appears to be a robustnegative relationship between the presence of a substance abuse treatment centerand nearby home values
u C o n c l u s i o n
In this study we find evidence that residential substance abuse treatment centersadversely impact the price of neighboring homes We find that homes within 18mile of a treatment center sell for approximately 8 less than otherwisecomparable homes that are located further away Furthermore we find that themarket differentiates between potential risks that nearby treatment centers maycarry as living near a methadone clinic that treats opiate addictions such as heroinor morphine may be associated with a reduction in home values by as much as17 We find little evidence that nearby treatment centers affect a homersquos timeon market
Examining this particular externality is important to the broader literature onneighborhood externalities and environmental factors as well as the specificliterature on the issue of residential treatment centers The PPACA has expandedMHSUD coverage and made intensive treatment options affordable and as aresult demand for effective substance abuse treatment is increasing Operating atreatment center is a growing industry and it is reasonable to assume that newcenters will be built nationally many of which will be sited near or withinresidential communities Indeed there is very little that individuals and localitiescan do to prohibit a substance abuse treatment center from locating in a residentialarea because alcohol and drug addiction is considered to be a handicap and thusalcoholicaddicts in recovery are members of a protected class under the federalanti-discrimination housing laws Hence as residential treatment centers becomemore common it is important to understand all their effects including the effectsthey may have on nearby real estate and how markets price the potential risk ofnearby externalities
u E n d n o t e s1 For a more complete review on the impact of environmental externalities see Boyle and
Kiel (2001)
lsquo lsquo N o t i n M y B a c k y a r d rsquo rsquo u 8 9
J O S R E u V o l 6 u N o 1 ndash 2 0 1 4
2 Consistent with other real estate studies we culled outliers from our data set confiningour data to more lsquolsquotypicalrsquorsquo range of homes listed at less than $1000000 fewer than10 bedrooms fewer than 16 acres (99 of observations) property taxes paid that wereless $10000 (99 of observations) and younger than 150 years old (99 ofobservations) For our other dependent variable of interest time on market we similarlytrim the 1 extremes Generally the findings are not sensitive to dropping theseobservations Further important to disclose how our data has been trimmed fortransparency and replicability As an additional quality check a sample of the MLS datawas compared to county tax records which contain data on price and housingcharacteristics
3 There were approximately 153 96 and 60 properties listed within 0175 miles 015miles and 0125 miles of a rehab treatment facility respectively over the time periodof our study Given the very recent and projected growth of rehab centers nationallyfuture research will be able to take advantage of additional homes (data points) beingbought and sold near rehab facilities
4 The choice of this radius does not fundamentally alter the qualitative conclusions of thisstudy The definition of onersquos lsquolsquobackyardrsquorsquo is somewhat ambiguous and may differdepending on an individualrsquos perception Some externality studies use 01 mile 02 mileor 03 mile as a radius to examine a given externality While similar results are obtainedlooking at bands slightly larger and slightly smaller we follow Congdon-Hohman (2013)and use 18 mile in most of our tabulated regression results An easy way to think of0125 miles 015 miles and 0175 miles is that these are 25 minute 3 minute and 35minute walks respectively (assuming a pace of 3 miles per hour)
5 For recent examples of amenity or disamenity studies of externality effects see Asabereand Huffman (1991) Gibbons (2004) Linden and Rockoff (2008) Pope (2008) Rossi-Hansberg Sarte and Owens (2010) Campbell Giglio and Pathek (2011) Hoen WiserCappers Thayer and Sethi (2011) Daneshvary Clauretie and Kader (2011) GroutJaeger and Plantinga (2011) Daneshvary and Clauretie (2012) Congdon-Hohman(2013) Guignet (2013) Linn (2013) Munneke Sirmans Slade and Turnbull (2013)and Wentland Waller and Brastow (2014)
6 Recent examples include neighborhood foreclosure effects (Harding Rosenblatt andYao 2009 Lin Rosenblatt and Yao 2009 Agarwal Ambrose Chomsisengphet andSanders 2010)
7 Kuminoff Parmeter and Pope (2010) survey 69 hedonic studies and found that 80rely on linear semi-log or log-log functional form We have explored a number of non-linear functional forms and our results remain robust Rather than repeat all of the abovemodels with various non-linear explanatory variables the authors will produce resultsof alternative specifications upon request
8 For example we use the following property specific variables square footage ageacreage number of bedrooms bathrooms number of stories new vacant HOA feeswhether it has a pool a tenant a basement and whether it is a short sale or foreclosureWe also include year fixed effects to control for variation over time
9 When we explore different location controls later we will cluster by location (egcensus tract block group or block)
10 For example see Yavas and Yang (1995) Knight (2002) and Turnbull and Dombrow(2006)
11 Specifically both our paper and Zahirovic-Herbert and Turnbull (2008) calculate C inthe following way lsquolsquoThe days-on-market or selling time is s(i) 2 l(i) 1 1 where l(i)and s(i) are the listing date and sales date for house i Denoting the listing date and
9 0 u L a R o c h e W a l l e r a n d W e n t l a n d
sales date for house j by l( j) and s( j) the overlapping time on the market for these twohouses is min[s(i) s( j)] 2 max[l(i) l( j)] The straight-line distance in miles betweenhouses i and j is D(i j) The measured competition for house i is C(i) 5 oj (1 2 D(ij))2min[s(i) s( j)] 2 max[l(i) l( j)] where the summation is taken over all competinghouses j that is houses for sale within one mile and 20 larger or smaller in livingarea of house irsquorsquo (Zahirovic-Herbert and Turnbull 2008)
12 At the suggestion of a reviewer we also identify the system by using different controlvariables A simple way to do this is to use different location controls We use ZIP Codefixed effects in the price equation and census tract fixed effects in the time on marketequation Generally the results are not very sensitive to which location controls are usedin each equation Further the results are similar when we use the Turnbull and Dombrow(2006) method alone to identify the system
13 According to Belsley (1988) when there are strong interrelations among error terms3SLS is used instead of 2SLS in estimating systems of equations because it is moreefficient Specifically one would expect unobservables that contribute to error inestimating price to be also correlated the error in liquidity
14 See wwwcensusgov for more detail specifically http wwwcensusgovgeowwwcobtr metadatahtmlgad
u R e f e r e n c e s
Agarwal S B Ambrose S Chomsisengphet and AB Sanders Thy NeighborrsquosMortgage Does Living in a Subprime Neighborhood Affect Onersquos Probability of DefaultReal Estate Economics 2012 401 1ndash22
Asabere P and F Huffman Historic Districts and Land Values Journal of Real EstateResearch 1991 61 1ndash8
Augusta Chronicle Neighbors Oppose Upscale Rehab Facility in South Augusta http chronicleaugustacomnewshealth2013-08-05neighbors-oppose-upscale-rehab-facility-south-augusta August 5 2013
Belsley DA Two- or Three-stage Least Squares Computational Economics 1988 1 21ndash30
Beronio K R Po L Skopec and S Glied ASPE Research Brief Affordable Care ActWill Expand Mental Health and Substance Use Disorder Benefits and Parity Protectionsfor 62 Million Americans http aspehhsgovhealthreports 2013mental rb mentalcfm February 20 2013
Boyle M and K Kiel A Survey of House Price Hedonic Studies of the Impact ofEnvironmental Externalities Journal of Real Estate Literature 2001 92 117ndash44
Campbell JY S Giglio and P Pathak Forced Sales and House Prices AmericanEconomic Review 2011 1015 2108ndash31
City of Edmonds v Oxford House Inc et al 514 US 725 1995
Congdon-Hohman J The Lasting Effects of Crime The Relationship of DiscoveredMethamphetamine Laboratories and Home Values Regional Science and UrbanEconomics 2013 431 31ndash41
Connery H Alcohol Use and AbusemdashA Harvard Medical School Special Health Report2011 Fact Sheet MHPAEA http wwwdolgovebsanewsroomfsmhpaeahtml HUDDisability Rights in Housing http portalhudgovhudportal HUDsrc5 programofficesfair housing equal oppdisabilities inhousing
lsquo lsquo N o t i n M y B a c k y a r d rsquo rsquo u 9 1
J O S R E u V o l 6 u N o 1 ndash 2 0 1 4
Coulson NE and RM Leichenko The Internal and External Impact of HistoricalDesignation on Property Values Journal of Real Estate Finance and Economics 2001 231 113ndash24
Daneshvary N and TM Clauretie Toxic Neighbors Foreclosures and Short-SalesSpillover Effects from the Current Housing-Market Crash Economic Inquiry 2012 501217ndash31
Daneshvary N TM Clauretie and A Kader Short-Term Own-Price and Spillover Effectsof Distressed Residential Properties The Case of a Housing Crash Journal of Real EstateResearch 2011 332 179ndash207
Gibbons S The Cost of Urban Property Crime Economic Journal 2004 114 441ndash63
Grout CA WK Jaeger and AJ Plantinga Land-use Regulations and Property Valuesin Portland Oregon A Regression Discontinuity Design Approach Regional Science andUrban Economics 2011 482 98ndash107
Guignet D What Do Property Values Really Tell Us A Hedonic Study of UndergroundStorage Tanks Land Economics 2013 892 211ndash26
Harding JP E Rosenblatt and VW Yao The Contagion Effect of Foreclosed PropertiesJournal of Urban Economics 2009 663 164ndash78
Hite D W Chern F Hitzusen and A Randall Property-Value Impacts of anEnvironmental Disamenity The Case of Landfills Journal of Real Estate Finance andEconomics 2001 22 185ndash202
Hoen B R Wiser P Cappers M Thayer and G Sethi Wind Energy Facilities andResidential Properties The Effect of Proximity and View on Sales Prices Journal of RealEstate Research 2011 333 279ndash316
Ihlanfeldt K and T Mayock Panel Data Estimates of the Effects of Different Types ofCrime on Housing Prices Regional Science and Urban Economics 2010 40 161ndash72
Knight J Listing Price Time on Market and Ultimate Selling Price Causes and Effectsof Listing Price Changes Real Estate Economics 2002 302 213ndash37
Krainer J A Theory of Liquidity in Residential Real Estate Markets Journal of UrbanEconomics 2001 491 32ndash53
Kuminoff NV CF Parmeter and JC Pope Which Hedonic Models Can We Trust toRecover the Marginal Willingness to Pay for Environmental Amenities Journal ofEnvironmental Economics and Management 2010 603 145ndash60
Levitt SD and C Syverson Market Distortions When Agents Are Better Informed TheValue of Information in Real Estate Transactions Review of Economics and Statistics 2008904 599ndash611
Lin Z E Rosenblatt and VW Yao Spillover Effects of Foreclosures on NeighborhoodProperty Values Journal of Real Estate Finance and Economics 2009 383 387ndash407
Linden L and JE Rockoff Estimates of the Impact of Crime Risk on Property Valuesfrom Meganrsquos Law American Economic Review 2008 983 1103ndash27
Linn J The Effect of Voluntary Brownfields Programs on Nearby Property ValuesEvidence from Illinois Journal of Urban Economics 2013 78 1ndash18
McCluskey J and G Rausser Stigmatized Asset Value Is it Temporary or Long-TermReview of Economics and Statistics 2003 852 276ndash85
Munneke HJ CF Sirmans BA Slade and G Turnbull Housing RegulationExternalities and Residential Property Prices Real Estate Economics 2013 413 422ndash56
Pope D and J Pope Crime and Property Values Evidence from the 1990s Crime DropRegional Science and Urban Economic 2012 42 177ndash88
9 2 u L a R o c h e W a l l e r a n d W e n t l a n d
Pope J Fear of Crime and Housing Prices Household Reactions to Sex OffenderRegistries Journal of Urban Economics 2008 64 601ndash14
Reichert A M Small and S Mohanty The Impact of Landfills on Residential PropertyValues Journal of Real Estate Research 1992 73 297ndash314
Rosiers FD Power Lines Visual Encumbrance and House Values A MicrospatialApproach to Impact Measurement Journal of Real Estate Research 2002 233 275ndash301
Rossi-Hansberg E P-D Sarte and R Owens Housing Externalities Journal of PoliticalEconomy 2010 118 485ndash534
SAMHSA National Survey on Substance Abuse Treatment Services (N-SSATS) 2008http wwwsamhsagovsamhsanewsletter Volume 18 Number 1TreatmentFacilitiesaspx
Shaffer H Overcoming Addiction Paths Toward RecoverymdashA Harvard Medical SchoolSpecial Health Report 2012
Thaler R A Note on the Value of Crime Control Evidence from the Property MarketJournal of Urban Economics 1978 51 137ndash45
Turnbull G and J Dombrow Spatial Competition and Shopping Externalities Evidencefrom the Housing Market Journal of Real Estate Finance and Economics 2006 324391ndash408
Wentland S B Waller and R Brastow Estimating the Effect of Crime Risk on PropertyValues and Time on Market Evidence from Meganrsquos Law in Virginia Real EstateEconomics 2013 421 223ndash51
Yavas A and S Yang The Strategic Role of Listing Price in Marketing Real Estate Theoryand Evidence Real Estate Economics 1995 233 347ndash68
Zahirovic-Herbert V and G Turnbull School Quality House Prices and Liquidity Journalof Real Estate Finance and Economics 2008 37 113ndash30
Claire R La Roche Longwood University Farmville VA 23909 or larochecrlongwoodedu
Bennie D Waller Longwood University Farmville VA 23909 or wallerbdlongwoodedu
Scott A Wentland Longwood University Farmville VA 23909 or wentlandsalongwoodedu
6 4 u L a R o c h e W a l l e r a n d W e n t l a n d
Treatment centers tend to be inconspicuous and may have blackout curtains andminimal signage (or no sign) The housing is often gated and locked at a certaintime of the day Generally clients enrolled in residential treatment programs arenot allowed to interact with the lsquolsquolocalsrsquorsquo of the neighborhood or leave thepremises Under current law (discussed in the next section) despite theirchallenges residential treatment centers have relatively few limitations on wherethey are sited
On the other hand like many negative externalities or NIMBY issues there arereasons to suspect that rehab facilities may adversely impact neighboring realestate Substance abuse is a multifaceted health issue and many patients inresidential treatment have a dual diagnosis a mental health issue and an addiction(Connery 2011) The Substance Abuse Mental Health Services Administration(SAMHSA 2008) surveyed 14423 facilities in 2008 and had a response rate of941 The SAMHSA survey indicated that 39 of the clients in treatment centershad a dual diagnosis In addition concurrent alcohol and drug addiction accountedfor approximately 45 while clients in treatment solely for drug abuse accountedfor 34ndash36 and 18ndash20 of the patients only abused alcohol (SAMHSA2008)
One consequence of locating drug and alcohol rehabilitation centers in residentialareas is that patients in substance abuse treatment programs frequently leave orare administratively discharged before successful completion At some pointexperts say that lsquolsquorelapse is an almost unavoidablemdashand potentially usefulmdashstepin recoveryrsquorsquo (Shaffer 2012) For many intensive residential treatment is a lsquolsquolastresortrsquorsquo A healthy family of an addict will decline to lsquolsquoenablersquorsquo negative behaviorand instead will insist that the alcoholicaddict experience the lsquolsquoconsequencersquorsquoof the decision to use again and refuse treatment In other words the family willoften not offer any form of financial support and the addict will have to fend forhimself or herself In addition to having a substance abuse disorder and possiblya dual diagnosis those who relapse and leave treatment prior to completion oftenhave limited job skills and perhaps even a criminal recordmdashfactors that makeemployment a challenge Thus as a practical matter nearby neighbors may havevalid concerns that the presence of a treatment center will be accompanied byadditional unemployed or even homeless addicts on the street near the area inwhich the treatment center is located This perception of elevated risk in theseareas may then be reflected in the market prices of nearby real estate
The likely occurrence of relapse combined with the probability of criminal chargesandor convictions associated with substance abuse corroborates the argument thatthe presence of a treatment center may bring objectionable consequences into acommunity The purpose of this paper is to use market data to assess whetherthere is substantial evidence of nearby real estate being adversely impacted by thepresence of treatment centers consistent with the potential risks that proximity tothese facilities may bring As a clear-cut NIMBY issue this paper contributes tothe broader literature of examining the market effects of specific externalities orenvironmental factors in real estate Our study contributes to the literature by beingthe first to examine the effect of substance abuse treatment centers on the
lsquo lsquo N o t i n M y B a c k y a r d rsquo rsquo u 6 5
J O S R E u V o l 6 u N o 1 ndash 2 0 1 4
surrounding real estate market and more generally adding to our understandingof external factors that impact home prices
u S u b s t a n c e A b u s e T r e a t m e n t S a l i e n t I s s u e s
R e c e n t T r e n d s a n d R e l a t e d L i t e r a t u r e
It is anticipated that the impact of the July 1 2014 changes to insurance coverageunder the Affordable Care Act (ACA) will cause the number of treatment centersto burgeon and thus a study of the effect of nearby addiction treatment centerson real estate is timely Prior to investigating treatment centersrsquo effects on nearbyreal estate it is crucial to understand the background of substance abuse treatmentand why the current issues motivate the examination of potential real estateexternalities
Although accurate statistics of drug or alcohol disorders are difficult to obtainaccording to a Harvard Medical School Special Health Report between 15 and28 of Americans will have a substance use disorder sometime during theirlifetime and this estimate does not include addiction to nicotine (Shaffer 2012)Residential treatment has become a more common way to treat addiction and likemany areas in healthcare services residential rehabilitation has become a growthindustry
Broadly speaking there are three types of treatment centers intensive outpatientprogram (IOP) inpatient treatment and partial hospitalization program (PHP)Typically IOP treatment centers offer each client nine hours of group therapy onehour of individual therapy and one hour of case management (managing auxiliaryservices) per week IOP clients either live in a halfway house or at home withstrict guidelines established by their primary therapist Although halfway housescan vary greatly they generally have full-time house managers and mandatoryrandom urinalysis Inpatient programs require clients to live at the facility in whichall treatment takes place and may either be freestanding or hospital-based PHPalso known as the lsquolsquoFlorida modelrsquorsquo is a hybrid version of inpatient treatment andintensive outpatient treatment individuals go to a counseling center during theday and after a full day of therapy sessions return to off-site housing located ina neighborhood Behavioral health technicians work at the off-site facilities aroundthe clock
Mandatory addiction treatment (commitment) does not exist under the law Anaddict must choose to be in a recovery program It is interesting to note that allthree of the substance abuse treatment models include the possibility of grouphousing in neighborhood settings
Projected Increase in SUD Treatment Facilities MHPAEA and the
ACA
The Patient Protection and Affordable Care Act (PPACA) also known as ObamaCare made sweeping changes to Mental HealthSubstance Use Disorder
6 6 u L a R o c h e W a l l e r a n d W e n t l a n d
(MHSUD) insurance coverage that went into effect on July 1 2014 Tounderstand the ramifications for residential treatment centers it is necessary tobriefly examine the legislative history of MHSUD insurance coverage Prior toJuly 1 2014 the high cost of MHSUD treatment meant that it was only availableto patients with (or whose families have) considerable means or those whosehealth insurance provided coverage The Mental Health Parity and AddictionEquity Act of 2008 (MHPAEA) attempted to address the unequal treatment ofMHSUD health insurance coverage and legislated equal treatment between MHSUD benefits and medicalsurgical benefits If a plan had MHSUD coveragethen it must be on par with the medicalsurgical benefits offered under that policyThe MHPAEA did not mandate that an insurance policy must cover MHSUDand only applied to group health plans sponsored by employers with 50 or moreemployees Both individual and small employer group policies were specificallyexempted from coverage (MHPAEA Fact Sheet)
The PPACA mandates that MHSUD coverage be included in marketplace healthinsurance policies as an lsquolsquoessential health benefitrsquorsquo as of July 1 2014 (MHPAEAFact Sheet) The effect of inclusion of MHSUD coverage as an essential healthbenefit is that the MHSUD parity rules now apply to non-grandfatheredindividual and small group plans (Beronio Po Skopec and Glied 2013) Withexpansion of the lsquolsquoparity rulesrsquorsquo and inclusion of MHSUD coverage as anessential health benefit under the ACA it is anticipated that the number of patientshaving access to expensive addiction treatment options will grow exponentiallyas will the number of treatment centers
Antidiscrimination Housing Laws
When a proposed treatment center is sited concerned members of the communityfrequently pressure lawmakers or hire attorneys causing treatment centers to fightprotracted legal battles that attempt to prevent the opening of the center Howevernumerous laws hinder such NIMBY efforts providing legal basis for treatmentcenters to be located just about anywhere There are several federal laws thatprohibit discrimination in housing based on a lsquolsquodisabilityrsquorsquo and define disabilityas lsquolsquoAny person who has a physical or mental impairment that substantially limitsone or more major life activities has a record of such impairment or is regardedas having such impairmentrsquorsquo (HUD)
Substance abuse disorders are clearly recognized disabilities and thus are coveredunder fair housing laws Federal housing laws that prohibit disability-baseddiscrimination and ensure equal housing opportunities are briefly discussed below
Fair Housing Act The Fair Housing Act (FHA) was designed to prohibitdiscrimination in housing In 1988 the FHA was amended to include persons withhandicaps to the protected classes under the FHA 42 USC sect3604(f)(3)(B) Thedefinition of lsquolsquohandicaprsquorsquo under the FHA is very broad and drug addiction andalcoholism are considered to be disabilities that are covered The FHA also has aprovision (42 USC sect3604(f)(9)) that permits the exclusion of those lsquolsquowhosetenancy would constitute a direct threat to the health or safety of other individualsor would result in substantial physical damage to the property of othersrsquorsquo Thus
lsquo lsquo N o t i n M y B a c k y a r d rsquo rsquo u 6 7
J O S R E u V o l 6 u N o 1 ndash 2 0 1 4
the FHA does not protect an individual currently using illegal drugs or a personwith a conviction of distributing or illegally manufacturing a controlled substance
The FHA covers almost every aspect of a real estate transaction According to theAct it is illegal to discriminate in the sale or rental of a dwelling against a personwith a disability Thus an alcoholicaddict cannot be denied housing based solelyon his or her addiction The Act does permit lsquolsquoreasonable local State or Federalrestriction regarding the maximum number of occupants permitted to occupy adwellingrsquorsquo 42 USC sect3607(b)(1) This exemption is for living space per occupantand is intended to promote health and safety not exclude group homes fromresidential areas
Although a person with a conviction for dealing or illegally manufacturing acontrolled substance is not protected under the FHA a drug distribution convictiondoes not automatically exclude a person from invoking the Rehabilitation Act orthe Americans with Disabilities Act
Rehabilitation Act sect504 (45 CFR Part 84) of the Rehabilitation Act of 1973prohibits any entity from receiving federal funds from discriminating on the basisof a disability Drug addiction and alcoholism are covered under this act as wellCommunities have attempted to use zoning laws to exclude treatment centersUnder sect504 if a communityrsquos zoning regulation excludes substance abusetreatment centers that community risks losing its federal funds
Americans with Disabilities Act Among other things the purpose of Title II ofthe Americans with Disabilities Act (ADA) is to eliminate discrimination inhousing against people with disabilities This Act has further reach than sect504 ofthe Rehabilitation Act because the receipt of federal funds is not required for TitleII of the ADA to apply
Zoning and Case Law Zoning regulations create perhaps the biggest barrier toentry for a substance abuse center As a practical matter when considering aproposed site for a treatment center the owners prefer to avoid spending a lot oftime and money fighting a protracted court battle associated with a zoningordinance This mindset however did not stop a significant case from beingappealed to the United States Supreme Court by Oxford House a self-supportingresident-run residential treatment program In the landmark case of City ofEdmonds v Oxford House Inc et al 514 US 725 (1995) the City of Edmondsattempted to use an occupancy restriction in a zoning ordinance to excludetreatment centers from residential areas The zoning ordinance in question allowedan unlimited number of related persons to live in a home and attempted to restrictthe number of unrelated persons living in a single-family dwelling to five TheCity of Edmonds claimed that the sect3607(b)(1) exemption to the FHA applied tothe cityrsquos zoning ordinance In a 5ndash4 decision the Supreme Court held that azoning ordinance that defined a family in such a way as to exclude treatmentcenters was unlawful The ordinance was not a maximum occupancy provisionbut a provision describing who may compose a lsquolsquofamilyrsquorsquo and thus it violated theFHA This case was a critical victory for the lsquolsquoOxford House Modelrsquorsquo becausethis community-based treatment program leases houses located in upscaleneighborhoods across the US
6 8 u L a R o c h e W a l l e r a n d W e n t l a n d
The bottom line is that there must be a lsquolsquorational basisrsquorsquo for zoning regulation tobe valid and localities have consistently been prohibited from discriminatingagainst substance abuse treatment centers Absent drastic changes to the lawsoutlined above it is clear that residential centers are here to stay and that ifchallenged in court NIMBY proponents will have an uphill battle Thus giventhe growth trends in this industry the potential risks posed to neighbors and thelaws that protect the treatment centersrsquo rights to locate almost anywhere what isthe consequence for real estate when a treatment center is located in onersquoslsquolsquobackyardrsquorsquo so to speak
Related Literature in Real Estate
Researchers have long recognized that numerous externalities impact themarketing outcomes of residential real estate These externalities may include forexample neighboring pollution1 or even the condition of adjoining or nearbyproperties andor the tenantrsquos behavior living in such properties Real propertyhas intangible benefits or disamenities which are determined largely by publicperception and capitalized into the pricing and marketing duration of residentialproperties Furthermore negative externalities are likely to significantly impact themarketing outcomes of properties in close proximity to the properties beingmarketed for sale as well as impact the desirability of the overall neighborhoodSuch lsquolsquostigmarsquorsquo events are likely to be correlated with an exodus of higher incomeresidents causing a lsquolsquosnowballrsquorsquo effect in declining property values (McCluskeyand Rausser 2003)
There are a number of researchers who analyze the degree to which external orneighborhood factors both positive and negative are capitalized in residentialreal estate marketing outcomes For example Thaler (1978) finds a negativerelationship between neighborhood crime rates and property values Gibbons(2004) finds an inverse relationship between vandalism and property values inLondon As one would expect robbery and aggravated assault rates have asignificant and negative impact on property values (Ihanfeldt and Mayock 2010)Pope (2012) found that decrease in crime rates had a positive effect on propertyvalues particularly in those cities with substantial decreases in crime rates Usinga microspatial approach Rosiers (2002) examined the impact of the visualencumbrance of power lines on property value and finds that on average itnegatively impacts value by approximately 10 but increases to 14 in areaswhere setback in property lines are less
As a result of the recent economic and housing collapse there are several studiesthat have examined the impact of foreclosed properties Foreclosed properties maypresent a variety of negative effects on neighboring properties including (but notlimited to) the lsquolsquoeyesore effectrsquorsquo where neighboring foreclosures that have longbeen vacant adversely impact the aesthetic appeal of the neighborhood Suchstudies include Harding Rosenblatt and Yao (2009) Lin Rosenblatt and Yao(2009) Daneshvary Clauretie and Kader (2011) Daneshvary and Clauretie(2012) and Agarwal Ambrose Chomsisengphet and Sanders (2013) Generallythese studies find negative neighborhood spillovers from foreclosed or distressedproperties
lsquo lsquo N o t i n M y B a c k y a r d rsquo rsquo u 6 9
J O S R E u V o l 6 u N o 1 ndash 2 0 1 4
A review of the literature does not reveal any specific examples of residential drugrehabilitation centers and their impact on neighboring property values Howeverthere is analogous literature of undesirable neighbors impacting property valuesFor example Congdon-Hohman (2013) finds a significant and negative effect onhome values located within one-eighth of a mile of a methamphetamine lab Theeffect dissipates both as time passes after the discovery of and distance from ameth lab Reichert Small and Mohanty (1992) estimate the impact of landfillson nearby real estate finding a negative impact when located within several blocksof an expensive housing area They find an effect that ranges from 55 to 73depending on the distance from the landfill Indeed the authors find that thepercentage impact on older less expensive properties to be significantly less (3ndash4) relative to the more expensive properties Similarly Hite Chern Hitzusenand Randall (2001) find significant differences in property values located within325 miles of a landfill
Other studies have shown that a variety of other external factors affect real estatemarket outcomes Coulson and Leichenko (2001) find that designated propertiesas well as neighboring properties are significantly impacted by historicaldesignations Other examples include the impact of registered sex offenders onthe marketing outcomes of neighboring properties Three recent studies haveexamined the impact as to the proximity of registered sex offenders Most recentlyWentland Waller and Brastow (2014) found that close proximity to sex offendersrendered large price and liquidity effects declining but significant out to one mileThe authors also found amplified effects for homes with more bedrooms a proxyfor children and whether the nearby offender was convicted of a violent sexoffense Linden and Rockoff (2008) found significant reductions in home pricesacross radii of less than 01 miles and 01 to 03 miles when an offender movesin Pope (2008) found properties located within 01 miles of a sex offendersignificantly reduced home values
u D a t a
We use residential real estate data from a multiple listing service (MLS) locatedin central Virginia including Richmond and other surrounding areas MLS dataare critical for any externality study particularly those that analyze both time onmarket and price because it contains both the list date and sell date (or withdrawdate) of residential properties while tax data and other publically available datausually only include the propertyrsquos date of sale This is critical because nearbyamenities or disamenities may be capitalized into a homersquos price liquidity orsome combination of the two In this study we examine both While the expectedsign of living near a potential disamenity is likely negative for the price estimatesthe estimated impact on liquidity is theoretically ambiguous While the disamenitymay lower the arrival rate of potential buyers lengthening the time on marketthe seller may be willing to discount the home in part to counteract this effect
The sample is composed of listings in the residential real estate market overapproximately a decade between 2001 and 2011 The initial housing data contains207793 observations (including both sold and unsold properties) Among others
7 0 u L a R o c h e W a l l e r a n d W e n t l a n d
Levitt and Syverson (2008) point out that MLS data are entered by real estateagents and can be incorrect or incomplete The data were carefully examined inlight of common issues prevalent in the data After culling for incomplete missingor illogical data that suggest data entry errors or extravagant outliers the finaldata set consists of approximately 194983 homes on the market withapproximately 111580 that eventually sold2 The MLS data include numerousproperty characteristics (square footage bedrooms baths age acreage etc) andof course each propertyrsquos location
Our MLS data are a fairly representative housing market in the US whichincludes urban suburban and rural sales Richmond is a medium-sized citylocated in the eastern part of central Virginia and the MLS covers much of thelsquolsquoGreater Richmondrsquorsquo area (or Richmond MSA) The average property in this MLShas a listing and selling price of $263641 and $242116 respectively The averagelisted property was 25 years of age with 2143 square feet 36 bedrooms and24 bathrooms with an average time on market of 85 days During this time periodthere were 36 substance abuse treatment centers located within the broader regionencompassing the listings in our data and nine were located within the city limitsof Richmond specifically3 See Exhibit 1 for additional descriptive statistics
The primary source of the treatment center externality is its proximity to a givenhome on the market Intuitively there is likely an increasing NIMBY sentimentas the proximity to the center is closer in distance Thus we compute the distancefrom a given home in the MLS and each treatment center using address data tocode the longitude and latitude from which the straight-line distance is calculatedusing the great-circle formula While NIMBY does not literally refer to onersquoslsquolsquobackyardrsquorsquo it is usually taken to mean very close proximity but the definition ofwhat qualifies as lsquolsquovery close proximityrsquorsquo may be different depending on the personand the issue Below we examine the effect of nearby substance abuse treatmentcenters on nearby real estate using different spatial proximities (eg 0175 miles015 miles and 0125 miles) as a robustness check4
Empirical Methodology
Our primary goal is to isolate the effect of a treatment center on neighborhoodreal estate outcomes Numerous studies have examined other neighborhoodexternalities using a variety of empirical approaches5 Initially we focus on atreatment centerrsquos effect on the sale price and liquidity of a home utilizing across-sectional OLS hedonic pricing model as the baseline While hedonic pricingmodels are commonly used to determine the value of specific property attributesand surrounding (dis)amenities by estimating marginal effects on the sale price ofthe property6 we also explore a simultaneous equation model to account for thejoint determination of both price and liquidity The purpose of exploring multipleapproaches is to demonstrate that the results are not particularly sensitive to thechoice of modeling technique
Baseline OLS Hedonic Models
Beginning with a simple cross-sectional approach we provide a baseline estimateof the effect of a nearby substance abuse treatment center employing a traditional
lsquo lsquo N o t i n M y B a c k y a r d rsquo rsquo u 7 1
J O S R E u V o l 6 u N o 1 ndash 2 0 1 4
Exhibit 1 u Summary Statistics
Variable Mean Std Dev
List Price ($) 263641 142300
Sale Price ($) 242116 127608
Time on Market (in Days) 8545 7999
Rehab Center (Dummy Var 5 1 if the home is near a rehab center(distance specified in each table) 0 otherwise)
00003 002
Age (in Years) 2499 2616
Acreage 079 191
Square Feet 214329 88825
Bedrooms 360 077
Bathrooms 238 082
Foreclosure (Dummy Var 5 1 if foreclosure 0 otherwise) 002 012
Number of levels 183 065
Pool (Dummy Var 5 1 if the home has a pool 0 otherwise) 005 023
Basement (Dummy Var 5 1 if they have a basement 0 otherwise) 017 038
Short Sale (Dummy Var 5 1 if short sale 0 otherwise) 002 013
Tenant (Dummy Var 5 1 if it has a tenant at listing 0 otherwise) 003 016
Vacant (Dummy Var 5 1 if the home is vacant 0 otherwise) 036 048
Taxes 177995 131174
HOA Fees (Dummy Var 5 1 if it has HOA fees 0 otherwise) 032 047
Listing Density 6441 57740
Competition 58222 106208
Note Location and year fixed effects summary stats omitted
hedonic model that accounts for heterogeneous characteristics of both homes andtheir locations We estimate the following functional forms
SP 5 w (X LOC T TOM ) 1 laquo (1)i P i i i i
and
TOM 5 w (X LOC T LP ) 1 laquo (2)i P i i i i
where SPi is a vector for property selling price7 LPi is a vector for property listingprice Xi is a vector of property specific characteristics8 LOCi is a vector forlocation control using ZIP Codes (see below) Ti the variable of interest equals
7 2 u L a R o c h e W a l l e r a n d W e n t l a n d
1 if a treatment center is located nearby of a given homei and is 0 otherwiseTOMi is the time on market (in days) which the literature also calls marketingduration or a measure of liquidity and laquo is an error term that is heteroskedastic-consistent and clustered by ZIP Code9
Hedonic analysis of the housing market requires some control for spatialheterogeneity because location itself is a key source of differences in housingprices The goal is to disentangle specific proximity to a treatment center frombroader location differences that explain real estate prices Following numerousstudies in the real estate and urban economics literature we chose ZIP Code fixedeffects to control for unobserved heterogeneity across these areas so that theexplanatory variablesrsquo effects are identified from variation within a given area (oreven in a given year as is the case for time fixed effects) In effect our resultsmay then be interpreted as the treatment centerrsquos effect on home prices givencomparable homes within the same ZIP Code but located further away In thissense we are attempting to disentangle the broader location effect from theproximity to a treatment center by essentially comparing homes within a certainZIP Code Further we explore alternative location controls (census tracts blockgroups and blocks) in a similar vein as well as altering the control group itselfby confining it to narrow bands around a rehab facility Appropriate locationcontrols can disentangle the negative externality effect from simply a lsquolsquobadneighborhoodrsquorsquo or lsquolsquobad part of townrsquorsquo effect
Simultaneous Equations Approach System Identification
Numerous studies in real estate and urban economics model price and time onmarket in a simultaneous system (like 2SLS or 3SLS) given likely jointdetermination of these factors A seller can always lower price to increaseliquidity and vice versa Yet a homersquos sale price and time on market aredetermined by virtually identical factors Econometrically this creates anidentification problem because if one wants to model this simultaneity with asystem of equations then by definition such a system could not be identifiedusing identical exogenous variables While a number of empirical studiesacknowledge this simultaneity10 Turnbull and Dombrow (2006) and Zahirovic-Herbert and Turnbull (2008) have identified a novel way of overcoming thisidentification problem through their incorporation of variables that representmarket conditions from other listings on the market Below we summarize asolution to this identification issue as we utilize an adapted form of this approachto model price and liquidity in a simultaneous system
Following Krainerrsquos (2001) search market model one can model a homersquosexpected liquidity E[TOM] (measured as a homersquos marketing duration or timeon market) and expected house sale price E[SP] as simultaneously determinedand implicitly defined as
F(E[SP] E[TOM] T X LOC C) 5 0 (3)
lsquo lsquo N o t i n M y B a c k y a r d rsquo rsquo u 7 3
J O S R E u V o l 6 u N o 1 ndash 2 0 1 4
where T is an indicator of whether a home is near a rehab treatment center Xis a vector of house (and market) characteristics LOC is location controls andC are neighborhood market conditions The latter variable C representsneighborhood market conditions that have an ambiguous external effect on localproperties On one hand when the number of nearby homes that go on the marketincreases the supply of additional homes on the market ought to negatively impactthe price and liquidity of a nearby home (ie lsquolsquoa competition effectrsquorsquo) On theother hand the increased traffic generated from additional nearby homes on themarket could actually positively impact a homersquos price and liquidity which istermed lsquolsquoa shopping externality effectrsquorsquo Empirically the sales price and time onmarket can be represented as separate functions with jointly distributed stochasticerrors laquop and laquoT
SP 5 w (TOM T LOC X C) 1 laquo (4)p p
and
TOM 5 w (SP T LOC X C) 1 laquo (5)T T
The vector C (ie market conditions or neighborhood competition) and anothervector L (ie listing density) are the keys to Turnbull and Dombrowrsquos (2006)solution to over-identifying this system of equations (since equations 3 and 4 arenot yet identified) Neighborhood competition C is a measure that accounts forlsquolsquonearby houses for sale as long as each competing listed house overlaps with theperiod that this house is on the market inversely weighted by the distance betweenthe houses to reflect the assumption that nearby houses will have stronger effectson the sale of this house than houses that are farther awayrsquorsquo (Zahirovic-Herbertand Turnbull 2008)11 Listing density L is similarly defined as lsquolsquothe measureof competing overlapping listings per day on the marketrsquorsquo (Zahirovic-Herbertand Turnbull 2008) where L(i) 5 oj(1 2 D(i j))2min[s(i) s( j)] 2 max[l(i)l( j)]s(i) 2 l(i) 1 1 Essentially both measures capture neighborhood marketconditions by quantifying the marketing overlap of nearby homes on the marketsimultaneously however listing density is weighted by time on market Turnbulland Dombrow (2006) point out that a change in competition while holding sellingtime constant is also the partial derivative with respect to listing density (and itis easy to see that shywp shyC [ shywp shyL) Therefore we can rewrite our system ofequations to reflect
SP 5 w (TOM T LOC X L) 1 laquo (6)p p
7 4 u L a R o c h e W a l l e r a n d W e n t l a n d
and
TOM 5 w (SP T LOC X C) 1 laquo (7)T T
Both L and C vectors uniquely identify the simultaneous system Further wesupplement this approach by using different location controls across equations12
We estimate the system of equations (5) and (6) using three-stage least squares(3SLS) in the next section to generate a coefficient estimate of the effect of anearby treatment center on price and time on market We model simultaneity usinga 3SLS approach because it incorporates an additional step with seeminglyunrelated regression (SUR) estimation to control for correlations between errorterms13
Alternative Specifications and Robustness
While the baseline results include location controls an additional way to isolatethe treatment effect of a rehab facility is by limiting the control group to homescloser to rehab facilities more generally (ie omitting observations sufficiently farfrom any rehab facility) Methodologically the comparison is then between homesthat are near a rehab treatment facility and homes just outside a given rangeSpecifically we explore the effect of a rehab center (within 18 mile) on nearbyreal estate as compared to similar homes further out (ie within 15 miles 1 mileand 23 mile respectively) This approach allows us to further homogenizelocation as a robustness check and to provide additional evidence that the externaleffect is specific to the rehab facility and not simply the part of town in which itis located
We also examine whether facilities that only treat opiate addicts (commonlyknown as methadone clinics) have a larger impact on nearby real estate Clinicsthat treat heroin or prescription addicts for example often use buprenorphine ormethadone as part of the rehabilitation process Nearby residents may perceivepatients who are still intoxicated albeit at a lower dose as an elevated crime riskApproximately half of the 36 treatment centers in our sample only treat opiateaddiction (hereinafter referred to as methadone clinics) We examine whethernearby real estate is more affected by methadone clinics specifically
u R e s u l t s
Baseline OLS Results
The baseline OLS results provide evidence that nearby treatment centers adverselyimpact surrounding home values but have little if any impact on property liquidityEstimating equations (1) and (2) Exhibit 2 shows that this adverse effect is notqualitatively sensitive to the choice of the definition of lsquolsquonearbyrsquorsquo Column 1 showsthat the presence of a rehab center within 0125 (18) miles is associated with
lsquolsquoN
ot
in
My
Ba
ck
ya
rd
rsquorsquo
u7
5
JO
SR
Eu
Vo
l
6u
No
1
ndash2
01
4
Exhibit 2 u Effect of a Nearby Rehab Center on a Homersquos Price and Liquidity Baseline OLS Results
Dependent Variable ln(Sale Price) Dependent Variable ln(Days on Market)
Notes This table presents results of hedonic OLS models showing the effect of a nearby (ie within 0125 mile 015 mile and 0175 mile) rehab facility on apropertyrsquos sale price and time on market (errors clustered by ZIP Code) T-statistics are in parentheses The number of observation in columns 1ndash3 is 117187 thenumber of observation in columns 4ndash6 is 206420Significant at the 10 levelSignificant at the 5 levelSignificant at the 1 level
lsquo lsquo N o t i n M y B a c k y a r d rsquo rsquo u 7 7
J O S R E u V o l 6 u N o 1 ndash 2 0 1 4
approximately an 8 reduction in home values The corresponding impact ontime on market is not statistically significant at any conventional level providinginitial evidence that the externality is primarily capitalized into home prices ratherthan liquidity Indeed columns 2 and 3 show that homes sold for approximately6 or 5 less if they were located within 015 miles or 0175 miles of a rehabcenter respectively While qualitatively similar these coefficient estimates alsoprovide some evidence that the externality may be diminishing in distance asadditional further properties are included in the latter estimates The regressionstabulated in columns 5 and 6 tell approximately the same story as column 4 inthat there is little evidence that rehab centers have a statistically significant impacton a homersquos liquidity
The real estate literature has not adopted a single way to control for spatialheterogeneity In Exhibit 3 we examine a few common alternatives to controllingfor location The initial estimates in Exhibit 2 use ZIP Codes to control for spatialheterogeneity In Exhibit 3 we use census tract fixed effects (columns 1 and 4)block group fixed effect (columns 2 and 5) and block fixed effects (columns 3and 6) Census tracts according to the US Census are lsquolsquosmall relativelypermanent statistical subdivisions of a county designed to be homogenous withrespect to population characteristics economic status and living conditionsrsquorsquo14
Census block groups are subsets of census tracts and blocks are further subsetsof block groups One can think of these as different measures of lsquolsquoneighborhoodsrsquorsquobroadly to more narrowly defined The results from the price regressions in Exhibit3 are consistent with Exhibit 2 falling within a fraction of a percentage point ofone another with an effect of approximately 72 to 79 Columns 4ndash6 inExhibit 3 also show that substance abuse treatment centers are not associated witha statistically significant impact on nearby property liquidity Overall it is clearthat the estimates of the effect of a substance abuse treatment center on nearbyreal estate is not particularly sensitive to the choice of location controls providingevidence that the external effect of substance abuse treatment centers is robust
Simultaneous Equation Results
When price and time on market are modeled within a simultaneous 3SLS systemof equations the estimated effect of a nearby substance abuse treatment center onhome price and liquidity are similar to the OLS results finding that nearbysubstance abuse treatment centers are associated with an approximately 8 dropin home values (within 18 mile) Column 1 in Exhibit 4 displays this result Likethe initial OLS results the 3SLS estimations also show that substance abusetreatment centers have little impact on nearby property liquidity as the externalityappears to be capitalized into price exclusively Exhibit 4 provides additionalevidence that the external impact of substance abuse treatment centers is robustto multiple modeling approaches that are common in empirical real estate studies
Exhibit 4 also provides evidence that not all substance abuse treatment centersmay be perceived by nearby residents as presenting equal risk It is possible thatmethadone clinics have a greater NIMBY sentiment from the broader communityWe test this proposition empirically by exclusively examining the effect of
78
uL
aR
oc
he
W
alle
r
an
dW
en
tla
nd
Exhibit 3 u Effect of a Nearby Rehab Center on a Homersquos Price and Liquidity with Different Location Controls
Dependent Variable ln(Sale Price) Dependent Variable ln(Days on Market)
Notes This table presents results of hedonic OLS models showing the effect of a nearby (ie within 0125 mile) rehab facility on a propertyrsquos sale price and time onmarket while controlling for different spatialarea fixed effects Errors are clustered by spatial area in each regression respectively T-statistics are in parentheses Thenumber of observation in columns 1ndash3 is 116663 the number of observation in columns 4ndash6 is 205281Significant at the 10 levelSignificant at the 5 levelSignificant at the 1 level
8 0 u L a R o c h e W a l l e r a n d W e n t l a n d
Exhibit 4 u Effect of a Nearby Rehab and Methadone Treatment Center on a Homersquos Price and
Liquidity
DependentVariableln(Sale Price)
DependentVariableln(Days on Market)
DependentVariableln(Sale Price)
DependentVariableln(Days on Market)
(1) (2) (3) (4)
Rehab Center 18 Mile 20077 20009(2244) (2004)
Meth Center 18 Mile 20174 0192(2235) (033)
ln(Age of Home) 20063 0125 20063 0125(211893) (1089) (211892) (1086)
HOA Fees 0059 20076 0059 20076(4151) (2507) (4150) (2505)
ln(Time on Market) 0050 0050(4552) (4545)
ln(Sale Price) 1254 1248(748) (744)
lsquo lsquo N o t i n M y B a c k y a r d rsquo rsquo u 8 1
J O S R E u V o l 6 u N o 1 ndash 2 0 1 4
Exhibit 4 u (continued)
Effect of a Nearby Rehab and Methadone Treatment Center on a Homersquos Price and Liquidity
DependentVariableln(Sale Price)
DependentVariableln(Days on Market)
DependentVariableln(Sale Price)
DependentVariableln(Days on Market)
(1) (2) (3) (4)
Listing Density 0000 0000(2193) (2195)
Competition 0000 0000(2148) (2150)
Location Controls u u u u
Year Fixed Effects u u u u
Notes This table presents the results of hedonic 3SLS models showing the effect of a nearby (ie within0125 mile) rehab facility and a rehab facility that treats methadone addiction specifically on a propertyrsquossale price and time on market constant omitted here for brevity Z-statistics are in parentheses The numberof observations in columns 1ndash4 is 110361Significant at the 10 levelSignificant at the 5 levelSignificant at the 1 level
methadone clinics Columns 3 and 4 in Exhibit 4 display the results of the same3SLS estimations as columns 1 and 2 but confining the treatment variable to adummy variable that equals one if the home is within 0125 mile of a methadoneclinic The coefficient estimates in Exhibit 4 indicate that homes within 0125miles of a methadone clinic sell for approximately a 17 discount relative tohomes that are located further away holding other factors constant There is littleevidence however that these clinics affect nearby home liquidity Overall Exhibit4 provides evidence that the market differentiates among risks generated by thesepotential externalities and the treatment centers that may be perceived as havinga higher risk to their neighbors have a much greater impact on the surroundingreal estate market
As a robustness check in Exhibit 5 we explore the extent to which the controlgroups matter finding results generally consistent with those in Exhibit 4 Acritique of hedonic models for estimating any externality might be that theinterpretation of the dummy variable essentially defines the control group ashomes not located near (within 0125 miles) the potential externality Defining thecontrol group in this way may present some unobserved spatial heterogeneityissues To address this issue in Exhibits 5 and 6 we estimate the same regressionsas Exhibit 4 but confine the sample to homes that are located within 15 miles1 mile and 06 miles of a rehab facility respectively The results are consistentwith the initial 3SLS estimates in Exhibit 4 and by extension the initial OLSestimates in Exhibits 2 and 3 Both exhibits show that homes near substance abuse
82
uL
aR
oc
he
W
alle
r
an
dW
en
tla
nd
Exhibit 5 u Effect of a Nearby Rehab Facility on a Homersquos Sale Price and Days on Market
DependentVariableln(Sale Price)
DependentVariableln(Days on Market)
DependentVariableln(Sale Price)
DependentVariableln(Days on Market)
DependentVariableln(Sale Price)
DependentVariableln(Days on Market)
Within 15 Miles of a Rehab Facility Within 1 Mile of a Rehab Facility Within 06 Miles of a Rehab Facility
ln(Time on Market) 0043 0019 0010(1091) (380) (150)
ln(Sale Price) 1023 0071 0295(198) (012) (039)
Listing Density 0000 0000 0000(630) (433) (235)
84
uL
aR
oc
he
W
alle
r
an
dW
en
tla
nd
Exhibit 5 u (continued)
Effect of a Nearby Rehab Facility on a Homersquos Sale Price and Days on Market
DependentVariableln(Sale Price)
DependentVariableln(Days on Market)
DependentVariableln(Sale Price)
DependentVariableln(Days on Market)
DependentVariableln(Sale Price)
DependentVariableln(Days on Market)
Within 15 Miles of a Rehab Facility Within 1 Mile of a Rehab Facility Within 06 Miles of a Rehab Facility
(1a) (1b) (2a) (2b) (3a) (3b)
Competition 0000 0000 0000(880) (626) (595)
Location Controls u u u u u u
Year Fixed Effects u u u u u u
Notes This table presents the 3SLS results of simultaneous estimation of the effect of a nearby rehab facility on a homersquos selling price and liquidity (time on market)changing the sample to vary the control groups by smaller radii from a rehab center Z-statistics are in parentheses The number of observations in columns 1ndash2 is7711 the number of observations in columns 3ndash4 is 3589 the number of observations in columns 5ndash6 is 1324Significant at the 10 levelSignificant at the 5 levelSignificant at the 1 level
lsquolsquoN
ot
in
My
Ba
ck
ya
rd
rsquorsquo
u8
5
JO
SR
Eu
Vo
l
6u
No
1
ndash2
01
4
Exhibit 6 u Effect of a Nearby Rehab Facility that Treats Methadone Addiction
DependentVariableln(Sale Price)
DependentVariableln(Days on Market)
DependentVariableln(Sale Price)
DependentVariableln(Days on Market)
DependentVariableln(Sale Price)
DependentVariableln(Days on Market)
Within 15 Miles of a Rehab Facility Within 1 Mile of a Rehab Facility Within 06 Miles of a Rehab Facility
ln(Time on Market) 0042 0020 0012(1081) (393) (167)
ln(Sale Price) 0955 0082 0322(185) (014) (043)
Listing Density 0000 0000 0000(642) (440) (248)
lsquolsquoN
ot
in
My
Ba
ck
ya
rd
rsquorsquo
u8
7
JO
SR
Eu
Vo
l
6u
No
1
ndash2
01
4
Exhibit 6 u (continued)
Effect of a Nearby Rehab Facility that Treats Methadone Addiction
DependentVariableln(Sale Price)
DependentVariableln(Days on Market)
DependentVariableln(Sale Price)
DependentVariableln(Days on Market)
DependentVariableln(Sale Price)
DependentVariableln(Days on Market)
Within 15 Miles of a Rehab Facility Within 1 Mile of a Rehab Facility Within 06 Miles of a Rehab Facility
(1a) (1b) (2a) (2b) (3a) (3b)
Competition 0000 0000 0000(886) (625) (589)
Location Controls u u u u u u
Year Fixed Effects u u u u u u
Notes This table presents 3SLS results of simultaneous estimation of the effect of a nearby rehab facility that treats methadone addiction on a homersquos selling price andliquidity (time on market) changing the sample to vary the control groups by smaller radii from a rehab center Z-statistics are in parentheses The number ofobservations in column 1 is 7711 the number of observations in column 2 is 3589 the number of observations in column 3 is 1324Significant at the 10 levelSignificant at the 5 levelSignificant at the 1 level
8 8 u L a R o c h e W a l l e r a n d W e n t l a n d
treatment centers are still negatively impacted and by approximately the samemagnitudes Indeed the last two columns are particularly striking Given that thisis already a lsquolsquowithin neighborhoodrsquorsquo estimation by controlling for location thefact that the substance abuse treatment center result is robust when the controlgroup is reduced to 1 mile and 06 miles indicates that unobserved spatialheterogeneity is not likely driving the core results of this paper More intuitivelythis provides strong evidence that the substance abuse treatment center effect isnot simply a lsquolsquobad part of town effectrsquorsquo in that we are comparing lsquolsquoapples withapplesrsquorsquo across the dimension of location and the principle characteristicdistinguishing the variation in prices in these areas is the presence of a nearbysubstance abuse treatment center Based on these results we cannot conclude thatthere is a robust impact on property liquidity but there appears to be a robustnegative relationship between the presence of a substance abuse treatment centerand nearby home values
u C o n c l u s i o n
In this study we find evidence that residential substance abuse treatment centersadversely impact the price of neighboring homes We find that homes within 18mile of a treatment center sell for approximately 8 less than otherwisecomparable homes that are located further away Furthermore we find that themarket differentiates between potential risks that nearby treatment centers maycarry as living near a methadone clinic that treats opiate addictions such as heroinor morphine may be associated with a reduction in home values by as much as17 We find little evidence that nearby treatment centers affect a homersquos timeon market
Examining this particular externality is important to the broader literature onneighborhood externalities and environmental factors as well as the specificliterature on the issue of residential treatment centers The PPACA has expandedMHSUD coverage and made intensive treatment options affordable and as aresult demand for effective substance abuse treatment is increasing Operating atreatment center is a growing industry and it is reasonable to assume that newcenters will be built nationally many of which will be sited near or withinresidential communities Indeed there is very little that individuals and localitiescan do to prohibit a substance abuse treatment center from locating in a residentialarea because alcohol and drug addiction is considered to be a handicap and thusalcoholicaddicts in recovery are members of a protected class under the federalanti-discrimination housing laws Hence as residential treatment centers becomemore common it is important to understand all their effects including the effectsthey may have on nearby real estate and how markets price the potential risk ofnearby externalities
u E n d n o t e s1 For a more complete review on the impact of environmental externalities see Boyle and
Kiel (2001)
lsquo lsquo N o t i n M y B a c k y a r d rsquo rsquo u 8 9
J O S R E u V o l 6 u N o 1 ndash 2 0 1 4
2 Consistent with other real estate studies we culled outliers from our data set confiningour data to more lsquolsquotypicalrsquorsquo range of homes listed at less than $1000000 fewer than10 bedrooms fewer than 16 acres (99 of observations) property taxes paid that wereless $10000 (99 of observations) and younger than 150 years old (99 ofobservations) For our other dependent variable of interest time on market we similarlytrim the 1 extremes Generally the findings are not sensitive to dropping theseobservations Further important to disclose how our data has been trimmed fortransparency and replicability As an additional quality check a sample of the MLS datawas compared to county tax records which contain data on price and housingcharacteristics
3 There were approximately 153 96 and 60 properties listed within 0175 miles 015miles and 0125 miles of a rehab treatment facility respectively over the time periodof our study Given the very recent and projected growth of rehab centers nationallyfuture research will be able to take advantage of additional homes (data points) beingbought and sold near rehab facilities
4 The choice of this radius does not fundamentally alter the qualitative conclusions of thisstudy The definition of onersquos lsquolsquobackyardrsquorsquo is somewhat ambiguous and may differdepending on an individualrsquos perception Some externality studies use 01 mile 02 mileor 03 mile as a radius to examine a given externality While similar results are obtainedlooking at bands slightly larger and slightly smaller we follow Congdon-Hohman (2013)and use 18 mile in most of our tabulated regression results An easy way to think of0125 miles 015 miles and 0175 miles is that these are 25 minute 3 minute and 35minute walks respectively (assuming a pace of 3 miles per hour)
5 For recent examples of amenity or disamenity studies of externality effects see Asabereand Huffman (1991) Gibbons (2004) Linden and Rockoff (2008) Pope (2008) Rossi-Hansberg Sarte and Owens (2010) Campbell Giglio and Pathek (2011) Hoen WiserCappers Thayer and Sethi (2011) Daneshvary Clauretie and Kader (2011) GroutJaeger and Plantinga (2011) Daneshvary and Clauretie (2012) Congdon-Hohman(2013) Guignet (2013) Linn (2013) Munneke Sirmans Slade and Turnbull (2013)and Wentland Waller and Brastow (2014)
6 Recent examples include neighborhood foreclosure effects (Harding Rosenblatt andYao 2009 Lin Rosenblatt and Yao 2009 Agarwal Ambrose Chomsisengphet andSanders 2010)
7 Kuminoff Parmeter and Pope (2010) survey 69 hedonic studies and found that 80rely on linear semi-log or log-log functional form We have explored a number of non-linear functional forms and our results remain robust Rather than repeat all of the abovemodels with various non-linear explanatory variables the authors will produce resultsof alternative specifications upon request
8 For example we use the following property specific variables square footage ageacreage number of bedrooms bathrooms number of stories new vacant HOA feeswhether it has a pool a tenant a basement and whether it is a short sale or foreclosureWe also include year fixed effects to control for variation over time
9 When we explore different location controls later we will cluster by location (egcensus tract block group or block)
10 For example see Yavas and Yang (1995) Knight (2002) and Turnbull and Dombrow(2006)
11 Specifically both our paper and Zahirovic-Herbert and Turnbull (2008) calculate C inthe following way lsquolsquoThe days-on-market or selling time is s(i) 2 l(i) 1 1 where l(i)and s(i) are the listing date and sales date for house i Denoting the listing date and
9 0 u L a R o c h e W a l l e r a n d W e n t l a n d
sales date for house j by l( j) and s( j) the overlapping time on the market for these twohouses is min[s(i) s( j)] 2 max[l(i) l( j)] The straight-line distance in miles betweenhouses i and j is D(i j) The measured competition for house i is C(i) 5 oj (1 2 D(ij))2min[s(i) s( j)] 2 max[l(i) l( j)] where the summation is taken over all competinghouses j that is houses for sale within one mile and 20 larger or smaller in livingarea of house irsquorsquo (Zahirovic-Herbert and Turnbull 2008)
12 At the suggestion of a reviewer we also identify the system by using different controlvariables A simple way to do this is to use different location controls We use ZIP Codefixed effects in the price equation and census tract fixed effects in the time on marketequation Generally the results are not very sensitive to which location controls are usedin each equation Further the results are similar when we use the Turnbull and Dombrow(2006) method alone to identify the system
13 According to Belsley (1988) when there are strong interrelations among error terms3SLS is used instead of 2SLS in estimating systems of equations because it is moreefficient Specifically one would expect unobservables that contribute to error inestimating price to be also correlated the error in liquidity
14 See wwwcensusgov for more detail specifically http wwwcensusgovgeowwwcobtr metadatahtmlgad
u R e f e r e n c e s
Agarwal S B Ambrose S Chomsisengphet and AB Sanders Thy NeighborrsquosMortgage Does Living in a Subprime Neighborhood Affect Onersquos Probability of DefaultReal Estate Economics 2012 401 1ndash22
Asabere P and F Huffman Historic Districts and Land Values Journal of Real EstateResearch 1991 61 1ndash8
Augusta Chronicle Neighbors Oppose Upscale Rehab Facility in South Augusta http chronicleaugustacomnewshealth2013-08-05neighbors-oppose-upscale-rehab-facility-south-augusta August 5 2013
Belsley DA Two- or Three-stage Least Squares Computational Economics 1988 1 21ndash30
Beronio K R Po L Skopec and S Glied ASPE Research Brief Affordable Care ActWill Expand Mental Health and Substance Use Disorder Benefits and Parity Protectionsfor 62 Million Americans http aspehhsgovhealthreports 2013mental rb mentalcfm February 20 2013
Boyle M and K Kiel A Survey of House Price Hedonic Studies of the Impact ofEnvironmental Externalities Journal of Real Estate Literature 2001 92 117ndash44
Campbell JY S Giglio and P Pathak Forced Sales and House Prices AmericanEconomic Review 2011 1015 2108ndash31
City of Edmonds v Oxford House Inc et al 514 US 725 1995
Congdon-Hohman J The Lasting Effects of Crime The Relationship of DiscoveredMethamphetamine Laboratories and Home Values Regional Science and UrbanEconomics 2013 431 31ndash41
Connery H Alcohol Use and AbusemdashA Harvard Medical School Special Health Report2011 Fact Sheet MHPAEA http wwwdolgovebsanewsroomfsmhpaeahtml HUDDisability Rights in Housing http portalhudgovhudportal HUDsrc5 programofficesfair housing equal oppdisabilities inhousing
lsquo lsquo N o t i n M y B a c k y a r d rsquo rsquo u 9 1
J O S R E u V o l 6 u N o 1 ndash 2 0 1 4
Coulson NE and RM Leichenko The Internal and External Impact of HistoricalDesignation on Property Values Journal of Real Estate Finance and Economics 2001 231 113ndash24
Daneshvary N and TM Clauretie Toxic Neighbors Foreclosures and Short-SalesSpillover Effects from the Current Housing-Market Crash Economic Inquiry 2012 501217ndash31
Daneshvary N TM Clauretie and A Kader Short-Term Own-Price and Spillover Effectsof Distressed Residential Properties The Case of a Housing Crash Journal of Real EstateResearch 2011 332 179ndash207
Gibbons S The Cost of Urban Property Crime Economic Journal 2004 114 441ndash63
Grout CA WK Jaeger and AJ Plantinga Land-use Regulations and Property Valuesin Portland Oregon A Regression Discontinuity Design Approach Regional Science andUrban Economics 2011 482 98ndash107
Guignet D What Do Property Values Really Tell Us A Hedonic Study of UndergroundStorage Tanks Land Economics 2013 892 211ndash26
Harding JP E Rosenblatt and VW Yao The Contagion Effect of Foreclosed PropertiesJournal of Urban Economics 2009 663 164ndash78
Hite D W Chern F Hitzusen and A Randall Property-Value Impacts of anEnvironmental Disamenity The Case of Landfills Journal of Real Estate Finance andEconomics 2001 22 185ndash202
Hoen B R Wiser P Cappers M Thayer and G Sethi Wind Energy Facilities andResidential Properties The Effect of Proximity and View on Sales Prices Journal of RealEstate Research 2011 333 279ndash316
Ihlanfeldt K and T Mayock Panel Data Estimates of the Effects of Different Types ofCrime on Housing Prices Regional Science and Urban Economics 2010 40 161ndash72
Knight J Listing Price Time on Market and Ultimate Selling Price Causes and Effectsof Listing Price Changes Real Estate Economics 2002 302 213ndash37
Krainer J A Theory of Liquidity in Residential Real Estate Markets Journal of UrbanEconomics 2001 491 32ndash53
Kuminoff NV CF Parmeter and JC Pope Which Hedonic Models Can We Trust toRecover the Marginal Willingness to Pay for Environmental Amenities Journal ofEnvironmental Economics and Management 2010 603 145ndash60
Levitt SD and C Syverson Market Distortions When Agents Are Better Informed TheValue of Information in Real Estate Transactions Review of Economics and Statistics 2008904 599ndash611
Lin Z E Rosenblatt and VW Yao Spillover Effects of Foreclosures on NeighborhoodProperty Values Journal of Real Estate Finance and Economics 2009 383 387ndash407
Linden L and JE Rockoff Estimates of the Impact of Crime Risk on Property Valuesfrom Meganrsquos Law American Economic Review 2008 983 1103ndash27
Linn J The Effect of Voluntary Brownfields Programs on Nearby Property ValuesEvidence from Illinois Journal of Urban Economics 2013 78 1ndash18
McCluskey J and G Rausser Stigmatized Asset Value Is it Temporary or Long-TermReview of Economics and Statistics 2003 852 276ndash85
Munneke HJ CF Sirmans BA Slade and G Turnbull Housing RegulationExternalities and Residential Property Prices Real Estate Economics 2013 413 422ndash56
Pope D and J Pope Crime and Property Values Evidence from the 1990s Crime DropRegional Science and Urban Economic 2012 42 177ndash88
9 2 u L a R o c h e W a l l e r a n d W e n t l a n d
Pope J Fear of Crime and Housing Prices Household Reactions to Sex OffenderRegistries Journal of Urban Economics 2008 64 601ndash14
Reichert A M Small and S Mohanty The Impact of Landfills on Residential PropertyValues Journal of Real Estate Research 1992 73 297ndash314
Rosiers FD Power Lines Visual Encumbrance and House Values A MicrospatialApproach to Impact Measurement Journal of Real Estate Research 2002 233 275ndash301
Rossi-Hansberg E P-D Sarte and R Owens Housing Externalities Journal of PoliticalEconomy 2010 118 485ndash534
SAMHSA National Survey on Substance Abuse Treatment Services (N-SSATS) 2008http wwwsamhsagovsamhsanewsletter Volume 18 Number 1TreatmentFacilitiesaspx
Shaffer H Overcoming Addiction Paths Toward RecoverymdashA Harvard Medical SchoolSpecial Health Report 2012
Thaler R A Note on the Value of Crime Control Evidence from the Property MarketJournal of Urban Economics 1978 51 137ndash45
Turnbull G and J Dombrow Spatial Competition and Shopping Externalities Evidencefrom the Housing Market Journal of Real Estate Finance and Economics 2006 324391ndash408
Wentland S B Waller and R Brastow Estimating the Effect of Crime Risk on PropertyValues and Time on Market Evidence from Meganrsquos Law in Virginia Real EstateEconomics 2013 421 223ndash51
Yavas A and S Yang The Strategic Role of Listing Price in Marketing Real Estate Theoryand Evidence Real Estate Economics 1995 233 347ndash68
Zahirovic-Herbert V and G Turnbull School Quality House Prices and Liquidity Journalof Real Estate Finance and Economics 2008 37 113ndash30
Claire R La Roche Longwood University Farmville VA 23909 or larochecrlongwoodedu
Bennie D Waller Longwood University Farmville VA 23909 or wallerbdlongwoodedu
Scott A Wentland Longwood University Farmville VA 23909 or wentlandsalongwoodedu
lsquolsquoN
ot
in
My
Ba
ck
ya
rd
rsquorsquo
u7
5
JO
SR
Eu
Vo
l
6u
No
1
ndash2
01
4
Exhibit 2 u Effect of a Nearby Rehab Center on a Homersquos Price and Liquidity Baseline OLS Results
Dependent Variable ln(Sale Price) Dependent Variable ln(Days on Market)
Notes This table presents results of hedonic OLS models showing the effect of a nearby (ie within 0125 mile 015 mile and 0175 mile) rehab facility on apropertyrsquos sale price and time on market (errors clustered by ZIP Code) T-statistics are in parentheses The number of observation in columns 1ndash3 is 117187 thenumber of observation in columns 4ndash6 is 206420Significant at the 10 levelSignificant at the 5 levelSignificant at the 1 level
lsquo lsquo N o t i n M y B a c k y a r d rsquo rsquo u 7 7
J O S R E u V o l 6 u N o 1 ndash 2 0 1 4
approximately an 8 reduction in home values The corresponding impact ontime on market is not statistically significant at any conventional level providinginitial evidence that the externality is primarily capitalized into home prices ratherthan liquidity Indeed columns 2 and 3 show that homes sold for approximately6 or 5 less if they were located within 015 miles or 0175 miles of a rehabcenter respectively While qualitatively similar these coefficient estimates alsoprovide some evidence that the externality may be diminishing in distance asadditional further properties are included in the latter estimates The regressionstabulated in columns 5 and 6 tell approximately the same story as column 4 inthat there is little evidence that rehab centers have a statistically significant impacton a homersquos liquidity
The real estate literature has not adopted a single way to control for spatialheterogeneity In Exhibit 3 we examine a few common alternatives to controllingfor location The initial estimates in Exhibit 2 use ZIP Codes to control for spatialheterogeneity In Exhibit 3 we use census tract fixed effects (columns 1 and 4)block group fixed effect (columns 2 and 5) and block fixed effects (columns 3and 6) Census tracts according to the US Census are lsquolsquosmall relativelypermanent statistical subdivisions of a county designed to be homogenous withrespect to population characteristics economic status and living conditionsrsquorsquo14
Census block groups are subsets of census tracts and blocks are further subsetsof block groups One can think of these as different measures of lsquolsquoneighborhoodsrsquorsquobroadly to more narrowly defined The results from the price regressions in Exhibit3 are consistent with Exhibit 2 falling within a fraction of a percentage point ofone another with an effect of approximately 72 to 79 Columns 4ndash6 inExhibit 3 also show that substance abuse treatment centers are not associated witha statistically significant impact on nearby property liquidity Overall it is clearthat the estimates of the effect of a substance abuse treatment center on nearbyreal estate is not particularly sensitive to the choice of location controls providingevidence that the external effect of substance abuse treatment centers is robust
Simultaneous Equation Results
When price and time on market are modeled within a simultaneous 3SLS systemof equations the estimated effect of a nearby substance abuse treatment center onhome price and liquidity are similar to the OLS results finding that nearbysubstance abuse treatment centers are associated with an approximately 8 dropin home values (within 18 mile) Column 1 in Exhibit 4 displays this result Likethe initial OLS results the 3SLS estimations also show that substance abusetreatment centers have little impact on nearby property liquidity as the externalityappears to be capitalized into price exclusively Exhibit 4 provides additionalevidence that the external impact of substance abuse treatment centers is robustto multiple modeling approaches that are common in empirical real estate studies
Exhibit 4 also provides evidence that not all substance abuse treatment centersmay be perceived by nearby residents as presenting equal risk It is possible thatmethadone clinics have a greater NIMBY sentiment from the broader communityWe test this proposition empirically by exclusively examining the effect of
78
uL
aR
oc
he
W
alle
r
an
dW
en
tla
nd
Exhibit 3 u Effect of a Nearby Rehab Center on a Homersquos Price and Liquidity with Different Location Controls
Dependent Variable ln(Sale Price) Dependent Variable ln(Days on Market)
Notes This table presents results of hedonic OLS models showing the effect of a nearby (ie within 0125 mile) rehab facility on a propertyrsquos sale price and time onmarket while controlling for different spatialarea fixed effects Errors are clustered by spatial area in each regression respectively T-statistics are in parentheses Thenumber of observation in columns 1ndash3 is 116663 the number of observation in columns 4ndash6 is 205281Significant at the 10 levelSignificant at the 5 levelSignificant at the 1 level
8 0 u L a R o c h e W a l l e r a n d W e n t l a n d
Exhibit 4 u Effect of a Nearby Rehab and Methadone Treatment Center on a Homersquos Price and
Liquidity
DependentVariableln(Sale Price)
DependentVariableln(Days on Market)
DependentVariableln(Sale Price)
DependentVariableln(Days on Market)
(1) (2) (3) (4)
Rehab Center 18 Mile 20077 20009(2244) (2004)
Meth Center 18 Mile 20174 0192(2235) (033)
ln(Age of Home) 20063 0125 20063 0125(211893) (1089) (211892) (1086)
HOA Fees 0059 20076 0059 20076(4151) (2507) (4150) (2505)
ln(Time on Market) 0050 0050(4552) (4545)
ln(Sale Price) 1254 1248(748) (744)
lsquo lsquo N o t i n M y B a c k y a r d rsquo rsquo u 8 1
J O S R E u V o l 6 u N o 1 ndash 2 0 1 4
Exhibit 4 u (continued)
Effect of a Nearby Rehab and Methadone Treatment Center on a Homersquos Price and Liquidity
DependentVariableln(Sale Price)
DependentVariableln(Days on Market)
DependentVariableln(Sale Price)
DependentVariableln(Days on Market)
(1) (2) (3) (4)
Listing Density 0000 0000(2193) (2195)
Competition 0000 0000(2148) (2150)
Location Controls u u u u
Year Fixed Effects u u u u
Notes This table presents the results of hedonic 3SLS models showing the effect of a nearby (ie within0125 mile) rehab facility and a rehab facility that treats methadone addiction specifically on a propertyrsquossale price and time on market constant omitted here for brevity Z-statistics are in parentheses The numberof observations in columns 1ndash4 is 110361Significant at the 10 levelSignificant at the 5 levelSignificant at the 1 level
methadone clinics Columns 3 and 4 in Exhibit 4 display the results of the same3SLS estimations as columns 1 and 2 but confining the treatment variable to adummy variable that equals one if the home is within 0125 mile of a methadoneclinic The coefficient estimates in Exhibit 4 indicate that homes within 0125miles of a methadone clinic sell for approximately a 17 discount relative tohomes that are located further away holding other factors constant There is littleevidence however that these clinics affect nearby home liquidity Overall Exhibit4 provides evidence that the market differentiates among risks generated by thesepotential externalities and the treatment centers that may be perceived as havinga higher risk to their neighbors have a much greater impact on the surroundingreal estate market
As a robustness check in Exhibit 5 we explore the extent to which the controlgroups matter finding results generally consistent with those in Exhibit 4 Acritique of hedonic models for estimating any externality might be that theinterpretation of the dummy variable essentially defines the control group ashomes not located near (within 0125 miles) the potential externality Defining thecontrol group in this way may present some unobserved spatial heterogeneityissues To address this issue in Exhibits 5 and 6 we estimate the same regressionsas Exhibit 4 but confine the sample to homes that are located within 15 miles1 mile and 06 miles of a rehab facility respectively The results are consistentwith the initial 3SLS estimates in Exhibit 4 and by extension the initial OLSestimates in Exhibits 2 and 3 Both exhibits show that homes near substance abuse
82
uL
aR
oc
he
W
alle
r
an
dW
en
tla
nd
Exhibit 5 u Effect of a Nearby Rehab Facility on a Homersquos Sale Price and Days on Market
DependentVariableln(Sale Price)
DependentVariableln(Days on Market)
DependentVariableln(Sale Price)
DependentVariableln(Days on Market)
DependentVariableln(Sale Price)
DependentVariableln(Days on Market)
Within 15 Miles of a Rehab Facility Within 1 Mile of a Rehab Facility Within 06 Miles of a Rehab Facility
ln(Time on Market) 0043 0019 0010(1091) (380) (150)
ln(Sale Price) 1023 0071 0295(198) (012) (039)
Listing Density 0000 0000 0000(630) (433) (235)
84
uL
aR
oc
he
W
alle
r
an
dW
en
tla
nd
Exhibit 5 u (continued)
Effect of a Nearby Rehab Facility on a Homersquos Sale Price and Days on Market
DependentVariableln(Sale Price)
DependentVariableln(Days on Market)
DependentVariableln(Sale Price)
DependentVariableln(Days on Market)
DependentVariableln(Sale Price)
DependentVariableln(Days on Market)
Within 15 Miles of a Rehab Facility Within 1 Mile of a Rehab Facility Within 06 Miles of a Rehab Facility
(1a) (1b) (2a) (2b) (3a) (3b)
Competition 0000 0000 0000(880) (626) (595)
Location Controls u u u u u u
Year Fixed Effects u u u u u u
Notes This table presents the 3SLS results of simultaneous estimation of the effect of a nearby rehab facility on a homersquos selling price and liquidity (time on market)changing the sample to vary the control groups by smaller radii from a rehab center Z-statistics are in parentheses The number of observations in columns 1ndash2 is7711 the number of observations in columns 3ndash4 is 3589 the number of observations in columns 5ndash6 is 1324Significant at the 10 levelSignificant at the 5 levelSignificant at the 1 level
lsquolsquoN
ot
in
My
Ba
ck
ya
rd
rsquorsquo
u8
5
JO
SR
Eu
Vo
l
6u
No
1
ndash2
01
4
Exhibit 6 u Effect of a Nearby Rehab Facility that Treats Methadone Addiction
DependentVariableln(Sale Price)
DependentVariableln(Days on Market)
DependentVariableln(Sale Price)
DependentVariableln(Days on Market)
DependentVariableln(Sale Price)
DependentVariableln(Days on Market)
Within 15 Miles of a Rehab Facility Within 1 Mile of a Rehab Facility Within 06 Miles of a Rehab Facility
ln(Time on Market) 0042 0020 0012(1081) (393) (167)
ln(Sale Price) 0955 0082 0322(185) (014) (043)
Listing Density 0000 0000 0000(642) (440) (248)
lsquolsquoN
ot
in
My
Ba
ck
ya
rd
rsquorsquo
u8
7
JO
SR
Eu
Vo
l
6u
No
1
ndash2
01
4
Exhibit 6 u (continued)
Effect of a Nearby Rehab Facility that Treats Methadone Addiction
DependentVariableln(Sale Price)
DependentVariableln(Days on Market)
DependentVariableln(Sale Price)
DependentVariableln(Days on Market)
DependentVariableln(Sale Price)
DependentVariableln(Days on Market)
Within 15 Miles of a Rehab Facility Within 1 Mile of a Rehab Facility Within 06 Miles of a Rehab Facility
(1a) (1b) (2a) (2b) (3a) (3b)
Competition 0000 0000 0000(886) (625) (589)
Location Controls u u u u u u
Year Fixed Effects u u u u u u
Notes This table presents 3SLS results of simultaneous estimation of the effect of a nearby rehab facility that treats methadone addiction on a homersquos selling price andliquidity (time on market) changing the sample to vary the control groups by smaller radii from a rehab center Z-statistics are in parentheses The number ofobservations in column 1 is 7711 the number of observations in column 2 is 3589 the number of observations in column 3 is 1324Significant at the 10 levelSignificant at the 5 levelSignificant at the 1 level
8 8 u L a R o c h e W a l l e r a n d W e n t l a n d
treatment centers are still negatively impacted and by approximately the samemagnitudes Indeed the last two columns are particularly striking Given that thisis already a lsquolsquowithin neighborhoodrsquorsquo estimation by controlling for location thefact that the substance abuse treatment center result is robust when the controlgroup is reduced to 1 mile and 06 miles indicates that unobserved spatialheterogeneity is not likely driving the core results of this paper More intuitivelythis provides strong evidence that the substance abuse treatment center effect isnot simply a lsquolsquobad part of town effectrsquorsquo in that we are comparing lsquolsquoapples withapplesrsquorsquo across the dimension of location and the principle characteristicdistinguishing the variation in prices in these areas is the presence of a nearbysubstance abuse treatment center Based on these results we cannot conclude thatthere is a robust impact on property liquidity but there appears to be a robustnegative relationship between the presence of a substance abuse treatment centerand nearby home values
u C o n c l u s i o n
In this study we find evidence that residential substance abuse treatment centersadversely impact the price of neighboring homes We find that homes within 18mile of a treatment center sell for approximately 8 less than otherwisecomparable homes that are located further away Furthermore we find that themarket differentiates between potential risks that nearby treatment centers maycarry as living near a methadone clinic that treats opiate addictions such as heroinor morphine may be associated with a reduction in home values by as much as17 We find little evidence that nearby treatment centers affect a homersquos timeon market
Examining this particular externality is important to the broader literature onneighborhood externalities and environmental factors as well as the specificliterature on the issue of residential treatment centers The PPACA has expandedMHSUD coverage and made intensive treatment options affordable and as aresult demand for effective substance abuse treatment is increasing Operating atreatment center is a growing industry and it is reasonable to assume that newcenters will be built nationally many of which will be sited near or withinresidential communities Indeed there is very little that individuals and localitiescan do to prohibit a substance abuse treatment center from locating in a residentialarea because alcohol and drug addiction is considered to be a handicap and thusalcoholicaddicts in recovery are members of a protected class under the federalanti-discrimination housing laws Hence as residential treatment centers becomemore common it is important to understand all their effects including the effectsthey may have on nearby real estate and how markets price the potential risk ofnearby externalities
u E n d n o t e s1 For a more complete review on the impact of environmental externalities see Boyle and
Kiel (2001)
lsquo lsquo N o t i n M y B a c k y a r d rsquo rsquo u 8 9
J O S R E u V o l 6 u N o 1 ndash 2 0 1 4
2 Consistent with other real estate studies we culled outliers from our data set confiningour data to more lsquolsquotypicalrsquorsquo range of homes listed at less than $1000000 fewer than10 bedrooms fewer than 16 acres (99 of observations) property taxes paid that wereless $10000 (99 of observations) and younger than 150 years old (99 ofobservations) For our other dependent variable of interest time on market we similarlytrim the 1 extremes Generally the findings are not sensitive to dropping theseobservations Further important to disclose how our data has been trimmed fortransparency and replicability As an additional quality check a sample of the MLS datawas compared to county tax records which contain data on price and housingcharacteristics
3 There were approximately 153 96 and 60 properties listed within 0175 miles 015miles and 0125 miles of a rehab treatment facility respectively over the time periodof our study Given the very recent and projected growth of rehab centers nationallyfuture research will be able to take advantage of additional homes (data points) beingbought and sold near rehab facilities
4 The choice of this radius does not fundamentally alter the qualitative conclusions of thisstudy The definition of onersquos lsquolsquobackyardrsquorsquo is somewhat ambiguous and may differdepending on an individualrsquos perception Some externality studies use 01 mile 02 mileor 03 mile as a radius to examine a given externality While similar results are obtainedlooking at bands slightly larger and slightly smaller we follow Congdon-Hohman (2013)and use 18 mile in most of our tabulated regression results An easy way to think of0125 miles 015 miles and 0175 miles is that these are 25 minute 3 minute and 35minute walks respectively (assuming a pace of 3 miles per hour)
5 For recent examples of amenity or disamenity studies of externality effects see Asabereand Huffman (1991) Gibbons (2004) Linden and Rockoff (2008) Pope (2008) Rossi-Hansberg Sarte and Owens (2010) Campbell Giglio and Pathek (2011) Hoen WiserCappers Thayer and Sethi (2011) Daneshvary Clauretie and Kader (2011) GroutJaeger and Plantinga (2011) Daneshvary and Clauretie (2012) Congdon-Hohman(2013) Guignet (2013) Linn (2013) Munneke Sirmans Slade and Turnbull (2013)and Wentland Waller and Brastow (2014)
6 Recent examples include neighborhood foreclosure effects (Harding Rosenblatt andYao 2009 Lin Rosenblatt and Yao 2009 Agarwal Ambrose Chomsisengphet andSanders 2010)
7 Kuminoff Parmeter and Pope (2010) survey 69 hedonic studies and found that 80rely on linear semi-log or log-log functional form We have explored a number of non-linear functional forms and our results remain robust Rather than repeat all of the abovemodels with various non-linear explanatory variables the authors will produce resultsof alternative specifications upon request
8 For example we use the following property specific variables square footage ageacreage number of bedrooms bathrooms number of stories new vacant HOA feeswhether it has a pool a tenant a basement and whether it is a short sale or foreclosureWe also include year fixed effects to control for variation over time
9 When we explore different location controls later we will cluster by location (egcensus tract block group or block)
10 For example see Yavas and Yang (1995) Knight (2002) and Turnbull and Dombrow(2006)
11 Specifically both our paper and Zahirovic-Herbert and Turnbull (2008) calculate C inthe following way lsquolsquoThe days-on-market or selling time is s(i) 2 l(i) 1 1 where l(i)and s(i) are the listing date and sales date for house i Denoting the listing date and
9 0 u L a R o c h e W a l l e r a n d W e n t l a n d
sales date for house j by l( j) and s( j) the overlapping time on the market for these twohouses is min[s(i) s( j)] 2 max[l(i) l( j)] The straight-line distance in miles betweenhouses i and j is D(i j) The measured competition for house i is C(i) 5 oj (1 2 D(ij))2min[s(i) s( j)] 2 max[l(i) l( j)] where the summation is taken over all competinghouses j that is houses for sale within one mile and 20 larger or smaller in livingarea of house irsquorsquo (Zahirovic-Herbert and Turnbull 2008)
12 At the suggestion of a reviewer we also identify the system by using different controlvariables A simple way to do this is to use different location controls We use ZIP Codefixed effects in the price equation and census tract fixed effects in the time on marketequation Generally the results are not very sensitive to which location controls are usedin each equation Further the results are similar when we use the Turnbull and Dombrow(2006) method alone to identify the system
13 According to Belsley (1988) when there are strong interrelations among error terms3SLS is used instead of 2SLS in estimating systems of equations because it is moreefficient Specifically one would expect unobservables that contribute to error inestimating price to be also correlated the error in liquidity
14 See wwwcensusgov for more detail specifically http wwwcensusgovgeowwwcobtr metadatahtmlgad
u R e f e r e n c e s
Agarwal S B Ambrose S Chomsisengphet and AB Sanders Thy NeighborrsquosMortgage Does Living in a Subprime Neighborhood Affect Onersquos Probability of DefaultReal Estate Economics 2012 401 1ndash22
Asabere P and F Huffman Historic Districts and Land Values Journal of Real EstateResearch 1991 61 1ndash8
Augusta Chronicle Neighbors Oppose Upscale Rehab Facility in South Augusta http chronicleaugustacomnewshealth2013-08-05neighbors-oppose-upscale-rehab-facility-south-augusta August 5 2013
Belsley DA Two- or Three-stage Least Squares Computational Economics 1988 1 21ndash30
Beronio K R Po L Skopec and S Glied ASPE Research Brief Affordable Care ActWill Expand Mental Health and Substance Use Disorder Benefits and Parity Protectionsfor 62 Million Americans http aspehhsgovhealthreports 2013mental rb mentalcfm February 20 2013
Boyle M and K Kiel A Survey of House Price Hedonic Studies of the Impact ofEnvironmental Externalities Journal of Real Estate Literature 2001 92 117ndash44
Campbell JY S Giglio and P Pathak Forced Sales and House Prices AmericanEconomic Review 2011 1015 2108ndash31
City of Edmonds v Oxford House Inc et al 514 US 725 1995
Congdon-Hohman J The Lasting Effects of Crime The Relationship of DiscoveredMethamphetamine Laboratories and Home Values Regional Science and UrbanEconomics 2013 431 31ndash41
Connery H Alcohol Use and AbusemdashA Harvard Medical School Special Health Report2011 Fact Sheet MHPAEA http wwwdolgovebsanewsroomfsmhpaeahtml HUDDisability Rights in Housing http portalhudgovhudportal HUDsrc5 programofficesfair housing equal oppdisabilities inhousing
lsquo lsquo N o t i n M y B a c k y a r d rsquo rsquo u 9 1
J O S R E u V o l 6 u N o 1 ndash 2 0 1 4
Coulson NE and RM Leichenko The Internal and External Impact of HistoricalDesignation on Property Values Journal of Real Estate Finance and Economics 2001 231 113ndash24
Daneshvary N and TM Clauretie Toxic Neighbors Foreclosures and Short-SalesSpillover Effects from the Current Housing-Market Crash Economic Inquiry 2012 501217ndash31
Daneshvary N TM Clauretie and A Kader Short-Term Own-Price and Spillover Effectsof Distressed Residential Properties The Case of a Housing Crash Journal of Real EstateResearch 2011 332 179ndash207
Gibbons S The Cost of Urban Property Crime Economic Journal 2004 114 441ndash63
Grout CA WK Jaeger and AJ Plantinga Land-use Regulations and Property Valuesin Portland Oregon A Regression Discontinuity Design Approach Regional Science andUrban Economics 2011 482 98ndash107
Guignet D What Do Property Values Really Tell Us A Hedonic Study of UndergroundStorage Tanks Land Economics 2013 892 211ndash26
Harding JP E Rosenblatt and VW Yao The Contagion Effect of Foreclosed PropertiesJournal of Urban Economics 2009 663 164ndash78
Hite D W Chern F Hitzusen and A Randall Property-Value Impacts of anEnvironmental Disamenity The Case of Landfills Journal of Real Estate Finance andEconomics 2001 22 185ndash202
Hoen B R Wiser P Cappers M Thayer and G Sethi Wind Energy Facilities andResidential Properties The Effect of Proximity and View on Sales Prices Journal of RealEstate Research 2011 333 279ndash316
Ihlanfeldt K and T Mayock Panel Data Estimates of the Effects of Different Types ofCrime on Housing Prices Regional Science and Urban Economics 2010 40 161ndash72
Knight J Listing Price Time on Market and Ultimate Selling Price Causes and Effectsof Listing Price Changes Real Estate Economics 2002 302 213ndash37
Krainer J A Theory of Liquidity in Residential Real Estate Markets Journal of UrbanEconomics 2001 491 32ndash53
Kuminoff NV CF Parmeter and JC Pope Which Hedonic Models Can We Trust toRecover the Marginal Willingness to Pay for Environmental Amenities Journal ofEnvironmental Economics and Management 2010 603 145ndash60
Levitt SD and C Syverson Market Distortions When Agents Are Better Informed TheValue of Information in Real Estate Transactions Review of Economics and Statistics 2008904 599ndash611
Lin Z E Rosenblatt and VW Yao Spillover Effects of Foreclosures on NeighborhoodProperty Values Journal of Real Estate Finance and Economics 2009 383 387ndash407
Linden L and JE Rockoff Estimates of the Impact of Crime Risk on Property Valuesfrom Meganrsquos Law American Economic Review 2008 983 1103ndash27
Linn J The Effect of Voluntary Brownfields Programs on Nearby Property ValuesEvidence from Illinois Journal of Urban Economics 2013 78 1ndash18
McCluskey J and G Rausser Stigmatized Asset Value Is it Temporary or Long-TermReview of Economics and Statistics 2003 852 276ndash85
Munneke HJ CF Sirmans BA Slade and G Turnbull Housing RegulationExternalities and Residential Property Prices Real Estate Economics 2013 413 422ndash56
Pope D and J Pope Crime and Property Values Evidence from the 1990s Crime DropRegional Science and Urban Economic 2012 42 177ndash88
9 2 u L a R o c h e W a l l e r a n d W e n t l a n d
Pope J Fear of Crime and Housing Prices Household Reactions to Sex OffenderRegistries Journal of Urban Economics 2008 64 601ndash14
Reichert A M Small and S Mohanty The Impact of Landfills on Residential PropertyValues Journal of Real Estate Research 1992 73 297ndash314
Rosiers FD Power Lines Visual Encumbrance and House Values A MicrospatialApproach to Impact Measurement Journal of Real Estate Research 2002 233 275ndash301
Rossi-Hansberg E P-D Sarte and R Owens Housing Externalities Journal of PoliticalEconomy 2010 118 485ndash534
SAMHSA National Survey on Substance Abuse Treatment Services (N-SSATS) 2008http wwwsamhsagovsamhsanewsletter Volume 18 Number 1TreatmentFacilitiesaspx
Shaffer H Overcoming Addiction Paths Toward RecoverymdashA Harvard Medical SchoolSpecial Health Report 2012
Thaler R A Note on the Value of Crime Control Evidence from the Property MarketJournal of Urban Economics 1978 51 137ndash45
Turnbull G and J Dombrow Spatial Competition and Shopping Externalities Evidencefrom the Housing Market Journal of Real Estate Finance and Economics 2006 324391ndash408
Wentland S B Waller and R Brastow Estimating the Effect of Crime Risk on PropertyValues and Time on Market Evidence from Meganrsquos Law in Virginia Real EstateEconomics 2013 421 223ndash51
Yavas A and S Yang The Strategic Role of Listing Price in Marketing Real Estate Theoryand Evidence Real Estate Economics 1995 233 347ndash68
Zahirovic-Herbert V and G Turnbull School Quality House Prices and Liquidity Journalof Real Estate Finance and Economics 2008 37 113ndash30
Claire R La Roche Longwood University Farmville VA 23909 or larochecrlongwoodedu
Bennie D Waller Longwood University Farmville VA 23909 or wallerbdlongwoodedu
Scott A Wentland Longwood University Farmville VA 23909 or wentlandsalongwoodedu
76
uL
aR
oc
he
W
alle
r
an
dW
en
tla
nd
Exhibit 2 u (continued)
Effect of a Nearby Rehab Center on a Homersquos Price and Liquidity Baseline OLS Results
Dependent Variable ln(Sale Price) Dependent Variable ln(Days on Market)
(1) (2) (3) (4) (5) (6)
Short Sale 200935 200935 200935 03775 03775 03775(21268) (21268) (21267) (1807) (1808) (1807)
Notes This table presents results of hedonic OLS models showing the effect of a nearby (ie within 0125 mile 015 mile and 0175 mile) rehab facility on apropertyrsquos sale price and time on market (errors clustered by ZIP Code) T-statistics are in parentheses The number of observation in columns 1ndash3 is 117187 thenumber of observation in columns 4ndash6 is 206420Significant at the 10 levelSignificant at the 5 levelSignificant at the 1 level
lsquo lsquo N o t i n M y B a c k y a r d rsquo rsquo u 7 7
J O S R E u V o l 6 u N o 1 ndash 2 0 1 4
approximately an 8 reduction in home values The corresponding impact ontime on market is not statistically significant at any conventional level providinginitial evidence that the externality is primarily capitalized into home prices ratherthan liquidity Indeed columns 2 and 3 show that homes sold for approximately6 or 5 less if they were located within 015 miles or 0175 miles of a rehabcenter respectively While qualitatively similar these coefficient estimates alsoprovide some evidence that the externality may be diminishing in distance asadditional further properties are included in the latter estimates The regressionstabulated in columns 5 and 6 tell approximately the same story as column 4 inthat there is little evidence that rehab centers have a statistically significant impacton a homersquos liquidity
The real estate literature has not adopted a single way to control for spatialheterogeneity In Exhibit 3 we examine a few common alternatives to controllingfor location The initial estimates in Exhibit 2 use ZIP Codes to control for spatialheterogeneity In Exhibit 3 we use census tract fixed effects (columns 1 and 4)block group fixed effect (columns 2 and 5) and block fixed effects (columns 3and 6) Census tracts according to the US Census are lsquolsquosmall relativelypermanent statistical subdivisions of a county designed to be homogenous withrespect to population characteristics economic status and living conditionsrsquorsquo14
Census block groups are subsets of census tracts and blocks are further subsetsof block groups One can think of these as different measures of lsquolsquoneighborhoodsrsquorsquobroadly to more narrowly defined The results from the price regressions in Exhibit3 are consistent with Exhibit 2 falling within a fraction of a percentage point ofone another with an effect of approximately 72 to 79 Columns 4ndash6 inExhibit 3 also show that substance abuse treatment centers are not associated witha statistically significant impact on nearby property liquidity Overall it is clearthat the estimates of the effect of a substance abuse treatment center on nearbyreal estate is not particularly sensitive to the choice of location controls providingevidence that the external effect of substance abuse treatment centers is robust
Simultaneous Equation Results
When price and time on market are modeled within a simultaneous 3SLS systemof equations the estimated effect of a nearby substance abuse treatment center onhome price and liquidity are similar to the OLS results finding that nearbysubstance abuse treatment centers are associated with an approximately 8 dropin home values (within 18 mile) Column 1 in Exhibit 4 displays this result Likethe initial OLS results the 3SLS estimations also show that substance abusetreatment centers have little impact on nearby property liquidity as the externalityappears to be capitalized into price exclusively Exhibit 4 provides additionalevidence that the external impact of substance abuse treatment centers is robustto multiple modeling approaches that are common in empirical real estate studies
Exhibit 4 also provides evidence that not all substance abuse treatment centersmay be perceived by nearby residents as presenting equal risk It is possible thatmethadone clinics have a greater NIMBY sentiment from the broader communityWe test this proposition empirically by exclusively examining the effect of
78
uL
aR
oc
he
W
alle
r
an
dW
en
tla
nd
Exhibit 3 u Effect of a Nearby Rehab Center on a Homersquos Price and Liquidity with Different Location Controls
Dependent Variable ln(Sale Price) Dependent Variable ln(Days on Market)
Notes This table presents results of hedonic OLS models showing the effect of a nearby (ie within 0125 mile) rehab facility on a propertyrsquos sale price and time onmarket while controlling for different spatialarea fixed effects Errors are clustered by spatial area in each regression respectively T-statistics are in parentheses Thenumber of observation in columns 1ndash3 is 116663 the number of observation in columns 4ndash6 is 205281Significant at the 10 levelSignificant at the 5 levelSignificant at the 1 level
8 0 u L a R o c h e W a l l e r a n d W e n t l a n d
Exhibit 4 u Effect of a Nearby Rehab and Methadone Treatment Center on a Homersquos Price and
Liquidity
DependentVariableln(Sale Price)
DependentVariableln(Days on Market)
DependentVariableln(Sale Price)
DependentVariableln(Days on Market)
(1) (2) (3) (4)
Rehab Center 18 Mile 20077 20009(2244) (2004)
Meth Center 18 Mile 20174 0192(2235) (033)
ln(Age of Home) 20063 0125 20063 0125(211893) (1089) (211892) (1086)
HOA Fees 0059 20076 0059 20076(4151) (2507) (4150) (2505)
ln(Time on Market) 0050 0050(4552) (4545)
ln(Sale Price) 1254 1248(748) (744)
lsquo lsquo N o t i n M y B a c k y a r d rsquo rsquo u 8 1
J O S R E u V o l 6 u N o 1 ndash 2 0 1 4
Exhibit 4 u (continued)
Effect of a Nearby Rehab and Methadone Treatment Center on a Homersquos Price and Liquidity
DependentVariableln(Sale Price)
DependentVariableln(Days on Market)
DependentVariableln(Sale Price)
DependentVariableln(Days on Market)
(1) (2) (3) (4)
Listing Density 0000 0000(2193) (2195)
Competition 0000 0000(2148) (2150)
Location Controls u u u u
Year Fixed Effects u u u u
Notes This table presents the results of hedonic 3SLS models showing the effect of a nearby (ie within0125 mile) rehab facility and a rehab facility that treats methadone addiction specifically on a propertyrsquossale price and time on market constant omitted here for brevity Z-statistics are in parentheses The numberof observations in columns 1ndash4 is 110361Significant at the 10 levelSignificant at the 5 levelSignificant at the 1 level
methadone clinics Columns 3 and 4 in Exhibit 4 display the results of the same3SLS estimations as columns 1 and 2 but confining the treatment variable to adummy variable that equals one if the home is within 0125 mile of a methadoneclinic The coefficient estimates in Exhibit 4 indicate that homes within 0125miles of a methadone clinic sell for approximately a 17 discount relative tohomes that are located further away holding other factors constant There is littleevidence however that these clinics affect nearby home liquidity Overall Exhibit4 provides evidence that the market differentiates among risks generated by thesepotential externalities and the treatment centers that may be perceived as havinga higher risk to their neighbors have a much greater impact on the surroundingreal estate market
As a robustness check in Exhibit 5 we explore the extent to which the controlgroups matter finding results generally consistent with those in Exhibit 4 Acritique of hedonic models for estimating any externality might be that theinterpretation of the dummy variable essentially defines the control group ashomes not located near (within 0125 miles) the potential externality Defining thecontrol group in this way may present some unobserved spatial heterogeneityissues To address this issue in Exhibits 5 and 6 we estimate the same regressionsas Exhibit 4 but confine the sample to homes that are located within 15 miles1 mile and 06 miles of a rehab facility respectively The results are consistentwith the initial 3SLS estimates in Exhibit 4 and by extension the initial OLSestimates in Exhibits 2 and 3 Both exhibits show that homes near substance abuse
82
uL
aR
oc
he
W
alle
r
an
dW
en
tla
nd
Exhibit 5 u Effect of a Nearby Rehab Facility on a Homersquos Sale Price and Days on Market
DependentVariableln(Sale Price)
DependentVariableln(Days on Market)
DependentVariableln(Sale Price)
DependentVariableln(Days on Market)
DependentVariableln(Sale Price)
DependentVariableln(Days on Market)
Within 15 Miles of a Rehab Facility Within 1 Mile of a Rehab Facility Within 06 Miles of a Rehab Facility
ln(Time on Market) 0043 0019 0010(1091) (380) (150)
ln(Sale Price) 1023 0071 0295(198) (012) (039)
Listing Density 0000 0000 0000(630) (433) (235)
84
uL
aR
oc
he
W
alle
r
an
dW
en
tla
nd
Exhibit 5 u (continued)
Effect of a Nearby Rehab Facility on a Homersquos Sale Price and Days on Market
DependentVariableln(Sale Price)
DependentVariableln(Days on Market)
DependentVariableln(Sale Price)
DependentVariableln(Days on Market)
DependentVariableln(Sale Price)
DependentVariableln(Days on Market)
Within 15 Miles of a Rehab Facility Within 1 Mile of a Rehab Facility Within 06 Miles of a Rehab Facility
(1a) (1b) (2a) (2b) (3a) (3b)
Competition 0000 0000 0000(880) (626) (595)
Location Controls u u u u u u
Year Fixed Effects u u u u u u
Notes This table presents the 3SLS results of simultaneous estimation of the effect of a nearby rehab facility on a homersquos selling price and liquidity (time on market)changing the sample to vary the control groups by smaller radii from a rehab center Z-statistics are in parentheses The number of observations in columns 1ndash2 is7711 the number of observations in columns 3ndash4 is 3589 the number of observations in columns 5ndash6 is 1324Significant at the 10 levelSignificant at the 5 levelSignificant at the 1 level
lsquolsquoN
ot
in
My
Ba
ck
ya
rd
rsquorsquo
u8
5
JO
SR
Eu
Vo
l
6u
No
1
ndash2
01
4
Exhibit 6 u Effect of a Nearby Rehab Facility that Treats Methadone Addiction
DependentVariableln(Sale Price)
DependentVariableln(Days on Market)
DependentVariableln(Sale Price)
DependentVariableln(Days on Market)
DependentVariableln(Sale Price)
DependentVariableln(Days on Market)
Within 15 Miles of a Rehab Facility Within 1 Mile of a Rehab Facility Within 06 Miles of a Rehab Facility
ln(Time on Market) 0042 0020 0012(1081) (393) (167)
ln(Sale Price) 0955 0082 0322(185) (014) (043)
Listing Density 0000 0000 0000(642) (440) (248)
lsquolsquoN
ot
in
My
Ba
ck
ya
rd
rsquorsquo
u8
7
JO
SR
Eu
Vo
l
6u
No
1
ndash2
01
4
Exhibit 6 u (continued)
Effect of a Nearby Rehab Facility that Treats Methadone Addiction
DependentVariableln(Sale Price)
DependentVariableln(Days on Market)
DependentVariableln(Sale Price)
DependentVariableln(Days on Market)
DependentVariableln(Sale Price)
DependentVariableln(Days on Market)
Within 15 Miles of a Rehab Facility Within 1 Mile of a Rehab Facility Within 06 Miles of a Rehab Facility
(1a) (1b) (2a) (2b) (3a) (3b)
Competition 0000 0000 0000(886) (625) (589)
Location Controls u u u u u u
Year Fixed Effects u u u u u u
Notes This table presents 3SLS results of simultaneous estimation of the effect of a nearby rehab facility that treats methadone addiction on a homersquos selling price andliquidity (time on market) changing the sample to vary the control groups by smaller radii from a rehab center Z-statistics are in parentheses The number ofobservations in column 1 is 7711 the number of observations in column 2 is 3589 the number of observations in column 3 is 1324Significant at the 10 levelSignificant at the 5 levelSignificant at the 1 level
8 8 u L a R o c h e W a l l e r a n d W e n t l a n d
treatment centers are still negatively impacted and by approximately the samemagnitudes Indeed the last two columns are particularly striking Given that thisis already a lsquolsquowithin neighborhoodrsquorsquo estimation by controlling for location thefact that the substance abuse treatment center result is robust when the controlgroup is reduced to 1 mile and 06 miles indicates that unobserved spatialheterogeneity is not likely driving the core results of this paper More intuitivelythis provides strong evidence that the substance abuse treatment center effect isnot simply a lsquolsquobad part of town effectrsquorsquo in that we are comparing lsquolsquoapples withapplesrsquorsquo across the dimension of location and the principle characteristicdistinguishing the variation in prices in these areas is the presence of a nearbysubstance abuse treatment center Based on these results we cannot conclude thatthere is a robust impact on property liquidity but there appears to be a robustnegative relationship between the presence of a substance abuse treatment centerand nearby home values
u C o n c l u s i o n
In this study we find evidence that residential substance abuse treatment centersadversely impact the price of neighboring homes We find that homes within 18mile of a treatment center sell for approximately 8 less than otherwisecomparable homes that are located further away Furthermore we find that themarket differentiates between potential risks that nearby treatment centers maycarry as living near a methadone clinic that treats opiate addictions such as heroinor morphine may be associated with a reduction in home values by as much as17 We find little evidence that nearby treatment centers affect a homersquos timeon market
Examining this particular externality is important to the broader literature onneighborhood externalities and environmental factors as well as the specificliterature on the issue of residential treatment centers The PPACA has expandedMHSUD coverage and made intensive treatment options affordable and as aresult demand for effective substance abuse treatment is increasing Operating atreatment center is a growing industry and it is reasonable to assume that newcenters will be built nationally many of which will be sited near or withinresidential communities Indeed there is very little that individuals and localitiescan do to prohibit a substance abuse treatment center from locating in a residentialarea because alcohol and drug addiction is considered to be a handicap and thusalcoholicaddicts in recovery are members of a protected class under the federalanti-discrimination housing laws Hence as residential treatment centers becomemore common it is important to understand all their effects including the effectsthey may have on nearby real estate and how markets price the potential risk ofnearby externalities
u E n d n o t e s1 For a more complete review on the impact of environmental externalities see Boyle and
Kiel (2001)
lsquo lsquo N o t i n M y B a c k y a r d rsquo rsquo u 8 9
J O S R E u V o l 6 u N o 1 ndash 2 0 1 4
2 Consistent with other real estate studies we culled outliers from our data set confiningour data to more lsquolsquotypicalrsquorsquo range of homes listed at less than $1000000 fewer than10 bedrooms fewer than 16 acres (99 of observations) property taxes paid that wereless $10000 (99 of observations) and younger than 150 years old (99 ofobservations) For our other dependent variable of interest time on market we similarlytrim the 1 extremes Generally the findings are not sensitive to dropping theseobservations Further important to disclose how our data has been trimmed fortransparency and replicability As an additional quality check a sample of the MLS datawas compared to county tax records which contain data on price and housingcharacteristics
3 There were approximately 153 96 and 60 properties listed within 0175 miles 015miles and 0125 miles of a rehab treatment facility respectively over the time periodof our study Given the very recent and projected growth of rehab centers nationallyfuture research will be able to take advantage of additional homes (data points) beingbought and sold near rehab facilities
4 The choice of this radius does not fundamentally alter the qualitative conclusions of thisstudy The definition of onersquos lsquolsquobackyardrsquorsquo is somewhat ambiguous and may differdepending on an individualrsquos perception Some externality studies use 01 mile 02 mileor 03 mile as a radius to examine a given externality While similar results are obtainedlooking at bands slightly larger and slightly smaller we follow Congdon-Hohman (2013)and use 18 mile in most of our tabulated regression results An easy way to think of0125 miles 015 miles and 0175 miles is that these are 25 minute 3 minute and 35minute walks respectively (assuming a pace of 3 miles per hour)
5 For recent examples of amenity or disamenity studies of externality effects see Asabereand Huffman (1991) Gibbons (2004) Linden and Rockoff (2008) Pope (2008) Rossi-Hansberg Sarte and Owens (2010) Campbell Giglio and Pathek (2011) Hoen WiserCappers Thayer and Sethi (2011) Daneshvary Clauretie and Kader (2011) GroutJaeger and Plantinga (2011) Daneshvary and Clauretie (2012) Congdon-Hohman(2013) Guignet (2013) Linn (2013) Munneke Sirmans Slade and Turnbull (2013)and Wentland Waller and Brastow (2014)
6 Recent examples include neighborhood foreclosure effects (Harding Rosenblatt andYao 2009 Lin Rosenblatt and Yao 2009 Agarwal Ambrose Chomsisengphet andSanders 2010)
7 Kuminoff Parmeter and Pope (2010) survey 69 hedonic studies and found that 80rely on linear semi-log or log-log functional form We have explored a number of non-linear functional forms and our results remain robust Rather than repeat all of the abovemodels with various non-linear explanatory variables the authors will produce resultsof alternative specifications upon request
8 For example we use the following property specific variables square footage ageacreage number of bedrooms bathrooms number of stories new vacant HOA feeswhether it has a pool a tenant a basement and whether it is a short sale or foreclosureWe also include year fixed effects to control for variation over time
9 When we explore different location controls later we will cluster by location (egcensus tract block group or block)
10 For example see Yavas and Yang (1995) Knight (2002) and Turnbull and Dombrow(2006)
11 Specifically both our paper and Zahirovic-Herbert and Turnbull (2008) calculate C inthe following way lsquolsquoThe days-on-market or selling time is s(i) 2 l(i) 1 1 where l(i)and s(i) are the listing date and sales date for house i Denoting the listing date and
9 0 u L a R o c h e W a l l e r a n d W e n t l a n d
sales date for house j by l( j) and s( j) the overlapping time on the market for these twohouses is min[s(i) s( j)] 2 max[l(i) l( j)] The straight-line distance in miles betweenhouses i and j is D(i j) The measured competition for house i is C(i) 5 oj (1 2 D(ij))2min[s(i) s( j)] 2 max[l(i) l( j)] where the summation is taken over all competinghouses j that is houses for sale within one mile and 20 larger or smaller in livingarea of house irsquorsquo (Zahirovic-Herbert and Turnbull 2008)
12 At the suggestion of a reviewer we also identify the system by using different controlvariables A simple way to do this is to use different location controls We use ZIP Codefixed effects in the price equation and census tract fixed effects in the time on marketequation Generally the results are not very sensitive to which location controls are usedin each equation Further the results are similar when we use the Turnbull and Dombrow(2006) method alone to identify the system
13 According to Belsley (1988) when there are strong interrelations among error terms3SLS is used instead of 2SLS in estimating systems of equations because it is moreefficient Specifically one would expect unobservables that contribute to error inestimating price to be also correlated the error in liquidity
14 See wwwcensusgov for more detail specifically http wwwcensusgovgeowwwcobtr metadatahtmlgad
u R e f e r e n c e s
Agarwal S B Ambrose S Chomsisengphet and AB Sanders Thy NeighborrsquosMortgage Does Living in a Subprime Neighborhood Affect Onersquos Probability of DefaultReal Estate Economics 2012 401 1ndash22
Asabere P and F Huffman Historic Districts and Land Values Journal of Real EstateResearch 1991 61 1ndash8
Augusta Chronicle Neighbors Oppose Upscale Rehab Facility in South Augusta http chronicleaugustacomnewshealth2013-08-05neighbors-oppose-upscale-rehab-facility-south-augusta August 5 2013
Belsley DA Two- or Three-stage Least Squares Computational Economics 1988 1 21ndash30
Beronio K R Po L Skopec and S Glied ASPE Research Brief Affordable Care ActWill Expand Mental Health and Substance Use Disorder Benefits and Parity Protectionsfor 62 Million Americans http aspehhsgovhealthreports 2013mental rb mentalcfm February 20 2013
Boyle M and K Kiel A Survey of House Price Hedonic Studies of the Impact ofEnvironmental Externalities Journal of Real Estate Literature 2001 92 117ndash44
Campbell JY S Giglio and P Pathak Forced Sales and House Prices AmericanEconomic Review 2011 1015 2108ndash31
City of Edmonds v Oxford House Inc et al 514 US 725 1995
Congdon-Hohman J The Lasting Effects of Crime The Relationship of DiscoveredMethamphetamine Laboratories and Home Values Regional Science and UrbanEconomics 2013 431 31ndash41
Connery H Alcohol Use and AbusemdashA Harvard Medical School Special Health Report2011 Fact Sheet MHPAEA http wwwdolgovebsanewsroomfsmhpaeahtml HUDDisability Rights in Housing http portalhudgovhudportal HUDsrc5 programofficesfair housing equal oppdisabilities inhousing
lsquo lsquo N o t i n M y B a c k y a r d rsquo rsquo u 9 1
J O S R E u V o l 6 u N o 1 ndash 2 0 1 4
Coulson NE and RM Leichenko The Internal and External Impact of HistoricalDesignation on Property Values Journal of Real Estate Finance and Economics 2001 231 113ndash24
Daneshvary N and TM Clauretie Toxic Neighbors Foreclosures and Short-SalesSpillover Effects from the Current Housing-Market Crash Economic Inquiry 2012 501217ndash31
Daneshvary N TM Clauretie and A Kader Short-Term Own-Price and Spillover Effectsof Distressed Residential Properties The Case of a Housing Crash Journal of Real EstateResearch 2011 332 179ndash207
Gibbons S The Cost of Urban Property Crime Economic Journal 2004 114 441ndash63
Grout CA WK Jaeger and AJ Plantinga Land-use Regulations and Property Valuesin Portland Oregon A Regression Discontinuity Design Approach Regional Science andUrban Economics 2011 482 98ndash107
Guignet D What Do Property Values Really Tell Us A Hedonic Study of UndergroundStorage Tanks Land Economics 2013 892 211ndash26
Harding JP E Rosenblatt and VW Yao The Contagion Effect of Foreclosed PropertiesJournal of Urban Economics 2009 663 164ndash78
Hite D W Chern F Hitzusen and A Randall Property-Value Impacts of anEnvironmental Disamenity The Case of Landfills Journal of Real Estate Finance andEconomics 2001 22 185ndash202
Hoen B R Wiser P Cappers M Thayer and G Sethi Wind Energy Facilities andResidential Properties The Effect of Proximity and View on Sales Prices Journal of RealEstate Research 2011 333 279ndash316
Ihlanfeldt K and T Mayock Panel Data Estimates of the Effects of Different Types ofCrime on Housing Prices Regional Science and Urban Economics 2010 40 161ndash72
Knight J Listing Price Time on Market and Ultimate Selling Price Causes and Effectsof Listing Price Changes Real Estate Economics 2002 302 213ndash37
Krainer J A Theory of Liquidity in Residential Real Estate Markets Journal of UrbanEconomics 2001 491 32ndash53
Kuminoff NV CF Parmeter and JC Pope Which Hedonic Models Can We Trust toRecover the Marginal Willingness to Pay for Environmental Amenities Journal ofEnvironmental Economics and Management 2010 603 145ndash60
Levitt SD and C Syverson Market Distortions When Agents Are Better Informed TheValue of Information in Real Estate Transactions Review of Economics and Statistics 2008904 599ndash611
Lin Z E Rosenblatt and VW Yao Spillover Effects of Foreclosures on NeighborhoodProperty Values Journal of Real Estate Finance and Economics 2009 383 387ndash407
Linden L and JE Rockoff Estimates of the Impact of Crime Risk on Property Valuesfrom Meganrsquos Law American Economic Review 2008 983 1103ndash27
Linn J The Effect of Voluntary Brownfields Programs on Nearby Property ValuesEvidence from Illinois Journal of Urban Economics 2013 78 1ndash18
McCluskey J and G Rausser Stigmatized Asset Value Is it Temporary or Long-TermReview of Economics and Statistics 2003 852 276ndash85
Munneke HJ CF Sirmans BA Slade and G Turnbull Housing RegulationExternalities and Residential Property Prices Real Estate Economics 2013 413 422ndash56
Pope D and J Pope Crime and Property Values Evidence from the 1990s Crime DropRegional Science and Urban Economic 2012 42 177ndash88
9 2 u L a R o c h e W a l l e r a n d W e n t l a n d
Pope J Fear of Crime and Housing Prices Household Reactions to Sex OffenderRegistries Journal of Urban Economics 2008 64 601ndash14
Reichert A M Small and S Mohanty The Impact of Landfills on Residential PropertyValues Journal of Real Estate Research 1992 73 297ndash314
Rosiers FD Power Lines Visual Encumbrance and House Values A MicrospatialApproach to Impact Measurement Journal of Real Estate Research 2002 233 275ndash301
Rossi-Hansberg E P-D Sarte and R Owens Housing Externalities Journal of PoliticalEconomy 2010 118 485ndash534
SAMHSA National Survey on Substance Abuse Treatment Services (N-SSATS) 2008http wwwsamhsagovsamhsanewsletter Volume 18 Number 1TreatmentFacilitiesaspx
Shaffer H Overcoming Addiction Paths Toward RecoverymdashA Harvard Medical SchoolSpecial Health Report 2012
Thaler R A Note on the Value of Crime Control Evidence from the Property MarketJournal of Urban Economics 1978 51 137ndash45
Turnbull G and J Dombrow Spatial Competition and Shopping Externalities Evidencefrom the Housing Market Journal of Real Estate Finance and Economics 2006 324391ndash408
Wentland S B Waller and R Brastow Estimating the Effect of Crime Risk on PropertyValues and Time on Market Evidence from Meganrsquos Law in Virginia Real EstateEconomics 2013 421 223ndash51
Yavas A and S Yang The Strategic Role of Listing Price in Marketing Real Estate Theoryand Evidence Real Estate Economics 1995 233 347ndash68
Zahirovic-Herbert V and G Turnbull School Quality House Prices and Liquidity Journalof Real Estate Finance and Economics 2008 37 113ndash30
Claire R La Roche Longwood University Farmville VA 23909 or larochecrlongwoodedu
Bennie D Waller Longwood University Farmville VA 23909 or wallerbdlongwoodedu
Scott A Wentland Longwood University Farmville VA 23909 or wentlandsalongwoodedu
lsquolsquoN
ot
in
My
Ba
ck
ya
rd
rsquorsquo
u7
9
JO
SR
Eu
Vo
l
6u
No
1
ndash2
01
4
Exhibit 3 u (continued)
Effect of a Nearby Rehab Center on a Homersquos Price and Liquidity with Different Location Controls
Dependent Variable ln(Sale Price) Dependent Variable ln(Days on Market)
Notes This table presents results of hedonic OLS models showing the effect of a nearby (ie within 0125 mile) rehab facility on a propertyrsquos sale price and time onmarket while controlling for different spatialarea fixed effects Errors are clustered by spatial area in each regression respectively T-statistics are in parentheses Thenumber of observation in columns 1ndash3 is 116663 the number of observation in columns 4ndash6 is 205281Significant at the 10 levelSignificant at the 5 levelSignificant at the 1 level
8 0 u L a R o c h e W a l l e r a n d W e n t l a n d
Exhibit 4 u Effect of a Nearby Rehab and Methadone Treatment Center on a Homersquos Price and
Liquidity
DependentVariableln(Sale Price)
DependentVariableln(Days on Market)
DependentVariableln(Sale Price)
DependentVariableln(Days on Market)
(1) (2) (3) (4)
Rehab Center 18 Mile 20077 20009(2244) (2004)
Meth Center 18 Mile 20174 0192(2235) (033)
ln(Age of Home) 20063 0125 20063 0125(211893) (1089) (211892) (1086)
HOA Fees 0059 20076 0059 20076(4151) (2507) (4150) (2505)
ln(Time on Market) 0050 0050(4552) (4545)
ln(Sale Price) 1254 1248(748) (744)
lsquo lsquo N o t i n M y B a c k y a r d rsquo rsquo u 8 1
J O S R E u V o l 6 u N o 1 ndash 2 0 1 4
Exhibit 4 u (continued)
Effect of a Nearby Rehab and Methadone Treatment Center on a Homersquos Price and Liquidity
DependentVariableln(Sale Price)
DependentVariableln(Days on Market)
DependentVariableln(Sale Price)
DependentVariableln(Days on Market)
(1) (2) (3) (4)
Listing Density 0000 0000(2193) (2195)
Competition 0000 0000(2148) (2150)
Location Controls u u u u
Year Fixed Effects u u u u
Notes This table presents the results of hedonic 3SLS models showing the effect of a nearby (ie within0125 mile) rehab facility and a rehab facility that treats methadone addiction specifically on a propertyrsquossale price and time on market constant omitted here for brevity Z-statistics are in parentheses The numberof observations in columns 1ndash4 is 110361Significant at the 10 levelSignificant at the 5 levelSignificant at the 1 level
methadone clinics Columns 3 and 4 in Exhibit 4 display the results of the same3SLS estimations as columns 1 and 2 but confining the treatment variable to adummy variable that equals one if the home is within 0125 mile of a methadoneclinic The coefficient estimates in Exhibit 4 indicate that homes within 0125miles of a methadone clinic sell for approximately a 17 discount relative tohomes that are located further away holding other factors constant There is littleevidence however that these clinics affect nearby home liquidity Overall Exhibit4 provides evidence that the market differentiates among risks generated by thesepotential externalities and the treatment centers that may be perceived as havinga higher risk to their neighbors have a much greater impact on the surroundingreal estate market
As a robustness check in Exhibit 5 we explore the extent to which the controlgroups matter finding results generally consistent with those in Exhibit 4 Acritique of hedonic models for estimating any externality might be that theinterpretation of the dummy variable essentially defines the control group ashomes not located near (within 0125 miles) the potential externality Defining thecontrol group in this way may present some unobserved spatial heterogeneityissues To address this issue in Exhibits 5 and 6 we estimate the same regressionsas Exhibit 4 but confine the sample to homes that are located within 15 miles1 mile and 06 miles of a rehab facility respectively The results are consistentwith the initial 3SLS estimates in Exhibit 4 and by extension the initial OLSestimates in Exhibits 2 and 3 Both exhibits show that homes near substance abuse
82
uL
aR
oc
he
W
alle
r
an
dW
en
tla
nd
Exhibit 5 u Effect of a Nearby Rehab Facility on a Homersquos Sale Price and Days on Market
DependentVariableln(Sale Price)
DependentVariableln(Days on Market)
DependentVariableln(Sale Price)
DependentVariableln(Days on Market)
DependentVariableln(Sale Price)
DependentVariableln(Days on Market)
Within 15 Miles of a Rehab Facility Within 1 Mile of a Rehab Facility Within 06 Miles of a Rehab Facility
ln(Time on Market) 0043 0019 0010(1091) (380) (150)
ln(Sale Price) 1023 0071 0295(198) (012) (039)
Listing Density 0000 0000 0000(630) (433) (235)
84
uL
aR
oc
he
W
alle
r
an
dW
en
tla
nd
Exhibit 5 u (continued)
Effect of a Nearby Rehab Facility on a Homersquos Sale Price and Days on Market
DependentVariableln(Sale Price)
DependentVariableln(Days on Market)
DependentVariableln(Sale Price)
DependentVariableln(Days on Market)
DependentVariableln(Sale Price)
DependentVariableln(Days on Market)
Within 15 Miles of a Rehab Facility Within 1 Mile of a Rehab Facility Within 06 Miles of a Rehab Facility
(1a) (1b) (2a) (2b) (3a) (3b)
Competition 0000 0000 0000(880) (626) (595)
Location Controls u u u u u u
Year Fixed Effects u u u u u u
Notes This table presents the 3SLS results of simultaneous estimation of the effect of a nearby rehab facility on a homersquos selling price and liquidity (time on market)changing the sample to vary the control groups by smaller radii from a rehab center Z-statistics are in parentheses The number of observations in columns 1ndash2 is7711 the number of observations in columns 3ndash4 is 3589 the number of observations in columns 5ndash6 is 1324Significant at the 10 levelSignificant at the 5 levelSignificant at the 1 level
lsquolsquoN
ot
in
My
Ba
ck
ya
rd
rsquorsquo
u8
5
JO
SR
Eu
Vo
l
6u
No
1
ndash2
01
4
Exhibit 6 u Effect of a Nearby Rehab Facility that Treats Methadone Addiction
DependentVariableln(Sale Price)
DependentVariableln(Days on Market)
DependentVariableln(Sale Price)
DependentVariableln(Days on Market)
DependentVariableln(Sale Price)
DependentVariableln(Days on Market)
Within 15 Miles of a Rehab Facility Within 1 Mile of a Rehab Facility Within 06 Miles of a Rehab Facility
ln(Time on Market) 0042 0020 0012(1081) (393) (167)
ln(Sale Price) 0955 0082 0322(185) (014) (043)
Listing Density 0000 0000 0000(642) (440) (248)
lsquolsquoN
ot
in
My
Ba
ck
ya
rd
rsquorsquo
u8
7
JO
SR
Eu
Vo
l
6u
No
1
ndash2
01
4
Exhibit 6 u (continued)
Effect of a Nearby Rehab Facility that Treats Methadone Addiction
DependentVariableln(Sale Price)
DependentVariableln(Days on Market)
DependentVariableln(Sale Price)
DependentVariableln(Days on Market)
DependentVariableln(Sale Price)
DependentVariableln(Days on Market)
Within 15 Miles of a Rehab Facility Within 1 Mile of a Rehab Facility Within 06 Miles of a Rehab Facility
(1a) (1b) (2a) (2b) (3a) (3b)
Competition 0000 0000 0000(886) (625) (589)
Location Controls u u u u u u
Year Fixed Effects u u u u u u
Notes This table presents 3SLS results of simultaneous estimation of the effect of a nearby rehab facility that treats methadone addiction on a homersquos selling price andliquidity (time on market) changing the sample to vary the control groups by smaller radii from a rehab center Z-statistics are in parentheses The number ofobservations in column 1 is 7711 the number of observations in column 2 is 3589 the number of observations in column 3 is 1324Significant at the 10 levelSignificant at the 5 levelSignificant at the 1 level
8 8 u L a R o c h e W a l l e r a n d W e n t l a n d
treatment centers are still negatively impacted and by approximately the samemagnitudes Indeed the last two columns are particularly striking Given that thisis already a lsquolsquowithin neighborhoodrsquorsquo estimation by controlling for location thefact that the substance abuse treatment center result is robust when the controlgroup is reduced to 1 mile and 06 miles indicates that unobserved spatialheterogeneity is not likely driving the core results of this paper More intuitivelythis provides strong evidence that the substance abuse treatment center effect isnot simply a lsquolsquobad part of town effectrsquorsquo in that we are comparing lsquolsquoapples withapplesrsquorsquo across the dimension of location and the principle characteristicdistinguishing the variation in prices in these areas is the presence of a nearbysubstance abuse treatment center Based on these results we cannot conclude thatthere is a robust impact on property liquidity but there appears to be a robustnegative relationship between the presence of a substance abuse treatment centerand nearby home values
u C o n c l u s i o n
In this study we find evidence that residential substance abuse treatment centersadversely impact the price of neighboring homes We find that homes within 18mile of a treatment center sell for approximately 8 less than otherwisecomparable homes that are located further away Furthermore we find that themarket differentiates between potential risks that nearby treatment centers maycarry as living near a methadone clinic that treats opiate addictions such as heroinor morphine may be associated with a reduction in home values by as much as17 We find little evidence that nearby treatment centers affect a homersquos timeon market
Examining this particular externality is important to the broader literature onneighborhood externalities and environmental factors as well as the specificliterature on the issue of residential treatment centers The PPACA has expandedMHSUD coverage and made intensive treatment options affordable and as aresult demand for effective substance abuse treatment is increasing Operating atreatment center is a growing industry and it is reasonable to assume that newcenters will be built nationally many of which will be sited near or withinresidential communities Indeed there is very little that individuals and localitiescan do to prohibit a substance abuse treatment center from locating in a residentialarea because alcohol and drug addiction is considered to be a handicap and thusalcoholicaddicts in recovery are members of a protected class under the federalanti-discrimination housing laws Hence as residential treatment centers becomemore common it is important to understand all their effects including the effectsthey may have on nearby real estate and how markets price the potential risk ofnearby externalities
u E n d n o t e s1 For a more complete review on the impact of environmental externalities see Boyle and
Kiel (2001)
lsquo lsquo N o t i n M y B a c k y a r d rsquo rsquo u 8 9
J O S R E u V o l 6 u N o 1 ndash 2 0 1 4
2 Consistent with other real estate studies we culled outliers from our data set confiningour data to more lsquolsquotypicalrsquorsquo range of homes listed at less than $1000000 fewer than10 bedrooms fewer than 16 acres (99 of observations) property taxes paid that wereless $10000 (99 of observations) and younger than 150 years old (99 ofobservations) For our other dependent variable of interest time on market we similarlytrim the 1 extremes Generally the findings are not sensitive to dropping theseobservations Further important to disclose how our data has been trimmed fortransparency and replicability As an additional quality check a sample of the MLS datawas compared to county tax records which contain data on price and housingcharacteristics
3 There were approximately 153 96 and 60 properties listed within 0175 miles 015miles and 0125 miles of a rehab treatment facility respectively over the time periodof our study Given the very recent and projected growth of rehab centers nationallyfuture research will be able to take advantage of additional homes (data points) beingbought and sold near rehab facilities
4 The choice of this radius does not fundamentally alter the qualitative conclusions of thisstudy The definition of onersquos lsquolsquobackyardrsquorsquo is somewhat ambiguous and may differdepending on an individualrsquos perception Some externality studies use 01 mile 02 mileor 03 mile as a radius to examine a given externality While similar results are obtainedlooking at bands slightly larger and slightly smaller we follow Congdon-Hohman (2013)and use 18 mile in most of our tabulated regression results An easy way to think of0125 miles 015 miles and 0175 miles is that these are 25 minute 3 minute and 35minute walks respectively (assuming a pace of 3 miles per hour)
5 For recent examples of amenity or disamenity studies of externality effects see Asabereand Huffman (1991) Gibbons (2004) Linden and Rockoff (2008) Pope (2008) Rossi-Hansberg Sarte and Owens (2010) Campbell Giglio and Pathek (2011) Hoen WiserCappers Thayer and Sethi (2011) Daneshvary Clauretie and Kader (2011) GroutJaeger and Plantinga (2011) Daneshvary and Clauretie (2012) Congdon-Hohman(2013) Guignet (2013) Linn (2013) Munneke Sirmans Slade and Turnbull (2013)and Wentland Waller and Brastow (2014)
6 Recent examples include neighborhood foreclosure effects (Harding Rosenblatt andYao 2009 Lin Rosenblatt and Yao 2009 Agarwal Ambrose Chomsisengphet andSanders 2010)
7 Kuminoff Parmeter and Pope (2010) survey 69 hedonic studies and found that 80rely on linear semi-log or log-log functional form We have explored a number of non-linear functional forms and our results remain robust Rather than repeat all of the abovemodels with various non-linear explanatory variables the authors will produce resultsof alternative specifications upon request
8 For example we use the following property specific variables square footage ageacreage number of bedrooms bathrooms number of stories new vacant HOA feeswhether it has a pool a tenant a basement and whether it is a short sale or foreclosureWe also include year fixed effects to control for variation over time
9 When we explore different location controls later we will cluster by location (egcensus tract block group or block)
10 For example see Yavas and Yang (1995) Knight (2002) and Turnbull and Dombrow(2006)
11 Specifically both our paper and Zahirovic-Herbert and Turnbull (2008) calculate C inthe following way lsquolsquoThe days-on-market or selling time is s(i) 2 l(i) 1 1 where l(i)and s(i) are the listing date and sales date for house i Denoting the listing date and
9 0 u L a R o c h e W a l l e r a n d W e n t l a n d
sales date for house j by l( j) and s( j) the overlapping time on the market for these twohouses is min[s(i) s( j)] 2 max[l(i) l( j)] The straight-line distance in miles betweenhouses i and j is D(i j) The measured competition for house i is C(i) 5 oj (1 2 D(ij))2min[s(i) s( j)] 2 max[l(i) l( j)] where the summation is taken over all competinghouses j that is houses for sale within one mile and 20 larger or smaller in livingarea of house irsquorsquo (Zahirovic-Herbert and Turnbull 2008)
12 At the suggestion of a reviewer we also identify the system by using different controlvariables A simple way to do this is to use different location controls We use ZIP Codefixed effects in the price equation and census tract fixed effects in the time on marketequation Generally the results are not very sensitive to which location controls are usedin each equation Further the results are similar when we use the Turnbull and Dombrow(2006) method alone to identify the system
13 According to Belsley (1988) when there are strong interrelations among error terms3SLS is used instead of 2SLS in estimating systems of equations because it is moreefficient Specifically one would expect unobservables that contribute to error inestimating price to be also correlated the error in liquidity
14 See wwwcensusgov for more detail specifically http wwwcensusgovgeowwwcobtr metadatahtmlgad
u R e f e r e n c e s
Agarwal S B Ambrose S Chomsisengphet and AB Sanders Thy NeighborrsquosMortgage Does Living in a Subprime Neighborhood Affect Onersquos Probability of DefaultReal Estate Economics 2012 401 1ndash22
Asabere P and F Huffman Historic Districts and Land Values Journal of Real EstateResearch 1991 61 1ndash8
Augusta Chronicle Neighbors Oppose Upscale Rehab Facility in South Augusta http chronicleaugustacomnewshealth2013-08-05neighbors-oppose-upscale-rehab-facility-south-augusta August 5 2013
Belsley DA Two- or Three-stage Least Squares Computational Economics 1988 1 21ndash30
Beronio K R Po L Skopec and S Glied ASPE Research Brief Affordable Care ActWill Expand Mental Health and Substance Use Disorder Benefits and Parity Protectionsfor 62 Million Americans http aspehhsgovhealthreports 2013mental rb mentalcfm February 20 2013
Boyle M and K Kiel A Survey of House Price Hedonic Studies of the Impact ofEnvironmental Externalities Journal of Real Estate Literature 2001 92 117ndash44
Campbell JY S Giglio and P Pathak Forced Sales and House Prices AmericanEconomic Review 2011 1015 2108ndash31
City of Edmonds v Oxford House Inc et al 514 US 725 1995
Congdon-Hohman J The Lasting Effects of Crime The Relationship of DiscoveredMethamphetamine Laboratories and Home Values Regional Science and UrbanEconomics 2013 431 31ndash41
Connery H Alcohol Use and AbusemdashA Harvard Medical School Special Health Report2011 Fact Sheet MHPAEA http wwwdolgovebsanewsroomfsmhpaeahtml HUDDisability Rights in Housing http portalhudgovhudportal HUDsrc5 programofficesfair housing equal oppdisabilities inhousing
lsquo lsquo N o t i n M y B a c k y a r d rsquo rsquo u 9 1
J O S R E u V o l 6 u N o 1 ndash 2 0 1 4
Coulson NE and RM Leichenko The Internal and External Impact of HistoricalDesignation on Property Values Journal of Real Estate Finance and Economics 2001 231 113ndash24
Daneshvary N and TM Clauretie Toxic Neighbors Foreclosures and Short-SalesSpillover Effects from the Current Housing-Market Crash Economic Inquiry 2012 501217ndash31
Daneshvary N TM Clauretie and A Kader Short-Term Own-Price and Spillover Effectsof Distressed Residential Properties The Case of a Housing Crash Journal of Real EstateResearch 2011 332 179ndash207
Gibbons S The Cost of Urban Property Crime Economic Journal 2004 114 441ndash63
Grout CA WK Jaeger and AJ Plantinga Land-use Regulations and Property Valuesin Portland Oregon A Regression Discontinuity Design Approach Regional Science andUrban Economics 2011 482 98ndash107
Guignet D What Do Property Values Really Tell Us A Hedonic Study of UndergroundStorage Tanks Land Economics 2013 892 211ndash26
Harding JP E Rosenblatt and VW Yao The Contagion Effect of Foreclosed PropertiesJournal of Urban Economics 2009 663 164ndash78
Hite D W Chern F Hitzusen and A Randall Property-Value Impacts of anEnvironmental Disamenity The Case of Landfills Journal of Real Estate Finance andEconomics 2001 22 185ndash202
Hoen B R Wiser P Cappers M Thayer and G Sethi Wind Energy Facilities andResidential Properties The Effect of Proximity and View on Sales Prices Journal of RealEstate Research 2011 333 279ndash316
Ihlanfeldt K and T Mayock Panel Data Estimates of the Effects of Different Types ofCrime on Housing Prices Regional Science and Urban Economics 2010 40 161ndash72
Knight J Listing Price Time on Market and Ultimate Selling Price Causes and Effectsof Listing Price Changes Real Estate Economics 2002 302 213ndash37
Krainer J A Theory of Liquidity in Residential Real Estate Markets Journal of UrbanEconomics 2001 491 32ndash53
Kuminoff NV CF Parmeter and JC Pope Which Hedonic Models Can We Trust toRecover the Marginal Willingness to Pay for Environmental Amenities Journal ofEnvironmental Economics and Management 2010 603 145ndash60
Levitt SD and C Syverson Market Distortions When Agents Are Better Informed TheValue of Information in Real Estate Transactions Review of Economics and Statistics 2008904 599ndash611
Lin Z E Rosenblatt and VW Yao Spillover Effects of Foreclosures on NeighborhoodProperty Values Journal of Real Estate Finance and Economics 2009 383 387ndash407
Linden L and JE Rockoff Estimates of the Impact of Crime Risk on Property Valuesfrom Meganrsquos Law American Economic Review 2008 983 1103ndash27
Linn J The Effect of Voluntary Brownfields Programs on Nearby Property ValuesEvidence from Illinois Journal of Urban Economics 2013 78 1ndash18
McCluskey J and G Rausser Stigmatized Asset Value Is it Temporary or Long-TermReview of Economics and Statistics 2003 852 276ndash85
Munneke HJ CF Sirmans BA Slade and G Turnbull Housing RegulationExternalities and Residential Property Prices Real Estate Economics 2013 413 422ndash56
Pope D and J Pope Crime and Property Values Evidence from the 1990s Crime DropRegional Science and Urban Economic 2012 42 177ndash88
9 2 u L a R o c h e W a l l e r a n d W e n t l a n d
Pope J Fear of Crime and Housing Prices Household Reactions to Sex OffenderRegistries Journal of Urban Economics 2008 64 601ndash14
Reichert A M Small and S Mohanty The Impact of Landfills on Residential PropertyValues Journal of Real Estate Research 1992 73 297ndash314
Rosiers FD Power Lines Visual Encumbrance and House Values A MicrospatialApproach to Impact Measurement Journal of Real Estate Research 2002 233 275ndash301
Rossi-Hansberg E P-D Sarte and R Owens Housing Externalities Journal of PoliticalEconomy 2010 118 485ndash534
SAMHSA National Survey on Substance Abuse Treatment Services (N-SSATS) 2008http wwwsamhsagovsamhsanewsletter Volume 18 Number 1TreatmentFacilitiesaspx
Shaffer H Overcoming Addiction Paths Toward RecoverymdashA Harvard Medical SchoolSpecial Health Report 2012
Thaler R A Note on the Value of Crime Control Evidence from the Property MarketJournal of Urban Economics 1978 51 137ndash45
Turnbull G and J Dombrow Spatial Competition and Shopping Externalities Evidencefrom the Housing Market Journal of Real Estate Finance and Economics 2006 324391ndash408
Wentland S B Waller and R Brastow Estimating the Effect of Crime Risk on PropertyValues and Time on Market Evidence from Meganrsquos Law in Virginia Real EstateEconomics 2013 421 223ndash51
Yavas A and S Yang The Strategic Role of Listing Price in Marketing Real Estate Theoryand Evidence Real Estate Economics 1995 233 347ndash68
Zahirovic-Herbert V and G Turnbull School Quality House Prices and Liquidity Journalof Real Estate Finance and Economics 2008 37 113ndash30
Claire R La Roche Longwood University Farmville VA 23909 or larochecrlongwoodedu
Bennie D Waller Longwood University Farmville VA 23909 or wallerbdlongwoodedu
Scott A Wentland Longwood University Farmville VA 23909 or wentlandsalongwoodedu
lsquolsquoN
ot
in
My
Ba
ck
ya
rd
rsquorsquo
u8
3
JO
SR
Eu
Vo
l
6u
No
1
ndash2
01
4
Exhibit 5 u (continued)
Effect of a Nearby Rehab Facility on a Homersquos Sale Price and Days on Market
DependentVariableln(Sale Price)
DependentVariableln(Days on Market)
DependentVariableln(Sale Price)
DependentVariableln(Days on Market)
DependentVariableln(Sale Price)
DependentVariableln(Days on Market)
Within 15 Miles of a Rehab Facility Within 1 Mile of a Rehab Facility Within 06 Miles of a Rehab Facility
ln(Time on Market) 0043 0019 0010(1091) (380) (150)
ln(Sale Price) 1023 0071 0295(198) (012) (039)
Listing Density 0000 0000 0000(630) (433) (235)
84
uL
aR
oc
he
W
alle
r
an
dW
en
tla
nd
Exhibit 5 u (continued)
Effect of a Nearby Rehab Facility on a Homersquos Sale Price and Days on Market
DependentVariableln(Sale Price)
DependentVariableln(Days on Market)
DependentVariableln(Sale Price)
DependentVariableln(Days on Market)
DependentVariableln(Sale Price)
DependentVariableln(Days on Market)
Within 15 Miles of a Rehab Facility Within 1 Mile of a Rehab Facility Within 06 Miles of a Rehab Facility
(1a) (1b) (2a) (2b) (3a) (3b)
Competition 0000 0000 0000(880) (626) (595)
Location Controls u u u u u u
Year Fixed Effects u u u u u u
Notes This table presents the 3SLS results of simultaneous estimation of the effect of a nearby rehab facility on a homersquos selling price and liquidity (time on market)changing the sample to vary the control groups by smaller radii from a rehab center Z-statistics are in parentheses The number of observations in columns 1ndash2 is7711 the number of observations in columns 3ndash4 is 3589 the number of observations in columns 5ndash6 is 1324Significant at the 10 levelSignificant at the 5 levelSignificant at the 1 level
lsquolsquoN
ot
in
My
Ba
ck
ya
rd
rsquorsquo
u8
5
JO
SR
Eu
Vo
l
6u
No
1
ndash2
01
4
Exhibit 6 u Effect of a Nearby Rehab Facility that Treats Methadone Addiction
DependentVariableln(Sale Price)
DependentVariableln(Days on Market)
DependentVariableln(Sale Price)
DependentVariableln(Days on Market)
DependentVariableln(Sale Price)
DependentVariableln(Days on Market)
Within 15 Miles of a Rehab Facility Within 1 Mile of a Rehab Facility Within 06 Miles of a Rehab Facility
ln(Time on Market) 0042 0020 0012(1081) (393) (167)
ln(Sale Price) 0955 0082 0322(185) (014) (043)
Listing Density 0000 0000 0000(642) (440) (248)
lsquolsquoN
ot
in
My
Ba
ck
ya
rd
rsquorsquo
u8
7
JO
SR
Eu
Vo
l
6u
No
1
ndash2
01
4
Exhibit 6 u (continued)
Effect of a Nearby Rehab Facility that Treats Methadone Addiction
DependentVariableln(Sale Price)
DependentVariableln(Days on Market)
DependentVariableln(Sale Price)
DependentVariableln(Days on Market)
DependentVariableln(Sale Price)
DependentVariableln(Days on Market)
Within 15 Miles of a Rehab Facility Within 1 Mile of a Rehab Facility Within 06 Miles of a Rehab Facility
(1a) (1b) (2a) (2b) (3a) (3b)
Competition 0000 0000 0000(886) (625) (589)
Location Controls u u u u u u
Year Fixed Effects u u u u u u
Notes This table presents 3SLS results of simultaneous estimation of the effect of a nearby rehab facility that treats methadone addiction on a homersquos selling price andliquidity (time on market) changing the sample to vary the control groups by smaller radii from a rehab center Z-statistics are in parentheses The number ofobservations in column 1 is 7711 the number of observations in column 2 is 3589 the number of observations in column 3 is 1324Significant at the 10 levelSignificant at the 5 levelSignificant at the 1 level
8 8 u L a R o c h e W a l l e r a n d W e n t l a n d
treatment centers are still negatively impacted and by approximately the samemagnitudes Indeed the last two columns are particularly striking Given that thisis already a lsquolsquowithin neighborhoodrsquorsquo estimation by controlling for location thefact that the substance abuse treatment center result is robust when the controlgroup is reduced to 1 mile and 06 miles indicates that unobserved spatialheterogeneity is not likely driving the core results of this paper More intuitivelythis provides strong evidence that the substance abuse treatment center effect isnot simply a lsquolsquobad part of town effectrsquorsquo in that we are comparing lsquolsquoapples withapplesrsquorsquo across the dimension of location and the principle characteristicdistinguishing the variation in prices in these areas is the presence of a nearbysubstance abuse treatment center Based on these results we cannot conclude thatthere is a robust impact on property liquidity but there appears to be a robustnegative relationship between the presence of a substance abuse treatment centerand nearby home values
u C o n c l u s i o n
In this study we find evidence that residential substance abuse treatment centersadversely impact the price of neighboring homes We find that homes within 18mile of a treatment center sell for approximately 8 less than otherwisecomparable homes that are located further away Furthermore we find that themarket differentiates between potential risks that nearby treatment centers maycarry as living near a methadone clinic that treats opiate addictions such as heroinor morphine may be associated with a reduction in home values by as much as17 We find little evidence that nearby treatment centers affect a homersquos timeon market
Examining this particular externality is important to the broader literature onneighborhood externalities and environmental factors as well as the specificliterature on the issue of residential treatment centers The PPACA has expandedMHSUD coverage and made intensive treatment options affordable and as aresult demand for effective substance abuse treatment is increasing Operating atreatment center is a growing industry and it is reasonable to assume that newcenters will be built nationally many of which will be sited near or withinresidential communities Indeed there is very little that individuals and localitiescan do to prohibit a substance abuse treatment center from locating in a residentialarea because alcohol and drug addiction is considered to be a handicap and thusalcoholicaddicts in recovery are members of a protected class under the federalanti-discrimination housing laws Hence as residential treatment centers becomemore common it is important to understand all their effects including the effectsthey may have on nearby real estate and how markets price the potential risk ofnearby externalities
u E n d n o t e s1 For a more complete review on the impact of environmental externalities see Boyle and
Kiel (2001)
lsquo lsquo N o t i n M y B a c k y a r d rsquo rsquo u 8 9
J O S R E u V o l 6 u N o 1 ndash 2 0 1 4
2 Consistent with other real estate studies we culled outliers from our data set confiningour data to more lsquolsquotypicalrsquorsquo range of homes listed at less than $1000000 fewer than10 bedrooms fewer than 16 acres (99 of observations) property taxes paid that wereless $10000 (99 of observations) and younger than 150 years old (99 ofobservations) For our other dependent variable of interest time on market we similarlytrim the 1 extremes Generally the findings are not sensitive to dropping theseobservations Further important to disclose how our data has been trimmed fortransparency and replicability As an additional quality check a sample of the MLS datawas compared to county tax records which contain data on price and housingcharacteristics
3 There were approximately 153 96 and 60 properties listed within 0175 miles 015miles and 0125 miles of a rehab treatment facility respectively over the time periodof our study Given the very recent and projected growth of rehab centers nationallyfuture research will be able to take advantage of additional homes (data points) beingbought and sold near rehab facilities
4 The choice of this radius does not fundamentally alter the qualitative conclusions of thisstudy The definition of onersquos lsquolsquobackyardrsquorsquo is somewhat ambiguous and may differdepending on an individualrsquos perception Some externality studies use 01 mile 02 mileor 03 mile as a radius to examine a given externality While similar results are obtainedlooking at bands slightly larger and slightly smaller we follow Congdon-Hohman (2013)and use 18 mile in most of our tabulated regression results An easy way to think of0125 miles 015 miles and 0175 miles is that these are 25 minute 3 minute and 35minute walks respectively (assuming a pace of 3 miles per hour)
5 For recent examples of amenity or disamenity studies of externality effects see Asabereand Huffman (1991) Gibbons (2004) Linden and Rockoff (2008) Pope (2008) Rossi-Hansberg Sarte and Owens (2010) Campbell Giglio and Pathek (2011) Hoen WiserCappers Thayer and Sethi (2011) Daneshvary Clauretie and Kader (2011) GroutJaeger and Plantinga (2011) Daneshvary and Clauretie (2012) Congdon-Hohman(2013) Guignet (2013) Linn (2013) Munneke Sirmans Slade and Turnbull (2013)and Wentland Waller and Brastow (2014)
6 Recent examples include neighborhood foreclosure effects (Harding Rosenblatt andYao 2009 Lin Rosenblatt and Yao 2009 Agarwal Ambrose Chomsisengphet andSanders 2010)
7 Kuminoff Parmeter and Pope (2010) survey 69 hedonic studies and found that 80rely on linear semi-log or log-log functional form We have explored a number of non-linear functional forms and our results remain robust Rather than repeat all of the abovemodels with various non-linear explanatory variables the authors will produce resultsof alternative specifications upon request
8 For example we use the following property specific variables square footage ageacreage number of bedrooms bathrooms number of stories new vacant HOA feeswhether it has a pool a tenant a basement and whether it is a short sale or foreclosureWe also include year fixed effects to control for variation over time
9 When we explore different location controls later we will cluster by location (egcensus tract block group or block)
10 For example see Yavas and Yang (1995) Knight (2002) and Turnbull and Dombrow(2006)
11 Specifically both our paper and Zahirovic-Herbert and Turnbull (2008) calculate C inthe following way lsquolsquoThe days-on-market or selling time is s(i) 2 l(i) 1 1 where l(i)and s(i) are the listing date and sales date for house i Denoting the listing date and
9 0 u L a R o c h e W a l l e r a n d W e n t l a n d
sales date for house j by l( j) and s( j) the overlapping time on the market for these twohouses is min[s(i) s( j)] 2 max[l(i) l( j)] The straight-line distance in miles betweenhouses i and j is D(i j) The measured competition for house i is C(i) 5 oj (1 2 D(ij))2min[s(i) s( j)] 2 max[l(i) l( j)] where the summation is taken over all competinghouses j that is houses for sale within one mile and 20 larger or smaller in livingarea of house irsquorsquo (Zahirovic-Herbert and Turnbull 2008)
12 At the suggestion of a reviewer we also identify the system by using different controlvariables A simple way to do this is to use different location controls We use ZIP Codefixed effects in the price equation and census tract fixed effects in the time on marketequation Generally the results are not very sensitive to which location controls are usedin each equation Further the results are similar when we use the Turnbull and Dombrow(2006) method alone to identify the system
13 According to Belsley (1988) when there are strong interrelations among error terms3SLS is used instead of 2SLS in estimating systems of equations because it is moreefficient Specifically one would expect unobservables that contribute to error inestimating price to be also correlated the error in liquidity
14 See wwwcensusgov for more detail specifically http wwwcensusgovgeowwwcobtr metadatahtmlgad
u R e f e r e n c e s
Agarwal S B Ambrose S Chomsisengphet and AB Sanders Thy NeighborrsquosMortgage Does Living in a Subprime Neighborhood Affect Onersquos Probability of DefaultReal Estate Economics 2012 401 1ndash22
Asabere P and F Huffman Historic Districts and Land Values Journal of Real EstateResearch 1991 61 1ndash8
Augusta Chronicle Neighbors Oppose Upscale Rehab Facility in South Augusta http chronicleaugustacomnewshealth2013-08-05neighbors-oppose-upscale-rehab-facility-south-augusta August 5 2013
Belsley DA Two- or Three-stage Least Squares Computational Economics 1988 1 21ndash30
Beronio K R Po L Skopec and S Glied ASPE Research Brief Affordable Care ActWill Expand Mental Health and Substance Use Disorder Benefits and Parity Protectionsfor 62 Million Americans http aspehhsgovhealthreports 2013mental rb mentalcfm February 20 2013
Boyle M and K Kiel A Survey of House Price Hedonic Studies of the Impact ofEnvironmental Externalities Journal of Real Estate Literature 2001 92 117ndash44
Campbell JY S Giglio and P Pathak Forced Sales and House Prices AmericanEconomic Review 2011 1015 2108ndash31
City of Edmonds v Oxford House Inc et al 514 US 725 1995
Congdon-Hohman J The Lasting Effects of Crime The Relationship of DiscoveredMethamphetamine Laboratories and Home Values Regional Science and UrbanEconomics 2013 431 31ndash41
Connery H Alcohol Use and AbusemdashA Harvard Medical School Special Health Report2011 Fact Sheet MHPAEA http wwwdolgovebsanewsroomfsmhpaeahtml HUDDisability Rights in Housing http portalhudgovhudportal HUDsrc5 programofficesfair housing equal oppdisabilities inhousing
lsquo lsquo N o t i n M y B a c k y a r d rsquo rsquo u 9 1
J O S R E u V o l 6 u N o 1 ndash 2 0 1 4
Coulson NE and RM Leichenko The Internal and External Impact of HistoricalDesignation on Property Values Journal of Real Estate Finance and Economics 2001 231 113ndash24
Daneshvary N and TM Clauretie Toxic Neighbors Foreclosures and Short-SalesSpillover Effects from the Current Housing-Market Crash Economic Inquiry 2012 501217ndash31
Daneshvary N TM Clauretie and A Kader Short-Term Own-Price and Spillover Effectsof Distressed Residential Properties The Case of a Housing Crash Journal of Real EstateResearch 2011 332 179ndash207
Gibbons S The Cost of Urban Property Crime Economic Journal 2004 114 441ndash63
Grout CA WK Jaeger and AJ Plantinga Land-use Regulations and Property Valuesin Portland Oregon A Regression Discontinuity Design Approach Regional Science andUrban Economics 2011 482 98ndash107
Guignet D What Do Property Values Really Tell Us A Hedonic Study of UndergroundStorage Tanks Land Economics 2013 892 211ndash26
Harding JP E Rosenblatt and VW Yao The Contagion Effect of Foreclosed PropertiesJournal of Urban Economics 2009 663 164ndash78
Hite D W Chern F Hitzusen and A Randall Property-Value Impacts of anEnvironmental Disamenity The Case of Landfills Journal of Real Estate Finance andEconomics 2001 22 185ndash202
Hoen B R Wiser P Cappers M Thayer and G Sethi Wind Energy Facilities andResidential Properties The Effect of Proximity and View on Sales Prices Journal of RealEstate Research 2011 333 279ndash316
Ihlanfeldt K and T Mayock Panel Data Estimates of the Effects of Different Types ofCrime on Housing Prices Regional Science and Urban Economics 2010 40 161ndash72
Knight J Listing Price Time on Market and Ultimate Selling Price Causes and Effectsof Listing Price Changes Real Estate Economics 2002 302 213ndash37
Krainer J A Theory of Liquidity in Residential Real Estate Markets Journal of UrbanEconomics 2001 491 32ndash53
Kuminoff NV CF Parmeter and JC Pope Which Hedonic Models Can We Trust toRecover the Marginal Willingness to Pay for Environmental Amenities Journal ofEnvironmental Economics and Management 2010 603 145ndash60
Levitt SD and C Syverson Market Distortions When Agents Are Better Informed TheValue of Information in Real Estate Transactions Review of Economics and Statistics 2008904 599ndash611
Lin Z E Rosenblatt and VW Yao Spillover Effects of Foreclosures on NeighborhoodProperty Values Journal of Real Estate Finance and Economics 2009 383 387ndash407
Linden L and JE Rockoff Estimates of the Impact of Crime Risk on Property Valuesfrom Meganrsquos Law American Economic Review 2008 983 1103ndash27
Linn J The Effect of Voluntary Brownfields Programs on Nearby Property ValuesEvidence from Illinois Journal of Urban Economics 2013 78 1ndash18
McCluskey J and G Rausser Stigmatized Asset Value Is it Temporary or Long-TermReview of Economics and Statistics 2003 852 276ndash85
Munneke HJ CF Sirmans BA Slade and G Turnbull Housing RegulationExternalities and Residential Property Prices Real Estate Economics 2013 413 422ndash56
Pope D and J Pope Crime and Property Values Evidence from the 1990s Crime DropRegional Science and Urban Economic 2012 42 177ndash88
9 2 u L a R o c h e W a l l e r a n d W e n t l a n d
Pope J Fear of Crime and Housing Prices Household Reactions to Sex OffenderRegistries Journal of Urban Economics 2008 64 601ndash14
Reichert A M Small and S Mohanty The Impact of Landfills on Residential PropertyValues Journal of Real Estate Research 1992 73 297ndash314
Rosiers FD Power Lines Visual Encumbrance and House Values A MicrospatialApproach to Impact Measurement Journal of Real Estate Research 2002 233 275ndash301
Rossi-Hansberg E P-D Sarte and R Owens Housing Externalities Journal of PoliticalEconomy 2010 118 485ndash534
SAMHSA National Survey on Substance Abuse Treatment Services (N-SSATS) 2008http wwwsamhsagovsamhsanewsletter Volume 18 Number 1TreatmentFacilitiesaspx
Shaffer H Overcoming Addiction Paths Toward RecoverymdashA Harvard Medical SchoolSpecial Health Report 2012
Thaler R A Note on the Value of Crime Control Evidence from the Property MarketJournal of Urban Economics 1978 51 137ndash45
Turnbull G and J Dombrow Spatial Competition and Shopping Externalities Evidencefrom the Housing Market Journal of Real Estate Finance and Economics 2006 324391ndash408
Wentland S B Waller and R Brastow Estimating the Effect of Crime Risk on PropertyValues and Time on Market Evidence from Meganrsquos Law in Virginia Real EstateEconomics 2013 421 223ndash51
Yavas A and S Yang The Strategic Role of Listing Price in Marketing Real Estate Theoryand Evidence Real Estate Economics 1995 233 347ndash68
Zahirovic-Herbert V and G Turnbull School Quality House Prices and Liquidity Journalof Real Estate Finance and Economics 2008 37 113ndash30
Claire R La Roche Longwood University Farmville VA 23909 or larochecrlongwoodedu
Bennie D Waller Longwood University Farmville VA 23909 or wallerbdlongwoodedu
Scott A Wentland Longwood University Farmville VA 23909 or wentlandsalongwoodedu
lsquolsquoN
ot
in
My
Ba
ck
ya
rd
rsquorsquo
u8
5
JO
SR
Eu
Vo
l
6u
No
1
ndash2
01
4
Exhibit 6 u Effect of a Nearby Rehab Facility that Treats Methadone Addiction
DependentVariableln(Sale Price)
DependentVariableln(Days on Market)
DependentVariableln(Sale Price)
DependentVariableln(Days on Market)
DependentVariableln(Sale Price)
DependentVariableln(Days on Market)
Within 15 Miles of a Rehab Facility Within 1 Mile of a Rehab Facility Within 06 Miles of a Rehab Facility
ln(Time on Market) 0042 0020 0012(1081) (393) (167)
ln(Sale Price) 0955 0082 0322(185) (014) (043)
Listing Density 0000 0000 0000(642) (440) (248)
lsquolsquoN
ot
in
My
Ba
ck
ya
rd
rsquorsquo
u8
7
JO
SR
Eu
Vo
l
6u
No
1
ndash2
01
4
Exhibit 6 u (continued)
Effect of a Nearby Rehab Facility that Treats Methadone Addiction
DependentVariableln(Sale Price)
DependentVariableln(Days on Market)
DependentVariableln(Sale Price)
DependentVariableln(Days on Market)
DependentVariableln(Sale Price)
DependentVariableln(Days on Market)
Within 15 Miles of a Rehab Facility Within 1 Mile of a Rehab Facility Within 06 Miles of a Rehab Facility
(1a) (1b) (2a) (2b) (3a) (3b)
Competition 0000 0000 0000(886) (625) (589)
Location Controls u u u u u u
Year Fixed Effects u u u u u u
Notes This table presents 3SLS results of simultaneous estimation of the effect of a nearby rehab facility that treats methadone addiction on a homersquos selling price andliquidity (time on market) changing the sample to vary the control groups by smaller radii from a rehab center Z-statistics are in parentheses The number ofobservations in column 1 is 7711 the number of observations in column 2 is 3589 the number of observations in column 3 is 1324Significant at the 10 levelSignificant at the 5 levelSignificant at the 1 level
8 8 u L a R o c h e W a l l e r a n d W e n t l a n d
treatment centers are still negatively impacted and by approximately the samemagnitudes Indeed the last two columns are particularly striking Given that thisis already a lsquolsquowithin neighborhoodrsquorsquo estimation by controlling for location thefact that the substance abuse treatment center result is robust when the controlgroup is reduced to 1 mile and 06 miles indicates that unobserved spatialheterogeneity is not likely driving the core results of this paper More intuitivelythis provides strong evidence that the substance abuse treatment center effect isnot simply a lsquolsquobad part of town effectrsquorsquo in that we are comparing lsquolsquoapples withapplesrsquorsquo across the dimension of location and the principle characteristicdistinguishing the variation in prices in these areas is the presence of a nearbysubstance abuse treatment center Based on these results we cannot conclude thatthere is a robust impact on property liquidity but there appears to be a robustnegative relationship between the presence of a substance abuse treatment centerand nearby home values
u C o n c l u s i o n
In this study we find evidence that residential substance abuse treatment centersadversely impact the price of neighboring homes We find that homes within 18mile of a treatment center sell for approximately 8 less than otherwisecomparable homes that are located further away Furthermore we find that themarket differentiates between potential risks that nearby treatment centers maycarry as living near a methadone clinic that treats opiate addictions such as heroinor morphine may be associated with a reduction in home values by as much as17 We find little evidence that nearby treatment centers affect a homersquos timeon market
Examining this particular externality is important to the broader literature onneighborhood externalities and environmental factors as well as the specificliterature on the issue of residential treatment centers The PPACA has expandedMHSUD coverage and made intensive treatment options affordable and as aresult demand for effective substance abuse treatment is increasing Operating atreatment center is a growing industry and it is reasonable to assume that newcenters will be built nationally many of which will be sited near or withinresidential communities Indeed there is very little that individuals and localitiescan do to prohibit a substance abuse treatment center from locating in a residentialarea because alcohol and drug addiction is considered to be a handicap and thusalcoholicaddicts in recovery are members of a protected class under the federalanti-discrimination housing laws Hence as residential treatment centers becomemore common it is important to understand all their effects including the effectsthey may have on nearby real estate and how markets price the potential risk ofnearby externalities
u E n d n o t e s1 For a more complete review on the impact of environmental externalities see Boyle and
Kiel (2001)
lsquo lsquo N o t i n M y B a c k y a r d rsquo rsquo u 8 9
J O S R E u V o l 6 u N o 1 ndash 2 0 1 4
2 Consistent with other real estate studies we culled outliers from our data set confiningour data to more lsquolsquotypicalrsquorsquo range of homes listed at less than $1000000 fewer than10 bedrooms fewer than 16 acres (99 of observations) property taxes paid that wereless $10000 (99 of observations) and younger than 150 years old (99 ofobservations) For our other dependent variable of interest time on market we similarlytrim the 1 extremes Generally the findings are not sensitive to dropping theseobservations Further important to disclose how our data has been trimmed fortransparency and replicability As an additional quality check a sample of the MLS datawas compared to county tax records which contain data on price and housingcharacteristics
3 There were approximately 153 96 and 60 properties listed within 0175 miles 015miles and 0125 miles of a rehab treatment facility respectively over the time periodof our study Given the very recent and projected growth of rehab centers nationallyfuture research will be able to take advantage of additional homes (data points) beingbought and sold near rehab facilities
4 The choice of this radius does not fundamentally alter the qualitative conclusions of thisstudy The definition of onersquos lsquolsquobackyardrsquorsquo is somewhat ambiguous and may differdepending on an individualrsquos perception Some externality studies use 01 mile 02 mileor 03 mile as a radius to examine a given externality While similar results are obtainedlooking at bands slightly larger and slightly smaller we follow Congdon-Hohman (2013)and use 18 mile in most of our tabulated regression results An easy way to think of0125 miles 015 miles and 0175 miles is that these are 25 minute 3 minute and 35minute walks respectively (assuming a pace of 3 miles per hour)
5 For recent examples of amenity or disamenity studies of externality effects see Asabereand Huffman (1991) Gibbons (2004) Linden and Rockoff (2008) Pope (2008) Rossi-Hansberg Sarte and Owens (2010) Campbell Giglio and Pathek (2011) Hoen WiserCappers Thayer and Sethi (2011) Daneshvary Clauretie and Kader (2011) GroutJaeger and Plantinga (2011) Daneshvary and Clauretie (2012) Congdon-Hohman(2013) Guignet (2013) Linn (2013) Munneke Sirmans Slade and Turnbull (2013)and Wentland Waller and Brastow (2014)
6 Recent examples include neighborhood foreclosure effects (Harding Rosenblatt andYao 2009 Lin Rosenblatt and Yao 2009 Agarwal Ambrose Chomsisengphet andSanders 2010)
7 Kuminoff Parmeter and Pope (2010) survey 69 hedonic studies and found that 80rely on linear semi-log or log-log functional form We have explored a number of non-linear functional forms and our results remain robust Rather than repeat all of the abovemodels with various non-linear explanatory variables the authors will produce resultsof alternative specifications upon request
8 For example we use the following property specific variables square footage ageacreage number of bedrooms bathrooms number of stories new vacant HOA feeswhether it has a pool a tenant a basement and whether it is a short sale or foreclosureWe also include year fixed effects to control for variation over time
9 When we explore different location controls later we will cluster by location (egcensus tract block group or block)
10 For example see Yavas and Yang (1995) Knight (2002) and Turnbull and Dombrow(2006)
11 Specifically both our paper and Zahirovic-Herbert and Turnbull (2008) calculate C inthe following way lsquolsquoThe days-on-market or selling time is s(i) 2 l(i) 1 1 where l(i)and s(i) are the listing date and sales date for house i Denoting the listing date and
9 0 u L a R o c h e W a l l e r a n d W e n t l a n d
sales date for house j by l( j) and s( j) the overlapping time on the market for these twohouses is min[s(i) s( j)] 2 max[l(i) l( j)] The straight-line distance in miles betweenhouses i and j is D(i j) The measured competition for house i is C(i) 5 oj (1 2 D(ij))2min[s(i) s( j)] 2 max[l(i) l( j)] where the summation is taken over all competinghouses j that is houses for sale within one mile and 20 larger or smaller in livingarea of house irsquorsquo (Zahirovic-Herbert and Turnbull 2008)
12 At the suggestion of a reviewer we also identify the system by using different controlvariables A simple way to do this is to use different location controls We use ZIP Codefixed effects in the price equation and census tract fixed effects in the time on marketequation Generally the results are not very sensitive to which location controls are usedin each equation Further the results are similar when we use the Turnbull and Dombrow(2006) method alone to identify the system
13 According to Belsley (1988) when there are strong interrelations among error terms3SLS is used instead of 2SLS in estimating systems of equations because it is moreefficient Specifically one would expect unobservables that contribute to error inestimating price to be also correlated the error in liquidity
14 See wwwcensusgov for more detail specifically http wwwcensusgovgeowwwcobtr metadatahtmlgad
u R e f e r e n c e s
Agarwal S B Ambrose S Chomsisengphet and AB Sanders Thy NeighborrsquosMortgage Does Living in a Subprime Neighborhood Affect Onersquos Probability of DefaultReal Estate Economics 2012 401 1ndash22
Asabere P and F Huffman Historic Districts and Land Values Journal of Real EstateResearch 1991 61 1ndash8
Augusta Chronicle Neighbors Oppose Upscale Rehab Facility in South Augusta http chronicleaugustacomnewshealth2013-08-05neighbors-oppose-upscale-rehab-facility-south-augusta August 5 2013
Belsley DA Two- or Three-stage Least Squares Computational Economics 1988 1 21ndash30
Beronio K R Po L Skopec and S Glied ASPE Research Brief Affordable Care ActWill Expand Mental Health and Substance Use Disorder Benefits and Parity Protectionsfor 62 Million Americans http aspehhsgovhealthreports 2013mental rb mentalcfm February 20 2013
Boyle M and K Kiel A Survey of House Price Hedonic Studies of the Impact ofEnvironmental Externalities Journal of Real Estate Literature 2001 92 117ndash44
Campbell JY S Giglio and P Pathak Forced Sales and House Prices AmericanEconomic Review 2011 1015 2108ndash31
City of Edmonds v Oxford House Inc et al 514 US 725 1995
Congdon-Hohman J The Lasting Effects of Crime The Relationship of DiscoveredMethamphetamine Laboratories and Home Values Regional Science and UrbanEconomics 2013 431 31ndash41
Connery H Alcohol Use and AbusemdashA Harvard Medical School Special Health Report2011 Fact Sheet MHPAEA http wwwdolgovebsanewsroomfsmhpaeahtml HUDDisability Rights in Housing http portalhudgovhudportal HUDsrc5 programofficesfair housing equal oppdisabilities inhousing
lsquo lsquo N o t i n M y B a c k y a r d rsquo rsquo u 9 1
J O S R E u V o l 6 u N o 1 ndash 2 0 1 4
Coulson NE and RM Leichenko The Internal and External Impact of HistoricalDesignation on Property Values Journal of Real Estate Finance and Economics 2001 231 113ndash24
Daneshvary N and TM Clauretie Toxic Neighbors Foreclosures and Short-SalesSpillover Effects from the Current Housing-Market Crash Economic Inquiry 2012 501217ndash31
Daneshvary N TM Clauretie and A Kader Short-Term Own-Price and Spillover Effectsof Distressed Residential Properties The Case of a Housing Crash Journal of Real EstateResearch 2011 332 179ndash207
Gibbons S The Cost of Urban Property Crime Economic Journal 2004 114 441ndash63
Grout CA WK Jaeger and AJ Plantinga Land-use Regulations and Property Valuesin Portland Oregon A Regression Discontinuity Design Approach Regional Science andUrban Economics 2011 482 98ndash107
Guignet D What Do Property Values Really Tell Us A Hedonic Study of UndergroundStorage Tanks Land Economics 2013 892 211ndash26
Harding JP E Rosenblatt and VW Yao The Contagion Effect of Foreclosed PropertiesJournal of Urban Economics 2009 663 164ndash78
Hite D W Chern F Hitzusen and A Randall Property-Value Impacts of anEnvironmental Disamenity The Case of Landfills Journal of Real Estate Finance andEconomics 2001 22 185ndash202
Hoen B R Wiser P Cappers M Thayer and G Sethi Wind Energy Facilities andResidential Properties The Effect of Proximity and View on Sales Prices Journal of RealEstate Research 2011 333 279ndash316
Ihlanfeldt K and T Mayock Panel Data Estimates of the Effects of Different Types ofCrime on Housing Prices Regional Science and Urban Economics 2010 40 161ndash72
Knight J Listing Price Time on Market and Ultimate Selling Price Causes and Effectsof Listing Price Changes Real Estate Economics 2002 302 213ndash37
Krainer J A Theory of Liquidity in Residential Real Estate Markets Journal of UrbanEconomics 2001 491 32ndash53
Kuminoff NV CF Parmeter and JC Pope Which Hedonic Models Can We Trust toRecover the Marginal Willingness to Pay for Environmental Amenities Journal ofEnvironmental Economics and Management 2010 603 145ndash60
Levitt SD and C Syverson Market Distortions When Agents Are Better Informed TheValue of Information in Real Estate Transactions Review of Economics and Statistics 2008904 599ndash611
Lin Z E Rosenblatt and VW Yao Spillover Effects of Foreclosures on NeighborhoodProperty Values Journal of Real Estate Finance and Economics 2009 383 387ndash407
Linden L and JE Rockoff Estimates of the Impact of Crime Risk on Property Valuesfrom Meganrsquos Law American Economic Review 2008 983 1103ndash27
Linn J The Effect of Voluntary Brownfields Programs on Nearby Property ValuesEvidence from Illinois Journal of Urban Economics 2013 78 1ndash18
McCluskey J and G Rausser Stigmatized Asset Value Is it Temporary or Long-TermReview of Economics and Statistics 2003 852 276ndash85
Munneke HJ CF Sirmans BA Slade and G Turnbull Housing RegulationExternalities and Residential Property Prices Real Estate Economics 2013 413 422ndash56
Pope D and J Pope Crime and Property Values Evidence from the 1990s Crime DropRegional Science and Urban Economic 2012 42 177ndash88
9 2 u L a R o c h e W a l l e r a n d W e n t l a n d
Pope J Fear of Crime and Housing Prices Household Reactions to Sex OffenderRegistries Journal of Urban Economics 2008 64 601ndash14
Reichert A M Small and S Mohanty The Impact of Landfills on Residential PropertyValues Journal of Real Estate Research 1992 73 297ndash314
Rosiers FD Power Lines Visual Encumbrance and House Values A MicrospatialApproach to Impact Measurement Journal of Real Estate Research 2002 233 275ndash301
Rossi-Hansberg E P-D Sarte and R Owens Housing Externalities Journal of PoliticalEconomy 2010 118 485ndash534
SAMHSA National Survey on Substance Abuse Treatment Services (N-SSATS) 2008http wwwsamhsagovsamhsanewsletter Volume 18 Number 1TreatmentFacilitiesaspx
Shaffer H Overcoming Addiction Paths Toward RecoverymdashA Harvard Medical SchoolSpecial Health Report 2012
Thaler R A Note on the Value of Crime Control Evidence from the Property MarketJournal of Urban Economics 1978 51 137ndash45
Turnbull G and J Dombrow Spatial Competition and Shopping Externalities Evidencefrom the Housing Market Journal of Real Estate Finance and Economics 2006 324391ndash408
Wentland S B Waller and R Brastow Estimating the Effect of Crime Risk on PropertyValues and Time on Market Evidence from Meganrsquos Law in Virginia Real EstateEconomics 2013 421 223ndash51
Yavas A and S Yang The Strategic Role of Listing Price in Marketing Real Estate Theoryand Evidence Real Estate Economics 1995 233 347ndash68
Zahirovic-Herbert V and G Turnbull School Quality House Prices and Liquidity Journalof Real Estate Finance and Economics 2008 37 113ndash30
Claire R La Roche Longwood University Farmville VA 23909 or larochecrlongwoodedu
Bennie D Waller Longwood University Farmville VA 23909 or wallerbdlongwoodedu
Scott A Wentland Longwood University Farmville VA 23909 or wentlandsalongwoodedu
86
uL
aR
oc
he
W
alle
r
an
dW
en
tla
nd
Exhibit 6 u (continued)
Effect of a Nearby Rehab Facility that Treats Methadone Addiction
DependentVariableln(Sale Price)
DependentVariableln(Days on Market)
DependentVariableln(Sale Price)
DependentVariableln(Days on Market)
DependentVariableln(Sale Price)
DependentVariableln(Days on Market)
Within 15 Miles of a Rehab Facility Within 1 Mile of a Rehab Facility Within 06 Miles of a Rehab Facility
ln(Time on Market) 0042 0020 0012(1081) (393) (167)
ln(Sale Price) 0955 0082 0322(185) (014) (043)
Listing Density 0000 0000 0000(642) (440) (248)
lsquolsquoN
ot
in
My
Ba
ck
ya
rd
rsquorsquo
u8
7
JO
SR
Eu
Vo
l
6u
No
1
ndash2
01
4
Exhibit 6 u (continued)
Effect of a Nearby Rehab Facility that Treats Methadone Addiction
DependentVariableln(Sale Price)
DependentVariableln(Days on Market)
DependentVariableln(Sale Price)
DependentVariableln(Days on Market)
DependentVariableln(Sale Price)
DependentVariableln(Days on Market)
Within 15 Miles of a Rehab Facility Within 1 Mile of a Rehab Facility Within 06 Miles of a Rehab Facility
(1a) (1b) (2a) (2b) (3a) (3b)
Competition 0000 0000 0000(886) (625) (589)
Location Controls u u u u u u
Year Fixed Effects u u u u u u
Notes This table presents 3SLS results of simultaneous estimation of the effect of a nearby rehab facility that treats methadone addiction on a homersquos selling price andliquidity (time on market) changing the sample to vary the control groups by smaller radii from a rehab center Z-statistics are in parentheses The number ofobservations in column 1 is 7711 the number of observations in column 2 is 3589 the number of observations in column 3 is 1324Significant at the 10 levelSignificant at the 5 levelSignificant at the 1 level
8 8 u L a R o c h e W a l l e r a n d W e n t l a n d
treatment centers are still negatively impacted and by approximately the samemagnitudes Indeed the last two columns are particularly striking Given that thisis already a lsquolsquowithin neighborhoodrsquorsquo estimation by controlling for location thefact that the substance abuse treatment center result is robust when the controlgroup is reduced to 1 mile and 06 miles indicates that unobserved spatialheterogeneity is not likely driving the core results of this paper More intuitivelythis provides strong evidence that the substance abuse treatment center effect isnot simply a lsquolsquobad part of town effectrsquorsquo in that we are comparing lsquolsquoapples withapplesrsquorsquo across the dimension of location and the principle characteristicdistinguishing the variation in prices in these areas is the presence of a nearbysubstance abuse treatment center Based on these results we cannot conclude thatthere is a robust impact on property liquidity but there appears to be a robustnegative relationship between the presence of a substance abuse treatment centerand nearby home values
u C o n c l u s i o n
In this study we find evidence that residential substance abuse treatment centersadversely impact the price of neighboring homes We find that homes within 18mile of a treatment center sell for approximately 8 less than otherwisecomparable homes that are located further away Furthermore we find that themarket differentiates between potential risks that nearby treatment centers maycarry as living near a methadone clinic that treats opiate addictions such as heroinor morphine may be associated with a reduction in home values by as much as17 We find little evidence that nearby treatment centers affect a homersquos timeon market
Examining this particular externality is important to the broader literature onneighborhood externalities and environmental factors as well as the specificliterature on the issue of residential treatment centers The PPACA has expandedMHSUD coverage and made intensive treatment options affordable and as aresult demand for effective substance abuse treatment is increasing Operating atreatment center is a growing industry and it is reasonable to assume that newcenters will be built nationally many of which will be sited near or withinresidential communities Indeed there is very little that individuals and localitiescan do to prohibit a substance abuse treatment center from locating in a residentialarea because alcohol and drug addiction is considered to be a handicap and thusalcoholicaddicts in recovery are members of a protected class under the federalanti-discrimination housing laws Hence as residential treatment centers becomemore common it is important to understand all their effects including the effectsthey may have on nearby real estate and how markets price the potential risk ofnearby externalities
u E n d n o t e s1 For a more complete review on the impact of environmental externalities see Boyle and
Kiel (2001)
lsquo lsquo N o t i n M y B a c k y a r d rsquo rsquo u 8 9
J O S R E u V o l 6 u N o 1 ndash 2 0 1 4
2 Consistent with other real estate studies we culled outliers from our data set confiningour data to more lsquolsquotypicalrsquorsquo range of homes listed at less than $1000000 fewer than10 bedrooms fewer than 16 acres (99 of observations) property taxes paid that wereless $10000 (99 of observations) and younger than 150 years old (99 ofobservations) For our other dependent variable of interest time on market we similarlytrim the 1 extremes Generally the findings are not sensitive to dropping theseobservations Further important to disclose how our data has been trimmed fortransparency and replicability As an additional quality check a sample of the MLS datawas compared to county tax records which contain data on price and housingcharacteristics
3 There were approximately 153 96 and 60 properties listed within 0175 miles 015miles and 0125 miles of a rehab treatment facility respectively over the time periodof our study Given the very recent and projected growth of rehab centers nationallyfuture research will be able to take advantage of additional homes (data points) beingbought and sold near rehab facilities
4 The choice of this radius does not fundamentally alter the qualitative conclusions of thisstudy The definition of onersquos lsquolsquobackyardrsquorsquo is somewhat ambiguous and may differdepending on an individualrsquos perception Some externality studies use 01 mile 02 mileor 03 mile as a radius to examine a given externality While similar results are obtainedlooking at bands slightly larger and slightly smaller we follow Congdon-Hohman (2013)and use 18 mile in most of our tabulated regression results An easy way to think of0125 miles 015 miles and 0175 miles is that these are 25 minute 3 minute and 35minute walks respectively (assuming a pace of 3 miles per hour)
5 For recent examples of amenity or disamenity studies of externality effects see Asabereand Huffman (1991) Gibbons (2004) Linden and Rockoff (2008) Pope (2008) Rossi-Hansberg Sarte and Owens (2010) Campbell Giglio and Pathek (2011) Hoen WiserCappers Thayer and Sethi (2011) Daneshvary Clauretie and Kader (2011) GroutJaeger and Plantinga (2011) Daneshvary and Clauretie (2012) Congdon-Hohman(2013) Guignet (2013) Linn (2013) Munneke Sirmans Slade and Turnbull (2013)and Wentland Waller and Brastow (2014)
6 Recent examples include neighborhood foreclosure effects (Harding Rosenblatt andYao 2009 Lin Rosenblatt and Yao 2009 Agarwal Ambrose Chomsisengphet andSanders 2010)
7 Kuminoff Parmeter and Pope (2010) survey 69 hedonic studies and found that 80rely on linear semi-log or log-log functional form We have explored a number of non-linear functional forms and our results remain robust Rather than repeat all of the abovemodels with various non-linear explanatory variables the authors will produce resultsof alternative specifications upon request
8 For example we use the following property specific variables square footage ageacreage number of bedrooms bathrooms number of stories new vacant HOA feeswhether it has a pool a tenant a basement and whether it is a short sale or foreclosureWe also include year fixed effects to control for variation over time
9 When we explore different location controls later we will cluster by location (egcensus tract block group or block)
10 For example see Yavas and Yang (1995) Knight (2002) and Turnbull and Dombrow(2006)
11 Specifically both our paper and Zahirovic-Herbert and Turnbull (2008) calculate C inthe following way lsquolsquoThe days-on-market or selling time is s(i) 2 l(i) 1 1 where l(i)and s(i) are the listing date and sales date for house i Denoting the listing date and
9 0 u L a R o c h e W a l l e r a n d W e n t l a n d
sales date for house j by l( j) and s( j) the overlapping time on the market for these twohouses is min[s(i) s( j)] 2 max[l(i) l( j)] The straight-line distance in miles betweenhouses i and j is D(i j) The measured competition for house i is C(i) 5 oj (1 2 D(ij))2min[s(i) s( j)] 2 max[l(i) l( j)] where the summation is taken over all competinghouses j that is houses for sale within one mile and 20 larger or smaller in livingarea of house irsquorsquo (Zahirovic-Herbert and Turnbull 2008)
12 At the suggestion of a reviewer we also identify the system by using different controlvariables A simple way to do this is to use different location controls We use ZIP Codefixed effects in the price equation and census tract fixed effects in the time on marketequation Generally the results are not very sensitive to which location controls are usedin each equation Further the results are similar when we use the Turnbull and Dombrow(2006) method alone to identify the system
13 According to Belsley (1988) when there are strong interrelations among error terms3SLS is used instead of 2SLS in estimating systems of equations because it is moreefficient Specifically one would expect unobservables that contribute to error inestimating price to be also correlated the error in liquidity
14 See wwwcensusgov for more detail specifically http wwwcensusgovgeowwwcobtr metadatahtmlgad
u R e f e r e n c e s
Agarwal S B Ambrose S Chomsisengphet and AB Sanders Thy NeighborrsquosMortgage Does Living in a Subprime Neighborhood Affect Onersquos Probability of DefaultReal Estate Economics 2012 401 1ndash22
Asabere P and F Huffman Historic Districts and Land Values Journal of Real EstateResearch 1991 61 1ndash8
Augusta Chronicle Neighbors Oppose Upscale Rehab Facility in South Augusta http chronicleaugustacomnewshealth2013-08-05neighbors-oppose-upscale-rehab-facility-south-augusta August 5 2013
Belsley DA Two- or Three-stage Least Squares Computational Economics 1988 1 21ndash30
Beronio K R Po L Skopec and S Glied ASPE Research Brief Affordable Care ActWill Expand Mental Health and Substance Use Disorder Benefits and Parity Protectionsfor 62 Million Americans http aspehhsgovhealthreports 2013mental rb mentalcfm February 20 2013
Boyle M and K Kiel A Survey of House Price Hedonic Studies of the Impact ofEnvironmental Externalities Journal of Real Estate Literature 2001 92 117ndash44
Campbell JY S Giglio and P Pathak Forced Sales and House Prices AmericanEconomic Review 2011 1015 2108ndash31
City of Edmonds v Oxford House Inc et al 514 US 725 1995
Congdon-Hohman J The Lasting Effects of Crime The Relationship of DiscoveredMethamphetamine Laboratories and Home Values Regional Science and UrbanEconomics 2013 431 31ndash41
Connery H Alcohol Use and AbusemdashA Harvard Medical School Special Health Report2011 Fact Sheet MHPAEA http wwwdolgovebsanewsroomfsmhpaeahtml HUDDisability Rights in Housing http portalhudgovhudportal HUDsrc5 programofficesfair housing equal oppdisabilities inhousing
lsquo lsquo N o t i n M y B a c k y a r d rsquo rsquo u 9 1
J O S R E u V o l 6 u N o 1 ndash 2 0 1 4
Coulson NE and RM Leichenko The Internal and External Impact of HistoricalDesignation on Property Values Journal of Real Estate Finance and Economics 2001 231 113ndash24
Daneshvary N and TM Clauretie Toxic Neighbors Foreclosures and Short-SalesSpillover Effects from the Current Housing-Market Crash Economic Inquiry 2012 501217ndash31
Daneshvary N TM Clauretie and A Kader Short-Term Own-Price and Spillover Effectsof Distressed Residential Properties The Case of a Housing Crash Journal of Real EstateResearch 2011 332 179ndash207
Gibbons S The Cost of Urban Property Crime Economic Journal 2004 114 441ndash63
Grout CA WK Jaeger and AJ Plantinga Land-use Regulations and Property Valuesin Portland Oregon A Regression Discontinuity Design Approach Regional Science andUrban Economics 2011 482 98ndash107
Guignet D What Do Property Values Really Tell Us A Hedonic Study of UndergroundStorage Tanks Land Economics 2013 892 211ndash26
Harding JP E Rosenblatt and VW Yao The Contagion Effect of Foreclosed PropertiesJournal of Urban Economics 2009 663 164ndash78
Hite D W Chern F Hitzusen and A Randall Property-Value Impacts of anEnvironmental Disamenity The Case of Landfills Journal of Real Estate Finance andEconomics 2001 22 185ndash202
Hoen B R Wiser P Cappers M Thayer and G Sethi Wind Energy Facilities andResidential Properties The Effect of Proximity and View on Sales Prices Journal of RealEstate Research 2011 333 279ndash316
Ihlanfeldt K and T Mayock Panel Data Estimates of the Effects of Different Types ofCrime on Housing Prices Regional Science and Urban Economics 2010 40 161ndash72
Knight J Listing Price Time on Market and Ultimate Selling Price Causes and Effectsof Listing Price Changes Real Estate Economics 2002 302 213ndash37
Krainer J A Theory of Liquidity in Residential Real Estate Markets Journal of UrbanEconomics 2001 491 32ndash53
Kuminoff NV CF Parmeter and JC Pope Which Hedonic Models Can We Trust toRecover the Marginal Willingness to Pay for Environmental Amenities Journal ofEnvironmental Economics and Management 2010 603 145ndash60
Levitt SD and C Syverson Market Distortions When Agents Are Better Informed TheValue of Information in Real Estate Transactions Review of Economics and Statistics 2008904 599ndash611
Lin Z E Rosenblatt and VW Yao Spillover Effects of Foreclosures on NeighborhoodProperty Values Journal of Real Estate Finance and Economics 2009 383 387ndash407
Linden L and JE Rockoff Estimates of the Impact of Crime Risk on Property Valuesfrom Meganrsquos Law American Economic Review 2008 983 1103ndash27
Linn J The Effect of Voluntary Brownfields Programs on Nearby Property ValuesEvidence from Illinois Journal of Urban Economics 2013 78 1ndash18
McCluskey J and G Rausser Stigmatized Asset Value Is it Temporary or Long-TermReview of Economics and Statistics 2003 852 276ndash85
Munneke HJ CF Sirmans BA Slade and G Turnbull Housing RegulationExternalities and Residential Property Prices Real Estate Economics 2013 413 422ndash56
Pope D and J Pope Crime and Property Values Evidence from the 1990s Crime DropRegional Science and Urban Economic 2012 42 177ndash88
9 2 u L a R o c h e W a l l e r a n d W e n t l a n d
Pope J Fear of Crime and Housing Prices Household Reactions to Sex OffenderRegistries Journal of Urban Economics 2008 64 601ndash14
Reichert A M Small and S Mohanty The Impact of Landfills on Residential PropertyValues Journal of Real Estate Research 1992 73 297ndash314
Rosiers FD Power Lines Visual Encumbrance and House Values A MicrospatialApproach to Impact Measurement Journal of Real Estate Research 2002 233 275ndash301
Rossi-Hansberg E P-D Sarte and R Owens Housing Externalities Journal of PoliticalEconomy 2010 118 485ndash534
SAMHSA National Survey on Substance Abuse Treatment Services (N-SSATS) 2008http wwwsamhsagovsamhsanewsletter Volume 18 Number 1TreatmentFacilitiesaspx
Shaffer H Overcoming Addiction Paths Toward RecoverymdashA Harvard Medical SchoolSpecial Health Report 2012
Thaler R A Note on the Value of Crime Control Evidence from the Property MarketJournal of Urban Economics 1978 51 137ndash45
Turnbull G and J Dombrow Spatial Competition and Shopping Externalities Evidencefrom the Housing Market Journal of Real Estate Finance and Economics 2006 324391ndash408
Wentland S B Waller and R Brastow Estimating the Effect of Crime Risk on PropertyValues and Time on Market Evidence from Meganrsquos Law in Virginia Real EstateEconomics 2013 421 223ndash51
Yavas A and S Yang The Strategic Role of Listing Price in Marketing Real Estate Theoryand Evidence Real Estate Economics 1995 233 347ndash68
Zahirovic-Herbert V and G Turnbull School Quality House Prices and Liquidity Journalof Real Estate Finance and Economics 2008 37 113ndash30
Claire R La Roche Longwood University Farmville VA 23909 or larochecrlongwoodedu
Bennie D Waller Longwood University Farmville VA 23909 or wallerbdlongwoodedu
Scott A Wentland Longwood University Farmville VA 23909 or wentlandsalongwoodedu