Ecology, 93(5), 2012, pp. 1002–1015 Ó 2012 by the Ecological Society of America Not just the usual suspects: Insect herbivore populations and communities are associated with multiple plant nutrients ANTHONY JOERN, 1,4 TONY PROVIN, 2 AND SPENCER T. BEHMER 3 1 Division of Biology, Kansas State University, Manhattan, Kansas 66506 USA 2 Department of Soil and Crop Sciences, Texas A&M University, College Station, Texas 77843 USA 3 Department of Entomology, Texas A&M University, College Station, Texas 77843 USA Abstract. The relationship between plant nutrient content and insect herbivore populations and community structure has long interested ecologists. Insect herbivores require multiple nutrients, but ecologists have focused mostly on nitrogen (an estimate of plant protein content), and more recently phosphorus (P); other nutrients have received little attention. Here we document nutrient variation in grass and forb samples from grassland habitats in central Nebraska using an elemental approach; in total we measured foliar concentrations of 12 elements (N and P, plus S, B, Ca, Mg, Na, K, Zn, Fe, Mn, and Cu). We detected significant variability among sites for N, P, Mg, Na, K, and Cu. We next used a model selection approach to explore how this nutritional variation and plant biomass correlate with grasshopper densities (collectively and at the feeding-guild level), and principal component analysis to explore nutrient correlations with grasshopper community species composition. When all grasshoppers were pooled, densities varied among sites, but only P was associated with abundance of the elements shown to vary between sites. Different responses occurred at the feeding-guild level. For grass specialists, densities were associated with N, plus P, Mg, and Na. For forb specialists, N and P were often associated with density, but associations with Na and K were also observed. Finally, mixed-feeder abundance was strongly associated with biomass, and to a lesser extent P, Mg, Na, and Cu. At the community level, B, Ca, Zn, and Cu, plus biomass, explained .30% of species composition variation. Our results confirm the positive association of N and P with insect herbivore populations, while suggesting a potential role for Mg, Na, and K. They also demonstrate the importance of exploring effects at the feeding-guild level. We hope our data motivate ecologists to think beyond N and P when considering plant nutrient effects on insect herbivores, and make a call for studies to examine functional responses of insect herbivores to dietary manipulation of Mg, Na, and K. Finally, our results demonstrate correlations between variation in nutrients and species assemblages, but factors not linked to plant nutrient quality or biomass likely explain most of the observed variation. Key words: Acrididae; grasshoppers; insect herbivory; mixed grass prairie; Nebraska sandhills grassland (USA); nutritional ecology; Orthoptera; physiological ecology. INTRODUCTION The distributions and abundances of insect herbivores are notoriously heterogeneous in time and space at multiple spatial scales (Barbosa and Schultz 1987, Cappuccino and Price 1995). Two factors that can be linked with these patterns are plant nutritional quality and biomass. Exploring the relationship between plant biomass and insect herbivores is relatively straightfor- ward, in part because these two factors are easily quantified. In contrast, linking plant quality with insect herbivore abundance is a greater challenge. First, because insect herbivores require multiple nutrients and perform best when they acquire nutrients in a specific blend, both in terms of amounts and ratios (Behmer and Joern 2008, Behmer 2009, Raubenheimer et al. 2009), there are inherent shortcomings in reducing plant quality to a single variable (e.g., total protein or nitrogen). Second, characterizing plant quality is not straightforward because the multiple nutrients that insect herbivores require come packaged in different forms. For example, some nutrients exist as biomole- cules, including amino acids (either free, or in protein), digestible carbohydrates (e.g., simple sugars and starch), fatty acids, sterols, vitamins (both fat- and water- soluble), lipogenic compounds (e.g., myo-inositol and choline), absorbic acid, and nucleic acids (Chapman 1998). Nutrients can also exist as free ions (e.g., PO 4 3 , Na þ ,K þ , Ca 2 þ , Mg 2 þ , Cl , Fe 2 þ , Zn 2 þ , and Mn 2 þ ), and are sometimes found in more complex organic struc- tures, including enzymes and coenzymes. The diversity of nutrient forms means that document- ing and quantifying variation in plant quality can be an Manuscript received 26 June 2011; revised 10 November 2011; accepted 17 November 2011. Corresponding Editor: S. J. Simpson. 4 E-mail: [email protected]1002
Transcript
Ecology, 93(5), 2012, pp. 1002–1015� 2012 by the Ecological Society of America
Not just the usual suspects: Insect herbivore populations andcommunities are associated with multiple plant nutrients
ANTHONY JOERN,1,4 TONY PROVIN,2 AND SPENCER T. BEHMER3
1Division of Biology, Kansas State University, Manhattan, Kansas 66506 USA2Department of Soil and Crop Sciences, Texas A&M University, College Station, Texas 77843 USA
3Department of Entomology, Texas A&M University, College Station, Texas 77843 USA
Abstract. The relationship between plant nutrient content and insect herbivorepopulations and community structure has long interested ecologists. Insect herbivores requiremultiple nutrients, but ecologists have focused mostly on nitrogen (an estimate of plantprotein content), and more recently phosphorus (P); other nutrients have received littleattention. Here we document nutrient variation in grass and forb samples from grasslandhabitats in central Nebraska using an elemental approach; in total we measured foliarconcentrations of 12 elements (N and P, plus S, B, Ca, Mg, Na, K, Zn, Fe, Mn, and Cu). Wedetected significant variability among sites for N, P, Mg, Na, K, and Cu. We next used amodel selection approach to explore how this nutritional variation and plant biomass correlatewith grasshopper densities (collectively and at the feeding-guild level), and principalcomponent analysis to explore nutrient correlations with grasshopper community speciescomposition. When all grasshoppers were pooled, densities varied among sites, but only P wasassociated with abundance of the elements shown to vary between sites. Different responsesoccurred at the feeding-guild level. For grass specialists, densities were associated with N, plusP, Mg, and Na. For forb specialists, N and P were often associated with density, butassociations with Na and K were also observed. Finally, mixed-feeder abundance was stronglyassociated with biomass, and to a lesser extent P, Mg, Na, and Cu. At the community level, B,Ca, Zn, and Cu, plus biomass, explained .30% of species composition variation. Our resultsconfirm the positive association of N and P with insect herbivore populations, while suggestinga potential role for Mg, Na, and K. They also demonstrate the importance of exploring effectsat the feeding-guild level. We hope our data motivate ecologists to think beyond N and P whenconsidering plant nutrient effects on insect herbivores, and make a call for studies to examinefunctional responses of insect herbivores to dietary manipulation of Mg, Na, and K. Finally,our results demonstrate correlations between variation in nutrients and species assemblages,but factors not linked to plant nutrient quality or biomass likely explain most of the observedvariation.
arduous task, and is not generally tractable in field
studies. A methodologically more straightforward ap-
proach is to characterize plant quality at an elemental
level. Carbon (C), nitrogen (N), and phosphorus (P)
have been the most frequently examined elements
because of their importance in major classes of
biological molecules (e.g., protein [C, N], carbohydrates
[C], lipids [C], nucleic acids [C, N, P], and energetic
nucleotides [C, N, P]), and because of their critical
structural roles and relatively high concentrations in
organisms (Sterner and Elser 2002). However, insect
herbivores require multiple nutrients, many of which
contain elements other than C, N, or P. For instance, we
currently know little about how other nutrient-linked
elements might be associated with insect herbivore
population- and community-level processes, particularly
elements that occur in plants as free ions, and which
serve important physiological and maintenance func-
tions (e.g., Na, K, Ca, Mg), or structural purposes (e.g.,
Fe, Zn, Mn; Cribb et al. 2008).
However, because insect herbivores use nutrients in
various forms, it is reasonable to question the value of
characterizing plant quality using an elemental ap-
proach. The usefulness of elements as surrogates for
nutrients depends on the extent to which a particular
element is correlated with key nutrient biomolecules or
ions. Take, for example, the relationship between
nitrogen and plant protein content. Plant proteins,
especially RuBisCo, are easily the greatest source of N
in plants (Feller et al. 2008). But because the average N-
content of the 20 amino acids found in proteins is
consistently ;17% (Sterner and Elser 2002), plant N-
content shows a strong relationship with plant protein
content (values of plant total protein and N-content
generally range from 5% to 30% and 0.5% to 5%,
respectively, depending on the plant species, its age, and
its growing conditions (Schoonhoven et al. 2005)).
What about phosphorus? After uptake by plants
(mainly as H2PO4�), two things can happen to P
(Marschner 1995): (1) it can remain as inorganic
phosphate (Pi ), or (2) it is can be esterified to a carbon
chain as a simple phosphate ester (e.g., sugar phos-
phate), or attached to another phosphate (e.g., ADP or
ATP). When soil phosphorus supply is sufficient, nucleic
acids (DNA, mRNA, tRNA, rRNA) are the major P-
containing fraction, averaging ;34% of the total P
content (Kakie 1969); the remaining P-containing
fractions include lipids (;21%), esters (;23%), and
inorganic phosphorus (;21%). Each of these forms of P
is available to insect herbivores (Woods et al. 2002,
Perkins et al. 2004), so elemental P levels in plants
correlate with P that can be used by insect herbivores.
Interestingly, when soil P levels increase above suffi-
ciency, inorganic P levels increase (stored in the
vacuoles), but the amounts of the other P-containing
fractions remain constant (Kakie 1969). With the
important exception of carbon (C), which is found in
all macromolecules and is particularly high in structural
compounds (e.g., cellulose, lignin) that insect herbivores
cannot digest (Chapman 1998), there is a strongcorrelation between plant elemental levels (e.g., S, Ca,
Na, K, to name a few) and the availability of nutrients inthis form to insect herbivores (Marschner 1995). Hence,
an elemental analysis is not useful for assessingdigestible carbohydrates and lipids, both of which arekey components of food nutritional quality.
In the current study we use an elemental approach tobroadly document natural variation in aspects of plant
quality; in total we measure 12 elements (N and P, plusS, B, Ca, Mg, Na, K, Zn, Fe, Mn, and Cu). We then use
a model selection approach to identify correlationsbetween variation in plant foliar elements and insect
herbivore abundance, and principal component analysesto examine how variation in plant foliar elements can
inform community species composition. We targetgrasshoppers for study for three reasons. First, they
are ubiquitous insect herbivores in grasslands world-wide, with representatives from three feeding guilds in
most habitats: grass-feeders, forb-feeders, and mixed-feeders (Joern 1979, Chapman and Sword 1997).
Second, grasshopper population densities fluctuategreatly in time or space, and communities vary in
species composition at both local and regional scales(Joern and Gaines 1990, Lockwood 1997, Jonas andJoern 2007). Third, grasshopper densities or species
compositions on a local scale are distributed spatially ina way that may reflect spatial heterogeneity in food
quality (Heidorn and Joern 1987, White 1993, Haddadet al. 2001, Loaiza et al. 2011). We ask three primary
questions: (1) How variable are plant foliar elementalconcentrations between grasses and forbs, and between
sites? (2) Can variation in foliar element concentrationsbe linked with the spatial heterogeneity of grasshopper
densities at both the taxonomic and feeding guild level,and if so, which elements are most informative? (3) Can
variation in plant foliar levels be linked to speciescomposition of grasshopper communities? Our work is
comparative without accompanying experimental vali-dation of outcomes, but the scope of comparisons is
broad, and highly informative. We also identify a suiteof elements whose functional/physiological effects oninsect herbivores warrant further investigation.
METHODS
Site descriptions, grasshopper and vegetation sampling
Grasshopper abundance and community composi-tion, plant vegetative biomass, and elemental composi-
tion from 17 well-dispersed sites from three grasslandhabitats in western Nebraska, USA (Keith and Arthur
counties) were sampled over a five-day period in August2005 (a period which corresponded with peak emergence
of adult grasshoppers). The three grassland habitatsincluded: (1) sandhills grassland (nine sites in total; fourfrom Arapaho Prairie in Arthur County (abbreviated as
AP), plus five additional sites in Arthur County(abbreviated as Arthur), (2) mixed-grass prairie on
May 2012 1003PLANT NUTRIENTS AND INSECT HERBIVORES
low-lying sandy soils (five sites; collected in Keith
County, at Cedar Point Biological Station and abbrevi-
ated as CPBS), and (3) disturbed areas composed of
loamy soils with past heavy grazing and vegetation
characterized as ‘‘weedy’’ (three sites; collected in Arthur
county, near CPBS; these sites are abbreviated as Dist).
Each of the four site abbreviations is used in Figs. 1, 2,
4, and 5. The maximum distance between any two sites
was ;50 km and the closest ;0.6 km. Sites differ in soil
composition, landscape position, historical land use, and
current grazing levels among the three habitats (sand-
hills, mixed grassland, and disturbed sites). Soils in this
study ranged from sites with moderate to strongly
sloping well-drained Valentine fine sand to those
dominated by Bayard fine sandy loams or Keith loams
on gently to moderate slopes (NRCS soil maps).
Grazing intensity also varied and likely influenced
grasshopper abundance, leaf area index, and plant–soil
interactions (O’Neill et al. 2003).
Grasshopper densities and community species com-
positions were quantified using the standardized ring
count method (Onsager 1977, Joern 2005) and sweep
sampling (Evans et al. 1983). These methods accurately
assess density and species composition, respectively, in
grassland habitats characteristic of the study area. At
each site, four ;100 m long transects spaced at least 10
m apart were sampled. Twenty 0.1-m2 area rings were
placed randomly along each transect with a minimum
distance of at least 2 m between each ring. This distance
was sufficient to limit interference with the next
uncounted ring during the actual sampling process.
After several hours to allow natural redistribution of
grasshoppers, transects were walked slowly and individ-
uals located in each ring were counted.
Relative abundances of grasshoppers were estimated
using sweep sampling. Systematic sweeping using nets
(32 cm diameter) was conducted until 200 sweeps were
completed. Nets were emptied after every 25 sweeps; the
entire sample was bulked to estimate relative abundanc-
es of species for each site. This technique provides
reliable estimates of relative abundance of grasshoppers
in grassland habitats (Evans et al. 1983). Species
densities at each site were determined by multiplying
relative abundances of individual species by the overall
grasshopper density. Relative abundances of grasshop-
per species for sampled localities are shown in Appen-
dices A and B. Vegetation biomass was estimated by
averaging clipped vegetation at 1 cm above ground level
for 10 0.1-m2 plots located randomly along each of the
four transects at each site. Vegetation was sorted to
grass and forb, dried for 36 h at 558C, and weighed to
estimate total biomass (g/m2) at each site. Only grass
biomass was included in analyses of grass-feeding
grasshopper responses and only forb biomass was
included in models for forb-feeding grasshoppers. Total
plant biomass was used for analyses including mixed-
feeding grasshoppers and all taxa combined. Plant tissue
was then prepared for elemental analysis, including N,
P, S, B, Ca, Mg, Na, K, Zn, Fe, Mn, and Cu, as detailed
in Appendix C.
Statistical analyses
First we examined how foliar elemental content varied
between plant type (forb and grass) and among 17
unique sites, from three different grassland habitats
(sandhills grassland, mixed-grass prairie, and disturbed
areas). We evaluated responses using MANOVA tech-
niques (JMP version 7.0.2; SAS Institute, Cary, North
Carolina, USA) because elemental levels in plant
vegetative tissues are not independent of one another.
Where significant differences were observed with respect
to site, contrasts were employed to compare elemental
profiles across the three sites (sandhills vs. mixed-grass,
sandhills vs. disturbed, and mixed-grass vs. disturbed).
For each element we also performed univariate analyses
at the site level (using Bonferroni adjustments to avoid
Type I errors). Finally, we compared the absolute
concentration of each element in forbs and grasses by
calculating a forb : grass element ratio for each element
at each site. This ratio was analyzed using a t test with a
hypothesized mean of 1 (a value indicating absolute
elemental amounts were equal in paired forb and grass
comparisons).
We next employed a model selection approach
following Akaike’s Information Criterion (DAICc)
corrected for small sample sizes to explore links between
foliar concentrations of elements with the spatial
heterogeneity of grasshopper density among sites. This
approach is particularly well suited for making infer-
ences on observational data collected from complex
systems (Burnham and Anderson 2002, Johnson and
Omland 2004). In total, 36 candidate models (Appendix
D) were generated using combinations of elements for
which biological reasons predicted performance effects,
and fit to the data using linear regression (PROC
GENMOD; SAS version 9.1, SAS Institute, Cary,
North Carolina, USA). Calculated AICc weights (wi )
were used to assess the fit of each model (model wi values
range between 0 and 1; higher wi values indicate a better
fit of data to a given model). Evidence ratio (ER) values,
which represent the likelihood that the best model (bm)
is true compared to model i were also calculated (ER¼wbm/wi for all i models where the best model is the model
with the highest wi ).
Finally, species composition of the grasshopper
communities and its relationship to foliar elemental
levels and plant biomass was examined using two
approaches. First, hierarchical clustering of sites based
on grasshopper species composition was performed to
determine if sites from the same habitat type and
location were most similar. Second, grasshopper com-
munities (relative abundances) were ordinated (32
species at 16 sites) by principal components analysis
(PCA) using variance/covariance matrices for grasshop-
per species among sites. Ordination scores were calcu-
lated using distance-based biplot methods, while site-
ANTHONY JOERN ET AL.1004 Ecology, Vol. 93, No. 5
based ordinations were plotted with the contribution of
environmental variables from plant elemental composi-
tion and average plant biomass. Both of the above
analyses were performed using PCORD (version 5)
(McCune and Mefford 1999, McCune and Grace 2002).
RESULTS
Foliar concentrations of elements
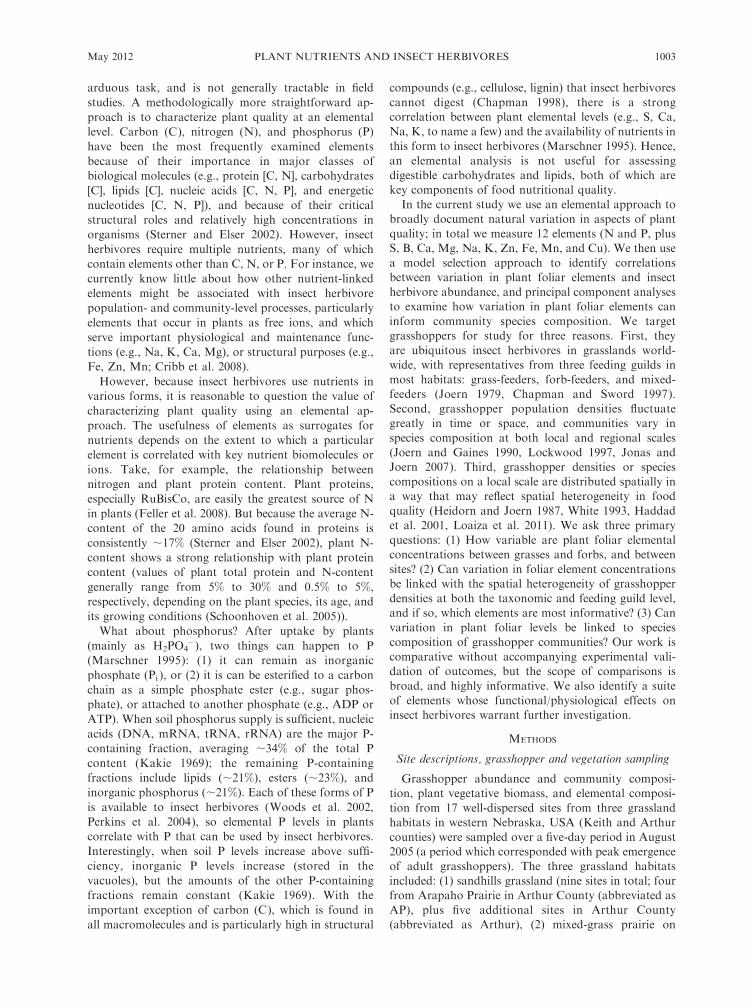
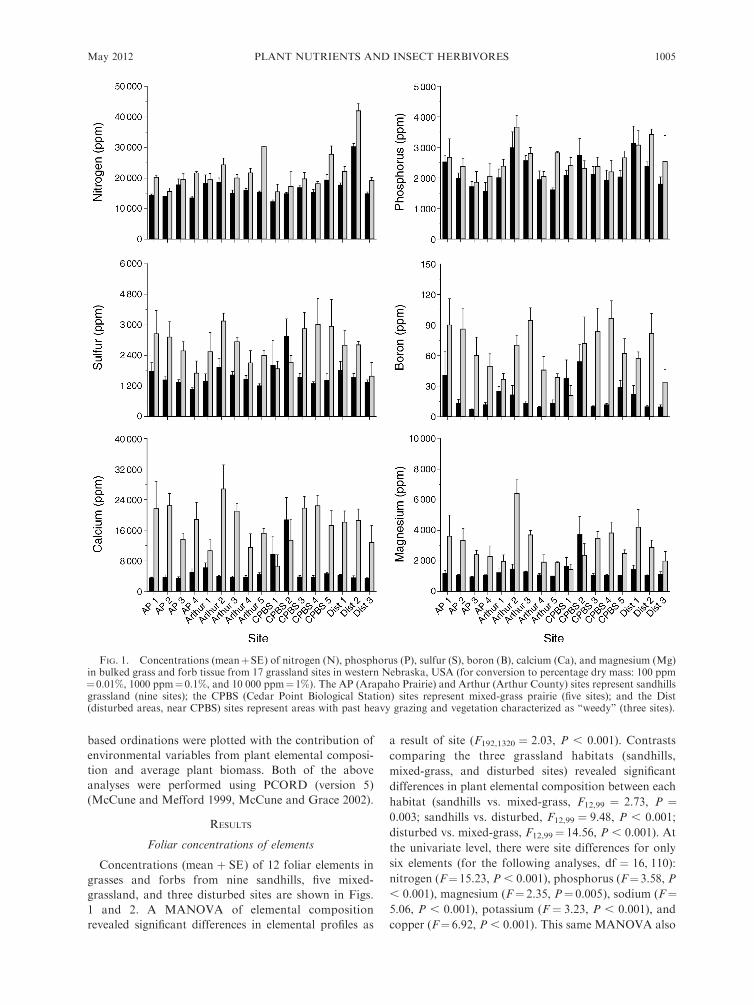
Concentrations (mean þ SE) of 12 foliar elements in
grasses and forbs from nine sandhills, five mixed-
grassland, and three disturbed sites are shown in Figs.
1 and 2. A MANOVA of elemental composition
revealed significant differences in elemental profiles as
a result of site (F192,1320 ¼ 2.03, P , 0.001). Contrasts
comparing the three grassland habitats (sandhills,
mixed-grass, and disturbed sites) revealed significant
differences in plant elemental composition between each
habitat (sandhills vs. mixed-grass, F12,99 ¼ 2.73, P ¼0.003; sandhills vs. disturbed, F12,99 ¼ 9.48, P , 0.001;
disturbed vs. mixed-grass, F12,99¼ 14.56, P , 0.001). At
the univariate level, there were site differences for only
six elements (for the following analyses, df ¼ 16, 110):
nitrogen (F¼15.23, P , 0.001), phosphorus (F¼3.58, P
, 0.001), magnesium (F¼ 2.35, P¼ 0.005), sodium (F¼5.06, P , 0.001), potassium (F ¼ 3.23, P , 0.001), and
copper (F¼ 6.92, P , 0.001). This same MANOVA also
FIG. 1. Concentrations (meanþSE) of nitrogen (N), phosphorus (P), sulfur (S), boron (B), calcium (Ca), and magnesium (Mg)in bulked grass and forb tissue from 17 grassland sites in western Nebraska, USA (for conversion to percentage dry mass: 100 ppm¼0.01%, 1000 ppm¼0.1%, and 10 000 ppm¼1%). The AP (Arapaho Prairie) and Arthur (Arthur County) sites represent sandhillsgrassland (nine sites); the CPBS (Cedar Point Biological Station) sites represent mixed-grass prairie (five sites); and the Dist(disturbed areas, near CPBS) sites represent areas with past heavy grazing and vegetation characterized as ‘‘weedy’’ (three sites).
May 2012 1005PLANT NUTRIENTS AND INSECT HERBIVORES
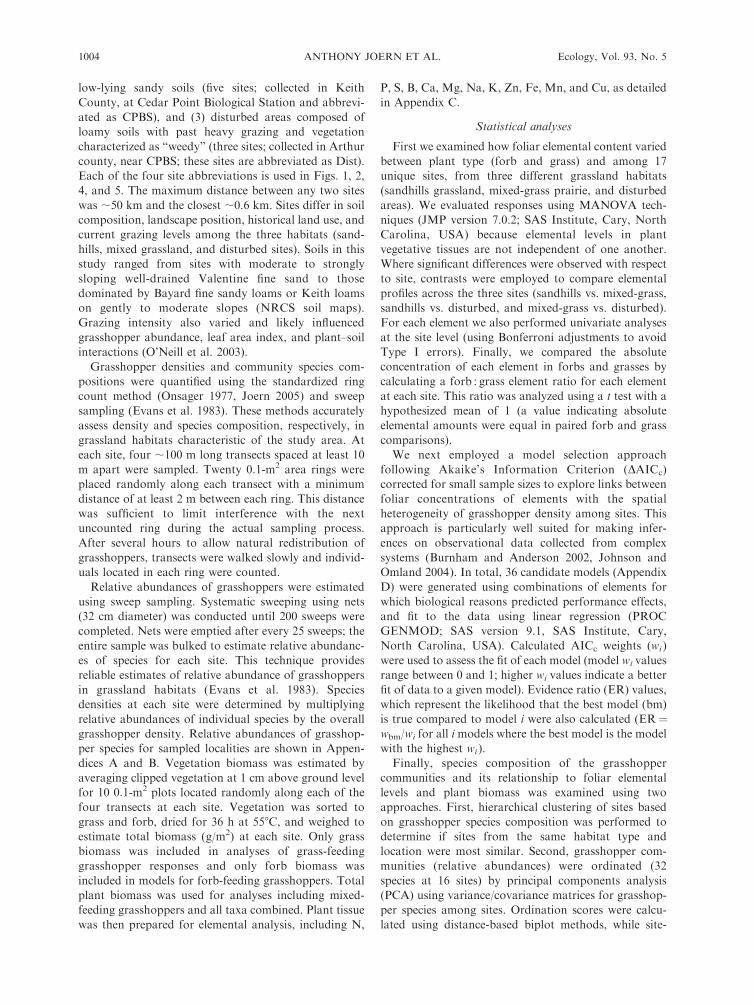
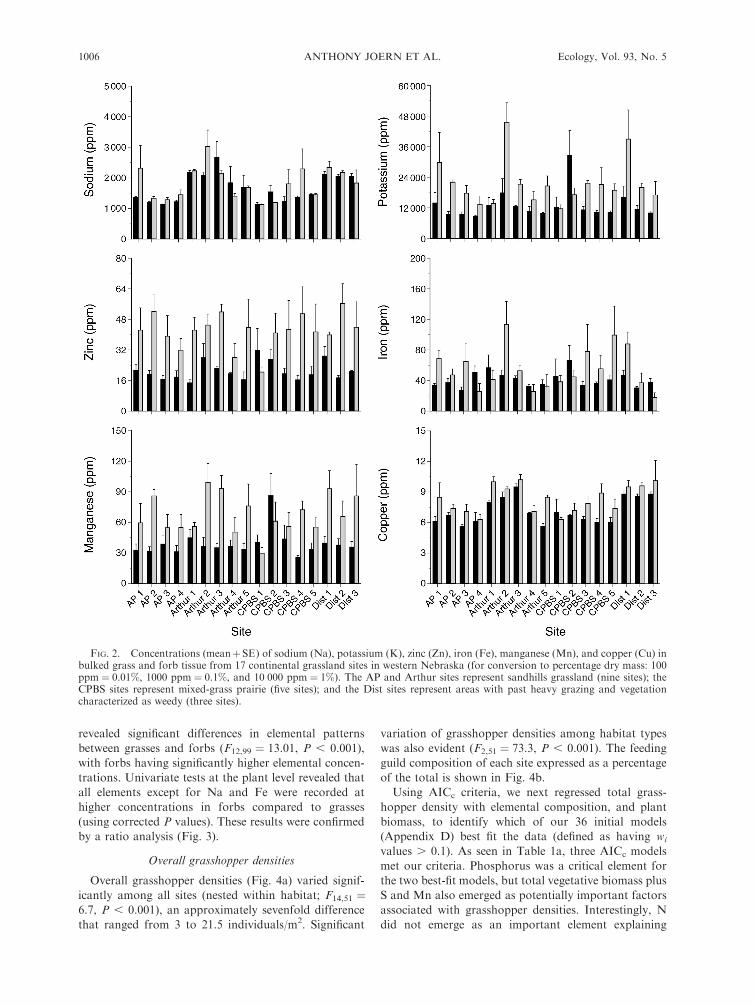
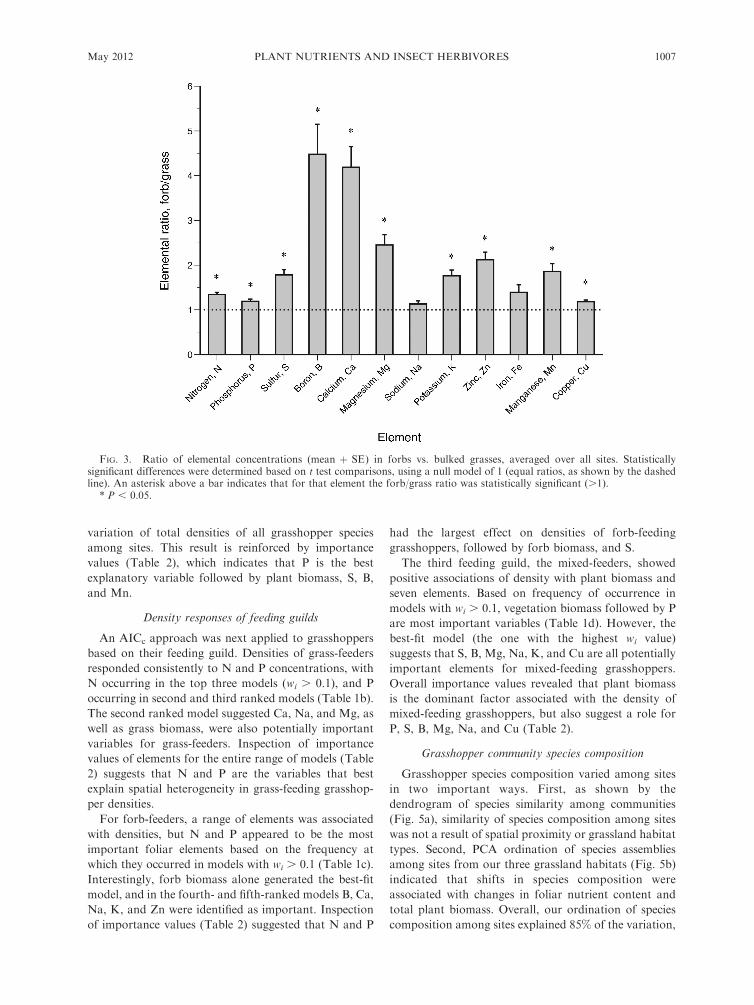
revealed significant differences in elemental patterns
between grasses and forbs (F12,99 ¼ 13.01, P , 0.001),
with forbs having significantly higher elemental concen-
trations. Univariate tests at the plant level revealed that
all elements except for Na and Fe were recorded at
higher concentrations in forbs compared to grasses
(using corrected P values). These results were confirmed
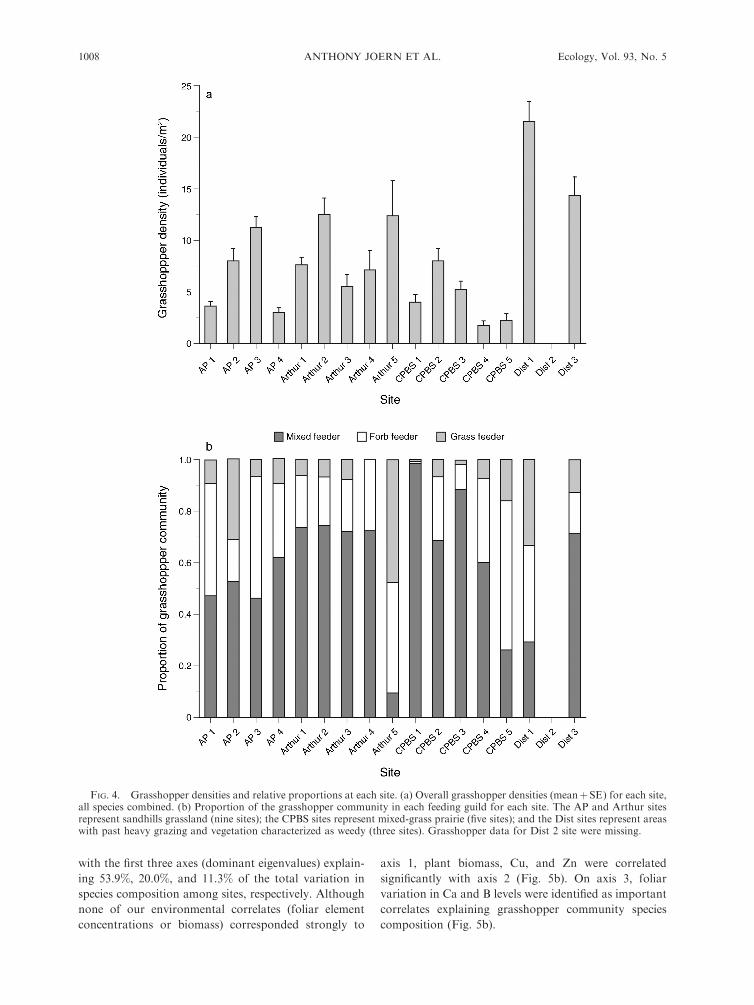
icantly among all sites (nested within habitat; F14,51 ¼6.7, P , 0.001), an approximately sevenfold difference
that ranged from 3 to 21.5 individuals/m2. Significant
variation of grasshopper densities among habitat types
was also evident (F2,51 ¼ 73.3, P , 0.001). The feeding
guild composition of each site expressed as a percentage
of the total is shown in Fig. 4b.
Using AICc criteria, we next regressed total grass-
hopper density with elemental composition, and plant
biomass, to identify which of our 36 initial models
(Appendix D) best fit the data (defined as having wi
values . 0.1). As seen in Table 1a, three AICc models
met our criteria. Phosphorus was a critical element for
the two best-fit models, but total vegetative biomass plus
S and Mn also emerged as potentially important factors
associated with grasshopper densities. Interestingly, N
did not emerge as an important element explaining
FIG. 2. Concentrations (meanþSE) of sodium (Na), potassium (K), zinc (Zn), iron (Fe), manganese (Mn), and copper (Cu) inbulked grass and forb tissue from 17 continental grassland sites in western Nebraska (for conversion to percentage dry mass: 100ppm ¼ 0.01%, 1000 ppm ¼ 0.1%, and 10 000 ppm ¼ 1%). The AP and Arthur sites represent sandhills grassland (nine sites); theCPBS sites represent mixed-grass prairie (five sites); and the Dist sites represent areas with past heavy grazing and vegetationcharacterized as weedy (three sites).
ANTHONY JOERN ET AL.1006 Ecology, Vol. 93, No. 5
variation of total densities of all grasshopper species
among sites. This result is reinforced by importance
values (Table 2), which indicates that P is the best
explanatory variable followed by plant biomass, S, B,
and Mn.
Density responses of feeding guilds
An AICc approach was next applied to grasshoppers
based on their feeding guild. Densities of grass-feeders
responded consistently to N and P concentrations, with
N occurring in the top three models (wi . 0.1), and P
occurring in second and third ranked models (Table 1b).
The second ranked model suggested Ca, Na, and Mg, as
well as grass biomass, were also potentially important
variables for grass-feeders. Inspection of importance
values of elements for the entire range of models (Table
2) suggests that N and P are the variables that best
explain spatial heterogeneity in grass-feeding grasshop-
per densities.
For forb-feeders, a range of elements was associated
with densities, but N and P appeared to be the most
important foliar elements based on the frequency at
which they occurred in models with wi . 0.1 (Table 1c).
Interestingly, forb biomass alone generated the best-fit
model, and in the fourth- and fifth-ranked models B, Ca,
Na, K, and Zn were identified as important. Inspection
of importance values (Table 2) suggested that N and P
had the largest effect on densities of forb-feeding
grasshoppers, followed by forb biomass, and S.
The third feeding guild, the mixed-feeders, showed
positive associations of density with plant biomass and
seven elements. Based on frequency of occurrence in
models with wi . 0.1, vegetation biomass followed by P
are most important variables (Table 1d). However, the
best-fit model (the one with the highest wi value)
suggests that S, B, Mg, Na, K, and Cu are all potentially
important elements for mixed-feeding grasshoppers.
Overall importance values revealed that plant biomass
is the dominant factor associated with the density of
mixed-feeding grasshoppers, but also suggest a role for
P, S, B, Mg, Na, and Cu (Table 2).
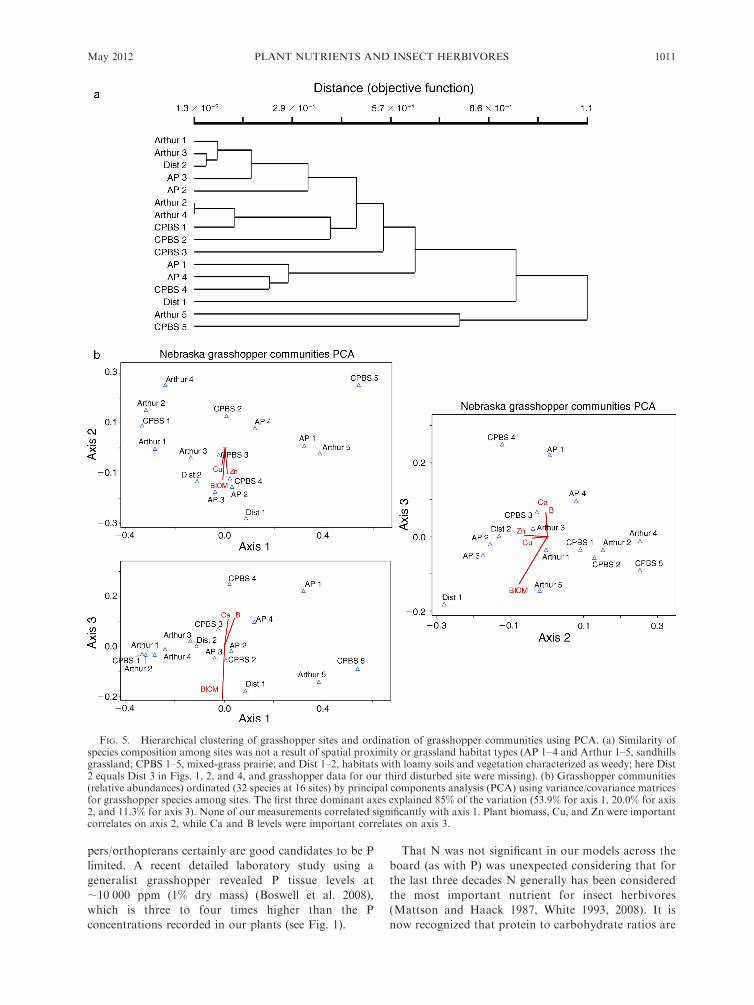
Grasshopper community species composition
Grasshopper species composition varied among sites
in two important ways. First, as shown by the
dendrogram of species similarity among communities
(Fig. 5a), similarity of species composition among sites
was not a result of spatial proximity or grassland habitat
types. Second, PCA ordination of species assemblies
among sites from our three grassland habitats (Fig. 5b)
indicated that shifts in species composition were
associated with changes in foliar nutrient content and
total plant biomass. Overall, our ordination of species
composition among sites explained 85% of the variation,
FIG. 3. Ratio of elemental concentrations (mean þ SE) in forbs vs. bulked grasses, averaged over all sites. Statisticallysignificant differences were determined based on t test comparisons, using a null model of 1 (equal ratios, as shown by the dashedline). An asterisk above a bar indicates that for that element the forb/grass ratio was statistically significant (.1).
* P , 0.05.
May 2012 1007PLANT NUTRIENTS AND INSECT HERBIVORES
with the first three axes (dominant eigenvalues) explain-
ing 53.9%, 20.0%, and 11.3% of the total variation in
species composition among sites, respectively. Although
none of our environmental correlates (foliar element
concentrations or biomass) corresponded strongly to
axis 1, plant biomass, Cu, and Zn were correlated
significantly with axis 2 (Fig. 5b). On axis 3, foliar
variation in Ca and B levels were identified as important
correlates explaining grasshopper community species
composition (Fig. 5b).
FIG. 4. Grasshopper densities and relative proportions at each site. (a) Overall grasshopper densities (meanþSE) for each site,all species combined. (b) Proportion of the grasshopper community in each feeding guild for each site. The AP and Arthur sitesrepresent sandhills grassland (nine sites); the CPBS sites represent mixed-grass prairie (five sites); and the Dist sites represent areaswith past heavy grazing and vegetation characterized as weedy (three sites). Grasshopper data for Dist 2 site were missing.
ANTHONY JOERN ET AL.1008 Ecology, Vol. 93, No. 5
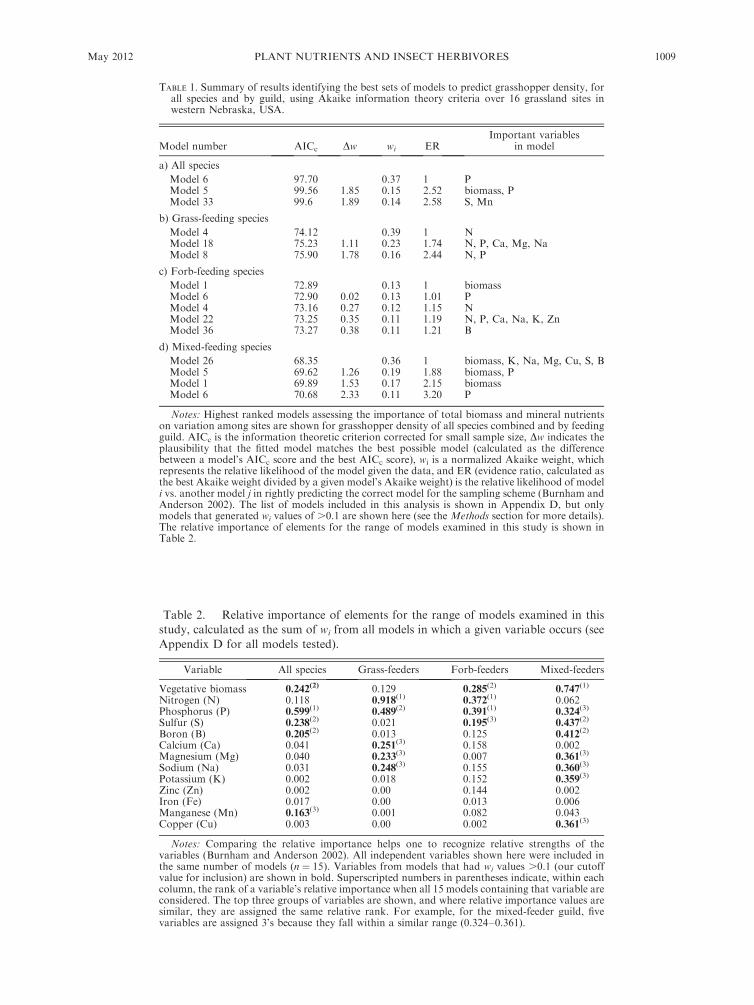
TABLE 1. Summary of results identifying the best sets of models to predict grasshopper density, forall species and by guild, using Akaike information theory criteria over 16 grassland sites inwestern Nebraska, USA.
Notes: Highest ranked models assessing the importance of total biomass and mineral nutrientson variation among sites are shown for grasshopper density of all species combined and by feedingguild. AICc is the information theoretic criterion corrected for small sample size, Dw indicates theplausibility that the fitted model matches the best possible model (calculated as the differencebetween a model’s AICc score and the best AICc score), wi is a normalized Akaike weight, whichrepresents the relative likelihood of the model given the data, and ER (evidence ratio, calculated asthe best Akaike weight divided by a given model’s Akaike weight) is the relative likelihood of modeli vs. another model j in rightly predicting the correct model for the sampling scheme (Burnham andAnderson 2002). The list of models included in this analysis is shown in Appendix D, but onlymodels that generated wi values of .0.1 are shown here (see the Methods section for more details).The relative importance of elements for the range of models examined in this study is shown inTable 2.
Table 2. Relative importance of elements for the range of models examined in thisstudy, calculated as the sum of wi from all models in which a given variable occurs (see
Appendix D for all models tested).
Variable All species Grass-feeders Forb-feeders Mixed-feeders
Notes: Comparing the relative importance helps one to recognize relative strengths of thevariables (Burnham and Anderson 2002). All independent variables shown here were included inthe same number of models (n ¼ 15). Variables from models that had wi values .0.1 (our cutoffvalue for inclusion) are shown in bold. Superscripted numbers in parentheses indicate, within eachcolumn, the rank of a variable’s relative importance when all 15 models containing that variable areconsidered. The top three groups of variables are shown, and where relative importance values aresimilar, they are assigned the same relative rank. For example, for the mixed-feeder guild, fivevariables are assigned 3’s because they fall within a similar range (0.324–0.361).
May 2012 1009PLANT NUTRIENTS AND INSECT HERBIVORES
DISCUSSION
The dynamics of insect herbivore populations andtheir community structure result from the combined
effects of multiple bottom-up and top-down processes,but the success of insect herbivores at the individual level
remains fundamentally tied to plant nutritional quality(Denno and McClure 1983, Rosenthal and Berenbaum
1992, White 1993). Laboratory studies provide detailedmechanistic and functional insights into how food
quality affects insect herbivores because they allowprecise manipulation and control of key dietary
nutrients and allelochemicals (Raubenheimer and Simp-son 1993, Trumper and Simpson 1993, Behmer and Elias
2000, Simpson and Raubenheimer 2001, Behmer et al.2002). But because ecologists are ultimately interested in
natural responses by insect herbivores, it is critical toinvestigate how insect herbivores respond to natural
variation in host plant nutritional quality (definedbeyond one or two variables). We readily acknowledgethe considerable contributions of laboratory feeding
studies to nutritional ecology, but our approach in thiscurrent study is to let natural variation point to key
relationships between plant quality and grasshopperresponses. In doing so, we have uncovered interesting
correlations between grasshopper abundances/speciescompositions and foliar elements, some which have
been rarely examined. Our results also suggest thatcertain understudied nutrients warrant further investi-
gation at a functional/mechanistic level.Before discussing our results, we make three impor-
tant caveats. First, although our efforts focus ondescribing grasshopper abundance and species commu-
nity composition with respect to plant nutritional(measured in terms of elements) and biomass traits, we
realize that insect herbivore distributions and abun-dances can also interact and covary with a range of
nonnutritional factors, including: vegetation structureand plant species composition (Haddad et al. 2001,
Joern 2004), resource complementation (Beckerman2002), behavioral limits affecting local dispersal (Withand Crist 1995, Haynes and Cronin 2006), predation
risk (Schmitz et al. 1997, Cronin et al. 2004, Danner andJoern 2004, Schmitz 2009, Hawlena and Schmitz 2010),
and larger-scale landscape features than that studiedhere (Haynes et al. 2007). Second, we acknowledge that
what is measured in plants, and what is available toinsect herbivores, are not necessarily equal. For exam-
ple, cell wall morphology (C3 vs. C4) and leaf age (newvs. old) can affect nutrient extraction efficiency (Clissold
et al. 2006, 2009). By bulking plant samples (grasssamples represent multiple species as do forb samples),
and only sampling green plant tissue, we hope that suchplant-specific effects will have been subsumed. Third, we
did not assess carbon (C) in our analyses. Although C isthe most abundant element in plants, and is often usedas a proxy for available energy, plant total-C is not
particularly informative. Carbon is contained in allmajor biomolecules, but its content in these biomole-
cules is highly variable; the average C content of
carbohydrates, proteins, and lipids is ;37%, ;53%,
and ;70%, respectively (Sterner and Elser 2002). This
means that identifying the plant source of C and its
functional role (e.g., energy vs. structural) is crucial. It is
also the case that a large fraction of plant carbohydrate-
C is contained within cellulose and lignin (Marschner
1995), which is not digestible by most insect herbivores
(Chapman 1998). Thus, attempts to treat C as a nutrient
for insect herbivores and/or to use it as a surrogate for
available energy are highly problematic, and should be
avoided (Anderson et al. 2004, Raubenheimer et al.
2009).
It is now well established that foliar elemental
composition of plants can be highly variable in response
to local environmental conditions (Clarkson 1985,
Chapin et al. 1987, Chapin 1991, Aerts and Chapin
2000). We also found significant variation in patterns of
foliar elements among habitats and individual sites, but
our univariate analysis of individual elements showed
that significant variation across sites occurred for only
six of our 12 foliar elements: N, P, Mg, Na, K, and Cu.
Of these, N, P, Mg, and K are categorized as plant
macronutrients, while Na and Cu are considered
micronutrients (Mills and Jones 1996). On average,
forbs contained higher concentrations of mineral ele-
ments (except Na and Fe) compared to grasses, and
these differences were sometimes large (B, Ca, Mg, and
Zn). Such differences in foliar elemental concentrations
between dicots and monocots have been long known
(Marschner 1995), and this suggests that forbs relative
to grasses have greater absolute nutritional value.
Having documented the extent of natural variation in
foliar elements, our next goal was to evaluate how this
variation might inform spatial variability in grasshopper
abundances, both at the broad family taxonomic level
(Acrididae), and the feeding-guild level (grass-, forb-,
and mixed-feeder). The two foliar elements consistently
viewed as being important for insect herbivores are N
(Heidorn and Joern 1987, Haddad et al. 2000, Apple et
al. 2009, Bishop et al. 2010, Loaiza et al. 2011) and P
(Schade et al. 2003, Kay et al. 2004, Apple et al. 2009,
Bishop et al. 2010), but only P was significantly
correlated with total grasshopper abundance across the
four grouping levels. Apple et al. (2009) found that
naturally occurring foliar P levels were positively
correlated with caterpillar survival and growth rate at
an early primary succession terrestrial habitat. At this
same site, Bishop et al. (2010) also documented that P
[Tettigoniidae]). Our results are consistent with the
notion that P might constrain insect herbivore popula-
tions in terrestrial ecosystems. An alternative possibility
is that plants with higher P levels may have higher
photosynthetic rates, and thus provide greater energetic
value. However, P in and of itself can limit insect
herbivore growth (Perkins et al. 2004), and grasshop-
ANTHONY JOERN ET AL.1010 Ecology, Vol. 93, No. 5
pers/orthopterans certainly are good candidates to be P
limited. A recent detailed laboratory study using a
generalist grasshopper revealed P tissue levels at
;10 000 ppm (1% dry mass) (Boswell et al. 2008),
which is three to four times higher than the P
concentrations recorded in our plants (see Fig. 1).
That N was not significant in our models across the
board (as with P) was unexpected considering that for
the last three decades N generally has been considered
the most important nutrient for insect herbivores
(Mattson and Haack 1987, White 1993, 2008). It is
now recognized that protein to carbohydrate ratios are
FIG. 5. Hierarchical clustering of grasshopper sites and ordination of grasshopper communities using PCA. (a) Similarity ofspecies composition among sites was not a result of spatial proximity or grassland habitat types (AP 1–4 and Arthur 1–5, sandhillsgrassland; CPBS 1–5, mixed-grass prairie; and Dist 1–2, habitats with loamy soils and vegetation characterized as weedy; here Dist2 equals Dist 3 in Figs. 1, 2, and 4, and grasshopper data for our third disturbed site were missing). (b) Grasshopper communities(relative abundances) ordinated (32 species at 16 sites) by principal components analysis (PCA) using variance/covariance matricesfor grasshopper species among sites. The first three dominant axes explained 85% of the variation (53.9% for axis 1, 20.0% for axis2, and 11.3% for axis 3). None of our measurements correlated significantly with axis 1. Plant biomass, Cu, and Zn were importantcorrelates on axis 2, while Ca and B levels were important correlates on axis 3.
May 2012 1011PLANT NUTRIENTS AND INSECT HERBIVORES
more important than protein alone (Raubenheimer and
Simpson 1993, Raubenheimer et al. 2009), and that
insect herbivores can balance diets to meet multidi-
mensional nutritional demands. Moreover, this makes
it difficult to generalize results from elemental concen-
trations without additional experimental tests because
of problems in inferring carbohydrate concentrations
from C alone as discussed previously. Interestingly, N
was strongly associated with the abundance of both
grass-feeding grasshoppers, which were the dominant
feeding guild at most of our sites (often comprising 50–
70% of the total), and forb-feeding grasshoppers
(occurring in two out of five significant models, and
having a high relative evidence ratio [ER] score). In
contrast, N was not correlated with abundance of
mixed-feeders, which regularly consume significant
quantities of both grasses and forbs (Joern 1985).
Perhaps this suggests that plant N levels are most
informative with respect to population abundance of
specialist insect herbivores on only grasses or forbs.
For generalist insect herbivores, foliar-N levels may be
less useful because eating a broad diet may allow them
to reach their preferred N (protein) intake by switching
back and forth between high-N (forbs) and low-N
(grasses) plants (Jonas and Joern 2008).
We also documented variability in grasshopper
abundances to variable foliar concentrations of Mg,
Na, K, and Cu levels. How might these additional
elements affect insect herbivores? Like N, Mg is used
for structural purposes, Na and K are involved in
electrochemical function, including message transmis-
sion in nerves, cellular signaling, and energy metabo-
lism, and Cu is used in catalytic roles (Frausto da Silva
and Williams 1991). With the exception of K, these
elements are found at low concentrations in plants and
insect herbivores (Boswell et al. 2008). However, low
concentration does not mean these nutrients cannot
influence ecological processes. For example, the nutri-
tional value of Na is well illustrated by puddling
behavior in insects (Smedley and Eisner 1995, Molle-
man 2010), its influence on host plant selection in
moose (Belovsky and Jordan 1981), its effect on
marching in Mormon crickets (Simpson et al. 2006),
ant recruitment to baits (Kaspari and Yanoviak 2009,
Kaspari et al. 2009), and other invertebrate responses
in tropical brown food webs (Kaspari and Yanoviak
2009). In our study, Na was the only element (other
than P) identified in at least one model for each of our
three feeding guilds. Very little is known about how
variation in foliar Mg and K might affect insect
herbivores, but these two elements were each included
twice in significant models (see Table 1). Interestingly,
some elements that did not show great variation in
plants were nonetheless included as significant elements
in models. These included S, Ca, and B (each found in
two significant models), plus Mn and Zn (each in one
significant model). Each of these elements is found at
significantly higher concentrations in forbs relative to
grasses, especially Ca and B (Fig. 3), so perhaps they
are important nutrients for insect herbivores that
include forbs in their diet breadth.
Vegetative biomass varied positively with grasshopper
abundance with the single exception of grass-feeders. It
was also a particularly important variable explaining
spatial variation for mixed-feeding grasshoppers, ap-
pearing as an important variable in the top three models
and exhibiting a high relative importance value (0.75).
Although more biomass may indicate more food, an
alternative or complementary explanation is that in-
creased biomass leads to increased structure in the
habitat, which affects the ability to hide from predators
and increase the range of thermal conditions available to
insect herbivores within vegetation (Pitt 1999).
As revealed by two separate analyses, spatial variation
in foliar elements might also be correlated with variation
in taxonomic composition of grasshopper assemblages
among sites. First, our hierarchical analysis suggests
that community structure is not readily explained by
habitat type, or the proximity of sites to one another.
Second, our ordination of species abundances explained
a large proportion of the variation (85%) in grasshopper
assemblages, and 37% of this variation was explained by
five of our measured variables (biomass, B, Ca, Zn, and
Cu). We were surprised that N and P were not identified
as important factors with respect to community
structure given their notoriety in the nutritional ecology
of insect herbivores, and their frequent occurrence as
significant factors explaining grasshopper abundance in
our model selection analyses. That N in particular was
not significant is interesting given its link (via protein) to
niche differentiation in protein : carbohydrate nutrient
space that has been documented for forb and mixed
feeding grasshoppers from this same grassland area
(Behmer and Joern 2008). Interpreting the biological
significance of these explanatory factors at the commu-
nity level can be challenging, but an inspection of our
earlier analyses suggests that much of the explanatory
power is linked to grasshoppers that include forbs in
their diets. For instance, each of the elements identified
as significant in our ordination analysis are significantly
higher (absolute levels) in forbs compared to grasses
(especially B and Ca). Additionally, the elements
identified as being important at the community level
are identified as important variables in models associ-
ated with either forb-feeding or mixed-feeding grass-
hopper abundance.
Where do we go from here? Moe et al. (2005) argued
for the explicit inclusion of elemental constraints in
models and empirical studies in order to enhance our
ability to explain how populations and communities
operate, especially for terrestrial insects. We concur,
but with a slight modification—models and empirical
studies should focus on nutritional, rather than
elemental constraints. Our study demonstrates the
utility of this approach, although it seems better suited
for questions concerning abundance, rather than
ANTHONY JOERN ET AL.1012 Ecology, Vol. 93, No. 5
community structure. Moe et al. (2005) also cautioned
against painting with too broad a brush at the
taxonomic level. In our case unique insights were
obtained by paying attention to important biological
criteria, namely host plant type (grasses vs. forbs) and
feeders); we particularly urge nutritional ecologists to
be mindful of feeding guild differences when exploring
their data. Finally, while our results confirm the general
strong correlation effects of N and P with insect
herbivores, they also highlight the need to think beyond
N and P. In particular, we encourage nutritional
ecologists and research broadly interested in insect–
plant interactions to investigate the nutritional roles of
Na, Mg, and K for insect herbivores, given that these
nutrients vary in plants, and are correlated with
grasshopper population abundance.
ACKNOWLEDGMENTS
We thank members of the Joern Lab (A. Kula, J. Hill, A.Laws, and S. Parsons), the Provin Lab (J. Waskom), and theBehmer Lab (S. C. Cook, M. Le Gall, T. Gates, P. Lenhart, K.Roeder, and X. Jing) for help in processing samples, and forfeedback on earlier versions of the manuscript. We also thankDavid Raubenheimer and one anonymous reviewer for specificsuggestions that greatly improved the manuscript. Cedar PointBiological Station (University of Nebraska–Lincoln) providedlogistical support of fieldwork. We especially thank J. Jonas forassistance and advice on statistics. This research was supportedby an NSF grant (DEB-0456522) awarded to A. Joern and S. T.Behmer and is a contribution of the Kansas AgriculturalExperiment Station.
LITERATURE CITED
Aerts, R., and F. S. Chapin. 2000. The mineral nutrition of wildplants revisited: a re-evaluation of processes and patterns.Advances in Ecological Research 30:1–67.
Anderson, T. R., M. Boersma, and D. Raubenheimer. 2004.Stoichiometry: linking elements to biochemicals. Ecology85:1193–1202.
Apple, J. L., M. Wink, S. E. Wills, and J. G. Bishop. 2009.Successional change in phosphorus stoichiometry explainsthe inverse relationship between herbivory and lupin densityon Mount St. Helens. PLoS ONE 4:e7807.
Barbosa, P., and J. C. Schultz, editors. 1987. Insect outbreaks.Academic Press, New York, New York, USA.
Beckerman, A. P. 2002. The distribution of Melanoplusfemurrubrum: fear and freezing in Connecticut. Oikos99:131–140.
Behmer, S. T. 2009. Insect herbivore nutrient regulation.Annual Review of Entomology 54:165–187.
Behmer, S. T., and D. O. Elias. 2000. Sterol metabolicconstraints as a factor contributing to the maintenance ofdiet mixing in grasshoppers (Orthoptera: Acrididae). Phys-iological and Biochemical Zoology 73:219–230.
Behmer, S. T., and A. Joern. 2008. Coexisting generalistherbivores occupy unique nutritional feeding niches. Pro-ceedings of the National Academy of Sciences USA105:1977–1982.
Behmer, S. T., S. J. Simpson, and D. Raubenheimer. 2002.Herbivore foraging in chemically heterogeneous environ-ments: nutrients and secondary metabolites. Ecology83:2489–2501.
Belovsky, G. E., and P. A. Jordan. 1981. Sodium dynamics andadaptations of a moose population. Journal of Mammalogy62:613–621.
Bishop, J. G., N. B. O’Hara, J. H. Titus, J. L. Apple, R. A. Gill,and L. Wynn. 2010. N-P co-limitation of primary productionand response of arthropods to N and P in early primarysuccession on Mount St. Helens volcano. PLoS ONE5:e13598.
Boswell, A. W., T. Provin, and S. T. Behmer. 2008. Therelationship between body mass and elemental compositionin nymphs of the grasshopper Schistocerca americana.Journal of Orthoptera Research 17:307–313.
Burnham, K. P., and D. R. Anderson. 2002. Model selectionand multimodel inference: a practical information-theoreticalapproach. Springer-Verlag, New York, New York, USA.
Cappuccino, N., and P. W. Price, editors. 1995. Populationdynamics: new approaches and syntheses. Academic Press,San Diego, California, USA.
Chapin, F. S. 1991. Integrated responses of plants to stress.BioScience 41:29–36.
Chapin, F. S., A. J. Bloom, C. B. Field, and R. H. Waring.1987. Plant responses to multiple environmental factors.BioScience 37:49–57.
Chapman, R. F. 1998. The insects: structure and function.Cambridge University Press, Cambridge, UK.
Chapman, R. F., and G. A. Sword. 1997. Polyphagy in theAcridomorpha. Pages 183–195 in S. K. Gangwere, M. C.Muralirangan, and M. Muralirangan, editors. Bionomics ofgrasshoppers, katydids and their kin. CABI, Wallingford,UK.
Clarkson, D. T. 1985. Factors affecting mineral nutrientacquisition by plants. Annual Review of Plant Physiologyand Plant Molecular Biology 36:77–115.
Clissold, F. J., G. D. Sanson, and J. Read. 2006. Theparadoxical effects of nutrient ratios and supply rates on anoutbreaking insect herbivore, the Australian plague locust.Journal of Animal Ecology 75:1000–1013.
Clissold, F. J., G. D. Sanson, J. Read, and S. J. Simpson. 2009.Gross vs. net income: How plant toughness affects perfor-mance of an insect herbivore. Ecology 90:3393–3405.
Cribb, B. W., A. J. A. Stewart, H. Huang, R. Truss, B. Noller,R. Rasch, and M. P. Zalucki. 2008. Insect mandibles—comparative mechanical properties and links with metalincorporation. Naturwissenschaften 95:17–23.
Cronin, J. T., K. J. Haynes, and F. P. Dillemuth. 2004. Spidereffects on planthopper mortality, dispersal, and spatialpopulation dynamics. Ecology 85:2134–2143.
Danner, B. J., and A. Joern. 2004. Development, growth andegg production of the common grasshopper, Ageneotettixdeorum (Orthoptera: Acrididae) in response to indirect risk ofspider predation. Ecological Entomology 29:1–11.
Denno, R. F., and M. S. McClure, editors. 1983. Variableplants and herbivores in natural and managed systems.Academic Press, New York, New York, USA.
Evans, E. W., R. A. Rogers, and D. J. Opfermann. 1983.Sampling grasshoppers (Orthoptera: Acridide) on burnedand unburned tallgrass prairie: night trapping vs. sweeping.Environmental Entomology 12:1449–1454.
Feller, U., I. Anders, and T. Mae. 2008. Rubiscolytics: fate ofRubisco after its enzymatic function in a cell is terminated.Journal of Experimental Botany 59:1615–1624.
Frausto da Silva, J. J. R. and R. J. P. Williams. 1991. Thebiological chemistry of the elements: the inorganic chemistryof life. Clarendon, Oxford, UK.
Haddad, N., J. Haarstad, and D. Tilman. 2000. The effects oflong-term nitrogen loading on grassland insect communities.Oecologia 124:73–84.
Haddad, N. M., D. Tilman, J. Haarstad, M. E. Ritchie, andJ. M. H. Knops. 2001. Contrasting effects of plant richnessand composition on insect communities: a field experiment.American Naturalist 158:17–35.
Hawlena, D., and O. J. Schmitz. 2010. Herbivore physiologicalresponse to predation risk and implications for ecosystem
May 2012 1013PLANT NUTRIENTS AND INSECT HERBIVORES
nutrient dynamics. Proceedings of the National Academy ofSciences USA 107:15503–15507.
Haynes, K. J., and J. T. Cronin. 2006. Interpatch movementand edge effects: the role of behavioral responses to thelandscape matrix. Oikos 113:43–54.
Haynes, K. J., F. P. Dillemuth, B. J. Anderson, A. S. Hakes,H. B. Jackson, S. E. Jackson, and J. T. Cronin. 2007.Landscape context outweighs local habitat quality in itseffects on herbivore dispersal and distribution. Oecologia151:431–441.
Heidorn, T. J., and A. Joern. 1987. Feeding preference andspatial distribution by grasshoppers (Acrididae) in responseto nitrogen fertilization of Calamovilfa longifolia. FunctionalEcology 1:369–375.
Joern, A. 1979. Feeding patterns in grasshoppers (Orthoptera:Acrididae): factors influencing diet specialization. Oecologia38:325–347.
Joern, A. 1985. Grasshopper dietary (Orthoptera: Acrididae)from a Nebraska sandhills prairie. Transactions of theNebraska Academy of Sciences 13:21–32.
Joern, A. 2004. Variation in grasshopper (Acrididae) densitiesin response to fire frequency and bison grazing in tallgrassprairie. Environmental Entomology 33:1617–1625.
Joern, A. 2005. Disturbance by fire frequency and bison grazingmodulate grasshopper species assemblages (Orthoptera) intallgrass prairie. Ecology 86:861–873.
Joern, A., and S. B. Gaines. 1990. Population dynamics andregulation in grasshoppers. Pages 415–482 in R. F. Chapmanand A. Joern, editors. Biology of grasshoppers. John Wileyand Sons, New York, New York, USA.
Johnson, J. B., and K. S. Omland. 2004. Model selection inecology and evolution. Trends in Ecology and Evolution19:101–108.
Jonas, J. L., and A. Joern. 2007. Grasshopper (Orthoptera:Acrididae) communities respond to fire, bison grazing andweather in North American tallgrass prairie: a long-termstudy. Oecologia 153:699–711.
Jonas, J. L., and A. Joern. 2008. Host plant quality alters grass:forb consumption by a mixed-feeding herbivore, Melanoplusbivitattus. Ecological Entomology 33:546–554.
Kakie, T. 1969. Phosphorus fractions in tobacco plants asaffected by phosphate application. Soil Science and PlantNutrition (Tokyo) 15:81–85.
Kaspari, M., and S. P. Yanoviak. 2009. Biogeochemistry andthe structure of tropical brown food webs. Ecology 90:3342–3351.
Kaspari, M., S. P. Yanoviak, R. Dudley, M. Yuan, and N. A.Clay. 2009. Sodium shortage as a constraint on the carboncycle in an inland tropical rainforest. Proceedings of theNational Academy of Sciences USA 106:19405–19409.
Kay, A. D., S. E. Scott, J. D. Schade, and S. E. Hobbie. 2004.Stoichiometric relations in an ant–treehopper mutualism.Ecology Letters 7:1024–1028.
Loaiza, V., J. L. Jonas, and A. Joern. 2011. Grasshoppers(Orthoptera: Acrididae) select vegetation patches in local-scale responses to foliar nitrogen but not phosphorus innative grassland. Insect Science 18:533–540.
Lockwood, J. A. 1997. Grasshopper population dynamics: aprairie perspective. Pages 103–128 in S. K. Gangwere, M. C.Muralirangan, and M. Muralirangan, editors. The bionomicsof grasshoppers, katydids and their kin. CAB International,New York, New York, USA.
Marschner, H. 1995. Mineral nutrition of higher plants. Secondedition. Academic Press, San Diego, California, USA.
Mattson, W. J., and R. A. Haack. 1987. The role of droughtin outbreaks of plant-eating insects. BioScience 37:110–118.
McCune, B., and J. B. Grace. 2002. Analysis of ecologicalcommunities. MJM Software Design, Gleneden Beach,Oregon, USA.
McCune, B., and M. J. Mefford. 1999. PC-ORD. Multivariateanalysis of ecological data. MJM Software Design, Corvallis,Oregon, USA.
Mills, H. A., and J. B. Jones, Jr. 1996. Plant analysishandbook II. A practical sampling, preparation, analysis,and interpretation guide. Micromacro, Athens, Georgia,USA.
Moe, S. J., R. S. Stelzer, M. R. Forman, W. S. Harpole, T.Daufresne, and T. Yoshida. 2005. Recent advances inecological stoichiometry: insights for population and com-munity ecology. Oikos 109:29–39.
Molleman, F. 2010. Puddling: from natural history tounderstanding how it affects fitness. Entomologia Exper-imentalis et Applicata 134:107–113.
O’Neill, K. M., B. E. Olson, M. G. Rolston, R. Wallander,D. P. Larson, and C. E. Seibert. 2003. Effects of livestockgrazing on rangeland grasshopper (Orthoptera: Acrididae)abundance. Agriculture, Ecosystems and Environment97:51–64.
Onsager, J. A. 1977. Comparison of five methods for estimatingdensity of rangeland grasshoppers. Journal of EconomicEntomology 70:187–190.
Perkins, M. C., H. A. Woods, J. F. Harrison, and J. J. Elser.2004. Dietary phosphorus affects the growth of larvalManduca sexta. Archives of Insect Biochemistry andPhysiology 55:153–168.
Pitt, W. C. 1999. Effects of multiple vertebrate predators ongrasshopper habitat selection: trade-offs due to predationrisk, foraging and thermoregulation. Evolutionary Ecology13:499–515.
Raubenheimer, D., and S. J. Simpson. 1993. The geometry ofcompensatory feeding in the locust. Animal Behaviour45:953–964.
Raubenheimer, D., S. J. Simpson, and D. Mayntz. 2009.Nutrition, ecology and nutritional ecology: toward anintegrated framework. Functional Ecology 23:4–16.
Rosenthal, G. A., and M. R. Berenbaum, editors. 1992.Herbivores: their interactions with secondary plant metabo-lites. Second edition. Academic Press, New York, New York,USA.
Schade, J. D., M. Kyle, S. E. Hobbie, W. F. Fagan, and J. J.Elser. 2003. Stoichiometric tracking of soil nutrients by adesert insect herbivore. Ecology Letters 6:96–101.
Schmitz, O. J. 2009. Effects of predator functional diversity ongrassland ecosystem function. Ecology 90:2339–2345.
Schmitz, O. J., A. P. Beckerman, and K. M. O’Brien. 1997.Behaviorally mediated trophic cascades: effects of predationrisk on food web interactions. Ecology 78:1388–1399.
Schoonhoven, L. M., J. J. A. van Loon, and M. Dicke. 2005.Insect–plant biology. Oxford University Press, Oxford, UK.
Simpson, S. J., and D. Raubenheimer. 2001. The geometricanalysis of nutrient–allelochemical interactions: a case studyusing locusts. Ecology 82:422–439.
Simpson, S. J., G. A. Sword, P. D. Lorch, and I. D. Couzin.2006. Cannibal crickets on a forced march for protein andsalt. Proceedings of the National Academy of Sciences USA103:4152–4156.
Smedley, S. R., and T. Eisner. 1995. Sodium uptake bypuddling in a moth. Science 270:1816–1818.
Sterner, R. W., and J. J. Elser. 2002. Ecological stoichiometry:the biology of elements from molecules to the biosphere.Princeton University Press, Princeton, New Jersey, USA.
Trumper, S., and S. J. Simpson. 1993. Regulation of salt intakeby nymphs of Locusta migratoria. Journal of InsectPhysiology 39:857–864.
White, T. C. R. 1993. The inadequate environment: nitrogenand the abundance of animals. Springer-Verlag, Berlin,Germany.
White, T. C. R. 2008. The role of food, weather and climate inlimiting the abundance of animals. Biological Review 83:227–248.
ANTHONY JOERN ET AL.1014 Ecology, Vol. 93, No. 5
With, K. A., and T. O. Crist. 1995. Critical thresholds inspecies’ responses to landscape structure. Ecology 76:2446–2459.
Woods, H. A., M. C. Perkins, J. J. Elser, and J. F. Harrison.2002. Absorption and storage of phosphorus by larvalManduca sexta. Journal of Insect Physiology 48:555–564.
SUPPLEMENTAL MATERIAL
Appendix A
Relative abundances of grasshopper species at each site and overall relative abundance of each species averaged over all sites(Ecological Archives E093-087-A1).
Appendix B
Relative abundances and densities of grasshopper feeding guilds by sites (Ecological Archives E093-087-A2).
Appendix C
Analytical methods used in the elemental analyses of plant tissue (Ecological Archives E093-087-A3).
Appendix D
Models compared in AIC analyses (Ecological Archives E093-087-A4).
May 2012 1015PLANT NUTRIENTS AND INSECT HERBIVORES