SOLUTIONS & MULTI-ASSET | GLOBAL BALANCED RISK CONTROL TEAM Outlook 2020 Not the Usual Suspects Heading into 2020, world economic growth appears sufficiently robust to resist recession, but is slowing enough to prompt a number of governments to implement fiscal stimulus programmes. While the U.S. economy continues to be supported by a healthy consumer and China is stabilising with minimal stimulus, we see the brightest spots as being outside the usual suspects: The opportunities in 2020 appear to be in regions like Japan and the UK, both of which have been out of favour for a number of years.
Transcript
SOLUTIONS & MULTI-ASSET | GLOBAL BALANCED RISK CONTROL TEAM
Outlook 2020
Not the Usual SuspectsHeading into 2020, world economic growth appears sufficiently robust to resist recession, but is slowing enough to prompt a number of governments to implement fiscal stimulus programmes. While the U.S. economy continues to be supported by a healthy consumer and China is stabilising with minimal stimulus, we see the brightest spots as being outside the usual suspects: The opportunities in 2020 appear to be in regions like Japan and the UK, both of which have been out of favour for a number of years.
2
OUTLOOK 2020
MORGAN STANLEY INVESTMENT MANAGEMENT | SOLUTIONS & MULTI-ASSET
The United States: Slow and steadyConsumption in the U.S. is healthy, with strong job and wage growth, particularly in lower-wage positions that need to be filled locally, such as leisure, health care and social assistance. Households, which now own considerably more listed equities than they have historically due to low competing bank rates, are also experiencing a positive wealth effect from the S&P’s strong climb over 2019.
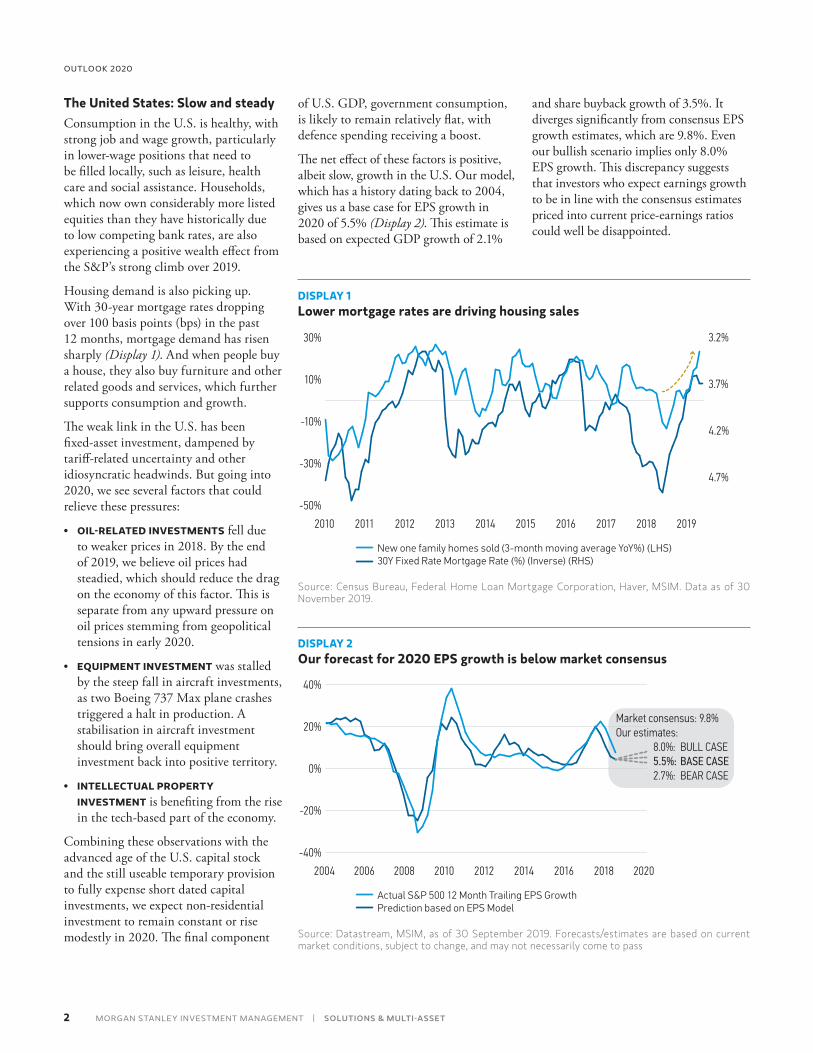
Housing demand is also picking up. With 30-year mortgage rates dropping over 100 basis points (bps) in the past 12 months, mortgage demand has risen sharply (Display 1). And when people buy a house, they also buy furniture and other related goods and services, which further supports consumption and growth.
The weak link in the U.S. has been fixed-asset investment, dampened by tariff-related uncertainty and other idiosyncratic headwinds. But going into 2020, we see several factors that could relieve these pressures:
• OIL-RELATED INVESTMENTS fell due to weaker prices in 2018. By the end of 2019, we believe oil prices had steadied, which should reduce the drag on the economy of this factor. This is separate from any upward pressure on oil prices stemming from geopolitical tensions in early 2020.
• EQUIPMENT INVESTMENT was stalled by the steep fall in aircraft investments, as two Boeing 737 Max plane crashes triggered a halt in production. A stabilisation in aircraft investment should bring overall equipment investment back into positive territory.
• INTELLECTUAL PROPERTY INVESTMENT is benefiting from the rise in the tech-based part of the economy.
Combining these observations with the advanced age of the U.S. capital stock and the still useable temporary provision to fully expense short dated capital investments, we expect non-residential investment to remain constant or rise modestly in 2020. The final component
of U.S. GDP, government consumption, is likely to remain relatively flat, with defence spending receiving a boost.
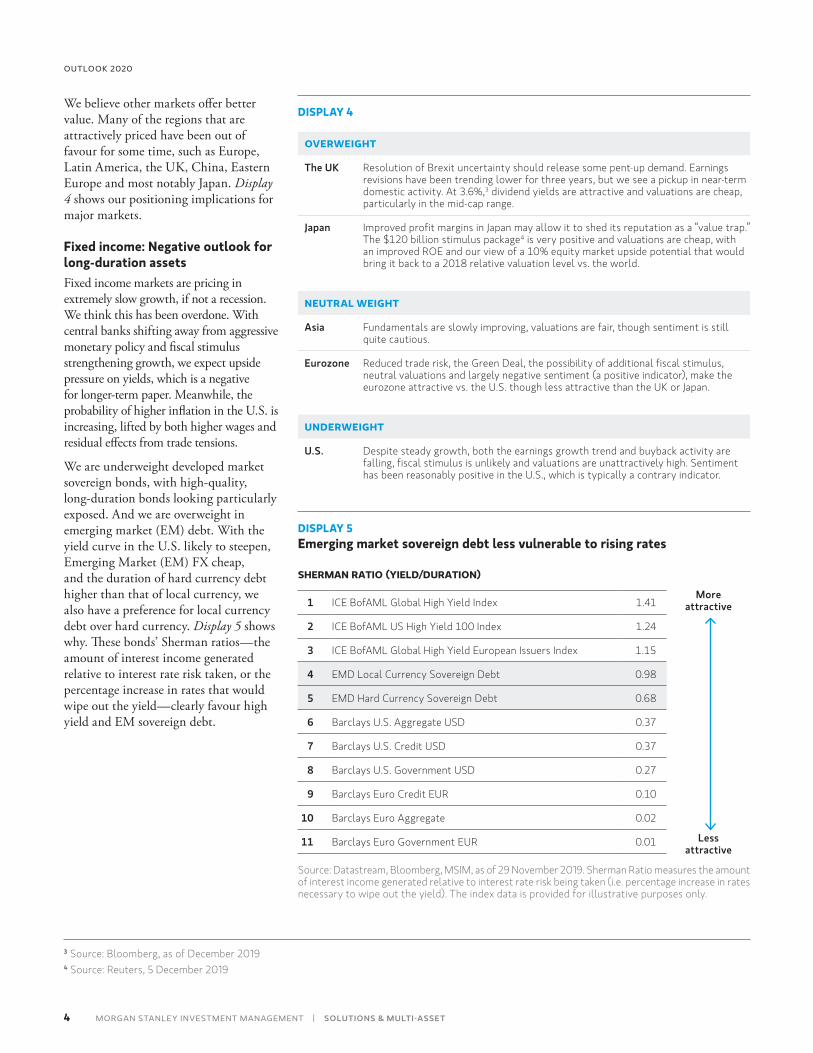
The net effect of these factors is positive, albeit slow, growth in the U.S. Our model, which has a history dating back to 2004, gives us a base case for EPS growth in 2020 of 5.5% (Display 2). This estimate is based on expected GDP growth of 2.1%
and share buyback growth of 3.5%. It diverges significantly from consensus EPS growth estimates, which are 9.8%. Even our bullish scenario implies only 8.0% EPS growth. This discrepancy suggests that investors who expect earnings growth to be in line with the consensus estimates priced into current price-earnings ratios could well be disappointed.
DISPLAY 1Lower mortgage rates are driving housing sales
30%
-30%
-50%
2010 2019
10%
3.2%
New one family homes sold (3-month moving average YoY%) (LHS)30Y Fixed Rate Mortgage Rate (%) (Inverse) (RHS)
2011 2016201520142012
-10%
4.7%
2013 2017 2018
3.7%
4.2%
Source: Census Bureau, Federal Home Loan Mortgage Corporation, Haver, MSIM. Data as of 30 November 2019.
DISPLAY 2Our forecast for 2020 EPS growth is below market consensus
2004 2020
Actual S&P 500 12 Month Trailing EPS GrowthPrediction based on EPS Model
2006 2016201420122008 2010 2018
40%
-20%
-40%
20%
0%
Market consensus: 9.8%Our estimates: 8.0%: BULL CASE 5.5%: BASE CASE 2.7%: BEAR CASE
Source: Datastream, MSIM, as of 30 September 2019. Forecasts/estimates are based on current market conditions, subject to change, and may not necessarily come to pass
3
NOT THE USUAL SUSPECTS
SOLUTIONS & MULTI-ASSET | MORGAN STANLEY INVESTMENT MANAGEMENT
China: Controlled stimulus to maintain stability
While China’s slowdown is signalling a need for stimulus, government policy has been focused on transitioning away from indiscriminate investment, towards higher-quality growth. To balance these competing forces, China is likely to continue to apply controlled stimulus that keeps the economy growing at a moderate pace, but not much faster.
In November, the People’s Bank of China (PBOC) unexpectedly lowered the rate on one-year medium-term lending facilities by 5 bps, launched a seven-day reverse repo on which it cut its rate to 2.5% for the first time since 2015, and then lowered its one- and five-year loan rates. In January, the PBoC continued its stimulus by pumping $115 billion into the country’s financial system.1 We expect the PBoC to maintain this cautious easing.
On the fiscal side, two years of government deleveraging have given China the room to increase stimulus and to continue to set a reasonable quota for bond issuance. This gives China the needed tools to maintain growth. But with improving PMI data, an accelerating service sector and November manufacturing activity expanding at its fastest pace in three years, the Chinese government seems less worried about economic growth falling below 6%. Moreover, trade tensions have started to ease as evidenced by a pickup in Chinese imports in recent months (Display 3). Therefore, on balance, we are likely to see only targeted fiscal stimulus with continuing structural reform.
Rest of the world: Also shifting towards fiscal policy2
Expectations of slower growth in the two biggest economies are finally driving a meaningful fiscal stimulus response, but it is coming from places investors might not normally expect:
• JAPAN: $120 billion fiscal stimulus (about 1.9% of GDP) over 15 months
• GERMANY: With a comfortable budget surplus, the government is considering fiscal stimulus beyond a recently announced $60 billion climate package. This is on top of the European Green Deal, which envisions over $100 billion in targeted investments
• THE UK: Plans for fiscal stimulus of about 1.2% to 2.4% of GDP from April 2020, in order to help the economy recover from the previous drag of Brexit uncertainty
• SOUTH KOREA: Most expansionary budget since 2008-2009, about 1.9% of GDP
• INDIA: Stimulus of $20 billion
We expect these and additional similar stimulus packages to boost global growth—even in the absence of action from the U.S. and China.
Outlook: Equities beat bonds . . . The stabilisation of manufacturing data, acceleration of credit growth, some restocking of inventories in Asia and easing of trade tensions all point to solid global fundamentals, with some potential
upside as the policy mix shifts from monetary to fiscal stimulus.
Equities generally appear more attractive than bonds. Interest rates are so low they appear to be pricing in a recession and equity positioning remains bearishly skewed. In fact, retail equity fund outflows are at record levels, higher than in 2008—a striking indication of negative sentiment (typically a positive indicator). If we start seeing evidence of moderate growth, it is likely that bond yields will rebound, equities will rise and investors will rotate from bonds into equities.
. . . in reasonably priced marketsDespite solid fundamentals and negative sentiment—implying the potential for positive surprises—equity investors should be careful. Some markets look very expensive, including the U.S., India, Taiwan, South Korea, Australia and the world as a whole. Looking at the 12-month price-earnings ratios around the world, the U.S. is at the 95th percentile, second only to Australia. As noted earlier, the U.S. ratio reflects a forecast of 9% earnings growth, which we think is excessive.
DISPLAY 3Chinese imports have rebounded in recent monthsChina Imports YoY%
2014 2019
EU South Korea U.S.
20162015 2017 2018
50
-50
25
-25
0
Source: Bloomberg, MSIM, as of 30 November 2019.
1 Source: Financial Times 5 November 2019 and 2 January 20202 Source: Haver, FT, Morgan Stanley Research, MSIM as of 6 December 2019
4
OUTLOOK 2020
MORGAN STANLEY INVESTMENT MANAGEMENT | SOLUTIONS & MULTI-ASSET
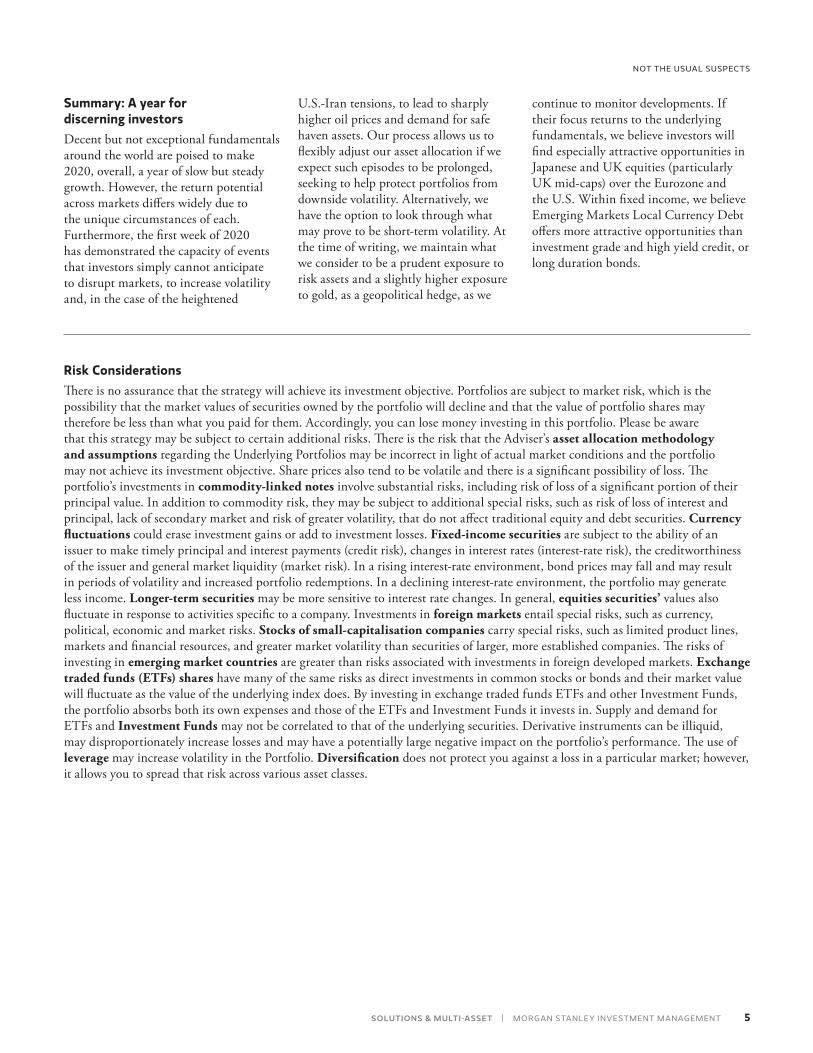
We believe other markets offer better value. Many of the regions that are attractively priced have been out of favour for some time, such as Europe, Latin America, the UK, China, Eastern Europe and most notably Japan. Display 4 shows our positioning implications for major markets.
Fixed income: Negative outlook for long-duration assets Fixed income markets are pricing in extremely slow growth, if not a recession. We think this has been overdone. With central banks shifting away from aggressive monetary policy and fiscal stimulus strengthening growth, we expect upside pressure on yields, which is a negative for longer-term paper. Meanwhile, the probability of higher inflation in the U.S. is increasing, lifted by both higher wages and residual effects from trade tensions.
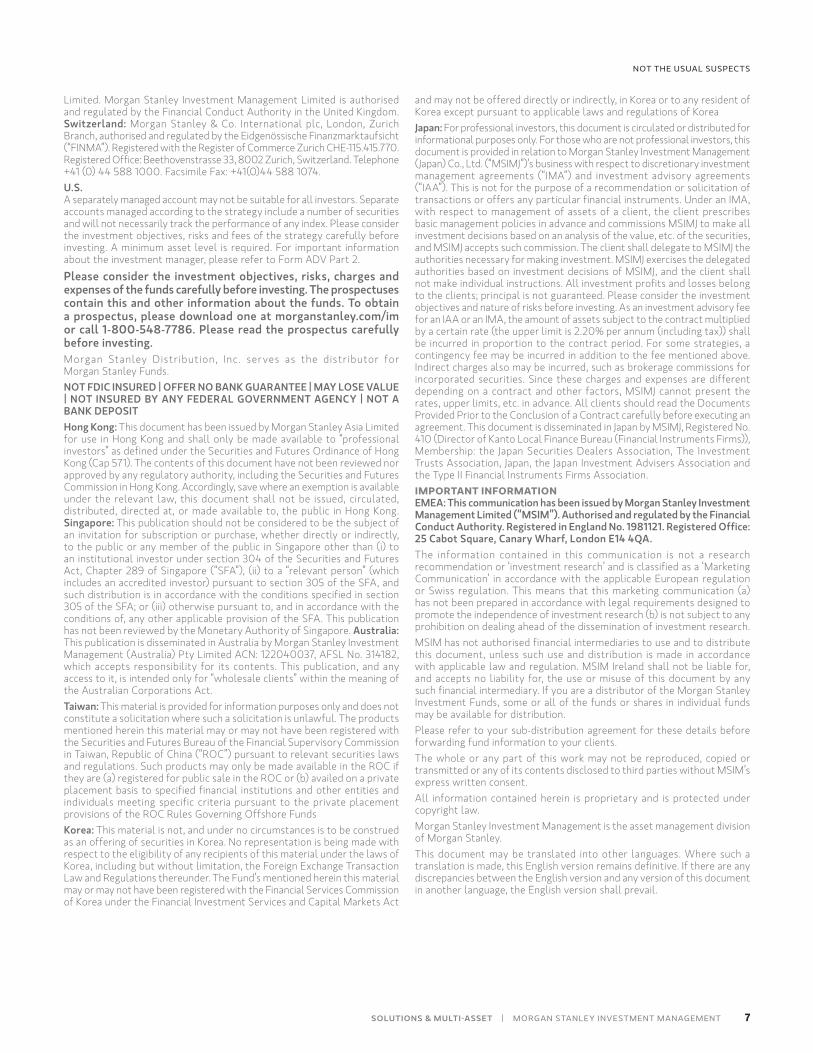
We are underweight developed market sovereign bonds, with high-quality, long-duration bonds looking particularly exposed. And we are overweight in emerging market (EM) debt. With the yield curve in the U.S. likely to steepen, Emerging Market (EM) FX cheap, and the duration of hard currency debt higher than that of local currency, we also have a preference for local currency debt over hard currency. Display 5 shows why. These bonds’ Sherman ratios—the amount of interest income generated relative to interest rate risk taken, or the percentage increase in rates that would wipe out the yield—clearly favour high yield and EM sovereign debt.
DISPLAY 4
OVERWEIGHT
The UK Resolution of Brexit uncertainty should release some pent-up demand. Earnings revisions have been trending lower for three years, but we see a pickup in near-term domestic activity. At 3.6%,3 dividend yields are attractive and valuations are cheap, particularly in the mid-cap range.
Japan Improved profit margins in Japan may allow it to shed its reputation as a “value trap.” The $120 billion stimulus package4 is very positive and valuations are cheap, with an improved ROE and our view of a 10% equity market upside potential that would bring it back to a 2018 relative valuation level vs. the world.
NEUTRAL WEIGHT
Asia Fundamentals are slowly improving, valuations are fair, though sentiment is still quite cautious.
Eurozone Reduced trade risk, the Green Deal, the possibility of additional fiscal stimulus, neutral valuations and largely negative sentiment (a positive indicator), make the eurozone attractive vs. the U.S. though less attractive than the UK or Japan.
UNDERWEIGHT
U.S. Despite steady growth, both the earnings growth trend and buyback activity are falling, fiscal stimulus is unlikely and valuations are unattractively high. Sentiment has been reasonably positive in the U.S., which is typically a contrary indicator.
DISPLAY 5Emerging market sovereign debt less vulnerable to rising rates
SHERMAN RATIO (YIELD/DURATION)
1 ICE BofAML Global High Yield Index 1.41More
attractive
2 ICE BofAML US High Yield 100 Index 1.24
3 ICE BofAML Global High Yield European Issuers Index 1.15
4 EMD Local Currency Sovereign Debt 0.98
5 EMD Hard Currency Sovereign Debt 0.68
6 Barclays U.S. Aggregate USD 0.37
7 Barclays U.S. Credit USD 0.37
8 Barclays U.S. Government USD 0.27
9 Barclays Euro Credit EUR 0.10
10 Barclays Euro Aggregate 0.02
Less attractive
11 Barclays Euro Government EUR 0.01
Source: Datastream, Bloomberg, MSIM, as of 29 November 2019. Sherman Ratio measures the amount of interest income generated relative to interest rate risk being taken (i.e. percentage increase in rates necessary to wipe out the yield). The index data is provided for illustrative purposes only.
3 Source: Bloomberg, as of December 20194 Source: Reuters, 5 December 2019
5
NOT THE USUAL SUSPECTS
SOLUTIONS & MULTI-ASSET | MORGAN STANLEY INVESTMENT MANAGEMENT
Summary: A year for discerning investorsDecent but not exceptional fundamentals around the world are poised to make 2020, overall, a year of slow but steady growth. However, the return potential across markets differs widely due to the unique circumstances of each. Furthermore, the first week of 2020 has demonstrated the capacity of events that investors simply cannot anticipate to disrupt markets, to increase volatility and, in the case of the heightened
U.S.-Iran tensions, to lead to sharply higher oil prices and demand for safe haven assets. Our process allows us to flexibly adjust our asset allocation if we expect such episodes to be prolonged, seeking to help protect portfolios from downside volatility. Alternatively, we have the option to look through what may prove to be short-term volatility. At the time of writing, we maintain what we consider to be a prudent exposure to risk assets and a slightly higher exposure to gold, as a geopolitical hedge, as we
continue to monitor developments. If their focus returns to the underlying fundamentals, we believe investors will find especially attractive opportunities in Japanese and UK equities (particularly UK mid-caps) over the Eurozone and the U.S. Within fixed income, we believe Emerging Markets Local Currency Debt offers more attractive opportunities than investment grade and high yield credit, or long duration bonds.
Risk Considerations There is no assurance that the strategy will achieve its investment objective. Portfolios are subject to market risk, which is the possibility that the market values of securities owned by the portfolio will decline and that the value of portfolio shares may therefore be less than what you paid for them. Accordingly, you can lose money investing in this portfolio. Please be aware that this strategy may be subject to certain additional risks. There is the risk that the Adviser’s asset allocation methodology and assumptions regarding the Underlying Portfolios may be incorrect in light of actual market conditions and the portfolio may not achieve its investment objective. Share prices also tend to be volatile and there is a significant possibility of loss. The portfolio’s investments in commodity-linked notes involve substantial risks, including risk of loss of a significant portion of their principal value. In addition to commodity risk, they may be subject to additional special risks, such as risk of loss of interest and principal, lack of secondary market and risk of greater volatility, that do not affect traditional equity and debt securities. Currency fluctuations could erase investment gains or add to investment losses. Fixed-income securities are subject to the ability of an issuer to make timely principal and interest payments (credit risk), changes in interest rates (interest-rate risk), the creditworthiness of the issuer and general market liquidity (market risk). In a rising interest-rate environment, bond prices may fall and may result in periods of volatility and increased portfolio redemptions. In a declining interest-rate environment, the portfolio may generate less income. Longer-term securities may be more sensitive to interest rate changes. In general, equities securities’ values also fluctuate in response to activities specific to a company. Investments in foreign markets entail special risks, such as currency, political, economic and market risks. Stocks of small-capitalisation companies carry special risks, such as limited product lines, markets and financial resources, and greater market volatility than securities of larger, more established companies. The risks of investing in emerging market countries are greater than risks associated with investments in foreign developed markets. Exchange traded funds (ETFs) shares have many of the same risks as direct investments in common stocks or bonds and their market value will fluctuate as the value of the underlying index does. By investing in exchange traded funds ETFs and other Investment Funds, the portfolio absorbs both its own expenses and those of the ETFs and Investment Funds it invests in. Supply and demand for ETFs and Investment Funds may not be correlated to that of the underlying securities. Derivative instruments can be illiquid, may disproportionately increase losses and may have a potentially large negative impact on the portfolio’s performance. The use of leverage may increase volatility in the Portfolio. Diversification does not protect you against a loss in a particular market; however, it allows you to spread that risk across various asset classes.
6
OUTLOOK 2020
MORGAN STANLEY INVESTMENT MANAGEMENT | SOLUTIONS & MULTI-ASSET
DEFINITIONS A buyback, also known as a share repurchase, is when a company buys its own outstanding shares to reduce the number of shares available on the open market. Companies buy back shares for a number of reasons, such as to increase the value of remaining shares available by reducing the supply or to prevent other shareholders from taking a controlling stake. Gross Domestic Product (GDP) is the monetary value of all the finished goods and services produced within a country’s borders in a specific time period. It includes all private and public consumption, government outlays, investments and net exports. EPS Growth Rate is total earnings divided by the number of shares outstanding. Companies often use a weighted average of shares outstanding over the reporting term. EPS can be calculated for the previous year (“trailing EPS”), for the current year (“current EPS”), or for the coming year (“forward EPS”). Note that last year’s EPS would be actual, while current year and forward year EPS would be estimates. Price-Earnings (P/E) is the price of a stock divided by its earnings per share for the past 12 months. Sometimes called the multiple, P/E gives investors an idea of how much they are paying for a company’s earning power. The higher the P/E, the more investors are paying, and therefore the more earnings growth they are expecting. The Purchasing Managers Index (PMI) is an indicator of the economic health of the manufacturing sector. The PMI index is based on five major indicators: new orders, inventory levels, production, supplier deliveries and the employment environment. Return On Equity (ROE) is the amount of net income returned as a percentage of shareholders equity. Return on equity measures a corporation’s profitability by revealing how much profit a company generates with the money shareholders have invested.The indexes are unmanaged and do not include any expenses, fees or sales charges. It is not possible to invest directly in an index. Any index referred to herein is the intellectual property (including registered trademarks) of the applicable licensor. Any product based on an index is in no way sponsored, endorsed, sold or promoted by the applicable licensor and it shall not have any liability with respect thereto. The Bloomberg Barclays U.S. Aggregate Index tracks the performance of all U.S. government agency and Treasury securities, investment-grade corporate debt securities, agency mortgage-backed securities, asset-backed securities and commercial mortgage-backed securities. The Bloomberg Barclays U.S. Credit Index measures the investment grade, US dollar-denominated, fixed-rate, taxable corporate and government related bond markets. It is composed of the US Corporate Index and a non-corporate component that includes foreign agencies, sovereigns, supranationals and local authorities. The Bloomberg Barclays U.S. Government/Credit Index tracks the performance of government and corporate obligations, including U.S. government agency and Treasury securities and corporate and Yankee bonds. The Bloomberg Barclays Euro Credit Index is a the credit component of the broad-based flagship benchmark that measures the investment grade, euro-denominated, fixed-rate bond market, including treasuries, government-related, corporate and securitized issues. Inclusion is based on currency denomination of a bond and not country of risk of the issuer. The Bloomberg Barclays Euro Aggregate Bond Index is a broad-based flagship benchmark that measures the investment grade, euro-denominated, fixed-rate bond market, including treasuries, government-related, corporate and securitized issues. Inclusion is based on currency denomination of a bond and not country of risk of the issuer. ICE BofAML Global High Yield Index tracks the performance of USD, CAD, GBP and EUR denominated below investment grade corporate debt publicly issued in the major domestic or eurobond markets. ICE BofAML US High Yield 100 Index is designed to emulate, as closely as possible, the risk characteristics of The ICE BofAML US High Yield Constrained Index (HUC0) with a comparatively small basket of securities. Rebalancing rules are geared toward selecting the most liquid HUC0 constituents while minimizing turnover. ICE BofAML Global High Yield European Issuers Index tracks the performance of USD, EUR and GBP denominated below investment grade corporate debt publicly issued by European corporations in the US, sterling or euro domestic or the eurobond markets. DISCLOSURESThe views and opinions are those of the author as of the date of publication and are subject to change at any time due to market or economic conditions and may not necessarily come to pass. Furthermore, the views will not be updated or otherwise revised to reflect information that subsequently becomes available or circumstances existing, or changes occurring, after the date of publication. The views expressed do not reflect the opinions of all portfolio managers at Morgan Stanley Investment Management (MSIM) or the views of the firm as a whole, and may not be reflected in all the strategies and products that the Firm offers.
Forecasts and/or estimates provided herein are subject to change and may not actually come to pass. Information regarding expected market returns and market outlooks is based on the research, analysis and opinions of the authors. These conclusions are speculative in nature, may not come to pass, and are not intended to predict the future performance of any specific Morgan Stanley Investment Management product. Except as otherwise indicated, the views and opinions expressed herein are those of the Portfolio Management team, are based on matters as they exist as of the date of preparation and not as of any future date, and will not be updated or otherwise revised to reflect information that subsequently becomes available or circumstances existing, or changes occurring, after the date hereof. Certain information herein is based on data obtained from third-party sources believed to be reliable. However, we have not verified this information, and we make no representations whatsoever as to its accuracy or completeness. The information herein is a general communication, which is not impartial and has been prepared solely for information and educational purposes, and does not constitute an offer or a recommendation to buy or sell any particular security, or to adopt any specific investment strategy. The material contained herein has not been based on a consideration of any individual client circumstances and is not investment advice, nor should it be construed in any way as tax, accounting, legal or regulatory advice. To that end, investors should seek independent legal and financial advice, including advice as to tax consequences, before making any investment decision. Past performance is no guarantee of future results. Charts and graphs provided herein are for illustrative purposes only.This communication is not a product of Morgan Stanley’s Research Department and should not be regarded as a research recommendation. The information contained herein has not been prepared in accordance with legal requirements designed to promote the independence of investment research and is not subject to any prohibition on dealing ahead of the dissemination of investment research. This commentary is only intended for, and will be only distributed to, persons resident in jurisdictions where distribution or availability would not be contrary to local laws or regulations. There is no guarantee that any investment strategy will work under all market conditions, and each investor should evaluate their ability to invest for the long-term, especially during periods of downturn in the market. Prior to investing, investors should carefully review the product’s relevant offering document. There are important differences in how the strategy is carried out in each of the investment vehicles. DISTRIBUTIONThis communication is only intended for and will only be distributed to persons resident in jurisdictions where such distribution or availability would not be contrary to local laws or regulations. Ireland: Morgan Stanley Investment Management (Ireland) Limited. Registered Office: The Observatory, 7-11 Sir John Rogerson’s Quay, Dublin 2, Ireland. Registered in Ireland under company number 616662. Regulated by the Central Bank of Ireland. United Kingdom: Morgan Stanley Investment Management Limited is authorised and regulated by the Financial Conduct Authority. Registered in England. Registered No. 1981121. Registered Office: 25 Cabot Square, Canary Wharf, London E14 4QA, authorised and regulated by the Financial Conduct Authority. Dubai: Morgan Stanley Investment Management Limited (Representative Office, Unit Precinct 3-7th Floor-Unit 701 and 702, Level 7, Gate Precinct Building 3, Dubai International Financial Centre, Dubai, 506501, United Arab Emirates. Telephone: +97 (0)14 709 7158). Germany: Morgan Stanley Investment Management Limited Niederlassung Deutschland, Grosse Gallusstrasse 18, 60312 Frankfurt am Main, Germany (Gattung: Zweigniederlassung (FDI) gem. § 53b KWG). Italy: Morgan Stanley Investment Management Limited, Milan Branch (Sede Secondaria di Milano) is a branch of Morgan Stanley Investment Management Limited, a company registered in the U.K., authorised and regulated by the Financial Conduct Authority (FCA), and whose registered office is at 25 Cabot Square, Canary Wharf, London, E14 4QA. Morgan Stanley Investment Management Limited Milan Branch (Sede Secondaria di Milano) with seat in Palazzo Serbelloni Corso Venezia, 16 20121 Milano, Italy, is registered in Italy with company number and VAT number 08829360968. The Netherlands: Morgan Stanley Investment Management, Rembrandt Tower, 11th Floor Amstelplein 1 1096HA, Netherlands. Telephone: 31 2-0462-1300. Morgan Stanley Investment Management is a branch office of Morgan Stanley Investment Management
7
NOT THE USUAL SUSPECTS
SOLUTIONS & MULTI-ASSET | MORGAN STANLEY INVESTMENT MANAGEMENT
Limited. Morgan Stanley Investment Management Limited is authorised and regulated by the Financial Conduct Authority in the United Kingdom. Switzerland: Morgan Stanley & Co. International plc, London, Zurich Branch, authorised and regulated by the Eidgenössische Finanzmarktaufsicht (“FINMA”). Registered with the Register of Commerce Zurich CHE-115.415.770. Registered Office: Beethovenstrasse 33, 8002 Zurich, Switzerland. Telephone +41 (0) 44 588 1000. Facsimile Fax: +41(0)44 588 1074.U.S. A separately managed account may not be suitable for all investors. Separate accounts managed according to the strategy include a number of securities and will not necessarily track the performance of any index. Please consider the investment objectives, risks and fees of the strategy carefully before investing. A minimum asset level is required. For important information about the investment manager, please refer to Form ADV Part 2.
Please consider the investment objectives, risks, charges and expenses of the funds carefully before investing. The prospectuses contain this and other information about the funds. To obtain a prospectus, please download one at morganstanley.com/im or call 1-800-548-7786. Please read the prospectus carefully before investing.Morgan Stanley Distr ibution, Inc . serves as the distr ibutor for Morgan Stanley Funds. NOT FDIC INSURED | OFFER NO BANK GUARANTEE | MAY LOSE VALUE | NOT INSURED BY ANY FEDERAL GOVERNMENT AGENCY | NOT A BANK DEPOSIT Hong Kong: This document has been issued by Morgan Stanley Asia Limited for use in Hong Kong and shall only be made available to “professional investors” as defined under the Securities and Futures Ordinance of Hong Kong (Cap 571). The contents of this document have not been reviewed nor approved by any regulatory authority, including the Securities and Futures Commission in Hong Kong. Accordingly, save where an exemption is available under the relevant law, this document shall not be issued, circulated, distributed, directed at, or made available to, the public in Hong Kong. Singapore: This publication should not be considered to be the subject of an invitation for subscription or purchase, whether directly or indirectly, to the public or any member of the public in Singapore other than (i) to an institutional investor under section 304 of the Securities and Futures Act, Chapter 289 of Singapore (“SFA”), (ii) to a “relevant person” (which includes an accredited investor) pursuant to section 305 of the SFA, and such distribution is in accordance with the conditions specified in section 305 of the SFA; or (iii) otherwise pursuant to, and in accordance with the conditions of, any other applicable provision of the SFA. This publication has not been reviewed by the Monetary Authority of Singapore. Australia: This publication is disseminated in Australia by Morgan Stanley Investment Management (Australia) Pty Limited ACN: 122040037, AFSL No. 314182, which accepts responsibility for its contents. This publication, and any access to it, is intended only for “wholesale clients” within the meaning of the Australian Corporations Act. Taiwan: This material is provided for information purposes only and does not constitute a solicitation where such a solicitation is unlawful. The products mentioned herein this material may or may not have been registered with the Securities and Futures Bureau of the Financial Supervisory Commission in Taiwan, Republic of China (“ROC”) pursuant to relevant securities laws and regulations. Such products may only be made available in the ROC if they are (a) registered for public sale in the ROC or (b) availed on a private placement basis to specified financial institutions and other entities and individuals meeting specific criteria pursuant to the private placement provisions of the ROC Rules Governing Offshore FundsKorea: This material is not, and under no circumstances is to be construed as an offering of securities in Korea. No representation is being made with respect to the eligibility of any recipients of this material under the laws of Korea, including but without limitation, the Foreign Exchange Transaction Law and Regulations thereunder. The Fund’s mentioned herein this material may or may not have been registered with the Financial Services Commission of Korea under the Financial Investment Services and Capital Markets Act
and may not be offered directly or indirectly, in Korea or to any resident of Korea except pursuant to applicable laws and regulations of KoreaJapan: For professional investors, this document is circulated or distributed for informational purposes only. For those who are not professional investors, this document is provided in relation to Morgan Stanley Investment Management (Japan) Co., Ltd. (“MSIMJ”)’s business with respect to discretionary investment management agreements (“IMA”) and investment advisory agreements (“IAA”). This is not for the purpose of a recommendation or solicitation of transactions or offers any particular financial instruments. Under an IMA, with respect to management of assets of a client, the client prescribes basic management policies in advance and commissions MSIMJ to make all investment decisions based on an analysis of the value, etc. of the securities, and MSIMJ accepts such commission. The client shall delegate to MSIMJ the authorities necessary for making investment. MSIMJ exercises the delegated authorities based on investment decisions of MSIMJ, and the client shall not make individual instructions. All investment profits and losses belong to the clients; principal is not guaranteed. Please consider the investment objectives and nature of risks before investing. As an investment advisory fee for an IAA or an IMA, the amount of assets subject to the contract multiplied by a certain rate (the upper limit is 2.20% per annum (including tax)) shall be incurred in proportion to the contract period. For some strategies, a contingency fee may be incurred in addition to the fee mentioned above. Indirect charges also may be incurred, such as brokerage commissions for incorporated securities. Since these charges and expenses are different depending on a contract and other factors, MSIMJ cannot present the rates, upper limits, etc. in advance. All clients should read the Documents Provided Prior to the Conclusion of a Contract carefully before executing an agreement. This document is disseminated in Japan by MSIMJ, Registered No. 410 (Director of Kanto Local Finance Bureau (Financial Instruments Firms)), Membership: the Japan Securities Dealers Association, The Investment Trusts Association, Japan, the Japan Investment Advisers Association and the Type II Financial Instruments Firms Association.IMPORTANT INFORMATIONEMEA: This communication has been issued by Morgan Stanley Investment Management Limited (“MSIM”). Authorised and regulated by the Financial Conduct Authority. Registered in England No. 1981121. Registered Office: 25 Cabot Square, Canary Wharf, London E14 4QA.The information contained in this communication is not a research recommendation or ‘investment research’ and is classified as a ‘Marketing Communication’ in accordance with the applicable European regulation or Swiss regulation. This means that this marketing communication (a) has not been prepared in accordance with legal requirements designed to promote the independence of investment research (b) is not subject to any prohibition on dealing ahead of the dissemination of investment research.MSIM has not authorised financial intermediaries to use and to distribute this document, unless such use and distribution is made in accordance with applicable law and regulation. MSIM Ireland shall not be liable for, and accepts no liability for, the use or misuse of this document by any such financial intermediary. If you are a distributor of the Morgan Stanley Investment Funds, some or all of the funds or shares in individual funds may be available for distribution. Please refer to your sub-distribution agreement for these details before forwarding fund information to your clients. The whole or any part of this work may not be reproduced, copied or transmitted or any of its contents disclosed to third parties without MSIM’s express written consent. All information contained herein is proprietary and is protected under copyright law.Morgan Stanley Investment Management is the asset management division of Morgan Stanley. This document may be translated into other languages. Where such a translation is made, this English version remains definitive. If there are any discrepancies between the English version and any version of this document in another language, the English version shall prevail.