21
Notes on Sensit and Treeplan EXCEL REVIEW 2001-2002

Notes on Sensit and Treeplan
EXCEL REVIEW 2001-2002

Contents
Page SensIt
What is SensIt?.............................................................................................. 1 Running SensIt .............................................................................................. 1 SensIt’s Plot Command................................................................................. 1 The finance.xls Sample Spreadsheet ............................................................. 3 SensIt’s Tornado Command.......................................................................... 4 The Tornado Results Spreadsheet ................................................................. 6
TreePlan What is Treeplan?.......................................................................................... 7 How to Get Treeplan ..................................................................................... 7 Running TreePlan.......................................................................................... 7 How to:
��Build up a tree ............................................................................. 8 ��Change tree labels ....................................................................... 8 ��Modify a tree’s structure ............................................................. 8
TreePlan’s Dialog Boxes............................................................................... 9 The Copy subtree Command......................................................................... 10 Formatting ..................................................................................................... 10 Anatomy of a Decision Tree ......................................................................... 10 Solving Trees................................................................................................. 11 Controlling Calculations ............................................................................... 11 TreePlan’s Online Help................................................................................. 12 The TreePlan Online Help File ..................................................................... 13

1
SENSIT
What is SensIt? SensIt is an Excel add-in that makes it easy to do sensitivity analysis inside an Excel spreadsheet. SensIt is written as an Excel macro. It was written by Mike Middleton of the University of San Francisco and Jim Smith of Duke University. Download a copy of SensIt from either of these URLs:
http://ourworld.compuserve.com/homepages/decision/ http://faculty.fuqua.duke.edu/~pecklund/excelreview/ExcelReview.htm
Running SensIt To run SensIt, load the sensit.xla file after starting Excel. When prompted, agree to run the SensIt macros. After SensIt loads you’ll see two new commands at the bottom of the Tools menu: Plot and Tornado. We’ll describe these two commands using the spreadsheet model finance.xls as an example. The finance.xls spreadsheet is also available for download from Fuqua’s web site. This spreadsheet is used to perform a risk analysis in support of a new product launch decision. The outlined cells are “inputs” that refer to values in the upper left corner of the spreadsheet. SensIt’s Plot Command Use SensIt’s Plot command to examine the sensitivity of a single variable. In the example, one might be interested to see how “Volume w/Entry” affects “NPV”. To do this, choose Tools, Plot (or, as a shortcut, hold down the Control key and hit the p key). The Plot dialog displays. When you click the OK button in SensIt’s Plot dialog, SensIt varies the value of the input variable you identified across the range you specified. It records the corresponding result values in the specified output cell. In this example, the program sets cell $C$5 to 1000 and records the value in cell $C$45. It then repeats this process 10 times for input values of 1400, 1800, 2200, …, 5000. When done, SensIt
Put cell references in these fields. Either type them in or point to the cell on the
spreadsheet while the
cursor is in a field.
Type numeric values in these
fields. The value in the “Steps” field must be an
integer.

2
produces a spreadsheet (separate from the original) that lists and plots the results (see below). The labels of the input and output variables are taken from cells $B5 and $B45, respectively. A copy of the finance.xls spreadsheet follows.
Sensitivity Analysis for [FINANCE.XLS]Sheet1 run on Jun 09, 1997 (09:27 AM)
Input OutputVolume w/ Entry NPV 10%
1,000 ($24,516)1,400 $9,9421,800 $42,9122,200 $75,4362,600 $107,9603,000 $140,4843,400 $173,0083,800 $205,3544,200 $237,5494,600 $269,7445,000 $301,939
($50,000)$0
$50,000$100,000$150,000
$200,000$250,000$300,000$350,000
0 2,000 4,000 6,000
Volume w/ Entry
NPV
10%

3
The finance.xls worksheet.

4
SensIt’s Tornado Command SensIt’s Tornado command allows you to perform sensitivity analysis on a number of variables simultaneously. When you select the command Tools, Tornado the Tornado dialog appears.
The Tornado dialog box requires a list of input variables and low, base, and high cases for each of the variables. The input variables must be arranged in a column (as in the finance.xls example) and the low, base, and high case values must be columns of the same length as in the input variables. When defining the high and low cases for each variable it is important to be consistent so that the “high” cases are all equally high and the “low” cases are all equally low. For example, you might specify:
• = all the base case values to be estimates of the mean of the input variable • = all the low cases to be values such as there is a 1-in-10 chance of the variable being
below this amount • = all the high cases to be values such that there’s a 1-in-10 chance of the variable being
above this amount When you hit the OK button in the Tornado dialog SensIt sets all the input variables to their base-case values and records the output value (in this case from cell $C$45). It then goes through each of the input variables one at a time, plugs the low-case value into the input cell, and records the value in the output cell. It repeats the process for the high case. SensIt then produces a separate spreadsheet that lists the results and displays them in a “Tornado” chart. A copy of this results spreadsheet follows. In the results spreadsheet, the variables are sorted by their “swing” — the absolute value of the difference between the output values in the low and high cases. In this example we see that if “Price with Entry” is set at the low value of $40 and all other variables are set at their base case value, NPV is $35,993. If “Price with Entry” is set to the high value of $68.00, NPV is $312,267. The swing is then the difference between these two values of $276,273. “Swing” serves as a rough measure of the impact of each input variable. “Percent variance” is a standardized measure of impact: it squares each swing and sums them up to get a “Total Variance” and reports the percentage of the “total variance” attributed to each input variable. In general you should focus your modeling efforts on those variables with the swing in the Tornado analysis. But you must be careful in interpreting the results of a Tornado analysis. In this

5
example, the Tornado results indicate that “Price w/o Entry” and “Volume w/o Entry” have no impact on NPV. This is because in the base case Competitor Entry is set to 1 (indicating the presence of a competitor) and “Price w/o Entry” and “Volume w/o Entry” play no role in the model. If we had instead set “Competitor Entry” to 0 in the base case and rerun the Tornado analysis, “Price w/o Entry” and “Volume w/o Entry” would both have significant impacts on NPV and “Price w/Entry” and “Volume w/Entry” would have no impact. In cases like this, it’s probably better to run separate Tornado analyses in the two different cases of “Competitor Entry”. Any time you see a variable with zero swing it means the input cell has no impact on the output. These cases should be investigated carefully. A copy of the Tornado results spreadsheet follows.

6
The Tornado Analysis for the finance.xls sample spreadsheet.

7
TreePlan What is TreePlan? TreePlan is an Excel add-in that allows you to build decision trees in Excel. It was developed by Professor Michael R. Middleton at the University of San Francisco and modified for use at Fuqua by Duke University Professor Jim Smith. How to Get TreePlan Download a copy of Treeplan from either of these URLs:
http://ourworld.compuserve.com/homepages/decision/ http://faculty.fuqua.duke.edu/~pecklund/excelreview/ExcelReview.htm
Running TreePlan To run TreePlan, open the treeplan.xla file in Excel. When prompted, agree to run the TreePlan macros. With the treeplan.xla file loaded, a new command Decision Tree appears at the bottom of Excel’s Tools menu. Start a new decision tree in TreePlan by holding down the Control key and hitting the t key or by selecting Tools, Decision Tree from Excel’s menus. Treeplan prompts you with a dialog box with three options. Choose the New Tree option to begin a new tree. At the current cell Treeplan draws a default initial decision tree, extending downward and to the right with the selected cell as the upper-left-hand corner. For example, the figure below shows how TreePlan draws a new tree when cell $B$2 is selected. Important Notes:
• = The new tree TreePlan creates will write over any existing data in that area of your spreadsheet so begin your tree to the right of where your data is stored.
• = Once you’ve created a tree, don’t add or delete any rows or columns in the tree-diagram area.
TreePlanDecision 1
00 0
10
Decision 20
0 0
8
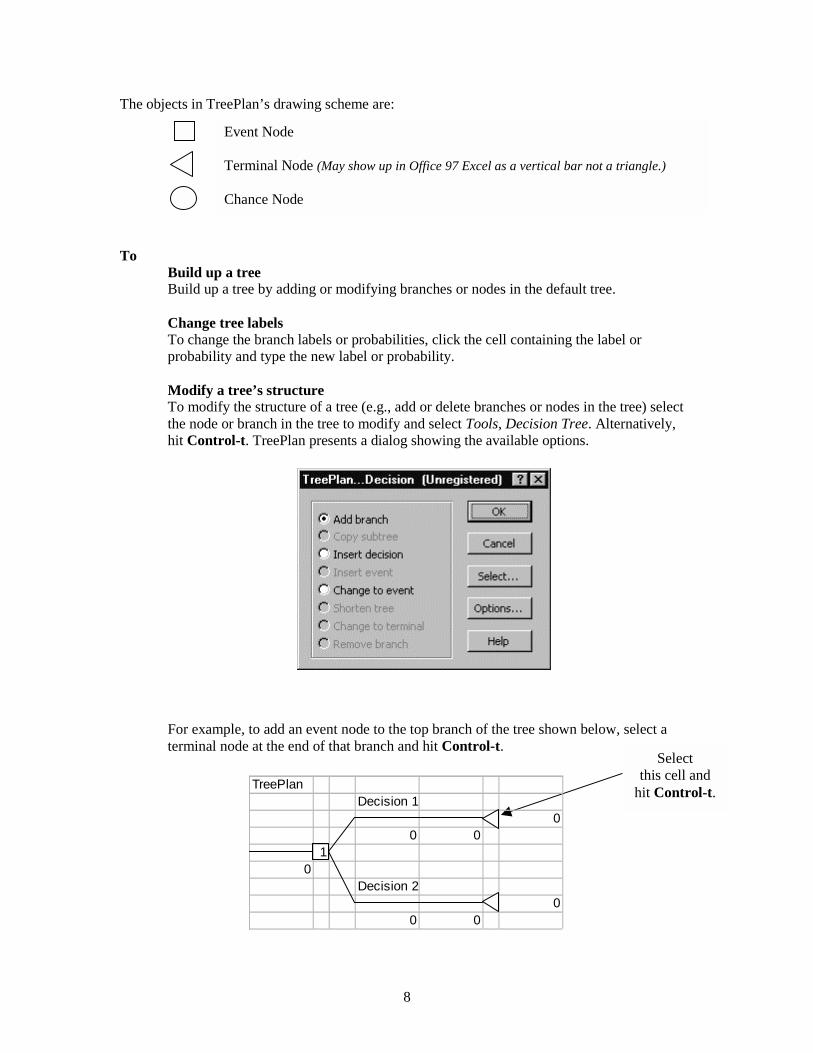
The objects in TreePlan’s drawing scheme are:
To
Build up a tree Build up a tree by adding or modifying branches or nodes in the default tree. Change tree labels To change the branch labels or probabilities, click the cell containing the label or probability and type the new label or probability. Modify a tree’s structure To modify the structure of a tree (e.g., add or delete branches or nodes in the tree) select the node or branch in the tree to modify and select Tools, Decision Tree. Alternatively, hit Control-t. TreePlan presents a dialog showing the available options.
For example, to add an event node to the top branch of the tree shown below, select a terminal node at the end of that branch and hit Control-t.
Event Node Terminal Node (May show up in Office 97 Excel as a vertical bar not a triangle.) Chance Node
Select this cell and
hit Control-t.TreePlanDecision 1
00 0
10
Decision 20
0 0
9
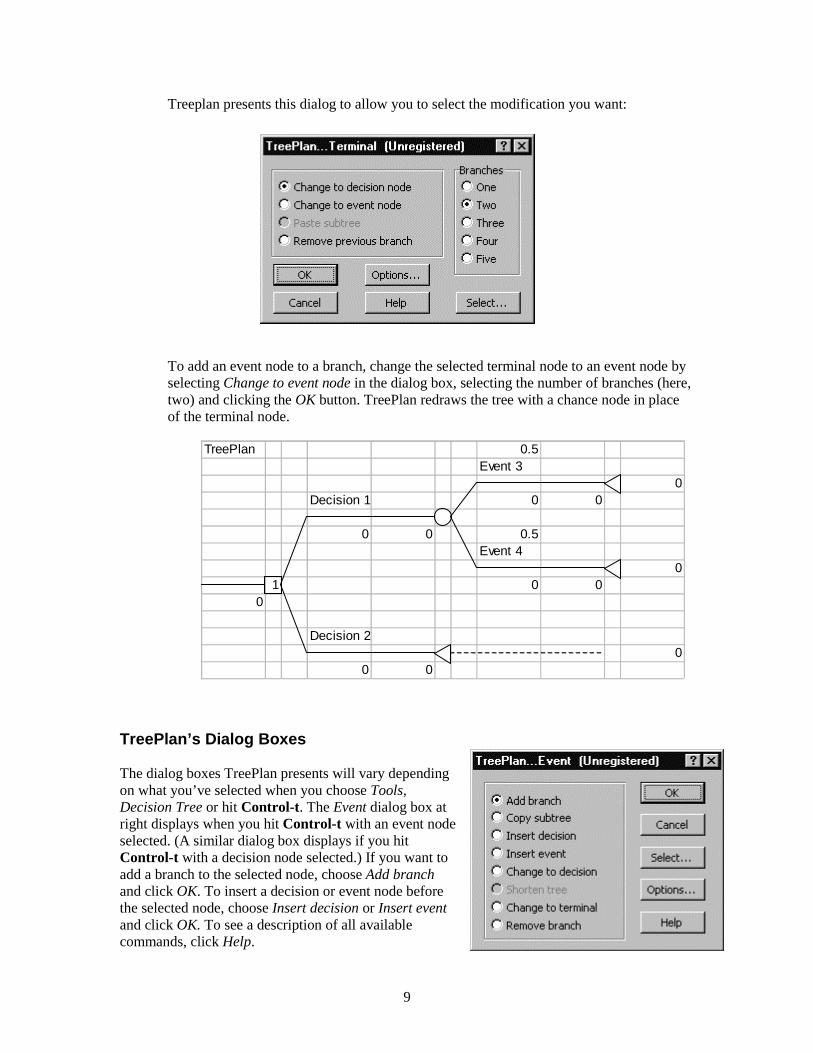
Treeplan presents this dialog to allow you to select the modification you want:
To add an event node to a branch, change the selected terminal node to an event node by selecting Change to event node in the dialog box, selecting the number of branches (here, two) and clicking the OK button. TreePlan redraws the tree with a chance node in place of the terminal node.
TreePlan’s Dialog Boxes The dialog boxes TreePlan presents will vary depending on what you’ve selected when you choose Tools, Decision Tree or hit Control-t. The Event dialog box at right displays when you hit Control-t with an event node selected. (A similar dialog box displays if you hit Control-t with a decision node selected.) If you want to add a branch to the selected node, choose Add branch and click OK. To insert a decision or event node before the selected node, choose Insert decision or Insert event and click OK. To see a description of all available commands, click Help.
TreePlan 0.5Event 3
0Decision 1 0 0
0 0 0.5Event 4
01 0 0
0
Decision 20
0 0

10
The Copy subtree Command The Copy subtree command is particularly useful when building large trees. If two or more parts of the tree are similar you can copy and paste “subtrees” rather than building up each part separately. To copy a subtree select the node at the root of the subtree, hit Control-t, choose Copy subtree, and then click OK. This tells TreePlan to copy the selected node and everything to the right of it in the tree. To paste the subtree from the Clipboard to another location on your tree, select a terminal node, hit Control-t, choose Paste subtree, and click OK. TreePlan duplicates the specified subtree at the terminal node you selected. Formatting Since a TreePlan decision tree is built directly in Excel, you can use Excel’s commands to format your tree. For example, you can use bold or italic fonts for branch labels by selecting the cells you want to format and changing them using Excel’s formatting commands. To help you, TreePlan provides a Select dialog box that appears when you choose Tools, Decision Tree or hit Control-t without a node selected.
The Select dialog box also appears if you click the Select button on the Node dialog box. From the Select dialog box you can select all items of a particular type in the tree. For example, if you choose Probabilities and click OK, TreePlan selects all the probabilities in the tree. You can then format all the probabilities simultaneously using Excel’s formatting commands. You can sometimes speed up formatting by formatting entire columns. Note that because of limitations in Excel, the Select dialog isn’t available when working with very large trees. Anatomy of a TreePlan Decision Tree An example of a TreePlan decision tree is shown below. In the example, a firm must decide whether to purchase an option on the defense market rights to a new flight safety system. The tree consists of decision nodes, event nodes, and terminal nodes connected by branches. Each branch is surrounded by cells containing formulas, cell references, or labels pertaining to that branch. You can edit the labels, probabilities, and partial cash flows associated with each branch. The

11
partial cash flows are the amount the firm “gets paid” to go down that branch. Here, the firm pays $125,000 if it decides to purchase the option and another $575,000 if it signs the license agreement.
Solving Trees Trees are “solved” using formulas embedded in the spreadsheet. The terminal values sum all the partial cash flows along the path leading to that terminal node. The tree is then “rolled back” by computing expected values at event nodes and by maximizing at decision nodes. The rollback EVs appear next to each node and show the expected value at that point in the tree. The numbers in the decision nodes indicate which alternative is optimal for that decision. In the example, the “1” in the decision node indicates that it’s optimal to “Purchase Option” because that alternative leads to the highest expected value ($100,000). Controlling Calculations TreePlan has a few options that control the way calculations are done in the tree. To select these options click the Options button in any of TreePlan’s dialog boxes. The first choice is between Use Expected Values and Use Exponential Utility Function. The default is to rollback the tree using expected values. If you choose to use the exponential utility function, Treeplan computes utilities of endpoint cash flows at the terminal nodes
0.25Win Second Contract
0.15 $10,500Win First Contract $7,000 $10,500
$4,200 $5,250 0.750.71 SublicenseLicense Agreement $3,500
$0 $3,500-$575 $193
0.85Purchase Option No Contract
-$700-$125 $100 $0 -$700
0.29No License Agreement
1 -$125$100 $0 -$125
Reject Purchase$0
$0 $0All d o llar amounts are thousand s ($00 0 ).
Decis io n Tree b ased o n AIL Examp le in Ulvila and Brown, "Decis io n Analys is Co mes o f Ag e", Harvard B us iness R eview , Sep temb er-Octo b er 19 8 2
PROBABILITIES: Enter numbers or formulas in these cell.
DECISION NODE: The number in the node indicates
EVENT NODES
TERMINAL NODES
PARTIAL CASH FLOWS: Enter numbers or formulas in these cell.
BRANCH LABELS: Type text in these cells
TERMINAL VALUES: Equal to sum of partial cash flows along path.
ROLLBACK EVs: Equal to the expected value at this point in the tree.

12
and then rolls back these utilities instead of expected values. Certainty equivalents are calculated in the cell above the expected utilities. You can also choose one of the options Maximize (profits) or Minimize (costs). The default is to maximize profits. If you choose to minimize costs instead, the cash flows are interpreted as costs and decisions are made by choosing the minimum expected value/utility rather than the maximum. TreePlan’s Online Help
To learn more about these features and any other TreePlan feature please see TreePlan’s online help file. Click the Help button from any TreePlan dialog box to see TreePlan’s Help pages. The contents of the TreePlan’s file is reproduced below.

13
TreePlan’s Online Help File TreePlan for Excel 1.58
Decision Tree Software Add-In for Microsoft Excel 4, 5, 7,and 97 for Windows and Macintosh TreePlan helps you build and modify decision tree diagrams in Excel worksheets. TreePlan automatically puts formulas on your worksheet for evaluating these trees. To build a new decision tree, first create a new worksheet. Then start TreePlan in one of two ways: (1) Choose Decision Tree... from the Options menu (Excel 4) or the Tools menu (Excel 5, 7, and 97), or (2) Press the shortcut key: Control + t. When the TreePlan...New dialog box appears, choose New Tree. TreePlan builds a tree diagram with an initial decision node and two branches. The tree diagram begins with the upper left corner of the diagram near the active cell at the time New... is chosen. TreePlan assigns the name TreeDiagram to the range of the tree diagram and initially sets Excel's Print_Area equal to TreeDiagram. To change the structure of the tree diagram, select a node, start TreePlan, and choose commands from a TreePlan dialog box. On the left side of each branch of the tree diagram, there is a name field above the branch line and a partial-cash-flow value field below the line. On the left side of event branches, there is also a probability field above the name field. Decision nodes also have a number in them indicating the optimal branch.
On the right side of each branch of the tree diagram, there is a rollback Expected Value field below the line near each node. TreePlan automatically puts the rollback EV formula into this cell: maximum of successor EVs at a decision node, and expected value of successor EVs at an event node.
To the right of the terminal nodes, there is an endpoint value field that sums all of the partial cashflows in the tree.
Internally, TreePlan uses the TreeData range, near cell GV1000, to construct the TreeDiagram.
14
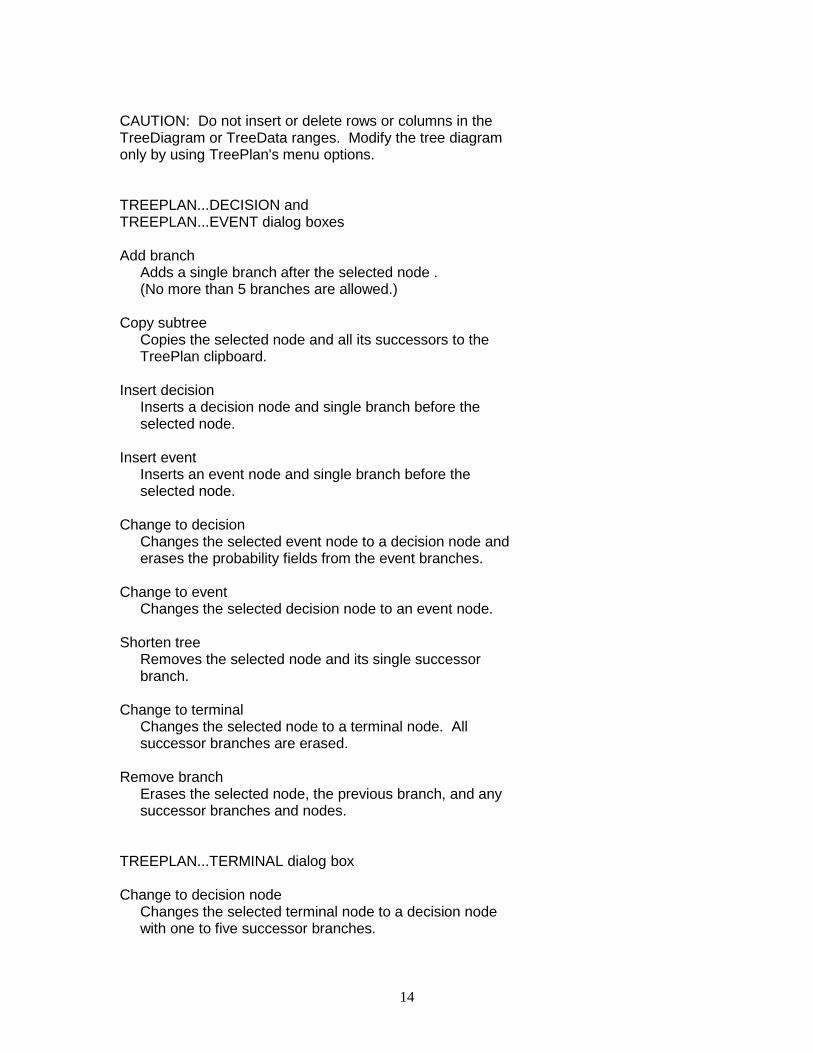
CAUTION: Do not insert or delete rows or columns in the TreeDiagram or TreeData ranges. Modify the tree diagram only by using TreePlan's menu options. TREEPLAN...DECISION and TREEPLAN...EVENT dialog boxes Add branch Adds a single branch after the selected node . (No more than 5 branches are allowed.) Copy subtree Copies the selected node and all its successors to the TreePlan clipboard. Insert decision Inserts a decision node and single branch before the selected node. Insert event Inserts an event node and single branch before the selected node. Change to decision Changes the selected event node to a decision node and erases the probability fields from the event branches. Change to event Changes the selected decision node to an event node. Shorten tree Removes the selected node and its single successor branch. Change to terminal Changes the selected node to a terminal node. All successor branches are erased. Remove branch Erases the selected node, the previous branch, and any successor branches and nodes. TREEPLAN...TERMINAL dialog box Change to decision node Changes the selected terminal node to a decision node with one to five successor branches.

15
Change to event node Changes the selected terminal node to an event node with one to five successor branches. Paste subtree Pastes the subtree onto the selected terminal node from the TreePlan clipboard. Remove previous branch Erases the selected terminal node and the previous branch. TREEPLAN...SELECT dialog box Cells To select a set of nonadjacent cells for subsequent formatting, select the appropriate option button. (In large trees, this option may not be available.) Objects To select all objects, choose Select Special from the Formula menu, and select the Objects option button. (In large trees, this option may not be available.) Columns To select a set of nonadjacent columns for subsequent formatting, select the appropriate option button. TREEPLAN...OPTIONS dialog box Certainty Equivalents The default is to rollback the tree using expected values. If you chose to use exponential utilities, TreePlan will compute utilities and certainty equivalents at each node. For the Maximize option, the rollback formulas are U=A-B*EXP(-X/RT) and X=-LN((A-U)/B)*RT, and for the Minimize option, U=A-B*EXP(X/RT) and X=LN((A-U)/B)*RT.
NOTE: TreePlan uses the name RT to represent the risk tolerance parameter of the exponential utility function; the names A and B determine scaling. If the names A, B, and RT don't exist, they are initially defined as A=1, B=1, and RT=999999999999. The name UseExpUtility is a flag indicating whether to use exponential utilities or expected values.
Decision Node EV/CE Choices The default is to Maximize profits. If you choose to

16
Minimize costs instead, the cash flows are interpreted as costs, and decisions are made by choosing the minimum expected value/CE rather than the maximum. TreePlan uses the name MinimizeCosts as a flag indicating whether to maximize profits or minimize costs.
ACKNOWLEDGMENT
Sincere thanks to Professor James E. Smith, Duke University, for adding exponential utility and several other features.
TREEPLAN REGISTRATION TreePlan is distributed as shareware and may be provided at no charge to the user for evaluation. If you find this program useful and continue to use TreePlan after a 30-day evaluation period, you must make a registration payment to Decision Support Services. The registration fee will license one copy for use on any one computer at any one time. Upon registering TreePlan, you will be sent by postal mail a disk containing the most recent version of the software and documentation. The registered TreePlan package has a 30-day money-back guarantee. Registered users will be notified of the next major version and are entitled to unlimited technical support via postal mail, Compuserve 71330,3445, or Internet: [email protected]. A site license agreement is required to use TreePlan on a computer network, and academic pricing is available. Please contact Decision Support Services for details. An evaluation copy of TreePlan and other information may be obtained from the Decision Support Services web site: http://ourworld.compuserve.com/homepages/decision

17
TREEPLAN REGISTRATION BY CHECK The registration fee for TreePlan is $29.00 (California residents, add sales tax) plus $4.00 shipping to U.S. and Canada, $6.00 elsewhere. Make money order or check (in U.S. funds drawn on a U.S. bank) payable to Decision Support Services, and mail to: Decision Support Services Voice/Fax (415) 673-6217 2105 Buchanan Street, #1 Compuserve 71330,3445 San Francisco, CA 94115
TREEPLAN REGISTRATION BY CREDIT CARD
You can order with MC, Visa, Amex, or Discover from Public (software) Library by calling 800-2424-PsL or 713-524-6394 or by fax to 713-524-6398 or by Compuserve Email to 71355,470. You can also mail credit card orders to PsL at P.O. Box 35705, Houston, TX 77235-5705.
The above numbers are for orders only. The author cannot be reached at these PsL phone numbers.
Any questions about the status of the shipment of the order, refunds, registration options, product details, technical support, volume discounts, dealer pricing, site licenses, non-credit card orders, etc., must be directed to 415-673-6217 (Voice/Fax), Compuserve 71330,3445, or Decision Support Services, 2105 Buchanan Street, #1, San Francisco, CA 94115.
To insure that you get the latest version, PsL will notify us the day of your order, and we will ship the product directly to you. PsL has assigned item/product #11325 to TreePlan for Excel. The prices are $33 US/Canada and $35 overseas.
TREEPLAN DISTRIBUTION Please share copies of TreePlan freely with prospective users. You are granted permission to make as many copies as you wish. Do not distribute copies that have been altered. Disk vendors, bulletin boards, other distributors, and individuals may distribute TreePlan as long as you clearly explain the shareware concept, the need for users to register the products they use, and the fact that the price of

18
your disks/CD-ROM/service is a copying fee only and does not constitute payment for the product. Please direct questions about volume discounts, dealer pricing, rack vending, book bundling, or other distribution methods to 415-673-6217 (Voice/Fax), Compuserve 71330,3445, or Decision Support Services, 2105 Buchanan Street, #1, San Francisco, CA 94115. ABOUT SHAREWARE Shareware is a method of distributing software that gives you a chance to try software before buying it. If you try a shareware program and continue using it, you are expected to register. Individual programs differ on the details about the evaluation period, registration fee, and support. Copyright laws apply to both shareware and commercial software, and the copyright holder may choose to retain all rights. The only meaningful difference between shareware and commercial software is the method of distribution. Shareware authors specifically grant the rights to copy and distribute the software and documentation, either to all users and by all methods, or with some restrictions. You should try to find software that suits your needs and budget, whether it's commercial or shareware. Both types have good programs and bad, but shareware makes finding the right program easier, because you can try before you buy. Also, because shareware distribution costs are much lower, shareware prices are often lower, too. Finally, shareware has the ultimate money-back guarantee: if you don't use it, you don't pay for it. ASP OMBUDSMAN INFORMATION This program is produced by a member of the Association of Shareware Professionals (ASP). ASP wants to make sure that the shareware principle works for you. If you are unable to resolve a shareware-related problem with an ASP member by contacting the member directly, ASP may be able to help. The ASP Ombudsman can help you resolve a dispute or problem with an ASP member, but does not provide technical support for members' products. Please write to the ASP Ombudsman at 545 Grover Road, Muskegon, MI 49442-9427, Fax 616-788-2765, or send a Compuserve message via Compuserve Mail to ASP Ombudsman 70007,3536.
19
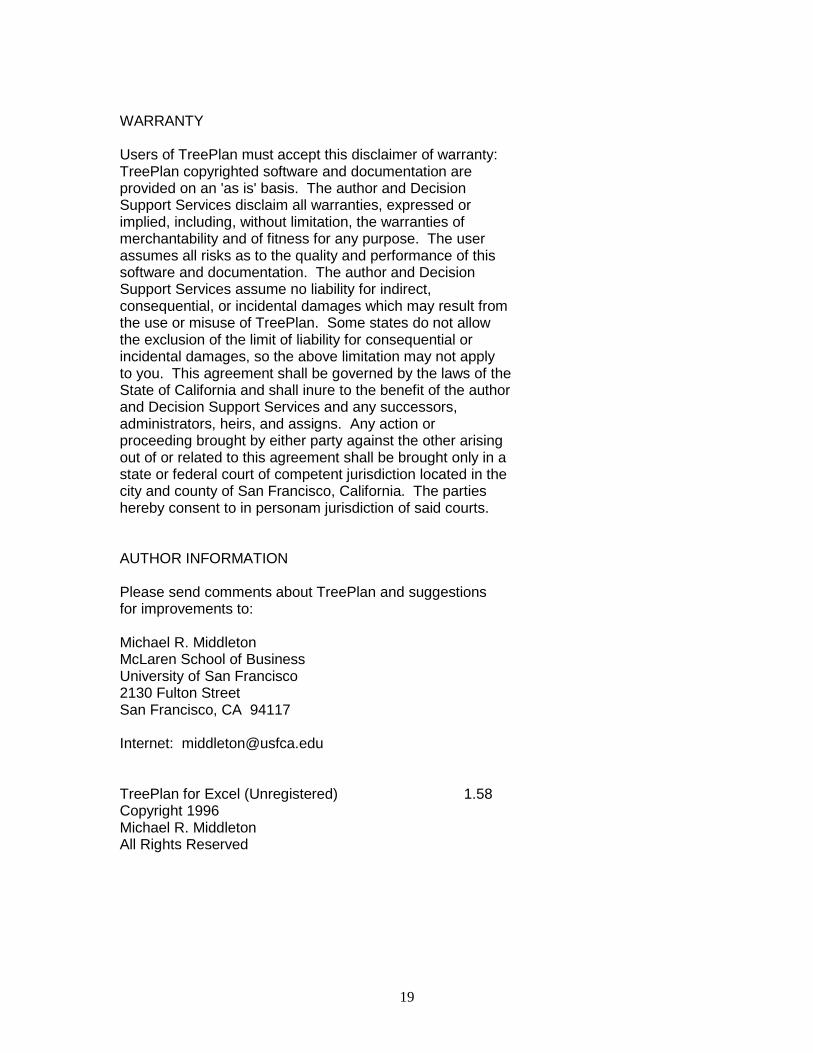
WARRANTY Users of TreePlan must accept this disclaimer of warranty: TreePlan copyrighted software and documentation are provided on an 'as is' basis. The author and Decision Support Services disclaim all warranties, expressed or implied, including, without limitation, the warranties of merchantability and of fitness for any purpose. The user assumes all risks as to the quality and performance of this software and documentation. The author and Decision Support Services assume no liability for indirect, consequential, or incidental damages which may result from the use or misuse of TreePlan. Some states do not allow the exclusion of the limit of liability for consequential or incidental damages, so the above limitation may not apply to you. This agreement shall be governed by the laws of the State of California and shall inure to the benefit of the author and Decision Support Services and any successors, administrators, heirs, and assigns. Any action or proceeding brought by either party against the other arising out of or related to this agreement shall be brought only in a state or federal court of competent jurisdiction located in the city and county of San Francisco, California. The parties hereby consent to in personam jurisdiction of said courts. AUTHOR INFORMATION Please send comments about TreePlan and suggestions for improvements to: Michael R. Middleton McLaren School of Business University of San Francisco 2130 Fulton Street San Francisco, CA 94117 Internet: [email protected] TreePlan for Excel (Unregistered) 1.58 Copyright 1996 Michael R. Middleton All Rights Reserved


![[XLS]faculty.fuqua.duke.edupecklund/ExcelReview/... · Web viewCharting Data Tables Formulas Basic Editing Formatting Naming Ranges Introduction cement Interest_rate Principal SALES](https://static.documents.pub/doc/80x56/5b1fc4777f8b9a20508b5601/xls-pecklundexcelreview-web-viewcharting-data-tables-formulas-basic-editing.jpg)


