(All amounts in ` million, unless otherwise stated) Notes to the Financial Statements 170 MARUTI SUZUKI INDIA LIMITED 1. Summary of Significant Accounting Policies 1.1 General Information The Company is primarily in the business of manufacturing, purchase and sale of motor vehicles, components and spare parts (“automobiles”). The other activities of the Company comprise facilitation of Pre-Owned Car sales, Fleet Management and Car Financing. The Company is a public company listed on the Bombay Stock Exchange (BSE) and the National Stock Exchange (NSE). 1.2 Basis for Preparation of Financial Statements These financial statements have been prepared as a going concern in accordance with the generally accepted accounting principles in India under the historical cost convention on an accrual basis and comply in all material aspects with the Companies Act, 2013, applicable rules and other relevant provisions of the Companies Act, 2013 and Accounting Standard 30, Financial Instruments: Recognition and Measurement issued by the Institute of Chartered Accountants of India to the extent it does not contradict with any other accounting standard referred to in the Companies Act, 2013. All assets and liabilities have been classified as current or non-current according to the Company’s operating cycle and other criteria set out in the Companies Act, 2013. Based on the nature of products and the time between the acquisition of assets for processing and their realisation in cash and cash equivalents, the Company has ascertained its operating cycle as 12 months for the purpose of current – non current classification of assets and liabilities. The Ministry of Corporate Affairs (MCA) has notified the Companies (Accounting Standards) Amendment Rules, 2016 vide its notification dated March 30, 2016, which is interpreted to apply to the accounting period commencing on or aſter the date of notification i.e. 1st April, 2016. 1.3 Revenue Recognition Revenue is recognised as follows: (a) Domestic and export sales on transfer of significant risks and rewards to the customer which takes place on dispatch of goods from the factory and port respectively. (b) Income from services on completion of rendering of services. 1.4 Fixed Assets Tangible Assets a) Fixed assets (except freehold land which is carried at cost) are carried at cost of acquisition or construction or at manufacturing cost (in case of own manufactured assets) in the year of capitalisation less accumulated depreciation. b) Assets acquired under finance leases are capitalised at the lower of their fair value and the present value of minimum lease payments. Intangible Assets Lumpsum royalty is stated at cost incurred stated in the relevant licence agreements with the technical know-how / engineering support provider less accumulated amortisation. 1.5 Borrowing Costs Borrowing costs that are directly attributable to the acquisition, construction or production of qualifying assets, which are assets that necessarily take a substantial period of time to get ready for their intended use or sale, are added to the cost of those assets, until such time as the assets are substantially ready for their intended use or sale. 1.6 Depreciation / Amortisation a) Tangible fixed assets except leasehold land are depreciated on the straight line method on a pro-rata basis from the month in which each asset is put to use. Depreciation has been provided in accordance with useful lives prescribed in the Companies Act, 2013 except for certain fixed assets where, based on technical evaluation of the useful lives of the assets, higher depreciation has been provided on the straight line method over the following useful lives: Plant and Machinery 8 - 11 Years Dies and Jigs 4 Years Electronic Data Processing Equipment 3 Years In respect of assets whose useful lives has been revised, the unamortised depreciable amount is charged over the revised remaining useful lives of the assets. b) Leasehold land is amortised over the period of lease. c) All assets, the individual written down value of which at the beginning of the year is ` 5,000 or less, are depreciated at the rate of 100%. Assets purchased during the year costing ` 5,000 or less are depreciated at the rate of 100%. d) Lump sum royalty is amortised on a straight line basis over its estimated useful life i.e. 4 years from the start of production of the related model. 1.7 Inventories a) Inventories are valued at the lower of cost, determined on the weighted average basis and net realisable value. b) The cost of finished goods and work in progress comprises raw materials, direct labour, other direct costs and related production overheads. Net realisable value is the estimated selling price in the ordinary course of business, less the estimated costs of completion and the estimated costs necessary to make the sale.
Transcript
(All amounts in ` million, unless otherwise stated)
Notes to the Financial Statements
170 MARUTI SUZUKI INDIA LIMITED
1. Summary of Significant Accounting Policies
1.1 General InformationThe Company is primarily in the business of manufacturing, purchase and sale of motor vehicles, components and spare parts (“automobiles”). The other activities of the Company comprise facilitation of Pre-Owned Car sales, Fleet Management and Car Financing. The Company is a public company listed on the Bombay Stock Exchange (BSE) and the National Stock Exchange (NSE).
1.2 Basis for Preparation of Financial StatementsThese financial statements have been prepared as a going concern in accordance with the generally accepted accounting principles in India under the historical cost convention on an accrual basis and comply in all material aspects with the Companies Act, 2013, applicable rules and other relevant provisions of the Companies Act, 2013 and Accounting Standard 30, Financial Instruments: Recognition and Measurement issued by the Institute of Chartered Accountants of India to the extent it does not contradict with any other accounting standard referred to in the Companies Act, 2013.
All assets and liabilities have been classified as current or non-current according to the Company’s operating cycle and other criteria set out in the Companies Act, 2013. Based on the nature of products and the time between the acquisition of assets for processing and their realisation in cash and cash equivalents, the Company has ascertained its operating cycle as 12 months for the purpose of current – non current classification of assets and liabilities.
The Ministry of Corporate Affairs (MCA) has notified the Companies (Accounting Standards) Amendment Rules, 2016 vide its notification dated March 30, 2016, which is interpreted to apply to the accounting period commencing on or after the date of notification i.e. 1st April, 2016.
1.3 Revenue RecognitionRevenue is recognised as follows:(a) Domestic and export sales on transfer of significant risks and rewards to the customer which takes place on dispatch of goods from the factory and port respectively.
(b) Income from services on completion of rendering of services.
1.4 Fixed AssetsTangible Assetsa) Fixed assets (except freehold land which is carried at cost) are carried at cost of acquisition or construction or at manufacturing cost (in case of own manufactured assets) in the year of capitalisation less accumulated depreciation.
b) Assets acquired under finance leases are capitalised at the lower of their fair value and the present value of minimum lease payments.
Intangible AssetsLumpsum royalty is stated at cost incurred stated in the relevant licence agreements with the technical know-how / engineering support provider less accumulated amortisation.
1.5 Borrowing CostsBorrowing costs that are directly attributable to the acquisition, construction or production of qualifying assets, which are assets that necessarily take a substantial period of time to get ready for their intended use or sale, are added to the cost of those assets, until such time as the assets are substantially ready for their intended use or sale.
1.6 Depreciation / Amortisationa) Tangible fixed assets except leasehold land are depreciated on the straight line method on a pro-rata basis from the month in which each asset is put to use.
Depreciation has been provided in accordance with useful lives prescribed in the Companies Act, 2013 except for certain fixed assets where, based on technical evaluation of the useful lives of the assets, higher depreciation has been provided on the straight line method over the following useful lives:
Plant and Machinery 8 - 11 YearsDies and Jigs 4 YearsElectronic Data Processing Equipment 3 Years
In respect of assets whose useful lives has been revised, the unamortised depreciable amount is charged over the revised remaining useful lives of the assets.
b) Leasehold land is amortised over the period of lease.
c) All assets, the individual written down value of which at the beginning of the year is ` 5,000 or less, are depreciated at the rate of 100%. Assets purchased during the year costing ` 5,000 or less are depreciated at the rate of 100%.
d) Lump sum royalty is amortised on a straight line basis over its estimated useful life i.e. 4 years from the start of production of the related model.
1.7 Inventoriesa) Inventories are valued at the lower of cost, determined on the weighted average basis and net realisable value.
b) The cost of finished goods and work in progress comprises raw materials, direct labour, other direct costs and related production overheads. Net realisable value is the estimated selling price in the ordinary course of business, less the estimated costs of completion and the estimated costs necessary to make the sale.
(All amounts in ` million, unless otherwise stated)
STANDALONE FINANCIAL STATEMENTS | NOTES TO THE FINANCIAL STATEMENTS 171
c) Loose tools are written off over a period of three years except for tools valued at ` 5,000 or less individually which are charged to revenue in the year of purchase.
d) Machinery spares (other than those supplied along with main plant and machinery, which are capitalised and depreciated accordingly) are charged to revenue on consumption except those valued at ` 5,000 or less individually, which are charged to revenue in the year of purchase.
1.8 InvestmentsInvestments that are readily realisable and are intended to be held for not more than one year from the date, on which such investments are made, are classified as current investments. All other investments are classified as long term investments. Current investments are valued at the lower of cost and fair value. Long-term investments are valued at cost except in the case of other than temporary decline in value, in which case the necessary provision is made.
1.9 Research and Development Revenue expenditure on research and development is charged against the profit for the year in which it is incurred. Capital expenditure on research and development is shown as an addition to fixed assets and depreciated accordingly.
1.10 Foreign Currency Translations and Derivative Instrumentsa) Foreign currency transactions are recorded at the exchange rates prevailing at the date of the transactions. Exchange differences arising on settlement of transactions are recognised as income or expense in the year in which they arise.
b) At the balance sheet date, all monetary assets and liabilities denominated in foreign currency are reported at the exchange rates prevailing at the balance sheet date by recognising the exchange difference in the Statement of Profit and Loss. However, the exchange difference arising on foreign currency monetary items that qualify and are designated as hedge instruments in a cash flow hedge is initially recognised in ‘hedge reserve’ and subsequently transferred to the Statement of Profit and Loss on occurrence of the underlying hedged transaction.
c) Effective 1st April, 2008, the Company adopted Accounting Standard-30, “Financial Instruments: Recognition and Measurement” issued by The Institute of Chartered Accountants of India to the extent the adoption does not contradict with the accounting standards specified under section 133 of the Companies Act, 2013 (“the Act”) and other regulatory requirements. All derivative contracts (except for forward foreign exchange contracts where underlying assets or liabilities exist) are fair valued at each reporting date. For derivative contracts designated in a hedging relationship, the Company records the gain or loss on effective hedges, if any, in a hedge reserve, until the transaction is complete. On completion, the gain or
loss is transferred to the Statement of Profit and Loss of that period. Changes in fair value relating to the ineffective portion of the hedges and derivatives not qualifying or not designated as hedges are recognised in the Statement of Profit and Loss in the accounting period in which they arise.
d) In the case of forward foreign exchange contracts where an underlying asset or liability exists, the difference between the forward rate and the exchange rate at the inception of the contract is recognised as income or expense over the life of the contract. Exchange differences on such contracts are recognised in the Statement of Profit and Loss in the reporting period in which the exchange rates change. Any profit or loss arising on cancellation or renewal of a forward contract is recognised as income or expense in the year in which such cancellation or renewal is made.
1.11 Employee Benefit CostsShort - Term Employee Benefits: Recognised as an expense at the undiscounted amount in the Statement of Profit and Loss for the year in which the related service is rendered.
Post-employment and Other Long Term Employee Benefits:(i) The Company has Defined Contribution Plans for post-employment benefit namely the Superannuation Fund which is recognised by the income tax authorities. This Fund is administered through a Trust set up by the Company and the Company’s contribution thereto is charged to the Statement of Profit and Loss every year. The Company also maintains an insurance policy to fund a post-employment medical assistance scheme, which is a Defined Contribution Plan administered by The New India Insurance Company Limited. The Company’s contribution to State Plans namely Employees’ State Insurance Fund and Employees’ Pension Scheme are charged to the Statement of Profit and Loss every year.
(ii) The Company has Defined Benefit Plans namely Gratuity, Provident Fund & Retirement Allowance for employees and Other Long Term Employee Benefits i.e. Leave Encashment / Compensated Absences, the liability for which is determined on the basis of an actuarial valuation at the end of the year based on the Projected Unit Credit Method and any shortfall in the size of the fund maintained by the Trust is additionally provided for in the Statement of Profit and Loss. The Gratuity Fund and Provident Fund are recognised by the income tax authorities and are administered through Trusts set up by the Company.
Termination benefits are immediately recognised as an expense as and when incurred.
Gains and losses arising out of actuarial valuations are recognised immediately in the Statement of Profit and Loss as income or expense.
(All amounts in ` million, unless otherwise stated)
Notes to the Financial Statements
172 MARUTI SUZUKI INDIA LIMITED
1.12 Customs DutyCustoms duty available as drawback is initially recognised as purchase cost and is credited to consumption of materials on exported vehicles.
1.13 Government GrantsGovernment grants are recognised in the Statement of Profit and Loss in accordance with the related schemes and in the period in which these accrue.
1.14 TaxesTax expense for the year, comprising current tax and deferred tax, is included in determining the net profit or loss for the year.
Current tax is measured at the amount expected to be paid to the tax authorities in accordance with the Income Tax Act and at the prevailing tax rates.
Deferred tax is recognised for all timing differences, subject to the consideration of prudence in respect of deferred tax assets. Deferred tax assets are recognised and carried forward only to the extent there is a reasonable certainty that sufficient future taxable income will be available against which such deferred tax assets can be realised. Deferred tax assets and liabilities are measured using the tax rates and tax laws that have been enacted or substantively enacted by the Balance Sheet date. In situations, where the Company has unabsorbed depreciation or carry forward losses under tax laws, all deferred tax assets are recognised only to the extent that there is virtual certainty supported by convincing evidence that they can be realised against future taxable profits. At each Balance Sheet date, the Company reassesses unrecognised deferred tax assets, if any.
Minimum Alternate Tax (MAT), paid in accordance with the Income Tax Act, 1961 gives rise to expected future economic benefit in the form of adjustment of future tax liability arising within a specified period, is recognised as an asset only to the extent there is convincing evidence that the Company will pay normal income tax during the specified period. Such asset is reviewed at each balance sheet date and the carrying amount of the MAT credit asset is written down to the extent there is no longer convincing evidence to the effect that the Company will pay normal income tax during the specified period.
1.15 Dividend IncomeDividend from investments is recognised when the right to receive the payment is established and when no significant uncertainty as to measurability or collectability exits.
1.16 Interest IncomeInterest income is recognised on the time proportion basis determined by the amount outstanding and the rate applicable and where no significant uncertainty as to measurability or collectability exists.
1.17 Impairment of AssetsAt each Balance Sheet date, the Company assesses whether there is any indication that an asset may be impaired. If any such indication exists, the Company estimates the recoverable amount. If the carrying amount of the asset exceeds its recoverable amount, an impairment loss is recognised in the Statement of Profit and Loss to the extent the carrying amount exceeds the recoverable amount.
1.18 Royaltya) The Company pays / accrues for royalty in accordance with the relevant licence agreements with the technical know-how provider.
b) The lump sum royalty incurred towards obtaining technical assistance/technical know-how and engineering support to manufacture a new model/ car, ownership of which rests with the technical know-how provider, is recognised as an intangible asset. Royalty payable on sale of products i.e. running royalty is charged to the Statement of Profit and Loss as and when incurred.
1.19 Provisions and ContingenciesProvisions: Provisions are recognised when there is a present obligation as a result of a past event, it is probable that an outflow of resources embodying economic benefits will be required to settle the obligation and there is a reliable estimate of the amount of the obligation. Provisions are measured at the best estimate of the expenditure required to settle the present obligation at the balance sheet date and are not discounted to their present value.
Contingent Liabilities: Contingent liabilities are disclosed when there is a possible obligation arising from past events, the existence of which will be confirmed only by the occurrence or non occurrence of one or more uncertain future events not wholly within the control of the Company or a present obligation that arises from past events where it is either not probable that an outflow of resources will be required to settle or a reliable estimate of the amount cannot be made.
1.20 LeasesAs a lesseeLeases in which a significant portion of the risks and rewards of ownership are retained by the lessor are classified as operating leases. Payments made under operating leases are charged to the Statement of Profit and Loss on a straight-line basis over the period of the lease or the terms of underlying agreement/s, as the case may be.
As a lessorThe Company has leased certain tangible assets and such leases where the Company has substantially retained all the risks and rewards of ownership are classified as operating leases. Lease income on such operating leases are recognised in the Statement of Profit and Loss on a straight line basis over the
(All amounts in ` million, unless otherwise stated)
STANDALONE FINANCIAL STATEMENTS | NOTES TO THE FINANCIAL STATEMENTS 173
lease term which is representative of the time pattern in which benefit derived from the use of the leased asset is diminished.
1.21 Cash and Cash EquivalentsIn the Cash Flow Statement, cash and cash equivalents include cash in hand, demand deposits with banks, other short-term highly liquid investments with original maturities of three months or less.
1.22 Earnings per Share Basic earnings per share are calculated by dividing the net profit or loss for the period attributable to equity shareholders by the weighted average number of equity shares outstanding during
the period. Earnings considered in ascertaining the Company’s earnings per share consist of the net profit for the period and any attributable tax thereon. The weighted average number of equity shares outstanding during the period and for all periods presented is adjusted for events other than the conversion of potential equity shares that have changed the number of equity shares outstanding, without a corresponding change in resources. For the purpose of calculating diluted earnings per share, the net profit or loss for the period attributable to equity shareholders and the weighted average number of shares outstanding during the period are adjusted for the effects of all dilutive potential equity shares.
2 Share Capital
As at 31.03.2016
As at 31.03.2015
Authorised Capital3,744,000,000 equity shares of ` 5 each (previous year 3,744,000,000 equity shares of ` 5 each) 18,720 18,720Issued, Subscribed and Paid up 302,080,060 equity shares of ` 5 each (previous year 302,080,060 equity shares of ` 5 each) fully paid up
1,510 1,510
1,510 1,510
Reconciliation of the number of sharesAs at 31.03.2016 As at 31.03.2015
Number of Shares Amount Number of
Shares Amount
Balance as at the beginning of the year 302,080,060 1,510 302,080,060 1,510Balance as at the end of the year 302,080,060 1,510 302,080,060 1,510
Equity shares held by the holding company As at 31.03.2016 As at 31.03.2015
Number of Shares Amount Number of
Shares Amount
Suzuki Motor Corporation, the holding company 169,788,440 849 169,788,440 849 169,788,440 849 169,788,440 849
Rights, preferences and restrictions attached to shares The Company has one class of equity shares having a par value of ` 5 per share. Each shareholder is eligible for one vote per share held. The dividend proposed by the Board of Directors is subject to the approval of the shareholders in the ensuing Annual General Meeting, except in case of interim dividend. In the event of liquidation, the equity shareholders are eligible to receive the remaining assets of the Company after distribution of all preferential amounts, in proportion to their shareholding.
(All amounts in ` million, unless otherwise stated)
Notes to the Financial Statements
174 MARUTI SUZUKI INDIA LIMITED
Shares held by each shareholder holding more than 5% of the aggregate shares in the Company
%Number of
Shares%
Number of Shares
Suzuki Motor Corporation (the holding company) 56.21 169,788,440 56.21 169,788,440Life Insurance Corporation of India 5.75 17,382,016 5.94 17,932,030
Shares allotted as fully paid up pursuant to contract(s) without payment being received in cash (during 5 years immediately preceding 31st March, 2016): 13,170,000 Equity Shares of ` 5 each have been allotted as fully paid up during Financial Year 2012-13 to Suzuki Motor Corporation pursuant to the Company’s scheme of amalgamation with erstwhile Suzuki Powertrain India Limited.
3 Reserves and Surplus
As at 31.03.2016
As at 31.03.2015
Reserve created on Amalgamation 9,153 9,153 Securities Premium Account 4,241 4,241 General ReserveBalance as at the beginning of the year 24,738 21,027 Add: Transferred from Surplus in Statement of Profit and Loss during the year 4,571 3,711Balance as at the end of the year 29,309 24,738Hedge ReserveBalance as at the beginning of the year 32 - Add / (Less): Released / recognised during the year 40 32Balance as at the end of the year 72 32 Surplus in Statement of Profit and LossBalance as at the beginning of the year 197,368 173,849Impact of revision of useful lives of certain fixed assets (Refer Note 12)
- (792)
Add: Profit for the year 45,714 37,112 Less: Appropriations: Transferred to General Reserve 4,571 3,711 Proposed dividend 10,573 7,552 Dividend distribution tax 2,152 1,538Balance as at the end of the year 225,786 197,368
268,561 235,532
4 Long Term Borrowings (Refer Note 10)
As at 31.03.2016
As at 31.03.2015
UnsecuredForeign currency loans from banks - 869 Loan from holding company - 579
- 1,448
(All amounts in ` million, unless otherwise stated)
STANDALONE FINANCIAL STATEMENTS | NOTES TO THE FINANCIAL STATEMENTS 175
1. Foreign currency loans from banks include: Loan amounting to ` 921 million (USD 13.90 million) (previous year ` 1,738 million; USD 27.80 million) taken from Japan Bank of International Cooperation (JBIC) at an interest rate of LIBOR + 0.125, repayable in 2 half yearly instalments (acquired pursuant to a scheme of amalgamation). The entire amount of ` 921 million (previous year ` 869 million) repayable within one year has been transferred to current maturities of long term debts. The repayment of the loan is guaranteed by Suzuki Motor Corporation, Japan (the holding company).
Loan amounting to ` Nil (Previous year ` 1,906 million) (USD 30 million) taken from banks at an average interest rate of Libor + 1.375 and repaid in July 2015.
2. A loan amounting to ` 614 million (USD 9.27 million) (previous year ` 1,158 million; USD 18.53 million) taken from the holding company at an interest rate of LIBOR + 0.48, repayable in 2 half yearly instalments (acquired pursuant to a scheme of amalgamation). The entire amount of ` 614 million (previous year ` 579 million) repayable within one year has been transferred to current maturities of long term debts.
5 Deferred Tax Liabilities (Net)
Major components of deferred tax arising on account of timing differences along with their movement as at 31st March, 2016 are:
As at 31.03.2015
Movement during the year*
As at 31.03.2016
Deferred Tax AssetsProvision for doubtful debts / advances 94 (25) 69Contingent provisions (net of amount paid) 224 (35) 189Others 744 511 1,255Total (A) 1,062 451 1,513Deferred Tax LiabilitiesDepreciation on fixed assets 5,345 (650) 4,695Exchange gain on capital accounts (91) 65 (26)Allowances under Income Tax Act, 1961 618 967 1,585Total (B) 5,872 382 6,254Net Deferred Tax Liability (B) - (A) 4,810 (69) 4,741Previous Year 5,866 (1,056) 4,810* Includes adjustment of ` 709 million (Previous year ` 105 million) on account of reclassification to “Deferred Tax Liabilities” from “Provision for Taxation” and adjustment on account of change in useful live of fixed assets of ` Nil (previous year `409 million) (reversal of deferred tax liabilities) adjusted with retained earning. (Refer Note 12)Note: Deferred Tax Assets and Deferred Tax Liabilities have been offset as they are governed by the same taxation laws.
6 Other Long Term Liabilities
As at 31.03.2016
As at 31.03.2015
Deposits from dealers, contractors and others 1,224 1,054 1,224 1,054
(All amounts in ` million, unless otherwise stated)
Notes to the Financial Statements
176 MARUTI SUZUKI INDIA LIMITED
7 Long Term Provisions
As at 31.03.2016
As at 31.03.2015
Provisions for Employee BenefitsProvision for retirement allowance (Refer Note 28) 56 53 Other ProvisionsProvision for litigation / disputes 1,645 2,081 Provision for warranty & product recall 1,319 783 Others - 2,964 9 2,873
3,020 2,926
Details of Other Provisions:Litigation / Disputes Warranty/ Product Recall Others
2015-2016 2014-2015 2015-2016 2014-2015 2015-2016 2014-2015Balance as at the beginning of the year 2,081 1,121 1,071 1,307 9 8 Additions during the year 134 1,110 919 806 - 3 Utilised/ reversed during the year 570 150 155 1,042 9 2 Balance as at the end of the year 1,645 2,081 1,835 1,071 - 9 Classified as Long Term 1,645 2,081 1,319 783 - 9 Classified as Short Term - - 516 288 - - Total 1,645 2,081 1,835 1,071 - 9 a) Provision for litigation / disputes represents the estimated outflow in respect of disputes with various government authorities. b) Provision for warranty and product recall represents the estimated outflow in respect of warranty and recall cost for products sold. c) Provision for others represents the estimated outflow in respect of disputes or other obligations on account of export obligation, etc. d) Due to the nature of the above costs, it is not possible to estimate the timing / uncertainties relating to their outflows as well as the expected reimbursements from such estimates.
8 Short Term Borrowings
As at 31.03.2016
As at 31.03.2015
UnsecuredFrom banks - cash credit and overdraft 774 354
774 354
9 Trade Payables
As at 31.03.2016
As at 31.03.2015
Total outstanding dues of micro enterprises and small enterprises 533 590Total outstanding dues of creditors other than micro enterprises and small enterprises 69,600 53,591
70,133 54,181
(All amounts in ` million, unless otherwise stated)
STANDALONE FINANCIAL STATEMENTS | NOTES TO THE FINANCIAL STATEMENTS 177
The Company pays its vendors within 30 days and no interest during the year has been paid or is payable under the terms of the Micro, Small and Medium Enterprises Development Act, 2006.
10 Other Current Liabilities
As at 31.03.2016
As at 31.03.2015
Current maturities of long term debts (Refer Note 4) 1,535 3,354Interest accrued but not due on:- Borrowings - 254- Deposits from dealers, contractors and others 228 228 80 334Unclaimed dividend * 7 6Creditors for capital goods and services 6,203 5,695Other payables 4,075 2,664Book overdraft 584 590Advances from customers/dealers 5,213 4,253Statutory dues 3,641 2,903Deposits from dealers, contractors and others 2,162 21,878 275 16,380
23,648 20,074* There are no amount due for payment to the Investor Education and Protection Fund under Section 205C of the Companies Act, 1956 as at year end.
11 Short Term Provisions
As at 31.03.2016
As at 31.03.2015
Provisions for Employee Benefits (Refer Note 7 and 28)Provision for retirement allowances 2 1Provision for compensated absences 2,101 2,103 1,830 1,831Other Provisions (Refer Note 7)Provision for warranty & product recall 516 288Provision for proposed dividend* 10,573 7,552Provision for corporate dividend tax 2,152 1,538Provision for taxation [Net of tax paid ` 107,670 million (Previous year ` 88,571 million) and Minimum Alternate Tax credit available ` 1,608 million (previous year ` 1,608 million)]
3,001 16,242 2,395 11,773
18,345 13,604* The final dividend proposed for the year is as follows:
As at 31.03.2016
As at 31.03.2015
On equity shares of ` 5 each: Amount of dividend proposed 10,573 7,552 Dividend per equity share ` 35.00 ` 25.00
178 MARUTI SUZUKI INDIA LIMITED(A
ll am
ount
s in
` m
illio
n, u
nles
s ot
herw
ise
stat
ed)
Notes to the Financial Statements12
Tang
ible
Ass
ets
Gros
s Bl
ock
Depr
ecia
tion
/ Am
ortis
atio
nNe
t Blo
ck
Part
icul
ars
As a
t 01
.04.
2015
Addi
tions
Dedu
ctio
ns/
Adju
stm
ents
#As
at
31.0
3.20
16Up
to
01.0
4.20
15Fo
r the
ye
arDe
duct
ions
/ Ad
just
men
tsAs
at
31.0
3.20
16As
at
31.0
3.20
16As
at
31.0
3.20
15
Ow
n As
sets
(Acq
uire
d):
Free
hold
Lan
d (N
ote
3 be
low
and
not
e 32
(vii)
) 1
7,85
2 6
00
- 1
8,45
2 -
- -
- 1
8,45
2 1
7,85
2
Leas
ehol
d La
nd 3
,100
1
44
- 3
,244
1
04
37
- 1
41
3,1
03
2,9
96
Build
ing
18,
117
1,7
76
- 1
9,89
3 4
,865
7
14
- 5
,579
1
4,31
4 1
3,25
2 Pl
ant a
nd M
achi
nery
(Not
e 2
belo
w)
214,
590
28,
243
(3,9
34)
238
,899
1
30,7
86
25,
590
(3,5
42)
152
,834
8
6,06
5 8
3,80
4 El
ectro
nic
Data
Pro
cess
ing
Equi
pmen
t 1
,875
3
43
(201
) 2
,017
1
,391
3
44
(201
) 1
,534
4
83
484
Fu
rnitu
re, F
ixtu
res
and
Office
App
lianc
es 1
,373
5
31
(37)
1,8
67
804
1
94
(19)
979
8
88
569
Ve
hicl
es 1
,016
5
94
(343
) 1
,267
3
03
147
(8
7) 3
63
904
7
13
Tota
l 2
57,9
23
32,2
31
(4,5
15)
285
,639
1
38,2
53
27,
026
(3,8
49)
161
,430
1
24,2
09
119
,670
Gros
s Bl
ock
Depr
ecia
tion
/ Am
ortis
atio
nNe
t Blo
ck
Part
icul
ars
As a
t 01
.04.
2014
Addi
tions
Dedu
ctio
ns/
Adju
stm
ents
#As
At
31.0
3.20
15Up
to
01.0
4.20
14Fo
r the
ye
arDe
duct
ions
/ Ad
just
men
ts*
As A
t 31
.03.
2015
As A
t 31
.03.
2015
As A
t 31
.03.
2014
Ow
n As
sets
(Acq
uire
d):
Free
hold
Lan
d (N
ote
1,3)
13,
152
4,7
00
- 1
7,85
2 -
- -
- 1
7,85
2 1
3,15
2 Le
aseh
old
Land
3,0
97
3
- 3
,100
6
9 3
5 -
104
2
,996
3
,028
Bu
ildin
g 1
6,89
3 1
,238
(1
4) 1
8,11
7 2
,822
1
,012
1
,031
4
,865
1
3,25
2 1
4,07
1 Pl
ant a
nd M
achi
nery
(Not
e 2)
185
,485
3
2,15
1 (3
,123
) 2
14,5
13
111
,598
2
1,90
7 (2
,796
) 1
30,7
09
83,
804
73,
887
Elec
troni
c Da
ta P
roce
ssin
g Eq
uipm
ent
1,6
78
365
(1
68)
1,8
75
1,2
52
306
(1
67)
1,3
91
484
4
26
Furn
iture
, Fix
ture
s an
d Offi
ce A
pplia
nces
1,2
73
171
(7
1) 1
,373
4
52
207
1
45
804
5
69
821
Ve
hicl
es 8
68
331
(1
83)
1,0
16
214
1
33
(44)
303
7
13
654
To
tal (
A) 2
22,4
46
38,9
59
(3,5
59)
257
,846
1
16,4
07
23,
600
(1,8
31)
138
,176
1
19,6
70
106
,039
As
sets
give
n on
ope
ratin
g le
ase:
Plan
t and
Mac
hine
ry 7
7 -
- 7
7 3
9 -
38
77
- 3
8 To
tal (
B) 7
7 -
- 7
7 3
9 -
38
77
- 3
8 To
tal [
(A) +
(B)]
222
,523
38
,959
(3
,559
) 2
57,9
23
116
,446
2
3,60
0 (1
,793
) 1
38,2
53
119
,670
1
06,0
77
Pre
vious
Yea
r Fig
ures
1
94,1
12
30,
362
(1,9
51)
222
,523
9
8,34
7 1
9,84
4 (1
,745
) 1
16,4
46
106
,077
(1
) Im
mov
able
pro
pert
ies
cost
ing
` 16
mill
ion
(pre
vious
yea
r ` 1
6 m
illio
n) is
not
yet
regi
ster
ed in
the
nam
e of
the
Com
pany
.
(2) P
lant
and
Mac
hine
ry (g
ross
blo
ck) i
nclu
des
pro-
rata
cos
t am
ount
ing
to `
374
mill
ion
(pre
vious
yea
r ` 3
74 m
illio
n) o
f a G
as Tu
rbin
e jo
intly
ow
ned
by th
e Co
mpa
ny w
ith it
s gr
oup
com
pani
es a
nd o
ther
com
pani
es.
(3) A
par
t of f
reeh
old
land
of t
he C
ompa
ny a
t Gur
gaon
, Man
esar
and
Guj
arat
(Ref
er N
ote
56) h
as b
een
mad
e av
aila
ble
to it
s gr
oup
com
pani
es /
fello
w s
ubsi
diar
y.*
The
estim
ated
use
ful l
ives
of c
erta
in fi
xed
asse
ts h
ad b
een
revis
ed in
acc
orda
nce
with
Sch
edul
e II
to th
e Co
mpa
nies
Act
201
3, w
ith e
ffect
from
1st
Apr
il 20
14. P
ursu
ant t
o th
e ab
ove
men
tione
d ch
ange
s in
use
ful
lives
, the
dep
reci
atio
n ex
pens
e of
pre
vious
yea
r was
hig
her b
y `
649
mill
ion
and
for t
he a
sset
s w
hose
revis
ed u
sefu
l live
s ha
d ex
pire
d pr
ior t
o 31
st M
arch
201
4, th
e ne
t boo
k va
lue
of `
792
mill
ion
(net
of d
efer
red
tax
of `
409
mill
ion)
had
bee
n de
duct
ed fr
om th
e re
tain
ed e
arni
ngs.
# Ad
just
men
t inc
lude
s th
e in
tra-h
ead
re-g
roup
ing
of a
mou
nts
STANDALONE FINANCIAL STATEMENTS | NOTES TO THE FINANCIAL STATEMENTS 179
13 In
tang
ible
Ass
ets
Gros
s Bl
ock
Depr
ecia
tion
/ Am
ortis
atio
nNe
t Blo
ck
Part
icul
ars
As a
t 01
.04.
2015
Addi
tions
Dedu
ctio
ns/
Adju
stm
ents
As
at
31.0
3.20
16Up
to
01.0
4.20
15Fo
r the
ye
arDe
duct
ions
/ Ad
just
men
tsAs
at
31.0
3.20
16As
at
31.0
3.20
16As
at
31.0
3.20
15
Ow
n As
sets
(Acq
uire
d):
Lum
p su
m ro
yalty
and
Eng
inee
ring
supp
ort
6,6
94
1,7
59
- 8
,453
3
,771
1
,213
-
4,9
84
3,4
69
2,9
23
Tota
l 6
,694
1
,759
-
8,4
53
3,7
71
1,2
13
- 4
,984
3
,469
2
,923
Gros
s Bl
ock
Depr
ecia
tion
/ Am
ortis
atio
nNe
t Blo
ck
Part
icul
ars
As a
t 01
.04.
2014
Addi
tions
Dedu
ctio
ns/
Adju
stm
ents
As
At
31.0
3.20
15Up
to
01.0
4.20
14Fo
r the
ye
arDe
duct
ions
/ Ad
just
men
tsAs
At
31.0
3.20
15As
At
31.0
3.20
15As
At
31.0
3.20
14
Ow
n As
sets
(Acq
uire
d):
Lum
p su
m ro
yalty
4,4
95
2,1
99
- 6
,694
2
,668
1
,103
-
3,7
71
2,9
23
1,8
27
Tota
l 4
,495
2
,199
-
6,6
94
2,6
68
1,1
03
- 3
,771
2
,923
1
,827
Pr
evio
us Y
ear F
igur
es
3,8
95
600
-
4,4
95
1,6
68
1,0
00
- 2
,668
1
,827
(All
amou
nts
in `
mill
ion,
unl
ess
othe
rwis
e st
ated
)
(All amounts in ` million, unless otherwise stated)
Notes to the Financial Statements
180 MARUTI SUZUKI INDIA LIMITED
14 Capital Work In Progress
As at 31.03.2016
As at 31.03.2015
Plant and Machinery 8,025 16,346 Civil Work in Progress 2,044 2,482
10,069 18,828
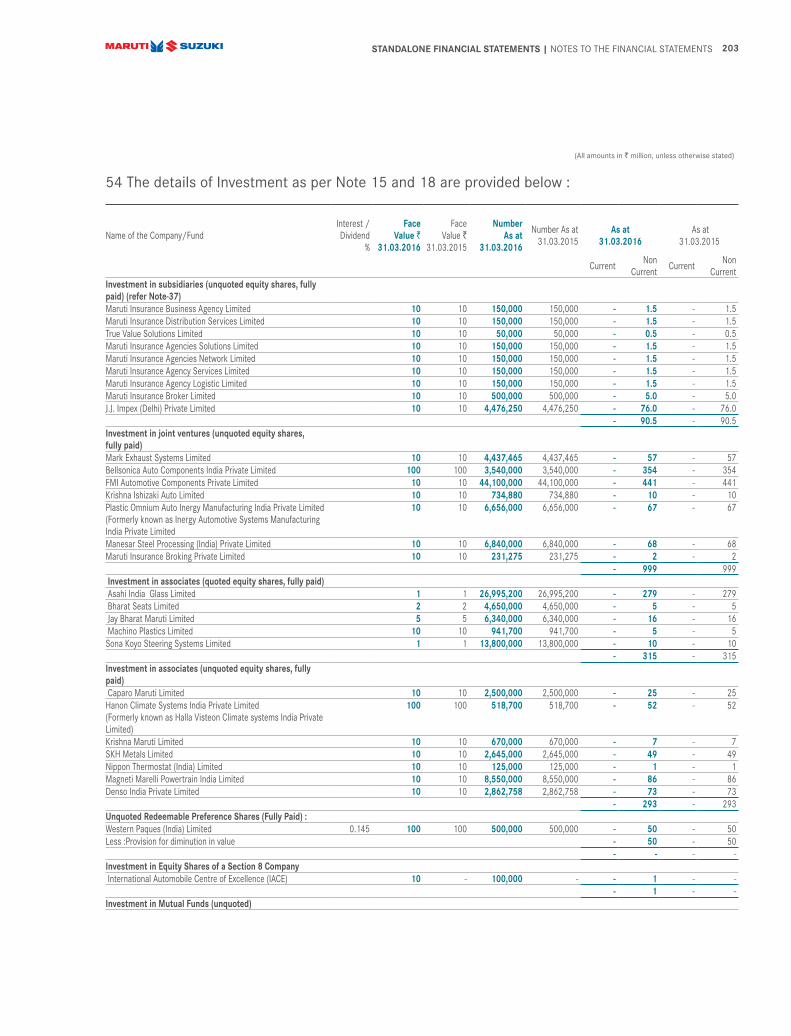
15 Non-Current Investments (Refer Note 54)
As at 31.03.2016
As at 31.03.2015
Trade Investment (valued at cost, unless otherwise stated)Investment in subsidiaries (unquoted equity instruments) 91 91 Investment in joint ventures (unquoted equity instruments) 999 999 Investment in associates: - quoted equity instruments 315 315 - unquoted equity instruments 293 293
1,698 1,698Other Investment (valued at cost unless otherwise stated)Investment in equity shares of a Section 8 Company - unquoted 1 - Investment in mutual funds - unquoted 167,428 96,478Investment in preference shares - unquoted 50 50
167,479 96,528 Less: Provision for diminution, other than temporary, in value of investments in preference shares
50 167,429 50 96,478
169,127 98,176Aggregate value of unquoted investments 168,861 97,911Aggregate value of quoted investments 315 315Market value of quoted investments 5,839 5,605Aggregate value of provision for diminution other than temporary in value of investments
50 50
(All amounts in ` million, unless otherwise stated)
STANDALONE FINANCIAL STATEMENTS | NOTES TO THE FINANCIAL STATEMENTS 181
16 Long Term Loans and Advances
As at 31.03.2016
As at 31.03.2015
Capital AdvancesUnsecured - considered good 5,114 4,712 - considered doubtful - 33
5,114 4,745Less: Provision for doubtful capital advances - 5,114 33 4,712Security DepositsUnsecured - considered good 103 113Taxes Paid Under DisputeUnsecured - considered good 8,100 8,476 Inter corporate deposits - unsecured considered doubtful 125 125 Less: Provision for doubtful deposits 125 - 125 - Other Loans and AdvancesSecured - considered good 4 5Unsecured - considered good 176 187 - considered doubtful 42 43
222 235Less: Provision for doubtful other loans and advances 42 180 43 192
13,497 13,493
17 Other Non-Current Assets
As at 31.03.2016
As at 31.03.2015
Interest Accrued on Deposits, Loans and AdvancesSecured - considered good 1 1 ClaimsUnsecured - considered good 83 68 - considered doubtful 27 27
110 95 Less: Provision for doubtful claims 27 83 27 68Others [Including derivative assets of ` Nil (Previous Year ` 366 million)] 6 372
90 441
18 Current Investments (Refer Note 54)
As at 31.03.2016
As at 31.03.2015
At cost or market value, whichever is lessInvestment in mutual funds - unquoted 8,730 29,964
8,730 29,964
(All amounts in ` million, unless otherwise stated)
Notes to the Financial Statements
182 MARUTI SUZUKI INDIA LIMITED
19 Inventories (Refer Note 47)
As at 31.03.2016
As at 31.03.2015
Components and Raw Materials 17,343 13,212Work in Progress 1,643 1,232Finished Goods ManufacturedVehicles 7,695 8,633 Vehicle spares and components 441 389
8,136 9,022Traded GoodsVehicle spares and components 2,480 1,963 Stores and Spares 994 861 Loose Tools 725 569
31,321 26,859 Inventory includes in transit inventory of: Components and Raw Materials 6,860 5,186 Traded Goods - vehicle spares 43 26
20 Trade Receivables
As at 31.03.2016
As at 31.03.2015
Unsecured - considered goodOutstanding for a period exceeding six months from the date they are due for payment
99 53
Others 12,887 12,986 10,645 10,698Unsecured - considered doubtfulOutstanding for a period exceeding six months from the date they are due for payment
Cash and Cash Equivalents Cash on hand 10 8 Cheques and drafts on hand 14 3Bank balances in current accounts 360 384 166 177Other Bank Balances Unclaimed dividend accounts 7 7 6 6
391 183
(All amounts in ` million, unless otherwise stated)
STANDALONE FINANCIAL STATEMENTS | NOTES TO THE FINANCIAL STATEMENTS 183
22 Short Term Loans and Advances (considered good, unless otherwise stated)
As at 31.03.2016
As at 31.03.2015
Loans and Advances to Related PartiesUnsecured 1,538 1,256Balance with Customs, Port Trust and Other Government AuthoritiesUnsecured 11,204 7,442Other Loans and AdvancesSecured 2 2Unsecured 2,821 2,823 3,028 3,030
15,565 11,728
23 Other Current Assets (considered good, unless otherwise stated)
As at 31.03.2016
As at 31.03.2015
Interest Accrued on Deposits, Loans and AdvancesSecured - 3Unsecured 4 4 37 40ClaimsUnsecured 1,230 1,350ReceivableUnsecured 517 584Others[Including derivative assets of ` 746 million (Previous Year ` 552 million)]Unsecured 751 556
2,502 2,530
24 Gross Sale of Products (Refer Note 47)
For the year ended 31.03.2016
For the year ended 31.03.2015
Vehicles 582,950 490,806 Spare parts / dies and moulds / components 55,719 46,879
638,669 537,685
(All amounts in ` million, unless otherwise stated)
Notes to the Financial Statements
184 MARUTI SUZUKI INDIA LIMITED
25 Other Operating Revenue
For the year ended 31.03.2016
For the year ended 31.03.2015
Income from services [Net of expenses of ` 1,241 million (Previous Year ` 1,039 million)] 3,508 4,113 Sale of scrap 3,564 4,191 Cash discount received 1,429 1,599 Recovery of service charges 776 681 Provisions no longer required written back 2,175 1,452 Others 2,507 1,615
13,959 13,651
26 Other Income
For the year ended 31.03.2016
For the year ended 31.03.2015
Interest Income (gross) on:a) Fixed deposits - 325 b) Receivables from dealers 545 614 c) Advances to vendors 3 146 d) Income tax refund 885 - e) Others 77 1,510 1 1,086Dividend Income from:a) Long term investments 107 67b) Short term investments - 107 473 540Net gain on sale of investmentsa) Long term 2,577 6,494b) Short term 425 3,002 196 6,690
4,619 8,316
27 Change in Inventories of Finished Goods, Work-In-Progress and Stock-in-Trade
938 (4,959)Less: Excise duty on (increase) / decrease of finished goods (111) 1,049 (477) (4,482)Vehicle Spares and Components - Manufactured and TradedOpening stock 2,352 1,980Less: Closing stock 2,921 (569) 2,352 (372)
69 (4,559)
(All amounts in ` million, unless otherwise stated)
STANDALONE FINANCIAL STATEMENTS | NOTES TO THE FINANCIAL STATEMENTS 185
28 Employee Benefits
For the year ended 31.03.2016
For the year ended 31.03.2015
Salaries, wages, allowances and other benefits [Net of staff cost recovered ` 30 million (Previous year ` 42 million)]
17,393 14,127
Contribution to provident and other funds 983 911Staff welfare expenses 1,511 1,028
19,887 16,066
The Company has calculated the various benefits provided to employees as under :
A. Defined Contribution Plans a) Superannuation Fund b) Post Employment Medical Assistance Scheme.
During the year the Company has recognised the following amounts in the statement of profit and loss :-
For the year ended 31.03.2016
For the year ended 31.03.2015
Employers Contribution to Superannuation Fund* 69 75Employers Contribution to Post Employment Medical Assistance Scheme.* 9 10
B. State Plans a) Employers contribution to Employee State Insurance b) Employers contribution to Employee’s Pension Scheme 1995
During the year the Company has recognised the following amounts in the statement of profit and loss :-
For the year ended 31.03.2016
For the year ended 31.03.2015
Employers contribution to Employee State Insurance.* 38 21 Employers contribution to Employee's Pension Scheme 1995.* 261 176
* Included in ‘Contribution to Provident and Other Funds’ above
(All amounts in ` million, unless otherwise stated)
Notes to the Financial Statements
186 MARUTI SUZUKI INDIA LIMITED
C. Defined Benefit Plans and Other Long Term Benefits a) Contribution to Gratuity Funds - Employee’s Gratuity Fund. b) Leave Encashment/ Compensated Absence. c) Retirement Allowance d) Provident Fund
In accordance with Accounting Standard 15 (revised 2005), an actuarial valuation was carried out in respect of the aforesaid defined benefit plans and other long term benefits based on the following assumptions.
March 31, 2016 March 31, 2015
Provident Fund
Leave Encashment/ Compensated
Absence
Employees Gratuity Fund
Retirement Allowance
Provident Fund
Leave Encashment/ Compensated
Absence
Employees Gratuity Fund
Retirement Allowance
Discount rate (per annum) 8.80% 8.00% 8.00% 8.00% 8.75% 8.00% 8.00% 8.00%Rate of increase in compensation levels
Not Applicable
7.00% 7.00% Not Applicable
Not Applicable
7.00% 7.00% Not Applicable
Rate of return on plan assets 8.85% Not Applicable 9.00% Not Applicable
8.81% Not Applicable 9.00% Not Applicable
Expected average remaining working lives of employees (years)
26 26 26 26 22 22 22 22
Estimates of future salary increases considered in actuarial valuation take account of inflation, seniority, promotion and other relevant factors such as supply and demand in the employment market.
Changes in present value of obligations
March 31, 2016 March 31, 2015
Provident Fund
Leave Encashment/ Compensated
Absence
Employees Gratuity Fund
Retirement Allowance
Provident Fund
Leave Encashment/ Compensated
Absence
Employees Gratuity Fund
Retirement Allowance
Present value of obligation as at beginning of the year
9,563 1,830 1,715 54 7,908 1,448 1,351 47
Adjustment in beginning balance
- - - - - (10) - -
Interest cost 870 142 138 5 732 99 105 4 Current service cost 403 200 93 10 334 167 138 - Contribution by plan participants
1,137 - - - 881 - - -
Benefits paid (373) (282) (86) - (500) (247) (71) - Transfer In - - - - 197 - - - Actuarial (gain) / loss on obligations
(10) 211 107 (11) 11 373 192 3
Present value of obligation as at the year end
11,590 2,101 1,967 58 9,563 1,830 1,715 54
(All amounts in ` million, unless otherwise stated)
STANDALONE FINANCIAL STATEMENTS | NOTES TO THE FINANCIAL STATEMENTS 187
Changes in the fair value of plan assetsMarch 31, 2016 March 31, 2015
Provident Fund
Employees Gratuity Fund
Provident Fund
Employees Gratuity Fund
Fair value of Plan Assets as at beginning of the year 9,632 1,715 8,020 1,354 Expected return on Plan Assets 870 155 707 122 Employer contribution 403 203 334 292 Employee contribution 1,137 - 881 - Benefits paid (373) (86) (500) (71)Transfer In - - 197 - Actuarial (gain)/ loss on obligations (15) 20 7 (18)Fair value of plan assets as at the year end 11,684 1,967 9,632 1,715
Reconciliation of present value of defined benefit obligation and fair value of assets
March 31, 2016 March 31, 2015
Provident Fund*
Leave Encashment/ Compensated
Absence
Employees Gratuity Fund
Retirement Allowance
Provident Fund*
Leave Encashment/ Compensated
Absence
Employees Gratuity
Fund*
Retirement Allowance
Present value of obligation as at the year end
11,590 2,101 1,967 58 9,563 1,830 1,715 54
Fair value of plan assets as at the year end
11,684 - 1,967 - 9,632 - 1,715 -
Surplus/ (Deficit) 94 (2,101) - (58) 69 (1,830) - (54)Unfunded net asset/ (liability) recognised in balance sheet
- (2,101) - (58) - (1,830) - (54)
* Since there is surplus, the same has not been recognised in Balance Sheet
March 31, 2016 March 31, 2015
Provident Fund*
Leave Encashment/ Compensated
Absence
Employees Gratuity Fund
Retirement Allowance
Provident Fund*
Leave Encashment/ Compensated
Absence
Employees Gratuity Fund*
Retirement Allowance
Classified as Long Term - - - 56 - - - 53 Classified as Short Term - 2,101 - 2 - 1,830 - 1 Total - 2,101 - 58 - 1,830 - 54
(All amounts in ` million, unless otherwise stated)
Notes to the Financial Statements
188 MARUTI SUZUKI INDIA LIMITED
March 31, 2014 March 31, 2013
Provident Fund
Leave Encashment/ Compensated
Absence
Employees Gratuity Fund
Retirement Allowance
Provident Fund
Leave Encashment/ Compensated
Absence
Employees Gratuity Fund
Retirement Allowance
Present value of obligation as at the year end
7,908 1,448 1,351 47 6,009 1,274 1,126 44
Fair value of plan assets as at the year end
8,020 - 1,354 - 6,508 - 1,126 -
Surplus/ (deficit) 112 (1,448) 3 (47) 499 (1,274) - (44)Unfunded net asset/ (liability) recognised in balance sheet
- (1,448) - (47) - (1,274) - (44)
March 31, 2012
Provident Fund
Leave Encashment/ Compensated
Absence
Employees Gratuity Fund
Retirement Allowance
Present value of obligation as at the year end 5,459 850 848 37 Fair value of plan assets as at the year end 5,480 - 907 - Surplus/ (deficit) 21 (850) 59 (37)Unfunded net asset/ (liability) recognised in balance sheet - (850) - (37)
Expenses recognised in the statement of profit & loss
March 31, 2016 March 31, 2015
Provident Fund*
Leave Encashment/ Compensated
Absence**
Employees Gratuity
Fund*
Retirement Allowance**
Provident Fund*
Leave Encashment/ Compensated
Absence**
Employees Gratuity Fund*
Retirement Allowance**
Current service cost - 200 93 10 - 167 138 - Company's Contribution to Provident Fund
403 - - - 334 - - -
Interest cost - 142 138 5 - 99 105 4 Expected return on plan assets
- - (155) - - - (122) -
Net actuarial (gain)/ loss recognised during the year
- 211 127 (11) - 373 174 3
Total expense recognised in statement of profit and loss
403 553 203 4 334 639 295 7
* Included in “Contribution to provident and other funds” above** Included in “Salaries, wages, allowances and other benefits” above
(All amounts in ` million, unless otherwise stated)
STANDALONE FINANCIAL STATEMENTS | NOTES TO THE FINANCIAL STATEMENTS 189
Constitution of Plan AssetsProvident Fund Gratuity
The return on the investment is the nominal yield available on the format of investment as applicable to Approved Gratuity Fund under Rule 101 of Income Tax Act 1961.
The return on plan assets of Provident Fund is based on assumed rate of return derived from returns of past years.
Expected contribution on account of Gratuity and Provident Fund for the year ending 31st March, 2017 can not be ascertained at this stage.
29 Finance Costs
For the year ended 31.03.2016
For the year ended 31.03.2015
Interest on : - Foreign currency loans from banks 26 23 - Buyers’ credit and export credit 41 475 - Deposits from dealers, contractors and others 745 812 779 1,277Other borrowing costs 3 5Other Interest - 778
Depreciation / amortisation on tangible assets 27,026 23,600 Amortisation on intangible assets 1,213 1,103
28,239 24,703
(All amounts in ` million, unless otherwise stated)
Notes to the Financial Statements
190 MARUTI SUZUKI INDIA LIMITED
31 Other Expenses
For the year ended 31.03.2016
For the year ended 31.03.2015
Consumption of stores [Refer Note 45 (iii)] 2,140 1,801Power and fuel [Net of amount recovered ` 737 million (Previous year ` 1,085 million)]
6,926 7,123
Rent (Refer Note 51) 199 162Repairs and maintenance : - Plant and machinery 1,861 1,194 - Building 474 330 - Others 396 2,731 407 1,931Insurance 150 136Rates, taxes and fees 1,496 1,260Royalty 32,443 26,574Tools / machinery spares charged off 3,432 2,498Net loss on foreign currency transactions and translation 1,008 678 Advertisement 7,720 4,638Sales promotion 4,570 2,996Warranty and product recall 919 806Transportation and distribution expenses 5,416 6,188Net loss on sale / discarding of fixed assets 1,353 483Corporate social responsibility expenses (refer note below) 785 373Other miscellaneous expenses * 8,703 8,784
79,991 66,431
Note on Corporate Social Responsibility Gross amount required to be spent by the Company during the year ` 654 million
Amount spent during the year on:For the year
ended 31.03.2016For the year
ended 31.03.2015
(i) Construction / acquisition of any asset In cash - - Yet to be paid in cash - -
- - (ii) On purpose other than above In cash 785 373 Yet to be paid in cash - -
785 373 Total 785 373 * Does not include any item of expenditure with a value of more than 1% of turnover
(All amounts in ` million, unless otherwise stated)
STANDALONE FINANCIAL STATEMENTS | NOTES TO THE FINANCIAL STATEMENTS 191
32 Contingent Liabilities
a) Claims against the Company disputed and not acknowledged as debts:
Particulars As at March 31, 2016
As at March 31, 2015
(i) Excise Duty(a) Cases decided in the Company’s favour by Appellate authorities and for which
the department has filed further appeals and show cause notices / orders on the same issues for other periods
7,123 2,965
(b) Cases pending before Appellate authorities in respect of which the Company has filed appeals and show cause notices for other periods 11,099 13,741
(c) Show cause notices on issues yet to be adjudicated 7,019 15,670Total 25,241 32,376Amount deposited under protest 1,561 383
(ii) Service Tax(a) Cases decided in the Company’s favour by Appellate authorities and for which
the department has filed further appeals and show cause notices / orders on the same issues for other periods
430 385
(b) Cases pending before Appellate authorities in respect of which the Company has filed appeals and show cause notices for other periods 3,318 4,912
(c) Show cause notices on issues yet to be adjudicated 486 183Total 4,234 5,480Amount deposited under protest 22 19
(iii) Income Tax(a) Cases decided in the Company’s favour by Appellate authorities and for which the
department has filed further appeals7,778 6,033
(b) Cases pending before Appellate authorities / Dispute Resolution Panel in respect of which the Company has filed appeals
32,254 21,825
Total 40,032 27,858Amount deposited under protest 5,172 7,140
(iv) Customs DutyCases pending before Appellate authorities in respect of which the Company has filed appeals
108 103
Others 43 32Total 151 135Amount deposited under protest 22 22
(v) Sales TaxCases pending before Appellate authorities in respect of which the Company has filed appeals
67 53
Amount deposited under protest 18 2
(vi) Claims against the Company for recovery of ` 326 million (Previous year ` 339 million) lodged by various parties.
(vii) In earlier years, pursuant to Court orders, the Haryana State Industrial & Infrastructure Development Corporation Limited (“HSI-IDC”) had raised demands amounting to ̀ 10,317 million towards enhanced compensation to landowners for the Company’s freehold land at Manesar, Haryana. Against this, the Company has made a payment of ` 3,742 million under protest and capitalised it as part of the cost of land. During the current year, The Punjab & Haryana High Court (“High Court”) set aside the above orders and referred the matter back to the District Court, Gurgaon for fresh adjudication. An appeal was preferred by the land owners against the order of the High Court and presently the matter is pending with the Supreme Court.
(All amounts in ` million, unless otherwise stated)
Notes to the Financial Statements
192 MARUTI SUZUKI INDIA LIMITED
(viii) In respect of disputed Local Area Development Tax (LADT) (upto 15th April, 2008) / Entry Tax, the Sales Tax department has filed an appeal in the Supreme Court of India against the order of the Punjab & Haryana High Court. The amounts under dispute are ` 21 million (Previous year ` 21 million) for LADT and ` 19 million (Previous year ` 18 million) for Entry Tax. The State Government of Haryana has repealed the LADT effective from 16th April, 2008 and introduced the Haryana Tax on Entry of Goods into Local Area Act, 2008 with effect from the same date.
(ix) The Competition Commission of India (“CCI”) had passed an order dated 25th August, 2014 stating that the Company has violated certain sections of the Competition Act, 2002 and has imposed a penalty of ` 4,712 million. An interim stay is in oper-ation on the above order of the CCI pursuant to the writ petition filed by the Company before the Delhi High Court.
b) The amounts shown in the item (a) represent the best possible estimates arrived at on the basis of available information. The uncertainties and possible reimbursements are dependent on the outcome of the different legal processes which have been invoked by the Company or the claimants as the case may be and therefore cannot be predicted accurately or relate to a present obligations that arise from past events where it is either not probable that an outflow of resources will be required to settle or a reliable estimate cannot be made. The Company engages reputed professional advisors to protect its interests and has been advised that it has strong legal positions against such disputes.
33 Outstanding commitments under Letters of Credit established by the Company aggregate ` 1,671 million (Previous year ` 2,029 million).
34 Estimated value of contracts on capital account, excluding capital advances, remaining to be executed and not provided for, amount to ` 30,387 million (Previous year ` 20,295 million).
35 Consumption of raw materials and components has been computed by adding purchases to the opening stock and deducting closing stock physically verified by the management.
36 The Company was granted sales tax benefit in accordance with the provisions of Rule 28C of Haryana General Sales Tax Rules, 1975 for the period from 1st August, 2001 to 31st July, 2015. The ceiling amount of concession to be availed of during the entitlement period is ` 5,644 million. Till 31st March 2016, the Company has availed of / claimed sales tax benefit amounting to ` 2,884 million (Previous year ` 2,626 million).
37 The Board of Directors, in its meeting held on 27th October, 2015 has approved a Scheme of Amalgamation (the “Scheme”) under Sections 391 to 394 of the Companies Act, 1956 (‘the 1956 Act’) and other applicable provisions of the 1956 Act and the Companies Act, 2013, as per pooling of interest method, between the Company and its seven wholly owned subsidiaries which were authorised to engage in the business of acting as insurance intermediaries, by the name of Maruti Insurance Business Agency Limited, Maruti Insurance Distribution Services Limited, Maruti Insurance Agency Network Limited, Maruti Insurance Agency Solutions Limited, Maruti Insurance Agency Services Limited, Maruti Insurance Agency Logistics Limited and Maruti Insurance Broker Limited.
The amalgamation will be effective from 1st April, 2016 being the appointed date and is subject to shareholders’ and other statutory approvals. The amalgamation is not expected to have a material impact.
38 The Company has considered “ business segment” as its primary segment. The Company is primarily in the business of manufacture, purchase and sale of motor vehicles, components and spare parts (“automobiles”). The other activities of the Company comprise facilitation of pre-owned car sales, fleet management and car financing. The income from these activities, which are incidental to the Company’s business, is not material in financial terms but such activities contribute significantly in generating the demand for the products of the Company. Accordingly, the Company operates in one business segment and thus no business segment information is required to be disclosed.
The “Geographical Segments” have been considered for disclosure as the secondary segment, under which the domestic segment includes sales to customers located in India and the overseas segment includes sales to customers located outside India.
(All amounts in ` million, unless otherwise stated)
STANDALONE FINANCIAL STATEMENTS | NOTES TO THE FINANCIAL STATEMENTS 193
Financial information of geographical segments is as follows :
2015-16 2014-15Particulars Domestic Overseas Unallocated Total Domestic Overseas Unallocated TotalRevenue from external customers 598,475 51,978 6,794 657,247 498,656 51,228 9,768 559,652 Segment assets 200,893 4,996 186,067 391,956 196,849 1,909 136,735 335,493 Capital expenditure during the year 25,231 - - 25,231 33,772 - - 33,772
Notes:- a) Domestic segment includes sales and services to customers located in India. b) Overseas segment includes sales and services rendered to customers located outside India. c) Unallocated assets include other deposits, dividend bank accounts, investments and amount paid under protest. d) Segment assets includes fixed assets, inventories, sundry debtors, cash and bank balances (except dividend bank account), other current assets, loans and advances (except other deposits). e) The accounting policies adopted for segment reporting are in conformity with the accounting policies adopted for the Company. Revenue and expenses have been identified to segments on the basis of their relationship to the operating activities of the segment. Revenue and expenses, which relate to the Company as a whole and are not allocable to segments on a reasonable basis, have been included under ‘unallocated expenses / income’.
39 The following expenses incurred on Research and Development are included under Respective Account heads:
2015-16 2014-15Revenue Expenditure Employees remuneration and benefits 2,079 1,943 Other expenses of manufacturing and administration 1,137 1,869Capital Expenditure 3,289 3,220Less: Contract research income (570) (472)
5,935 6,560
40 Auditors’ Remuneration*
2015-16 2014-15Statutory audit 14.30 13.65Other audit services / certification 2.28 2.18Reimbursement of expenses 0.40 1.17*Excluding service tax and swachh bharat cess
41 CIF Value of Imports
2015-16 2014-15Raw materials and components 33,632 31,818Capital goods 7,383 10,112Stores and spares 1,000 758Dies and moulds 168 100Other items 461 131
(All amounts in ` million, unless otherwise stated)
Notes to the Financial Statements
194 MARUTI SUZUKI INDIA LIMITED
42 Expenditure in Foreign Currency (Accrual Basis)
2015-16 2014-15Export of goods (FOB basis) 47,353 45,857Export of services 570 472
44 Dividend Remitted in Foreign Currency (Cash Basis)
2015-16 2014-15Dividend for the year 2014-15 (Previous year 2013-14) 4,245 2,037No. of non-resident shareholders 1 1No. of shares for which dividend remitted 169,788,440 169,788,440
45 Value of Imported and Indigenous Materials Consumed
2015-16 2014-15i) Raw Materials and Components
Imported 26,158 23,953Indigenous 330,911 304,725
357,069 328,678Percentage of Total ConsumptionImported 7% 7%Indigenous 93% 93%
( - )* (1,490,000) (1,308,537)Notes: * Licensed Capacity is not applicable from 1993-94. **Installed Capacity is as certified by the management and relied upon by the auditors, being a technical matter. Previous Year figures are in brackets.
47 Sales, Opening Stock and Closing Stock
Sales Opening Stock Closing StockProduct Qty.(Nos.) Value Qty.(Nos.) Value Qty.(Nos.) ValuePassenger Vehicles 1,429,248 582,950 25,564 8,633 19,162 7,695
(1,292,415) (490,806) (10,596) (3,674) (25,564) (8,633)Spare Parts and Components * 55,670 * 389 * 441
* (NA) * (1,527) * (1,232)Notes : 1. Traded goods comprise vehicles, spares, components, dies and moulds. During the year 1 vehicle (previous year nil vehicle) was purchased. 2. Closing Stock of vehicles is after adjustment of 39 vehicles (previous year 84) totally damaged. 3. Sales quantity excludes own use vehicles 1,191 Nos. (previous year 807 Nos.) 4. Sales quantity excludes sample vehicles 255 Nos. (previous year 263 Nos.) 5. Previous year figures are in brackets. * In view of the innumerable sizes/numbers (individually less than 10%) of the components, spare parts and dies and moulds it is not possible to give quantitative details.
(All amounts in ` million, unless otherwise stated)
Notes to the Financial Statements
196 MARUTI SUZUKI INDIA LIMITED
48 Statement of Raw Materials and Components Consumed
357,069 328,678* In view of the innumerable sizes/numbers (individually less than 10%) of the components, spare parts and dies and moulds it is not possible to give quantitative details.
49 Purchase of Stock in Trade
2015-16 2014-15Traded spares [includes cost related to inhouse manufactured spares ` 3,551 million (Previous year ` 2,934 million)] 31,238 26,543
Traded vehicles 2 - Others 24 109
31,264 26,652
50 Statement of Earning per Share
2015-16 2014-15Net profit after tax attributable to shareholders (in ` million) 45,714 37,112Weighted average number of equity shares outstanding during the year (Nos) 302,080,060 302,080,060Nominal value per share (In `) 5.00 5.00 Basic earning per share (In `) 151.33 122.85 Diluted earning per share (In `) 151.33 122.85
(All amounts in ` million, unless otherwise stated)
STANDALONE FINANCIAL STATEMENTS | NOTES TO THE FINANCIAL STATEMENTS 197
51 Minimum Lease payments outstanding as on 31st March 2016 in respect of assets taken on non-cancellable operating leases are as follows:
a) As a lessee
March 31, 2016 March 31, 2015
Due Total Minimum Lease Payments Outstanding as on 31st March 2016
Total Minimum Lease Payments Outstanding as on 31st March 2015
Premises Cars Total Premises Cars TotalWithin one year 55 1 56 54 2 56 Later than one year but less than five years 244 - 244 233 1 234 Later than five years 497 - 497 562 - 562
March 31, 2016 March 31, 2015Minimum Lease Payment Minimum Lease Payment
Premises Cars Total Premises Cars TotalCharged to rent expense 60 2 62 60 2 62 The Company has taken certain premises on cancellable operating lease. The rent expense amounting to ` 137 million (Previous year ` 100 million) has been charged to the statement of profit and loss.
52 Derivative Instruments outstanding at the Balance Sheet date:
1(a) Forward Contracts against imports and royalty: Forward contracts to buy JPY 3,500 million (Previous year JPY 14,500 million) against USD amounting to ` 1,978 million (Previous year ` 7,575 million). Forward contracts to buy EURO 6 million (Previous year EURO 13 million) against USD amounting to ` 434 million (Previous year ` 882 million). The above contracts have been undertaken to hedge against the foreign exchange exposures arising from transactions like import of goods and royalty.
(b) Forward Contracts against exports: Forward contracts to sell USD 48.32 million (Previous year 35.8 million) against INR amounting to ` 3,321 million (Previous year 2,279 million). Forward contracts to sell JPY 5,398 million (Previous year Nil) against INR amounting to ` 3,273 million
(Previous year Nil). The above contracts have been undertaken to hedge against the foreign exchange exposures arising from export of goods.
(c) USD Floating rate/INR Floating rate cross-currency swap: Outstanding USD/INR Floating rate cross-currency swap USD 23.17 million (Previous year USD 46.34 million) amounting to ` 1,535 million (Previous year ` 2,896 million).
(d) Forward Contracts against buyers credit: Forward Contracts to buy USD Nil (Previous year USD 30.49 millions) against INR amounting to ` Nil (Previous year ` 1,905 million). Contracts mentioned in (c) &(d) above have been undertaken to hedge against the foreign exchange exposure arising from foreign currency loan.
(All amounts in ` million, unless otherwise stated)
Notes to the Financial Statements
198 MARUTI SUZUKI INDIA LIMITED
(e) Forward Contracts against Commodities (Firm Commitment):
As at March 31, 2016 Platinum (In Oz) Palladium (In Oz) Lead (In Tons) Copper (In Tons)
(All amounts in ` million, unless otherwise stated)
STANDALONE FINANCIAL STATEMENTS | NOTES TO THE FINANCIAL STATEMENTS 199
53 Statement of Transactions with Related Parties
Holding Company Suzuki Motor Corporation
Joint Ventures Mark Exhaust Systems Limited Bellsonica Auto Component India Private Limited FMI Automotive Components Private Limited Krishna Ishizaki Auto Limited Plastic Omnium Auto Inergy Manufacturing India Private Limited (Formerly known as Inergy Automotive Systems Manufacturing India Private Limited) Maruti Insurance Broking Private Limited Manesar Steel Processing India Private Limited
Key Management Personnel Mr. Kenichi Ayukawa Mr. Toshiaki Hasuike Mr. Kazuhiko Ayabe (upto 30th Jan, 2016) Mr. Masayuki Kamiya (upto 30th July, 2014) Mr. Shigetoshi Torii (w.e.f. 31st July, 2014)
Associates Asahi India Glass Limited Bharat Seats Limited Caparo Maruti Limited Denso India Private Limited
Jay Bharat Maruti Limited Krishna Maruti Limited Machino Plastics Limited SKH Metals Limited Nippon Thermostat (India) Limited Sona Koyo Steering Systems Limited Magneti Marelli Powertrain India Private Limited Hanon Climate Systems India Private Limited (Former Halla Visteon Climate Systems India Private Limited)
Fellow Subsidiaries (Only with whom the Company had transactions during the current year) Cambodia Suzuki Motor Co. Ltd. Magyar Suzuki Corporation Ltd. Pak Suzuki Motor Co., Ltd. Pt Suzuki Indomobil Motor (Former Pt Indomobil Suzuki International) Suzuki (Myanmar) Motor Co., Ltd. Suzuki Australia Pty. Ltd. Suzuki Austria Automobile Handels G.M.B.H. Suzuki Auto South Africa (Pty) Ltd Suzuki Cars (Ireland) Ltd. Suzuki France S.A.S. Suzuki Gb Plc Suzuki International Europe G.M.B.H. Suzuki Italia S.P.A. Suzuki Malaysia Automobile Sdn. Bhd. Suzuki Motor (Thailand) Co., Ltd. Suzuki Motor De Mexico, S.A. De C.V. Suzuki Motor Gujarat Private Limited Suzuki Motor Iberica, S.A.U. Suzuki Motor Poland Sp. Z.O.O. (Former Suzuki Motor Poland Ltd.) Suzuki Motorcycle India Ltd. Suzuki New Zealand Ltd. Suzuki Philippines Inc. Taiwan Suzuki Automobile Corporation Thai Suzuki Motor Co., Ltd. Vietnam Suzuki Corporation
200 MARUTI SUZUKI INDIA LIMITED(A
ll am
ount
s in
` m
illio
n, u
nles
s ot
herw
ise
stat
ed)
Notes to the Financial Statements20
15 - 1
620
14-15
Joint
Ventu
resSu
bsidi
aries
Asso
ciates
Holdi
ng
Comp
any
Fello
w su
bsidi
aries
Key
Mana
geme
nt Pe
rsonn
elTo
talJoi
nt Ve
ntures
Subs
idiari
esAs
socia
tesHo
lding
Co
mpan
yFe
llow
subs
idiari
es
Key
Mana
geme
nt Pe
rsonn
elTo
tal
Outs
tand
ing at
Year
End
Loan
s and
Adv
ance
s Rec
over
able
Suzu
ki Mo
tor C
orpo
ration
- -
- 33
5 -
- 33
5 -
- -
339
- -
339
SKH
Metal
s Lim
ited
- -
193
- -
- 19
3 -
- 27
0 -
- -
270
Krish
na M
aruti L
imite
d -
- 20
2 -
- -
202
- -
- -
- -
- Jay
Bhara
t Maru
ti Lim
ited
- -
389
- -
- 38
9 -
- 16
3 -
- -
163
Othe
rs 11
7 -
277
- 25
-
419
71
- 41
2 -
1 -
484
Tota
l 11
7 -
1,06
1 33
5 25
-
1,53
8 71
-
845
339
1 -
1,25
6 Lo
ans P
ayab
leSu
zuki
Motor
Cor
porat
ion -
- -
614
- -
614
- -
- 1,
158
- -
1,15
8 To
tal
- -
- 61
4 -
- 61
4 -
- -
1,15
8 -
- 1,
158
Amou
nts P
ayab
leSu
zuki
Motor
Cor
porat
ion -
- -
19,24
0 -
- 19
,240
- -
- 14
,657
- -
14,65
7 Ot
hers
2,26
9 2
9,90
3 -
350
- 12
,524
1,26
8 -
5,77
7 -
134
- 7,
179
Tota
l 2,
269
2 9,
903
19,24
0 35
0 -
31,76
4 1,
268
- 5,
777
14,65
7 13
4 -
21,83
6 Am
ount
Rec
over
able
Suzu
ki Mo
tor C
orpo
ration
- -
- 3,
846
- -
3,84
6 -
- -
309
- -
309
Othe
rs 71
0 78
1,
069
- 93
2 -
2,78
9 37
0 20
1,
100
- 1,
407
- 2,
897
Tota
l 71
0 78
1,
069
3,84
6 93
2 -
6,63
5 37
0 20
1,
100
309
1,40
7 -
3,20
6 Go
ods i
n Tra
nsit
- Com
pone
nt Et
c.Su
zuki
Motor
Cor
porat
ion -
- -
2,44
6 -
- 2,
446
- -
- 1,
632
- -
1,63
2 Ot
hers
- -
- -
85
- 85
-
- -
117
- 11
7 To
tal
- -
- 2,
446
85
- 2,
531
- -
- 1,
632
117
- 1,
749
Purc
hase
s of T
angib
le an
d Int
angib
le Fix
ed A
sset
sSu
zuki
Motor
Cor
porat
ion -
- -
2,48
3 -
- 2,
483
- -
- 3,
610
- -
3,61
0 Kr
ishna
Maru
ti Lim
ited
- -
599
- -
- 59
9 -
- 45
-
- -
45
Othe
rs 56
2 -
1,56
2 -
1 -
2,12
5 36
1 -
646
- 5
- 1,
012
Tota
l 56
2 -
2,16
1 2,
483
1 -
5,20
7 36
1 -
691
3,61
0 5
- 4,
667
Sale
of Ta
ngibl
e Fixe
d Ass
ets
Suzu
ki Mo
tor G
ujarat
Priva
te Lim
ited
(refer
note
56)
- -
- -
2,01
9 -
2,01
9 -
- -
- -
- -
Tota
l -
- -
- 2,
019
- 2,
019
- -
- -
- -
-
STANDALONE FINANCIAL STATEMENTS | NOTES TO THE FINANCIAL STATEMENTS 201
2015
- 16
2014
-15
Joint
Ventu
resSu
bsidi
aries
Asso
ciates
Holdi
ng
Comp
any
Fello
w su
bsidi
aries
Key
Mana
geme
nt Pe
rsonn
elTo
talJoi
nt Ve
ntures
Subs
idiari
esAs
socia
tesHo
lding
Co
mpan
yFe
llow
subs
idiari
es
Key
Mana
geme
nt Pe
rsonn
elTo
tal
Sale
of G
oods
Su
zuki
Motor
Cor
porat
ion -
- -
6,55
8 -
- 6,
558
- -
- 88
-
- 88
Su
zuki
Motor
cycle
India
Ltd
. -
- -
- 6,
077
- 6,
077
- -
- -
5,22
5 -
5,22
5 Su
zuki
Philip
pines
Inc
- -
- -
3,07
3 -
3,07
3 -
- -
- 3,
432
- 3,
432
Othe
rs 1,
817
306
3,70
2 -
5,99
0 -
11,81
5 1,
708
223
4,01
1 -
10,01
4 -
15,95
6 To
tal
1,81
7 30
6 3,
702
6,55
8 15
,140
- 27
,523
1,70
8 22
3 4,
011
88
18,67
1 -
24,70
1 Ot
her I
ncom
eFin
ance
Inco
me/ C
ommi
ssion
/Di
viden
dMa
rk Ex
haus
t Sys
tems L
imite
d 28
-
- -
- -
28
28
- -
- -
- 28
SK
H Me
tals L
imite
d -
- 62
-
- -
62
- -
146
- -
- 14
6 Ma
chino
Plas
tics L
imite
d -
- 18
-
- -
18
- -
15
- -
- 15
As
ahi In
dia G
lass L
imite
d -
- 42
-
- -
42
- -
65
- -
- 65
Ot
hers
19
1 10
-
- -
30
17
- 88
-
- -
105
Tota
l 47
1
132
- -
- 18
0 45
-
314
- -
- 35
9 Ot
her M
isc In
com
eSu
zuki
Motor
Cor
porat
ion -
- -
584
- -
584
- -
- 49
6 -
- 49
6 Ot
hers
31
1 36
-
110
- 17
8 30
2
49
- 4
- 85
To
tal
31
1 36
58
4 11
0 -
762
30
2 49
49
6 4
- 58
1 Ex
pend
iture
Purc
hase
s of G
oods
Suzu
ki Mo
tor C
orpo
ration
- -
- 11
,673
- -
11,67
3 -
- -
12,38
7 -
- 12
,387
Jay Bh
arat M
aruti L
imite
d -
- 10
,768
- -
- 10
,768
- -
10,50
5 -
- -
10,50
5 Kr
ishna
Maru
ti Lim
ited
- -
10,74
5 -
- -
10,74
5 -
- 10
,000
- -
- 10
,000
Othe
rs 14
,831
- 41
,313
- 1,
458
- 57
,602
13,72
7 -
38,20
7 -
124
- 52
,058
Tota
l 14
,831
- 62
,825
11,67
3 1,
458
- 90
,787
13,72
7 -
58,71
2 12
,387
124
- 84
,950
Prop
osed
Divi
dend
Suzu
ki Mo
tor C
orpo
ration
- -
- 5,
943
- -
5,94
3 -
- -
4,24
5 -
- 4,
245
Tota
l -
- -
5,94
3 -
- 5,
943
- -
- 4,
245
- -
4,24
5 Ro
yalty
Suzu
ki Mo
tor C
orpo
ration
- -
- 32
,443
- -
32,44
3 -
- -
26,57
4 -
- 26
,574
Tota
l -
- -
32,44
3 -
- 32
,443
- -
- 26
,574
- -
26,57
4
(All
amou
nts
in `
mill
ion,
unl
ess
othe
rwis
e st
ated
)
202 MARUTI SUZUKI INDIA LIMITED
Notes to the Financial Statements20
15 - 1
620
14-15
Joint
Ventu
resSu
bsidi
aries
Asso
ciates
Holdi
ng
Comp
any
Fello
w su
bsidi
aries
Key
Mana
geme
nt Pe
rsonn
elTo
talJoi
nt Ve
ntures
Subs
idiari
esAs
socia
tesHo
lding
Co
mpan
yFe
llow
subs
idiari
es
Key
Mana
geme
nt Pe
rsonn
elTo
tal
Serv
ices R
eceiv
edSu
zuki
Motor
Cor
porat
ion -
- -
883
- -
883
- -
- 77
7 -
- 77
7 Ot
hers
- -
- -
- -
- -
- -
- -
- -
Tota
l -
- -
883
- -
883
- -
777
- -
777
Othe
r Exp
endit
ure
Suzu
ki Mo
tor C
orpo
ration
- -
- 15
5 -
- 15
5 -
- -
168
- -
168
Suzu
ki Au
to So
uth Af
rica (
Pty)
Limite
d -
- -
- 65
-
65
- -
- -
43
- 43
Jay
Bhara
t Maru
ti Lim
ited
- -
161
- -
- 16
1 -
- 2
- -
- 2
Othe
rs 3
16
49
- 98
-
165
6 14
16
-
460
- 49
6 To
tal
3 16
21
0 15
5 16
3 -
547
6 14
18
16
8 50
3 -
709
Reco
very
of Ex
pens
esSu
zuki
Motor
Cor
porat
ion -
- -
27
- -
27
- -
- 24
-
- 24
Be
llson
ica Au
to Co
mpon
ent In
dia
Priva
te Lim
ited
242
- -
- -
- 24
2 26
9 -
- -
- -
269
Jay Bh
arat M
aruti L
imite
d -
- 12
9 -
- -
129
- -
381
- -
- 38
1 Ot
hers
127
12
207
- 47
-
393
205
11
391
- 39
-
646
Tota
l 36
9 12
33
6 27
47
-
791
474
11
772
24
39
- 1,
320
Mana
geria
l Rem
uner
ation
Mr. K
enich
i Ayu
kawa
- -
- -
- 35
35
-
- -
- -
34
34
Mr. T
oshia
ki Ha
suike
- -
- -
- 31
31
-
- -
- -
29
29
Mr. K
azuh
iko Ay
abe
- -
- -
- 21
21
-
- -
- -
24
24
Mr. M
asay
uki K
amiya
- -
- -
- -
- -
- -
- -
3 3
Mr. S
higeto
shi T
orii
- -
- -
- 26
26
-
- -
- -
16
16
Tota
l -
- -
- -
113
113
- -
- -
- 10
6 10
6
(All
amou
nts
in `
mill
ion,
unl
ess
othe
rwis
e st
ated
)
STANDALONE FINANCIAL STATEMENTS | NOTES TO THE FINANCIAL STATEMENTS 203
(All amounts in ` million, unless otherwise stated)
54 The details of Investment as per Note 15 and 18 are provided below :
- 293 - 293 Unquoted Redeemable Preference Shares (Fully Paid) : Western Paques (India) Limited 0.145 100 100 500,000 500,000 - 50 - 50 Less :Provision for diminution in value - 50 - 50
- - - - Investment in Equity Shares of a Section 8 Company International Automobile Centre of Excellence (IACE) 10 - 100,000 - - 1 - -
- 1 - - Investment in Mutual Funds (unquoted)
(All amounts in ` million, unless otherwise stated)
Notes to the Financial Statements
204 MARUTI SUZUKI INDIA LIMITED
Name of the Company/Fund Interest / Dividend
%
Face Value `
31.03.2016
Face Value `
31.03.2015
Number As at
31.03.2016
Number As at 31.03.2015
As at 31.03.2016
As at 31.03.2015
Current Non Current Current Non
Current Axis Banking Debt Fund Direct Plan 1,000 1,000 683,014 255,691 - 850 - 300 Axis Fixed Term Plan Series 47 (483 Days) 10 - 25,000,000 - - 250 - Axis Short Term Fund 10 10 74,879,353 42,568,240 - 1,150 - 650 Baroda Pioneer Fixed Maturity Plan Series N Plan B (12.4 Months)
- 10 - 15,000,000 - - 150 -
Birla Sunlife Fixed Term Plan Series FW - 10 - 25,000,000 - - 250 - Birla Sunlife Fixed Term Plan Series JI 1099 Days (Earlier 368 Days)
10 10 20,000,000 20,000,000 200 - - 200
Birla Sunlife Fixed Term Plan Series JQ 1099 Day (Earlier 368 Days)
10 10 60,000,000 60,000,000 600 - - 600
Birla Sunlife Fixed Term Plan Series JY 1099 Days (Earlier 367 Days )
10 10 20,000,000 20,000,000 200 - - 200
Birla Sunlife Fixed Term Plan Series KC 1099 Days (Earlier 368 Days )
10 10 20,000,000 20,000,000 200 - - 200
Birla Sunlife Govt Securities Long Term 10 10 11,596,220 11,596,220 - 400 - 400 Birla Sunlife Fixed Term Plan Series LG 1157 Day (Earlier 367 Days)
10 10 60,000,000 80,000,000 - 600 800 -
Birla Sunlife Fixed Term Plan Series LV (1099 Days) 10 10 20,000,000 20,000,000 - 200 - 200
Birla Sunlife Fixed Term Plan Series MA (1099 Days) 10 10 20,000,000 20,000,000 - 200 - 200
Birla Sunlife Fixed Term Plan Series MD (1099 Days) 10 10 50,000,000 50,000,000 - 500 - 500
Birla Sunlife Fixed Term Plan Series MX (1128 Days) 10 - 40,000,000 - - 400 - -
Birla Sunlife Fixed Term Plan Series MY (1107 Days) 10 - 50,000,000 - - 500 - -
Birla Sunlife Dynamic Bond Fund 10 10 234,032,609 234,032,609 - 5,480 - 5,480
Birla Sunlife Income Plus 10 10 35,314,419 35,314,419 - 2,200 - 2,200
Birla Sunlife Saving Fund 100 100 6,332,053 6,332,053 - 1,650 - 1,650
Birla Sunlife Short Term Fund 10 10 213,663,534 40,441,709 - 11,650 - 2,100
Birla Sunlife Treasury Optimizer Plan 100 - 1,141,130 - - 200 - - DSP Black Rock Strategic Bond Fund 10 10 1,705,807 1,407,588 - 2,760 - 2,260 DSP BlackRock Fixed Maturity Plan Series 163 12 Month - 10 - 25,000,000 - - 250 - DHFL Pramerica Banking & PSU Debt Fund (Earlier name DWS Banking & PSU Debt Fund) “
10 - 68,382,816 - - 850 - -
DWS Fixed Maturity Plan Series 57 10 - 50,000,000 - - 500 - DHFL Pramerica Premier Bond Fund (Earlier name DWS Premier Bond Fund)
10 10 25,923,526 25,923,526 - 500 - 500
DHFL Pramerica Gilt Fund (Earlier name DWS Gilt Fund)
10 10 38,515,757 38,515,757 - 500 - 500
DHFL Pramerica Short Term Floating Rate Fund (Earlier name DWS Treasury Fund Investment Plan)
10 10 45,187,833 45,187,833 - 670 - 670
DHFL Pramerica Ultra Short Term Fund (Earlier name DWS Ultra Short Term Fund)
10 10 55,129,962 55,129,962 - 536 - 536
DWS Interval Fund Annual Plan Series 1 - 10 - 24,205,730 - - 250 - DHFL Pramerica Fixed Maturity Plan Series 82 (Earlier name DWS Fixed Maturity Plan Series 82)
10 10 25,000,000 25,000,000 - 250 - 250
DHFL Pramerica Fixed Maturity Plan Series 85 (Earlier name DWS Fixed Maturity Plan Series 85)
10 10 30,000,000 30,000,000 - 300 - 300
DHFL Pramerica Fixed Maturity Plan Series 87 (Earlier name DWS Fixed Maturity Plan Series 87)
10 10 50,000,000 50,000,000 - 500 - 500
DHFL Pramerica Fixed Maturity Plan Series 91 (Earlier name DWS Fixed Maturity Plan Series 91)
10 - 30,000,000 - - 300 - -
Franklin India Treasury Management Account - 1,000 - 550,871 - - - 1,150 HDFC Fixed Maturity Plan 369 Days February 2014 (2) Series 29
10 10 30,000,000 30,000,000 - 300 - 300
HDFC Fixed Maturity Plan 378 Days March 2014 (1) Series 29 10 - 37,000,000 - - 370 - HDFC Fixed Maturity Plan 384 Days March 2014 (1) Series 29 - 10 - 40,000,000 - - 400 - HDFC FMP 1198 Days Feb 2013 (1) Series 24 10 10 5,000,000 5,000,000 50 - - 50 HDFC Fixed Maturity Plan 369 Days January 2014 (1) Series 29 10 10 45,000,000 45,000,000 450 - - 450
(All amounts in ` million, unless otherwise stated)
STANDALONE FINANCIAL STATEMENTS | NOTES TO THE FINANCIAL STATEMENTS 205
Name of the Company/Fund Interest / Dividend
%
Face Value `
31.03.2016
Face Value `
31.03.2015
Number As at
31.03.2016
Number As at 31.03.2015
As at 31.03.2016
As at 31.03.2015
Current Non Current Current Non
Current HDFC Fixed Maturity Plan 370 Days March 2014 (1) Series 29 10 10 25,000,000 25,000,000 - 250 - 250 HDFC Fixed Maturity Plan 372 Days December 2013 (1) Series 29
10 10 32,000,000 32,000,000 320 - - 320
HDFC Floating Rate Income Fund Long Term Plan 10 10 72,897,491 72,897,491 - 1,610 - 1,610 HDFC Floating Rate Income Fund Short Term Plan Growth 10 - 92,433,479 - - 2,200 - - HDFC Mediume Term Opportunity Fund 10 10 386,703,159 146,402,254 - 5,900 - 2,100 HDFC Fixed Maturity Plan 370 D April 2014 (1) Series 31 10 10 20,000,000 20,000,000 - 200 200 - HDFC Fixed Maturity Plan 370 D April 2014 (2) Series 31 10 10 40,000,000 60,000,000 - 400 600 - HDFC Fixed Maturity Plan 1111 Days November 2015 (1) Series 34
10 - 40,000,000 - - 400 - -
HDFC Fixed Maturity Plan 1114D March 2016 (1) Series 35 10 - 250,000,000 - - 2,500 - - HDFC Fixed Maturity Plan 1167 Days January 2016 (1) 10 - 180,000,000 - - 1,800 - - HDFC Fixed Maturity Plan 371 Days June 2014 (3) Series 31 - 10 - 25,000,000 - - 250 - HDFC Floating Rate Income Fund Short Term Plan - 10 - 92,433,479 - - - 2,200 HDFC High Interest Fund - Dynamic Plan 10 10 27,381,267 27,381,267 - 1,340 - 1,340 HDFC Income Fund 10 10 73,743,649 73,743,649 - 2,280 - 2,280 HDFC Short Term Opportunities Fund 10 10 472,665,120 132,564,742 - 7,350 - 2,000 HSBC Income Fund Short Term Plan 10 10 51,140,380 36,386,144 - 1,200 - 850 HSBC Fixed Term Series 109-377 Days - 10 - 50,000,000 - - 500 - ICICI Prudential Fixed Maturity Plan Series 68 745 Days Plan H 10 10 35,000,000 40,000,000 350 - 400 - ICICI Prudential Fixed Maturity Plan Series 73 376 Days Plan Q - 10 - 38,000,000 - - 380 - ICICI Prudential Interval Fund Series VI Annual Interval Plan C 10 10 10,760,176 22,854,844 118 - 250 - ICICI Prudential Blended Plan B 10 10 17,130,523 17,130,523 - 300 - 300 ICICI Prudential Fixed Maturity Plan Series 73 369 Days Plan S - 10 - 35,000,000 - - 350 - ICICI Prudential Fixed Maturity Plan Series 73 369 Days Plan T - 10 - 45,000,000 - - 450 - ICICI Prudential Fixed Maturity Plan Series 74 367 Days Plan D 10 10 60,000,000 85,000,000 - 600 850 - ICICI Prudential Fixed Maturity Plan Series 74 369 Days Plan F 10 10 40,000,000 50,000,000 - 400 500 - ICICI Prudential Fixed Maturity Plan Series 74 370 Days Plan X - 10 - 20,000,000 - - 200 - ICICI Prudential Fixed Maturity Plan Series 74-369 Days Plan K - 10 - 25,000,000 - - 250 - ICICI Prudential Fixed Maturity Plan Series 75- 1100 Days Plan H
10 10 15,000,000 15,000,000 - 150 - 150
ICICI Prudential Fixed Maturity Plan Series 75- 1100 Days Plan O
10 10 15,000,000 15,000,000 - 150 - 150
ICICI Prudential Fixed Maturity Plan Series 75 1100 Days Plan R 10 10 50,000,000 50,000,000 - 500 - 500 ICICI Prudential Fixed Maturity Plan Series 75 1103 Days Plan P 10 10 35,000,000 35,000,000 - 350 - 350 ICICI Prudential Fixed Maturity Plan Series 76 1100 Days Plan G
10 10 50,000,000 50,000,000 - 500 - 500
ICICI Prudential Fixed Maturity Plan Series 76 1100 Days Plan T 10 10 35,000,000 35,000,000 - 350 - 350 ICICI Prudential Fixed Maturity Plan Series 76 1103 Days Plan F 10 10 25,000,000 25,000,000 - 250 - 250 ICICI Prudential Fixed Maturity Plan Series 76 1155 Days Plan K 10 10 30,000,000 30,000,000 - 300 - 300 ICICI Prudential Banking and PSU Debt Fund 10 10 141,291,460 70,952,678 - 2,200 - 1,100 ICICI Prudential Flexible Income 100 100 11,858,050 9,596,222 - 3,100 - 2,500 ICICI Prudential Income Fund 10 10 48,662,288 48,662,288 - 2,040 - 2,040 ICICI Prudential Income Opportunities Fund 10 10 103,095,285 82,661,789 - 1,930 - 1,530 ICICI Prudential Saving Fund - 100 - 3,792,553 - - - 760 ICICI Prudential Ultra Short Term Direct Plan 10 - 551,079,506 - - 8,350 - - IDFC Dynamic Bond Fund 10 10 200,427,616 200,427,616 - 3,320 - 3,320 IDFC Government Securities Fund Investment Plan 10 10 20,690,838 20,690,838 - 350 - 350 IDFC Super Saver Income Fund Medium Term Plan - 10 - 37,686,075 - - - 900 IDFC Super Saver Income Fund Short Term Plan - 10 - 76,757,984 - - - 2,200 IDFC Money Manager Fund Investment Plan 10 10 105,056,990 62,901,943 - 2,200 - 1,250 IDFC Banking Debt Fund 10 10 91,140,256 91,140,256 - 1,000 - 1,000 IDFC Super Saver Income Fund Short Term Plan 10 - 134,579,249 - - 3,950 - - IDFC Super Saver Income Fund Medium Term Plan 10 - 37,686,075 - - 900 - - IDFC Yearly Series Interval Fund Direct Plan Series I 10 10 41,835,157 44,154,984 455 - 480 - IDFC Yearly Series Interval Fund Direct Plan Series II 10 10 21,079,644 21,079,644 230 - 230 - IDFC Fixed Term Plan Series 88 (372 Days) - 10 - 21,000,000 - - 210 - JM Money Manager Fund Super Plus Plan Growth Option 10 - 37,591,347 - - 750 - -
(All amounts in ` million, unless otherwise stated)
Notes to the Financial Statements
206 MARUTI SUZUKI INDIA LIMITED
Name of the Company/Fund Interest / Dividend
%
Face Value `
31.03.2016
Face Value `
31.03.2015
Number As at
31.03.2016
Number As at 31.03.2015
As at 31.03.2016
As at 31.03.2015
Current Non Current Current Non
Current JP Morgan Fixed Maturity Plan Series 23 10 10 8,000,000 8,000,000 80 - - 80 JP Morgan Income Fund Series 301 - 10 - 85,121,701 - - 851 - JP Morgan Active Income Bond Fund 10 10 93,948,790 93,948,790 - 1,230 - 1,230 JP Morgan India Liquid Fund 10 10 99,231,756 197,154,896 - 1,008 - 2,002 Kotak Bond Scheme Plan A 10 10 84,088,525 84,088,525 - 3,240 - 3,240 Kotak Bond Short Term 10 - 20,779,182 - - 550 - - Kotak Treasury Advantage Fund 10 10 144,239,928 80,748,992 - 3,230 - 1,800 Kotak Fixed Maturity Plan Series 136 10 10 35,000,000 35,000,000 350 - - 350 Kotak Fixed Maturity Plan Series 142 10 10 35,000,000 50,000,000 - 350 500 - Kotak Fixed Maturity Plan Series 147 - 10 - 40,000,000 - - 400 - Kotak Fixed Maturity Plan Series 150 10 10 25,000,000 25,000,000 - 250 - 250 Kotak Fixed Maturity Plan Series 151 10 10 25,000,000 40,000,000 - 250 400 - Kotak Fixed Maturity Plan Series 155 - 10 - 40,000,000 - - 400 - Kotak Fixed Maturity Plan Series 156 10 10 18,000,000 55,000,000 - 180 550 - Kotak Fixed Maturity Plan Series 157 - 10 - 60,000,000 - - 600 - Kotak Fixed Maturity Plan Series 158 10 10 25,000,000 40,000,000 - 250 400 - Kotak Fixed Maturity Plan Series 159 10 10 20,000,000 30,000,000 - 200 300 - Kotak Fixed Maturity Plan Series 171 10 10 20,000,000 20,000,000 - 200 - 200 Kotak Fixed Maturity Plan Series 176 10 - 25,000,000 - - 250 - - Kotak Fixed Maturity Plan Series 178 10 - 45,000,000 - - 450 - - L & T Fixed Maturity Plan Series X Plan S - 10 - 25,000,000 - - 250 - L & T Fixed Maturity Plan Series X Plan T - 10 - 43,000,000 - - 430 - L& T Ultra Short Term Fund 10 10 55,748,239 122,646,125 - 682 - 1,500 L&T Liquid Fund - 1,000 - 263,266 - - - 500 L & T Short Term Opportunities Fund 10 - 154,350,401 - - 2,150 - - LIC Nomura MF Fixed Maturity Plan Series 76 382 Days - 10 - 20,000,000 - - 200 - LIC Nomura MF Fixed Maturity Plan Series 79 373 Days - 10 - 20,000,000 - - 200 - LIC Nomura MF Fixed Maturity Plan Series 81 371 Days - 10 - 25,000,000 - - 250 - LIC Nomura MF Fixed Maturity Plan Series 86 370 Days - 10 - 15,000,000 - - 150 - Reliance Banking & PSU Debt Fund Direct Plan 10 - 173,988,866 - - 1,800 - - Reliance Yearly Interval Fund Series 2 10 10 128,329,697 128,329,697 1,400 - 1,400 - Reliance Yearly Interval Fund Series 3 10 10 36,525,011 36,525,011 400 - 400 - Reliance Yearly Interval Fund Series I 10 10 220,616,623 220,616,623 2,400 - 2,400 - Reliance Fixed Horizon Fund XXII Series 34 - 10 - 5,000,000 - - 50 - Reliance Fixed Horizon Fund XXVI Series 2 - 10 - 80,000,000 - - 800 - Reliance Fixed Horizon Fund XXVI Series 5 - 10 - 20,000,000 - - 200 - Reliance Fixed Horizon Fund XXVI Series 17 10 10 34,000,000 34,000,000 - 340 340 - Reliance Fixed Horizon Fund XXVI Series 8 - 10 - 50,000,000 - - 500 - Reliance Fixed Horizon Fund XXVI Series 9 - 10 - 175,000,000 - - 1,750 - Reliance Fixed Horizon Fund XXVII Series 11 10 10 45,000,000 45,000,000 - 450 - 450 Reliance Fixed Horizon Fund XXVIII Series 10 10 10 45,000,000 45,000,000 - 450 - 450 Reliance Fixed Horizon Fund XXIX Series 10 10 - 30,000,000 - - 300 - - Reliance Fixed Horizon Fund XXIX Series 16 10 - 50,000,000 - - 500 - - Reliance Fixed Horizon Fund XXIX Series 8 10 - 50,000,000 - - 500 - - Reliance Fixed Horizon Fund XXIX Series 9 10 - 60,000,000 - - 600 - - Reliance Fixed Horizon Fund XXX Series 4 10 - 85,000,000 - - 850 - - Reliance Yearly Interval Fund Series 6 10 10 22,964,644 22,964,644 250 - 250 - Reliance Yearly Interval Fund Series 8 10 10 33,812,627 46,058,753 367 - 500 - Reliance Dynamic Bond Fund 10 10 132,568,584 132,568,584 - 2,500 - 2,500 Reliance Floating Rate Fund Short Term 10 10 277,895,589 72,977,200 - 6,300 - 1,600 Reliance Income Fund 10 10 9,712,908 9,712,908 - 450 - 450 Reliance Money Manager Fund 10 - 517,148 - - 1,000 - - Reliance Short Term Fund 10 - 116,240,942 - - 3,300 - - Religare Invesco Ultra Short Term Fund 1,000 1,000 1,254,342 2,822,269 - 1,333 - 3,000 Religare Invesco Fixed Maturity Plan Series 23 Plan H (370 Days)
10 10 25,000,000 25,000,000 - 250 250 -
Religare Invesco Fixed Maturity Plan Series 23 Plan J (370 Days) - 10 - 30,000,000 - - 300 - Religare Invesco Fixed Maturity Plan Series 23 Plan L (370 Days) - 10 - 17,821,656 - - 178 -
(All amounts in ` million, unless otherwise stated)
STANDALONE FINANCIAL STATEMENTS | NOTES TO THE FINANCIAL STATEMENTS 207
Name of the Company/Fund Interest / Dividend
%
Face Value `
31.03.2016
Face Value `
31.03.2015
Number As at
31.03.2016
Number As at 31.03.2015
As at 31.03.2016
As at 31.03.2015
Current Non Current Current Non
Current Religare Invesco Fixed Maturity Plan Series 23 Plan O 370 Days - 10 - 10,000,000 - - 100 - Religare Invesco Fixed Maturity Plan Series 25 Plan A (1098 Days)
10 10 25,000,000 25,000,000 - 250 - 250
Religare Invesco Fixed Maturity Plan Series 25 Plan F (1126 Days)
10 10 30,000,000 30,000,000 - 300 - 300
Religare Invesco Fixed Maturity Plan Series 26 (1098 Days) 10 - 30,000,000 - - 300 - - Religare Short Term Fund 1,000 1,000 751,980 751,980 - 1,320 - 1,320 Religare Invesco Fixed Maturity Plan 376 Days Series 23 Plan G - 10 - 25,000,000 - - 250 - Religare Invesco Fixed Maturity Plan Series 22 Plan F (15 Months)
- 10 - 30,000,000 - - 300 -
Religare Invesco Fixed Maturity Plan Series 22 Plan H (427 Days)
10 10 25,000,000 25,000,000 - 250 - 250
Religare Invesco Fixed Maturity Plan Series 22 Plan L (14 MOnth)
- 10 - 10,000,000 - - 100 -
SBI Debt Fund Series A-14 380 Days - 10 - 30,000,000 - - 300 - SBI Debt Fund Series A 35 369 Days - 10 - 25,000,000 - - 250 - SBI Debt Fund Series A-17 366 Days - 10 - 65,000,000 - - 650 - SBI Debt Fund Series A-19 366 Days - 10 - 19,500,000 - - 195 - SBI Debt Fund Series A-20 366 Days - 10 - 40,000,000 - - 400 - SBI Debt Fund Series B- 8 (1105 Days) 10 10 25,000,000 25,000,000 - 250 - 250 SBI Debt Fund Series B- 18 (1100 Days) 10 - 30,000,000 - - 300 - - SBI Debt Fund Series B 26 (1100 Days ) 10 - 30,000,000 - - 300 - - SBI Debt Fund Series B 27 (1100 Days) 10 - 30,000,000 - - 300 - - SBI Dynamic Bond Fund 10 10 160,943,391 160,943,391 - 2,800 - 2,800 SBI Premier Liquid Fund - 1,000 - 1,325,633 - - - 2,900 SBI Short Term Debt Fund 10 10 150,936,462 123,538,537 - 2,430 - 1,980 SBI Ultra Short Term Debt Fund 1,000 1,000 1,529,671 920,996 - 2,700 - 1,600 Sundaram Fixed Term Plan GY 10 - 65,000,000 - - 650 - - Sundaram Fixed Term Plan HB 10 - 50,000,000 - - 500 - - Sundaram Money Fund 10 10 183,330,755 183,330,755 - 1,870 - 1,870 Sundaram Ultra Short Term Fund 10 10 26,443,089 26,443,089 - 279 - 279 Sundaram Fixed Term Plan FI 383 Days - 10 - 25,000,000 - - 250 - Sundaram Flexible Fund Short Term Plan 10 10 65,468,998 36,085,022 - 1,380 - 730 Tata Fixed Maturity Plan Series 45 Scheme C 10 10 17,370,158 17,370,158 174 - - 174 Tata Fixed Maturity Plan Series 46 Scheme R - 10 - 20,000,000 - - 200 - Tata Fixed Maturity Plan Series 47 Scheme C - 10 - 20,000,000 - - 200 - Tata Fixed Maturity Plan Series 47 Scheme D - 10 - 40,000,000 - - 400 - Tata Fixed Maturity Plan Series 47 Scheme F - 10 - 20,000,000 - - 200 - Tata Floater Fund Growth Option 10 - 1,093,981 - - 2,350 - - Tata Short Term Bond Fund 10 10 200,971,748 59,062,611 - 5,420 - 1,520 UTI Fixed Term Income Fund Series XVII-I (369 Days) 10 10 13,699,256 13,699,256 137 - - 137 UTI Fixed Term Income Fund Series XVII-XIII (369) Days 10 10 32,000,000 32,000,000 - 320 - 320 UTI Fixed Term Income Fund Series XIX IX 369 Days 10 10 54,995,921 75,000,000 - 550 750 - UTI Fixed Term Income Fund Series XIX VI 366 Days 10 10 25,000,000 25,000,000 - 250 250 - UTI Fixed Term Income Fund Series XIX XI 366 Days 10 10 33,039,648 40,000,000 - 330 400 - UTI Fixed Term Income Fund Series XVIII VIII (366 Days) - 10 - 25,000,000 - - 250 - UTI Fixed Term Income Fund Series XX VIII (1105 Days) 10 10 50,000,000 50,000,000 - 500 - 500 UTI Fixed Term Income Fund Series XX X (1105 Days) 10 10 30,000,000 30,000,000 - 300 - 300 UTI Fixed Term Income Fund Series XXI XI (1112 Days ) 10 10 50,000,000 50,000,000 - 500 - 500 UTI Fixed Term Income Fund Series XXII XIV (1100 Days) 10 - 45,000,000 - - 450 - - UTI Fixed Term Income Fund Series XXIII-III (1098 Days) 10 - 40,000,000 - - 400 - - UTI Fixed Term Income Fund Series XXIII- VII (1098) Days 10 - 35,000,000 - - 350 - - UTI Treasury Advantage Fund 1,000 - 2,889,912 - - 5,520 - - UTI Bond Fund 10 10 53,181,546 53,181,546 - 2,200 - 2,200 UTI Floating Rate Fund 1,000 1,000 705,166 705,166 - 1,600 - 1,600
8,730 167,428 29,964 96,478
(All amounts in ` million, unless otherwise stated)
Notes to the Financial Statements
208 MARUTI SUZUKI INDIA LIMITED
55 Statement on Assets, Liabilities, Income & Expenses of Joint Ventures
Details of the Company’s share in the Joint Venture Assets ,Liabilities ,Income & Expenses as required by Accounting Standard 27 “Financial Reporting of Interest in Joint Venture” is as indicated below.
SI. No Name of Company Country of
Incorporation % Ownership Interest
As at 31.03.2016
As at 31.03.2015
1 Mark Exhaust Systems Limited India 44.37 44.372 Bellsonica Auto Components India Limited India 30.00 30.003 FMI Automotive Components Private Limited India 49.00 49.004 Krishna Ishizaki Auto Limited India 15.00 15.005 Manesar Steel Processing (India) Private Limited India 11.83 11.836 Maruti Insurance Broking Private Limited India 46.26 46.26
7 Plastic Omnium Auto Inergy Manufacturing India Private Limited (Formerly known as Inergy Automotive Systems Manufacturing India Private Limited)
India 26.00 26.00
2015-16 2014-15Detail of AssetsNon-current AssetsTangible Assets 1,847 2,076Intangible Assets 39 25Capital Work in Progress 65 73Net Block 1,951 2,174Non-Current Investments 1,585 45 Long Term Loans and Advances 40 152 Other Non-Current Assets 1 - Current AssetsCurrent Investments 18 1,063 Inventories 650 591 Trade Receivables 876 707 Cash and Bank Balances 261 149 Short Term Loans and Advances 375 260 Other Current Assets 192 10 Detail of LiabilitiesNon-current LiabilitiesLong Term Borrowings 1,471 1,335 Deferred Tax Liabilities (Net) 1 24 Long Term Provisions 1 32 Current LiabilitiesShort Term Borrowings 133 171Trade Payables 1,122 910Other Current Liabilities 403 454Short Term Provisions 46 7 Detail of IncomeNet Sale of Products 6,995 6,665Other Operating Revenue 1,144 1,035
(All amounts in ` million, unless otherwise stated)
STANDALONE FINANCIAL STATEMENTS | NOTES TO THE FINANCIAL STATEMENTS 209
2015-16 2014-15Other Income 51 153Detail of ExpenditureCost of Material Consumed 5,253 5,161Purchase of Stock-in-Trade 10 50Change in Inventories of Finished Goods, Work-in-Progress and Stock-in-Trade 15 (53)Employees Benefit Expenses 498 439Finance Costs 120 118Depreciation and Amortisation Expense 415 423Other Expenses 991 834Tax Expenses Current 356 288Tax Expenses Deferred (23) (49)Details of Contingent LiabilitiesExcise Demands 9 9 Income Tax demands 10 4 Capital commitments 151 156
56 The Company has entered into Contract Manufacturing Agreement (CMA) with Suzuki Motor Gujarat Private Limited (the wholly owned subsidiary of Suzuki Motor Corporation, Japan), the consent of which, alongwith the execution of Lease Deed, Deed of Assignment and any other related agreement or documentation, was accorded during the current year by the shareholders through the process of postal ballot.
57 Previous Year’s figures have been recasted / regrouped where considered necessary to conform with the current year’s presentation.
For Price WaterhouseFirm Registration Number: 301112E KENICHI AYUKAWA TOSHIAKI HASUIKEChartered Accountants Managing Director & CEO Joint Managing Director
ANUPAM DHAWAN AJAY SETH S. RAVI AIYARPartner Chief Financial Officer Executive Director (Legal) & Company SecretaryMembership Number - 084451