9/30/2011 1 October 5 th , 2011 Driving Results through Strategic Data Sourcing and Optimization: Life Line Global Case Study Trish Mathe – Vice President of Database Marketing, Life Line Screening Ozgur Dogan – General Manager, Data Solutions Group, Merkle Presenter Backgrounds 2 • Trish Mathe • Vice President of Database Marketing at Life Line Screening • Over 10 years of database marketing experience both in financial services and healthcare industries • Areas of expertise include: building and maintaining marketing infrastructure and automation, prospect and customer database management, campaign management and measurement • Experienced in marketing to the fifty plus crowd, healthcare professionals, and several other specialty market segments • Ozgur Dogan • General Manager of Data Solutions Group at Merkle • Oversees the delivery of analytical data sourcing and optimization solutions for Merkle’s clients across all industry verticals • Spent 7 years at Merkle and has 15 years of industry experience in building, implementing and integrating database marketing solutions • Technical MBA Degree from the University of Georgia Session Overview 1. Evolution in the CRM Data Landscape 2. Developing a quantitative framework to assess value of data 3. Future Trends and Innovation Opportunities 4. Life Line Data Sourcing & Optimization Case Study 3
Transcript
9/30/2011
1
October 5th, 2011
Driving Results through Strategic Data Sourcing and Optimization: Life Line Global Case Study
Trish Mathe – Vice President of Database Marketing, Life Line Screening
Ozgur Dogan – General Manager, Data Solutions Group, Merkle
Presenter Backgrounds
2
• Trish Mathe• Vice President of Database Marketing at Life Line Screening
• Over 10 years of database marketing experience both in financial services and healthcare industries
• Areas of expertise include: building and maintaining marketing infrastructure and automation, prospect and customer database management, campaign management and measurement
• Experienced in marketing to the fifty plus crowd, healthcare professionals, and several other specialty market segments
• Ozgur Dogan• General Manager of Data Solutions Group at Merkle
• Oversees the delivery of analytical data sourcing and optimization solutions for Merkle’s clients across all industry verticals
• Spent 7 years at Merkle and has 15 years of industry experience in building, implementing and integrating database marketing solutions
• Technical MBA Degree from the University of Georgia
Session Overview
1. Evolution in the CRM Data Landscape
2. Developing a quantitative framework to assess value of data
3. Future Trends and Innovation Opportunities
4. Life Line Data Sourcing & Optimization Case Study
3
9/30/2011
2
Evolution of the Marketing Landscape
Global Market Trends
• Fundamental changes in the consumer decision making and buying process
• Advancing and evolving technology use
• Expanding fragmentation – media and channels
• Data explosion driven by emergence of digital media
• Clutter and confusion in the data landscape
• Increased Accountability and Measurement
Ultimately, these influencers are changing the way marketers will create competitive advantage in the future.
5
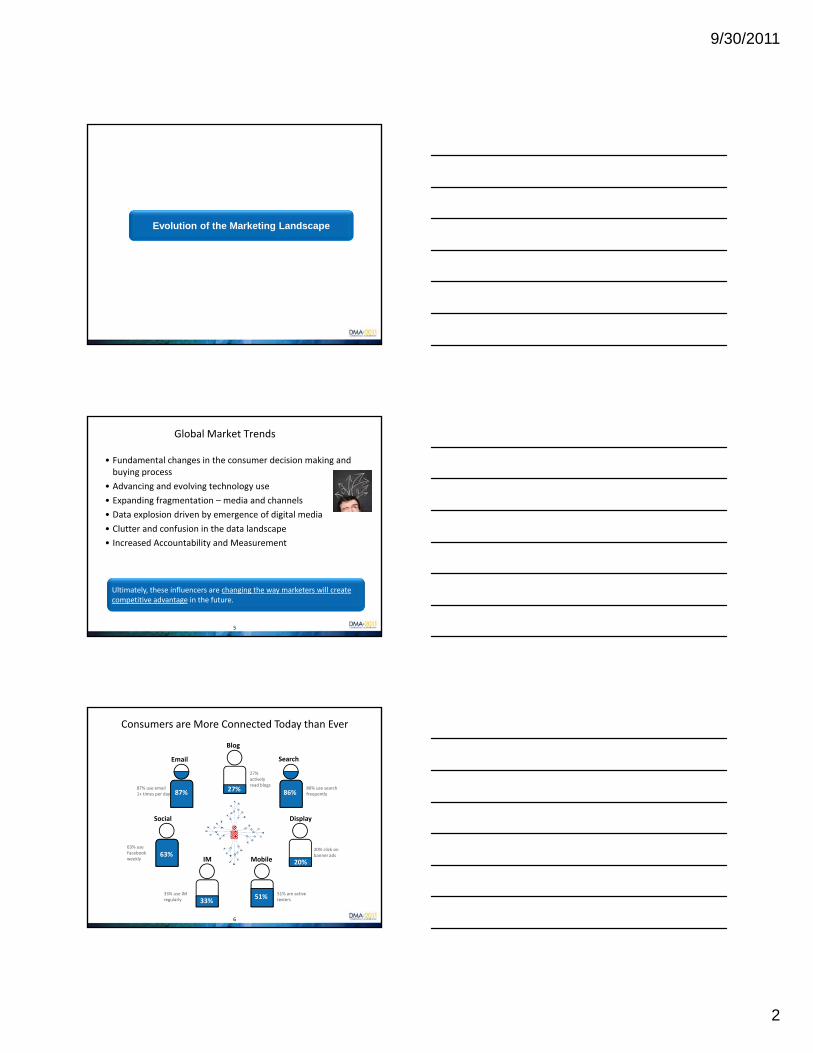
Consumers are More Connected Today than Ever
86%
63%
27%
20%
87%
Social
Email
Blog
Search
Display
87% use email 1+ times per day
63% use Facebook weekly
33% use IM regularly
51% are active texters
20% click on banner ads
86% use search frequently
27% actively read blogs
MobileIM
33%51%
6
9/30/2011
3
Database Marketing Landscape is Evolving
DbM 1.0 DbM 2.0
Direct/Identified Model New Entrants
Domestic US and International Solutions
Single Campaign/ Media Targeting Integrated Media Optimization
Key Trends
Cost Pressure Increased Cost Pressure
Offline focus Digitalization
7
Data Explosion!
Today, the codified information base of the world is believed to double every 11 hours
“Organizations are overwhelmed with the amount of data they have and struggle to understand how to use it to drive business
results.” (2010 MIT Sloan/IBM Study)
“We create as much information in two days now as we did from the dawn of man through 2003.”
Eric Schmidt, Google CEO
15 out of 17 sectors in the United States have more data stored per company than the US library of Congress
8
9
New Channels& Media
CustomerCentricity
Accountability&
Measurement
Technology
Increased Complexity
CostPressures
Focus onThe Customer
IntegratedApproach
AnalyticData Sourcing& Optimization
IncreasedMessageVolume
ImproveROI
Emergence Challenges Objectives Solution
Major Factors Driving Opportunity
9
9/30/2011
4
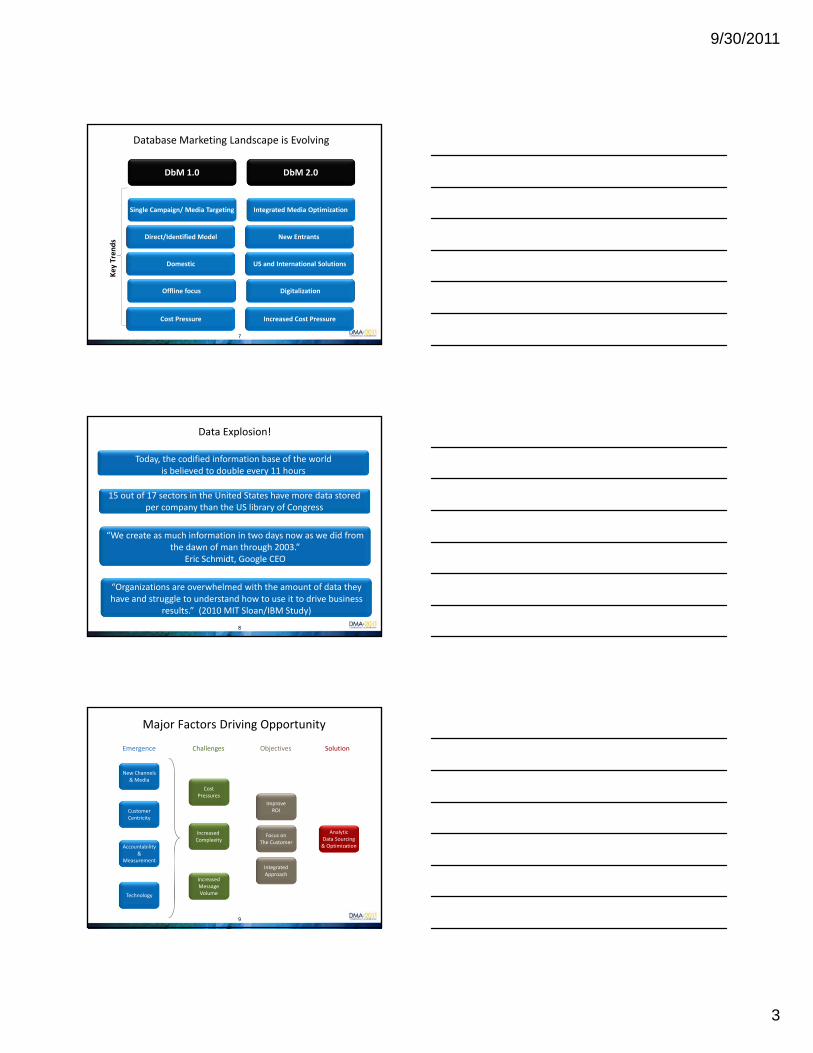
Business Impact of Analytical Data Sourcing
$0
$500,000
$1,000,000
$1,500,000
$2,000,000
$2,500,000
$3,000,000
$3,500,000
$4,000,000
Jun Jul Aug Sep Total
$490,515
$820,040
$268,479$456,425
$2,035,459
Total List Spends and Savings
Leading direct marketer saved $2 MM in list sourcing cost in it first four 4 months through analytical data sourcing optimization without negatively impacting response
2010 Costs 2011 Costs Savings
10
CRM Data Landscape
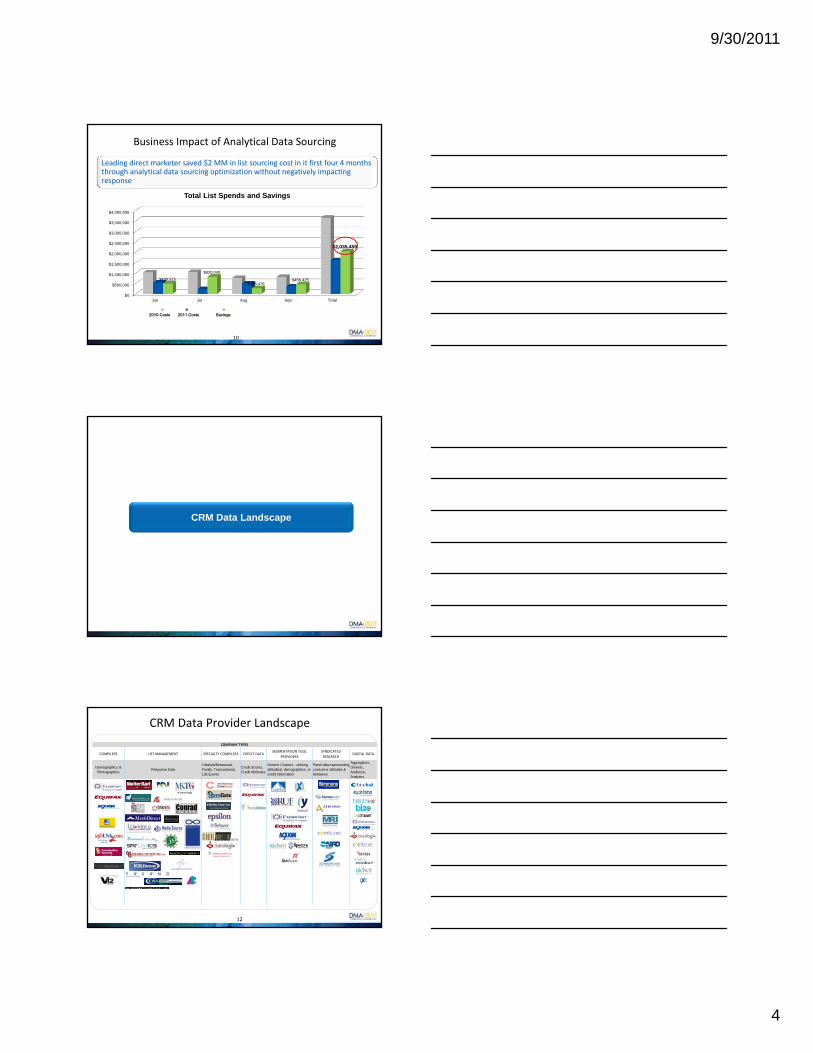
COMPANY TYPES
COMPILERS LIST MANAGEMENT SPECIALTY COMPILERS CREDIT DATASEGMENTATION TOOL
PROVIDERS
SYNDICATED
RESEARCHDIGITAL DATA
Demographics & Firmographics
Response DataLifestyle/Behavioral, Realty, Transactional, Life Events
Credit Scores, Credit Attributes
Generic Clusters - utilizing attitudinal, demographics, or credit information
Panel data representing consumer attitudes & behaviors
Aggregators, Owners, Audience, Analytics
CRM Data Provider Landscape
12
9/30/2011
5
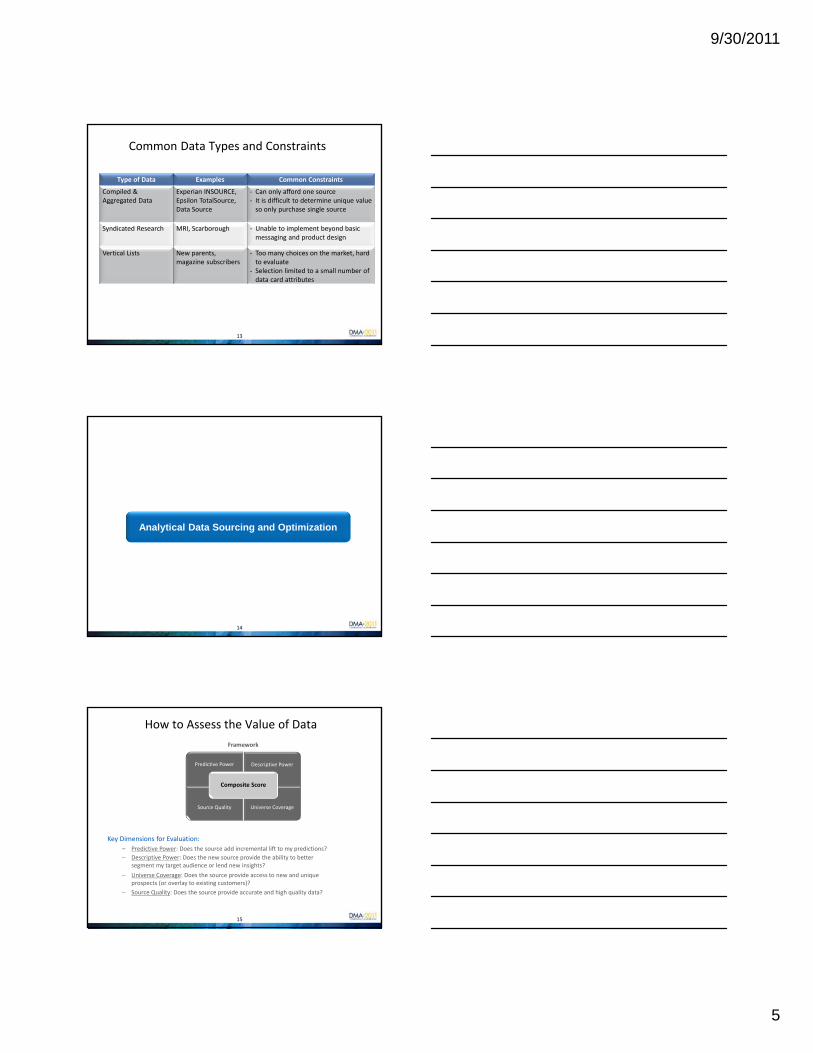
Common Data Types and Constraints
Type of Data Examples Common Constraints
Compiled & Aggregated Data
Experian INSOURCE, Epsilon TotalSource, Data Source
‐ Can only afford one source‐ It is difficult to determine unique value so only purchase single source
Syndicated Research MRI, Scarborough ‐ Unable to implement beyond basic messaging and product design
Vertical Lists New parents, magazine subscribers
‐ Too many choices on the market, hard to evaluate
‐ Selection limited to a small number of data card attributes
13
Analytical Data Sourcing and Optimization
14
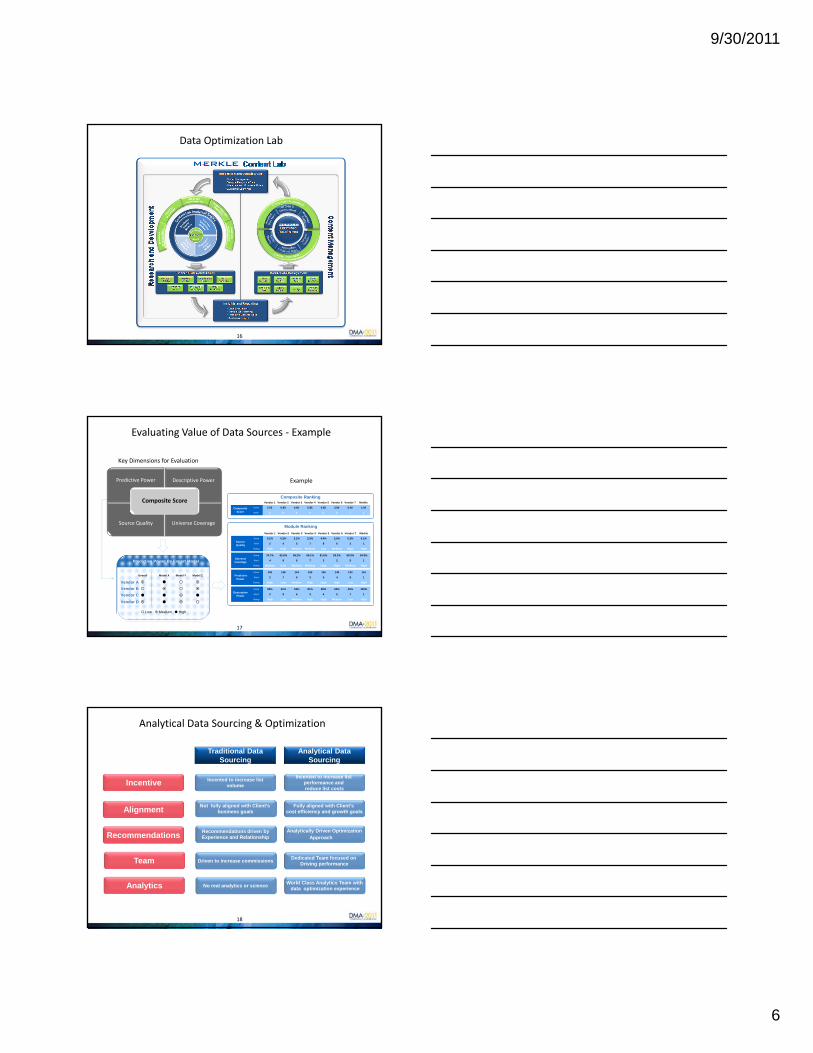
Framework
Key Dimensions for Evaluation:
– Predictive Power: Does the source add incremental lift to my predictions?
Predictive Power Descriptive Power
Source Quality Universe Coverage
Composite Score
How to Assess the Value of Data
– Descriptive Power: Does the new source provide the ability to better segment my target audience or lend new insights?
– Universe Coverage: Does the source provide access to new and unique prospects (or overlay to existing customers)?
– Source Quality: Does the source provide accurate and high quality data?
Rating Medium Low Medium Medium High High Medium High
Score 150 138 144 150 145 149 134 151
Rank 2 7 6 3 5 4 8 1
Rating High Low Medium High High High Low High
Score 95% 31% 53% 81% 80% 63% 45% 100%
Rank 2 8 6 3 4 5 7 1
Rating High Low Medium High High Medium Low High
Source Quality
Universe Coverage
Predictive Power
Descriptive Power
Predictive Power Descriptive Power
Source Quality Universe Coverage
Composite Score
17
Analytical Data Sourcing & Optimization
18
Incentive
Alignment
Recommendations
Team
Analytical Data Sourcing
Incented to increase list performance and reduce list costs
Fully aligned with Client’s cost efficiency and growth goals
Analytically Driven OptimizationApproach
Dedicated Team focused on Driving performance
World Class Analytics Team with data optimization experience
Incented to increase listvolume
Traditional Data Sourcing
Not fully aligned with Client’s business goals
Recommendations driven byExperience and Relationship
Driven to increase commissions
No real analytics or science Analytics
9/30/2011
7
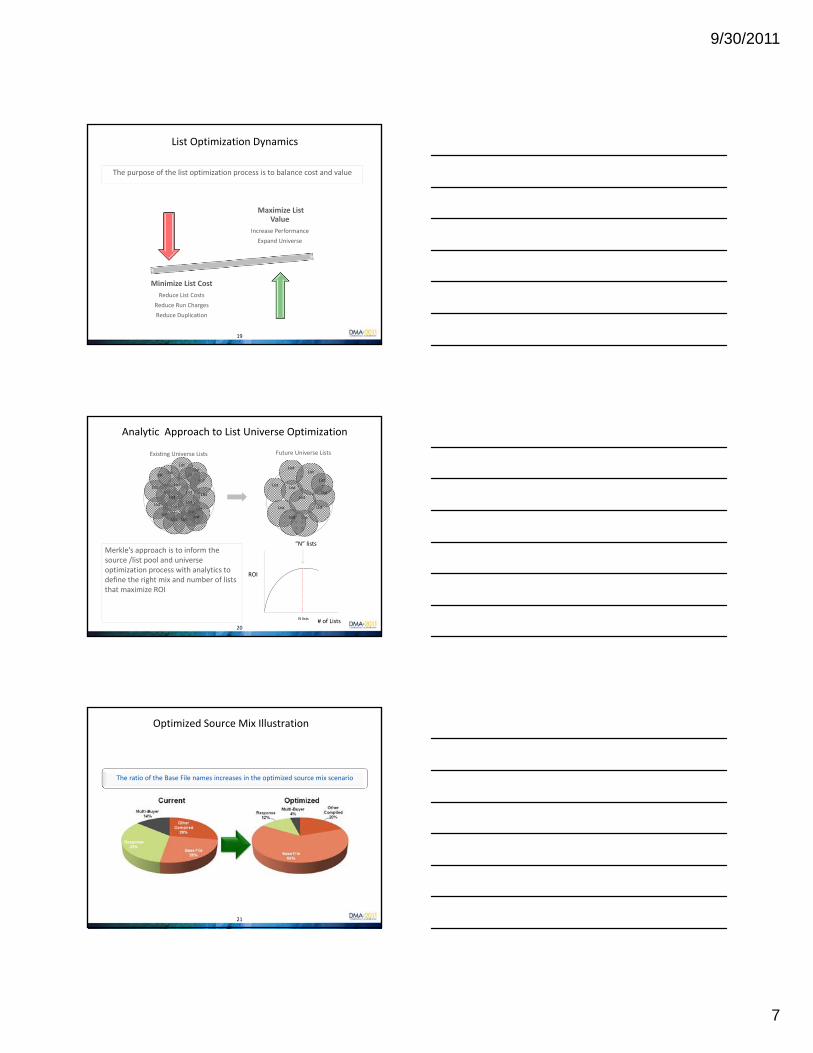
List Optimization Dynamics
Minimize List Cost
Reduce List Costs
Reduce Run Charges
Reduce Duplication
Maximize List Value
Increase Performance
Expand Universe
The purpose of the list optimization process is to balance cost and value
19
Analytic Approach to List Universe Optimization
List List
List List
List List
List
List
List
List
List
List
List
List
List
List List
List List
List
List
Merkle’s approach is to inform the source /list pool and universe optimization process with analytics to define the right mix and number of lists that maximize ROI
List List
List List
List
List
List
List
List
List
ROI
# of Lists
“N” lists
N lists
Existing Universe Lists Future Universe Lists
List
20
Optimized Source Mix Illustration
The ratio of the Base File names increases in the optimized source mix scenario
21
9/30/2011
8
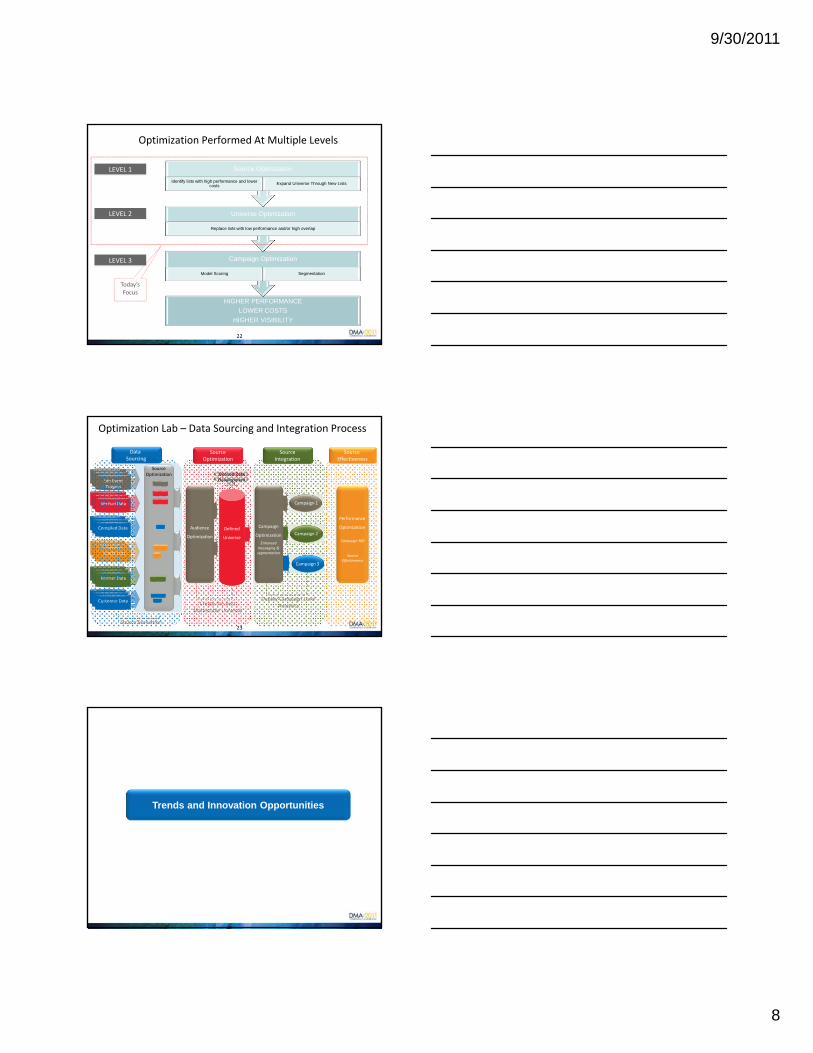
Optimization Performed At Multiple Levels
HIGHER PERFORMANCE
LOWER COSTS
HIGHER VISIBILITY
Campaign Optimization
Model Scoring Segmentation
Universe Optimization
Replace lists with low performance and/or high overlap
Source Optimization
Identify lists with high performance and lower costs Expand Universe Through New Lists
LEVEL 1
LEVEL 2
LEVEL 3
Today’s Focus
22
Optimization Lab – Data Sourcing and Integration Process
Life Event Triggers
Vertical Data
Compiled Data
Credit Data
Partner Data
Customer Data
SourceOptimization
Audience
Optimization
Campaign
Optimization
Enhanced messaging & segmentation
Defined
Universe
Campaign 1
Campaign 3
Campaign 2
Performance
Optimization
Source Evaluation
Create the best Marketable Universe
Deploy Campaign Level Analytics
Derived Data Development
Data Sourcing
SourceOptimization
SourceIntegration
Source Effectiveness
Campaign ROI
Source Effectiveness
23
Trends and Innovation Opportunities
9/30/2011
9
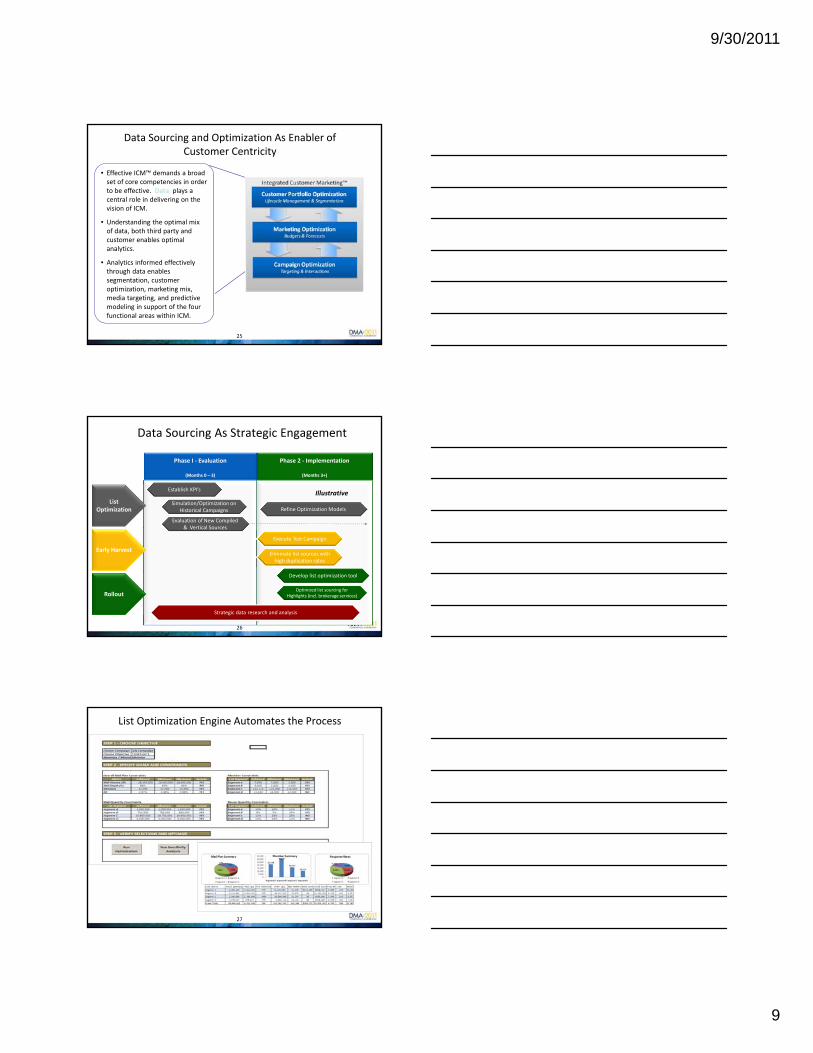
Data Sourcing and Optimization As Enabler of Customer Centricity
• Effective ICM™ demands a broad set of core competencies in order to be effective. Data plays a central role in delivering on the vision of ICM.
• Understanding the optimal mix of data, both third party and customer enables optimal analytics.
• Analytics informed effectively through data enables segmentation, customer optimization, marketing mix, media targeting, and predictive modeling in support of the four functional areas within ICM.
25
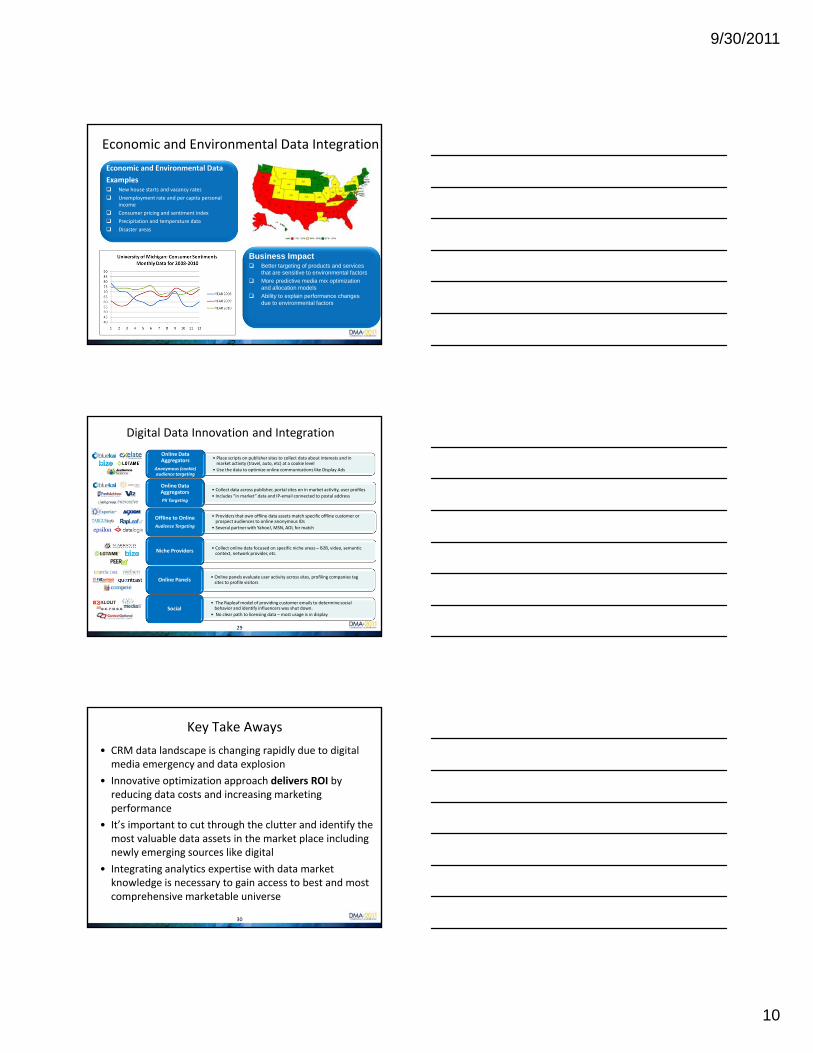
Data Sourcing As Strategic Engagement
26
Phase I ‐ Evaluation
(Months 0 – 3)
Phase 2 ‐ Implementation
(Months 3+)
Rollout
Early Harvest
List Optimization
Establish KPI’s
Evaluation of New Compiled & Vertical Sources
Simulation/Optimization on Historical Campaigns
Optimized list sourcing for Highlights (incl. brokerage services)
Execute Test Campaign
Develop list optimization tool
Refine Optimization Models
Strategic data research and analysis
26
Illustrative
Eliminate list sources with high duplication rates
26
27
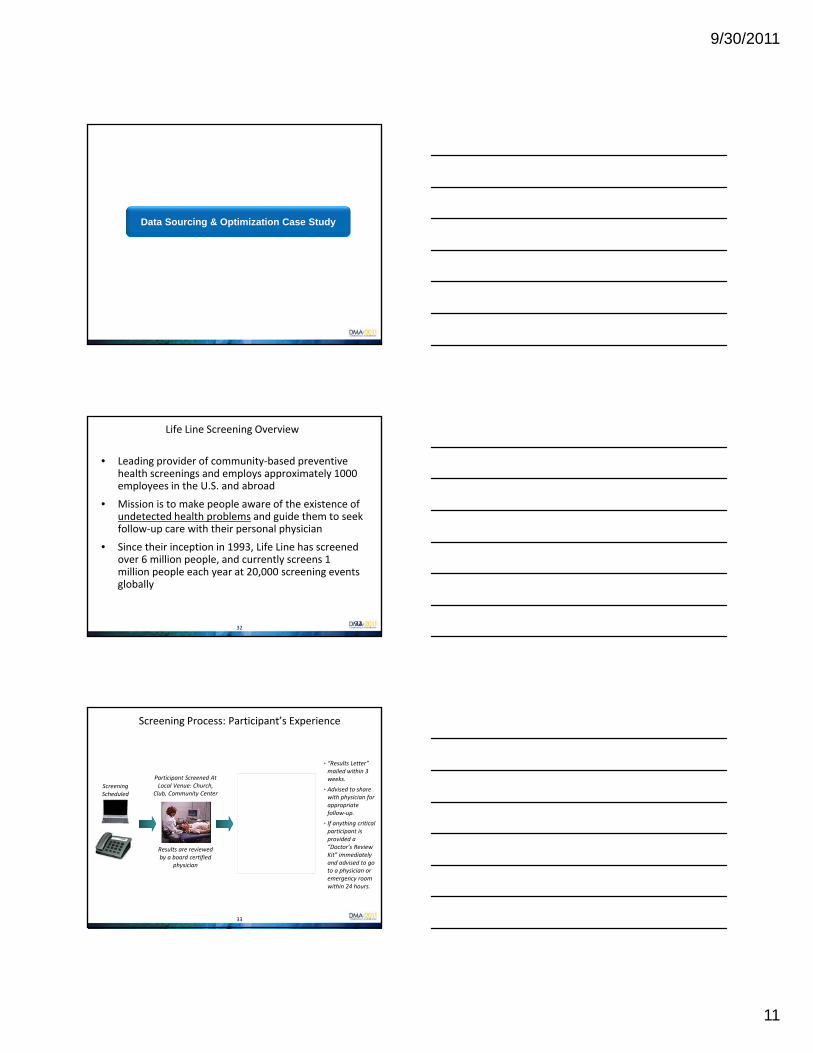
List Optimization Engine Automates the Process
9/30/2011
10
Economic and Environmental Data Integration
2
Economic and Environmental Data
Examples New house starts and vacancy rates
Unemployment rate and per capita personal income
Consumer pricing and sentiment index
Precipitation and temperature data
Disaster areas
Business Impact Better targeting of products and services
that are sensitive to environmental factors
More predictive media mix optimization and allocation models
Ability to explain performance changes due to environmental factors
Digital Data Innovation and Integration
• Place scripts on publisher sites to collect data about interests and in market activity (travel, auto, etc) at a cookie level
• Use the data to optimize online communications like Display Ads
Online Data Aggregators
Anonymous (cookie)audience targeting
• Collect data across publisher, portal sites on in market activity, user profiles
• Includes “in market” data and IP‐email connected to postal address
Online Data Aggregators
PII Targeting
• Providers that own offline data assets match specific offline customer or prospect audiences to online anonymous IDs
• Several partner with Yahoo!, MSN, AOL for match
Offline to Online
Audience Targeting
• Collect online data focused on specific niche areas – B2B, video, semantic context, network provider, etc.
Niche Providers
• Online panels evaluate user activity across sites, profiling companies tag sites to profile visitors
Online Panels
• The Rapleaf model of providing customer emails to determine social behavior and identify influencers was shut down.
• No clear path to licensing data – most usage is in display Social
29
Key Take Aways
• CRM data landscape is changing rapidly due to digital media emergency and data explosion
• Innovative optimization approach delivers ROI by reducing data costs and increasing marketing performance
• It’s important to cut through the clutter and identify the most valuable data assets in the market place including newly emerging sources like digital
• Integrating analytics expertise with data market knowledge is necessary to gain access to best and most comprehensive marketable universe
30
9/30/2011
11
Data Sourcing & Optimization Case Study
32
Life Line Screening Overview
• Leading provider of community‐based preventive health screenings and employs approximately 1000 employees in the U.S. and abroad
• Mission is to make people aware of the existence of undetected health problems and guide them to seek follow‐up care with their personal physician
• Since their inception in 1993, Life Line has screened over 6 million people, and currently screens 1 million people each year at 20,000 screening events globally
32
Screening Process: Participant’s Experience
Screening Scheduled
Participant Screened At Local Venue: Church,
Club, Community Center
Results are reviewed by a board certified
physician
• “Results Letter” mailed within 3 weeks.
• Advised to share with physician for appropriate follow‐up.
• If anything critical participant is provided a “Doctor’s Review Kit” immediately and advised to go to a physician or emergency room within 24 hours.
33
9/30/2011
12
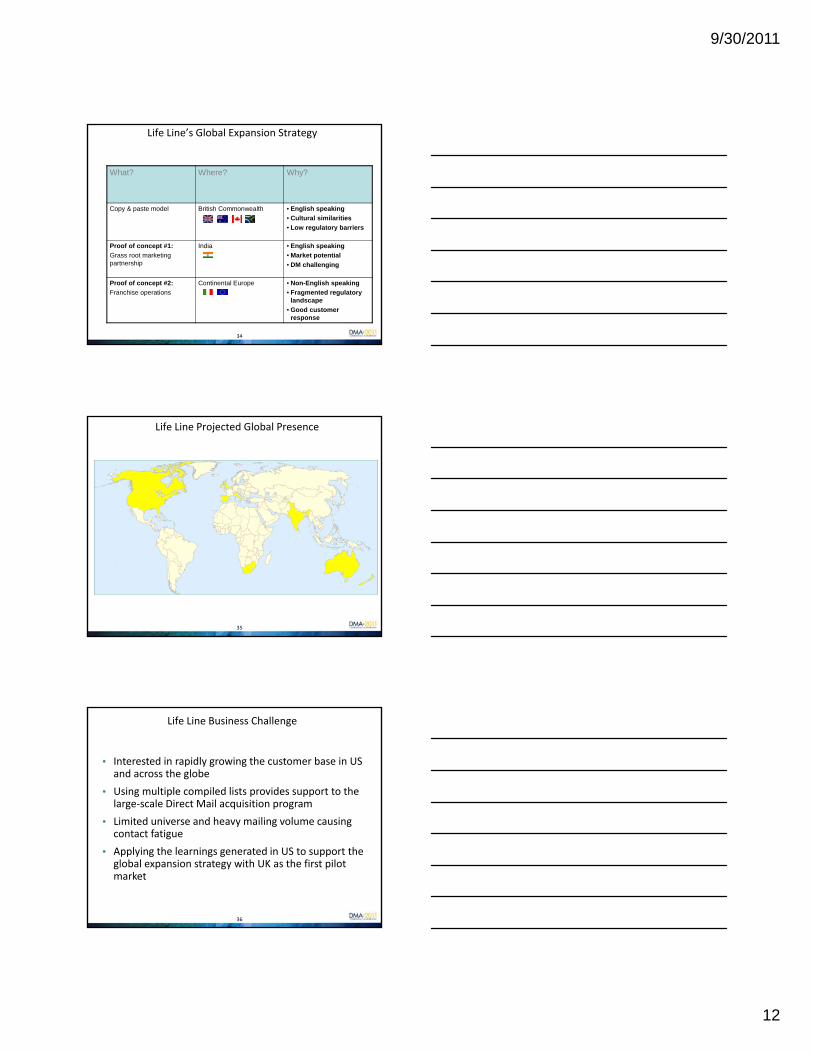
Life Line’s Global Expansion Strategy
What? Where? Why?
Copy & paste model British Commonwealth • English speaking
• Cultural similarities
• Low regulatory barriers
Proof of concept #1:
Grass root marketing partnership
India • English speaking
• Market potential
• DM challenging
Proof of concept #2:
Franchise operations
Continental Europe • Non-English speaking
• Fragmented regulatory landscape
• Good customer response
34
Life Line Projected Global Presence
35
Life Line Business Challenge
• Interested in rapidly growing the customer base in US and across the globe
• Using multiple compiled lists provides support to the large‐scale Direct Mail acquisition program
• Limited universe and heavy mailing volume causing contact fatigue
• Applying the learnings generated in US to support the global expansion strategy with UK as the first pilot market
36
9/30/2011
13
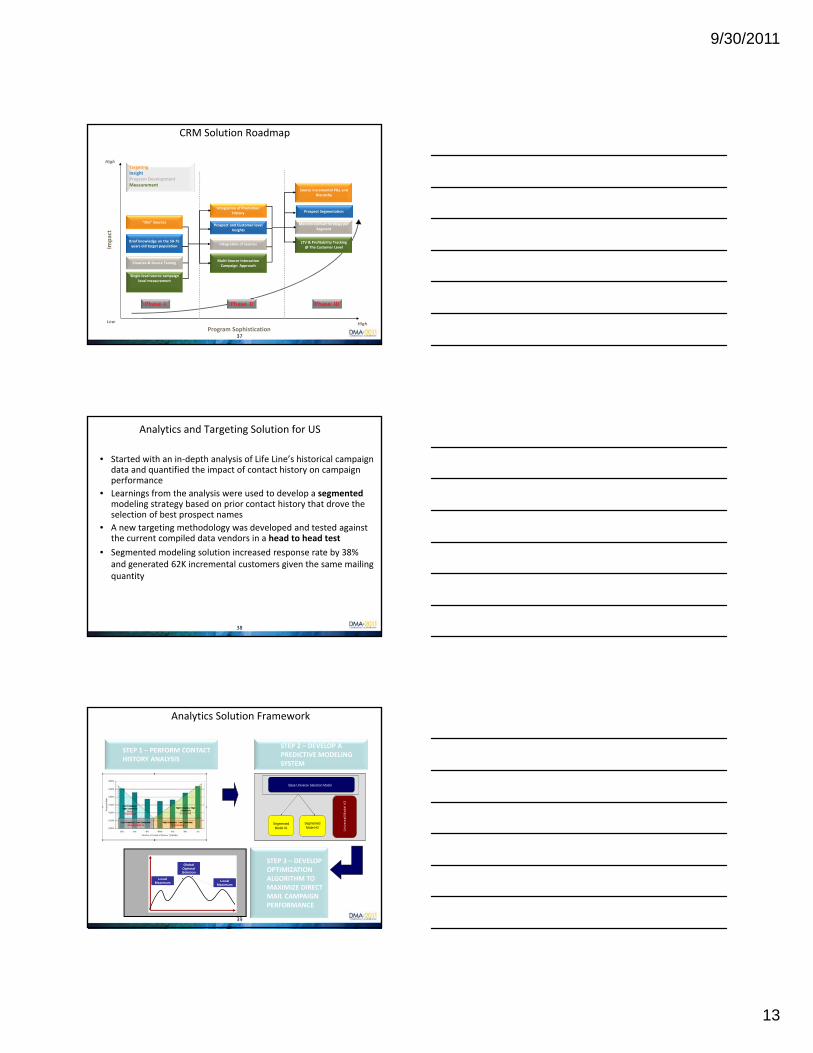
CRM Solution Roadmap
Program SophisticationLow
High
“Silo” Sources
Brief knowledge on the 50‐75 years old target population
Single level source campaign level measurement
Integration of Promotion History
Prospect and Customer level Insights
Multi‐Source Interaction Campaign Approach
Source Incremental P&L and Hierarchy
Prospect Segmentation
LTV & Profitability Tracking @ The Customer Level
TargetingInsightProgram DevelopmentMeasurement
Creative & Source Testing
Integration of Sources
Marcom Contact Strategy per Segment
Impact
Phase I Phase II Phase III
High
37
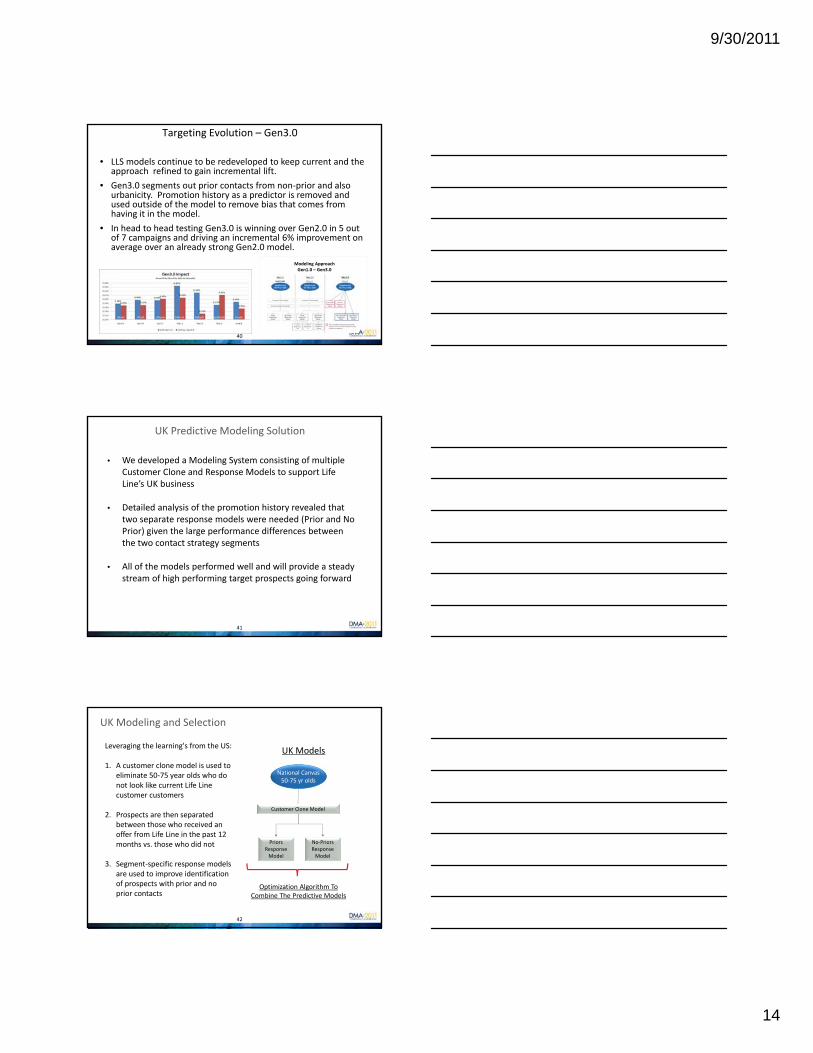
Analytics and Targeting Solution for US
• Started with an in‐depth analysis of Life Line’s historical campaign data and quantified the impact of contact history on campaign performance
• Learnings from the analysis were used to develop a segmentedmodeling strategy based on prior contact history that drove the selection of best prospect names
• A new targeting methodology was developed and tested against the current compiled data vendors in a head to head test
• Segmented modeling solution increased response rate by 38% and generated 62K incremental customers given the same mailing quantity
38
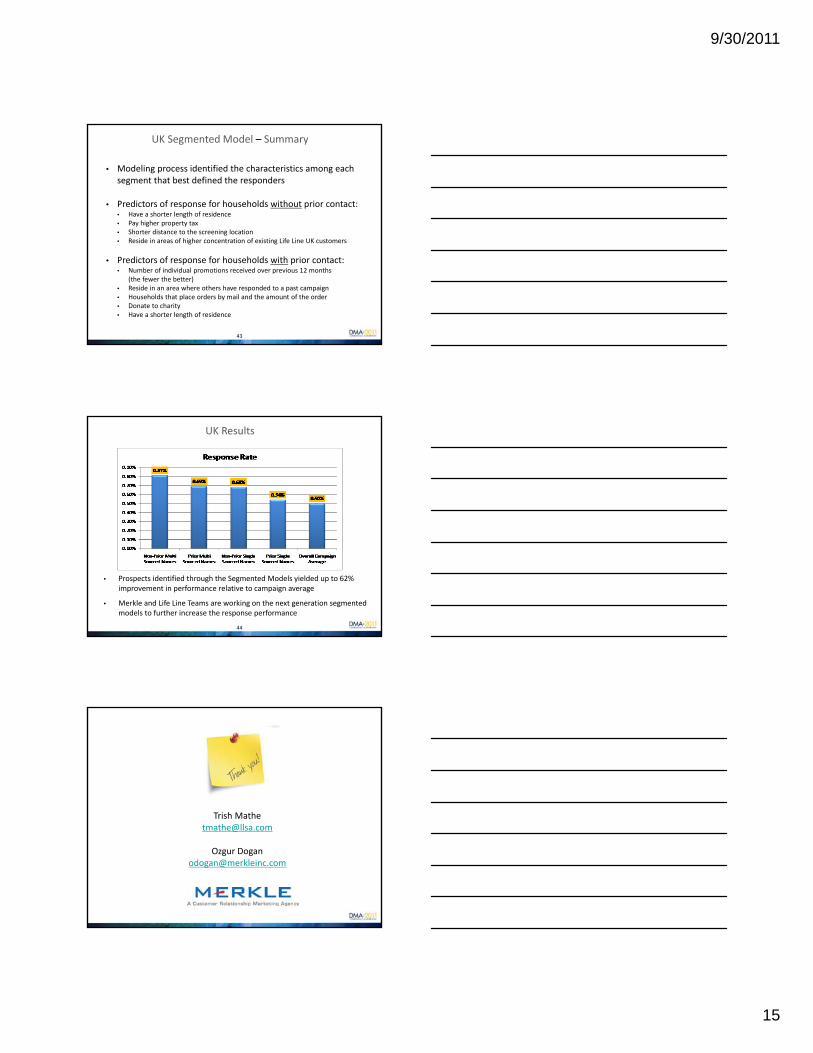
Analytics Solution Framework
STEP 1 – PERFORM CONTACT HISTORY ANALYSIS
STEP 2 – DEVELOP A PREDICTIVE MODELING SYSTEM
STEP 3 – DEVELOP OPTIMIZATION ALGORITHM TO MAXIMIZE DIRECT MAIL CAMPAIGN PERFORMANCE
Base Universe Selection Model
Uni
vers
al M
odel
#3
Segmented Model #1
Segmented Model #2
Base Universe Selection Model
Uni
vers
al M
odel
#3
Segmented Model #1
Segmented Model #2
Global Optimal Solution
Local Maximum
Local Maximum
39
9/30/2011
14
Targeting Evolution – Gen3.0
• LLS models continue to be redeveloped to keep current and the approach refined to gain incremental lift.
• Gen3.0 segments out prior contacts from non‐prior and also urbanicity. Promotion history as a predictor is removed and used outside of the model to remove bias that comes from having it in the model.
• In head to head testing Gen3.0 is winning over Gen2.0 in 5 out of 7 campaigns and driving an incremental 6% improvement on average over an already strong Gen2.0 model.
Modeling ApproachGen1.0 – Gen3.0
40
• We developed a Modeling System consisting of multiple Customer Clone and Response Models to support Life Line’s UK business
• Detailed analysis of the promotion history revealed that two separate response models were needed (Prior and No Prior) given the large performance differences between the two contact strategy segments
• All of the models performed well and will provide a steady stream of high performing target prospects going forward
UK Predictive Modeling Solution
41
National Canvas50‐75 yr olds
Priors Response Model
No‐Priors Response Model
UK Models
Customer Clone Model
Leveraging the learning's from the US:
1. A customer clone model is used to eliminate 50‐75 year olds who do not look like current Life Line customer customers
2. Prospects are then separated between those who received an offer from Life Line in the past 12 months vs. those who did not
3. Segment‐specific response models are used to improve identification of prospects with prior and no prior contacts
Optimization Algorithm To Combine The Predictive Models
UK Modeling and Selection
42
9/30/2011
15
• Modeling process identified the characteristics among each segment that best defined the responders
• Predictors of response for households without prior contact:• Have a shorter length of residence• Pay higher property tax• Shorter distance to the screening location• Reside in areas of higher concentration of existing Life Line UK customers
• Predictors of response for households with prior contact:• Number of individual promotions received over previous 12 months
(the fewer the better)• Reside in an area where others have responded to a past campaign• Households that place orders by mail and the amount of the order• Donate to charity• Have a shorter length of residence
UK Segmented Model – Summary
43
UK Results
• Prospects identified through the Segmented Models yielded up to 62% improvement in performance relative to campaign average
• Merkle and Life Line Teams are working on the next generation segmented models to further increase the response performance