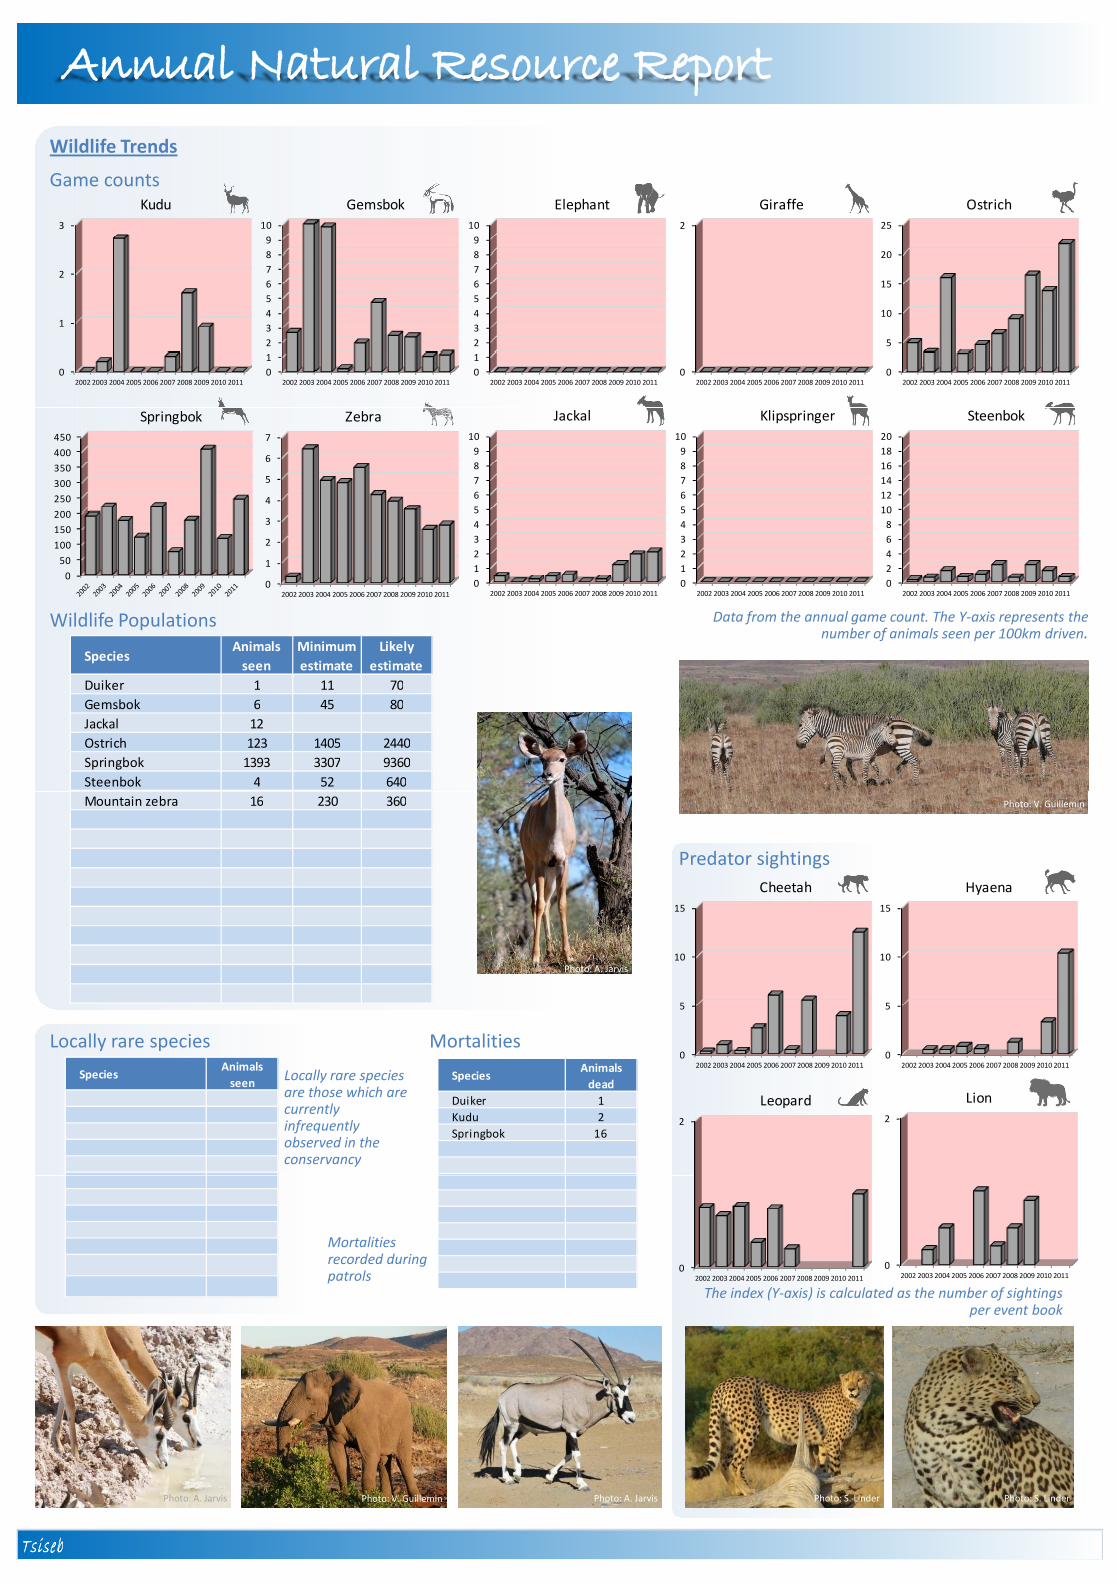
Game counts
Wildlife Trends
0
1
2
3
4
5
6
7
8
9
10
2002 2003 2004 2005 2006 2007 2008 2009 2010 2011
Gemsbok
0
1
2
3
4
5
6
7
8
9
10
2002 2003 2004 2005 2006 2007 2008 2009 2010 2011
Elephant
0
5
10
15
20
25
2002 2003 2004 2005 2006 2007 2008 2009 2010 2011
Ostrich
Springbok Zebra Klipspringer Steenbok
0
1
2
3
2002 2003 2004 2005 2006 2007 2008 2009 2010 2011
Kudu
0
2
2002 2003 2004 2005 2006 2007 2008 2009 2010 2011
Giraffe
Jackal
Wildlife Populations Data from the annual game count. The Y-axis represents the number of animals seen per 100km driven.
0
50
100
150
200
250
300
350
400
450
Springbok
0
1
2
3
4
5
6
7
2002 2003 2004 2005 2006 2007 2008 2009 2010 2011
Zebra
0
1
2
3
4
5
6
7
8
9
10
2002 2003 2004 2005 2006 2007 2008 2009 2010 2011
Klipspringer
0
2
4
6
8
10
12
14
16
18
20
2002 2003 2004 2005 2006 2007 2008 2009 2010 2011
Steenbok
0
1
2
3
4
5
6
7
8
9
10
2002 2003 2004 2005 2006 2007 2008 2009 2010 2011
Jackal
SpeciesAnimals
seen
Minimum
estimate
Likely
estimate
Duiker 1 11 70
Gemsbok 6 45 80
Jackal 12
Ostrich 123 1405 2440
Springbok 1393 3307 9360
Steenbok 4 52 640
Locally rare species
Locally rare species
are those which are currently infrequently observed in the conservancy
Mortalities
Predator sightings
Photo: A. Jarvis
Photo: V. Guillemin
SpeciesAnimals
seenSpecies
Animals
dead
Duiker 1
Kudu 2
Springbok 16
0
5
10
15
2002 2003 2004 2005 2006 2007 2008 2009 2010 2011
Cheetah
2
Lion
0
5
10
15
2002 2003 2004 2005 2006 2007 2008 2009 2010 2011
Hyaena
2
Leopard
Mountain zebra 16 230 360
Mortalities
recorded during patrols
The index (Y-axis) is calculated as the number of sightings
per event book
Photo: A. Jarvis Photo: S. Linder Photo: S. LinderPhoto: A. JarvisPhoto: V. Guillemin
02002 2003 2004 2005 2006 2007 2008 2009 2010 2011
02002 2003 2004 2005 2006 2007 2008 2009 2010 2011
TsisebTsisebTsisebTsiseb
Wildlife Use Wildlife Introductions
Tsiseb-2011 Tsiseb-2011 Tsiseb-2011 Tsiseb-2011
Year Species Number
2009 Black rhinoceros 2
2008 Gemsbok 52
2002 Gemsbok 30
Total TrophyOwn Use /
PremiumTrophy Shoot & Sell Capture
Problem
Animal
Baboon 5 5
Cheetah 1 1
Gemsbok 4 4
Hyaena 1 1
Jacka l 5 5
Kl ips pri nger 2 2
Kudu 4 4
Os tri ch 30 5
Springbok 800 30
Steenbok 5 5
Mounta in zebra 6 6
Total UsedSpecies
UtilisationQuota
Natural Resource Management
Human-Wildlife Conflict
Threats
Performance: Poaching
Incidents
IncidentsSpecies 2004 2005 2006 2007 2008 2009 2010 2011
Baboon 7 4 2 5
Caracal 4 1 2 4 15 14 19
Cheetah 2 5 7 9 17 26 110.8
1
Score
Weak Good
1 Adequate staffing 3 2.27991
PerformanceCategory
Photo: T. Robertson
Red bars indicate weak areas in the conservancy
management performance which need to be addressed. Green bars indicate positive management performance.
Effort:
Species
Cheetah 2 5 7 9 17 26 11
Elephant 2 9 3
Hyaena 4 4 23 16
Jackal 37 41 17 13 4 21 126 71
Leopard 1 1 3 8 6
0
10
20
30
40
50
60
70
80
0
0.2
0.4
0.6
Commercial Subsistence
0
1
2
3
4
5
Snares and traps recovered
Firearms recovered
0.8
1
1 Adequate staffing 3 2.279912 Adequate expenditure 3 1.709933 Audit attendance 4 1.139954 NR management plan 5 3.799845 Zonation 4 2.279916 Leadership 2 1.519947 Display of material 2 2.279918 Event Book modules 5 2.279919 Event Book quality 3 2.27991
10 Compliance 1 1 0.7599711 Game census 1 1 0.5699812 Reporting & adaptive m/ment 5 1.8239313 Law enforcement 3 1.1399514 HWC 2 2 0.7599715 Sources of NR income 5 2.2799116 Benefits produced 3 1.5199417 Resource Sustainability 2 2 0.75997
Effort:
The species chart indicates the
most troublesome to leasttroublesome conflict species in the conservancy. The Y-axis in HWC and poaching charts represents number of incidents.
Rainfall (mm)
Environmental monitoringDamage
Years with no bars indicate gaps in data collection
0
0
50
100
150
200
250
Other damage
Livestock attack
Human attack
Crop damage
0
0.2
0.4
0.6
Arrests Convictions
0
50
100
150
200
250
300
2003 2004 2005 2006 2007 2008 2009 2010 2011
Number of Community Game Guards: 6