400 West Mineral King Avenue · Visalia, CA · (559) 624 2000 · www.kaweahdelta.org March 8, 2019 NOTICE The Board of Directors of the Kaweah Delta Health Care District will meet in an open Quality Council Committee meeting at 7:00AM on Thursday March 14, 2019, in the Kaweah Delta Medical Center – Acequia Wing – Executive Office Conference Room {400 W. Mineral King, Visalia}. The Board of Directors of the Kaweah Delta Health Care District will meet in a Closed Quality Council Committee meeting immediately following the 7:00AM Open Quality Council Committee meeting on Thursday March 14, 2019, in the Kaweah Delta Medical Center – Acequia Wing – Executive Office Conference Room {400 W. Mineral King, Visalia} pursuant to Health and Safety Code 32155 & 1461. All Kaweah Delta Health Care District regular board meeting and committee meeting notices and agendas are posted 72 hours prior to meetings in the Kaweah Delta Medical Center, Mineral King Wing entry corridor between the Mineral King lobby and the Emergency Department waiting room. The disclosable public records related to agendas are available for public inspection at the Kaweah Delta Medical Center – Acequia Wing, Executive Offices (Administration Department) {1st floor}, 400 West Mineral King Avenue, Visalia, CA and on the Kaweah Delta Health Care District web page http://www.kaweahdelta.org. KAWEAH DELTA HEALTH CARE DISTRICT Nevin House, Secretary/Treasurer Cindy Moccio Board Clerk, Executive Assistant to CEO DISTRIBUTION: Governing Board Legal Counsel Executive Team Chief of Staff http://www.kaweahdelta.org/
Transcript
400 West Mineral King Avenue · Visalia, CA · (559) 624 2000 · www.kaweahdelta.org
March 8, 2019 NOTICE
The Board of Directors of the Kaweah Delta Health Care District will meet in an open Quality Council Committee meeting at 7:00AM on Thursday March 14, 2019, in the Kaweah Delta Medical Center – Acequia Wing – Executive Office Conference Room {400 W. Mineral King, Visalia}. The Board of Directors of the Kaweah Delta Health Care District will meet in a Closed Quality Council Committee meeting immediately following the 7:00AM Open Quality Council Committee meeting on Thursday March 14, 2019, in the Kaweah Delta Medical Center – Acequia Wing – Executive Office Conference Room {400 W. Mineral King, Visalia} pursuant to Health and Safety Code 32155 & 1461.
All Kaweah Delta Health Care District regular board meeting and committee meeting notices and agendas are posted 72 hours prior to meetings in the Kaweah Delta Medical Center, Mineral King Wing entry corridor between the Mineral King lobby and the Emergency Department waiting room.
The disclosable public records related to agendas are available for public inspection at the Kaweah Delta Medical Center – Acequia Wing, Executive Offices (Administration Department) {1st floor}, 400 West Mineral King Avenue, Visalia, CA and on the Kaweah Delta Health Care District web page http://www.kaweahdelta.org.
KAWEAH DELTA HEALTH CARE DISTRICT Nevin House, Secretary/Treasurer
Cindy Moccio Board Clerk, Executive Assistant to CEO
DISTRIBUTION: Governing Board Legal Counsel Executive Team Chief of Staff http://www.kaweahdelta.org/
Thursday March 14, 2019 – Quality Council Page 1 of 2 Herb Hawkins – Zone I ⃰⃰ Lynn Havard Mirviss – Zone II ⃰⃰ John Hipskind, MD – Zone III ⃰⃰ David Francis– Zone IV ⃰⃰ Nevin House– Zone V Board Member President Vice President Board Member Secretary/Treasurer
KAWEAH DELTA HEALTH CARE DISTRICT BOARD OF DIRECTORS
QUALITY COUNCIL
Thursday, March 14, 2019
Kaweah Delta Medical Center – Acequia Wing 400 W. Mineral King Avenue, Visalia, CA Executive Conference Room
ATTENDING: Herb Hawkins – Committee Chair, Board Member; Nevin House, Board Member; Gary Herbst, CEO; Regina Sawyer, RN, VP & CNO; Harry Lively, MD, Chief of Staff; Byron Mendenhall, MD, Professional Staff Quality Committee Chair; Monica Manga, MD, Secretary/Treasurer; Dan Boken, MD, Past Chief of Staff; Lori Winston, MD, DIO; Tom Gray, MD, Quality and Patient Safety Medical Director; Sandy Volchko, Director of Quality and Patient Safety; Evelyn McEntire, Director of Risk Management; Ben Cripps, Compliance and Privacy Officer, and Heather Goyer, Recording.
OPEN MEETING – 7:00AM
Call to order – Herb Hawkins, Committee Chair & Board Member
Public / Medical Staff participation – Members of the public wishing to address the Committee concerning items not on the agenda and within the subject matter jurisdiction of the Committee may step forward and are requested to identify themselves at this time. Members of the public or the medical staff may comment on agenda items after the item has been discussed by the Committee but before a Committee recommendation is decided. In either case, each speaker will be allowed five minutes.
1. Written Quality Reports – A review of key quality metrics and actions associated with the following populations:
1.1. Infection Prevention – Shawn Elkin, Manager of Infection Prevention 1.2. Patient Experience - Ed Largoza, Director of Patient Experience
2. Emergency Department Performance – A review of key performance measures and actions for the Emergency Department. Kona Seng, OD, Tom Siminski, RN Director of Emergency Services.
3. Update: Fiscal Year 2019 Clinical Quality Goals - A review of current performance and actions focused on the FY 2019 clinical quality goals. Sandy Volchko, RN, Director of Quality and Patient Safety.
4. Cardiac Service Line Quality Report – A review of key quality indicators and actions associated with the care of cardiac patient population 4.1. Dr. Sergio Caminha, Department Chair of Cardiac Surgery 4.2. Dr. Ashok Verma, MD, Medical Director of Cardiac Cath Lab
1/166
Thursday March 14, 2019 – Quality Council Page 2 of 2 Herb Hawkins – Zone I ⃰⃰ Lynn Havard Mirviss – Zone II ⃰⃰ John Hipskind, MD – Zone III ⃰⃰ David Francis– Zone IV ⃰⃰ Nevin House– Zone V Board Member President Vice President Board Member Secretary/Treasurer
5. Approval of Quality Council Closed Meeting Agenda – Kaweah Delta Medical Center Executive Conference Room – immediately following the open Quality Council meeting
o Quality Assurance pursuant to Health and Safety Code 32155 and 1461, report of Professional Staff Quality Committee (Pro-Staff) – Byron Mendenhall, MD, and Professional Staff Quality Committee Chair;
o Quality Assurance pursuant to Health and Safety Code 32155 and 1461, report of Professional Staff Quality Committee (Pro-Staff) – Evelyn McEntire, Director of Risk Management.
Adjourn Open Meeting – Herb Hawkins, Committee Chair & Board Member
CLOSED MEETING – Immediately following the 7:00AM open meeting
Call to order – Herb Hawkins, Committee Chair & Board Member
1. Quality Assurance pursuant to Health and Safety Code 32155 and 1461, report of Professional Staff Quality Committee (Pro-Staff) – Byron Mendenhall, MD, and Professional Staff Quality Committee Chair
2. Quality Assurance pursuant to Health and Safety Code 32155 and 1461, report of Professional Staff Quality Committee (Pro-Staff) – Evelyn McEntire, Director of Risk Management.
Adjourn Open Meeting – Herb Hawkins, Committee Chair & Board Member
In compliance with the Americans with Disabilities Act, if you need special assistance to participate at this meeting, please contact the Board Clerk (559) 624-2330. Notification 48 hours prior to the meeting will enable the District to make reasonable arrangements to ensure accessibility to the Kaweah Delta Health Care District Board of Directors committee meeting.
2/166
Kaweah Delta Health Care District 1
Q1 Q2 Q3 Q4AVG. or
TOTAL YTDSUMMARY / ACTION
I. Overall Surgical Site Infections (SSI) IR/SIR SSIs calculated internally though standard incidence
rate and externally through Standardized Infection
Ratio (SIR) from National Health and Safety Network
92% 89% 87% 89% 91% 1st QTR: 92%, just under our 95% goal. Current
actions to increase hand hygiene include review of
technology for monitoring complaince. Continued
secret shopper and Infection Prevention hand
hygiene monitoring. IP Liaison committee is
generating ideas to enhance hand hygiene through a
campaign and other measures to ensure greater
complaince.
2nd QTR: 89%, well under our 95% goal. IP Liaison
committee provided a list of barriers to hand hygiene
compliance and a list of potential solutions to poor
hand hygiene compliance. Need IP Committee and
Executive Leadership to support a higher standard
and accountability to better hand hygiene compliance.
3rd QTR: 87%, consistently decreasing compliance
and way off the mark of the now 90% compliance
goal. Of 3,519 observations, 3,071 were compliant
and 448 were not compliant. Will need to re-evaluate
our current hand hygiene campaign.
4th QTR: 89%, improving slightly. 3N CUSP team is
evaluating the best methods to increase hand
hygiene compliance on their unit. BioVigil electronic
hand hygiene monitoring will be trialed x 12 months
on 4N and ICU. IP Liaison continues actively perform
hand hygiene observations throughout the district.
ANNUAL SUMMARY: Capturing more accurate
results with employment of the IP Liaisons performing
"secret-shopper" hand hygiene audits. Waiting on
exective team approval for deployment of an
electronic hand hygiene surveillance trial to be
performed in the ICU and on 4N for 12 months.
Reinforcing with all healthcare personnel that hand
hygiene is the primary method to reduce disease
transmission.
VII. VRE (HAI) Blood-Hospital Onset (HO) BM
A. Total Infection Count 0 0 0 0 0 1st QTR: 0 Predicted: 0
2nd QTR: 0 Predicted: 0
3rd QTR: 0 Predicted: 0
4th QTR: 0 Predicted: 0
14/166
Kaweah Delta Health Care District 13
Q1 Q2 Q3 Q4AVG. or
TOTAL YTDSUMMARY / ACTION
Infection Prevention and Control Committee - IP Quality Improvement Dashboard CY 2018
B. Prevalence Rate (x100) 0 0 0 0 0 1st QTR: 0
2nd QTR: 0
3rd QTR: 0
4th QTR: 0
ANNUAL SUMMARY: Recommend removal of this
metric from the dashboard. C. Number Admissions 6179 5832 6126 18,137 admissionsVIII. MRSA (HAI) Blood CMS/VBP SIR
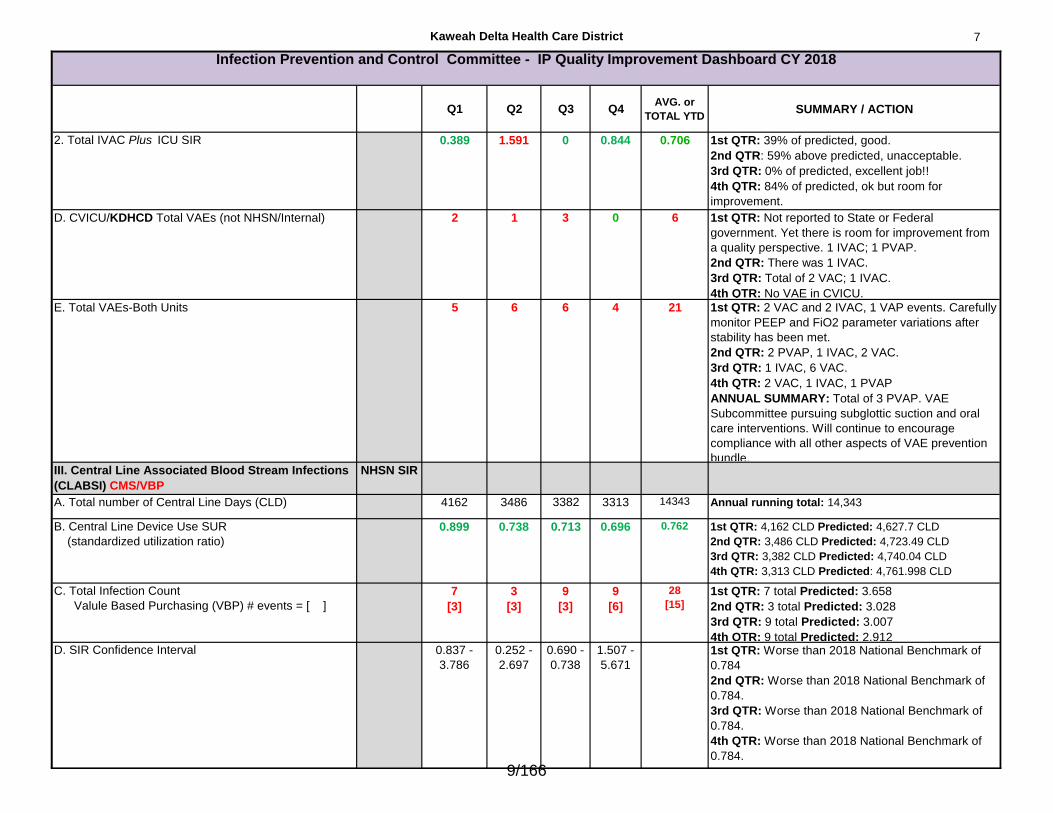
A. Total Infection Count (IP Facility-wide) 7 1 3 4 15 1st QTR: 7 Predicted 1.406
2nd QTR: 1 Predicted: 1.343
3rd QTR: 3 Predicted: 1.347
4th QTR: 4 Predicted: 1.452B. SIR CI (KDHCD predicted range, based on risks) 2.177 -
9.846
0.037 -
3.673
0.566-
6.061
0.875 -
6.644
1st QTR: Worse than 2018 National Benchmark of
0.815.
2nd QTR: Better than 2018 National Benchmark of
0.815 and Better than 2017 lower limit confidence
interval of 0.867.
3rd QTR: No different than 2018 National Benchmark
of 0.815.
4th QTR: Worse than 2018 National Benchmark of
0.815.
15/166
Kaweah Delta Health Care District 14
Q1 Q2 Q3 Q4AVG. or
TOTAL YTDSUMMARY / ACTION
Infection Prevention and Control Committee - IP Quality Improvement Dashboard CY 2018
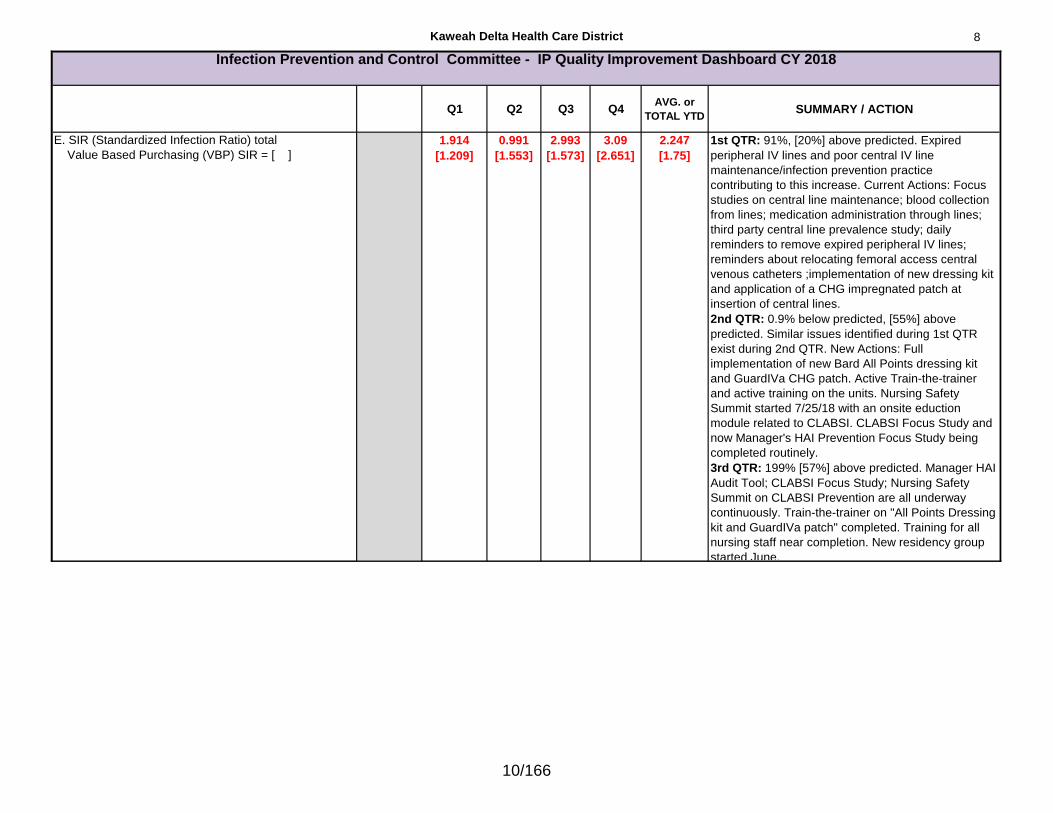
C. SIR (Standardized Infection Ration) total
Value Based Purchasing (VBP) SIR = [ ]
4.977
[4.977]
0.745
[0.745]
2.227
[2.227]
2.75
[2.754]
2.67
[2.67]
1st QTR: 416% above predicted, unacceptable.
MDRO-Committee meets monthy to address issues
related to Hospital Onset MRSA BSI prevalence.
Infection Prevention is working with Antimicrobial
Stewardship Pharmacist to ensure right drug/bug
match. However, added focus is being made recently
toward shifting cultural awareness toward meticulous
hand hygiene and cooperative environmental
cleaning practices.
2nd QTR: 75% of predicted, on the right track.
Infection Prevention continues to be tenacious
pushing for removal of expire peripheral IVs.
Pharmacy is looking at enhancing Antimicrobial
Stewardship Committee (increasing meeting
frequency, using assistance from Pharmacy
Residents) and continues to work closely with
Infectious Disease and Infection Prevention.
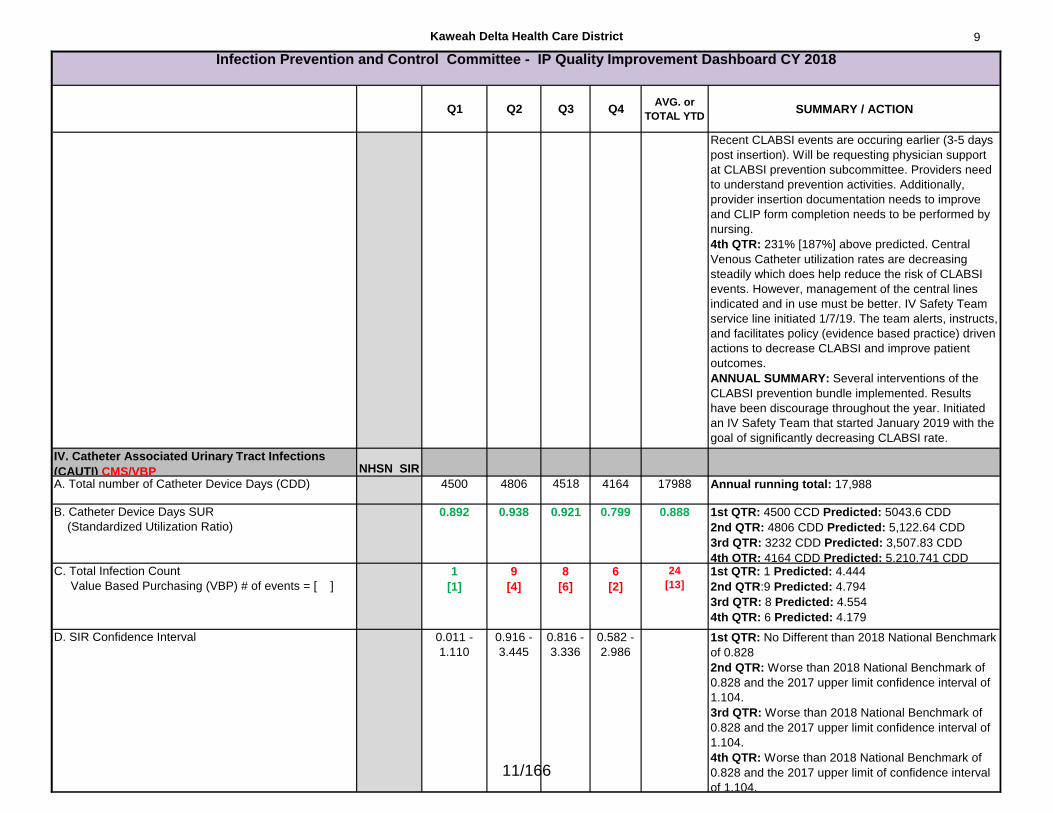
3rd QTR: 141% above predicted. Will be trialing
remote hand hygiene compliance sensor system
(BioVigil) in February 2019. Emphasizing removal of
peripheral IVs that remain as "just-in-case" access.
Performing surveillance on expired peripheral IV
lines. Changed peripheral IV replacement frequency
back to Q72 hours.
4th QTR: 194% above predicted number of events,
unacceptable. Majority of these events are associated
with an expired or infiltrated peripheral IV in the
presence of a central line. CLABSI and MRSA BSI
are closely associated because of this relationship.
ANNUAL SUMMARY: MRSA BSI rates are elevated
in-part to expired peripheral IV lines. IP staff pursue
the nursing units daily to remove/replace expired PIV.
IV Safety Team will be doing the same.
IX. Influenza Rates (Year 2017-2018) NHSN
A. All Healthcare Workers
4,844 working/4,769 total vaccination (75 declined)
98.5%Season 2017-2018: 98.5%. Slight Improvement from
year 2016/2017- 98%. Reported to CDHP/NHSN.
Action: MS and HR implemented processes to
assure increased gathering of information.
Season 2018-2019: Will not be available until the end
of March 2019. 16/166
Kaweah Delta Health Care District 15
Q1 Q2 Q3 Q4AVG. or
TOTAL YTDSUMMARY / ACTION
Infection Prevention and Control Committee - IP Quality Improvement Dashboard CY 2018
Approved IPC: March 21, 2018 approved
Approved IPC: June 20, 2018 approved
Approved IPC: December, 19, 2018 approved
Approved IPC:
Prepared by Shawn Elkin, MPA, BSN, RN, PHN, CIC
Infection Prevention Manager
17/166
Excellent Service / Patient Experience HCAHPS The data is for patients discharged: Second Quarter 2017 through First Quarter 2018. 1557 surveys completed with a 20% response rate. HCAHPS Composites Adjusted Score State Avg National Avg Comments/Improvement Efforts
Communication with Nurses (FY19 79%)
76%
76% 80% Bedside report
Patient communication boards
‘About Us’ flyers to inform patients of how to reach department leaders
Nurse leaders rounding on patients
Communication with Doctors (FY19 80%)
74%
77% 81% Review data & best practices routinely with Hospitalists, ACTS, FHCN, ED providers
Responsiveness of Hospital Staff (FY19 66%)
63%
64% 70% Hourly rounding
Proactive toileting
Communication about Medicines (FY19 65%)
60%
63% 66% Patient Medicine Guide
Cleanliness of Environment (FY19 79%)
68%
72% 75% EVS leaders rounding on patients
Rework of laundry supply and utilization
Culture of Cleanliness – Review refurbishment possibilities of high traffic areas in the MK wing, hardwire hygiene/bathing standards, evaluate availability of trash receptacles
Quietness of Environment (FY19 55%)
47%
51% 62% Evaluate vendors with noise masking solutions
Discharge Information (FY19 85%)
85% (Yes)
85% 87% Re-build discharge instructions to make them more patient-friendly
Support work of REC to improve discharge effectiveness and throughput
Badge visitors to enhance patient and staff safety
Provide assistance to visitor traveling between Acequia and Mineral King wings
Launch new patient menu
Willingness to Recommend (FY19 72%)
69% (Definitely Recommend)
70% 72% Same as above
Legend: Above or at benchmark Within 3% of benchmark Greater than 3% below benchmark
18/166
19/166
Sepsis is a potentially life-threatening complication of an infection. It's most dangerous in
older adults or those with weakened immune systems. Early treatment of sepsis, usually with antibiotics and large amounts of intravenous fluids, improves chances for survival.
OCTOBER 2018HIGHER IS BETTER
Percent of patients with this serious infection that received “perfect care”. Perfect care is the right treatment at the right time for our sepsis patients.
Methicillin-resistant Staphylococcus aureus (MRSA) is a type of staph bacteria that is
resistant to certain antibiotics. More severe or potentially life-threatening MRSA infections occur most frequently among patients in healthcare settings.
OCT-DEC 2018LOWER IS BETTER
DEC 2018NUMBER OF PATIENTS WHO ACQUIRED MRSA
Standardized Infection Ratio (SIR)The number of patients who acquired MRSA while in the hospital divided by the number of patients who were expected.
A catheter-associated urinary tract infection (CAUTI) is one of the most common infections a
person can contract in the hospital. Indwelling urinary catheters are the cause of this infection.
Standardized Infection Ratio: The number of patients who acquired a CAUTI while in the hospital divided by the number of patients who were expected.
OCT-DEC 2018LOWER IS BETTER
DEC 2018NUMBER OF PATIENTS WHO ACQUIRED CAUTI
A central line-associated bloodstream infection (CLABSI) is a serious infection
that occurs when germs (usually bacteria or viruses) enter the bloodstream through the central line.
OCT-DEC 2018LOWER IS BETTER
Standardized Infection Ratio (SIR) The number of patients who acquired a CLABSI while in the hospital divided by the number of patients who were expected.
DEC 2018NUMBER OF PATIENTS WHO
ACQUIRED CLABSI
<.86
PREVIOUSMONTH
63%
PREVIOUSQUARTER
NO SIR
PREVIOUSQUARTER
2.15
PREVIOUSQUARTER
2.99
CLINICAL QUALITY
62% 2.75
1
1
3.092
1.4420/166
Cardiac Surgery Data2018Q2
DATA ANALYSES OF THE SOCIETY OF THORACIC SURGEONS
NATIONAL ADULT CARDIAC SURGERY DATABASE
*Comparison reporting period 01/01/2018 through 06/30/201821/166
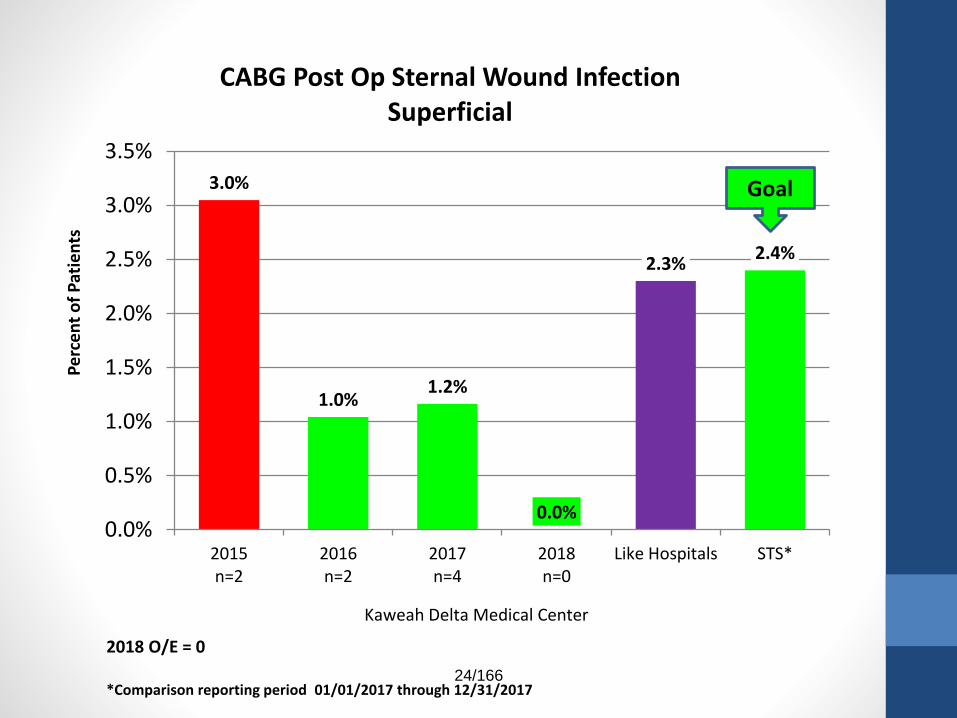
The Medical Staff Officers have reviewed the CV Services report and noted that the report is exemplary or has shown improvement in many areas, notably:
• From the STS Report:
• CABG Post Op Sternal Wound Infection, Deep and Superficial
• CABG Operative Mortality
• Post-Op Renal Failure
• CABG Prolonged Ventilation
• CABG Post Op Permanent Stroke
22/166
0.0% 0.0% 0.0% 0.0%
0.3% 0.3%
0.0%
0.2%
0.4%
0.6%
0.8%
1.0%
2015n=0/192
2016n=0/172
2017n=0/182
2018 Q1-Q2n=0/94
Like Hospitals STS*
Pe
rce
nt
of
Pat
ien
tsCABG Post Op Deep Sternal Wound Infection
Risk Adjusted
Kaweah Delta Medical Center
Goal
2018 O/E = 0
*Comparison reporting period 01/01/2018 through 06/30/201823/166
3.0%
1.0%1.2%
0.0%
2.3%2.4%
0.0%
0.5%
1.0%
1.5%
2.0%
2.5%
3.0%
3.5%
2015n=2
2016n=2
2017n=4
2018n=0
Like Hospitals STS*
Pe
rce
nt
of
Pat
ien
tsCABG Post Op Sternal Wound Infection
Superficial
Kaweah Delta Medical Center
Goal
2018 O/E = 0
*Comparison reporting period 01/01/2017 through 12/31/201724/166
0.9%
2.2%
1.5%
1.9%
2.5%
2.3%
0.0%
0.5%
1.0%
1.5%
2.0%
2.5%
3.0%
2015n=2/192
2016n=4/172
2017n=4/182
2018 Q1-Q2n=2/94
Like Hospitals STS*
Pe
rce
nt
of
Pat
ien
tsCABG Operative Mortality
Risk Adjusted
Kaweah Delta Medical Center
Goal
2018 O/E = 0.8
*Comparison reporting period 01/01/2018 through 06/30/201825/166
0.6%
3.2%
1.2%
2.4%2.5%
2.3%
0.0%
0.5%
1.0%
1.5%
2.0%
2.5%
3.0%
3.5%
4.0%
2015n=1/178
2016n=5/164
2017n=2/159
2018 Q1-Q2n=2/86
Like Hospitals STS*
Pe
rce
nt
of
Pat
ien
tsCABG Post-Op Renal Failure1
Risk Adjusted
Kaweah Delta Medical Center
Goal
2018 O/E = 1.0*Comparison reporting period 01/01/2018 through 06/30/20181 – Excludes patients with preoperative dialysis or preoperative Creatinine ≥ 4
26/166
8.5%
13.6%
6.5%
8.0% 8.3%7.7%
0.0%
5.0%
10.0%
15.0%
20.0%
2015n=20/192
2016n=29/172
2017n=19/182
2018 Q1-Q2n=11/94
Like Hospitals STS*
Pe
rce
nt
of
Pat
ien
tsCABG Prolonged Ventilation
Risk Adjusted
Kaweah Delta Medical Center
Goal
2018 O/E = 1.0
*Comparison reporting period 01/01/2018 through 06/30/201827/166
1.9%
1.7%
0.0%
1.9%
1.4% 1.4%
0.0%
0.5%
1.0%
1.5%
2.0%
2.5%
3.0%
2015n=4/192
2016n=3/172
2017n=0/182
2018 Q1-Q2n=2/94
Like Hospitals STS*
Pe
rce
nt
of
Pat
ien
ts
CABG Post Op Permanent StrokeRisk Adjusted
Kaweah Delta Medical Center
Goal
2018 O/E = 1.33
*Comparison reporting period 01/01/2018 through 06/30/201828/166
Opportunities for improvement and / or documentation of compliance with improvement plans were also noticed in several
areas.
The Officers have asked for a brief summary addressing the following questions to be presented at the ProStaff meeting
?29/166
2.6%2.3%
3.3%
2.1%1.9% 1.9%
0.0%
1.0%
2.0%
3.0%
4.0%
5.0%
2015n=5/193
2016n=4/172
2017n=6/182
2018 Q1-Q2n=2/94
Like Hospitals STS*
Pe
rce
nt
of
Pat
ien
ts
CABG Re-Op Bleed
Kaweah Delta Medical Center
Goal
2018 O/E = 1.2
*Comparison reporting period 01/01/2018 through 06/30/201830/166
37.2%41.3%
29.7%
34.0%
25.7% 25.9%
0.0%
10.0%
20.0%
30.0%
40.0%
50.0%
60.0%
2015n=67/193
2016n=71/172
2017n=54/182
2018 Q1-Q2n=32/94
Like Hospitals STS*
Pe
rce
nt
of
Pat
ien
ts
CABG Intra-operative Blood Product Usage1
Kaweah Delta Medical Center
Goal
2018 O/E = 1.3*Comparison reporting period 01/01/2018 through 06/30/20181Surgeries where at least one unit blood product (RBC, Plasma, Platelet) was given intra-operatively31/166
Quality Initiative: Bleeding, blood usage
• Quarterly review of blood usage throughout Pt. stay
• TEG coagulation monitoring
• Antifibrinolytic agents
• Heparin monitoring
• Heparin coated circuits
• Hemostasis achieved during procedure
• Cell saver utilized during surgery
• Restrictive transfusion criteria
• Surgeon approval of each transfusion
• Treatment of pre-operative anemia or transfusion as needed
Have any opportunities for
improvement been identified?
32/166
7.9
9.5
8.5
9.3
6.9 7.0
2.0
4.0
6.0
8.0
10.0
12.0
2015 2016 2017 2018 Q1-Q2 Like Hospitals STS*
Po
st-O
pe
rati
ve D
ays
in H
osp
ital
CABG Post Op Length of StayMean
Kaweah Delta Medical Center
Goal
2018 O/E = 1.3
*Comparison reporting period 01/01/2018 through 06/30/2018
Are there action plans to address these elements?
33/166
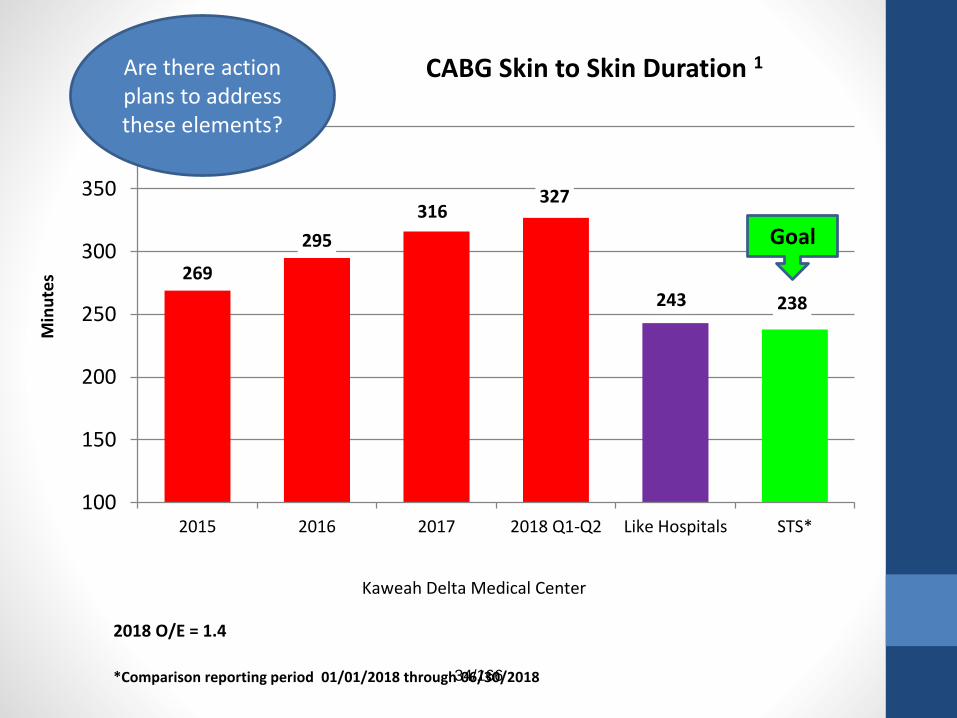
269
295
316327
243 238
100
150
200
250
300
350
400
2015 2016 2017 2018 Q1-Q2 Like Hospitals STS*
Min
ute
s
CABG Skin to Skin Duration 1
Kaweah Delta Medical Center
Goal
2018 O/E = 1.4
*Comparison reporting period 01/01/2018 through 06/30/2018
Are there action plans to address these elements?
34/166
126
134143
151
98 96
50
70
90
110
130
150
170
2015 2016 2017 2018 Q1-Q2 Like Hospitals STS*
Min
ute
s
CABG Pump Time Duration 1
Kaweah Delta Medical Center
Goal
2018 O/E = 1.6
*Comparison reporting period 01/01/2018 through 06/30/20181- Excludes Off-Pump procedures
Are there action plans to address these elements?
35/166
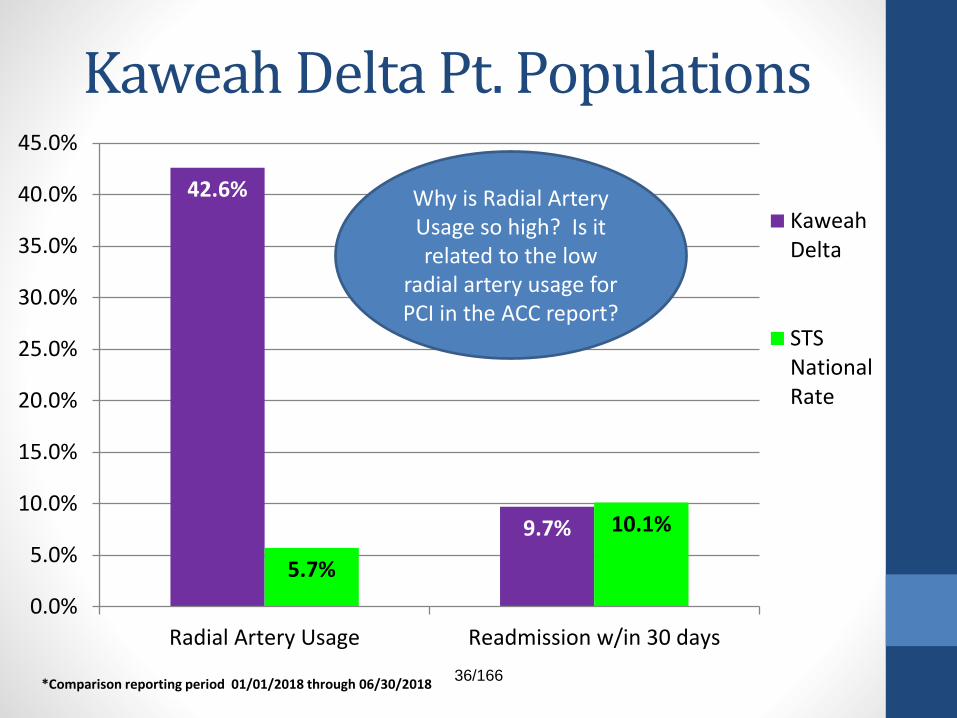
Kaweah Delta Pt. Populations
42.6%
9.7%
5.7%
10.1%
0.0%
5.0%
10.0%
15.0%
20.0%
25.0%
30.0%
35.0%
40.0%
45.0%
Radial Artery Usage Readmission w/in 30 days
KaweahDelta
STSNationalRate
*Comparison reporting period 01/01/2018 through 06/30/2018
Why is Radial Artery Usage so high? Is it related to the low
radial artery usage for PCI in the ACC report?
36/166
2017 Q2 - 2018 Q1 Data
Kaweah Delta Medical Center
PCI Data Quality Analysis
*Comparison reporting period 04/01/2017 through 03/31/2018
Green – At the ACC 90th % GOALPurple - At the ACC 50th %
Red - Worse than ACC 50th %
37/166
The Medical Staff Officers have reviewed the CV
Services report and noted that the report is exemplary
or has shown improvement in many areas, notably:
• From the ACC/PCI Report:o Stroke Post PCI
o Vascular Access Site Injury
o P2Y12 Inhibitor Prescribed at Discharge
38/166
Stroke Post PCI1
0.0%
0.34%0.35%
0.0%
0.17% 0.17%
0.0%0.0%
0.1%
0.2%
0.3%
0.4%
0.5%
0.6%
Q2 2017
n=0/306
Q3 2017
n=1/296
Q4 2017
n=1/284
Q1 2018
n=0/295
KD R4Q ACC 50th
percentile
ACC 90th
percentile
GOAL
R4Q O/E = 1.01 Patients without CABG during this admission. (ref: 1811)*Comparison reporting period is 4/01/17 through 03/31/18
39/166
Vascular Access Site InjuryBleeding Event w/in 72 Hours1
0.3%
1.7%
3.2%
1.4%
1.6% 1.6%
0.0%
0.5%
1.0%
1.5%
2.0%
2.5%
3.0%
3.5%
Q2 2017
n=1/306
Q3 2017
n=5/296
Q4 2017
n=9/284
Q1 2018
n=4/295
KD R4Q ACC
Average
GOAL
R4Q O/E = 1.01 Requiring treatment/ major bleeding; Pt.’s w/out CABG during admission defined as: Bleeding at access site, hematoma at access
site, or retroperitoneal bleed that occur within 72 hours of procedure. To qualify, event must be associated with Hgb drop >=3 g/dL;
transfusion, or a procedural intervention/surgery to reverse/stop or correct the bleeding. Excludes GI, GU, Other bleeds. (ref: 1848)*Comparison reporting period is 4/01/17 through 03/31/18
What Led to the Q1
Improvements?
40/166
P2Y12 Inhibitor Prescribed at DC1
100.0%
99.6%
98.4%
100.0%
99.5%
99.8%
100.0%
97.5%
98.0%
98.5%
99.0%
99.5%
100.0%
Q2 2017
n=0
Q3 2017
n=1
Q4 2017
n=4
Q1 2018
n=0
KD R4Q ACC 50th
percentile
ACC 90th
percentile
GOAL
R4Q O/E = 1.01 Proportion of pts (without a documented contraindication) with a stent implanted that had a thienopyridine/P2Y12 inhibitor
prescribed at discharge; excludes patients that were discharged to "Other acute care hospital", "Hospice", or “Left against medical
advice (AMA)“. (ref: 2005)*Comparison reporting period is 4/01/17 through 03/31/18
41/166
Opportunities for improvement and / or
documentation of compliance with improvement
plans were also noticed in several areas.
The Officers have asked for a brief summary
addressing the following questions to be presented at
the ProStaff meeting
?42/166
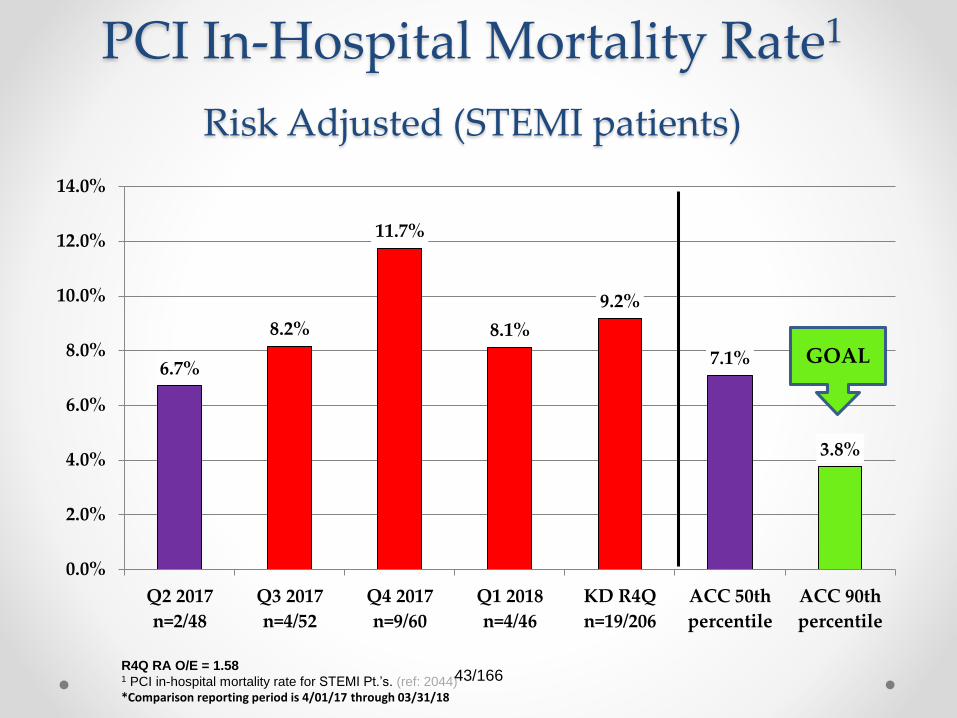
PCI In-Hospital Mortality Rate1
Risk Adjusted (STEMI patients)
6.7%
8.2%
11.7%
8.1%
9.2%
7.1%
3.8%
0.0%
2.0%
4.0%
6.0%
8.0%
10.0%
12.0%
14.0%
Q2 2017
n=2/48
Q3 2017
n=4/52
Q4 2017
n=9/60
Q1 2018
n=4/46
KD R4Q
n=19/206
ACC 50th
percentile
ACC 90th
percentile
GOAL
R4Q RA O/E = 1.58 1 PCI in-hospital mortality rate for STEMI Pt.’s. (ref: 2044)*Comparison reporting period is 4/01/17 through 03/31/18
43/166
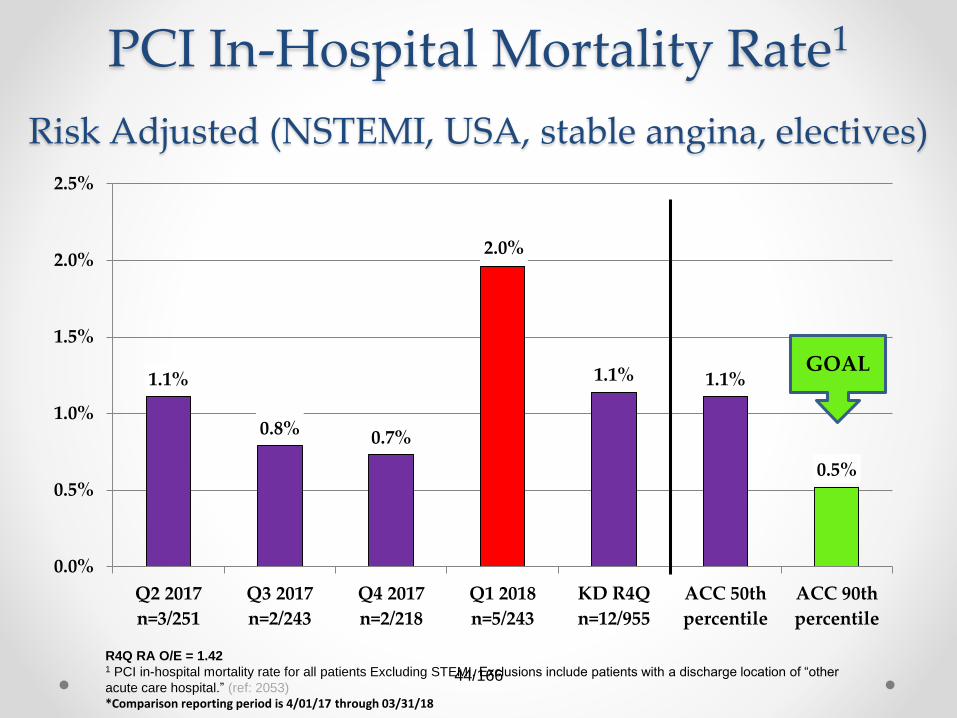
PCI In-Hospital Mortality Rate1
Risk Adjusted (NSTEMI, USA, stable angina, electives)
1.1%
0.8% 0.7%
2.0%
1.1% 1.1%
0.5%
0.0%
0.5%
1.0%
1.5%
2.0%
2.5%
Q2 2017
n=3/251
Q3 2017
n=2/243
Q4 2017
n=2/218
Q1 2018
n=5/243
KD R4Q
n=12/955
ACC 50th
percentile
ACC 90th
percentile
R4Q RA O/E = 1.421 PCI in-hospital mortality rate for all patients Excluding STEMI. Exclusions include patients with a discharge location of “other
acute care hospital.” (ref: 2053)*Comparison reporting period is 4/01/17 through 03/31/18
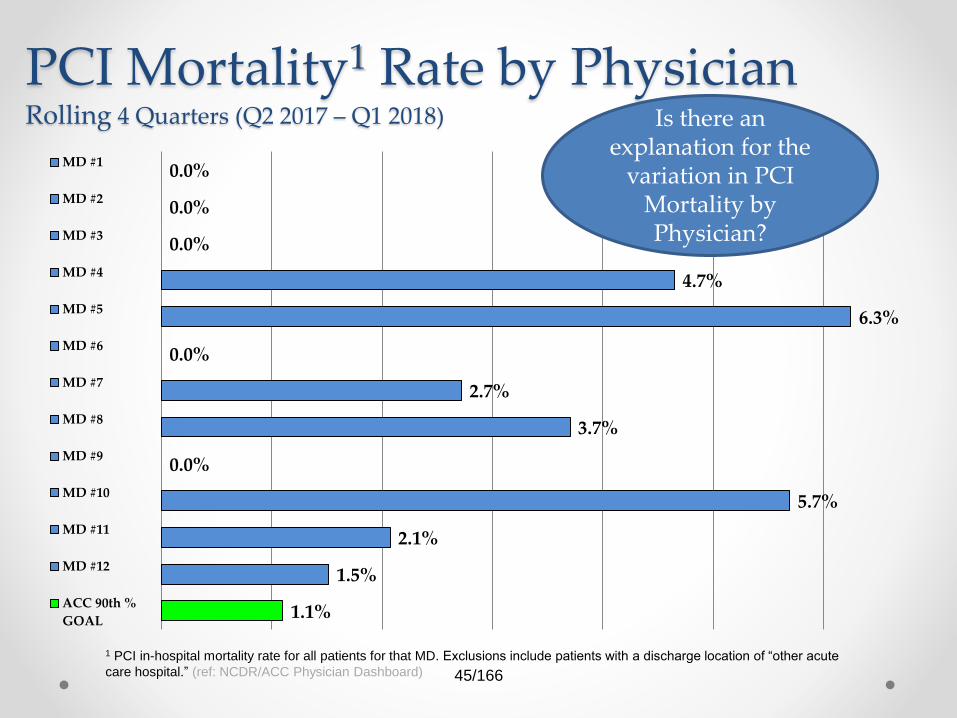
1 PCI in-hospital mortality rate for all patients for that MD. Exclusions include patients with a discharge location of “other acute
care hospital.” (ref: NCDR/ACC Physician Dashboard)
Is there an explanation for the
variation in PCI Mortality by Physician?
45/166
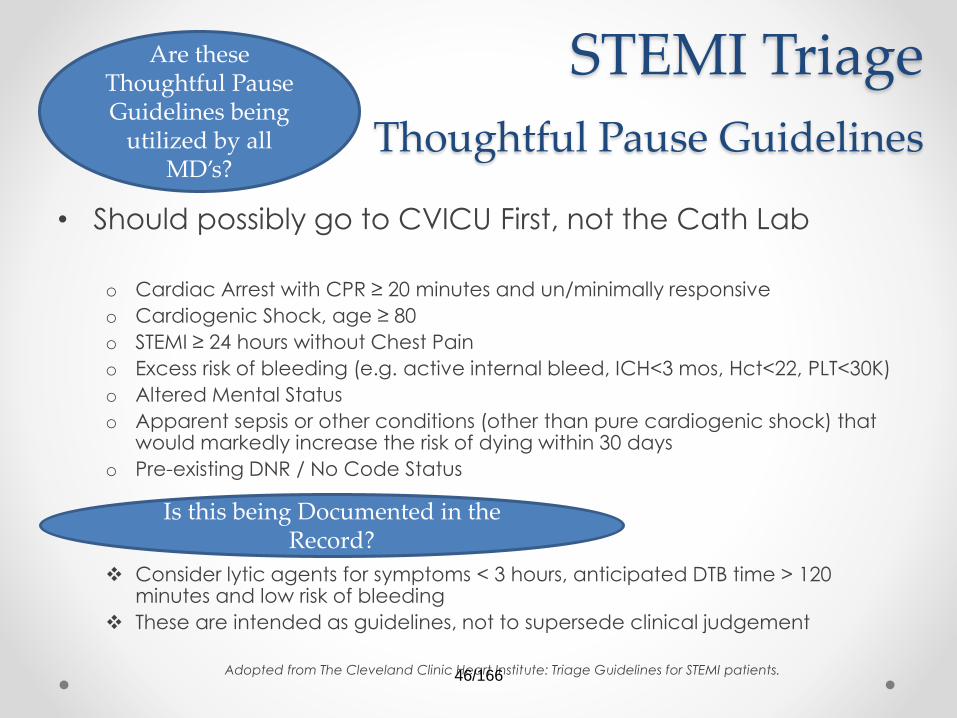
STEMI Triage
Thoughtful Pause Guidelines
• Should possibly go to CVICU First, not the Cath Lab
o Cardiac Arrest with CPR ≥ 20 minutes and un/minimally responsive
o Cardiogenic Shock, age ≥ 80
o STEMI ≥ 24 hours without Chest Pain
o Excess risk of bleeding (e.g. active internal bleed, ICH<3 mos, Hct<22, PLT<30K)
o Altered Mental Status
o Apparent sepsis or other conditions (other than pure cardiogenic shock) that would markedly increase the risk of dying within 30 days
o Pre-existing DNR / No Code Status
Consider lytic agents for symptoms < 3 hours, anticipated DTB time > 120 minutes and low risk of bleeding
These are intended as guidelines, not to supersede clinical judgement
Adopted from The Cleveland Clinic Heart Institute: Triage Guidelines for STEMI patients.
Are these Thoughtful Pause Guidelines being
utilized by all MD’s?
Is this being Documented in the Record?
46/166
Quality Initiative:
Vitally Important Steps• Physician collaboration & coordination between departments is required
• Cardiologist must participate in all thoughtful pause discussions
• ED physician and Cardiologist will consult with an Intensivist as needed for difficult cases
• Intensivist will respond to the ED for thoughtful pauses as requested
• Thoughtful pause must be documented in patient’s EMR by a physician
• ED staff will transport patients to the Cath Lab for Cardiac Alerts after hours with the Cath Lab RN
• Families must be given aggressive treatment options
with their corresponding prognosis or futility
• Honest communication between all parties required
to maintain transparency and trust
Rab, Tanveer, and Karl B. Kern. “Cardiac Arrest A Treatment Algorithm for Emergent Invasive Cardiac Procedures in the Resuscitated Comatose Patient.” Journal of the American College of Cardiology 66.1 (2015): 62-73.
Are patients and families presented with the options for care considering prognosis and futility?
47/166
Ethical Issues pertinent to Care
• Ethical issues are unavoidable in the care of
critically ill patients but we must maximize the
ethical decision-making regarding angiography
and PCI in these patient populationso Clinical judgments of the multidisciplinary physicians must be observed whenever possible
o Diagnostic tools and data must be readily available for discussion in real time so that decisions can
be made
o Additional research into emerging data on this topic and diagnostic tools to keep our patients
receiving state of the art care
o Transparent discussions at the practice and policy making levels about what characterizes
appropriate or futile care
o Assessing patient wishes, respecting DNR and advanced directives even in times of family crisis
and proxy decision makers
o Lastly and importantly, a frank and honest discussion with families as to
what is futile care
Rab, Tanveer, and Karl B. Kern. “Cardiac Arrest A Treatment Algorithm for Emergent Invasive Cardiac Procedures in the Resuscitated Comatose Patient.” Journal of the American College of Cardiology 66.1 (2015): 62-73.
How frequently does this occur, by whom?
48/166
Immediate PCI for
STEMI (in minutes)1
65 67
5458
62 60
49
0
10
20
30
40
50
60
70
80
90
Q2 2017
n=27
Q3 2017
n=27
Q4 2017
n=48
Q1 2018
n=33
KD R4Q ACC 50th
percentile
ACC 90th
percentile
GOAL
R4Q O/E = 1.31 Median time frame from hospital arrival to immediate PCI for STEMI pts in minutes. Exclusions: Patients transferred in from
another acute care facility; Reasons for delay does not equal none. (ref:1502)*Comparison reporting period is 4/01/17 through 03/31/18
Have Thoughtful Pause or risk stratification concerns/discussions
contributed to the time?
49/166
Quality Initiative:Best Practice in Door to Balloon
• ED staff and CathLab RN to bring patients to Cath Lab in Cardiac
Alerts after 9:00pm
• Cardiac Alerts to be called at the time of leaving transferring
hospitals
• ED EKG to be placed in EMR or Tracemaster
• Cath Lab on call crew response time of 20 minutes
• Fallouts are reviewed promptly and in every case
• Cardiac Alerts called within 10 minutes of ED arrival unless Thoughtful
Pause is documented in the EMR
Has review of the Fallouts provided insight into potential opportunities
for improvement?
50/166
Radial Arterial Access Use
0.0%2.6%
5.2%8.4%
4.0%
40.7%
0.0%
5.0%
10.0%
15.0%
20.0%
25.0%
30.0%
35.0%
40.0%
45.0%
50.0%
Q2 2017
n=0/315
Q3 2017
n= 8/304
Q4 2017
n= 15/287
Q1 2018
n=25/299
KD R4Q ACC
Average
GOALThis is increasing but remains far below the ACC average. Is there a plan to
increase radial artery access?
R4Q O/E = 0.1
(ref:1658)*Comparison reporting period is 4/01/17 through 03/31/18 51/166
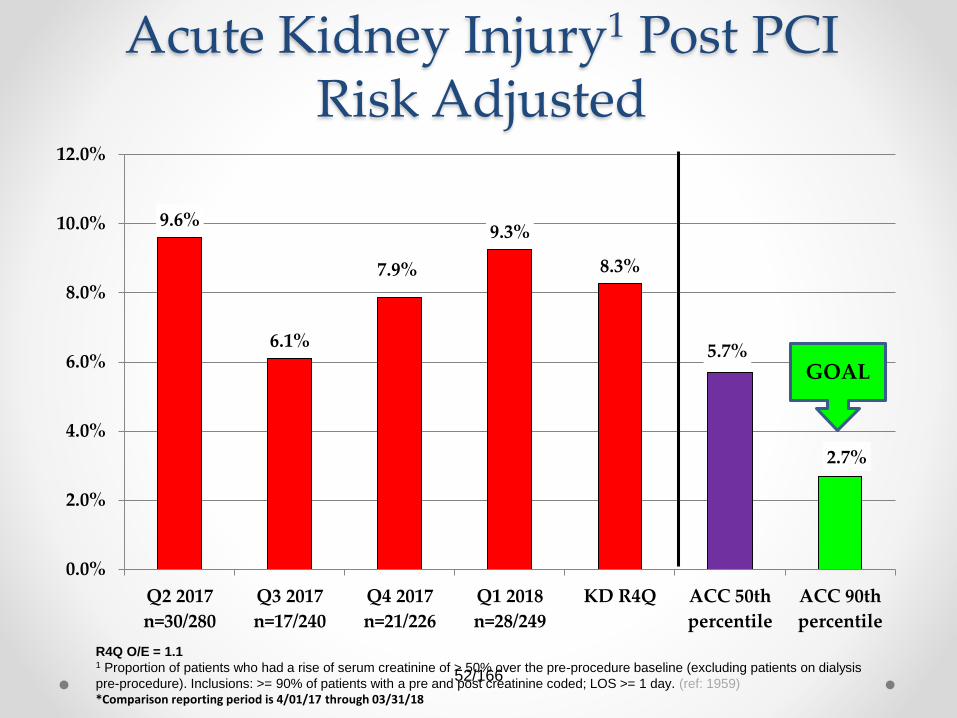
Acute Kidney Injury1 Post PCIRisk Adjusted
9.6%
6.1%
7.9%
9.3%
8.3%
5.7%
2.7%
0.0%
2.0%
4.0%
6.0%
8.0%
10.0%
12.0%
Q2 2017
n=30/280
Q3 2017
n=17/240
Q4 2017
n=21/226
Q1 2018
n=28/249
KD R4Q ACC 50th
percentile
ACC 90th
percentile
GOAL
R4Q O/E = 1.11 Proportion of patients who had a rise of serum creatinine of > 50% over the pre-procedure baseline (excluding patients on dialysis
pre-procedure). Inclusions: >= 90% of patients with a pre and post creatinine coded; LOS >= 1 day. (ref: 1959)*Comparison reporting period is 4/01/17 through 03/31/18
52/166
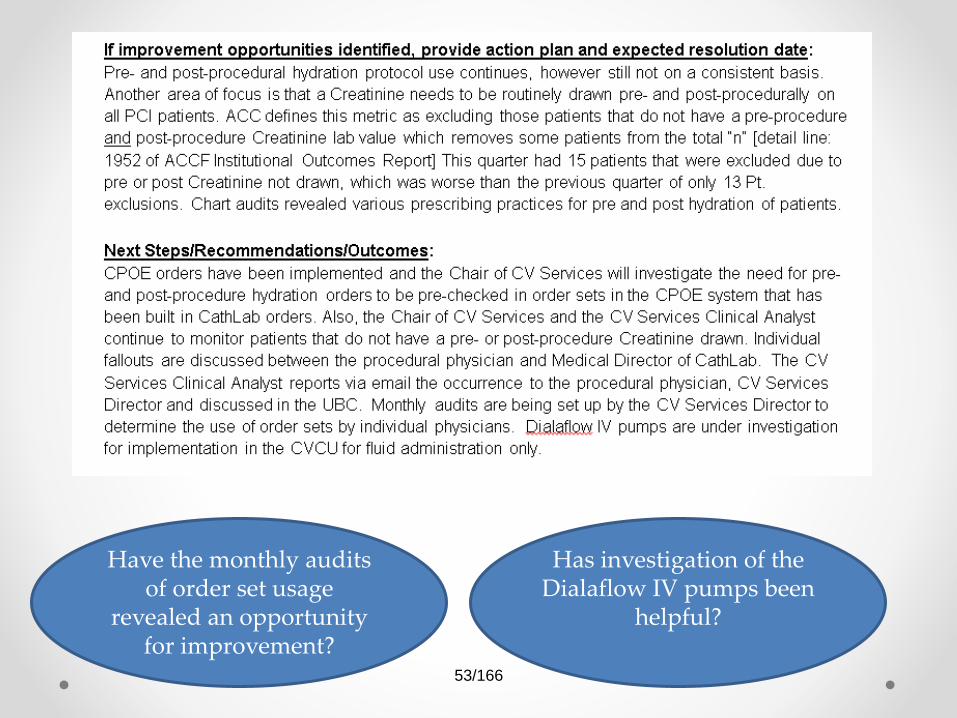
Have the monthly audits of order set usage
revealed an opportunity for improvement?
Has investigation of the Dialaflow IV pumps been
helpful?
53/166
Transfusion of RBCs1
3.0%
1.7%
2.5%2.4% 2.4%
1.1%
0.0%0.0%
0.5%
1.0%
1.5%
2.0%
2.5%
3.0%
3.5%
Q2 2017
n=9/304
Q3 2017
n=5/295
Q4 2017
n=7/280
Q1 2018
n=7/295
KD R4Q ACC 50th
percentile
ACC 90th
percentile
GOAL
R4Q O/E = 2.2 1 Proportion of patients who received a transfusion of whole blood or RBCs after PCI procedure. Exclusions: Patients having CABG
or other major surgery during the same admission; Pt.'s with a pre-procedure hemoglobin ≤8g/dL or no value. (ref: 1852)*Comparison reporting period is 4/01/17 through 03/31/18
54/166
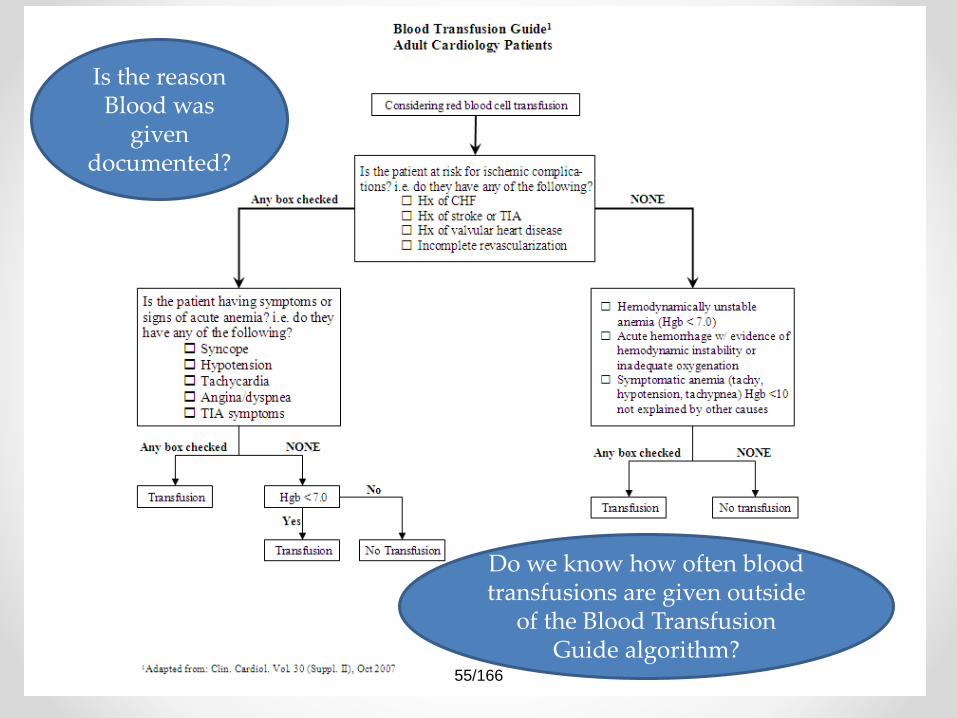
Do we know how often blood transfusions are given outside
of the Blood Transfusion Guide algorithm?
Is the reason Blood was
given documented?
55/166
ASA Prescribed at DC1
99.3%
97.2%
98.5%
99.6%
98.7%
99.3%
100.0%
95.5%
96.0%
96.5%
97.0%
97.5%
98.0%
98.5%
99.0%
99.5%
100.0%
Q2 2017
n=2
Q3 2017
n=8
Q4 2017
n=4
Q1 2018
n=1
KD R4Q ACC 50th
percentile
ACC 90th
percentile
GOAL
R4Q O/E = 1.01 Proportion of pts (without a documented contraindication) with a stent attempted or implanted that were prescribed aspirin at
discharge; excludes patients that were discharged to "Other acute care hospital", "Hospice", or “Left against medical advice (AMA)“
(ref: 1996)*Comparison reporting period is 4/01/17 through 03/31/18
Are the orders hardwired into the Discharge
order set?
56/166
Statins Prescribed at DC1
98.3%
96.5%
97.4%
99.6%
98.0% 98.0%
100.0%
94.0%
95.0%
96.0%
97.0%
98.0%
99.0%
100.0%
Q2 2017
n=5
Q3 2017
n=10
Q4 2017
n=7
Q1 2018
n=1
KD R4Q ACC 50th
percentile
ACC 90th
percentile
GOAL
R4Q O/E = 1.01 Proportion of pts (without a documented contraindication) with stent attempted or implanted that were prescribed statin at discharge;
excludes patients that were dc’ed to "Other acute care hospital", "Hospice", or “Left against medical advice (AMA)“ (ref: 2001)
*Comparison reporting period is 4/01/17 through 03/31/18
Are the orders hardwired into the Discharge
order set?
57/166
Post-PCI Length of Stay1
– with STEMI
4.03.7
4.6
3.94.1
3.7
0.0
0.5
1.0
1.5
2.0
2.5
3.0
3.5
4.0
4.5
5.0
Q2 2017
n=50
Q3 2017
n=51
Q4 2017
n=61
Q1 2018
n=45
KD R4Q ACC
Average
GOAL
R4Q O/E = 1.11 Mean Post-procedure length of stay in STEMI patients. Exclusions: Patients having CABG or other major surgery during the
same admission. (ref:2134)*Comparison reporting period is 4/01/17 through 03/31/18
Are there additional measures under
consideration for reducing the LOS or impediments
that need to be addressed by the medical staff?
58/166
Post-PCI Length of Stay1
– w/out STEMI
2.8
2.0 2.0
2.62.4
1.8
0.0
0.5
1.0
1.5
2.0
2.5
3.0
3.5
Q2 2017
n=257
Q3 2017
n=246
Q4 2017
n=220
Q1 2018
n=246
KD R4Q ACC
Average
GOAL
R4Q O/E = 1.31 Mean Post-procedure length of stay in patients without STEMI. Exclusions: Patients having CABG or other major surgery
during the same admission. (ref:2173)*Comparison reporting period is 4/01/17 through 03/31/18
Are there additional measures under
consideration for reducing the LOS or impediments that need to be addressed by the