+ All Categories
Home > Documents > Notice to ASX/LSE

Notice to ASX/LSE

Date post: 12-Dec-2021
Category:
Upload: others
View: 1 times
Download: 0 times
Share this document with a friend
24
Notice to ASX/LSE 1 Rio Tinto releases second quarter production results 17 July 2020 Rio Tinto Chief Executive J-S Jacques said “We delivered a strong performance, particularly in iron ore and bauxite, demonstrating the underlying resilience of our business and ability to adapt in difficult conditions. Our iron ore assets are performing well in a strong pricing environment and we are on track to meet our 2020 iron ore guidance. Despite various COVID-19 related challenges, all our assets have continued to operate, with our first priority to protect the health and safety of all our employees and communities. “Our focus is to maintain a business as usual approach with many safeguards at a very unusual time. Our operational teams are continuing to run our assets safely so we can continue to contribute to local and national economies and serve our customers. We remain even more committed to our relationship with communities, following the Juukan Gorge events in the Pilbara, and we are engaging extensively with Traditional Owners around our operations and across Australia. “We are executing our value over volume strategy to drive performance, productivity and free cash flow per share. We will remain agile and ready to adapt to the changing operating and macro environment.” Production* Q2 2020 vs Q2 2019 vs Q1 2020 H1 2020 vs H1 2019 Pilbara iron ore shipments (100% basis) Mt 86.7 +1 % +19 % 159.6 +3 % Pilbara iron ore production (100% basis) Mt 83.2 +4 % +7 % 161.1 +3 % Bauxite Mt 14.6 +9 % +5 % 28.4 +8 % Aluminium kt 785 -2 % 0 % 1,568 -2 % Mined Copper kt 132.8 -3 % 0 % 265.7 -5 % Titanium dioxide slag kt 262 -13 % -10 % 555 -7 % IOC iron ore pellets and concentrate Mt 2.8 +9 % +8 % 5.3 +6 % *Rio Tinto share unless otherwise stated Q2 Operational update We continue to prioritise the health and safety of our employees and communities during this turbulent period. We achieved an all injury frequency rate of 0.37 for the first half of 2020, trending positively compared with a rate of 0.42 in 2019. We have now fully embedded our rigorous COVID-19 health and hygiene controls as we adapt to the new operating conditions. Our operational sites and offices are moving ahead with the implementation of fit for purpose COVID-19 screening as an additional measure to protect our people and communities. We remain even more committed to our relationship with communities, following the Juukan Gorge events in the Pilbara. We are engaging extensively with Traditional Owners, including the Puutu Kunti Kurrama and Pinikura people, and indigenous leaders in the Pilbara and across Australia. On 19 June 2020, we announced a board-led review of our heritage management processes within Iron Ore to be completed by October 2020. We will also contribute to the Inquiry by the Joint Standing Committee on Northern Australia that will report to the Senate and we will continue to support the West Australian government’s planned reform of the Aboriginal Heritage Act 1972 (WA). Overall, we achieved a robust production performance with volumes up 1% compared with the second quarter of 2019 on a copper equivalent basis despite significant global challenges, restrictions related to COVID-19 and the impact of the earthquake at Kennecott, Utah. Pilbara iron ore shipments of 86.7 million tonnes (100% basis) were 1% higher than the second quarter of 2019 despite the impact of COVID-19 related operational controls. With 1.7 million tonnes of port sales in the second quarter, we continue to grow our portside business steadily, looking to better serve our existing customers and open opportunities to sell to new customers who do not participate in the seaborne market. Bauxite production of 14.6 million tonnes, 9% higher than the second quarter of 2019, continued the first quarter trend following the successful ramp-up of Amrun in 2019, and higher production at the non-managed CBG joint venture in Guinea reflecting good progress on the ramp-up of the expansion. Aluminium production of 0.8 million tonnes in the second quarter was 2% lower than the second quarter of 2019 primarily due to pot relining at Kitimat, the decision to operate the ISAL smelter at 85% capacity and the curtailment of the fourth pot line at our New Zealand Aluminium Smelter (NZAS) in April 2020 due to COVID-19 impacts. On 9 July 2020, we announced the wind-down of operations and eventual closure of NZAS following the conclusion of the strategic review.
Transcript

Notice to ASX/LSE

1

Rio Tinto releases second quarter production results 17 July 2020

Rio Tinto Chief Executive J-S Jacques said “We delivered a strong performance, particularly in iron ore and bauxite,

demonstrating the underlying resilience of our business and ability to adapt in difficult conditions. Our iron ore assets are

performing well in a strong pricing environment and we are on track to meet our 2020 iron ore guidance. Despite various

COVID-19 related challenges, all our assets have continued to operate, with our first priority to protect the health and safety of

all our employees and communities. “Our focus is to maintain a business as usual approach with many safeguards at a very unusual time. Our operational teams

are continuing to run our assets safely so we can continue to contribute to local and national economies and serve our

customers. We remain even more committed to our relationship with communities, following the Juukan Gorge events in the

Pilbara, and we are engaging extensively with Traditional Owners around our operations and across Australia.

“We are executing our value over volume strategy to drive performance, productivity and free cash flow per share. We will

remain agile and ready to adapt to the changing operating and macro environment.”

Production* Q2

2020 vs Q2 2019

vs Q1 2020

H1 2020

vs H1 2019

Pilbara iron ore shipments (100% basis) Mt 86.7 +1 % +19 % 159.6 +3 %

Pilbara iron ore production (100% basis) Mt 83.2 +4 % +7 % 161.1 +3 %

Bauxite Mt 14.6 +9 % +5 % 28.4 +8 %

Aluminium kt 785 -2 % 0 % 1,568 -2 %

Mined Copper kt 132.8 -3 % 0 % 265.7 -5 %

Titanium dioxide slag kt 262 -13 % -10 % 555 -7 %

IOC iron ore pellets and concentrate Mt 2.8 +9 % +8 % 5.3 +6 %

*Rio Tinto share unless otherwise stated

Q2 Operational update

• We continue to prioritise the health and safety of our employees and communities during this turbulent period. We

achieved an all injury frequency rate of 0.37 for the first half of 2020, trending positively compared with a rate of 0.42

in 2019. We have now fully embedded our rigorous COVID-19 health and hygiene controls as we adapt to the new

operating conditions. Our operational sites and offices are moving ahead with the implementation of fit for purpose

COVID-19 screening as an additional measure to protect our people and communities.

• We remain even more committed to our relationship with communities, following the Juukan Gorge events in the

Pilbara. We are engaging extensively with Traditional Owners, including the Puutu Kunti Kurrama and Pinikura

people, and indigenous leaders in the Pilbara and across Australia. On 19 June 2020, we announced a board-led

review of our heritage management processes within Iron Ore to be completed by October 2020. We will also

contribute to the Inquiry by the Joint Standing Committee on Northern Australia that will report to the Senate and we

will continue to support the West Australian government’s planned reform of the Aboriginal Heritage Act 1972 (WA).

• Overall, we achieved a robust production performance with volumes up 1% compared with the second quarter of

2019 on a copper equivalent basis despite significant global challenges, restrictions related to COVID-19 and the

impact of the earthquake at Kennecott, Utah.

• Pilbara iron ore shipments of 86.7 million tonnes (100% basis) were 1% higher than the second quarter of 2019

despite the impact of COVID-19 related operational controls. With 1.7 million tonnes of port sales in the second

quarter, we continue to grow our portside business steadily, looking to better serve our existing customers and open

opportunities to sell to new customers who do not participate in the seaborne market.

• Bauxite production of 14.6 million tonnes, 9% higher than the second quarter of 2019, continued the first quarter

trend following the successful ramp-up of Amrun in 2019, and higher production at the non-managed CBG joint

venture in Guinea reflecting good progress on the ramp-up of the expansion.

• Aluminium production of 0.8 million tonnes in the second quarter was 2% lower than the second quarter of 2019

primarily due to pot relining at Kitimat, the decision to operate the ISAL smelter at 85% capacity and the curtailment

of the fourth pot line at our New Zealand Aluminium Smelter (NZAS) in April 2020 due to COVID-19 impacts.

• On 9 July 2020, we announced the wind-down of operations and eventual closure of NZAS following the conclusion

of the strategic review.

2

• Second quarter mined copper was 3% lower than the same period of 2019 due to lower head grade at Kennecott.

Second quarter refined copper was 67% lower than the same period of 2019 due to the impact from the 5.7

magnitude earthquake in the first quarter resulting in an unplanned flash converting furnace rebuild at Kennecott, in

addition to the planned 45-day smelter shutdown in May/June.

• On 29 June 2020, we announced an agreement with Turquoise Hill Resources and the Government of Mongolia on

the preferred domestic power solution for Oyu Tolgoi that paves the way for the Government to fund and construct a

State Owned Power Plant at Tavan Tolgoi. Parties will work towards finalising a Power Purchase Agreement by

March 2021.

• The new Oyu Tolgoi mine design announced on 3 July 2020, confirms that the caving method of mining remains

valid. We are targeting first sustainable production between October 2022 to June 2023 and development capital of

$6.6 to $7.1 billion based on the updated mine design of Panel 0. Material contained in pillars retained on either side

of Panel 0 have been reclassified from Ore Reserves to Mineral Resources. Part of the material contained in these

pillars is expected to be recoverable at a later stage following additional studies which are currently underway.

• Titanium dioxide slag production of 262 thousand tonnes was 13% lower than the second quarter of 2019 partly due

to COVID-19 restrictions in Quebec and South Africa.

• Production of pellets and concentrate at the Iron Ore Company of Canada (IOC) was 9% higher than the same

period of 2019 with continued focus on concentrate feed to match market demand.

• Governments are gradually lifting restrictions on the movement of goods and people as part of their COVID-19

recovery plans. However, some restrictions remain in place or are being reintroduced. As a result, there continues to

be an impact on projects in general although to a lesser degree than earlier in the year.

• Capital expenditure is expected to be around $6 billion in 2020 (previously $5 to $6 billion) due to an appreciation in

our major operating currencies against the US dollar since the first quarter and a reduced impact of COVID-19 on

both sustaining and development expenditure. Capital expenditure for 2021 and 2022 is expected to be around $7

billion per year (previously $6.5 billion). This includes spend from 2020 that has been re-phased as a result of

COVID-19 restrictions. Further details can be found in the Investments, growth and development projects section

below.

• We made a final payment of US$1.0 billion in Australian income tax in June 2020 with respect to 2019 profits.

3

COVID-19 Our markets In China, conditions have improved through the second quarter and appear to be stabilising. While employment and trade

uncertainties remain, the construction and infrastructure sectors are performing well; house prices and stock markets are also

recovering, lending support to consumer confidence. The United States and Europe have started to re-open and recover. A

second wave of infections remains a key threat for advanced economies.

• China’s demand for iron ore continues while the recovery in Japan and Europe is yet to begin meaningfully and is

likely to be subdued when it does.

• The automotive sector is showing initial signs of recovery from a very low base, supporting demand for aluminium

value-added products (VAP).

• There has been limited impact on bauxite demand to date.

• China’s copper concentrate market remains favourable; however, the US market is weaker. COVID-19 related

supply disruptions are between 3 to 4% of annual copper supply currently, in addition to normal industry supply

disruptions, and could increase further.

Average realised prices achieved for our major commodities

Units H1 19 FY 19 Q1 20 Q2 20 H1 20 Pilbara iron ore FOB, $/wmt 78.5 79.0 77.3 79.6 78.5 Pilbara iron ore FOB, $/dmt 85.3 85.9 84.0 86.5 85.4 Aluminium Metal $/t 2,174 2,132 2,014 1,715 1,849 Copper US cents per pound 282.0 275.0 260.5 240.1 250.0 IOC pellets $/wmt 141.4 137.1 116.6 117.6 117.0

Our assets During the COVID-19 pandemic, we have implemented strict protocols globally across the business. These measures are in

line with government guidance and directives, and advice from leading medical experts and international health organisations

on best practice to keep our employees, contractors and partners healthy and safe. These range from physical distancing to

travel restrictions, roster changes and team splits, to flexible working arrangements, rapid screening and personal hygiene

controls.

While uncertainties continue to exist in our business environment, we are focused on our underlying resilience and ability to

adapt in a fast-moving environment. Key updates are outlined below and full details of initiatives taken to date can be found

on our website.

Operations and Workforce

• With the de-escalation of health restrictions in Western Australia, we are progressing the return to normal rosters at

our Iron Ore operations, construction and exploration projects. We expect this transition to be completed by August

2020.

• Our office-based employees are beginning to return to offices in regions where permitted. In most cases,

employees are returning to offices in alternate teams to reduce the risk of widespread transmission and ensure

business continuity.

• We have introduced screening programmes across sites as a control to stop the spread of COVID-19. For the Pilbara fly-in-fly-out workforce, we have conducted more than 50,000 checks through facilities we established at Perth and regional airports as an enhanced control for employees boarding flights to site.

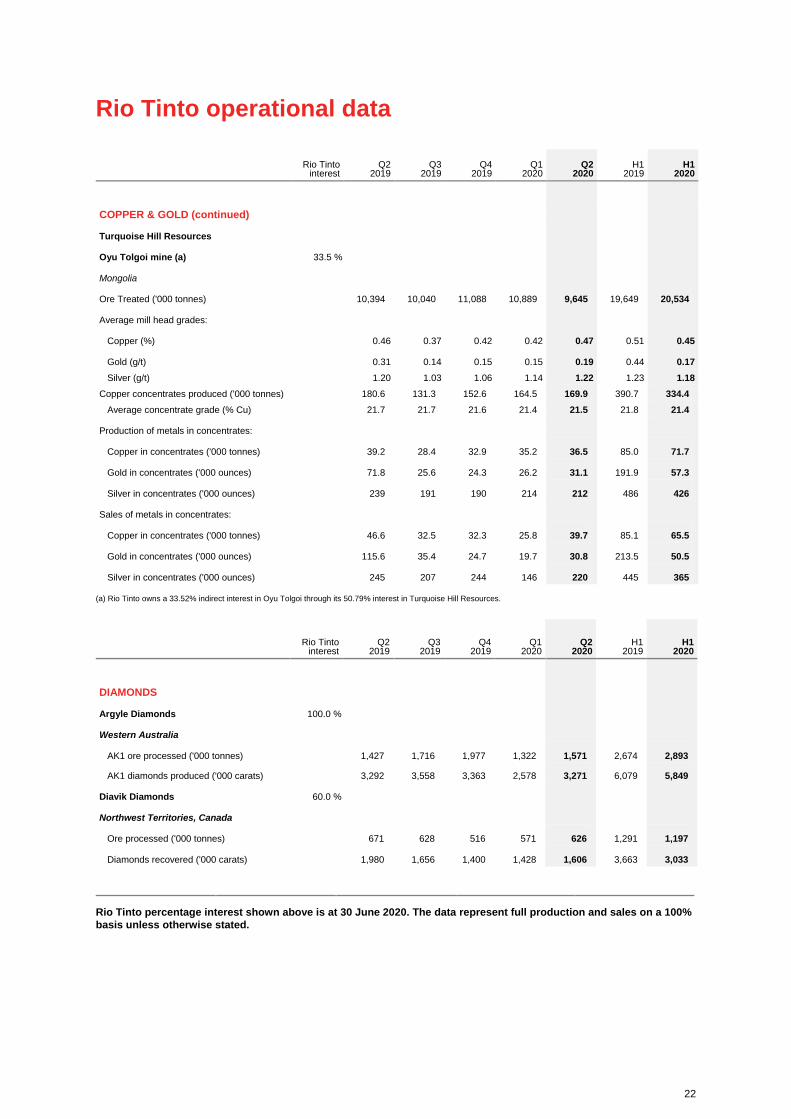
• At our copper assets in Mongolia and the US, our teams have used virtual technology to overcome some challenges related to COVID-19 travel restrictions. At our Oyu Tolgoi underground project in Mongolia, the use of virtual reality glasses has helped gain access to global experts to support project progression during construction and commissioning stages.

• At Richards Bay Minerals (RBM), furnaces are gradually ramping up production following easing of restrictions in South Africa. However, we are managing the situation carefully in the challenging South African environment.

Products

• In the second quarter, we continued to focus on the optimisation of IOC product mix to match market demand, moving from pellet to concentrate.

• In aluminium, in response to market conditions we have reduced the proportion of primary metal being produced as

VAP, which represented 40% of primary metal sold in the first half of 2020 (first half 2019: 54%).

4

Production guidance

Rio Tinto share, unless otherwise stated 2019 Actuals H1 2020 (YTD) 2020 Pilbara iron ore (shipments, 100% basis) (Mt) 327 159.6 324 to 334 Bauxite (Mt) 55 28.4 55 to 58 Alumina (Mt) 7.7 4.0 7.8 to 8.2 Aluminium (Mt) 3.2 1.6 3.1 to 3.3 Mined copper (kt) 577 265.7 475 to 520 Refined copper (kt) 260 74.1 165 to 205 Diamonds (M carats) 17 7.7 12 to 14 Titanium dioxide slag (Mt) 1.2 0.6 Lower end of 1.2 to 1.4

IOC iron ore pellets and concentrate (Mt) 10.5 5.3 10.5 to 12.0 Boric oxide equivalent (Mt) 0.5 0.26 ~0.5

• Production guidance remains unchanged across all commodities from the First Quarter Operations Review.

• We will continue to monitor and adjust production levels and product mix to meet customer requirements in 2020, in

line with our value over volume strategy, government imposed restrictions related to COVID-19, and any other

potential COVID-19 related disruptions.

Operating costs

• Pilbara iron ore 2020 unit cost guidance is expected to be within the previous guidance of $14 to $15 per tonne,

including unplanned one-off COVID-19 costs of $0.50 per tonne mostly incurred in the first half of 2020, relating to

controls such as cleaning, screening, additional flights, and roster changes. The guidance is based on an Australian

dollar exchange rate of $0.67.

• Copper C1 unit cost guidance in 2020 remains unchanged at 120-135 US cents/lb.

Investments, growth and development projects

• Governments are gradually lifting restrictions on the movement of goods and people as part of their COVID-19

recovery plans. Nevertheless, the pace is controlled and some restrictions remain in place or are being reintroduced.

This continues to have an impact on projects in general although to a lesser degree than earlier in the year.

• Capital expenditure is expected to be around $6 billion in 2020 (previously $5 to $6 billion) due to an appreciation in

our major operating currencies against the US dollar since the first quarter and a reduced impact of COVID-19 on

both sustaining and development expenditure. Our focus is to complete as much of the original planned sustaining

expenditure as possible in the second half to enhance the resilience of our asset base. Capital expenditure for 2021

and 2022 is expected to be around $7 billion per year (previously $6.5 billion). This includes spend from 2020 that

has been re-phased as a result of COVID-19 restrictions.

• Exploration and evaluation spend in the second quarter was $136 million ($280 million in the first half of 2020), 16%

lower than the second quarter of 2019, and 5% lower than the first quarter of 2020.

Pilbara replacement projects

• Project teams continue to actively manage the impacts of COVID-19 with the implementation of project response

plans. Recovery efforts are underway including a transition back to the usual three weeks on, one week off project

rosters in the Pilbara.

• Supply chain issues are being managed and construction continues to progress despite necessary roster changes,

social distancing and travel restrictions.

• The Koodaideri project is progressing with production ramp-up still expected to occur in early 2022. The primary

crusher surge bin was delivered to site in May 2020, representing the first significant structural component for the

processing plant.

• First ore from the Robe River Joint Venture sustaining production projects (West Angelas C&D and Mesa B, C and H

at Robe Valley) is still expected in 2021. All primary approvals for Mesa H have now been received.

Oyu Tolgoi underground project

• Work continues to progress despite international travel restrictions issued by the Government of Mongolia to manage

the risk of COVID-19 transmission.

• Underground lateral development continues to achieve high productivity with average monthly rates above 1,800

equivalent metres (eqm) in April, May and June.

• Shafts 3 and 4 remain on care and maintenance with no effective progress for the quarter and non-critical surface

construction work areas have now also been placed on care and maintenance. Limited night shift work has

recommenced on critical underground handling infrastructure, with the material handling system currently

progressing at approximately 40% of planned rates.

• The new mine design announced on 3 July 2020, confirms that the caving method of mining remains valid and that

the underground schedule and costs currently remain within the ranges previously disclosed. We are targeting first

sustainable production between October 2022 to June 2023 and development capital of $6.6 to $7.1 billion based on

the updated mine design of Panel 0.1

• Material contained in pillars retained on either side of Panel 0 have been reclassified from Ore Reserves to Mineral

Resources. Part of the material contained in these pillars is expected to be recoverable at a later stage following

additional studies which are currently underway.

• The definitive estimate of cost and schedule for Panel 0 is still expected in the second half of 2020.

5

Other key projects and exploration and evaluation

• Phase one of the south wall pushback project at Kennecott remains on track, despite disruptions from the 5.7

magnitude earthquake in the first quarter, with access to higher grades expected from 2021.

• The Zulti South project in South Africa remains on full suspension due to security and community issues.

• The Kemano hydropower tunnel project is targeting a re-start of tunnel excavation works in the third quarter of 2020.

• We are continuing our study programme at the Resolution Copper project in Arizona, USA despite COVID-19

disruptions. The study commenced underground characterisation of the ore body following Board approval in April

2020. Sinking of Shaft 9 continues on schedule and on budget, reaching a depth of 1,906m out of 2,086m total at the

end of June.

• At our Winu project in Western Australia, drilling and fieldwork activities continue with strong health protocols in place

to prevent the transmission of COVID-19. Restrictions are beginning to ease, allowing people movements and

access to sites. We continue to see potential to develop the Paterson into a broader opportunity through both our

own exploration and joint ventures in the region.

• The Simandou iron ore project (Blocks 3 and 4) in Guinea is progressing as we collaborate with our partners to

optimise the programme. A scope of work has been prepared to enable selected China-based design institutes to

update the infrastructure elements of the project including the design of its designated trans-Guinean rail line and to

assess shipping methods.

1 The level of accuracy of these estimates is preliminary in nature and subject to a range of variables, in line with previous guidance. The confidence level of these

estimates is at a level associated with a Pre-Feasibility Study, and further work is required between now and the second half of 2020 to refine the mine design options and

study them to a level of confidence and accuracy associated with Feasibility Study quality estimates.

All figures in this report are unaudited. All currency figures in this report are US dollars, and comments refer to Rio Tinto’s share of production, unless otherwise stated. To

allow production numbers to be compared on a like-for-like basis, production from asset divestments completed in 2019 is excluded from Rio Tinto share of production

data.

6

IRON ORE

Rio Tinto share of production (Million tonnes) Q2

2020 vs Q2 2019

vs Q1 2020

H1 2020

vs H1 2019

Pilbara Blend and SP10 Lump1 19.0 -4 % +3 % 37.5 -6 %

Pilbara Blend and SP10 Fines1 30.9 +8 % +11 % 58.6 +2 %

Robe Valley Lump 1.3 +10 % -10 % 2.8 +52 %

Robe Valley Fines 3.0 +40 % +24 % 5.4 +60 %

Yandicoogina Fines (HIY) 14.8 +6 % +5 % 28.9 +5 %

Total Pilbara production 68.9 +5 % +7 % 133.2 +3 %

Total Pilbara production (100% basis) 83.2 +4 % +7 % 161.1 +3 %

Rio Tinto share of shipments (Million tonnes) Q2

2020 vs Q2 2019

vs Q1 2020

H1 2020

vs H1 2019

Pilbara Blend Lump 16.7 -7 % +16 % 31.1 -8 %

Pilbara Blend Fines 33.0 +3 % +24 % 59.7 +1 %

Robe Valley Lump 1.1 +8 % -1 % 2.2 +51 %

Robe Valley Fines 3.0 +16 % +12 % 5.7 +46 %

Yandicoogina Fines (HIY) 15.6 +2 % +21 % 28.5 +4 %

SP10 Lump1 1.0 +60 % +1 % 2.0 +218 %

SP10 Fines1 1.6 -8 % +47 % 2.7 -18 %

Total Pilbara shipments2 72.0 +1 % +20 % 132.0 +2 %

Total Pilbara shipments (100% basis)2 86.7 +1 % +19 % 159.6 +3 %

Total Pilbara Shipments (consolidated basis)2, 3 74.0 +1 % +20 % 135.7 +2 %

1 SP10 includes other lower grade products. 2 Shipments includes material shipped from the Pilbara to our portside trading facility in China which may not be sold

onwards in the same period. 3 While Rio Tinto has a 53% net beneficial interest in Robe River Iron Associates, it recognises 65% of the assets, liabilities, sales revenues

and expenses in its accounts (as 30% is held through a 60% owned subsidiary and 35% is held through a 100% owned subsidiary). The consolidated basis sales reported

here include Robe River Iron Associates on a 65% basis to enable comparison with revenue reported in the financial statements.

Pilbara operations

Pilbara operations produced 161.1 million tonnes (Rio Tinto share 133.2 million tonnes) in the first half of 2020, 3% higher than

the same period of 2019. Total material moved across our operations, including waste, was 8% higher than the corresponding

period of 2019.

First half shipments of 159.6 million tonnes (Rio Tinto share 132.0 million tonnes) were 3% higher than the first half of 2019,

despite infrastructure damage and significant disruptions experienced at our ports as a result of Tropical Cyclone Damien in

February. In the second quarter, our operations performed well, despite the strict measures implemented to manage COVID-

19. In early June, our port operations achieved a record week of shipping with rates exceeding 400 million tonnes per annum.

Approximately 14% of shipments in the first half of 2020 were priced by reference to the prior quarter’s average index lagged by

one month. The remainder was sold either on current quarter average, current month average or on the spot market.

Approximately 31% of first half 2020 sales were made on a free on board (FOB) basis, with the remainder sold including freight. Achieved average pricing in the first half of 2020 was $78.5 per wet metric tonne on an FOB basis (equivalent to $85.4 per dry

metric tonne, at 8% moisture assumption). This compares to the average first half price for the Platts 62% index of $85.1 per

dry metric tonne.

China Portside Trading

We continue to increase the volumes of our port sales in China, with 2.5 million tonnes of sales during the first half of 2020 (1.7

million tonnes in the second quarter), and included product from our IOC and Pilbara operations, as well as third party volume.

Our portside trading sales are now serving 61 new customers.

Heritage

Following the Juukan Gorge heritage events in the Pilbara, we announced a board-led review of our heritage management

processes within Iron Ore to be completed by October 2020. We will also contribute to the Inquiry by the Joint Standing

Committee on Northern Australia that will report to the Senate and we will continue to support the West Australian

government’s planned reform of the Aboriginal Heritage Act 1972 (WA). We have introduced additional controls related to

heritage management and we are actively engaging with Traditional Owners and Aboriginal and Torres Strait Islander

communities around our operations and across Australia more broadly.

7

ALUMINIUM

Rio Tinto share of production (‘000 tonnes) Q2

2020 vs Q2 2019

vs Q1 2020

H1 2020

vs H1 2019

Bauxite 14,560 +9 % +5 % 28,373 +8 %

Bauxite third party shipments 10,721 +13 % +13 % 20,190 +10 %

Alumina 1,990 +6 % -1 % 4,000 +3 %

Aluminium 785 -2 % 0 % 1,568 -2 % Bauxite

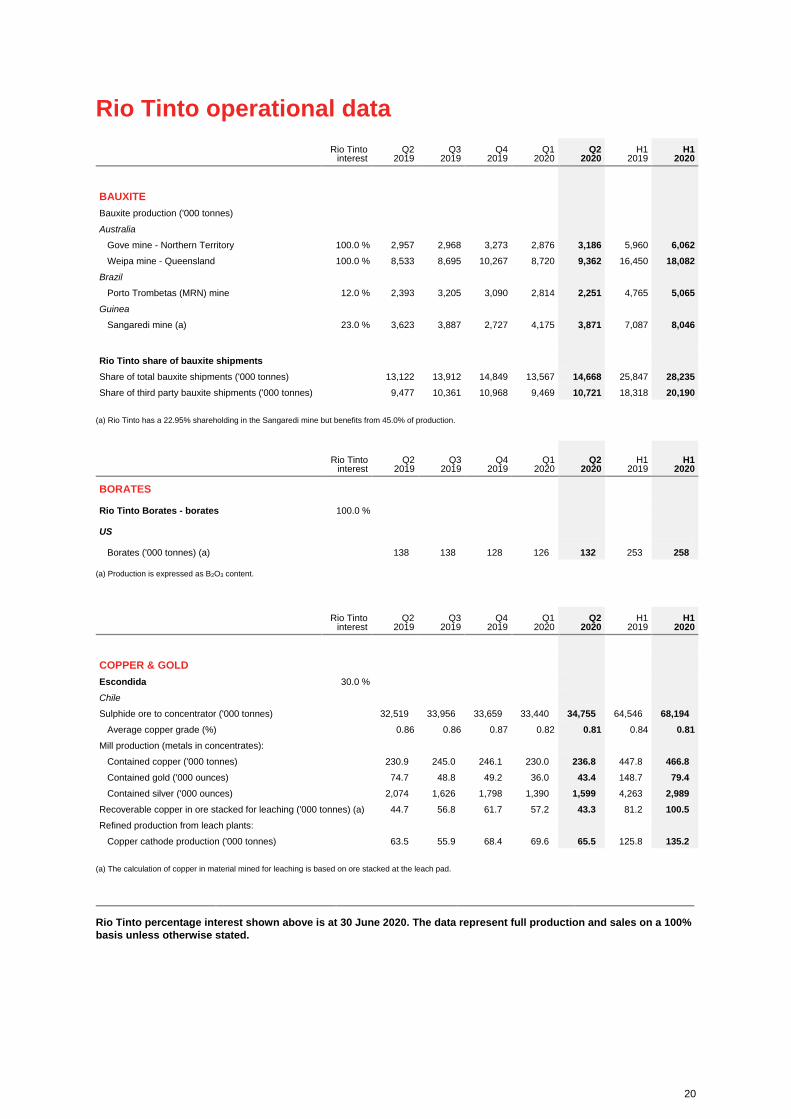
Second quarter bauxite production of 14.6 million tonnes was 9% higher than the second quarter of 2019. Production at

managed operations increased by 9% underpinned by the Amrun mine, whilst production at the non-managed CBG joint

venture in Guinea increased by 7% reflecting good progress on the ramp-up of the expansion.

We shipped 10.7 million tonnes of bauxite to third parties in the second quarter, 13% higher than same period of 2019.

Our Bauxite Integrated Operations Centre (BIOC) in Brisbane, Australia provides 24/7 operation and monitoring of all safety,

production and quality aspects at our remote bauxite sites in Weipa, Queensland and Gove, Northern Territory. We continue to

apply technology solutions for optimising the supply chain, leveraging data analytics and progressing automation initiatives. For

instance, we are utilising a fully automated “drone in a box” for remote monitoring of stock piles, removing the need for manual

visual inspection. Alumina

Alumina production in the second quarter of 2020 is 6% higher than the same period of 2019 due to higher production levels in

the Pacific refineries with Yarwun delivering a half year production record. Aluminium

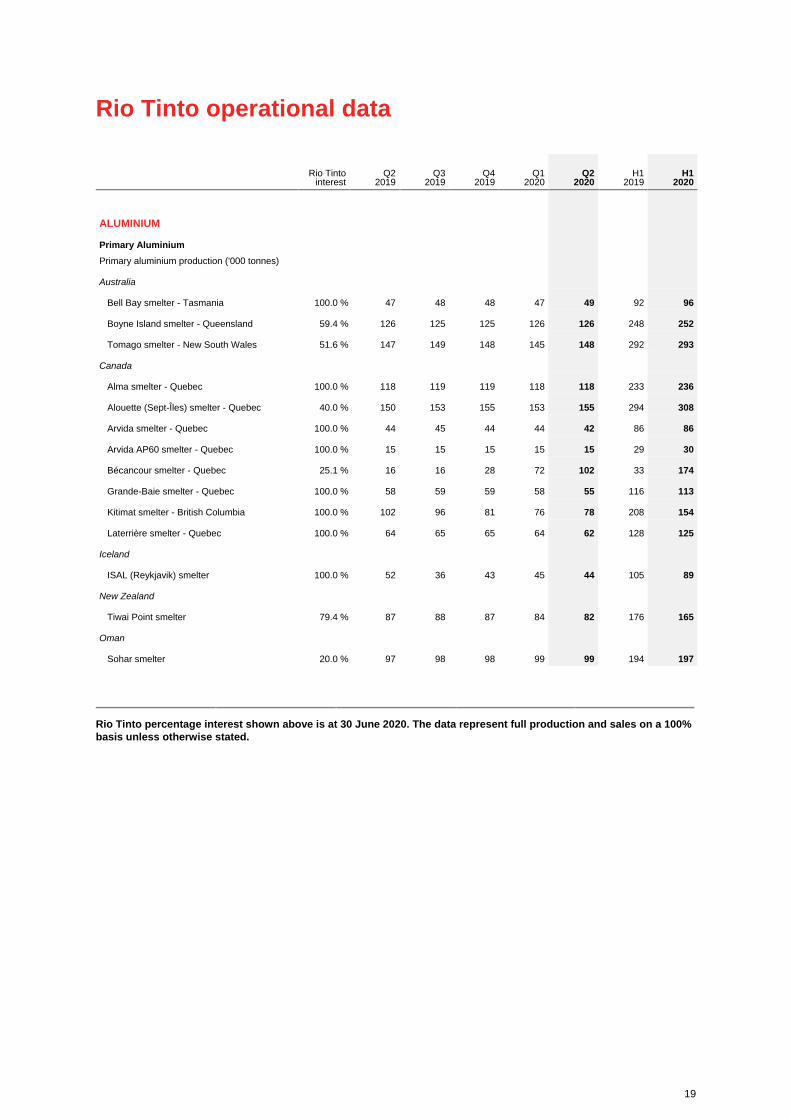
Aluminium production in the second quarter of 0.8 million tonnes was 2% lower than the second quarter of 2019 (flat on the

prior quarter), primarily due to pot relining at Kitimat, the decision to operate the ISAL smelter in Iceland at 85% of its capacity,

and the curtailment of the fourth pot line at NZAS on 3 April 2020 due to COVID-19 impacts. This has been partly offset by the

non-managed Becancour smelter which has reached 93% capacity, following its ramp-up after a lock-out in 2019. Average realised aluminium prices including premiums for value-added products (VAP) were down by 15% to $1,849 per tonne

in the first half of 2020 (first half 2019: $2,174 per tonne). The LME price decreased by 13% to $1,595 per tonne (first half 2019:

$1,826), whilst the mid-west premium duty paid dropped 41% to $249 per tonne in the first half of 2020 (first half 2019: $420

per tonne) due to the impact of COVID-19. Our VAP sales also dropped significantly to 40% of primary metal sold in the first

half of 2020 (first half 2019: 54%) in line with the market, but this was substituted by sales of standard ingot products (P1020).

Product premiums for VAP sales declined by 14% averaging, $208 per tonne of VAP sold (first half 2019: $242 per tonne).

The aluminium industry continues to face challenging conditions in global markets and policy uncertainty, exacerbated by the

impact of COVID-19. On 9 July 2020, we announced the wind-down of operations and eventual closure of the Tiwai Point

Aluminium Smelter (NZAS) following the conclusion of the strategic review which has shown the business is no longer viable

given high energy costs and a challenging outlook for the aluminium industry. As a result, NZAS has given Meridian Energy

notice to terminate the power contract, which will end in August 2021 when the smelter’s wind-down of operations is expected

to be complete.

We continue to actively work on enhancing the competitiveness of our smelters, including discussing energy pricing with

stakeholders, to ensure the sustainability of our smelters in Australia and Iceland. Work on the strategic review of the ISAL

smelter in Iceland announced in February 2020 is ongoing, to determine the viability and competitive position of the operation

considering all options including closure.

8

COPPER AND DIAMONDS

Rio Tinto share of production (‘000 tonnes) Q2

2020 vs Q2 2019

vs Q1 2020

H1 2020

vs H1 2019

Mined copper

Rio Tinto Kennecott 36.5 -11 % +4 % 71.5 -24 %

Escondida 84.0 +2 % -3 % 170.2 +7 %

Oyu Tolgoi 12.2 -7 % +4 % 24.0 -16 %

Refined copper

Rio Tinto Kennecott 7.2 -89 % -73 % 33.6 -64 %

Escondida 19.7 +3 % -6 % 40.5 +7 %

Rio Tinto share of production (‘000 carats) Q2

2020 vs Q2 2019

vs Q1 2020

H1 2020

vs H1 2019

Argyle 3,271 -1 % +27 % 5,849 -4 %

Diavik 963 -19 % +12 % 1,820 -17 % Kennecott

Mined copper production was 11% lower than the same quarter of 2019, primarily due to pit sequencing and lower copper

grades, with the end of the east wall lower pit mining approaching. Copper grades were 11% lower in the second quarter of

2020 compared with the same quarter of 2019. Grades will continue to be lower through 2020 before increasing from the first

half of 2021, with the transition from east wall to south wall mining.

Refined copper was 89% lower than the same quarter in 2019, driven by the shutdown of the flash converting furnace required

as a result of the earthquake on 18 March, and the consequent shutdown of anode production. Low levels of refined copper

produced in the second quarter were based on anodes refined prior to the shutdown and refining of scrap anodes.

The planned 45-day smelter shutdown in May has concluded and we are now focused on the safe re-start of the smelter. The

flash converting furnace rebuild required following the earthquake in Utah on 18 March is on track for completion by the second

half of July. Escondida

Escondida operated with a reduced workforce to incorporate preventative measures in response to COVID-19 in the second

quarter. Despite this, mined copper production was 2% higher than the same quarter of 2019 due to record concentrator

throughput, which was offset by 6% lower grade and 3% lower amount of material stacked into the leaching pads. Oyu Tolgoi

Mined copper production from the open pit was 7% lower than the same quarter of 2019 primarily due to a scheduled maintenance

shutdown in the mill. Sales recovered in the second quarter with the easing of COVID-19 trucking restrictions within China and

improved border access. Mine development and production phasing have been successfully accelerated so that access to higher

copper and gold grades are now expected in the second half of 2020 instead of the originally planned first half of 2021.

Provisional pricing

At 30 June 2020, the Group had an estimated 230 million pounds of copper sales that were provisionally priced at 255 cents

per pound. The final price of these sales will be determined during the second half of 2020. This compares with 220 million

pounds of open shipments at 31 December 2019, provisionally priced at 277 cents per pound. Diamonds

At Argyle, carat production was 1% lower than the same period of 2019 as a result of an 11% reduction in recovered grade,

partially offset by higher tonnes mined and processed. Preparation continues for the safe cessation of Argyle operations before

the end of 2020 and closure activities commencing in 2021.

At Diavik, carats recovered in second quarter 2020 were 19% lower than the second quarter of 2019 due to lower processed

tonnes and lower grade in the underground.

We continue to execute our value over volume strategy to match market demand during a challenging period for the industry.

9

ENERGY AND MINERALS

Rio Tinto share of production (million tonnes) Q2

2020 vs Q2 2019

vs Q1 2020

H1 2020

vs H1 2019

Iron ore pellets and concentrate

IOC 2.8 +9 % +8 % 5.3 +6 %

Rio Tinto share of production (’000 tonnes) Q2

2020 vs Q2 2019

vs Q1 2020

H1 2020

vs H1 2019

Minerals

Borates - B2O3 content 132 -5 % +5 % 258 +2 %

Titanium dioxide slag 262 -13 % -10 % 555 -7 %

Rio Tinto share of production (’000 lbs) Q2

2020 vs Q2 2019

vs Q1 2020

H1 2020

vs H1 2019

Uranium

Energy Resources of Australia 718 +16 % +6 % 1,393 -1 %

Iron Ore Company of Canada (IOC)

Iron ore pellets and concentrate production was 9% higher than the second quarter of 2019 with focus on higher concentrator

feed (28% higher than the corresponding period). In the second quarter of 2019, production was adversely affected by a

flooding incident.

In the second quarter, we continued to focus on the optimisation of product mix (pellet and concentrate) to match market

demand.

Borates

Borates production was 5% below the corresponding period of 2019. Refinery operating rates continued to be below name

plate capacity during the quarter. We adjust refinery operating rates to match market demand for borates products. Market

demand is being adversely impacted by COVID-19 in a number of end-use segments. Iron and Titanium

Titanium dioxide feedstock production was 13% lower than same period of 2019, due to community disruptions that resulted in

a site wide shutdown at RBM in December 2019. Operations have resumed at RBM following COVID-19 restrictions. However,

we are managing the situation carefully in the challenging South African environment.

We have restarted production at the Rio Tinto Fer et Titane (RTFT) metal powder plant in Sorel-Tracy, Quebec. The restart

follows a temporary suspension of production that was implemented in the first quarter due to the slowdown in demand from

the automotive industry.

Uranium

ERA’s Ranger operation continued to process existing stockpiles uninterrupted during the second quarter, 16% higher than the

second quarter of 2019. We sold additional material from inventory to capitalise on improved market conditions.

10

EXPLORATION AND EVALUATION

Pre-tax and pre-divestment expenditure on exploration and evaluation charged to the profit and loss account in the first half of

2020 was $280 million, compared with $287 million in the first half of 2019. Approximately 44% of this expenditure was incurred

by central exploration, 41% by Copper & Diamonds, 10% by Energy & Minerals and the remainder by Iron Ore and Aluminium.

There were no significant divestments of central exploration properties in the second quarter of 2020. Exploration highlights

Rio Tinto has a strong portfolio of projects with activity in 15 countries across six commodities. Due to COVID-19, there have

been significant impacts on exploration activities in some jurisdictions. All projects have followed government requirements and

guidelines while focusing on protecting well-being and health of local and indigenous communities. The bulk of the exploration

expenditure in this quarter focused on copper in Australia, Brazil, Canada, Chile, Colombia, Kazakhstan, Mongolia, Peru,

Serbia, United States and Zambia, and diamonds projects in Canada. Mine-lease exploration continued at Rio Tinto managed

businesses including Pilbara Iron in Australia, and Diavik in Canada. At Winu, studies are ongoing and drilling has focused on

resource definition and brownfield exploration. At Falcon, processing of samples collected in 2020 is ongoing. A summary of

activity for the quarter is as follows:

Commodities Studies stage Advanced projects Greenfield/Brownfield programmes

Bauxite Amargosa, Brazil*; Sanxai, Laos* Cape York, Australia

Base Metals Copper/molybdenum: Resolution, US; Winu, Australia

La Granja, Peru Nickel: Tamarack, US (3rd party operated) Pribrezhniy, Kazakhstan

Copper Greenfield: Australia, Chile, China, Kazakhstan, Nicaragua, Peru, Serbia, US, Zambia, Brazil, Canada, Colombia, Finland Nickel Greenfield: Canada, Finland

Diamonds Falcon, Canada Greenfield: Canada Brownfield: Diavik, Canada

Minerals Lithium borates: Jadar, Serbia Heavy mineral sands: Mutamba, Mozambique (third party operated)

Iron Ore Pilbara, Australia Pilbara, Australia Brownfield: Pilbara, Australia *Limited activity during the quarter

11

FORWARD-LOOKING STATEMENT

This announcement includes "forward-looking statements" within the meaning of the Private Securities Litigation Reform Act of

1995. All statements other than statements of historical facts included in this announcement, including, without limitation, those

regarding Rio Tinto's financial position, business strategy, plans and objectives of management for future operations (including

development plans and objectives relating to Rio Tinto's products, production forecasts and reserve and resource positions and

any statements related to the ongoing impact of the COVID-19 pandemic), are forward-looking statements. The words "intend",

"aim", "project", "anticipate", "estimate", "plan", "believes", "expects", "may", "would", "should", "could", "will", "target", "set to",

"seek", "risk" or similar expressions, commonly identify such forward-looking statements.

Such forward-looking statements involve known and unknown risks, uncertainties and other factors which may cause the actual

results, performance or achievements of Rio Tinto, or industry results, to be materially different from any future results,

performance or achievements expressed or implied by such forward-looking statements. Such forward-looking statements are

based on numerous assumptions regarding Rio Tinto's present and future business strategies and the environment in which

Rio Tinto will operate in the future. Among the important factors that could cause Rio Tinto's actual results, performance or

achievements to differ materially from those in the forward-looking statements are levels of actual production during any period,

levels of demand and market prices, the ability to produce and transport products profitably, the impact of foreign currency

exchange rates on market prices and operating costs, operational problems, political uncertainty and economic conditions in

relevant areas of the world, the actions of competitors, activities by governmental authorities such as changes in taxation or

regulation, the risks and uncertainties associated with the ongoing impacts of COVID-19 or other pandemic and such other risk

factors identified in Rio Tinto's most recent Annual report and accounts in Australia and the United Kingdom and the most

recent Annual report on Form 20-F filed with the United States Securities and Exchange Commission (the "SEC") or Form 6-Ks

furnished to, or filed with, the SEC. The above list is not exhaustive. Forward-looking statements should, therefore, be

construed in light of such risk factors and undue reliance should not be placed on forward-looking statements, particularly in

light of the current economic climate and the significant volatility, uncertainty and disruption caused by the outbreak of COVID-

19. These forward-looking statements speak only as of the date of this announcement. Rio Tinto expressly disclaims any

obligation or undertaking (except as required by applicable law, the UK Listing Rules, the Disclosure Guidance and

Transparency Rules of the Financial Conduct Authority and the Listing Rules of the Australian Securities Exchange) to release

publicly any updates or revisions to any forward-looking statement contained herein to reflect any change in Rio Tinto's

expectations with regard thereto or any change in events, conditions or circumstances on which any such statement is based.

Nothing in this announcement should be interpreted to mean that future earnings per share of Rio Tinto plc or Rio Tinto Limited

will necessarily match or exceed its historical published earnings per share.

12

CONTACTS

[email protected]

riotinto.com

Follow @RioTinto on Twitter

Media Relations, United Kingdom

Illtud Harri

M +44 7920 503 600

David Outhwaite

T +44 20 7781 1623

M +44 7787 597 493

Media Relations, Americas

Matthew Klar

T +1 514 608 4429

Media Relations, Asia

Grant Donald

T +65 6679 9290

M +65 9722 6028

Media Relations, Australia

Jonathan Rose

T +61 3 9283 3088

M +61 447 028 913

Matt Chambers

T +61 3 9283 3087

M +61 433 525 739

Jesse Riseborough

T +61 8 6211 6013

M +61 436 653 412

Investor Relations, United Kingdom

Menno Sanderse

T +44 20 7781 1517

M +44 7825 195 178

David Ovington

T +44 20 7781 2051

M +44 7920 010 978

Clare Peever

M: +44 7788 967 877

Investor Relations, Australia

Natalie Worley

T +61 3 9283 3063

M +61 409 210 462

Amar Jambaa

T +61 3 9283 3627

M +61 472 865 948

Group Company Secretary

Steve Allen

Rio Tinto plc

6 St James’s Square

London SW1Y 4AD

United Kingdom

T +44 20 7781 2000

Registered in England

No. 719885

Joint Company Secretary

Tim Paine

Rio Tinto Limited

Level 7, 360 Collins Street

Melbourne 3000

Australia

T +61 3 9283 3333

Registered in Australia

ABN 96 004 458 404

This announcement is authorised for release to the market by Rio Tinto’s Group Company Secretary.

LEI: 213800YOEO5OQ72G2R82

Classification: 3.1 Additional regulated information required to be disclosed under the laws of a Member State

13

Rio Tinto production summary

Rio Tinto share of production

Quarter Half Year % change

2019

Q2 2020

Q1 2020

Q2 2019

H1 2020

H1 Q2 20

vs Q2 19

Q2 20 vs

Q1 20 H1 20

vs H1 19

Principal commodities

Alumina ('000 t) 1,878 2,010 1,990 3,886 4,000 +6 % -1 % +3 %

Aluminium ('000 t) 803 783 785 1,599 1,568 -2 % 0 % -2 %

Bauxite ('000 t) 13,407 13,813 14,560 26,171 28,373 +9 % +5 % +8 %

Borates ('000 t) 138 126 132 253 258 -5 % +5 % +2 %

Copper - mined ('000 t) 136.9 133.0 132.8 280.8 265.7 -3 % 0 % -5 %

Copper - refined ('000 t) 82.3 47.2 26.9 130.6 74.1 -67 % -43 % -43 %

Diamonds ('000 cts) 4,481 3,434 4,235 8,277 7,669 -5 % +23 % -7 %

Iron Ore ('000 t) 68,141 66,787 71,689 134,723 138,477 +5 % +7 % +3 %

Titanium dioxide slag ('000 t) 303 293 262 599 555 -13 % -10 % -7 %

Uranium ('000 lbs) 620 676 718 1,413 1,393 +16 % +6 % -1 %

Other Metals & Minerals

Gold - mined ('000 oz) 111.6 61.5 63.6 227.0 125.1 -43 % +3 % -45 %

Gold - refined ('000 oz) 52.9 44.8 30.1 94.6 74.9 -43 % -33 % -21 %

Molybdenum ('000 t) 2.6 5.1 3.9 4.4 8.9 +50 % -24 % +101 %

Salt ('000 t) 1,269 1,044 1,425 2,579 2,469 +12 % +37 % -4 %

Silver - mined ('000 oz) 1,403 1,027 1,077 2,883 2,104 -23 % +5 % -27 %

Silver - refined ('000 oz) 734 462 382 1,351 844 -48 % -17 % -38 %

Throughout this report, figures in italics indicate adjustments made since the figure was previously quoted on the equivalent

page or reported for the first time. Production figures are sometimes more precise than the rounded numbers shown, hence

small differences may result between the total of the quarter figures and the year to date figures.

14

Rio Tinto share of production

Rio Tinto

interest Q2

2019 Q3

2019 Q4

2019 Q1

2020 Q2

2020 H1

2019 H1

2020

ALUMINA Production ('000 tonnes)

Jonquière (Vaudreuil) 100 % 336 360 345 373 340 709 713 Jonquière (Vaudreuil) specialty Alumina plant

100 % 31 28 24 24 25 57 49 Queensland Alumina 80 % 668 669 716 713 711 1,378 1,424 São Luis (Alumar) 10 % 86 99 97 94 95 172 188 Yarwun 100 % 757 671 850 806 820 1,570 1,626

Rio Tinto total alumina production 1,878 1,826 2,032 2,010 1,990 3,886 4,000

ALUMINIUM Production ('000 tonnes)

Australia - Bell Bay 100 % 47 48 48 47 49 92 96 Australia - Boyne Island 59 % 75 75 74 75 75 147 150 Australia - Tomago 52 % 76 77 76 75 76 150 151 Canada - six wholly owned 100 % 400 399 383 375 370 800 744 Canada - Alouette (Sept-Îles) 40 % 60 61 62 61 62 118 123 Canada - Bécancour 25 % 4 4 7 18 26 8 44 Iceland - ISAL (Reykjavik) 100 % 52 36 43 45 44 105 89 New Zealand - Tiwai Point 79 % 69 70 69 67 65 140 131 Oman - Sohar 20 % 19 20 20 20 20 39 39

Rio Tinto total aluminium production 803 789 783 783 785 1,599 1,568

BAUXITE Production ('000 tonnes) (a)

Gove 100 % 2,957 2,968 3,273 2,876 3,186 5,960 6,062 Porto Trombetas 12 % 287 385 371 338 270 572 608 Sangaredi (b) 1,630 1,749 1,227 1,879 1,742 3,189 3,621 Weipa 100 % 8,533 8,695 10,267 8,720 9,362 16,450 18,082

Rio Tinto total bauxite production 13,407 13,796 15,137 13,813 14,560 26,171 28,373

(a) Mine production figures for metals refer to the total quantity of metal produced in concentrates, leach liquor or doré bullion irrespective of whether these products are

then refined onsite, except for the data for bauxite and iron ore which represent production of marketable quantities of ore plus concentrates and pellets.

(b) Rio Tinto has a 22.95% shareholding in the Sangaredi mine but benefits from 45.0% of production.

15

Rio Tinto share of production

Rio Tinto

interest Q2

2019 Q3

2019 Q4

2019 Q1

2020 Q2

2020 H1

2019 H1

2020

BORATES

Production ('000 tonnes B2O3 content)

Rio Tinto Borates - borates 100 % 138 138 128 126 132 253 258

COPPER

Mine production ('000 tonnes) (a)

Bingham Canyon 100 % 41.1 57.8 35.4 35.0 36.5 93.7 71.5

Escondida 30 % 82.7 90.5 92.3 86.2 84.0 158.7 170.2

Oyu Tolgoi (b) 34 % 13.1 9.5 11.0 11.8 12.2 28.5 24.0 Rio Tinto total mine production 136.9 157.9 138.7 133.0 132.8 280.8 265.7

Refined production ('000 tonnes)

Escondida 30 % 19.0 16.8 20.5 20.9 19.7 37.7 40.5

Rio Tinto Kennecott 100 % 63.3 40.3 51.4 26.4 7.2 92.8 33.6 Rio Tinto total refined production 82.3 57.1 71.9 47.2 26.9 130.6 74.1

(a) Mine production figures for metals refer to the total quantity of metal produced in concentrates, leach liquor or doré bullion irrespective of whether these products are

then refined onsite, except for the data for bauxite and iron ore which represent production of marketable quantities of ore plus concentrates and pellets.

(b) Rio Tinto owns a 33.52% indirect interest in Oyu Tolgoi through its 50.79% interest in Turquoise Hill Resources Ltd.

DIAMONDS

Production ('000 carats)

Argyle 100 % 3,292 3,558 3,363 2,578 3,271 6,079 5,849

Diavik 60 % 1,188 994 840 857 963 2,198 1,820 Rio Tinto total diamond production 4,481 4,551 4,203 3,434 4,235 8,277 7,669

GOLD

Mine production ('000 ounces) (a)

Bingham Canyon 100 % 65.1 64.6 52.0 41.9 40.2 118.0 82.1

Escondida 30 % 22.4 14.6 14.8 10.8 13.0 44.6 23.8

Oyu Tolgoi (b) 34 % 24.1 8.6 8.2 8.8 10.4 64.3 19.2 Rio Tinto total mine production 111.6 87.8 75.0 61.5 63.6 227.0 125.1

Refined production ('000 ounces) Rio Tinto Kennecott 100 % 52.9 60.8 63.3 44.8 30.1 94.6 74.9

(a) Mine production figures for metals refer to the total quantity of metal produced in concentrates, leach liquor or doré bullion irrespective of whether these products are

then refined onsite, except for the data for bauxite and iron ore which represent production of marketable quantities of ore plus concentrates and pellets.

(b) Rio Tinto owns a 33.52% indirect interest in Oyu Tolgoi through its 50.79% interest in Turquoise Hill Resources Ltd.

16

Rio Tinto share of production

Rio Tinto

interest Q2

2019 Q3

2019 Q4

2019 Q1

2020 Q2

2020 H1

2019 H1

2020

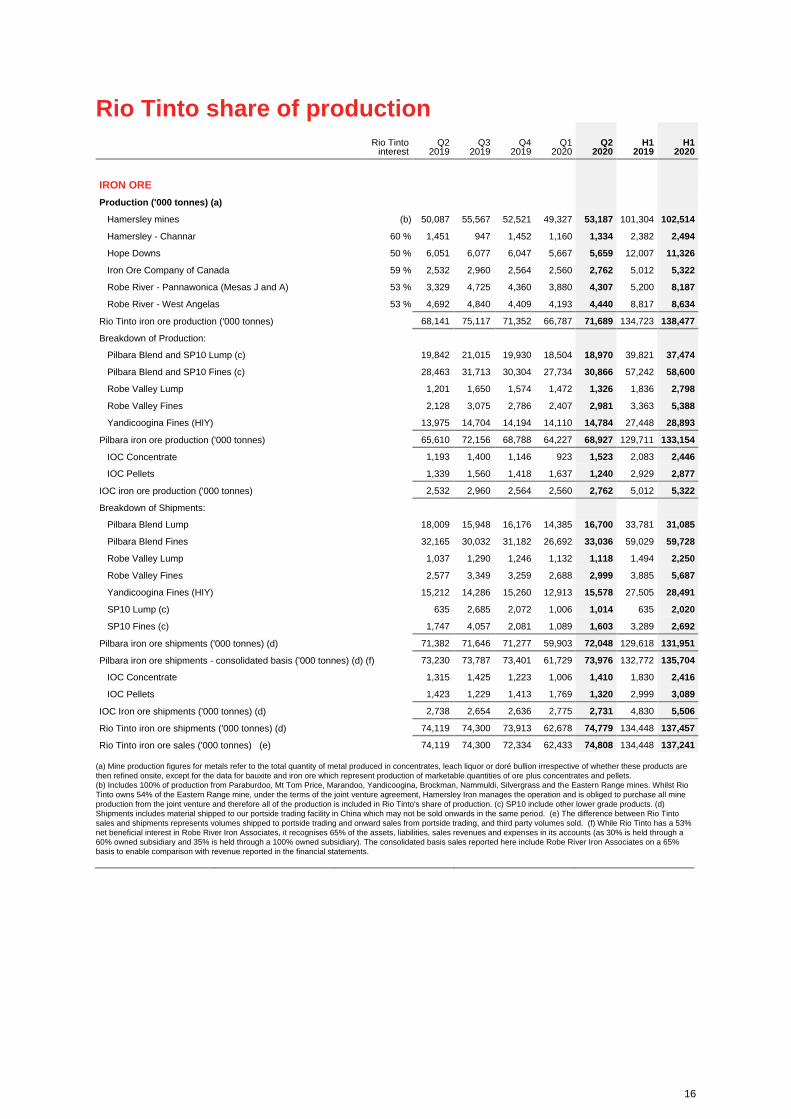
IRON ORE Production ('000 tonnes) (a)

Hamersley mines (b) 50,087 55,567 52,521 49,327 53,187 101,304 102,514 Hamersley - Channar 60 % 1,451 947 1,452 1,160 1,334 2,382 2,494 Hope Downs 50 % 6,051 6,077 6,047 5,667 5,659 12,007 11,326 Iron Ore Company of Canada 59 % 2,532 2,960 2,564 2,560 2,762 5,012 5,322 Robe River - Pannawonica (Mesas J and A) 53 % 3,329 4,725 4,360 3,880 4,307 5,200 8,187 Robe River - West Angelas 53 % 4,692 4,840 4,409 4,193 4,440 8,817 8,634

Rio Tinto iron ore production ('000 tonnes) 68,141 75,117 71,352 66,787 71,689 134,723 138,477 Breakdown of Production:

Pilbara Blend and SP10 Lump (c) 19,842 21,015 19,930 18,504 18,970 39,821 37,474 Pilbara Blend and SP10 Fines (c) 28,463 31,713 30,304 27,734 30,866 57,242 58,600 Robe Valley Lump 1,201 1,650 1,574 1,472 1,326 1,836 2,798 Robe Valley Fines 2,128 3,075 2,786 2,407 2,981 3,363 5,388 Yandicoogina Fines (HIY) 13,975 14,704 14,194 14,110 14,784 27,448 28,893

Pilbara iron ore production ('000 tonnes) 65,610 72,156 68,788 64,227 68,927 129,711 133,154 IOC Concentrate 1,193 1,400 1,146 923 1,523 2,083 2,446 IOC Pellets 1,339 1,560 1,418 1,637 1,240 2,929 2,877

IOC iron ore production ('000 tonnes) 2,532 2,960 2,564 2,560 2,762 5,012 5,322 Breakdown of Shipments:

Pilbara Blend Lump 18,009 15,948 16,176 14,385 16,700 33,781 31,085 Pilbara Blend Fines 32,165 30,032 31,182 26,692 33,036 59,029 59,728 Robe Valley Lump 1,037 1,290 1,246 1,132 1,118 1,494 2,250 Robe Valley Fines 2,577 3,349 3,259 2,688 2,999 3,885 5,687 Yandicoogina Fines (HIY) 15,212 14,286 15,260 12,913 15,578 27,505 28,491 SP10 Lump (c) 635 2,685 2,072 1,006 1,014 635 2,020 SP10 Fines (c) 1,747 4,057 2,081 1,089 1,603 3,289 2,692

Pilbara iron ore shipments ('000 tonnes) (d) 71,382 71,646 71,277 59,903 72,048 129,618 131,951 Pilbara iron ore shipments - consolidated basis ('000 tonnes) (d) (f) 73,230 73,787 73,401 61,729 73,976 132,772 135,704

IOC Concentrate 1,315 1,425 1,223 1,006 1,410 1,830 2,416 IOC Pellets 1,423 1,229 1,413 1,769 1,320 2,999 3,089

IOC Iron ore shipments ('000 tonnes) (d) 2,738 2,654 2,636 2,775 2,731 4,830 5,506 Rio Tinto iron ore shipments ('000 tonnes) (d) 74,119 74,300 73,913 62,678 74,779 134,448 137,457 Rio Tinto iron ore sales ('000 tonnes) (e) 74,119 74,300 72,334 62,433 74,808 134,448 137,241

(a) Mine production figures for metals refer to the total quantity of metal produced in concentrates, leach liquor or doré bullion irrespective of whether these products are

then refined onsite, except for the data for bauxite and iron ore which represent production of marketable quantities of ore plus concentrates and pellets.

(b) Includes 100% of production from Paraburdoo, Mt Tom Price, Marandoo, Yandicoogina, Brockman, Nammuldi, Silvergrass and the Eastern Range mines. Whilst Rio

Tinto owns 54% of the Eastern Range mine, under the terms of the joint venture agreement, Hamersley Iron manages the operation and is obliged to purchase all mine

production from the joint venture and therefore all of the production is included in Rio Tinto's share of production. (c) SP10 include other lower grade products. (d)

Shipments includes material shipped to our portside trading facility in China which may not be sold onwards in the same period. (e) The difference between Rio Tinto

sales and shipments represents volumes shipped to portside trading and onward sales from portside trading, and third party volumes sold. (f) While Rio Tinto has a 53%

net beneficial interest in Robe River Iron Associates, it recognises 65% of the assets, liabilities, sales revenues and expenses in its accounts (as 30% is held through a

60% owned subsidiary and 35% is held through a 100% owned subsidiary). The consolidated basis sales reported here include Robe River Iron Associates on a 65%

basis to enable comparison with revenue reported in the financial statements.

17

Rio Tinto share of production

Rio Tinto

interest Q2

2019 Q3

2019 Q4

2019 Q1

2020 Q2

2020 H1

2019 H1

2020

MOLYBDENUM

Mine production ('000 tonnes) (a)

Bingham Canyon 100 % 2.6 2.1 4.7 5.1 3.9 4.4 8.9

(a) Mine production figures for metals refer to the total quantity of metal produced in concentrates, leach liquor or doré bullion irrespective of whether these products are

then refined onsite, except for the data for bauxite and iron ore which represent production of marketable quantities of ore plus concentrates and pellets.

SALT

Production ('000 tonnes)

Dampier Salt 68 % 1,269 1,392 1,450 1,044 1,425 2,579 2,469

SILVER

Mine production ('000 ounces) (a)

Bingham Canyon 100 % 700 768 605 538 526 1,442 1,064

Escondida 30 % 622 488 539 417 480 1,279 897

Oyu Tolgoi (b) 34 % 80 64 64 72 71 163 143

Rio Tinto total mine production 1,403 1,320 1,209 1,027 1,077 2,883 2,104

Refined production ('000 ounces)

Rio Tinto Kennecott 100 % 734 664 839 462 382 1,351 844 (a) Mine production figures for metals refer to the total quantity of metal produced in concentrates, leach liquor or doré bullion irrespective of whether these products are

then refined onsite, except for the data for bauxite and iron ore which represent production of marketable quantities of ore plus concentrates and pellets.

(b) Rio Tinto owns a 33.52% indirect interest in Oyu Tolgoi through its 50.79% interest in Turquoise Hill Resources Ltd.

TITANIUM DIOXIDE SLAG

Production ('000 tonnes) Rio Tinto Iron & Titanium (a) 100 % 303 321 286 293 262 599 555

(a) Quantities comprise 100% of Rio Tinto Fer et Titane and Rio Tinto's 74% interest in Richards Bay Minerals (RBM).

URANIUM

Production ('000 lbs U3O8) (a)

Energy Resources of Australia 86 % 620 585 642 676 718 1,413 1,393 (a) ERA production data are drummed U3O8.

On 25 February 2020, Rio Tinto’s ownership interest in ERA increased from 68.39% to 86.33%, following completion of its offer to ensure ERA has the funds it needs to

meet its current rehabilitation obligations. Production is reported including this change from 1 March 2020.

Rio Tinto's interest in the Rössing operations were sold in 2019. No data for these operations are included in the Share of production table.

Production figures are sometimes more precise than the rounded numbers shown, hence small differences may result between the total of the

quarter figures and the year to date figures.

The Rio Tinto percentage shown above is at 30 June 2020.

18

Rio Tinto operational data

Rio Tinto interest

Q2 2019

Q3 2019

Q4 2019

Q1 2020

Q2 2020

H1 2019

H1 2020

ALUMINA Smelter Grade Alumina - Aluminium Group Alumina production ('000 tonnes) Australia

Queensland Alumina Refinery - Queensland 80.0 % 834 836 895 891 889 1,723 1,780 Yarwun refinery - Queensland 100.0 % 757 671 850 806 820 1,570 1,626

Brazil São Luis (Alumar) refinery 10.0 % 864 989 966 936 945 1,723 1,882

Canada Jonquière (Vaudreuil) refinery - Quebec (a) 100.0 % 336 360 345 373 340 709 713

(a) Jonquière’s (Vaudreuil’s) production shows smelter grade alumina only and excludes hydrate produced and used for specialty alumina.

Speciality Alumina - Aluminium Group Speciality alumina production ('000 tonnes) Canada

Jonquière (Vaudreuil) plant – Quebec 100.0 % 31 28 24 24 25 57 49

Rio Tinto percentage interest shown above is at 30 June 2020. The data represent full production and sales on a 100%

basis unless otherwise stated.

19

Rio Tinto operational data

Rio Tinto

interest Q2

2019 Q3

2019 Q4

2019 Q1

2020 Q2

2020 H1

2019 H1

2020

ALUMINIUM

Primary Aluminium Primary aluminium production ('000 tonnes) Australia

Bell Bay smelter - Tasmania 100.0 % 47 48 48 47 49 92 96

Boyne Island smelter - Queensland 59.4 % 126 125 125 126 126 248 252

Tomago smelter - New South Wales 51.6 % 147 149 148 145 148 292 293

Canada

Alma smelter - Quebec 100.0 % 118 119 119 118 118 233 236

Alouette (Sept-Îles) smelter - Quebec 40.0 % 150 153 155 153 155 294 308

Arvida smelter - Quebec 100.0 % 44 45 44 44 42 86 86

Arvida AP60 smelter - Quebec 100.0 % 15 15 15 15 15 29 30

Bécancour smelter - Quebec 25.1 % 16 16 28 72 102 33 174

Grande-Baie smelter - Quebec 100.0 % 58 59 59 58 55 116 113

Kitimat smelter - British Columbia 100.0 % 102 96 81 76 78 208 154

Laterrière smelter - Quebec 100.0 % 64 65 65 64 62 128 125

Iceland

ISAL (Reykjavik) smelter 100.0 % 52 36 43 45 44 105 89

New Zealand

Tiwai Point smelter 79.4 % 87 88 87 84 82 176 165

Oman

Sohar smelter 20.0 % 97 98 98 99 99 194 197

Rio Tinto percentage interest shown above is at 30 June 2020. The data represent full production and sales on a 100%

basis unless otherwise stated.

20

Rio Tinto operational data

Rio Tinto

interest Q2

2019 Q3

2019 Q4

2019 Q1

2020 Q2

2020 H1

2019 H1

2020

BAUXITE Bauxite production ('000 tonnes) Australia

Gove mine - Northern Territory 100.0 % 2,957 2,968 3,273 2,876 3,186 5,960 6,062 Weipa mine - Queensland 100.0 % 8,533 8,695 10,267 8,720 9,362 16,450 18,082

Brazil Porto Trombetas (MRN) mine 12.0 % 2,393 3,205 3,090 2,814 2,251 4,765 5,065

Guinea Sangaredi mine (a) 23.0 % 3,623 3,887 2,727 4,175 3,871 7,087 8,046

Rio Tinto share of bauxite shipments Share of total bauxite shipments ('000 tonnes) 13,122 13,912 14,849 13,567 14,668 25,847 28,235 Share of third party bauxite shipments ('000 tonnes) 9,477 10,361 10,968 9,469 10,721 18,318 20,190

(a) Rio Tinto has a 22.95% shareholding in the Sangaredi mine but benefits from 45.0% of production.

Rio Tinto

interest Q2

2019 Q3

2019 Q4

2019 Q1

2020 Q2

2020 H1

2019 H1

2020

BORATES

Rio Tinto Borates - borates 100.0 %

US

Borates ('000 tonnes) (a) 138 138 128 126 132 253 258

(a) Production is expressed as B2O3 content.

Rio Tinto

interest Q2

2019 Q3

2019 Q4

2019 Q1

2020 Q2

2020 H1

2019 H1

2020

COPPER & GOLD Escondida 30.0 % Chile Sulphide ore to concentrator ('000 tonnes) 32,519 33,956 33,659 33,440 34,755 64,546 68,194

Average copper grade (%) 0.86 0.86 0.87 0.82 0.81 0.84 0.81 Mill production (metals in concentrates):

Contained copper ('000 tonnes) 230.9 245.0 246.1 230.0 236.8 447.8 466.8 Contained gold ('000 ounces) 74.7 48.8 49.2 36.0 43.4 148.7 79.4 Contained silver ('000 ounces) 2,074 1,626 1,798 1,390 1,599 4,263 2,989

Recoverable copper in ore stacked for leaching ('000 tonnes) (a) 44.7 56.8 61.7 57.2 43.3 81.2 100.5 Refined production from leach plants:

Copper cathode production ('000 tonnes) 63.5 55.9 68.4 69.6 65.5 125.8 135.2 (a) The calculation of copper in material mined for leaching is based on ore stacked at the leach pad.

Rio Tinto percentage interest shown above is at 30 June 2020. The data represent full production and sales on a 100%

basis unless otherwise stated.

21

Rio Tinto operational data

Rio Tinto

interest Q2

2019 Q3

2019 Q4

2019 Q1

2020 Q2

2020 H1

2019 H1

2020

COPPER & GOLD (continued)

Rio Tinto Kennecott

Bingham Canyon mine 100.0 %

Utah, US

Ore treated ('000 tonnes) 10,123 10,084 11,141 10,315 10,083 20,808 20,398

Average ore grade:

Copper (%) 0.46 0.64 0.36 0.37 0.41 0.50 0.39

Gold (g/t) 0.33 0.30 0.23 0.22 0.23 0.29 0.23

Silver (g/t) 2.84 2.74 2.09 2.16 2.14 2.80 2.15

Molybdenum (%) 0.039 0.039 0.061 0.058 0.056 0.035 0.057 Copper concentrates produced ('000 tonnes) 161 207 156 148 135 368 283

Average concentrate grade (% Cu) 25.5 27.8 22.6 23.7 26.6 25.4 25.1 Production of metals in copper concentrates:

Copper ('000 tonnes) (a) 41.1 57.8 35.4 35.0 36.5 93.7 71.5

Gold ('000 ounces) 65.1 64.6 52.0 41.9 40.2 118.0 82.1

Silver ('000 ounces) 700 768 605 538 526 1,442 1,064 Molybdenum concentrates produced ('000 tonnes): 5.0 4.3 9.4 10.4 7.8 8.7 18.2

Molybdenum in concentrates ('000 tonnes) 2.6 2.1 4.7 5.1 3.9 4.4 8.9

Kennecott smelter & refinery 100.0 % Copper concentrates smelted ('000 tonnes) 207 160 216 161 51 411 212 Copper anodes produced ('000 tonnes) (b) 60.3 39.3 53.7 24.0 (2.1) 93.6 21.9 Production of refined metal:

Copper ('000 tonnes) 63.3 40.3 51.4 26.4 7.2 92.8 33.6

Gold ('000 ounces) (c) 52.9 60.8 63.3 44.8 30.1 94.6 74.9

Silver ('000 ounces) (c) 734 664 839 462 382 1,351 844

(a) Includes a small amount of copper in precipitates. (b) New metal excluding recycled material. (c) Includes gold and silver in intermediate products.

Rio Tinto percentage interest shown above is at 30 June 2020. The data represent full production and sales on a 100%

basis unless otherwise stated.

22

Rio Tinto operational data

Rio Tinto

interest Q2

2019 Q3

2019 Q4

2019 Q1

2020 Q2

2020 H1

2019 H1

2020

COPPER & GOLD (continued)

Turquoise Hill Resources

Oyu Tolgoi mine (a) 33.5 %

Mongolia

Ore Treated ('000 tonnes) 10,394 10,040 11,088 10,889 9,645 19,649 20,534

Average mill head grades:

Copper (%) 0.46 0.37 0.42 0.42 0.47 0.51 0.45

Gold (g/t) 0.31 0.14 0.15 0.15 0.19 0.44 0.17 Silver (g/t) 1.20 1.03 1.06 1.14 1.22 1.23 1.18

Copper concentrates produced ('000 tonnes) 180.6 131.3 152.6 164.5 169.9 390.7 334.4 Average concentrate grade (% Cu) 21.7 21.7 21.6 21.4 21.5 21.8 21.4

Production of metals in concentrates:

Copper in concentrates ('000 tonnes) 39.2 28.4 32.9 35.2 36.5 85.0 71.7

Gold in concentrates ('000 ounces) 71.8 25.6 24.3 26.2 31.1 191.9 57.3

Silver in concentrates ('000 ounces) 239 191 190 214 212 486 426

Sales of metals in concentrates:

Copper in concentrates ('000 tonnes) 46.6 32.5 32.3 25.8 39.7 85.1 65.5

Gold in concentrates ('000 ounces) 115.6 35.4 24.7 19.7 30.8 213.5 50.5

Silver in concentrates ('000 ounces) 245 207 244 146 220 445 365

(a) Rio Tinto owns a 33.52% indirect interest in Oyu Tolgoi through its 50.79% interest in Turquoise Hill Resources.

Rio Tinto

interest Q2

2019 Q3

2019 Q4

2019 Q1

2020 Q2

2020 H1

2019 H1

2020

DIAMONDS

Argyle Diamonds 100.0 %

Western Australia

AK1 ore processed ('000 tonnes) 1,427 1,716 1,977 1,322 1,571 2,674 2,893

AK1 diamonds produced ('000 carats) 3,292 3,558 3,363 2,578 3,271 6,079 5,849

Diavik Diamonds 60.0 %

Northwest Territories, Canada

Ore processed ('000 tonnes) 671 628 516 571 626 1,291 1,197

Diamonds recovered ('000 carats) 1,980 1,656 1,400 1,428 1,606 3,663 3,033

Rio Tinto percentage interest shown above is at 30 June 2020. The data represent full production and sales on a 100%

basis unless otherwise stated.

23

Rio Tinto operational data

Rio Tinto

interest Q2

2019 Q3

2019 Q4

2019 Q1

2020 Q2

2020 H1

2019 H1

2020

IRON ORE Rio Tinto Iron Ore Western Australia Pilbara Operations Saleable iron ore production ('000 tonnes)

Hamersley mines (a) 50,087 55,567 52,521 49,327 53,187 101,304 102,514 Hamersley - Channar 60.0 % 2,419 1,579 2,420 1,934 2,223 3,971 4,157 Hope Downs 50.0 % 12,101 12,155 12,095 11,334 11,318 24,015 22,652 Robe River - Pannawonica (Mesas J and A)

53.0 % 6,282 8,914 8,225 7,320 8,126 9,811 15,446 Robe River - West Angelas 53.0 % 8,853 9,133 8,318 7,912 8,378 16,635 16,290

Total production ('000 tonnes) 79,741 87,347 83,579 77,827 83,232 155,736 161,059 Breakdown of total production:

Pilbara Blend and SP10 Lump (b) 24,291 25,434 24,326 22,592 23,222 48,359 45,813 Pilbara Blend and SP10 Fines (b) 35,194 38,296 36,833 33,806 37,100 70,118 70,906 Robe Valley Lump 2,266 3,113 2,969 2,778 2,502 3,465 5,279 Robe Valley Fines 4,015 5,802 5,256 4,542 5,625 6,346 10,167 Yandicoogina Fines (HIY) 13,975 14,704 14,194 14,110 14,784 27,448 28,893

Breakdown of total shipments: Pilbara Blend Lump 21,653 19,329 19,680 17,506 20,339 40,621 37,844 Pilbara Blend Fines 39,358 36,947 39,186 33,197 40,379 72,374 73,576 Robe Valley Lump 1,957 2,433 2,350 2,135 2,110 2,820 4,245 Robe Valley Fines 4,862 6,318 6,149 5,071 5,659 7,330 10,730 Yandicoogina Fines (HIY) 15,212 14,286 15,260 12,913 15,578 27,505 28,491 SP10 Lump (b) 635 2,685 2,072 1,006 1,014 635 2,020 SP10 Fines (b) 1,747 4,057 2,081 1,089 1,603 3,289 2,692

Total shipments ('000 tonnes) (c) 85,423 86,055 86,779 72,916 86,681 154,573 159,598

Rio Tinto

interest Q2

2019 Q3

2019 Q4

2019 Q1

2020 Q2

2020 H1

2019 H1

2020

Iron Ore Company of Canada 58.7 % Newfoundland & Labrador and Quebec in Canada Saleable iron ore production:

Concentrates ('000 tonnes) 2,031 2,384 1,951 1,572 2,593 3,547 4,165 Pellets ('000 tonnes) 2,280 2,657 2,415 2,788 2,112 4,989 4,899

IOC Total production ('000 tonnes) 4,311 5,041 4,366 4,360 4,704 8,536 9,064 Shipments:

Concentrates ('000 tonnes) 2,239 2,427 2,083 1,713 2,402 3,117 4,115 Pellets ('000 tonnes) 2,424 2,093 2,406 3,013 2,248 5,108 5,261

IOC Total Shipments ('000 tonnes) (c) 4,663 4,520 4,490 4,726 4,650 8,225 9,376 Global Iron Ore Totals Iron Ore Production ('000 tonnes) 84,052 92,389 87,945 82,187 87,936 164,272 170,123 Iron Ore Shipments ('000 tonnes) 90,085 90,576 91,269 77,642 91,332 162,798 168,974 Iron Ore Sales ('000 tonnes) (d) 90,085 90,576 89,690 77,397 91,361 162,798 168,758

(a) Includes 100% of production from Paraburdoo, Mt Tom Price, Marandoo, Yandicoogina, Brockman, Nammuldi, Silvergrass and the Eastern Range mines. Whilst Rio

Tinto owns 54% of the Eastern Range mine, under the terms of the joint venture agreement, Hamersley Iron manages the operation and is obliged to purchase all mine

production from the joint venture and therefore all of the production is included in Rio Tinto's share of production. (b) SP10 include other lower grade products. (c)

Shipments includes material shipped to our portside trading facility in China which may not be sold onwards in the same period. (d) Include Pilbara and IOC sales

adjusted for portside trading movements and third party volumes sold.

Rio Tinto percentage interest shown above is at 30 June 2020. The data represent full production and sales on a 100%

basis unless otherwise stated.

24

Rio Tinto operational data

Rio Tinto

interest Q2

2019 Q3

2019 Q4

2019 Q1

2020 Q2

2020 H1

2019 H1

2020

SALT

Dampier Salt 68.4 %

Western Australia

Salt production ('000 tonnes) 1,856 2,036 2,121 1,527 2,085 3,773 3,612

TITANIUM DIOXIDE SLAG

Rio Tinto Iron & Titanium 100.0 %

Canada and South Africa

(Rio Tinto share) (a)

Titanium dioxide slag ('000 tonnes) 303 321 286 293 262 599 555

(a) Quantities comprise 100% of Rio Tinto Fer et Titane and Rio Tinto's 74% interest in Richards Bay Minerals' production. Ilmenite mined in Madagascar is being

processed in Canada.

URANIUM

Energy Resources of Australia Ltd

Ranger mine (a) 86.3 %

Northern Territory, Australia

U3O8 Production ('000 lbs) 906 855 939 928 831 2,066 1,760

(a) ERA production data are drummed U3O8.

On 25 February 2020, Rio Tinto’s ownership interest in ERA increased from 68.39% to 86.33%, following completion of its offer to ensure ERA has the funds it needs to

meet its current rehabilitation obligations. Production is reported including this change from 1 March 2020.

Rössing Uranium Ltd (a) (b) 0 %

Namibia

U3O8 Production ('000 lbs) 1,665 247 — — — 2,833 —

(a) Rössing production data are drummed U3O8.

(b) On 16 July 2019, Rio Tinto completed the sale of its entire 68.62% interest in the Rossing mine in Namibia to China National Uranium Corporation Limited. Production

is reported up to the date of completion.

Rio Tinto percentage interest shown above is at 30 June 2020. The data represent full production and sales on a 100%

basis unless otherwise stated.


Recommended