91
NOURISH PROJECT BASELINE SURVEY REPORT Cooperative Agreement No: AID-442-A-14-00006 Prepared by Save the Children June 2016 Photo by Igor Dashevskiy

NOURISH PROJECT
BASELINE SURVEY REPORT Cooperative Agreement No: AID-442-A-14-00006
Prepared by Save the Children June 2016
Ph
oto
by
Igo
r D
ash
evsk
iy

NOURISH Project Baseline Survey Report i
June 2016
NOURISH Project
Save the Children
No. 5, Street 242, Sangkat Chaktomuk
Daun Penh, Phnom Penh, Cambodia
Disclaimer: This document is made possible by the generous support of the American people through the United States
Agency for International Development (USAID) under Cooperative Agreement No. AID-442-A-14-00006. The
contents are the responsibility of Save the Children and do not necessarily reflect the views of USAID or the United
States Government.
Led by Save the Children, NOURISH is implemented in Cambodia in partnership with five local and international
partners: Operations Enfants du Cambodge, Partners in Compassion, SNV, The Manoff Group, and Wathnakpheap.

NOURISH Project Baseline Survey Report ii
EXECUTIVE SUMMARY
Background: This document reports the findings of the United States Agency for International
Development (USAID) and United States Presidential Initiative Feed the Future (FTF)-supported NOURISH
Project cross-sectional baseline. The NOURISH Project seeks to reduce the proportion of children in
Cambodia who are stunted and to begin to break the intergenerational malnutrition cycle and halt
productivity losses. NOURISH works to accelerate stunting reduction by focusing directly on the causal
factors of chronic malnutrition specific to Cambodia: lack of access to diverse and quality food, lack of
adequate feeding and care practices and unsanitary environments.
Survey Design and Methodology: The baseline captures data on the nutritional status of women and
children and behaviors related to the three pillars of the project’s approach to integrated nutrition: health,
water, sanitation and hygiene (WASH) and agriculture. The sampling frame was women of reproductive age
and caregivers of children under five years in the NOURISH Project area. Results will be compared to an
endline survey conducted toward the end of the project to assess NOURISH outcomes and impact.
The survey received approval from the National Ethical Committee for Health Research in Cambodia and
the Save the Children Ethical Review Board. All procedures followed ethical standards to ensure that
participation was informed and voluntary and maintained confidentiality at all stages. Selected through a
competitive bid process, the Royal University of Agriculture (RUA) of Cambodia collected the baseline data
in November 2015.
The cross-sectional survey sampled respondents from 90 villages across the NOURISH Project target area.
The survey used a multi-stage cluster methodology using communes and villages: 30 communes were
randomly selected from the three provinces, proportionate to population size. From these communes, 90
villages were randomly selected again based on the population distribution. Data were sampled to represent
the full project area and are not for province-specific disaggregation. Respondents were randomly selected
from household lists. The sample size was calculated for 95% confidence intervals on key variables. The
sample of 1,347 women included 16.6% women of reproductive age (15-49 years) (n=223), 26.6% pregnant
women (n=358) and 56.9% primary caregivers of children under 59 months (n=766). To capture exclusive
breastfeeding, the survey purposely oversampled children under six months of age. As a result,
anthropometric data of children 0-59 months were weighted to reflect the normal distribution of ages in the
population of children under five years.
Data collection tools utilized validated Cambodia Demographic and Health Survey (CDHS) questions and
Feed the Future guidance, combined into the following modules:
Women of Reproductive Age
Questionnaire Modules
Caregiver Questionnaire
Modules
Demographic characteristics
Maternal health
Anthropometry (non-pregnant women only)
Anemia
Water, hygiene and sanitation (WASH)
Homestead agriculture
Demographic characteristics
Maternal health
Anthropometry of children 0- 59 mos.
Anemia of children 6-59 mos.
Child care
Infant and Young Child feeding
WASH
Homestead agriculture
Data were entered and analyzed in SPSS except anthropometric data on weights and heights.
Anthropometric data were entered and analyzed in WHO’s Anthro software and then exported into SPSS
23.0 for combined analysis1. Twenty percent of questionnaires were re-entered to check data entry
accuracy.
1 http://www.who.int/nutgrowthdb/software/en/

NOURISH Project Baseline Survey Report iii
Baseline Survey Summary Results:
Impact Indicators to Measure Nutritional Status and Well-being of Women and Children
in Rural NOURISH-supported Communities at Baseline:
Prevalence of anemia among non-pregnant women of reproductive age and
pregnant women
41.5%; 52.4%
Prevalence of anemia among children 6-59 months 59.4%
Prevalence of stunted children under 5 years of age 34.3%
Prevalence of underweight children under 5 years of age 16.9%
Prevalence of wasted children under 5 years of age 8.5%
Prevalence of underweight women 14.8%
Outcome Indicators to Measure Practice of Key Nutrition Behaviors and Timely
Realization of Child Development Milestones at Baseline:
Women’s Dietary Diversity: Mean number of food groups consumed 4.67
Prevalence of exclusive breastfeeding of children under 6 months 77.8%
Prevalence of children 6-23 months receiving a minimum acceptable diet 25.5%
% parents/caregivers of children 0-23 months providing age-appropriate
stimulation of children according to child care and development standards
62.6%
% of children age 9-11 months who received enriched solid, semi-solid, or
soft foods with frequency in the last 24 hours
46.3%
Outcome Indicators to Measure Use of Improved Sanitation Facilities and Practice of Key
Water and Hygiene Behaviors at Baseline:
% of households (of women of reproductive age and children under 5) in
the target area using an improved latrine
37.0%
% of households (of women of reproductive age and children under 5) in
the target area practicing correct use of recommended household water
treatment technologies
43.4% [49.1% with bottled water]
% of households (of women of reproductive age and children under 5) with
soap and water at a hand washing station used by family members
63.3%
% of caregivers of children under 2 years disposing of infant stool
appropriately
57.1%

NOURISH Project Baseline Survey Report iv
ACKNOWLEDGEMENTS The baseline survey design, analysis and reporting was led by Math Srales, Monitoring and Evaluation (M&E)
Specialist of NOURISH/Save the Children with support from Lisa Sherburne, NOURISH/Save the Children
Community Nutrition Advisor. Special words of appreciation go to the Royal University of Agriculture
(RUA) contracted by Save the Children to conduct the baseline survey, led by Dr. Men Sarom, Director of
Research for RUA.
The NOURISH baseline survey required the coordinated efforts of many people. The survey team extends
its appreciation to all those who were involved in the survey including:
Joy Del Rosso, Save the Children US Nutrition Advisor for technical guidance on the design and analysis.
Larry Dershem, Save the Children US M&E Advisor for technical guidance and input into sampling,
comments on questionnaire drafts, valuable comments on this report and steadfast support.
Ly Samdy, NOURISH/Save the Children Database Assistant who supervised field data collection and
supported data cleaning and entry.
Jenni Lillingston, SNV M&E Advisor for supervising data analysis of WASH indicators.
Khaim Sophornn, NOURISH/SNV WASH Advisor for training data collectors on WASH indicators.
We express great appreciation to RUA team leaders, interviewers, data entry and management team for
actively participating in several weeks of training and survey revisions, facilitating evaluation discussions with
local leaders, coordinating administrative and logistical aspects of the survey fieldwork and diligently entering
and cleaning all of the data.
Our thanks are also extended to NOURISH finance staff and provincial teams for strong support to arrange
for and support data collection, organize logistics and many other aspects of the survey.
We also thank Provincial Departments of Health and Provincial Departments of Rural Development,
Operational Districts, Village Chiefs and Village Health Support Groups (VHSG) for supporting the survey
planning and implementation.
Last but certainly not least, to the women who graciously gave of their time, knowledge, and energy by
participating in the survey, we thank you. Without this participation and commitment to well-nourished
children, the baseline survey would not have been possible.
Inna Sacci
NOURISH Chief of Party
Save the Children

NOURISH Project Baseline Survey Report v
ACRONYMS ANC Antenatal Care
BFCI Baby Friendly Community Initiative
BMI Body Mass Index
BSC Business Service Center
CARD Council for Agricultural and Rural Development
CCT Conditional Cash Transfer
CCWC Commune Committee for Women and Children
CDB Commune Database
CDHS Cambodia Demographic and Health Survey
CLTS Community Led Total Sanitation
ECCD Early Childhood Care and Development
FTF Feed the Future
GMP Growth Monitoring and Promotion
HEF Health Equity Fund
IDA Iron Deficiency Anemia
IE Impact Evaluation
IYCF Infant and Young Child Feeding
JMP Joint Monitoring Programme for Water Supply and Sanitation
M&E Monitoring and Evaluation
MAFF Ministry of Agriculture, Forestry and Fisheries
MOH Ministry of Health
MRD Ministry of Rural Development
NECHR National Ethics Committee for Health Research
NNP National Nutrition Program
OD Operational District
ODF Open Defecation Free
PDA Provincial Department of Agriculture
PDRD Provincial Department of Rural Development
PHD Provincial Health Department
RGC Royal Government of Cambodia
RUA Royal University of Agriculture
SAM Severe Acute Malnutrition
SBCC Social and Behavior Change Communication
SD Standard Deviation
SME Small and Medium Enterprises

NOURISH Project Baseline Survey Report vi
UNICEF United Nation’s Children’s Fund
USAID United States Agency for International Development
VDC Village Development Committee
VHSG Village Health Support Group
VIP Ventilated Improved Pit latrine
WASH Water, Sanitation and Hygiene
WHO World Health Organization
WRA Women of Reproductive Age
ZOI Zone of Influence

NOURISH Project Baseline Survey Report vii
TABLE OF CONTENTS
EXECUTIVE SUMMARY ........................................................................................................................................ ii
ACKNOWLEDGEMENTS ................................................................................................................................... iv
ACRONYMS ............................................................................................................................................................ v
LIST OF FIGURES AND TABLES ..................................................................................................................... viii
INTRODUCTION .................................................................................................................................................. 1
Nutrition Situation in Cambodia ....................................................................................................................................... 1
Overview of the NOURISH Project ................................................................................................................................ 3
Results Framework and Indicators ................................................................................................................................... 5
METHODOLOGY .................................................................................................................................................. 5
Sampling .................................................................................................................................................................................. 5
Data Collection and Analysis ............................................................................................................................................. 7
Ethical Considerations ......................................................................................................................................................... 8
Limitations .............................................................................................................................................................................. 8
FINDINGS ................................................................................................................................................................. 9
Socio-Demographic Characteristics ................................................................................................................................. 9
Health and Nutrition ..................................................................................................................... 11
Maternal Health and Nutrition ................................................................................................................................... 11
Child Health and Nutrition .......................................................................................................................................... 15
Infant and Young Child Feeding .................................................................................................................................. 18
Child Care and Development ..................................................................................................................................... 22
Water, Sanitation and Hygiene (WASH) ................................................................................... 23
Drinking Water Treatment ......................................................................................................................................... 23
Sanitation .......................................................................................................................................................................... 24
Hygiene: Handwashing .................................................................................................................................................. 24
Hygiene: Household Environment of Caregivers ................................................................................................... 24
Agriculture ..................................................................................................................................... 25
CONCLUSIONS ................................................................................................................................................... 27
ANNEX I: Data Collection Protocol ................................................................................................................ 31
ANNEX II: Data Tables ........................................................................................................................................ 35
Demographics ...................................................................................................................................................................... 35
Women’s Demographic Tables .................................................................................................................................. 35
Children’s Demographic Tables ................................................................................................................................. 38
Maternal Health and Nutrition Tables ...................................................................................................................... 41
Child Health and Nutrition Tables ............................................................................................................................ 44
Infant and Young Child Feeding Tables ..................................................................................................................... 45
Child Care and Development Tables ........................................................................................................................ 49
Water, Sanitation and Hygiene (WASH) Tables .................................................................................................... 50
Agriculture Tables .......................................................................................................................................................... 52
ANNEX III: Questionnaires ................................................................................................................................ 54
Caregivers of Children Birth-59 Months ...................................................................................................................... 54
Women of Reproductive Age ......................................................................................................................................... 74

NOURISH Project Baseline Survey Report viii
LIST OF FIGURES AND TABLES
FIGURES
Figure 1 Trends in Child Malnutrition in Cambodia .......................................................................................................... 1
Figure 2 Distribution of Sampled Respondents, by Respondent Category .................................................................. 9
Figure 3 Primary Occupations .............................................................................................................................................. 10
Figure 4 Distribution of Children’s Ages ........................................................................................................................... 11
Figure 5 Sources of ANC ...................................................................................................................................................... 11
Figure 6 Number of ANC Visits .......................................................................................................................................... 12
Figure 7 Nutrition-related Components of ANC Received ......................................................................................... 12
Figure 8 Weight Gain in Last Pregnancy ............................................................................................................................ 13
Figure 9 Women's Dietary Diversity .................................................................................................................................. 14
Figure 10 Women's Food Consumption by Food Groups in the Past 24 Hours .................................................... 15
Figure 11 Stunting by Age in Months, Children 0-23 Months ...................................................................................... 16
Figure 12 Timing of Child's Most Recent Visit to a Health Facility, Children 0-23 Months ................................. 17
Figure 13 Services Child Received at Health Facility on Last Visit, Children 0-23 Months .................................. 17
Figure 15 Dietary Diversity, Children 6-23 Months ....................................................................................................... 19
Figure 16 Food Consumption, Children 6-23 Months ................................................................................................... 20
Figure 17 Minimum Acceptable Diet, Children 6-23 Months ....................................................................................... 20
Figure 18 Early Childhood Stimulation Activities in Past 3 Days, among Children 6-23 Months ........................ 22
Figure 19 Drinking Water Treatment ................................................................................................................................ 23
Figure 20 Nutrient-rich Vegetable Production at Home in “First 1,000 Day” Households ................................. 25
Figure 21 Consumption of Nutrient-rich Vegetables Grown at Home, by Family Member ................................ 26
TABLES
Table 1 Population of Sampled Respondents, by Province .............................................................................................. 5
Table 2 Sample Size by Respondent Category .................................................................................................................... 7
Table 3 BMI, Women of Reproductive Age (n=223) ..................................................................................................... 13
Table 4 Prevalence of Anemia, Non-Pregnant Women of Reproductive Age (n=217) ......................................... 14
Table 5 Prevalence of Anemia, Pregnant Women (n=185) .......................................................................................... 14
Table 6 Summary of Findings: NOURISH Maternal Health and Nutrition Indicators ............................................ 15
Table 7 Prevalence of Anemia, Children 6-59 Months .................................................................................................. 16
Table 8 Summary of Findings: NOURISH Child Health and Nutrition Indicators .................................................. 17
Table 9 Breastfeeding Practices ........................................................................................................................................... 18
Table 10 Minimum Acceptable Diet Children 6-23 Months ......................................................................................... 21
Table 11 Summary of Findings: NOURISH Infant and Young Child Feeding Indicators ........................................ 21
Table 12 Summary of Findings: NOURISH Child Care and Development Indicator ............................................. 22
Table 13 Household Sanitation Facilities ........................................................................................................................... 24
Table 14 Summary of Findings: NOURISH Water, Sanitation and Hygiene Indicators ......................................... 25
Table 15 Respondents by Category, Province and Age ................................................................................................ 35
Table 16 Women’s Marital Status, by Province ............................................................................................................... 35
Table 17 Women’s Education, by Province ...................................................................................................................... 36
Table 18 Women’s Occupation ........................................................................................................................................... 36
Table 19 Women’s Occupation, by Category of Respondent ..................................................................................... 36
Table 20 Husbands’ Education, by Province ..................................................................................................................... 37
Table 21 Husbands’ Occupation .......................................................................................................................................... 37
Table 22 Caregivers' Husbands' Location of Work: In or Outside of Village, by Province .................................. 37
Table 23 Among Husbands who Work Outside of Village, Location of Work, by Province ............................... 37
Table 24 Number of Children under Caregiver’s Supervision, by Province ............................................................ 38
Table 25 Type of Relationship to Child, by Province ..................................................................................................... 38
Table 26 Children’s Ages, by Province .............................................................................................................................. 38

NOURISH Project Baseline Survey Report ix
Table 27 Children’s Ages and Sex, by Province ............................................................................................................... 39
Table 28 Observation of Child’s Birth Certificate, by Province .................................................................................. 39
Table 29 Poverty Status, by Respondent Category and Province ............................................................................... 40
Table 30 Sources of Antenatal Care (ANC) .................................................................................................................... 41
Table 31 Timing of First ANC Visit .................................................................................................................................... 41
Table 32 Number of ANC Visits ......................................................................................................................................... 41
Table 33 Days of Iron Supplementation ............................................................................................................................ 41
Table 34 Delivery Location ................................................................................................................................................... 42
Table 35 Source of Postnatal care ...................................................................................................................................... 42
Table 36 Birthweight (Mother’s Recall) ............................................................................................................................. 42
Table 37 Birth Weight (Recorded) ..................................................................................................................................... 43
Table 38 BMI Women of Reproductive Age .................................................................................................................... 43
Table 39 BMI Women of Reproductive Age, by Province ............................................................................................ 43
Table 40 Prevalence of Anemia, Women of Reproductive Age .................................................................................. 43
Table 41 Prevalence of Anemia, Pregnant Women ........................................................................................................ 44
Table 42 Women’s Dietary Diversity ................................................................................................................................ 44
Table 43 Timing of Child's Most Recent Visit to Health Center, by Province ......................................................... 44
Table 44 Services Received during Most Recent Visit to a Health Facility ............................................................... 45
Table 45 Prevalence of Anemia, Children, by Province ................................................................................................. 45
Table 46 Breastfeeding Practices ......................................................................................................................................... 45
Table 47 Exclusive Breastfeeding among Children 0-5 Months, by Sex and Province ........................................... 45
Table 48 Liquids Other than Breastmilk Given, Children 0-5 Months ...................................................................... 46
Table 49 Times Breastfed in Past 24 Hours ..................................................................................................................... 46
Table 50 Duration of Breastfeeding .................................................................................................................................... 46
Table 51 Children 6-59 Months Food Consumption, by Type of Food and Province ........................................... 47
Table 52 Fish Consumption in Past 24 Hours .................................................................................................................. 47
Table 53 Sweets and Packaged Snacks Consumption in Past 24 Hours .................................................................... 47
Table 54 Feeding Practices During and After Fever 0-5 Month Olds ........................................................................ 47
Table 55 Feeding Practices During and After Diarrhea 6-59 Month Olds ................................................................ 48
Table 56 Feeding Practices During and After Fever 6-59 Month Olds ...................................................................... 48
Table 57 Positive Stimulation in Past 3 Days, Children 0-23 Months, by Type of Caregiver ............................... 49
Table 58 Negative Discipline in Past 3 Days, Children 0-23 Months ......................................................................... 49
Table 59 Water Treatment before Drinking, by Method and Province .................................................................... 50
Table 60 Water Treatment before Drinking among Caregivers, by Method and Age of Child .......................... 50
Table 61 Water Filter Cleaning ........................................................................................................................................... 50
Table 62 Water Filter Cleanliness (Observed) ................................................................................................................ 50
Table 63 Water Storage after Treatment ......................................................................................................................... 51
Table 64 Household Sanitation Facilities ........................................................................................................................... 51
Table 65 Handwashing Place, by Province ........................................................................................................................ 51
Table 66 Handwashing Station Characteristics (Observation) .................................................................................... 51
Table 67 Separate, Dedicated Handwashing Stations ..................................................................................................... 52
Table 68 Child Stool Disposal, by Province ...................................................................................................................... 52
Table 69 Percentage who Grow Food at Home ............................................................................................................. 52
Table 70 Vegetables Grown at Home, by Province ........................................................................................................ 53
Table 71 Use of Vegetables Grown .................................................................................................................................... 53

NOURISH Project Baseline Survey Report 1
INTRODUCTION
Nutrition Situation in Cambodia Despite steady economic growth since the mid-1990s, and some positive trends, malnutrition remains high.
Malnutrition has serious human development and economic
consequences; Cambodia’s Council for Agriculture and Rural
Development (CARD) estimates that stunting costs
approximately USD $120 million a year annually in lost gross
domestic product.2
Women’s Nutritional Status
The 2014 Cambodia Demographic and Health Survey (CDHS)
found that 14% of women of reproductive age 15-49 years
were underweight; young women 15-19 years of age have the
highest underweight prevalence (28%). 3 Among those births
for which the mother was able to report the baby’s weight,
8% of children had a low birthweight under 2.5 kg.
Approximately half of women were anemic; 45% of women of
reproductive age 15-49 years and 53.2% of pregnant women
had anemia.4 The causes of anemia in Cambodia include
genetic hemoglobin disorder and iron deficiency anemia
(IDA).5
Children’s Nutritional Status
Nearly one in three (32.4%) children under the age of five is chronically malnourished, or stunted. Stunting
is highest in rural areas (34.3%) and in children of families in the poorest quintile (42%). Although not as high
as stunting, one in four children under five years are underweight and one in 10 children is wasted with low
weight-for-height. Two percent of children under five years has severe acute malnutrition (SAM) or severely
low weight-for-height.
Over half (56%) of children 6 to 59 months of age is anemic and 66% is iodine deficient.6
2 Bagriansky J., et al. The economic consequences of malnutrition in Cambodia, more than 400 million US dollar lost annually. Asia Pac J Clin Nutr 2014;23(4):524-531 3National Institute of Statistics, Directorate General for Health, and ICF International, 2015. Cambodia Demographic and Health Survey 2014. Phnom
Penh, Cambodia, and Rockville, Maryland, USA: National Institute of Statistics, Directorate General for Health, and ICF International. 4 CDHS 2014 5 Karakochuk C., et al. Genetic Hemoglobin Disorders Rather Than Iron Deficiency Are a Major Predictor of Hemoglobin Concentration in Women
of Reproductive Age in Rural Prey Veng, Cambodia. The Journal of Nutrition: Community and International Nutrition. 2015. 6 CDHS 2014
National Nutrition Situation at a
Glance
14% of women are underweight
32.4% of children under 5 are stunted
24% of children are underweight and
10% of children are wasted
45% of women of reproductive age
are anemic; 53% of pregnant women
are anemic
55.5% of children are anemic
Source: CDHS 2014
39.9
28.0
11.0
32.423.9
9.6
Stunting in Children <5 Underweight in Children <5 Wasting in Children <5
Trends in Malnutrition in Cambodia 2010-2014 (%)
2010 CDHS 2014 CDHS
Figure 1 Trends in Child Malnutrition in Cambodia

NOURISH Project Baseline Survey Report 2
Summary of Factors that Drive Nutritional Status
Determinants of nutrition are multi-faceted. Immediate causes of undernutrition are inadequate dietary
intake and disease. Underlying causes are multi-sectoral encompassing maternal and infant and young child
feeding and care; health services; water, sanitation and hygiene environment and practices and sustainable
household food security.7
Health and Nutrition: Health service utilization during pregnancy and childbirth have shown significant
improvement since 2000. The 2014 CDHS found that 73.9% of rural women who had a live birth in the past
five years had at least four antenatal care (ANC) visits; 77.5% of rural women start ANC in the first
trimester. Through ANC services, nearly all women (96%) reported taking iron supplements and 76%
reported completing the course of 90 or more tablets during pregnancy. Nearly all (95%) pregnant women
were weighed and 72% received deworming as part of ANC. Most births (83%) were in a health facility.
Child health service access and utilization have also improved. CDHS 2014 found that 73% of children age
12-23 months was fully immunized and 70% of children 6-59 months received Vitamin A supplements in the
past six months.
Sixty-five percent of children under six months were exclusively breastfed overall; children in rural areas,
poor households and with mothers with lower education were significantly more likely to be exclusively
breastfed and to breastfeed longer. However, only 30% of children 6-23 months received a minimum
acceptable diet, meaning that the child received the minimum feeding frequency and minimum dietary
diversity, as appropriate for her or his age.8 Rural children and the poorest children were two and four times
less likely to receive the minimum acceptable diet, respectively. Secondary analysis of the Cambodia 2010
data show that children who ate animal source foods were less likely to be stunted.9,10
Water, Sanitation and Hygiene (WASH): CDHS 2014 (which sampled households with men and
women of reproductive age and children under five) found that 67% of rural households used an appropriate
method of water treatment, primarily boiling (55%) or filtering (17%). Nationally, 39.7% of rural households
had an improved latrine, 9% used a shared latrine, 1% had an unimproved latrine and 50.4% openly defecate.
Over two-thirds (70.6%) of households with children under five years dispose of children’s feces
hygienically.11 Most rural households (77%) had a place for handwashing (although not a designated separate
handwashing station) with water and soap.
Agriculture: Despite improvements in household food access and food consumption, the poor quality of
diet remains the main factor responsible for undernutrition in Cambodia.12 The vast majority of dietary
energy comes from cereals, particularly white rice. Food security constraints include low agricultural
productivity and diversification, limited access to and unsustainable use of resources, landlessness, and
insufficient employment and income opportunities, especially in rural areas. The risk of maternal underweight
increased as the severity of food security increased. Efforts to improve household food security are
recommended to improve women’s nutritional status.13
Multi-sectoral approaches are needed to address malnutrition including interventions to improve water,
sanitation, and hygiene; increase access to more diverse food for women and children; address suboptimal
infant and young child feeding practices; and support social protection initiatives.14
7 USAID Multi-Sectoral Nutrition Strategy 2014-2025. USAID. Washington, DC, 2014. 8 CHDS 2014 9 Ikeda, N. et al. Determinants of reduced child stunting in Cambodia: analysis of pooled data from three Demographic and Health Surveys. Bulletin of
the World Health Organization 2013; 91:341-349. 10 Consumption of animal source foods and dietary diversity reduce stunting in children in Cambodia. Darapheak et al. International Archives of Medicine 2013, 6:29 11 CDHS 2014 12 Cambodia ‐ Food and Nutrition Security Profiles 2015. Association of Southeast Asian Nations, EU, FAO, UNICEF WFP, WHO. 13 McDonald, CM et al. Household food insecurity and dietary diversity as correlates of maternal and child undernutrition in rural Cambodia. European Journal of Clinical Nutrition (2014), 1–5 14 Chaparro, C.; Oot, L.; and Sethuraman, K. 2014. Cambodia Nutrition Profile. Washington, DC: FHI 360/FANTA.

NOURISH Project Baseline Survey Report 3
Overview of the NOURISH Project NOURISH, an integrated nutrition project
funded by the United States Agency for
International Development (USAID) and the
US Presidential Initiative Feed the Future
(FTF), aims to reduce the proportion of
children in Cambodia who are stunted and to
begin to break the intergenerational
malnutrition cycle and halt productivity losses
due to poorer cognition and reduced
schooling. NOURISH works to accelerate
stunting reduction by focusing directly on the
causal factors of chronic malnutrition specific
to Cambodia: lack of access to diverse and
quality food, inadequate feeding and care
practices and unsanitary environments. The
project operates in three provinces,
Battambang, Pursat, and Siem Reap, directly
reaching 555 of the poorest rural villages and within those areas.
The NOURISH Project is implemented by Save the Children and partners: SNV and The Manoff Group with
Operation la Enfant du Cambodge in Battambang, Partners in Compassion in Pursat and Wathnakpheap in
Siem Reap over the course of five years from June 6, 2014 to June 5, 2019. In pursuit of its goal, NOURISH
offers a comprehensive integrated approach through four complementary strategic objectives:
NOURISH takes a multi-sectorial approach to improve nutrition, uniquely integrating health/nutrition, water,
sanitation and hygiene (WASH) and agriculture:
Health/Nutrition WASH Agriculture
To strengthen care practices for
pregnant and lactating women
and children under the age of
two, NOURISH works primarily
at the community level to
improve maternal and child diets
and feeding practices with special
emphasis on complementary
feeding and appropriate care-
seeking behaviors.
To improve access to safe
drinking water, improved
sanitation and hygiene,
NOURISH works to achieve
open defecation free (ODF)
status through community-led
total sanitation (CLTS).
For safe drinking water at point-
of-use and sustainable improved
sanitation, NOURISH fosters
improved access and promotion
of water filters, latrines and
To improve access to diverse
quality foods for women and
children year-round, NOURISH
links “first 1,000 days” families
with agriculture resources
including tested tools. NOURISH
promotes micro-gardens and the
consumption of small fish and
nutritious value chain products
supported by other USAID-
funded projects. This work
emphasizes decision-making to

NOURISH Project Baseline Survey Report 4
Health/Nutrition WASH Agriculture
handwashing devices by the
private sector. Vouchers serve
as incentives to expand sanitation
demand to “first 1,000 days”
poor families.
purchase of nutrient-dense foods
and capacity strengthening of
provincial agriculture partners to
support poor women farmers.
Project activities are implemented in collaboration with Cambodia’s Council on Agricultural and Rural
Development (CARD) and three respective line ministries: Ministry of Health (MOH), Ministry of Rural
Development (MRD) and Ministry of Agriculture, Fisheries, and Forestry (MAFF). Over the course of the
project implementation, NOURISH engages with central government and sub-national counterparts to
implement related policies and strategies:
National Strategy for Food Security and Nutrition (2014-2018): The Strategy identifies priority
actions over 4 dimensions of Food Security and Nutrition: availability; access; use and utilization of food;
and stability of these dimensions through three strategies: improve access to food, community nutrition
in the first 1,000 Days and multi-sectoral efforts, and social protection to reduce the vulnerability of
food insecure households and their exposure to risks.
National Fast Track Road Map for Improving Nutrition (2014-2020): This scales up a core
package of nutrition-specific interventions for first 1,000 days with 5 core components on nutrition
counseling in pregnancy, treatment of severe acute malnutrition, micronutrient supplementation and
behavior change communication. Three components aim to create an enabling environment, including
reducing financial barriers to services and multi-sectoral engagement in nutrition.
National Strategy for Rural Water Supply, Sanitation and Hygiene (2011-2025): The Strategy
has been translated into an Action Plan to achieve targets such as complete rural sanitation coverage by
2025 and improved hygiene behaviors by 2025.
Gender Mainstreaming Policy and Strategic Framework in Agriculture (2016-2020): The
Gender Mainstreaming framework guides women farmer’s empowerment and capacity strengthening of
the agriculture line ministry and extension workers to support women farmers to reach gender equity.
Policy and Strategic Framework on Childhood Development and Protection in the
Agriculture Sector (2016-2020): This policy aims to foster better conditions for childhood
development and protection, to prevent child labour in the agriculture sector and to protect them from
hazards like using agrochemicals.

NOURISH Project Baseline Survey Report 5
Results Framework and Indicators
METHODOLOGY The cross-sectional baseline survey aims to document starting levels of knowledge, behaviors and
environmental factors to assess project performance through comparison with an endline survey.
Sampling
The NOURISH Project implementation area is inclusive of 555 of the poorest villages in three provinces:
Battambang, Pursat and Siem Reap. Project communes have a poverty rate of 30% or higher according to
Ministry of Planning 2013 data.
Table 1 Population of Sampled Respondents, by Province
Province 0-5 months 6-59 months 15-49 year old Total %
Battambang 1,722 6,064 52,295 60,081 44%
Pursat 396 1,331 10,059 11,786 9%
Siem Reap 1,966 6,075 57,766 65,807 48%
Total 4,084 13,470 120,120 137,674 100%

NOURISH Project Baseline Survey Report 6
Sampling used a random, cluster sampling approach proportionate to population size. First, 30 communes
were randomly selected from the three provinces, proportionate to population size. These 30 communes
represent approximately half of the 58 communes remaining in the NOURISH Project implementation area,
after excluding 12 communes part of year 1 implementation. Next, within the communes, 90 villages were
randomly selected based on the population distribution.
Finally, within each village respondents were selected from household lists maintained by Village Chiefs.
Respondents were women of reproductive age and the primary caregivers of children under five years. For
women of reproductive age and caregivers of children under five years, respondents were randomly selected
from the household lists. For pregnant women and caregivers of children under six months of age, all
possible respondents in the village were interviewed in order to reach the sample required.
Sample Selection Process
Sample Size Calculation
The sample size calculation is based on a conventional approach of using a 95% level of confidence with a
confidence interval of +/-5%*. The sample size calculation is computed based on the following formula:
z = 1.96 from the standard normal variate tables (+5% type I error, P<0.05)
*z = 2.33 from the standard normal variate tables (+2% type I error, P<0.02) for children 6-59 months
P = Expected proportion in population based on previous studies or pilot studies
e = Absolute error or precision
N=𝑧2 𝑝 1−𝑝
𝑒2
30 Communes Selected
70 Communes
Clu
ste
r Sa
mp
ling
pro
po
rtio
nat
e t
o
po
pu
lati
on
siz
e
Ran
do
m sam
plin
g th
rou
gh H
H Lists
Po
pu
lation
P
rop
ortio
nate to
Size
WRA
210
Pregnant Women
360
Children 0-5 mos
390
Children 6-59 mos
360
Battambang
13
Pursat
3
Siem Reap
14
90 Villages Selected

NOURISH Project Baseline Survey Report 7
Table 2 Sample Size by Respondent Category
Respondent Category
Population Size
(CDB 2013)
Data Source for Sample
Calculation*
Sample
Size
Women of reproductive age
345,000 15.9% underweight
(CDHS 2010**)
210
Pregnant women
15,868 53.2% anemic
(HARVEST Project IE baseline 2012)
360
Children under 6 months
11,537 65% exclusive breastfeeding
(CDHS 2014 Preliminary Analysis)
360
Children 6-59 months
50,277 32.4% stunting
(CDHS 2014 Preliminary Analysis)
390
*The indicators selected for sample calculation were based on two criteria: the highest level outcome indicator for the specific
respondent category or in the case of children under 6 months, the most relevant indicator required to collect.
**Sample size calculation was done when the preliminary CDHS 2014 data were available but before the full CDHS 2014 report was
released. The preliminary CDHS 2014 included stunting but not women’s underweight.
Data Collection and Analysis
Baseline Survey: The survey was cross-sectional in nature in order to examine the prevalence of key
indicators among the defined project target population at a single point in time and the relationship between
these indicators and socio-demographic characteristics. The project will conduct an endline survey during
the last year of the project in November 2018. This will similarly be cross-sectional survey to collect
information on key indicators at a single point in time. Longitudinal or panel data will not be collected (over
multiple periods of time with the same persons.)
NOURISH developed the data collection tools and questionnaires using validated questions in the Cambodia
Demographic and Health Survey (CDHS) questionnaires and Feed the Future survey modules.15 The
questionnaires were translated from English to Khmer and back-translated to ensure comprehension and
accuracy of translation. Prior to training the interviewers, selected surveyors and NOURISH staff pre-tested
the questionnaire for language, understanding, skip patterns, as well as time, and then finalized tools for the
field data collection. The questionnaires were prepared and tested from August-September 2015. Ethical
clearance approval was received by the National Ethical Committee for Health Research in September 2015
and by the Save the Children Ethical Review Board in October 2015.
As a result of a competitive bidding process for the survey, NOURISH selected the Royal University of
Agriculture (RUA) to conduct the survey. RUA selected two types of interviewers to collect the data:
quantitative surveyors and health professionals. RUA interviewers collected data in November 2015. Data
collectors worked in 10 teams; each team of six data collectors included one nurse in charge of
anthropometric data and one supervisor.
Training of Interviewers: The NOURISH M&E Specialist and RUA trained interviewers during a four-day
training on key principles of interviewing and practice in the field to identify households, select respondents
and conduct interviews using the questionnaires. The NOURISH WASH Specialist introduced the sanitation
and hygiene variables and definitions, taught the WASH section in the questionnaire, and provided guidance
on how to collect data through observation. NOURISH M&E Specialist covered health topics and skills in
anthropometry and anemia testing. Their training included classroom-based learning and field practice to
ensure that weights and heights were measured, read and recorded correctly, following training detailed in
the FANTA Guide.16
15 Feed the Future M&E Guidance Series. Volume 8: Population-Based Survey Instrument for Feed the Future Zone of Influence Indicators with Revised WEAI Module, October 2012 16 Cogill, Bruce. 2003. Anthropometric Indicators Measurement Guide. Washington, DC: Food and Nutrition Technical Assistance (FANTA) Project, FHI 360

NOURISH Project Baseline Survey Report 8
Data Quality and Management: RUA hired and supervised data collectors. Each team of data collectors
had one supervisor attached to the team throughout data collection. Additional supervision from RUA
research experts in Phnom Penh provided spot checks. To ensure the quality of anthropometric data, scales
were re-calibrated in each village prior to weighing. Weights and length measures were taken two times per
child. Additionally, children were weighed with minimal clothing.
Each household was given a unique identifier code based on the Commune, Village, the type of respondent
(W = women of reproductive age; C = caregiver; H = household head) and the number of the interview.
The code was comprised of the first letter of the Province, first letter of the Commune, first letter of the
Village, and the number of the interview. The data were analyzed in SPSS 23.0.
The NOURISH M&E Specialist and Database Assistant conducted spot checks on data cleaning, coding and
entry. Data for a series of variables were re-entered to check data entry accuracy, and confirmed to be at
least or over 95% accurate.
Children anthropometric data were analyzed in WHO’s Anthro and then transferred to SPSS. Data analysis
for the remaining data was done in SPSS. Data analysis required weighting of children’s anthropometric data.
Due to the need to sample a large number of caregivers of children under six months old to capture
practices related to breastfeeding, coupled with constraints to sample as many children each of the other age
groups, the sample resulted in “oversampling” of caregivers of younger age groups of children, a common
survey challenge. Thus, in order for the sample to be representative of the population of children 0-59
months, the analysis required re-balancing or correction to reflect the older age groups by using a weighting
procedure. Weighting of the data was done in SPSS.
Ethical Considerations
In keeping USAID’s policy (22 CFR Part 225), NOURISH received approval to conduct research in
compliance with US federal standards for human subject research with review. The baseline survey was
approved by the Cambodia National Ethics Committee for Health Research (NECHR) on September 22,
2015 as well as the internal Save the Children Ethics Review Committee (ERC).
Participation in the survey was voluntary. Prior to participation, potential respondents were informed that
they had no obligation to participate and would face no penalty or consequence if they chose not to. If they
agreed, respondents were informed that they were free to withdraw at any time, again with no penalty or
consequence. For all minors under the age of 18 years, the primary caregiver was asked for consent.
Confidentiality was ensured during all stages. No names or other identifying characteristics of women,
individual caregivers and children were written on the forms which are being kept in a locked cabinet and
will be destroyed after one year. Finally, findings are reported by the total sample rather than by any unit
such as village or commune which further protects confidentiality.
Limitations
Potential limitations of the survey include response bias and recall bias. There are many reasons why people
may provide less-than-truthful responses to questions, i.e., socially desirable answers and recall bias. The
survey attempted to reduce this potential bias by providing respondents with clear information about why
they were interviewed and ensuring them that their responses would have no bearing on their participation
or lack of participation in in the project or other services, and that they would never be identified
individually or by name in any reports. In addition, to confirm answers on self-reported behaviors,
interviewers observed the environment when possible (relevant for WASH and agriculture topics).
Another limitation to the analysis and interpretation is the sample size which was calculated to be
representative of all three provinces combined. Therefore, the sample is not intended to disaggregate and
compare data by provinces. Although these data are shown in Annex II, apparent differences cannot be taken
as statistically significant.

NOURISH Project Baseline Survey Report 9
Additionally, the sample of this survey was women of reproductive age and children under five in the
NOURISH project area – not for the entire community. However, WASH interventions are designed to
reach all households for maximum health impact; reaching only “first 1,000 day” households will not provide
the impact from WASH interventions as anticipated from reaching all households. National reporting and
project monitoring systems are designed at whole of community level. Therefore, this survey can be used for
NOURISH Project comparison at baseline and endline, and compared to CDHS, but cannot fully be
compared to national WASH data.
Finally, collecting accurate weights and length measures of children under six months was a challenge. The
data collectors faced difficulty when infants were crying/not as still as the older children. Many of these data
had to be discarded due to the wide variation between first and second measures, especially among the
youngest. After cleaning the data, 8.6% (66) children’s heights, and 6.9% (53) of children’s weights could not
be used and were discarded from the sample. The number remaining data were sufficient for the analysis.
Additional information on the baseline survey protocol is found in Annex I.
FINDINGS
Socio-Demographic Characteristic This section provides information on the survey sample sizes and on the general characteristics of the
households surveyed at NOURISH baseline. The survey spanned 90 villages across the NOURISH Project
target areas in three provinces: Battambang, Pursat and Siem Reap. Highlights of the findings are shown in
this section; data not shown, and detailed data tables are included in Annex II.
The survey sampled 1,347 women: 56.8% were primary caregivers17 of children under 59 months (n=766),
26.6% of pregnant women (n=358) and 16.6% of women of reproductive age (n=223). The distribution by
province was proportionate to population size: 43.3% in Battambang (n=583), 46.9% in Siem Reap (n=632)
and 9.8% in Pursat (n=132) [Figure 2].
The ages of respondents ranged from 15 years to 68 years with a mean age of 27.7 years. Nearly all women
had ever been married (93% overall and 98.6% of pregnant women and caregivers) and 96% of ever-married
women were married at the time of the survey. Eighty-five percent of women had ever attended school; of
these 58% reported that their highest level of education was primary school, 27.7% went to secondary
school, and 12.2% attended high school or university. When asked about a primary occupation, women
reported the following occupations: 42.8% are farmers, 26.9% stay at home with children and 22.4% engage
in daily labor [Figure 3]. Occupations by type of respondent were similar between caregivers and women of
17 The survey interviewed the child’s primary caregiver whether the caregiver is the mother or not. Throughout the report, the designation of the
caregiver is used as mother when questions were asked only for the mother (ie. related to maternal health and breastfeeding) and parent/caregiver when encompassing all types of primary caregivers.
56.8%26.6%
16.6%
Distribution of Respondents, by Respondent Category (%)
Caregivers of Children 0-59 Months
Pregnant Women
Women of Reproductive Age
Figure 2 Distribution of Sampled Respondents, by Respondent Category

NOURISH Project Baseline Survey Report 10
reproductive age, while pregnant women were less likely to engage in daily labor and more likely to stay at
home (42.7%).
Currently married caregivers reported their husband’s ages which ranged from 20-70 years with a mean age
of 33 years. Currently married women reported their husband’s highest level of education: 51.4% said their
husbands completed primary school, 29.1% said that their husband attended secondary school, and 15%
reported that their husband went to high school or university. Sixty-one percent of currently married
women husbands’ are farmers [Figure 3]. Eighteen percent said that their husband worked outside of the
village, approximately half in Thailand (54.5%). The proportion of husbands who work outside the village
was higher in Battambang (27%) than the other provinces (12%), possibly due to cassava plantations which
hire farm laborers for several months at a time throughout the year.
Figure 3 Primary Occupations
Sixty-eight percent of women reported that their family owns agricultural land. Of these, the average size
owned is 1.72 hectares; most had one hectare or less (44%) or two to three hectares (37%), while 14% said
that they have four or more hectares.
Approximately 30% of women were poor: 21.7% had a current Identification (ID) Poor Card issued by the
Ministry of Planning, 7% said their household holds an ID Poor Card but did not have it on hand, and 2% had
an expired Card (the renewal cycle was in progress at the time of the survey). By type of respondent, 32.5%
of caregivers, 30.9% of women of reproductive age and 27.2% of pregnant women were poor.
Six percent of caregivers had a bank account, and 43.5% of these women were ID Poor. Thus overall 3% of
poor women caregivers had their own bank account.
Among women of reproductive age, 56.1% had at least one child; of these women the range of children is
one to nine children and the mean number is 2.4 children. The remainder of this section presents findings
from the 766 caregivers with children. The number of children in their care was between one and seven
children, with a mean number of 1.4 children. Among caregivers, 62.8% cared for one child, 32.2% cared for
two children and 5% cared for three or more children.
Given the presence of migration in the project area, the survey asked about the relationship of the caregiver
to the child. Overall, 88.1% of caregivers in the sample were mothers while 11.9% was the grandmother or
aunt of the child. The proportion of mother caregivers declined as the child’s age increased; 93% of
caregivers of children under six months was the mother versus 83% of caregivers of children 6-59 months.
42.8%
26.9%
14.3%8.2%
1.9% 1.6% 2.3% 2.0%
61.0%
4.0%7.0%
0.7%
13.50% 13.7%
0.1%
Farmer Stay at home Daily labor Seller Unemployed Construction/factory Other Do not know/missing
Primary Occupations (%)
Women Husbands (reported by women)

NOURISH Project Baseline Survey Report 11
The distribution of ages of children of
the caregivers interviewed follows:
49% children were under six months
(n=371), 23% children were 6-11
months (n=177) and 28% children
were 12-59 months (n=218) [Figure
4].
Girls comprised 48% of the sample
(n=360) and boys made up 52%
(n=389).
Caregivers of 59.8% of children had
the child’s birth certificate and could
show it to the interviewer.
Health and Nutrition This section provides information on maternal health care-seeking and other maternal practices including
dietary intake collected at NOURISH baseline. All women’s anemia status was assessed and non-pregnant
women of reproductive age 15-49 years were weighed and measured. The section also covers child care
practices, including exclusive breastfeeding during the first six months of life, continued breastfeeding until
age two, complementary foods and diet diversity for children under 24 months, as well as parenting attitudes
and practices. The anemia status of children 6-59 months was assessed and the height and weight of all
children under 59 months were measured. Highlights of the findings are shown in this section; data not
shown and detailed data tables are included in Annex II.
Maternal Health and Nutrition Among caregivers, those who are mothers were asked about maternal care-seeking behaviors for their most
recent pregnancy: 96.2% of all women and 97.3% of poor women reported receiving antenatal care (ANC)
at a health facility: 82.7% at a Health Center, 10.7% at a provincial hospital, 2.0% at a private health facility,
0.6% at health post and 0.3% at a national hospital. The remaining 3.8% did not go to a health facility for
ANC or did not answer this question [Figure 5].
Figure 5 Sources of ANC
Regarding timing of the first ANC visit, 76.9% of women reported seeking ANC in the first trimester, while
16.2% started ANC in the second trimester and 4.1% did not seek care until the third trimester. When
asked about the number of ANC visits made during pregnancy, 84.5% of women reported at least four ANC
visits [Figure 6], compared to 73.9% of rural women in CDHS 2014. There were no statistical differences
between poor and non-poor women ANC utilization in this survey.
0.3%10.7%
2.0%
82.7%
0.6% 3.2% 0.6%
National Hospital ProvincialHospital
Private Facility Health Center Health Post No health facility-based ANC
No answer
Sources of Antenatal Care (ANC) (%)
49%
23%
28%
Children's Ages (%)
0-5 months
6-11 months
12-59 months
Figure 4 Distribution of Children’s Ages

NOURISH Project Baseline Survey Report 12
Among women who received ANC, 97.3% reported taking iron tablets, 98.0% were weighed and 76.9% had
their height measured. Nearly all (95.6%) women had their blood pressure taken and 89.5% had a blood
sample taken. 82.9% said that the health workers gave them advice on diet in pregnancy, while only half
(55.1%) reported receiving advice on weight gain during pregnancy [Figure 7].
Of the 97.3% of women who reported taking iron supplements during ANC, 71.2% said that they took
tablets for 90 days or more, the national policy recommendation. One quarter (24.5%) reported taking
tablets for over 30 days but less than 90 days and 4.2% said that they took tablets under 30 days. Of the
total sample at NOURISH baseline, 66.7% reported taking 90 days or more of iron supplements.
Figure 7 Nutrition-related Components of ANC Received
Ninety-five percent of the mothers reported childbirth at a health facility at NOURISH baseline, compared
to 81% of rural women in CDHS 2014. Of these women, a majority (71.3%) delivered at a Health Center,
20% delivered at a public hospital and 3.8% gave birth at a private health facility.
Following global guidelines, the Cambodia Ministry of Health recommendations for weight gain are based on
a woman’s preconception weight; a woman who has a normal weight or body mass index (BMI) before
pregnancy is recommended to gain 11.5-16kg during pregnancy. An underweight woman before pregnancy
should gain 12.5-18kg during pregnancy.18 Mothers recalled advice they had received regarding weight gain
during their most recent pregnancy. Although 55.1% received advice during ANC, only 5.1% of mothers
recalled advice that could have been accurate. Another 24.7% said health workers told them to gain less
than 10kg, 46% did not get any advice and 24% did not recall.
18 National Fast Track Road Map for Improving Nutrition 2014-2020. Cambodia National Nutrition Program, National Maternal and Child Health Center, Ministry of Health.
97.3% 98.0%
76.9%95.6%
68.9%
89.5% 82.9%
55.1%
Took irontablets or
syrup
Weighed Heightmeasured
Blood pressuremeasured
Urine sampletaken
Blood sampletaken
Advice on diet Advice onweight gain
Nutrition-related Components of ANC Received (%)
(multiple responses)
1.3%9.9%
84.5%
4.3%
1 Visit 2-3 Visits 4 or more Visits Missing
Number of ANC Visits (%)
Figure 6 Number of ANC Visits

NOURISH Project Baseline Survey Report 13
Women were also asked to recall actual weight gain during their last pregnancy, regardless of their pre-
pregnancy weight and/or advise received from a health worker: 63.9% reported gaining less than 10kg during
their last pregnancy – lower than recommended by the Ministry of Health, 22.7% gained over 10kg (18.1%
said that they gained 10-12 kg and 4.6% gained over 12kg) and 13% did not know [Figure 8].
Mothers recalled the size of their infant at birth: 47.7% reported the baby was ‘average’, 35.5% said the baby
was ‘larger than average’ and 5.1% said the baby was ‘very large’. Eleven percent assessed the baby to be
small (9.8% said ‘smaller than average’ and 1.3% said ‘very small’), compared to CDHS 2014 where rural
mothers reported 12.1% of babies small (9.2% ‘smaller than average’ and 2.9% ‘very small’). When asked to
show the records to the interviewers, only slightly more than half of the respondents (58%) had their child
birth weight recorded on the Child Health Card with 5.1% listed as underweight (under 2.5kg at birth),
compared to CHDS 2014 data of 8.4% in rural areas. Regarding postnatal care after childbirth, 82.7% of
mothers reported care in the first two days at baseline, compared to 89.1% of rural mothers in CDHS 2014.
The survey assessed the nutritional status of women of reproductive age who were not knowingly pregnant
at the time of the baseline survey. Adequate energy in the diet is necessary to support the continuing
growth of adolescent girls and women’s ability to provide optimal care for their children and participate fully
in income generation activities.19 (This is calculated using Body Mass Index (BMI), defined as the weight of
non-pregnant women of reproductive age (15-49 years) in kilograms divided by the square of the height in
meters (kg/m2). A BMI 18.5 or lower signifies acute undernutrition while a BMI over 25 reflects overweight.
At NOURISH baseline, 14.8% of women of reproductive age were underweight [Table 3] based on the
weight measurements taken at the time of the survey, compared to 14.1% in CDHS 2014. Poor women
were no more likely to be underweight.
Table 3 BMI, Women of Reproductive Age (n=223)
BMI N % CDHS 2014 (Rural)
Underweight (<18.5) 33 14.8% 14.1%
Moderately and severely thin (<17) 7 3.1% 4.1%
Mildly thin (17-18.4) 26 11.7% 10.0%
Normal weight (18.5 -24.9) 148 66.4% 68.9%
Overweight (>25) 36 16.1% 17.0%
Anemia is measured by hemoglobin concentration in the blood. To assess anemia in women of reproductive
age the NOURISH survey used the HemoCue system, the same method used by CDHS, operated by trained
health workers. Anemia is detected when an individual has a level of hemoglobin below a defined cut-off.
Non-pregnant women of reproductive age with a hemoglobin concentration less than 12g/dl and pregnant
women with a hemoglobin concentration less than 11g/dl are classified as anemic. The survey found anemia
in 41.5% of women of reproductive age who are not pregnant and not lactating [Table 4] at NOURISH
19 FTF Indicators Handbook and Definition Sheets, 2014.
<10kg63.9%
10-12 kg18.1%
>12 kg4.6%
Do not know 13.3%
Reported Weight Gain in Last Pregnancy (%)
Figure 8 Weight Gain in Last Pregnancy

NOURISH Project Baseline Survey Report 14
baseline, compared to 43.8% in CDHS 2014. Among pregnant women, NOURISH baseline survey found
anemia in 52.4% [Table 5]; CDHS 2014 found similar (53.2%) prevalence of anemia in pregnant women,
however prevalence of severe anemia was much higher. Given the potential negative impact of severe
anemia on pregnancy outcome, interviewers were instructed to advise pregnant women seek medical advice
in the cases of severe anemia recorded during data collection efforts.
Table 4 Prevalence of Anemia, Non-Pregnant Women of Reproductive Age (n=217)
Women of Reproductive Age (not
pregnant) N %
CDHS 2014
Any anemia (<12 g/dl) 90 41.5% 43.8%
<7 g/dl severe anemia 9 4.1% 0.3%
7-9.9g/dl moderate anemia 19 8.8% 5.6%
10-11.9 g/dl mild anemia 62 28.6% 37.2%
Table 5 Prevalence of Anemia, Pregnant Women (n=185)
Pregnant Women N % CDHS 2014
Any anemia (<11 g/dl) 97 52.4% 53.2%
<9 g/dl severe anemia 23 12.4% 0.4%
9.0-9.9g/dl moderate anemia 20 10.8% 22.4%
10-10.9 g/dl mild anemia 54 29.2% 30.4%
The quality of women’s diets is indicated by women’s dietary diversity. Dietary diversity is calculated as the
mean number of food groups consumed in the previous day by women of reproductive age (15-49 years)
using the following nine food groups (Feed the Future Indicator Handbook 2014): (1) Grains, roots and tubers;
(2) Legumes and nuts;
(3) Dairy products (milk, yogurt, cheese);
(4) Organ meat;
(5) Eggs;
(6) Flesh foods and other misc. small animal protein;
(7) Vitamin A dark green leafy vegetables;
(8) Other Vitamin A rich vegetables and fruits; and
(9) Other fruits and vegetables.
Overall women interviewed (n=581) reported consuming an average total of 4.67 types of foods on the day
or night before the interview compared to a score of 4.6 in 2012.20 When analyzed by non-pregnant women
of reproductive age and pregnant women, the scores are 4.79 and 4.59, respectively [Figure 9]. The types of
food groups consumed are shown in Figure 10. Quantity and frequency was not collected as NOURISH
implemented standardized food recall instruments with a focus on dietary diversity.
Figure 9 Women's Dietary Diversity
20 Feed the Future Zone of Influence Baseline Report (2012). Michigan State University for Feed the Future Cambodia.
4.67
4.79
4.59
All women Women of Reproductive Age(non pregnant)
Pregnant Women
Women's Dietary Diversity Score

NOURISH Project Baseline Survey Report 15
Figure 10 Women's Food Consumption by Food Groups in the Past 24 Hours
Table 6 Summary of Findings: NOURISH Maternal Health and Nutrition Indicators
Indicators Women of
Reproductive Age
Pregnant Women
Prevalence of anemia among women 41.5% 52.4%
Prevalence of underweight women 14.8% --
Women’s Dietary Diversity: Mean number of food
groups consumed in past 24 hours
4.79 4.59
Child Health and Nutrition Stunting (low height-for-age) is a result of chronic malnutrition. Stunting is difficult to reverse after age two,
and linear growth deficits in the “first 1,000 days” have severe short- and long-term health and functional
consequences, including poor cognition and educational performance, low adult wages and lost
productivity.21 Stunted girls grow up to have higher risk of childbirth complications. Stunting prevalence is
one of core NOURISH indicators collected at baseline for the comparison at endline as a means to
demonstrate project impact.
This indicator measures the percent of children 0-59 months who are stunted, as defined by a height for age
Z score of <-2 SD. Children with a height for age Z score <-2 and >= -3 are classified as moderately
stunted. Children with a height for age Z score <-3 are classified as severely stunted. The numerator for
this indicator is the total number of children 0-59 months surveyed with a height for age Z score <-2 SD.
The denominator is the total number of children 0-59 months surveyed with height-for-age Z score data.
The prevalence of stunting, reflecting chronic malnutrition, in all children under the age of five surveyed at
NOURISH baseline was 34.3%.22 With further analysis, similar to national data, stunting sharply increases
with age after 11 months, at the time when complementary feeding is needed to provide nutrients in
addition to breastmilk and children become mobile: 14.5% of children 9-11 months was stunted compared to
29.0% of children 12-17 months and 34.6% of children 18-23 months. [Figure 11].
21 2016 WHO; Childhood Stunting: a Global Perspective. Maternal and Child Nutrition (2016). 12, pp 12-26. 22 Data analysis required weighting of children’s anthropometric data; results are ‘weighted’ to re-balance to reflect the prevalence in the population of
children up to 59 months, in order to correct for oversampling of children under six months (required to collect data on exclusive breastfeeding) and under-sampling of children 48-59 months.
98.8% 93.5%
63.3% 57.1%46.0% 43.0%
33.4%22.5%
9.5%
Grain (rice) Flesh foods Other fruitsand vegetables
Green leafyvegetables
Beans, Nutsand Seeds
Orange fruitsand vegetables
Eggs Milk products Organ meat
Women's Food Consumption by Food Groups in the Past 24 Hours (%)

NOURISH Project Baseline Survey Report 16
Figure 11 Stunting by Age in Months, Children 0-23 Months
Underweight is a weight-for-age measurement that is a reflection of acute malnutrition. This indicator
measures the percent of children 0-59 months who are acutely underweight, as defined by a weight-for-age
Z-score <-2 SD. The numerator for the indicator is the total number of children 0-59 months in the sample
with a weight-for-age Z-score <-2. The denominator is the total number of children 0-59 months in the
sample with weight-for-age Z-score data. The prevalence of underweight (weighted data), reflecting acute
malnutrition in children, was 16.9% at NOURISH baseline, lower than CDHS 2014 rural findings of 25.4%.
Wasting is a weight-for-height measurement that is a reflection of acute malnutrition. This indicator
measures the percent of children 0-59 months who are acutely underweight, as defined by a weight-for-
height Z score <-2 SD. The numerator is the total number of children 0-59 months in the sample with a
weight-for-height Z-score <-2. The denominator is the number of children 0-59 months in the sample with
weight-for-height Z-score data. The prevalence of wasting in children 0-59 months at NOURISH baseline
(weighted data) was 8.4%, lower than CDHS 2014 findings of 9.9% wasting in rural Cambodia. The
proportion of children found to have severely low weight-for-height (weight-for-height Z-score -3 SD), or
severe acute malnutrition (SAM), was 1.7% compared to 2.4% in CDHS 2014 data for rural children.
Anemia is measured by hemoglobin concentration in the blood. To assess anemia in children 6-59 months
the NOURISH survey used the HemoCue system, the same method used by CDHS. Anemia is detected
when an individual has a level of hemoglobin below a defined cut-off. Children with a hemoglobin
concentration less than 11g/dl are classified as anemic. The survey identified 59.4% anemia in children 6-59
months [Table 7] compared to 57.4% in CDHS 2014. The difference between girls and boys anemia is not
significant.
Table 7 Prevalence of Anemia, Children 6-59 Months
N % CDHS 2014
Anemia (<11 g/dl) 170 59.4% 57.4%
Girls 86 64.2% 54.2%
Boys 84 55.6% 56.7%
Thirty-two percent of caregivers interviewed at baseline reported taking the child to the health facility within
the month of the survey or the previous month, while 34% percent reported visiting a health facility in the
past two to three months. Another 23.1% reported that the child last visited a health facility within the past
four months (13.3% went in the last four to six months and 9.8% went over six months ago) [Figure 12].
16.0%13.2%
14.5%
29.0%34.6%
16.1%13.1%
16.6%28.1%
33.8%
<6 months 6-8 months 9-11 months 12-17 months 18-23 months
Stunting by Age in Months among Children until 2 Years (%)
NOURISH Baseline CHDS 2014

NOURISH Project Baseline Survey Report 17
Figure 12 Timing of Child's Most Recent Visit to a Health Facility, Children 0-23 Months
Among children 6-23 months who visited a health facility (n=720), 86% of caregivers reported that the child
was vaccinated during the last visit. Nearly equal proportions of caregivers said that the child was weighed
(46.3%), received medicine (46.2%) and intravenous (IV) fluids (43.2%). Additionally 21.4% recalled that they
received counseling [Figure 13]. There was no difference in services received by timing of the most recent
visit to a health facility.
Figure 13 Services Child Received at Health Facility on Last Visit, Children 0-23 Months
Monthly growth monitoring and promotion (GMP) during first 23 months is a key behavior promoted by the
NOURISH Project due to the importance of tracking growth to take corrective actions in growth faltering
before malnutrition is set. Of the 46.3% of children who were weighed in their most recent health facility
visit, 33% were weighed in the past month, 37% of children were weighed within two to three months, and
24% were weighed four or more months prior to the survey.
Table 8 Summary of Findings: NOURISH Child Health and Nutrition Indicators
Indicators Girls Boys Total
Prevalence of anemia among children 6-59 months 64.2% 55.6% 59.4%
Prevalence of stunted children under 5 years of age 28.0% 39.4%* 34.3%
Prevalence of underweight children under 5 years of age 12.1% 21.0%** 16.9%
Prevalence of wasted children under 5 years of age 8.4% 8.5% 8.5%
*p=<0.001
**p=<0.05
85.9%
46.3% 46.2% 43.2%
21.4%
3.3%
Vaccination GMP Medicine for sickchild care
Intervenous fluids Counseling Other
Tyoe of Services Child Received at Health Facility on Last Visit (%)
(multiple responses)
31.9% 34.1%
13.3%9.8% 11.7%
0-1 month 2-3 months 4-6 months >6 months Don't remember/ missing
Timing of Child's Most Recent Visit to a Health Facility (%)

NOURISH Project Baseline Survey Report 18
Infant and Young Child Feeding
Infants Birth to Five Months
Ninety-four percent of children surveyed at NOURISH baseline had ever been breastfed. Exclusive
breastfeeding for six months is the optimal way of feeding infants. Exclusive breastfeeding means that the
infant only receives breast milk without any additional food or drink, not even water. Among children under
six months, 77.8% were exclusively breastfed.
Among children who were not exclusively breastfed, some were given prelacteal feeds (12.5%) in the first
days after birth, or continue to get other liquids: water (9.5%), formula (9.2%) or milk (7.7%).
Continued breastfeeding is recommended by WHO and the Ministry of Health until 2 years of age and
beyond. At NOURISH baseline, continued breastfeeding declined with age on average from 77% among
children 6-8 months to 56% among children 12-23 months. Continued breastfeeding at two years is 32.5%,
using the WHO 2010 definition of continued breastfeeding at two years [Table 8].
Figure 14 Continued Breastfeeding by Age in Months
Table 9 Breastfeeding Practices
Variable Girls Boys Total
CDHS 2014 N % N % N %
Ever breastfed 354 93.7% 368 94.8% 722 94.3% 96%
Exclusively breastfed until 6 months 142 78.5% 156 77.2% 298 77.8% 65%
Continued breastfeeding
at two years
15 40.5% 9 24.3% 24 32.5% --
Among children under six months of age breastfeeding, the average number of breastfeeding sessions per
day ranged from 1 to 35 with a mean of 10.5 times per day. In the past 24 hours, 34.4% reported feeding 11
or more times, 45.5% fed five to 10 times and 20.1% fed less than five times. The average length of a
breastfeeding session ranged from under one minute to one hour with a mean of 12.9 minutes. Some
children (16.6%) consume breastmilk in other ways than breastfeeding.
Children during and after illness require additional nutrients to limit growth loss and prevent growth
faltering. At baseline, 62.4% of caregivers under six months said the child had ever experienced diarrhea.
During the last episode of diarrhea, 24.3% of children got more to drink. In the week after the last episode,
21.7% of children got more to drink. Forty-three percent of children got the same amount of liquid as usual.
Ten percent of children stopped liquids during diarrhea and 14.5% stopped in the week after illness.

NOURISH Project Baseline Survey Report 19
At baseline, 68.4% of caregivers under six months said the child had ever experienced fever. During the last
episode of fever, 19.5% of caregivers gave the child more to drink and in the week after fever 22.5% of
caregivers gave the child more to drink (21.4% gave more and 1.1% gave much more), while 44.8% and
48.5% gave children the same amount of liquid as usual during and after illness, respectively. Nine percent
and 17.6% did not drink liquid during and after fever, respectively.
Children Six to 59 Months
The globally standardized minimum acceptable diet indicator assesses the percentage of children 6-23
months who consumed the minimum dietary diversity and the minimum meal frequency during the previous
day. Specifically, a child with a minimum acceptable diet is given all of the following:
[I] Breast milk or two or more feedings of formula; fresh, tinned, or powdered animal milk; or yogurt; and
[II] Foods from four or more of the following groups:
(1) Infant formula, milk other than breast milk, cheese or yogurt, or other milk products;
(2) Foods made from grains, roots, and tubers, including porridge and fortified baby food from grains;
(3) Vitamin A-rich fruits and vegetables (and red palm oil);
(4) Other fruits and vegetables;
(5) Eggs;
(6) Meat, poultry, fish, and shellfish (and organ meats); and
(7) Legumes and nuts.
[III] The minimum number of recommended meals per day, according to age and breastfeeding status.
For breastfed children, the minimum meal frequency is solid or semi-solid food at least twice a day for
infants 6-8 months and at least three times a day for children 9-23 months. A non-breastfed 6-8 month old
child should eat soft or semi-solid food 3 times a day and a non-breastfed 9-23 month old child should eat
semi-solid food four times a day. NOURISH utilized the validated Feed the Future food recall to collect
data. Each component of this indicator is presented below, concluding with the composite indicator results.
[1] Breastmilk or other milk: Sixty-four percent of children 6-23 months continued to breastfeed; the
prevalence of breastfeeding appeared to decrease by age: 76.7% of 6-8 month olds, 73.6% of 9-11 month
olds, and 55.8% of 12-23 month old children continued to breastfeed at least twice a day.
[II] Number of Food Groups: The number of food groups consumed by children in the last day and night
ranged from 0 to 7 with a mean of four groups; 68.0% of children consumed four or more food groups in
the previous 24 hours. The proportion of children who ate four or more food groups increased with age:
47.0% of 6-8 month olds, 67.0% of 9-11 month olds, and 76.0% of 12-23 month old children consumed four
or more food groups in the previous day [Figure 15].
Figure 14 Dietary Diversity, Children 6-23 Months
The most commonly reported foods given to children were grains (91.9%), foods from animal origin (74.4%),
and fruits and vegetables (62.4%). Fewer children ate orange Vitamin A-rich fruits and vegetables (37.6%),
eggs (33.4%) and beans or nuts (29.9%) and milk products including milk products [Figure 16].
47%67%
76%
6-8 Months 9-11 Months 12-23 Months
Dietary Diversity, Children 6-23 Months (4 or more food groups consumed)

NOURISH Project Baseline Survey Report 20
Figure 15 Food Consumption, Children 6-23 Months
Not counted above, but important to understand the full scope of children’s dietary practices, are sweets
and packaged snacks. In the past day, 42.5% of children 6-23 months had a sugary food such as sweets or
biscuits and 30.1% had a packaged snack food (i.e., chips).
The survey also asked about small fish given its importance to children’s nutrition as a source of protein,
lipids, micronutrients and other nutrients in Cambodia: on average nearly half (46.4%) of children had small
fish of any type in the past 24 hours including 16.9% of children who ate small rice field fish in the past three
days. Small fish consumption increased with age: 20.8% of children 6-8 months, 52.6% of children 9-11
months, and 64.5% of children 12-23 months had fish in the past day at NOURISH baseline.
[III] Number of meals per day: 95.9% of breastfed children were fed with the recommended frequency
(at least twice a day when 6-8 months and at least three times a day when 9-23 months), but only 60.6% of
non-breastfed children were fed with the minimum frequency (four or more times a day).
Overall 25.5% of children 6-23 months received a minimum acceptable diet in the past 24 hours. More
breastfed children were appropriately fed than non-breastfed children [Figure 17]. Among breastfeeding
children 6-23 months of age, 34.1% consumed a minimum acceptable diet in the past 24 hours (criteria
include consumption of breastmilk in the recommended frequency, food from at least four food groups, and
at least three to four times in the past day and night). In comparison, CDHS 2014 found that 32% of
breastfeeding children 6-23 had a minimum acceptable diet.
Among children not breastfeeding at 6-23 months of age, only 7.5% consumed a minimum acceptable diet in
the past 24 hours (criteria include consumption of milk or milk products at least twice a day, four food
groups, and food at least four to five times per day (including milk feeds). CDHS 2014 found that 26% of
non-breastfed children 6-23 had a minimum acceptable diet.
Figure 16 Minimum Acceptable Diet, Children 6-23 Months
91.9%
74.4%62.4%
37.6% 33.4% 29.9%
48.7%61.1%
Grains Animal origin(meat, fish,
etc.)
Other fruitsand vegetables
Vitamin A richfruits and
vegetables
Eggs Beans, Nutsand Seeds
Dairy Breastmilk
Foods Consumed by Children 6-23 months in the Past 24 Hours (%)
34.1%
7.4%
25.5%
Breastfeeding Non Breastfeeding All children
Minimum Acceptable Diet, Children 6-23 Months (%)

NOURISH Project Baseline Survey Report 21
Table 10 Minimum Acceptable Diet Children 6-23 Months
Variables Girls
Boys Total
N % N % N %
Breastfeeding
Minimum acceptable diet 31 31.6% 39 36.5% 70 34.1%
Inadequate diet 67 68.4% 68 63.6% 135 65.9%
Subtotal 98 100% 107 100% 205 100%
Non breastfeeding
Minimum acceptable diet 4 6.0% 6 14.3% 10 7.5%
Inadequate diet 63 94.0% 36 85.7% 123 92.5%
Subtotal 67 100% 42 100% 133 100%
Combined (all children 6-23 months)
Minimum acceptable diet 35 21.2% 45 30.2% 80 25.5%
Inadequate diet 130 78.8% 104 69.8% 234 74.5%
Subtotal 165 100% 149 100% 314 100%
In Cambodia, stunting sharply increases around 9 months of age. Stunting is not treatable, but preventable.
Prevention requires targeted efforts during the introduction to the complementary feeding period, after six
months. At NOURISH baseline, 46.3% of children 9-11 months old ate food (vegetables and animal source
foods) with recommended frequency in the past day.
During the last episode of diarrhea, 48.9% of children 6-59 months had more (48.9%) liquid, while 29.7% had
the same amount. In the week after diarrhea, 28.4% of children 6-59 months was given more liquid while
56.6% was given the same amount as usual. Regarding food offered, 17.4% was given more food while 31.8%
was given the same amount as usual. In the week after diarrhea, 21.1% was given more food and 53.2% was
fed the same as usual. Overall, at baseline, 26% of children 6-59 months with diarrhea had increased fluids
with continued feeding (i.e., more, the same amount as usual, or somewhat less to eat).
During the most recent fever, 29.1% of children had more to drink, while 37.6% had the same amount as
usual. In the week after fever, 22.0% of children was given more to drink while 64.2% of children was given
the same amount as usual. Regarding the amount of food offered to children 6-59 months with fever, 10.1%
of children was given more while 35.8% was given the same amount as usual and 41.3% was fed less than
usual. In the week after fever, 21.1% of children was fed more and 59.6% was fed the same amount as usual.
15.0% of children was fed less than usual. Overall, at baseline, 16.1% of children 6-59 months with fever was
given increased fluids and continued feeding (i.e., more, the same amount as usual, or somewhat less).
Table 11 Summary of Findings: NOURISH Infant and Young Child Feeding Indicators
Indicators Girls Boys Total
Prevalence of exclusive breastfeeding of children under 6
months
78.5% 77.2% 77.8%
Prevalence of children 6-23 months receiving a minimum
acceptable diet
21.2% 30.2% 25.5%
% of children age 9-11 months who received enriched solid,
semi-solid, or soft foods with frequency in the last 24 hours
42.3% 50.0% 46.3%

NOURISH Project Baseline Survey Report 22
Child Care and Development Evidence is continuing to mount indicating that the first years of life are critical in the development of
children as they shape cognitive, social and language skills. From birth to age three, global early childhood
care and development (ECCD) recommendations focus on good nutrition as well as parent education and
early stimulation. The NOURISH Baseline survey used a globally validated tool to assess the environment of
the child including early stimulation.23 In the three days prior to the survey 81.5% of caregivers of children
6-23 months said that the child received affection, primarily from the mother. Caregivers of children 6-23
months also reported the types of activities someone over the age of 15 years did with the child three days
prior to the survey. Play was most frequently mentioned (81.7%) followed by taking child out (69.0%) and
singing songs (66.1%). Approximately half said that the child was praised (56.1%), asked questions (54.8%)
and taught something new (55.8%). Fewer (29.2%) of children had someone count (29.2%) or tell stories
(16.1%) [Figure 18]. The person who engaged in these activities most frequently was the mother.
Figure 17 Early Childhood Stimulation Activities in Past 3 Days, among Children 6-23 Months
Caregivers estimated that they spend an average of nine hours per day interacting with the child, with a
range from one to 24 hours.
Responsive feeding refers to a reciprocal relationship between a child and caregiver characterized by the
child communicating feelings of hunger and satiety through verbal or nonverbal cues, followed by an
immediate response from the caregiver. At baseline, 75.9% of caregivers reported that the child tells them
when s/he feels hungry and when the child feels full. Additionally, caregivers had positive behaviors and
attitudes toward involvement in feeding: 88.5% of caregivers said that they encourage the child to eat, 88%
agreed that adults should help or encourage the child to eat and 78.3% agreed that it is important for adults
to decide the quantity of food a child eats. Also, 70.2% of caregivers report re-trying to feed a food if the
child rejects the food first time. However, only 12.8% reported tracking the quantity of food a child eats
every meal and 52.0% let the child decide how much to eat. At baseline caregiver also mixed attitudes
toward snacks; nearly half believed that children should be able to eat whatever they want for a snack.
NOURISH constructed a variable on age-appropriate (minimum) stimulation according to child care and
development standards combined with responsive feeding. Based on these criteria, 62.6% of children 0-23
months had age-appropriate stimulation. The questionnaire also asked about negative discipline, 42.6% of
caregivers of children 0-23 months reported that someone yelled at or criticized the child and 38.6% said
that someone hit the child in the three days prior (none under 6 months), primarily the mother.
Table 12 Summary of Findings: NOURISH Child Care and Development Indicator
Indicator %
% parents/caregivers of children 0-23 months providing age-appropriate
stimulation of children according to child care and development standards
62.6%
23 International Development and Early Learning Assessment (IDELA) Caregiver Questionnaire, Save the Children US.
16.1%29.2%
55.8% 54.8% 56.1%66.1% 69.0%
81.5% 81.7%
Told stories Counted Taughtsomething new
Askedquestions
Praised forlearning
something new
Sang songs Took out Showedaffection
Played
Early Childhood Stimulation in Past 3 Days, by Activity (%)

NOURISH Project Baseline Survey Report 23
Water, Sanitation and Hygiene (WASH) This section provides information on water, sanitation and hygiene (WASH). Highlights of the findings are
shown in this section; data not shown and detailed data tables are included in Annex II.
Drinking Water Treatment The baseline survey analyzed the percent of respondents who practice correct use of recommended
household water treatment technologies. According to the USAID, households are considered to be
correctly practicing water treatment technologies if the following conditions are met for any of the
treatment options:
Chlorination: an enumerator carrying out the chlorine residual test obtains positive results (CT+);
Filtration: enumerators are able to see the filter and verify that water is in the filter’s bottom container
or comes out of the filter’s tap (Filter +);
Solar disinfection: the enumerator is able to see that bottles filled with water are exposed to the sun
and self reports indicate that bottles are exposed to the sun for at least six hours per day of exposure
(SODIS+) on sunny days and up to two days on cloudy days;
Boiling: study participants report that boiling occurred until water comes to a rolling boil and the same
container where water is boiled is used to store boiled water (BOIL+).
The numerator for this indicator is the number of households that properly treat drinking water through
chlorination, filtration, solar disinfection or boiling. The denominator for this indicator is the number of
households visited in the survey. Results found that 30.8% did not treat water before drinking. This finding is
the same as CDHS 2014 rural data. At NOURISH baseline, 42.6% of respondents followed “recommended
water treatment practices” as defined by USAID indicator guidelines: 26.7% boil water and keep the water in
the same container (do not transfer) and 15.9% filter water before drinking, confirmed by observation.
An additional 13.4% reported boiling water and transferring to a covered container and 5.6% reported
buying bottled water24 (primarily in Battambang from the distributors of the organization Teuk Saat25) [Figure
19] (observed).
Figure 18 Drinking Water Treatment
*These methods (boil but transfer and buying bottled water) are not included in the definition of recommended water
treatment practice, but included in the graph for program considerations.
Among respondents who treated water before drinking, 58.3% said that they keep treated water in the
container (in the filter, water pot or bottle) while 27.3% transferred the water to a covered container
(observed) and 1.4% transferred the water to an uncovered container (observed). Combined, 61.6%
reported drinking treated water (this excludes those who transfer boiled water to an uncovered container
or did not answer on whether water is transferred after treatment).
24 According to the Joint Monitoring Report: “Bottled water is considered to be improved only when the household uses water from
an improved source for cooking and personal hygiene. Where this information is not available, bottled water is classified on a case-
by-case basis. In some countries, bottled water is the best quality water available.” 25 http://www.1001fontaines.com/en/on-the-field/cambodia
26.7%15.9%
13.4%*
5.6%*
30.8%
1.5%
Boil Filter Buy bottled Nothing No answer/ missing
Drinking Water Treatment (%)
40.1%

NOURISH Project Baseline Survey Report 24
Interviewers at NOURISH baseline observed filters of those who filtered water before drinking: out of those
17.8% of the filters looked dirty. When asked about the frequency of cleaning filters, among those who use
filters, 83.2% reported cleaning the water filter weekly or more often.
Sanitation Respondents at NOURISH baseline were asked to allow the interviewer to observe their toilet facility. A
toilet facility is classified as “improved” if it is not shared by other households and if it effectively separates
human waste from human contact: flush or pour flush into a piped sewer system, septic tank, or pit latrine;
ventilated improved pit (VIP) latrines; pit latrines with a slab; and composting toilets, as defined by the Joint
Monitoring Programme (JMP) for Water Supply and Sanitation of WHO and UNICEF. Of all respondents’
households, 37% had an improved, not shared, facility. Forty-two percent of respondents reported no
facility. For purposes of comparison, CDHS 2014 which sampled households of women and men of
reproductive age, found that 39.7% of rural households had an improved, not shared, facility and 52% of rural
households had no facility.
Table 13 Household Sanitation Facilities
Variable N %
Improved, not shared facility 499 37.0%
Improved, shared facility 194 14.4%
Other 22 1.6%
Unimproved facility 2 0.1%
Shared 64 4.8%
Open Defecation 566 42.0%
Total 1347 100%
Hygiene: Handwashing Interviewers at NOURISH baseline observed a place for handwashing with water and soap or another
cleansing agent in 63.3% of households. In comparison, CDHS found that 77.1% of rural households had a
place for handwashing with soap and water.
Proximity to the latrine is a facilitating factor in handwashing after defecation, one of the key times. Twenty
percent of households had a handwashing station with soap or other cleansing agent within 10 meters of a
latrine. Among those households with an improved latrine, 35.3% have a handwashing station with soap or
another cleansing agent within 10 meters of the latrine.
Hygiene: Household Environment of Caregivers Interviewers at NOURISH baseline observed the compound of caregivers’ households for any type of feces.
They observed feces in 39.0% of household compounds: animal feces were observed in 37.3% of the homes
and children’s feces were seen in 1.7% of the households.
When food was observed, interviewers recorded whether the food was contained away from flies.
Interviewers observed food in 22.8% of households; of these households, more than half (51.4%) did not do
anything to protect the food from flies.
Almost one-quarter (24.4%) of caregivers of children under five years reported leaving infant stools
uncontained: 1.1% put or rinse into a drain or ditch, 2.8% throw into the garbage, 3.3% leave in the open and
17.2% throw into the forest. Sixty percent reported disposing children’s stools hygienically26: 15.0% put into
a latrine, 40.6% bury and 4.1% of children use latrine. After removing households where child feces were
26 As defined by the Cambodia Demographic and Health Survey 2014.

NOURISH Project Baseline Survey Report 25
observed in the compound, 57.1% of caregivers of children under two years and 57.7% of caregivers of
children under five years were found to hygienically dispose of children’s stools. In comparison, CDHS 2014
found that 70.6% of rural households disposed of children’s stools safely.
Table 14 Summary of Findings: NOURISH Water, Sanitation and Hygiene Indicators
Indicators Total
Sample
Households of
Children
Under 2
Households of
Children
Under 5
% of households (of women of reproductive age and
caregivers of children under 5) in the target area
using an improved latrine
37.0% 36.5% 36.3%
% of households (of women of reproductive age and
caregivers of children under 5) in the target area
practicing correct use of recommended household
water treatment technologies
43.4% [49.1% including
bottled water]
45.3% [51.0% including
bottled water]
44.2% [50.0% including
bottled water]
% of households (of women of reproductive age and
caregivers of children under 5) with soap and water
at a hand washing station used by family members
63.3% 64.3% 56.8%
% of caregivers disposing of feces appropriately -- 57.1% 57.7%
Agriculture This section provides information on questions collected at baseline related to homestead food production,
focusing on nutritious vegetables. As part of the nutrition-sensitive agriculture efforts for “first 1,000 days”
families, NOURISH promotes certain types of nutritious vegetables which are locally available, need minimal
water and are hardy enough to grow in small spaces year-round: amaranth, moringa and yard-long bean.
Pumpkin and sweet potato are also encouraged as locally acceptable complementary food for young children
and snacks for pregnant women. Highlights of the findings are shown in this section; detailed data tables are
included in Annex II.
All respondents interviewed at baseline were asked whether they grow food at home. Interviewers
requested to observe the garden. Overall 74.9% of homes grew some type of food in the compound, but
only 39.7% (n=535) grow at least one of three local high-nutrient vegetables promoted by NOURISH for
pregnant and lactating women and young children: 32.3% grow amaranth, 23.7% grow moringa and 14.8%
raise yard-long bean. Additionally, 28.1% grow pumpkin and 25.3% grow sweet potato [Figure 20].
32.3%
23.7%
14.8%
28.1%25.3%
Amaranth Moringa Yard-long bean Pumpkin Sweet potato
Homestead Production of Nutrient-rich Vegetables (%)
Figure 19 Nutrient-rich Vegetable Production at Home in “First 1,000 Day” Households

NOURISH Project Baseline Survey Report 26
Of the 39.7% who grows at least one of these vegetables (n=535), nearly all said that the family eats the
vegetables, about half said that they share with neighbors, one-third said that they share with family and
friends and a few sell the vegetables [(16.6% of women who grow vegetables or 6% of the total sample
(n=35)].
Consumption of vegetables grown at home was higher among adult women and men than among children.
While nearly all women and men ate vegetables grown at home, children’s consumption of the vegetables
increased with age: 50.6% of children 6 to 11 months (n=43 of 85 households with children 6-11 months
that grow vegetables at home), 56.9% of children 12 to 23 months (n=41 of 72 households with children 12-
23 months that grow vegetables at home), and 75.0% of children 12 to 23 months (n=18 of 24 households
with children 24-59 months that grows vegetables at home) are reported to be given these vegetables
[Figure 21].
Figure 20 Consumption of Nutrient-rich Vegetables Grown at Home, by Family Member
Compared to non-poor women (33%), significantly more poor (42%) women reported eating vegetables
grown at home (p=<0.05). However, there was no difference between poor and non-poor related to
feeding children under two years of age.
50.6%56.9%
75.0%
Children 6-11 months (n=43) Children 12-23 months (n=41) Children 24-59 months (n=18)
Children's Consumption of Vegetables Grown at Home (%)

NOURISH Project Baseline Survey Report 27
CONCLUSIONS
The baseline survey aimed to document baseline levels for each key NOURISH indicator in order to
compare to results at the end of the project. An endline survey will be conducted on or around November
2018, near the end of the project, during the same season of the baseline to ensure an accurate reflection of
any changes in nutritional status and behaviors related to health and nutrition, WASH and agriculture.
The sampling frame was designed to be representative of women of reproductive age and caregivers of
children under five years of the NOURISH Project area: the poorest rural communities in three provinces in
Cambodia. Consistent with national data for this rural area, most women and/or their husbands are
farmers, and 30% are officially identified as poor (33% of caregivers of young children, 31% of women of
reproductive age and 27% of pregnant women).
Migration is a predominant feature of life in the project areas. At the time of the baseline 18% of women
had husbands working away from the village; half of those in Thailand. Migration also affects care of young
children. In this sample, 10% of children’s primary caregivers was a grandmother or aunt. The proportion of
primary caregivers who were not mothers increased with the child’s age (for example, 13% of children over
6 months had a grandmother as the primary caregiver compared to 7% of children under 6 months).
While most health services are reaching people, social and financial services are less accessible. Less than
two-thirds of children had a birth certificate. Few women had a bank account: 6% of all women and 3% of
poor women had a bank account of any type.
Maternal Health and Nutrition Key Findings
Maternal care seeking practices in the project area are similar or better than national averages; nearly all
women in the project area received ANC, and over 80% sought four or more ANC visits. Over three-
quarters started ANC in the first trimester. Although postnatal care in the first two days after birth was
lower than the national rural average (83% vs 89%), this is related to greater facility-based delivery in this
sample than the national rural average; women stay in health centers for two days after delivery and get care
while in the health center so do not count separate return visits.
At NOURISH baseline, 11% of mothers assessed children to be too small at birth. Among children with a
recorded weight at birth, 5% were under 2.5kg at birth. Although this is lower than national average,
birthweight data should be interpreted cautiously since 42% of children do not have a recorded birthweight
on the Child Health Card.
The survey identified Health Centers as the primary place for antenatal care, childbirth and postnatal care
service provision. The ANC services related to nutrition that women received generally follow global
recommendations, including iron-folate supplementation. An important exception is support for adequate
weight gain during pregnancy. Although nearly all women were weighed during ANC, only half received any
advice on weight gain during pregnancy and only 5% recalled what could have been accurate advice.
Moreover, less than one-third of women may have gained sufficient weight during their most recent
pregnancy.
Women’s nutrition findings were generally consistent with national data: 52% of pregnant women and 42% of
non-pregnant women of reproductive age at NOURISH baseline were anemic. Slightly more women of
reproductive age in this sample were underweight (15%) compared to national data (14%). However,
women’s underweight data should be interpreted cautiously because underweight is based on global or Asian
regional weight and height standards. Due to the high prevalence of stunting in Cambodia, where women
are too short and too light, this measure may not provide a useful interpretation of the current situation.
For example, as women get taller BMI will appear to be worsening especially in young women.
Women consumed 4.67 food groups in the past 24 hours, suggesting that women generally ate a diverse diet
at the time of the survey. The most commonly eaten food groups included grains (rice), animal source foods,

NOURISH Project Baseline Survey Report 28
fruits and vegetables, and green vegetables. As this survey collected dietary information on the project
indicators, the quantity of food consumed was not collected.
Among children 6 to 59 months, the survey identified 59% of children with anemia, similar to CDHS 2014.
Chronic malnutrition, or stunting, in children also mirrored CDHS 2014 rural findings. Acute malnutrition,
in contrast, was lower than national averages. At NOURISH baseline, 17% of children under five years was
underweight compared to 24% nationally and 8% of children under five years was wasted, with low weight-
for-height, compared to 10% in CDHS 2014. Lower acute malnutrition may be related to seasonality; the
survey was conducted during the time of greatest food availability. There were significant differences
between girls and boys in malnutrition prevalence; boys were more likely to be stunted and underweight
than girls. Although overall infant and young child feeding practices appeared better for boys, the differences
were not significant.
Nutrition care seeking practices for children under two years are relatively low compared to maternal care
seeking. Children were most commonly brought to a health facility for vaccinations (86%), sick child care
(46%) and weighing (46%). Only 31% of children went in the month of the survey or the previous month, and
only 15% were weighed in the prior month, according to GMP recommendations.
Despite recent declines in urban Cambodia, breastfeeding practices remain high in rural areas. In this survey,
94% of children had been ever breastfed and 78% were exclusively breastfed for six months. Among the 22%
not exclusively breastfed, 61% was given prelacteal feeds the first day of birth. Ten percent have non-
maternal caregivers (mainly grandmothers).
However, complementary feeding practices for children over six months are not in line with global or
national recommendations. At NOURISH baseline, 26% of children 6-23 months were fed a minimum
acceptable diet in the past 24 hours. More breastfed children were appropriately fed than non-breastfed
children. Among breastfeeding children 9-23 months of age, 35% consumed a minimum acceptable diet in
the past 24 hours compared to 32% nationally (criteria include consumption of breastmilk in the
recommended frequency, food from at least four food groups, and at least three to four times in the past
day and night). However, among children 6-23 months of age not breastfeeding, only 7% consumed a
minimum acceptable diet in the past 24 hours compared to 26% nationally (criteria include consumption of
milk or milk products at least twice a day, four food groups, and at least four to five times per day (including
milk feeds) putting these children at greater risk for malnutrition. Like national data, children 6-8 months
were less likely than older children to be fed a minimum acceptable diet.
An important practice to address is feeding sweets and packaged snacks to children under two years of age.
In the past day, 43% of children had a sugary food such as sweets or biscuits and 31% had a packaged snack
food (i.e., chips).
As stunting sharply increases around nine months of age, stunting prevention requires targeted efforts to the
introduction of complementary food period. The survey found that less than half (46%) of children 9-11
months old ate a diverse diet needed for growth and development (including vegetables and animal source
foods) with recommended frequency in the past day.
It is important to note that this survey collected dietary information related outcome indicators; thus the
quantity of food consumed was not yet collected. This information will contribute to a more comprehensive
understanding of the complementary feeding situation.
Feeding practices during illness are also a concern. CDHS 2014 found that 13% of children under six
months had diarrhea in the past two weeks. Among children in this sample, during the last episode, only
24% were given more liquids during the illness and 22% were given more liquids in the week after illness as
recommended. CDHS 2014 indicated that 20% of children under six months had a fever in the past two
weeks. Among children in this sample, during the last episode, only 20% of caregivers gave the child more to
drink and 23% gave the child more to drink in the week after the illness.

NOURISH Project Baseline Survey Report 29
Feeding practices during illness also are suboptimal for children 6 to 59 months: 26% of children with
diarrhea were given increased fluids with continued feeding (i.e., more, the same amount as usual, or
somewhat less to eat). For fever, 16% of children with fever were given increased fluids and continued
feeding (i.e., more, the same amount as usual, or somewhat less).
The survey documented child care and development attitudes and practices as well; 63% of children under
two years received age-appropriate stimulation based on a composite indicator combining child care and
development standards and responsive feeding. This cannot be compared to national data because CDHS
asked only about children three to five years of age. The results of this survey highlight the need to expand
national and local attention on child care below the age of three, to include the time of fastest development-
- the first 1,000 days.
Eighty-two percent of children received some type of affection in the past three days (higher among children
under six months), but worryingly, 10% of children received no affection of any kind. Play was the most
common type of stimulation (82%), followed by going out (69%) and singing songs (66%). Just over half of
children were praised, asked questions or taught something new in the past three days. Fewer children
were taught to count (29%) or told stories (16%). The primary caregiver was generally the only person over
15 years engaged in any of these activities with the children.
Negative discipline methods are prevalent, and increase with the child’s age: 43% of children 0-23 months
were yelled at or criticized and 39% of children were hit in the past three days, nearly always by the mother.
No child under six months was hit.
Responsive feeding practices are largely positive, especially for children under six months of age. Three-
quarters (76%) of caregivers respond to children’s cues on hungry and fullness when deciding when to feed
and when to stop feeding; 89% also encouraged the child to eat. However, the findings highlighted key areas
to improve related to attitudes and practices related to child feeding: only 13% of caregivers track the
quantity of food a child eats. Half believed that children should be able to eat whatever they want for a
snack.
The NOURISH Project aims to improve each key health and nutrition indicators by at least 10%. The project
targets a 25% increase in the percentage of children 9-11 months who get a diverse diet with frequency) to
focus efforts on key behaviors to impact stunting prevention.
Water, Sanitation and Hygiene Key Findings
In the project area, 37% of respondents’ had an improved, not shared, sanitation facility (confirmed by
observation) while 42% of had no access to any type of facility. However, it is important to note that only
households of women of reproductive age and young children were sampled in this survey while the
NOURISH Project is working on community-wide sanitation of all households to achieve open defecation
free status of the entire community.
Interviewers observed the treatment and storage of water for drinking. Nearly one-third of women do not
treat drinking water. Forty-three percent followed recommended water treatment practices by boiling and
keeping water in the same container, or filtering water. Among those who treat water, most kept the water
in the same container or transferred it to a covered container. Filter cleaning should be addressed: 18% of
filters observed looked dirty and most were reported to be cleaned too often (once a week or more
frequently). The recommended cleaning frequency is once per month to avoid breakage or contamination.
Two-thirds of women’s households had a place for hand washing with water and soap and one-third of
women’s households had a designated handwashing station with soap. However, only one-third of
households with an improved latrine had a hand washing station with soap and water in proximity to the
latrine.

NOURISH Project Baseline Survey Report 30
Home hygiene was also suboptimal: 32% of homes with children under two years had feces left in the open
at the time of interview, primarily animal feces but also some children’s. Half of the food (observed in 23%
of households) was left unprotected from flies.
Nearly half of parents/caregivers reported that children’s stools are not hygienically contained in a latrine or
buried—decreasing with age as children learn to use latrines. The proportion of children’s whose stools are
hygienically contained was similar to CDHS findings for children under two years, consistent with the large
proportion of children under two in this sample.
The NOURISH Project aims to improve sanitation and hygiene behaviors by at least 20%. The target is 25%
increase in the percentage of households using an improved, not shared latrine.
Agriculture
Research in Cambodia links household food security and maternal thinness.27 The Ministry of Agriculture,
Forestry and Fisheries (MAFF)’s Policy and Strategic Framework on Childhood Development and Protection
Strategy in the Agriculture Sector recommends that families of pregnant women and young children raise
nutrient-rich vegetables at home. At NOURISH baseline, although two-thirds of women have some type of
plant growing in the household compound, only 40% of women grow nutrient-rich vegetables at home.
Out of those who grow nutrient-rich vegetables, most (89%) women said that they and other adults in their
household eat the vegetables they grow; few sell any of what they grow. However, only half of the children
age 6-59 months in households that grow vegetables eat what is grown.
The survey findings highlight the urgency for accelerated efforts to improve nutrition of women and children
by integrating health and nutrition, WASH and agriculture interventions for the benefit of children in the
“first 1,000 days”.
The NOURISH Project aims to improve agriculture practices for nutrition in “first 1,000 day” households
indicators by at least 10%.
27 C M McDonald, Household food insecurity and dietary diversity as correlates of maternal and child undernutrition in
rural Cambodia. European Journal of Clinical Nutrition (2015) 69, 242–246

NOURISH Project Baseline Survey Report 31
ANNEX I: Data Collection Protocol
Data Collection and Analysis Baseline and End-line
The baseline survey was cross-sectional to examine the prevalence of key indicators among the defined
project target population at a single point in time, as well as the relationship between these indicators and
socio-demographic characteristics. The cross-sectional data will be used for programming targeting purposes
and to compare to the endline survey at the end of the project. The endline survey will similarly be cross-
sectional to collect information on key indicators at a single point in time. Longitudinal or panel data will not
be collected.
Instruments
The questionnaires were developed by NOURISH based on validated questions of the CDHS and Feed the
Future modules.28 Questionnaires included sections on anemia testing, anthropometry and interview
questions including: background characteristics (e.g. age, family structure, work), knowledge and attitudes
towards related contextual issues such as perceptions of food for children, care practices and women’s
confidence, and behaviors on diet/feeding, and sanitation and hygiene.
Indicator Instrument
HemoCue Measures
Prevalence of anemia among women of
reproductive age and pregnant women
Women of reproductive age
Prevalence of anemia among children 6-59 months Caregiver of children under 5
Anthropometric Measures
Prevalence of underweight women Women of reproductive age
Prevalence of stunted children <5 Caregiver of children under 5
Prevalence of wasted children <5 Caregiver of children under 5
Prevalence of underweight children <5 Caregiver of children under 5
Questionnaires
Women’s Dietary Diversity: Mean number of food
groups consumed by women of reproductive age
Women of reproductive age
Prevalence of exclusive breastfeeding of children
under 6 months
Caregiver of children under 5
% of children age 9-11 months who received enriched
food with frequency in the last 24 hours Caregiver of children under 5
Prevalence of children 6-23 months receiving a
minimum acceptable diet
Caregiver of children under 5
% parents/caregivers of children 0-23 months
providing age-appropriate stimulation of children
Caregiver of children under 5
% children <5 who had diarrhea in prior 2 weeks Caregiver of children under 5
% of households in the target area using an
improved latrine
Caregiver of children under 5
% of households practicing correct use of
recommended HH water treatment technologies
Caregiver of children under 5
% of households with soap and water at a hand
washing station commonly used by family members
Caregiver of children under 5
% of caregivers disposing of feces appropriately Caregiver of children under 5
28 Feed the Future M&E Guidance Series. Volume 8: Population-Based Survey Instrument for Feed the Future Zone of Influence Indicators with Revised WEAI Module, October 2012

NOURISH Project Baseline Survey Report 32
Prior to training the interviewers, selected surveyors and NOURISH staff piloted the questionnaire for
language, understanding, skip patterns, as well as time, and then corrected.
Training of Researchers
The Royal University of Agriculture and the NOURISH M&E Unit trained the data collectors. The four-day
training included key principles of interviewing, practice using each questionnaire, and practice in the field to
identify households, select respondents and conduct interviews using the questionnaires and record the
answers.
Health workers weighed and measured women and children to ensure that weights and heights were read
and recorded correctly and consistently across locations, following training detailed in the FANTA Guide.29
Health workers conducted HemoCue measures.
Data Collection
The interviews were conducted at each respondent’s home in a location of their choice. All efforts were
made to find a private and quiet place for the interview, away from other people.
Anthropometric data were assessed at a central location in the village decided by the Village Chief, such as
the village chief’s home or the community meeting hall. The reason it was done publically is because calling
caregivers together is common practice in Cambodia, for immunization, Vitamin A distribution, outreach
(including weighing for remote villages).
Prior to data collection, the interviewers obtained verbal consent from the respondent or caregiver of the
child. This was done by reading the consent form aloud which explained the purpose and process of the
study and clarified that participation was voluntary with no penalties for refusing to participate. If the woman
agreed, she was asked to sign or provide a thumbprint as a sign of consent.
Children were weighed with minimal clothes. Children were weighed and measured twice, following
standard guidance. Children under two years were measured lying down while children over two years were
measured standing up.
Following the weighing and measurements, any caregiver of a child who is classified as severely malnourished
was referred to the health system in collaboration with health workers.
Unique Identifier Codes
Each household was given a unique identifier code based on the Commune, Village, the type of respondent
(W = women of reproductive age; C = caregiver; H = household head) and the number of the interview.
The code was comprised of the first letter of the Province, first letter of the Commune, first letter of the
Village, and the number of the interview.
Data Quality and Management
Anthropometrists and interviewers were trained for one week prior to the field work. The training will
included time for demonstration and practice with feedback. Anthropometrists were trained using proven
methods to standardize data30. RUA was responsible for hiring researchers and conducting the training;
NOURISH will provide technical oversight of the data collectors’ training.
RUA Supervisors and NOURISH staff conducted spot checks on data cleaning, coding and entry.
To prevent losing any of the entered data, the data entry supervisor will back up the data entered on
individual computers weekly.
29 Cogill, Bruce. 2003. Anthropometric Indicators Measurement Guide. Washington, DC: Food and Nutrition Technical Assistance (FANTA) Project, FHI 360. 30 Cogill, Bruce. 2003. Anthropometric Indicators Measurement Guide. Washington, DC: Food and Nutrition Technical Assistance (FANTA) Project, FHI 360.

NOURISH Project Baseline Survey Report 33
Data Analysis
The data were entered into Excel and analyzed with SPSS. With the data sets that show each variable, the
analysis prepared the results according to NOURISH indicators. For some indicators, analysis disaggregated
the results by sex and age, as per the Performance Indicator Reference Sheets in the NOURISH Project
Monitoring and Evaluation Plan.
Ethical Considerations
In keeping USAID’s policy (22 CFR Part 225), NOURISH received approval to conduct research in
compliance with US federal standards for human subject research with review. The baseline survey was
approved by the Cambodia National Ethics Committee (NEC) for Health Research as well as the internal
Save the Children Ethics Review Committee (ERC).
Informed Consent: Participation in the survey was voluntary. Prior to participation, caregivers were be
informed that they have no obligation to participate and would face no penalty or consequence if they
choose not to participate. If they agreed, they were informed that they were free to withdraw from the
study at any time, again with no penalty or consequence. On the day of the survey, interviewers read the
consent statement aloud and discussed it with the participant before consent. Consent forms will be kept in
a locked cabinet in the Battambang NOURISH office for 1 year, and then destroyed.
For all minors under the age of 18 years, the primary caregiver or guardian was asked for consent. For
young children under five years of age, the caregiver was requested to sign (or give a thumbprint) as a sign of
consent prior to their interview and the measurement of the child.
Confidentiality: Confidentiality was ensured during all stages of the study. Each woman’s age and each child’s
date of birth and sex was recorded, but no names or other identifying characteristics of women, individual
caregivers and children.
Electronic versions SPSS computer files containing these identifiers (birthdate) are password protected (both
in the local data collection firm and NOURISH office). The final data set can be accessed by RUA Supervisors
and Analysts, and the NOURISH staff. If ever reported or shared, findings will be reported by province,
rather than by village or commune, to further protect individual confidentiality.
Respect for Respondent’s Rights: Respondents were informed of all risks and protections in the written
consent form. Participants were informed of their right to withdraw from the study and to not answer any
questions they do not feel comfortable answering. Respondents were also provided with contact
information for a local contact should they have any further questions or concerns.
NOURISH carefully assessed potential risks and benefits for respondents, and aimed to eliminate or
minimize all possible risks. A potential risk is that children who are malnourished may not be identified due
to human error in weighing and measuring children. To minimize the potential risk of incorrectly identifying
a malnourished child, a Type II error (false negative) in which a malnourished child is classified as normal,
NOURISH will use only trained and experienced anthropometrists to conduct weighing and measuring. The
nutritionist on NOURISH staff will conduct a (refresher) training of experienced anthropometrists.
Furthermore, the same persons will do the weighing and measuring throughout the baseline in all villages to
ensure consistency.
There may be minimal psychological risk that may arise from some questions that some participants may find
to be sensitive. To minimise this risk, participants will be advised that they can decline to answer questions
that make them uncomfortable. Additionally, participants will be assured that refusal to participate will not
affect any services or care they would like to receive from the government of Cambodia or any other
service provider.

NOURISH Project Baseline Survey Report 34
Families and children will benefit by receiving the weight and height screening. Any child who is under the
standard weight and/or height for her/his age will be offered follow-up counseling through the regular
systems established by the project- trained Village Health Support Group and health workers. Additionally,
staff supported referrals to health centers or referral hospitals for any children are seriously ill or severely
malnourished not growing well (-3 SD), or for any other concerns that caregivers may have. Any child from
a poor family referred to a referral hospital will receive funds for transportation through the Health Equity
Fund.
Women of reproductive age who were weighed and measured who have a low body mass index (BMI)
received follow up counseling through the regular systems established by the project-trained Village Health
Support Group and health workers.
Participants were informed that theirs and other Cambodian communities will benefit because information
gained from this study will allow for more informed decision-making in programme design and service
delivery.

NOURISH Project Baseline Survey Report 35
ANNEX II: Data Tables
Demographics
Women’s Demographic Tables
Table 15 Respondents by Category, Province and Age
Ages
Caregivers of
Children 0- 59
months
Women
Reproductive
Age
Pregnant
Women
Total
N % N % N % N %
Battambang
< 20 43 13.0% 23 24.0% 34 21.7% 100 17.2%
20-29 161 48.8% 39 40.6% 82 52.2% 282 48.4%
30-39 87 26.4% 26 27.1% 37 23.6% 150 25.7%
40-49 17 5.2% 8 8.3% 4 2.5% 29 5.0%
50-59 15 4.5% 0 0.0% 0 0.0% 15 2.6%
> 60 7 2.1% 0 0.0% 0 0.0% 7 1.2%
Total 330 100% 96 100% 157 100% 583 100%
Siem Reap
< 20 44 12.2% 27 25.5% 24 14.5% 95 15.0%
20-29 195 54.0% 39 36.8% 95 57.6% 329 52.1%
30-39 90 24.9% 30 28.3% 44 26.7% 164 25.9%
40-49 23 6.4% 10 9.4% 2 1.2% 35 5.5%
50-59 5 1.4% 0 0.0% 0 0.0% 5 .8%
> 60 4 1.1% 0 0.0% 0 0.0% 4 .6%
Total 361 100% 106 100% 165 100% 632 100%
Pursat
< 20 6 8.0% 12 57.1% 8 22.2% 26 19.7%
20-29 44 58.7% 5 23.8% 20 55.6% 69 52.3%
30-39 24 32.0% 4 19.0% 8 22.2% 36 27.3%
40-49 1 1.3% 0 0.0% 0 0.0% 1 .8%
Total 75 100% 21 100% 36 100% 132 100%
TOTAL 766 223 358 1,347
Table 16 Women’s Marital Status, by Province
Marital
status Battambang Siem Reap Pursat Total
N % N % N % N %
Married 531 96.7% 566 96.4% 110 94.8% 1207 96.4%
Widowed 12 2.2% 10 1.7% 5 4.3% 27 2.2%
Divorced 6 1.1% 8 1.4% 1 0.9% 15 1.2%
No answer 0 0.0% 3 0.5% 0 0.0% 3 0.2%
Total 549 100% 587 100% 116 100% 1252 100%

NOURISH Project Baseline Survey Report 36
Table 17 Women’s Education, by Province
Battambang Siem Reap Pursat Total
N % N % N % N %
Illiteracy 13 2.2% 19 3.0% 2 1.5% 34 2.5%
Primary 302 51.8% 300 47.5% 63 47.7% 665 49.4%
Secondary 146 25.0% 124 19.6% 36 27.3% 306 22.7%
High 53 9.1% 66 10.4% 12 9.1% 131 9.7%
Above High 5 0.9% 2 0.3% 1 0.8% 8 0.6%
No answer 64 11.0% 121 19.1% 18 13.6% 203 15.1%
Total 583 100% 632 100% 132 100% 1347 100%
Table 18 Women’s Occupation
Total
N %
Farmer 576 42.8%
Stay at home 362 26.9%
Daily labor 191 14.3%
Seller 110 8.2%
Construction/ factory 21 1.6%
Unemployed 31 1.9%
Other 48 2.3%
Missing 8 1.6%
Total 1,347 100%
Table 19 Women’s Occupation, by Category of Respondent
Caregivers
Women of
Reproductive
Age
Pregnant
Women Total
N % N % N % N %
Farmer 332 43.3% 98 43.9% 146 40.8% 576 42.8%
Stay at home 162 21.1% 47 21.1% 153 42.7% 362 26.9%
Daily labor 178 23.2% 10 4.5% 3 0.8% 191 14.3%
Seller 48 6.3% 27 12.1% 35 9.8% 110 8.2%
Construction
/ factory 7 0.9% 7 3.1% 7 2.0% 21 1.6%
Unemployed 7 0.9% 21 9.4% 3 0.8% 31 1.9%
Other 30 3.9% 8 3.6% 10 2.8% 48 2.3%
Missing 2 0.3% 5 2.2% 1 0.3% 8 1.6%
Total 766 100% 223 100% 358 100% 1,347 100%

NOURISH Project Baseline Survey Report 37
Table 20 Husbands’ Education, by Province
Battambang Siem Reap Pursat Total
N % N % N % N %
Illiteracy 10 2.1% 10 2.2% 0 0.0% 20 2.0%
Primary 231 48.0% 255 56.8% 39 42.9% 525 51.4%
Secondary 154 32.0% 111 24.7% 32 35.2% 297 29.1%
High 60 12.5% 56 12.5% 18 19.8% 134 13.1%
Above High 15 3.1% 2 0.4% 2 2.2% 19 1.9%
No answer 11 2.3% 15 3.3% 0 0.0% 26 2.5%
Total 481 100% 449 100% 91 100% 1021 100%
Table 21 Husbands’ Occupation
N %
Other 108 9.0
Farmer 735 61.0
Factory 24 2.0
Seller 48 4.0
Motor taxi 18 1.5
Construction/Carpenter 138 11.5
Teacher/official 59 4.9
Unemployed 9 .7
Daily labor 66 5.5
Total 1205 100%
Table 22 Caregivers' Husbands' Location of Work: In or Outside of Village, by Province
Battambang Siem Reap Pursat Total
N % N % N % N %
In village 227 73.0% 297 88.1% 61 88.4% 585 81.6%
Outside 84 27.0% 40 11.9% 8 11.6% 132 18.4%
Total 311 100% 337 100% 69 100% 717 100%
Table 23 Among Husbands who Work Outside of Village, Location of Work, by Province
Battambang Siem Reap Pursat Total
N % N % N % N %
In Cambodia 36 42.9% 14 36.8% 3 37.5% 53 40.8%
Thailand 45 53.6% 22 57.9% 5 62.5% 72 55.4%
Other 3 3.6% 1 2.6% 0 -- 4 3.1%
Don't know 0 -- 3 2.6% 0 -- 3 0.8%
Total 84 100% 40 100% 8 100% 132 100%

NOURISH Project Baseline Survey Report 38
Children’s Demographic Tables
Table 24 Number of Children under Caregiver’s Supervision, by Province
Battambang Siem Reap Pursat Total
N % N % N % N %
1 202 61.2% 231 64.0% 48 64.0% 481 62.8%
2 109 33.0% 114 31.6% 24 32.0% 247 32.2%
3 13 3.9% 12 3.3% 3 4.0% 28 3.7%
4 5 1.5% 2 .6% 0 - 7 .9%
5 1 .3% 1 .3% 0 - 2 .3%
8 0 - 1 .3% 0 - 1 .1%
Total 330 100% 361 100% 75 100% 766 100%
Table 25 Type of Relationship to Child, by Province
Battambang Siem Reap Pursat Total
N % N % N % N %
Mother 274 83.0% 335 92.8% 71 94.7% 680 88.8%
Aunt 20 6.1% 5 1.4% 4 5.3% 29 3.8%
Grandmother 36 10.9% 21 5.8% 0 0.0% 57 7.4%
Total 330 100% 361 100% 75 100% 766 100%
Table 26 Children’s Ages, by Province
Battambang Siem Reap Pursat Total
N % N % N % N %
0-5 157 47.6% 173 48.1% 41 55.4% 371 48.6%
6-11 80 24.2% 78 21.7% 19 25.7% 177 23.2%
12-23 73 22.1% 91 25.3% 8 10.8% 172 22.5%
24-35 13 3.9% 13 3.6% 4 5.4% 30 3.9%
36-47 5 1.5% 5 1.4% 1 1.4% 11 1.4%
48-60 2 0.6% 0 0.0% 1 1.4% 3 .4%
Total 330 100% 360 100% 74 100% 764 100%

NOURISH Project Baseline Survey Report 39
Table 27 Children’s Ages and Sex, by Province
Provinces Age in
months Female Male Total
N % N % N %
Battambang
0-5 70 43.2% 86 53.8% 156 48.4%
6-11 42 25.9% 32 20.0% 74 23.0%
12-23 42 25.9% 30 18.8% 72 22.4%
24-35 6 3.7% 7 4.4% 13 4.0%
36-47 1 .6% 4 2.5% 5 1.6%
48-60 1 .6% 1 .6% 2 .6%
Total 162 100% 160 100% 322 100%
Siem Reap
0-5 80 48.5% 92 48.9% 172 48.7%
6-11 30 18.2% 42 22.3% 72 20.4%
12-23 47 28.5% 44 23.4% 91 25.8%
24-35 6 3.6% 7 3.7% 13 3.7%
Total 165 100% 188 100% 353 100%
Pursat
0-5 20 60.6% 21 51.2% 41 55.4%
6-11 9 27.3% 10 24.4% 19 25.7%
12-23 1 3.0% 7 17.1% 8 10.8%
24-35 2 6.1% 2 4.9% 4 5.4%
36-47 1 3.0% 0 0.0% 1 1.4%
48-60 0 0.0% 1 2.4% 1 1.4%
Total 33 100% 41 100% 74 100%
TOTAL 360 389 749
Table 28 Observation of Child’s Birth Certificate, by Province
Battambang Siem Reap Pursat Total
N % N % N % N %
Yes observed 185 56.1% 235 65.1% 38 50.7% 458 59.8%
Yes, not observed 71 21.5% 68 18.8% 21 28.0% 160 20.9%
No 65 19.7% 50 13.9% 16 21.3% 131 17.1%
Don't know 9 2.7% 8 2.2% 0 0.0% 17 2.2%
Total 330 100% 361 100% 75 100% 766 100%

NOURISH Project Baseline Survey Report 40
Table 29 Poverty Status, by Respondent Category and Province
Category Battambang Siem Reap Pursat Total
Yes
(ID Poor
Card
observed)
Caregiver 90 69 11 170
56.6% 63.9% 47.8% 58.6%
Women of
Reproductive Age
(WRA)
31 12 6 49
19.5% 11.1% 26.1% 16.9%
Pregnant Women 38 27 6 71
23.9% 25.0% 26.1% 24.5%
Total 159 108 23 290
100% 100% 100% 100%
Yes
(ID Poor
Card not
observed)
Caregivers 12 32 5 49
29.3% 69.6% 83.3% 52.7%
WRA 13 5 0 18
31.7% 10.9% 0.0% 19.4%
Pregnant Women 16 9 1 26
39.0% 19.6% 16.7% 28.0%
Total 41 46 6 93
100% 100% 100% 100%
Yes
(ID Poor
Card
expired)
Caregivers 17 13 0 30
100% 100% 100%
Total 17 13 0 30
100% 100% 100%
No
Caregivers 211 246 59 516
58.4% 53.6% 57.3% 55.9%
WRA 49 86 15 150
13.6% 18.7% 14.6% 16.3%
Pregnant Women 101 127 29 257
28.0% 27.7% 28.2% 27.8%
Total 361 459 103 923
100% 100% 100% 100%
Do not
know/
missing
Caregiver 0 1 0 1
100% 100%
Pregnant Women 2 0 0 2
100% 100%
Total 2 0 0 2
100% 100%
Total
Caregiver 330 361 75 766
56.9% 57.6% 56.8% 57.2%
WRA 93 103 21 217
16.0% 16.4% 15.9% 16.2%
Pregnant Women 157 163 36 356
27.1% 26.0% 27.3% 26.6%
TOTAL 580 627 132 1339
100% 100% 100% 100%

NOURISH Project Baseline Survey Report 41
Health and Nutrition
Maternal Health and Nutrition Tables Table 30 Sources of Antenatal Care (ANC)
N %
National Hospital 2 0.3%
Provincial Hospital 76 10.7%
Private Facility 14 2.0%
Health Center 587 82.7%
Health Post 4 0.6%
No health facility-based ANC 23 3.2%
No answer 4 0.6%
Total 710 100%
Table 31 Timing of First ANC Visit
N %
<3 months 546 76.9%
4-5 months 115 16.2%
6-7 months 20 2.8%
8 or more months 9 1.3%
Don't know/missing 20 2.8%
Total 710 100%
Table 32 Number of ANC Visits
N %
1 9 1.3%
2-3 70 9.9%
4+ 600 84.5%
Don't know/missing 31 4.4%
Total 710 100%
Table 33 Days of Iron Supplementation
N %
>30 days 0 0%
30-89 days 164 27.2%
90 days 437 63.2%
>90 days 109 15.8%
Total 710 100%

NOURISH Project Baseline Survey Report 42
Table 34 Delivery Location
N %
National Hospital 4 0.6%
Provincial Hospital 138 19.6%
Health Center 505 71.1%
Health Post 1 0.0%
Private Hospital 16 2.3%
Private Clinic 11 1.6%
Own Home 13 1.8%
Midwife/TBA’s home 3 0.4%
Other 19 2.7%
Total 710 100%
Table 35 Source of Postnatal care
N %
Doctor/medical assistant 64 9.0%
Midwife 431 60.7%
Nurse 100 14.1%
Traditional birth attendant 2 0.3%
None 113 15.9%
Total 710 100%
Table 36 Birthweight (Mother’s Recall)
N %
Very large 36 5.1%
Larger than average 250 35.5%
Average 336 47.7%
Smaller than average 69 9.8%
Very small 9 1.3%
Do not know/missing 6 0.6%
Total 710 100%

NOURISH Project Baseline Survey Report 43
Table 37 Birth Weight (Recorded)
N %
<2.5kg 23 5.1%
2.5-3.5kg 352 78.7%
3.6-4.5kg 71 15.9%
>4.5kg 1 0.2%
Total 447 100%
Average (3.1) Minimum (1.5) Maximum (5)
Table 38 BMI Women of Reproductive Age
N %
<18.5 (thin) 33 14.8%
18.5-24.9 (normal) 148 66.4%
>25 (overweight) 36 16.1%
Missing 6 2.7%
Total 223 100%
Table 39 BMI Women of Reproductive Age, by Province
Battambang Siem Reap Pursat Total
N % N % N % N %
Total Underweight <18.5 16 16.7% 10 6.8% 7 33.3% 33 14.8%
BMI <17 2 2.1% 3 2.9% 2 9.5% 7 3.1%
BMI 17-18.4 14 14.6% 4 3.9% 3 14.3% 21 9.4%
Normal Weight 18.5-24.9 58 60.4% 77 74.8% 13 61.9% 148 66.4%
Overweight >25 18 18.8% 17 16.5% 1 4.8% 36 16.1%
Missing 4 4.2% 2 1.9% 0 0.0% 6 2.7%
Total 96 100% 106 100% 21 100% 223 100%
Table 40 Prevalence of Anemia, Women of Reproductive Age
N %
Any anemia 90 41.5%
<7 g/dl severe anemia 9 4.1%
7-9.9g/dl moderate anemia 19 8.8%
10-11.9 g/dl mild anemia 62 28.6%
No anemia (>12 g/dl) 127 58.5%
Total 217 100%

NOURISH Project Baseline Survey Report 44
Table 41 Prevalence of Anemia, Pregnant Women
N %
Any anemia 97 52.4%
<9 g/dl severe anemia 23 12.4%
9-9.9g/dl moderate anemia 20 10.8%
10-10.9 g/dl mild anemia 54 29.2%
No anemia (>11 g/dl) 88 47.6%
Total 185 100%
Table 42 Women’s Dietary Diversity
Battambang Siem Reap Pursat Total
N % N % N % N %
Staples (rice) 250 20.5% 268 22.2% 56 19.2% 574 21.1%
Beans, Nuts and Seeds 118 9.7% 119 9.9% 30 10.3% 267 9.8%
Cheese, yogurt or other
milk products
71 5.8% 47 3.9% 13 4.5% 131 4.8%
Ducks or chicken eggs 87 7.1% 79 6.6% 28 9.6% 194 7.1%
Liver, kidney, heart or other
organ meats
23 1.9% 25 2.1% 7 2.4% 55 2.0%
Flesh foods 242 19.9% 244 20.2% 57 19.5% 543 20.0%
Dark green leafy vegetables 156 12.8% 132 11.0% 44 15.1% 332 12.2%
Orange vegetables and fruits 107 8.8% 119 9.9% 24 8.2% 250 9.2%
Other fruits and vegetables 163 13.4% 172 14.3% 33 11.3% 368 13.6%
Total 1,217 100% 1,205 100% 292 100% 2,714 100%
Child Health and Nutrition Tables
Table 43 Timing of Child's Most Recent Visit to Health Center, by Province
Battambang Siem Reap Pursat Total
N % N % N % N %
This month 58 17.6% 67 18.6% 9 12.0% 134 17.5%
1 month ago 39 11.8% 56 15.5% 9 12.0% 104 13.6%
2-3 months ago 116 35.2% 112 31.0% 33 33.3% 261 34.1%
4-5 months ago 37 11.2% 28 7.8% 10 13.3% 75 9.8%
6 months ago 11 3.3% 12 3.3% 4 5.3% 27 3.5%
Over 6 months 33 10.0% 39 10.8% 3 4.0% 75 9.8%
Don't remember/ missing 36 10.9% 47 13.0% 7 9.3% 90 11.7%
Total 330 100% 361 100% 75 89% 766 100%

NOURISH Project Baseline Survey Report 45
Table 44 Services Received during Most Recent Visit to a Health Facility
N % % of cases
Vaccination 623 34.9% 85.9%
GMP 336 18.8% 46.3%
Sick child care: medicine 335 18.8% 46.2%
Sick child care: IV 313 17.5% 43.2%
Counseling 155 8.7% 21.4%
Other 24 1.3% 3.3%
Total 1,786 100% 246.3%
Table 45 Prevalence of Anemia, Children, by Province
Battambang Siem Reap Pursat Total
N % N % N % N %
Any anemia (<11 g/dl) 77 44.0% 65 82.3% 29 85.3% 170 59.4%
<7 g/dl severe anemia 9 5.1% 2 2.5% 3 8.8% 14 4.9%
7-9.9g/dl moderate anemia 28 16.0% 31 39.2% 16 47.1% 75 26.0%
10-10.9 g/dl mild anemia 40 22.9% 32 40.5% 10 29.4% 81 28.5%
No anemia (>11 g/dl) 98 56.0% 14 17.7% 5 14.7% 117 40.6%
Total 175 100% 79 100% 34 100% 287 100%
Infant and Young Child Feeding Tables
Table 46 Breastfeeding Practices
Ever Breastfed Exclusive
Breastfeeding
N % N %
Yes 722 94.3% 298 77.8%
No 29 3.8% 85 22.2%
Do not know/missing 15 1.9% -- --
Total 766 100% 383 100%
Table 47 Exclusive Breastfeeding among Children 0-5 Months, by Sex and Province
Battambang Siem Reap Pursat Total
N % N % N % N %
Exclusive
Breastfeeding 126 75.9% 142 79.8% 30 76.9% 298 77.8%
Girls 59 74.7% 68 81.9% 15 78.9% 142 78.5%
Boys 67 77.0% 74 77.9% 15 75.0% 156 77.2%
Non-Exclusive
Breastfeeding 40 24.1% 36 22.2% 9 23.1% 85 22.2%
Girls 20 25.3% 15 18.1% 4 21.1% 39 21.5% Boys 20 23.0% 21 22.1% 5 25.0% 46 22.8%
Total 166 100% 178 100% 39 100% 383 100%

NOURISH Project Baseline Survey Report 46
Table 48 Liquids Other than Breastmilk Given, Children 0-5 Months
Table 49 Times Breastfed in Past 24 Hours
N %
< 5 times 63 20.1%
5-10 times 143 45.5%
11-15 times 59 18.8%
> 15 times 49 15.6%
Total 314 100%
N Minimum Maximum Mean Std. Deviation
314 1 35 10.5 5.5945
Table 50 Duration of Breastfeeding
N %
< 5 minutes 104 33.9%
5-10 minutes 91 29.6%
11-15 minutes 37 12.1%
> 15 minutes 75 24.4%
Total 307 100%
N Minimum Maximum Mean Std. Deviation
307 0.5 60 12.9 10.897
(Multiple answers) N %
Prelacteal feed 48 12.5%
Water 36 9.5%
Infant formula 35 9.2%
Milk 29 7.7%
Juice 1 0.3%
Soup broth 4 1.1%
Borbor 9 2.4%
Other liquids 14 3.7%
Vitamin drops or medicine 15 3.9%
Orasel
5 1.3%

NOURISH Project Baseline Survey Report 47
Table 52 Fish Consumption in Past 24 Hours
Any fish consumed Small Fish
N % N %
6-8 months 5 20.8% 9 15.0%
9-11 months 20 52.6% 10 11.0%
12-23 months 89 64.5% 33 20.0%
24-59 months 180 41.5% 9 20.5%
Total 294 46.4% 61 16.9%
Table 53 Sweets and Packaged Snacks Consumption in Past 24 Hours
Sweets Packaged Snacks
N % N %
Yes 147 42.5% 107 30.9%
No 192 55.5% 229 66.2%
Do not know 7 2.0% 10 2.9%
Total 342 100% 346 100%
Table 54 Feeding Practices During and After Fever 0-5 Month Olds
Drink Given
During Fever
Drink Given After
Fever
Food Given During
Fever
Food Given 1
Week After Fever
N % N % N % N %
Much Less 4 1.5% 1 0.4% 1 0.4% 0 0.0%
Somewhat Less 42 16.1% 16 6.1% 20 7.6% 6 2.3%
About the Same 117 44.8% 127 48.5% 64 24.4% 68 26.0%
More 51 19.5% 56 21.4% 20 7.6% 27 10.3%
Much More 0 0.0% 3 1.1% 2 0.8% 0 0.0%
Never Gave 23 8.8% 46 17.6% 136 51.9% 144 55.0%
Do not know 25 9.2% 13 5.0% 19 7.3% 17 6.5%
Total 262 100% 262 100% 262 100% 262 100%
Table 51 Children 6-59 Months Food Consumption, by Type of Food and Province
Battambang
(n=164)
Siem Reap
(n=183)
Pursat
(n=36)
Total
(n=383)
N % N % N % N %
Milk products 130 79.3% 133 72.7% 32 88.9% 295 77.0%
Grains (rice) 157 95.7% 163 89.1% 32 88.9% 356 91.9%
Vitamin A-rich fruits
and veg. 57 34.8% 78 42.6% 9 25.0% 144 37.6%
Other fruits & veg. 106 64.6% 115 62.8% 18 50.0% 239 62.4%
Eggs 54 32.9% 62 33.9% 12 33.3% 128 33.4%
Animal source foods 126 76.8% 138 75.4% 21 58.3% 285 74.4%
Nuts 59 36.0% 47 25.7% 8 22.2% 114 29.8%

NOURISH Project Baseline Survey Report 48
Table 55 Feeding Practices During and After Diarrhea 6-59 Month Olds
Drink Given
During Diarrhea
Drink Given
After Diarrhea
Food Given
During Diarrhea
Food Given 1 Week
After Diarrhea
N % N % N % N %
Much Less 5 1.5% 1 0.3% 27 8.3% 3 0.9%
Somewhat Less 45 13.8% 27 8.3% 97 29.7% 46 14.1%
About the Same 97 29.7% 185 56.6% 104 31.8% 174 53.2%
More 136 41.6% 85 26.0% 51 15.6% 67 20.5%
Much More 24 7.3% 8 2.4% 6 1.8% 2 0.6%
Stopped 1 0.3% 0 0.0% 3 0.9% 0 0.0%
Never Gave 0 0.0% 0 0.0% 20 6.1% 12 3.7%
Do not know 19 5.8% 21 6.4% 19 5.8% 23 7.0%
Total 327 100% 327 100% 327 100% 327 100%
Table 56 Feeding Practices During and After Fever 6-59 Month Olds
Drink Given
During Fever
Drink Given
After Fever
Food Given
During Fever
Food Given 1 Week
After Fever
N % N % N % N %
Much Less 7 2.1% 2 0.6% 18 5.5% 2 0.6%
Somewhat Less 98 30.0% 30 9.2% 135 41.3% 47 14.4%
About the Same 123 37.6% 210 64.2% 117 35.8% 195 59.6%
More 95 29.1% 72 22.0% 33 10.1% 64 19.6%
Much More 0 0.0% 0 0.0% 0 0.0% 5 1.5%
Never Gave 0 0.0% 0 0.0% 1 0.3% 1 0.3%
Do not know 1 0.3% 8 2.4% 8 2.4% 9 2.8%
Total 324 100% 322 100% 312 100% 323 100%

NOURISH Project Baseline Survey Report 49
Child Care and Development Tables
Table 57 Positive Stimulation in Past 3 Days, Children 0-23 Months, by Type of Caregiver
Told stories Sang songs Took out Played Counted Taught
something
New
Ask
questions
Praise for
learning new
Show
affection
Mother 33 8.6% 180 47.0% 188 49.1% 180 47.0% 54 14.1% 151 39.4% 152 39.7% 157 41.0% 246 64.2%
Father 5 1.3% 21 5.5% 38 9.9% 27 7.0% 11 2.9% 17 4.4% 11 2.9% 15 3.9% 13 3.4%
Grandmother 17 4.4% 31 8.1% 37 9.7% 42 11.0% 17 4.4% 26 6.8% 30 7.8% 35 9.1% 39 10.2%
Other 7 1.8% 21 5.5% 40 10.4% 64 16.7% 30 7.8% 20 5.2% 17 4.4% 8 2.1% 14 3.7%
No one 276 72.1% 103 26.9% 53 13.8% 35 9.1% 230 60.1% 138 36.0% 134 35.0% 133 34.7% 37 9.7%
Missing 45 11.7% 27 7.0% 27 7.0% 35 9.1% 41 10.7% 31 8.1% 39 10.2% 35 9.1% 34 8.9%
100% 100% 100% 100% 100% 100% 100% 100% 100%
Table 58 Negative Discipline in Past 3 Days, Children 0-23 Months
Hit Yell or Criticize
N % N %
Mother 109 28.5% 127 33.2%
Father 6 1.6% 6 1.6%
Grandmother 25 6.5% 20 5.2%
Other 8 2.1% 10 2.6%
No answers/Missing 30 7.8% 37 9.7%
No one 205 53.5% 183 47.8%
Total 383 100% 383 100%

NOURISH Project Baseline Survey Report 50
Water, Sanitation and Hygiene (WASH) Tables
Table 59 Water Treatment before Drinking, by Method and Province
Battambang Siem Reap Pursat Total
N % N % N % N %
Boil 331 56.6% 227 35.9% 66 50.0% 623 46.3%
Filter 43 7.4% 165 26.1% 6 4.5% 214 15.9%
Buy pure drinking water 41 7.0% 28 4.4% 7 5.3% 76 5.6%
Chlorine 1 0.2% 1 0.2% 0 0.0% 2 0.1%
Other 1 0.2% 0 0.0% 0 0.0% 1 0.1%
Nothing 166 28.6% 208 30.9% 53 39.8% 427 31.7%
Do not know/missing 0 0.0% 3 0.5% 0 0.0% 4 0.3%
Total 583 100% 632 100% 132 100% 1347 100%
Table 60 Water Treatment before Drinking among Caregivers, by Method and Age of Child
Children under 2 Children under 5 Total
N % N % N %
Boil 383 53.2% 13 29.5% 396 51.8%
Filter 97 13.5% 5 11.4% 102 13.4%
Buy pure drinking water 41 5.7% 3 6.8% 44 5.8%
Chlorine 2 0.3% 0 0.0% 2 0.3%
Nothing 197 27.4% 23 52.3% 220 28.8%
Total 720 100% 44 100% 764 100%
Table 61 Water Filter Cleaning
N %
Daily 24 11.2%
Every few days 86 40.2%
Weekly 68 31.8%
Monthly 12 5.6%
Every few months 8 3.7%
Don't remember/Missing 5 2.3%
Other 11 5.1%
Total 214 100%
Table 62 Water Filter Cleanliness (Observed)
N %
Looks clean 176 82.2%
Looks dirty 38 17.8%
Total 214 100%

NOURISH Project Baseline Survey Report 51
Table 63 Water Storage after Treatment
N %
Not transferred (kept in treatment container) 538 58.3%
Transferred to a covered and/or sealed container 272 29.5%
Transferred to an uncovered and/or unsealed container 13 1.4%
Other 28 3.0%
Missing 72 7.8%
923 100%
Table 64 Household Sanitation Facilities
N %
Improved, Not Shared Facility 499 37.0%
Improved Sanitation Coverage 499 37.0%
Shared 194 14.4%
Other 22 1.6%
Total Sanitation Coverage 781 58.0%
Non-improved Facility 654 46.9%
Unimproved Facility 2 0.1%
Shared Facility 64 5.0%
Open Defecation 566 42.0%
Total 1347 100%
Table 65 Handwashing Place, by Province
Battambang Siem Reap Pursat Total
N % N % N % N %
Observed 460 78.9% 463 73.3% 45 34.4% 968 73.8%
Not observed, not in dwelling/yard 110 18.9% 123 19.5% 79 60.3% 312 23.2%
Not observed, no permission to see 3 0.5% 4 0.7% 2 1.5% 9 0.7%
Not observed, other reason 5 0.9% 13 2.2% 5 3.8% 23 1.8%
Missing 5 0.9% 29 4.6% 1 0.8% 35 2.6%
Total 583 100% 632 100% 132 100% 1347 100%
Table 66 Handwashing Station Characteristics (Observation)
(Multiple answers n=1277) N % of cases
Water is available 923 95.4%
Soap or detergent is available 715 73.9%
Cleansing agent other than soap is available 18 1.9%
Near to platform 631 53.2%
Within 10 meters of a toilet 293 24.7%
Water is protected from contamination 99 8.3%
Water falls freely 254 21.4%

NOURISH Project Baseline Survey Report 52
Table 67 Separate, Dedicated Handwashing Stations
N %
Tippy Tap 148 11.0%
Tippy Tap with soap 437 32.4%
Happy Tap 11 0.8%
Happy Tap with soap 11 0.8%
Other 137 10.2%
No separate handwashing station 603 44.8%
Total 1347 100%
Table 68 Child Stool Disposal, by Province
Battambang Siem Reap Pursat Total
N % N % N % N %
Child use toilet or
latrine
19 5.8% 11 3.1% 1 1.3% 31 4.1%
Put/rinsed into toilet or
latrine
54 16.6% 51 14.5% 8 10.7% 113 15.0%
Buried 88 27.0% 181 51.6% 36 48.0% 305 40.6%
Total Hygienic Disposal 161 49.4% 243 69.2% 45 60.0% 449 59.7%
Put/rinsed into drain or
ditch
4 1.2% 4 1.1% 0 0.0% 8 1.1%
Thrown into garbage 19 5.8% 2 0.6% 0 0.0% 21 2.8%
Left in the open 58 2.5% 68 3.7% 28 5.3% 154 20.5%
Other 84 25.8% 34 9.7% 2 2.7% 120 16.0%
Total 326 100% 351 100% 75 100% 752 100%
Agriculture Tables
Table 69 Percentage who Grow Food at Home
Battambang Siem Reap Pursat Total
N % N % N % N %
Yes observed 482 82.7% 458 73.2% 59 42.8% 999 74.2%
Yes not observed 10 1.7% 38 6.1% 13 9.4% 61 4.5%
No 86 14.8% 127 20.3% 60 43.5% 273 20.3%
Missing 5 0.9% 3 0.5% 6 4.3% 14 1.0%
Total 583 100% 626 100% 138 100% 1347 100%

NOURISH Project Baseline Survey Report 53
Table 70 Vegetables Grown at Home, by Province
Battambang Siem Reap Pursat Total
N % N % N % N %
Amaranth 178 16.5% 147 13.6% 23 2.1% 348 32.3%
Yard-long bean 60 5.6% 89 8.3% 10 .9% 159 14.8%
Moringa 143 13.3% 95 8.8% 17 1.6% 255 23.7%
Pumpkin 131 12.2% 146 13.6% 26 2.4% 303 28.1%
Sweet potato 120 11.1% 133 12.3% 19 1.8% 272 25.3%
Total 632 100% 610 100% 95 100% 1337 100%
Table 71 Use of Vegetables Grown
(Multiple answers n=1,347) N % % of cases
Other 19 .9% 1.8%
Eat 1054 49.6% 98.7%
Sell 177 8.3% 16.6%
Give to family and friends 341 16.0% 31.9%
Give to neighbors 486 22.9% 45.5%
Give to animals 34 1.6% 3.2%
Throw away 14 .7% 1.3%

NOURISH Project Baseline Survey Report 54
ANNEX III: Questionnaires
QUESTIONNAIRE ID#___________
Caregivers of Children Birth-59 Months
IDENTIFICATION
PROVINCE. . . . . . . . . . . . . . . . . . . . . . . . . . . . . . . . . . . . . . .
DISTRICT . . . . . . . . . . . . . . . . . . . . . . . . . . . . . . . .. . . . . . . .
COMMUNE. . . . . . . . . . . . . . . . . . . . . . . . . . . . . . . . . . . . . .
VILLAGE. . . . . . . . . . . . . . . . . . . . . . . . . . . . . . . . . . . .. . . . .
CLUSTER NUMBER . . . . . . . . . . . . .. . . . . . . . . . . . . . . . . . .
HOUSEHOLD CODE . . . . . . . . . . . . . .. . . . . . . . . . . . . . . . .
HOUSEHOLD VISITS
DATE
INTERVIEWER'S NAME AND CODE
SUPERVISOR NAME AND CODE
. . . . . . . . . . . . . . . . . . . . . . . . . . . . . . . .
. . . . . . . . . . . . . . . . . . . . . . . . . . . . . . . .
. . . . . . . . . . . . . . . . . . . . . . . . . . . . . . . .
TIME INTERVIEW STARTED
TIME INTERVIEW COMPLETED
Hello. My name is _______________________________________. I am working with the NOURISH
Project to conduct a survey about nutrition in Cambodia. The information we collect will help to plan
services for villages like yours. You were selected for the survey. I would like to ask you some questions.
The questions usually take about 1 hour. READ THE CONSENT FORM.
SIGNATURE OF INTERVIEWER: _____________________________ DATE:
___________________
RESPONDENT AGREES TO BE INTERVIEWED . . . . . . . . . . . . 1
RESPONDENT DOES NOT AGREE TO BE INTERVIEWED . . . . 2 END
Do you have any questions?
May I begin the interview now?
Ask the woman to bring the child’s Yellow Health Card and birth certificate, and the family ID Poor Card (if
she has one).

NOURISH Project Baseline Survey Report 55
I. BASIC INFORMATION
QUESTION RESPONSE
1. IN WHAT MONTH AND YEAR WERE YOU BORN?
IF DON’T KNOW, KHMER MONTH AND YEAR BORN?
2. HOW OLD WERE YOU AT YOUR LAST BIRTHDAY?
Gregorian Month ___________
Gregorian Year ___ ___ ___ ___
Don't Know ……………………….88
_______________________
________ Years
3. HAVE YOU EVER ATTENDED SCHOOL?
4. WHAT IS THE HIGHEST LEVEL OF SCHOOL YOU
ATTENDED?
Yes . . . . . . . . . . . . . . . . . . . . . . . . . . 1
No . . . . . . . . . . . . . . . . . . . . . . . . . . 2 SKIP TO Q5
Don't Know . . . . . . . . . . . . . . . . . . .88
Primary (1-6) . . . . . . . . . . . . . . . . .. 1
Lower Secondary (7-9) . . . . . . . . . 2
Upper Secondary (10-12)…………… 3
Higher. . . . . . . . . . . . . . . . . . . . .. . .4
No Answer. . . . . . . . . . . . . . . . . . .. 99
5. HAVE YOU EVER BEEN MARRIED?
Yes . . . . . . . . . . . . . . . . . . . . . . . . . . 1
No . . . . . . . . . . . . . . . . . . . . . . . . . . 2 SKIP TO Q14
Don't Know . . . . . . . . . . . . . . . . . . . 88
6. WHAT IS YOUR MARITAL STATUS NOW?
Married . . . . . . . . . . . . . . . . . . . . . . 1
Widowed. . . . . . . . . . . . . . . . . . . . . 2
Divorced . . . . . . . . . . . . . . . . . . . . . 3
No Answer . . . . . . . . . . . . . . . . . . . 99
7. DID YOUR (LAST) (HUSBAND/PARTNER) EVER
ATTEND SCHOOL?
8. WHAT IS THE HIGHEST LEVEL OF SCHOOL HE
ATTENDED?
Yes . . . . . . . . . . . . . . . . . . . . . . . . . . 1
No . . . . . . . . . . . . . . . . . . . . . . . . . . 2 SKIP TO Q9
Don't Know . . . . . . . . . . . . . . . . . . . 88
Primary (1-6) . . . . . . . . . . . . . . ….. . 1
Lower Secondary (7-9) . . . . . . . . . . .2
Upper Secondary (10-12)….…….…… 3
Higher. . . . . . . . . . . . . . . . . . . . .. .. 4
No answer. . . . . . . . . . . . . . . . . . … 99
9. HOW OLD IS YOUR (LAST) (HUSBAND/PARTNER)? Under 20. . . . . . . . . . . . . . . . . . . . . . 1
20-29. . . . . . . . . . . . . . . . . . . . . . . . 2
30-39. . . . . . . . . . . . . . . . . . . . . . . . 3
40-49. . . . . . . . . . . . . . . . . . . . . . . . 4
50-59. . . . . . . . . . . . . . . . . . . . . . . . 5
60 or over . . . . . . . . . . . . . . . . . . . . 6
Don't Know . . . . . . . . . . . . . . . . . . . 88
10. WHAT IS YOUR (HUSBAND'S) OCCUPATION? THAT IS,
WHAT KIND OF WORK DOES HE MAINLY DO?
Farmer . . . . . . . . . . . . . . . . . . . . …...1
Factory . . . . . . . . . . . . . . . . . . . . .. ...2
Retail . . . . . . . . . . . . . . . . . . . . . . ….3
Motor taxi……………………………………..4
Construction …………………………………5
Teacher or official………………………….6
Unemployed……………………………… …7
Daily labor, irregular …………………… 8
Other ______________________ 00
Don't Know . . . . . . . . . . . . . . . . . . . 88
11. DOES YOUR HUSBAND WORK IN THIS VILLAGE? Yes . . . . . . . . . . . . . . . . . . . . . . . .. . . 1 SKIP TO Q14
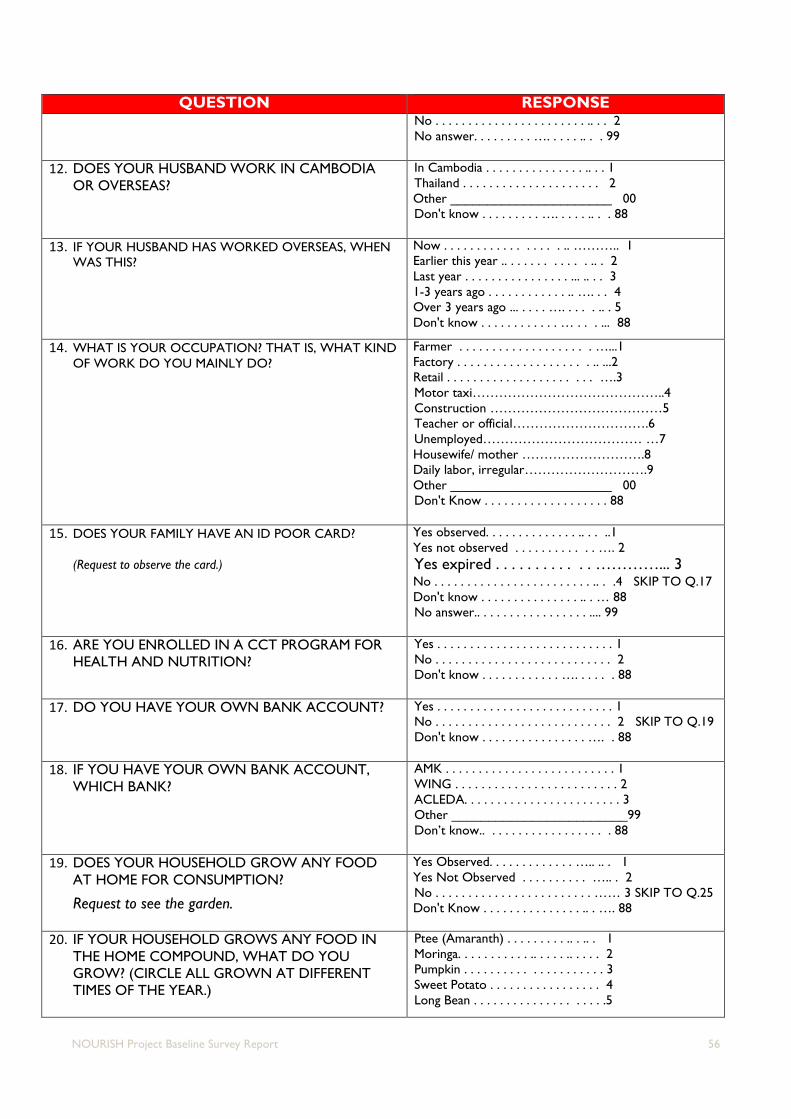
NOURISH Project Baseline Survey Report 56
QUESTION RESPONSE No . . . . . . . . . . . . . . . . . . . . . . . .. . . 2
No answer. . . . . . . . . …. . . . . .. . . 99
12. DOES YOUR HUSBAND WORK IN CAMBODIA
OR OVERSEAS?
In Cambodia . . . . . . . . . . . . . . . .. . . 1
Thailand . . . . . . . . . . . . . . . . . . . . . 2
Other ______________________ 00
Don't know . . . . . . . . . …. . . . . .. . . 88
13. IF YOUR HUSBAND HAS WORKED OVERSEAS, WHEN
WAS THIS?
Now . . . . . . . . . . . . . . . . . .. ……….. 1
Earlier this year .. . . . . . . . . . . . .. . 2
Last year . . . . . . . . . . . . . . . . ... .. . . 3
1-3 years ago . . . . . . . . . . . . .. …. . . 4
Over 3 years ago ... . . . . …. . . . . .. . 5
Don't know . . . . . . . . . . . . … . . . ... 88
14. WHAT IS YOUR OCCUPATION? THAT IS, WHAT KIND
OF WORK DO YOU MAINLY DO?
Farmer . . . . . . . . . . . . . . . . . . . . …...1
Factory . . . . . . . . . . . . . . . . . . . . .. ...2
Retail . . . . . . . . . . . . . . . . . . . . . . ….3
Motor taxi……………………………………..4
Construction …………………………………5
Teacher or official………………………….6
Unemployed……………………………… …7
Housewife/ mother ……………………….8
Daily labor, irregular……………………….9
Other ______________________ 00
Don't Know . . . . . . . . . . . . . . . . . . . 88
15. DOES YOUR FAMILY HAVE AN ID POOR CARD?
(Request to observe the card.)
Yes observed. . . . . . . . . . . . . . .. . . ..1
Yes not observed . . . . . . . . . . . . …. 2
Yes expired . . . . . . . . . . . . …………... 3 No . . . . . . . . . . . . . . . . . . . . . . . . .. . .4 SKIP TO Q.17
Don't know . . . . . . . . . . . . . . . .. . … 88
No answer.. . . . . . . . . . . . . . . . . .... 99
16. ARE YOU ENROLLED IN A CCT PROGRAM FOR
HEALTH AND NUTRITION?
Yes . . . . . . . . . . . . . . . . . . . . . . . . . . . 1
No . . . . . . . . . . . . . . . . . . . . . . . . . . . 2
Don't know . . . . . . . . . . . . …. . . . . . 88
17. DO YOU HAVE YOUR OWN BANK ACCOUNT?
Yes . . . . . . . . . . . . . . . . . . . . . . . . . . . 1
No . . . . . . . . . . . . . . . . . . . . . . . . . . . 2 SKIP TO Q.19
Don't know . . . . . . . . . . . . . . . . …. . 88
18. IF YOU HAVE YOUR OWN BANK ACCOUNT,
WHICH BANK?
AMK . . . . . . . . . . . . . . . . . . . . . . . . . . 1
WING . . . . . . . . . . . . . . . . . . . . . . . . . 2
ACLEDA. . . . . . . . . . . . . . . . . . . . . . . . 3
Other ________________________99
Don’t know.. . . . . . . . . . . . . . . . . . . 88
19. DOES YOUR HOUSEHOLD GROW ANY FOOD
AT HOME FOR CONSUMPTION?
Request to see the garden.
Yes Observed. . . . . . . . . . . . . ….. .. . 1
Yes Not Observed . . . . . . . . . . ….. . 2
No . . . . . . . . . . . . . . . . . . . . . . . . …… 3 SKIP TO Q.25
Don't Know . . . . . . . . . . . . . . . .. . …. 88
20. IF YOUR HOUSEHOLD GROWS ANY FOOD IN
THE HOME COMPOUND, WHAT DO YOU
GROW? (CIRCLE ALL GROWN AT DIFFERENT
TIMES OF THE YEAR.)
Ptee (Amaranth) . . . . . . . . . .. . .. . 1
Moringa. . . . . . . . . . . .. . . . . .. . . . . 2
Pumpkin . . . . . . . . . . . . . . . . . . . . . 3
Sweet Potato . . . . . . . . . . . . . . . . . 4
Long Bean . . . . . . . . . . . . . . . . . . . .5

NOURISH Project Baseline Survey Report 57
QUESTION RESPONSE Jackfruit. . . . . . . . . . . . . . . . . . . . .. 6
Mango. . . . . . . . . . . . . . . . . . . . . . . 7
Banana . . . . . . . . . . . . . . . . . . . . . .8
Other ______________________ 00
Don’t know . . . . . . . . . . . . . . . . . … 88
21. IF YOUR HOUSEHOLD GROWS FOOD AT HOME,
WHAT DO YOU DO WITH THE PRODUCE? (Circle
all answers given).
Eat . . . . . . . . . . . .. . . . . . . . . . . . . 1
Sell. . . . . . . . . . . . . . . . . . . . .. . . . . 2
Give to family and friends. . . . . . . 3
Give to neighbors. . . . . . . . . . . . . .4
Give to animals . . . . . . . . . . . . . .. . 5
Throw away. . . . . . . . . . . . . . . . . . 6
Other ______________________ 00
Don’t know . . . . . . . . . . . . . . . . . . 88
22. IF YOU SELL SOME, HOW MUCH MONEY DO
YOU MAKE FROM SELLING THESE EACH YEAR? ___________ Riel
[Ask only if she grows amaranth, yardlong bean, moringa,
or sweet potato in #18. If not, SKIP TO Q25 ]
23. HOW MUCH OF ______ THAT YOU GROW DID
YOUR HOUSEHOLD EAT IN THE PAST WEEK?
Bunch 1/2 kilo 1 kilo 2-5 kilos More
Amaranth 1 2 3 4 5
Moringa 1 2 3 4 5 2
Sweet potato1 2 3 4 5
Long bean 1 2 3 4 5
[Ask only if she grows amaranth, yardlong bean, moringa,
or sweet potato in #18. If not, SKIP TO Q25 ]
24. WHO EATS THE PRODUCE USUALLY?
(Read answers and circle all answers given).
Men . . .. . . . . . . . . . . . . . . . . . .. . .1
Women . . .. . . . . . . . . . . . . . . .. . . 2
Pregnant women. . .. . . . . . . .. ... . ..3
Children over 1 year . . . ... . .. . . ... .4
Children 1 year – 2 years. . . . . . .. ...5
Children over 2 years . . . . . . . . . ...6
Other _______________________ 00
Don’t know . . . . . . . . . . . . . . . . . . ...88
25. NOW I WOULD LIKE TO ASK ABOUT ALL THE BIRTHS
YOU HAVE HAD DURING YOUR LIFE. HAVE YOU EVER
GIVEN BIRTH?
Yes . . . . . . . . . . . . . . . . . . . . . . . .. .. 1
No . . . . . . . . . . . . . . . . . . . . . . . . . . 2
No Answer . . . . . . . . . . . . . . . . . . . .99
26. ARE YOU PREGNANT NOW?
Yes . . . . . . . . . . . . . . . . . . . . . . . . . .1 SKIP TO Q.31
No . . . . . . . . .. . . . . . . . . . . . . . . . . 2
Don't know . . . . . . . . . . . . . . . . . . . 88
No Answer.. . . . . . . . . . . . . . . . . . . .99
27. HAVE YOU BEEN PREGNANT IN THE PAST 12
MONTHS?
Yes . . . . . . . . . . . . . . . . . . . . . . . .. . ..1
No . . . . . . . . . . . . . . . . . . . . . . . . … 2 SKIP TO Q.31
No answer.. . . . . . . . . . . . . . . . . . . ..99
28. WAS IT FULL TERM PREGNANCY?
Yes . . . . . . . . . . . . . . . . . . . . . . . .. . ..1
No . . . . . . . . . . . . . . . . . . . . . . . . … 2
No answer.. . . . . . . . . . . . . . . . . . . ..99
29. HOW MUCH WEIGHT DID YOUR HEALTH
WORKER ADVISE YOU TO GAIN DURING
PREGNANCY?
Less than 10 kg. . . . . . . . . . . . . .. . ..1
10-12.0 kg . . . . . . . . . . . . . . . . . . . . 2
12.1- 14.9kg . . . . . . . . . . . . . . . . . . 3
14.9-17.9 kg . . . . . . . . . . . . . . . . . … 4
18 kg or more. . . . . . . . . . . . . . . . … 5
Never advised . . . . . . . . . . . . . . ….. 6
None . . . . . . . . . . . . . . . . . . . . . . . . .7
Don't remember. . . . . . . . . . . . … . 88

NOURISH Project Baseline Survey Report 58
QUESTION RESPONSE
30. HOW MUCH WEIGHT DID YOU GAIN DURING
PREGNANCY?
Less than 10 kg. . . . . . . . . . . . . .. . ..1
10-12.0 kg . . . . . . . . . . . . . . . . . . . . 2
12.1- 14.9kg . . . . . . . . . . . . . . . . . . 3
14.9-17.9 kg . . . . . . . . . . . . . . . . . …4
18 kg or more. . . . . . . . . . . . . . . . … 5
Never weighed . . . . . . . . . . . . . …… 6
None . . . . . . . . . . . . . . . . . . . . . . . . .7
Don't remember . . . . . . . . . . . . … 88
31. HOW MANY CHILDREN DO YOU CARE FOR UNDER 5
YEARS OF AGE?
__ __
If 0, end the interview. If 1 or more, continue.
32. WHAT IS YOUR RELATIONSHIP WITH EACH CHILD?
# children
Mother . . . . . . . . . . . . . . . . . . . . . . . . .1 _____
Father . . . . . . . . . . . . . . . . . . . . . . ….. .2 _____
Aunt . . . . . . .. . . . . . . . . . . . . . . . . . . . 3 _____
Grandmother . . . . . . . . . . . . . . . . . . . 4 _____
Grandfather. . . . . . . . . . . . . . . . . . . . . .5 _____
Sister. . . . . . .. . . . . . . . . . . . . . . . . . . . 6 _____
Don't know . . . . . . . . . . . . . . . . . . . . . 88 _____
No Answer.. . . . . . . . . . . . . . . . . . .. . . .99 _____
33. FOR THE REST OF THIS INTERVIEW WE CAN TALK
ABOUT ONE CHILD [SPECIFY AGE NEEDED] WHO IS
AT HOME NOW. IF YOU HAVE TWINS, PLEASE PICK
ONE.
WHAT IS THE CHILD’S NAME?
_____________________
34. WHAT DATE WAS {child’s name} BORN?
Verify with yellow child health card.
Gregorian (French) Month ___________
Gregorian (French) Year ___ ___ ___ ___
Don't Know . . . . . . . . . . . . . . . . . . . . 88
35. WHAT IS [child’s name]’S SEX?
Female. . . . . . . . . . . . . . . . . . . . . . . . 1
Male…. . . . . . . . . . . . . . . . . . . . . . . . 2
36. DOES [child’s name] HAVE A BIRTH CERTIFICATE?
Yes Observed. . . . . . . . . . . . . . . . . . . 1
Yes Not Observed . . . . . . . . . . . . . . 2
No . . . . . . . . . . . . . . . . . . . . . . . . . . . 3
Don't Know . . . . . . . . . . . . . . . . . . . . 88

NOURISH Project Baseline Survey Report 59
II. WOMEN’S HEALTH CARE
QUESTION RESPONSE Continue if mother is interviewed.
SKIP to Q 50 if grandmother or father is interviewed as main caregiver of child.
37. WHERE DID YOU RECEIVE ANTENATAL CARE FOR
YOUR MOST RECENT PREGNANCY?
Home
Your home . . . . . . . . . . . . . . . . . 1
Midwife/TBA home. . . . . . . . . . 2
Other home . . . . . . . . . . . . . . . . 3
Public
Natl hosp (pp) . . . . . . . . . . . . . .4
Provincial hosp. . . . . . . . . . . . . . 5
Hlth center. . . . . . . . . . . . .. . . . . 6
Hlth post . . . . . . . . . . . . . . . . . ..7
Outreach . . . . . . . . . . . . . . . . . .. 8
Military hosp. . . . . . . . . . . . . . . 9
Other ____________________ 00
Private
Priv. Hosp . . . . . . . . . . . . . . . . . 10
Priv. Clinic . . . . . . . . . . . . .. . . . 11
Other private. . . . . . . . . . . . . . . 12
38. HOW MANY MONTHS PREGNANT WERE YOU
WHEN YOU FIRST RECEIVED ANTENATAL CARE FOR
THIS PREGNANCY?
Months ___ ____
Don’t know ……88
39. HOW MANY TIMES DID YOU RECEIVE ANTENATAL
CARE DURING THIS PREGNANCY?
No. Times ___ ___
Don’t know ……88
40. AS PART OF YOUR ANTENATAL CARE DURING THIS
PREGNANCY, WERE ANY OF THE FOLLOWING
DONE?
Yes No
Were you weighed? WEIGHT . . . 1 2
Was your height taken? HEIGHT . . . 1 2
Was your blood pressure measured? BP . . . . . . . .1 2
Did you give a urine sample? URINE . . . 1 2
Did you give a blood sample? BLOOD . . 1 2 Given advice on weight gain in pregnancy? 1 2
Given advice on food to eat in pregnancy? 1 2
41. DURING THIS PREGNANCY, WERE YOU GIVEN OR
DID YOU BUY ANY IRON TABLETS OR IRON SYRUP?
Yes . . . . . . . . . . . . . 1
No . . . . . . . . . . . . . . 2
Don't know . . . …. . 88 42. DURING THE WHOLE PREGNANCY, FOR HOW MANY
DAYS DID YOU TAKE THE TABLETS OR SYRUP?
Days ____ ___ ____
Don't know . . . . . 88 43. WHERE DID YOU GIVE BIRTH?
Home
Your home . . . . . . . . . . . . . . . . . 1
Midwife/TBA home. . . . . . . . … .2
Other home . . . . . . . . . . . . . . . . 3
Public
Natl hosp (pp) . . . . . . . . . . . . . .. 4
Provincial hosp. . . . . . . . . . . . ... .5
Hlth center. . . . . . . . . . . . .. . . . .. 6
Hlth post . . . . . . . . . . . . . . . . . . .7
Outreach . . . . . . . . . . . . . . . . . . ..8
Military hosp. . . . . . . . . . . .. . . .. 9
Other _____________________99
Private
Priv. Hosp . . . . . . . . . . . . . . . . . 10
Priv. Clinic . . . . . . . . . . . . . . . . . 11
Other private. . . . .. . . . . . . . . . 12
QUESTION RESPONSE NOW, LET’S TALK AGAIN ABOUT [child’s name]. Very large . . . . . . . . . . . . . . . 1

NOURISH Project Baseline Survey Report 60
44. WHEN (child’s name) WAS BORN, WAS HE/SHE VERY
LARGE, LARGER THAN USUAL/AVERAGE,
USUAL/AVERAGE, SMALLER THAN USUAL/AVERAGE,
OR VERY SMALL?
Larger than average . .. . ….. 2
Average . . . . . . . . . . . . . . . . 3
Smaller than average . . ….. 4
Very small . . . . . . . . . . . . .. . 5
Don't know . . . . . . . . . . . . .88
45. WAS (child’s name) WEIGHED AT BIRTH? Yes . . . . . . . . . . . . . 1
No . . . . . . . . . . . . . 2
Don't know . . . …...88
46. HOW MUCH DID (child’s name) WEIGH?
A. Kg from card ___ ____kg
B. Kg from recall ___ ____kg
Don't know . . . . ………………. 88
47. AFTER YOU GAVE BIRTH TO (child’s name), DID
ANYONE CHECK ON YOUR HEALTH?
Yes . . . . . . . . . . . . . 1
No . . . . . . . . . . . . .. 2
Don't know . . . ….88
48. WHO CHECKED ON YOUR HEALTH AT THAT TIME?
Probe for most qualified person; circle one—the most qualified.
Health personnel
Doctor/medical assistant . . . . . . . . 1
Midwife . . . . . . . . . . . . . . . . . . . . . . 2
Nurse . . . . . . . . . . . . . . . .. . . . . . . . .3
Other person
Traditional birth attendant.. . . . . . . 4
Other _______________________99
(specify)
Don’t know.. . . . . . . . . . . . . . . . . .. 88
49. HOW LONG AFTER DELIVERY DID THE FIRST CHECK
TAKE PLACE?
HOURS __ ____
DAYS ___ ____
WEEKS ___ ___
Don’t know.. . . .. 88
III. HYGIENE AND SANITATION
QUESTION RESPONSE
50. DO YOU DO ANYTHING TO THE WATER
TO MAKE IT SAFER TO DRINK?
Yes . . . . . . . . . . . . . . . . . . . . . . . . . . . . .1
No . . . . . . . . . . . . . . . . . . . . . . . . . . . . . 2 SKIP TO Q54
Don't Know . . . . . . . . . . . . . . . . . . . . . 88
51. WHAT DO YOU USUALLY DO TO MAKE THE
WATER SAFER TO DRINK?
(Confirm by observation)
52. HOW OFTEN IS THE FILTER CLEANED?
(Confirm by observation)
Boil . . . . . . . . . . . . . . . . . . . . . …. . . . . ..1 SKIP TO Q53
Filter . . . . . . . . . . . . . . . . . . . . . . . . . . . 2
Chlorine . . . . . . . . . . . . . . . . . . . . . . . . 3 SKIP TO Q53
Nothing . . . . . . . . . . . . . . . . . . . . . . . . 4 SKIP TO Q54
Other __________________________99 SKIP TO Q54
No answer . . . . . . . . . . . . . . . . . . . . . . . 00
Based on answer above:
Water treatment device observed . . . . 1
Water treatment device not observed. 2
Daily . . . . . . . . . . . . . . . . . . . . . . . . . . . . 1
Weekly . . . . . . . . . . . . . . . . . . . . . . . . . . 2
Monthly . . . . . . . . . . . . . . . . . . . . . . . . 3
Every few months. . . . . . . . . . . . . . . . . .4
Every year . . . . . . . . . . . . . . . . . . . . . . . .5
Do not remember. . . . . . . . . . . . . . . . . .9

NOURISH Project Baseline Survey Report 61
QUESTION RESPONSE
Other __________________________99
Observed:
Filter looks clean . . . . . . . . . . . . . . . . . 1
Filter looks dirty. . . . . . . . . . . . . . . . . . 2
53. PLEASE SHOW ME WHAT HAPPENS TO THE
WATER AFTER TREATED.
Transferred to a covered, sealed, clean container. . 1
Transferred to a an uncovered/unsealed, dirty
container………………………………………………………
2
Kept in the container where it was boiled ……………. 3
54. WHAT KIND OF TOILET FACILITY DO MEMBERS
OF YOUR HOUSEHOLD USUALLY USE?
(Confirm by observation)
Flush or pour flush toilet
Flush to piped sewer system . . . . . . . .1
Flush to septic tank . . . . . . . . . . . . . . . 2
Flush to pit latrine . . . . . . . . . . . . . . . . 3
Flush to somewhere else . . . . . . . . . . .4
Flush, don't know where . . . . . . . . . . .5
Pit latrine
Ventilated improved pit latrine .. . . . .6
Pit latrine with slab . . . . . . . . . . . . . . . 7
Pit latrine without slab/ open pit . . . 8
Composting toilet . . . . . . . . . . . . . . . . 9
Bucket toilet . . . . . . . . . . . . . . . . . . . 10
Hanging toilet/hanging latrine . . . . . 11
No facility/bush/field . . . . . . . . . . . . . 12 SKIP TO Q57
Use another person/family’s latrine…13 SKIP TO Q56
Other _________________________00
(SPECIFY)
Answer above is confirmed by observation
Observed . . . . . . . . . . . . . . . . . . . . . . .. 1
Not observed . . . . . . . . . . . . . . . . . . . . 2
55. DO YOU SHARE YOUR TOILET FACILITY
WITH OTHER HOUSEHOLDS?
Yes . . . . . . . . . . . . . . . . . . . . . . . . . . . . . . 1
No . . . . . . . . . . . . . . . . . . . . . . . . . . . . . . 2 SKIP TO Q57
Don't Know . . . . . . . . . . . . . . . . . . . . . . . 88
56. HOW MANY HOUSEHOLDS USE THIS TOILET
FACILITY?
Number ____ ____ ____
Don't know . . . . . 88 57. THE LAST TIME (child’ name) PASSED STOOLS IN
THE PAST 24 HOURS, WHAT WAS DONE TO
DISPOSE OF THE STOOLS?
(Confirm by observation.)
Child used toilet or latrine . . . . . . . . . . . . . . 1
Put/rinsed into toilet or latrine . . . . . . . . 2
Put/rinsed into drain or ditch . . . . . . . . . . 3
Thrown into garbage . . . . . . . . . . . .. . . . . . 4
Buried . . . . . . . . . . . . . . . . . . . . .. . . . . . . . . . 5
Left in the open . . . . . . . . . . . .. . . . . . . . . . 6
Other ______________________________99
(specify)
Observed stools in hole, drain or ditch . .. . . … 1
Did not observe stools in hole, drain or ditch… 2
58. PLEASE SHOW ME WHERE MEMBERS OF
YOUR HOUSEHOLD MOST OFTEN WASH
THEIR HANDS.
Observed . . . . . . .. . . . . . . . . . . . . . .. . . . ….... 1
Not observed, not in dwelling/yard/plot . ... 2
Not observed, no permission to see . . . . . . . 3
Not observed, other reason . . . . . . . . . . . . . 4
[Note: anal cleansing water inside toilet is not considered
hand washing station]

NOURISH Project Baseline Survey Report 62
QUESTION RESPONSE
59. OBSERVATION ONLY: OBSERVE
PRESENCE OF WATER AT THE SPECIFIC
PLACE FOR HANDWASHING.
Water is available . . . . . . . . . . . . . . . . . . . .. . 1
Water is not available . . . . . . . . . .. . . . . . . .2
60. OBSERVATION ONLY: OBSERVE
PRESENCE OF SOAP, DETERGENT, OR OTHER
CLEANSING AGENT.
Soap or detergent (bar, liquid, powder) . . .. 1
Ash, mud, sand . . . . . . . . . . . . . . . .. . . .. . . . 2
None. . . . . . . . . . . . . . . . . .. . . . . . .. . . . . . . 3
61. OBSERVATION ONLY: OBSERVE
HANDWASHING STATION
(Circle all observed)
Near to platform (feeding/eating) place. . … 1
Within 10 meters of the toilet ……………………2
Water is protected from contamination by people and
animals …..…........…........…........…........…......3
Water falls freely (not ladled by one hand). 4
62. OBSERVATION ONLY: OBSERVE
PRESENCE OF A SEPARATE HANDWASHING
STATION
Tippy Tap …… . . . . . . . . . . . . . . . . ….. . . . .. . 1
Tippy Tap with soap . . . . .. . . . . . . . . . . . , .2
Happy Tap . . . . . . . . . . . . . . . . . . . ….. . . . .. . 3
Happy Tap with soap . . . . .. . . . . . . . . . . . , 4
No separate handwashing station . . . . . . . , 5
Other: ______________________________99
63. OBSERVATION ONLY: OBSERVE
WHETHER FLIES ARE KEPT OFF FOOD BEING
PREPARED OR STORED
Flies are kept off food . . . . . . . . . . . . . . . . . . 1
Flies are not kept off food. . . . .... .. . . . . . . . 2
No food observed . . . . . . .. . . . . .. .. . . . . . . 3
64. OBSERVATION ONLY: OBSERVE
WHETHER CHICKENS ARE CONTAINED,
KEPT AWAY FROM WHERE CHILD IS
SITTING, PLAYING OR EATING
Chickens are contained . . . . . . . . .. . . . . . .. . .1
Chickens are not contained. . . . . . .. . . . . . . .2
No chickens observed . . . . . . .. . . . . . . .. . . .3
65. OBSERVATION ONLY: OBSERVE
WHETHER THERE IS FECES AROUND THE
HOUSEHOLD (animal or humans-children)
(Circle all observed.)
Animal feces observed . . . . . . . . .. . . . . . .. . .1
Child feces observed. . . ………... . . .. . . . . . . .2
No feces observed . . . . . . .. ……. . . . . . .. . . .3
IV. CHILD’S ILLNESS
QUESTION RESPONSE Let’s continue to talk about the same child under 2 years you told me
about earlier. Let’s talk about this child’s health.
66. WHEN WAS THE LAST TIME THIS CHILD VISITED THE
HEALTH CENTER?
67. WHAT SERVICES DID THE CHILD RECEIVE DURING
THAT VISIT? (circle all mentioned).
_____ MONTH
_____ YEAR
Don't remember . .. . . . . .99
Vaccination . . . . . . . . . . . . . . . . . . . . . . . . . .1
Medicine…. . . . . . . . . . . . . . . . . . . . . . . . . .. 2
IV…………….. . . . . . . . . . . . . . . . . . . . . . . . . . .3
Weighing … . . . . . . . . . . . . . . . . . . . . . . . . . 4
Counseling. . . . . . . . . . . . . . . . . . . . . . . . .… 5
Don't remember . . . . . . . . . . . . . . . . . . . . .99
Other _____________________________00
May I see the Yellow Child Health Card?
68. OBSERVATION ONLY: WHEN IS THE LAST MONTH
THE CHILD’S WEIGHT WAS PLOTTED ON THE
YELLOW CHILD HEALTH CARD?
________ MONTH
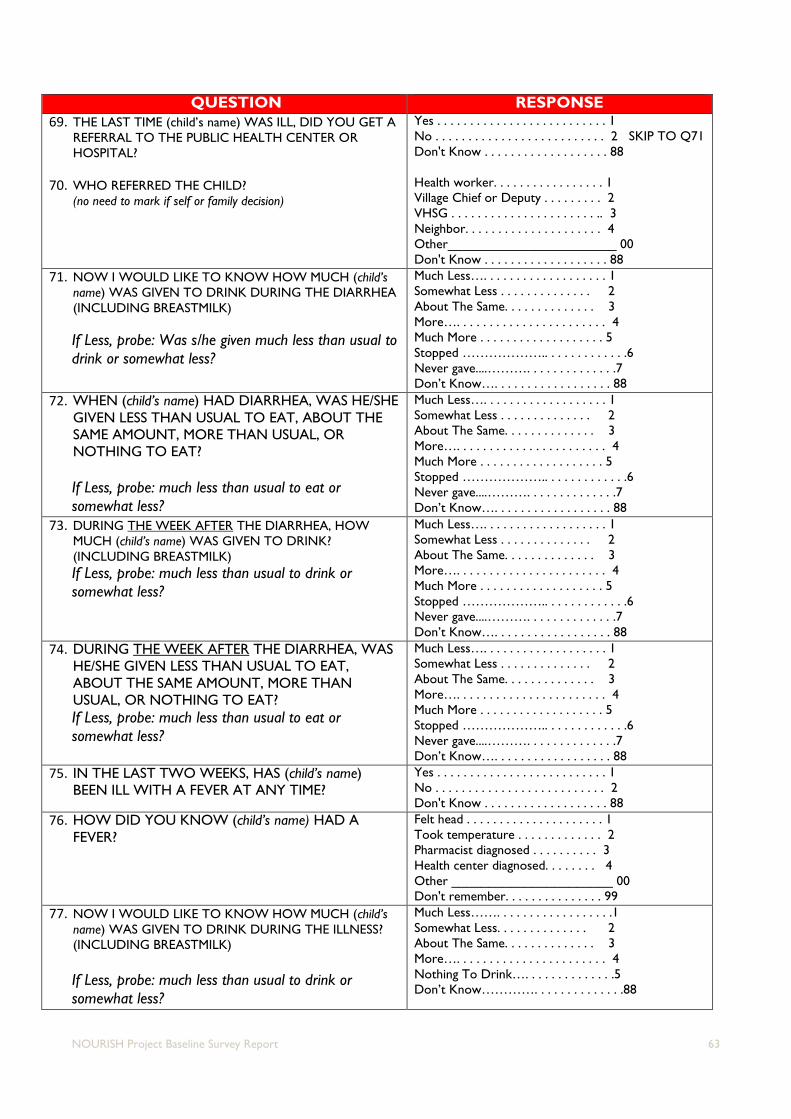
NOURISH Project Baseline Survey Report 63
QUESTION RESPONSE
69. THE LAST TIME (child’s name) WAS ILL, DID YOU GET A
REFERRAL TO THE PUBLIC HEALTH CENTER OR
HOSPITAL?
70. WHO REFERRED THE CHILD?
(no need to mark if self or family decision)
Yes . . . . . . . . . . . . . . . . . . . . . . . . . . 1
No . . . . . . . . . . . . . . . . . . . . . . . . . . 2 SKIP TO Q71
Don't Know . . . . . . . . . . . . . . . . . . . 88
Health worker. . . . . . . . . . . . . . . . . 1
Village Chief or Deputy . . . . . . . . . 2
VHSG . . . . . . . . . . . . . . . . . . . . . . .. 3
Neighbor. . . . . . . . . . . . . . . . . . . . . 4
Other_______________________ 00
Don't Know . . . . . . . . . . . . . . . . . . . 88
71. NOW I WOULD LIKE TO KNOW HOW MUCH (child’s
name) WAS GIVEN TO DRINK DURING THE DIARRHEA
(INCLUDING BREASTMILK)
If Less, probe: Was s/he given much less than usual to
drink or somewhat less?
Much Less…. . . . . . . . . . . . . . . . . . . 1
Somewhat Less . . . . . . . . . . . . . . 2
About The Same. . . . . . . . . . . . . . 3
More…. . . . . . . . . . . . . . . . . . . . . . . 4
Much More . . . . . . . . . . . . . . . . . . . 5
Stopped ……………….. . . . . . . . . . . . .6
Never gave....………. . . . . . . . . . . . . .7
Don’t Know…. . . . . . . . . . . . . . . . . . 88
72. WHEN (child’s name) HAD DIARRHEA, WAS HE/SHE
GIVEN LESS THAN USUAL TO EAT, ABOUT THE
SAME AMOUNT, MORE THAN USUAL, OR
NOTHING TO EAT?
If Less, probe: much less than usual to eat or
somewhat less?
Much Less…. . . . . . . . . . . . . . . . . . . 1
Somewhat Less . . . . . . . . . . . . . . 2
About The Same. . . . . . . . . . . . . . 3
More…. . . . . . . . . . . . . . . . . . . . . . . 4
Much More . . . . . . . . . . . . . . . . . . . 5
Stopped ……………….. . . . . . . . . . . . .6
Never gave....………. . . . . . . . . . . . . .7
Don’t Know…. . . . . . . . . . . . . . . . . . 88
73. DURING THE WEEK AFTER THE DIARRHEA, HOW
MUCH (child’s name) WAS GIVEN TO DRINK?
(INCLUDING BREASTMILK)
If Less, probe: much less than usual to drink or
somewhat less?
Much Less…. . . . . . . . . . . . . . . . . . . 1
Somewhat Less . . . . . . . . . . . . . . 2
About The Same. . . . . . . . . . . . . . 3
More…. . . . . . . . . . . . . . . . . . . . . . . 4
Much More . . . . . . . . . . . . . . . . . . . 5
Stopped ……………….. . . . . . . . . . . . .6
Never gave....………. . . . . . . . . . . . . .7
Don’t Know…. . . . . . . . . . . . . . . . . . 88
74. DURING THE WEEK AFTER THE DIARRHEA, WAS
HE/SHE GIVEN LESS THAN USUAL TO EAT,
ABOUT THE SAME AMOUNT, MORE THAN
USUAL, OR NOTHING TO EAT?
If Less, probe: much less than usual to eat or
somewhat less?
Much Less…. . . . . . . . . . . . . . . . . . . 1
Somewhat Less . . . . . . . . . . . . . . 2
About The Same. . . . . . . . . . . . . . 3
More…. . . . . . . . . . . . . . . . . . . . . . . 4
Much More . . . . . . . . . . . . . . . . . . . 5
Stopped ……………….. . . . . . . . . . . . .6
Never gave....………. . . . . . . . . . . . . .7
Don’t Know…. . . . . . . . . . . . . . . . . . 88
75. IN THE LAST TWO WEEKS, HAS (child’s name)
BEEN ILL WITH A FEVER AT ANY TIME?
Yes . . . . . . . . . . . . . . . . . . . . . . . . . . 1
No . . . . . . . . . . . . . . . . . . . . . . . . . . 2
Don't Know . . . . . . . . . . . . . . . . . . . 88
76. HOW DID YOU KNOW (child’s name) HAD A
FEVER?
Felt head . . . . . . . . . . . . . . . . . . . . . 1
Took temperature . . . . . . . . . . . . . 2
Pharmacist diagnosed . . . . . . . . . . 3
Health center diagnosed. . . . . . . . 4
Other ______________________ 00
Don't remember. . . . . . . . . . . . . . . 99
77. NOW I WOULD LIKE TO KNOW HOW MUCH (child’s
name) WAS GIVEN TO DRINK DURING THE ILLNESS?
(INCLUDING BREASTMILK)
If Less, probe: much less than usual to drink or
somewhat less?
Much Less……. . . . . . . . . . . . . . . . . .1
Somewhat Less. . . . . . . . . . . . . . 2
About The Same. . . . . . . . . . . . . . 3
More…. . . . . . . . . . . . . . . . . . . . . . . 4
Nothing To Drink…. . . . . . . . . . . . . .5
Don’t Know…………. . . . . . . . . . . . . .88

NOURISH Project Baseline Survey Report 64
QUESTION RESPONSE
78. DURING THE ILLNESS, WAS HE/SHE GIVEN LESS
THAN USUAL TO EAT, ABOUT THE SAME
AMOUNT, MORE THAN USUAL, OR NOTHING
TO EAT?
If Less, probe: much less than usual to eat or
somewhat less?
Much Less…. . . . . . . . . . . . . . . . . . . 1
Somewhat Less . . . . . . . . . . . . . . 2
About The Same. . . . . . . . . . . . . . 3
More…. . . . . . . . . . . . . . . . . . . . . . . 4
Much More . . . . . . . . . . . . . . . . . . . 5
Stopped ……………….. . . . . . . . . . . . .6
Never gave....………. . . . . . . . . . . . . .7
Don’t Know…. . . . . . . . . . . . . . . . . . 88
79. DURING THE WEEK AFTER THE ILLNESS, HOW MUCH
(child’s name) WAS GIVEN TO DRINK? (INCLUDING
BREASTMILK)
If Less, probe: much less than usual to drink or
somewhat less?
Much Less…. . . . . . . . . . . . . . . . . . . 1
Somewhat Less . . . . . . . . . . . . . . 2
About The Same. . . . . . . . . . . . . . 3
More…. . . . . . . . . . . . . . . . . . . . . . . 4
Much More . . . . . . . . . . . . . . . . . . . 5
Stopped ……………….. . . . . . . . . . . . .6
Never gave....………. . . . . . . . . . . . . .7
Don’t Know…. . . . . . . . . . . . . . . . . . 88
80. DURING THE WEEK AFTER THE ILLNESS, WAS
HE/SHE GIVEN LESS THAN USUAL TO EAT,
ABOUT THE SAME AMOUNT, MORE THAN
USUAL, OR NOTHING TO EAT?
If Less, probe: much less than usual to eat or
somewhat less?
Much Less…. . . . . . . . . . . . . . . . . . . 1
Somewhat Less . . . . . . . . . . . . . . 2
About The Same. . . . . . . . . . . . . . 3
More…. . . . . . . . . . . . . . . . . . . . . . . 4
Much More . . . . . . . . . . . . . . . . . . . 5
Stopped ……………….. . . . . . . . . . . . .6
Never gave....………. . . . . . . . . . . . . .7
Don’t Know…. . . . . . . . . . . . . . . . . . 88
V. CHILD’S WEIGHT AND HEIGHT
CHILDREN UNDER 24 MONTHS SHOULD BE MEASURED
LYING DOWN;
CHILDREN 24 MONTHS OR OLDER SHOULD BE
MEASURED STANDING UP.
81. Weight 1: kg __ __. __
Weight 2: kg __ __. __
Z score- to determine underweight, wasting _____
82. Height in cm __ __ __. __
Z score- to determine stunting, wasting _____
VI. ANEMIA
As part of this survey, we are asking people all over the province to take an anemia test. Anemia is a serious
health problem that usually results from genetic disorder, poor nutrition, infection, or chronic disease. We ask
that children 6 months through 5 years old take part in anemia testing in this survey and give a few drops of
blood from a finger or heel. The equipment used to take the blood is clean and completely safe. It has never been
used before and will be thrown away after each test. The blood will be tested for anemia immediately, and the
result will be told to you right away. The result will be kept strictly confidential and will not be shared with
anyone other than members of our survey team. Do you have any questions?
You can say yes to the test, or you can say no. It is up to you to decide.
Will you allow (NAME OF CHILD) to participate in the anemia test?

NOURISH Project Baseline Survey Report 65
Yes No
CIRCLE RESPONSE AND GET SIGNATURE/MARK IF YES
Signature or Thumb Print: ______________________
83. GRAMS PER DECILITER __ __ . __
VII. CHILD FEEDING
QUESTION RESPONSE
84. WAS [child’s name] EVER BEEN BREASTFED?
Yes . . . . . . . . . . . . . . . . . . . . . . . . . . 1
No . . . . . . . . . . . . . . . . . . . . . . . . . . 2 SKIP TO Q92
Don't Know . . . . . . . . . . . . . . . . . . . 8
85. HOW LONG AFTER BIRTH DID YOU FIRST PUT (child’s
name) TO THE BREAST?
IF LESS THAN 1 HOUR, RECORD ‘00' HOURS. IF LESS THAN 24
HOURS, RECORD HOURS. OTHERWISE, RECORD DAYS.
Minutes ___ ___
Hours ___ ___
Days ___ ___
Don’t Know . . . . 88
86. IN THE FIRST THREE DAYS AFTER DELIVERY, WAS
(child’s name) GIVEN ANYTHING OTHER THAN
BREAST MILK SUCH AS CHHEU EM?
Yes . . . . . . . . . . . . . . . . . . . . . . . . . . 1
No . . . . . . . . . . . . . . . . . . . . . . . . . . 2
Don't Know . . . . . . . . . . . . . . . . . . . 88
87. IF [child’s name] WAS BREASTFED EVER, IS S/HE
STILL BREASTFEEDING SOMETIMES?
Yes . . . . . . . . . . . . . . . . . . . . . . . . . . 1
No . . . . . . . . . . . . . . . . . . . . . . . . . . 2 SKIP TO Q92
Don't Know . . . . . . . . . . . . . . . . . . . 88
88. WAS [child’s name] BREASTFED YESTERDAY
DURING THE DAY OR AT NIGHT?
Yes . . . . . . . . . . . . . . . . . . . . . . . . . . 1
No . . . . . . . . . . . . . . . . . . . . . . . . . . 2
Don't Know . . . . . . . . . . . . . . . . . . . 88
89. IF [child’s name] BREASTFED YESTERDAY, HOW
MANY TIMES?
___ ___
90. IF [child’s name] BREASTFED YESTERDAY HOW
LONG IS THE USUAL FEEDING?
____ ___ MIN
Sometimes babies are fed breast milk in different ways, for example
by spoon, cup, or bottle. This can happen when the mother cannot
always be with her baby. Sometimes babies are breastfed by another
woman or given breast milk from another woman by spoon, cup,
bottle, or some other way. This can happen if a mother cannot
breastfeed her own baby.
91. DID [CHILD’S NAME] CONSUME BREAST MILK IN
ANY OF THESE WAYS YESTERDAY DURING THE
DAY OR AT NIGHT?
Yes . . . . . . . . . . . . . . . . . . . . . . . . . . 1
No . . . . . . . . . . . . . . . . . . . . . . . . . . 2
Don't Know . . . . . . . . . . . . . . . . . . . 88
Next I would like to ask you about some liquids that [child’s name]
may have had yesterday during the day or at night.
92. PLAIN WATER
Yes . . . . . . . . . . . . . . . . . . . . . . . . . . 1
No . . . . . . . . . . . . . . . . . . . . . . . . . . 2 SKIP TO Q94
Don't Know . . . . . . . . . . . . . . . . . . . 88
93. HOW MANY TIMES YESTERDAY DURING THE
DAY OR AT NIGHT DID [child’s name] CONSUME
WATER?
___ ___
94. INFANT FORMULA Yes . . . . . . . . . . . . . . . . . . . . . . . . . . 1

NOURISH Project Baseline Survey Report 66
No . . . . . . . . . . . . . . . . . . . . . . . . . . 2 SKIP TO Q96
Don't Know . . . . . . . . . . . . . . . . . . . 88
95. HOW MANY TIMES YESTERDAY DURING THE
DAY OR AT NIGHT DID [child’s name] CONSUME
FORMULA?
___ ___
96. DID [child’s name] HAVE ANY MILK SUCH AS
TINNED CONDENSED, POWDERED, OR FRESH
MILK?
Yes . . . . . . . . . . . . . . . . . . . . . . . . . . 1
No . . . . . . . . . . . . . . . . . . . . . . . . . . 2 SKIP TO Q98
Don't Know . . . . . . . . . . . . . . . . . . . 88
97. HOW MANY TIMES YESTERDAY DURING THE
DAY OR NIGHT DID [child’s name] CONSUME
MILK?
___ ___
98. DID [child’s name] HAVE ANY JUICE?
Yes . . . . . . . . . . . . . . . . . . . . . . . . . . 1
No . . . . . . . . . . . . . . . . . . . . . . . . . . 2
Don't Know . . . . . . . . . . . . . . . . . . . 88
99. PLAIN SOUP BROTH?
Yes . . . . . . . . . . . . . . . . . . . . . . . . . . 1
No . . . . . . . . . . . . . . . . . . . . . . . . . . 2
Don't Know . . . . . . . . . . . . . . . . . . . 88
100. BORBOR?
Yes . . . . . . . . . . . . . . . . . . . . . . . . . . 1
No . . . . . . . . . . . . . . . . . . . . . . . . . . 2
Don't Know . . . . . . . . . . . . . . . . . . . 88
101. ANY OTHER LIQUIDS?
Yes . . . . . . . . . . . . . . . . . . . . . . . . . . 1
No . . . . . . . . . . . . . . . . . . . . . . . . . . 2
Don't Know . . . . . . . . . . . . . . . . . . . 88
Now I would like to ask you about some medicines and
vitamins that are sometimes given to infants.
102. WAS [child’s name] GIVEN ANY VITAMIN DROPS
OR OTHER MEDICINES AS DROPS YESTERDAY
DURING THE DAY OR AT NIGHT?
Yes . . . . . . . . . . . . . . . . . . . . . . . . . . 1
No . . . . . . . . . . . . . . . . . . . . . . . . . . 2
Don't Know . . . . . . . . . . . . . . . . . . . 88
103. WAS [child’s name] GIVEN ORASEL YESTERDAY
DURING THE DAY OR AT NIGHT?
Yes . . . . . . . . . . . . . . . . . . . . . . . . . . 1
No . . . . . . . . . . . . . . . . . . . . . . . . . . 2
Don't Know . . . . . . . . . . . . . . . . . . . 88

NOURISH Project Baseline Survey Report 67
Check age of child:
Child age over 6-23 months Continue with this module. Child age over 23 months End Interview.
QUESTION
104. WAS [child’s name] EVER BREASTFED?
Yes . . . . . . . . . . . . . . . . . . . . . . . . . . 1
No . . . . . . . . . . . . . . . . . . . . . . . . . . 2
Don't Know . . . . . . . . . . . . . . . . . . . 88
105. PLEASE DESCRIBE EVERYTHING THAT [child’s name] ATE YESTERDAY DURING THE DAY OR
NIGHT, WHETHER AT HOME OR OUTSIDE THE HOME.
A) THINK ABOUT WHEN [child’s name] FIRST WOKE UP YESTERDAY. DID [child’s name] EAT
ANYTHING AT THAT TIME?
IF YES: Please tell me everything [child’s name] ate at that time.
PROBE: Anything else? UNTIL RESPONDENT SAYS NOTHING ELSE. THEN CONTINUE TO PART B).
IF NO, CONTINUE TO PART B).
B) WHAT DID [child’s name] EAT NEXT?
IF YES: Please tell me everything [child’s name] ate at that time.
PROBE: Anything else? REPEAT UNTIL RESPONDENT SAYS NOTHING ELSE.
IF RESPONDENT MENTIONS MIXED DISHES LIKE A PORRIDGE, SAUCE, OR SOUP, PROBE:
C) WHAT INGREDIENTS WERE IN THAT [MIXED DISH]? PROBE: ANYTHING ELSE? UNTIL
RESPONDENT SAYS NOTHING ELSE.
AS THE RESPONDENT RECALLS FOODS, CIRCLE THE 1 BY THE CORRESPONDING FOOD. IF THE FOOD
IS NOT LISTED IN ANY OF THE FOOD GROUPS BELOW, WRITE THE FOOD IN THE BOX LABELED
‘OTHER FOODS.’ IF FOODS ARE USED IN SMALL AMOUNTS FOR SEASONING OR AS A CONDIMENT,
INCLUDE THEM UNDER THE CONDIMENTS FOOD GROUP. ONCE THE RESPONDENT FINISHES
RECALLING FOODS EATEN, READ EACH FOOD GROUP WHERE ‘1’ WAS NOT ENTERED IN THE
RESPONSE BOX, ASK AND ENTER ‘1’ IF RESPONDENT SAYS YES, ‘2’ IF NO, AND ‘88’ IF DON’T KNOW.

NOURISH Project Baseline Survey Report 68
OTHER FOODS: PLEASE WRITE DOWN OTHER
FOODS (TO THE RIGHT OF THIS BOX) THAT
RESPONDENT MENTIONED BUT ARE NOT IN
THE LIST BELOW. THIS WILL ALLOW THE
SURVEY SUPERVISOR TO CLASSIFY THE FOOD
LATER.
RESPONSE
CODES
WRITE FOODS MENTIONED HOW MANY TIMES?
Food made from grains such as rice,
noodles, porridge
YES . . . . . . .. . . . . 1
NO . . . . . . . . . . . 2
DON'T KNOW . . . 88
Beans YES . . . . . . .. . . . . 1
NO . . . . . . . . . . . 2
DON'T KNOW . . . 88
Nuts and seeds YES . . . . . . .. . . . . 1
NO . . . . . . . . . . . 2
DON'T KNOW . . . 88
Pumpkin, carrots, squash, or sweet
potatoes that are yellow or orange inside
YES . . . . . . .. . . . . 1
NO . . . . . . . . . . . 2
DON'T KNOW . . . 88
White potatoes, white yams, or any other
foods made from roots
YES . . . . . . .. . . . . 1
NO . . . . . . . . . . . 2
DON'T KNOW . . . 88
Any dark green leafy vegetables such as
amaranth leaves, moringa, morning glory,
water spinach
YES . . . . . . .. . . . . 1
NO . . . . . . . . . . . 2
DON'T KNOW . . . 88
Ripe mangoes, ripe papaya, jackfruit
YES . . . . . . .. . . . . 1
NO . . . . . . . . . . . 2
DON'T KNOW . . . 88
Any other fruits or vegetables
YES . . . . . . .. . . . . 1
NO . . . . . . . . . . . 2
DON'T KNOW . . . 88
Liver, kidney, heart, or other organ meats
YES . . . . . . .. . . . . 1
NO . . . . . . . . . . . 2
DON'T KNOW . . . 88
Flesh foods (ie meat, such as beef, pork,
chicken, or duck)
YES . . . . . . .. . . . . 1
NO . . . . . . . . . . . 2
DON'T KNOW . . . 88
Wild animals like frogs, snails, crabs, insects YES . . . . . . .. . . . . 1

NOURISH Project Baseline Survey Report 69
OTHER FOODS: PLEASE WRITE DOWN OTHER
FOODS (TO THE RIGHT OF THIS BOX) THAT
RESPONDENT MENTIONED BUT ARE NOT IN
THE LIST BELOW. THIS WILL ALLOW THE
SURVEY SUPERVISOR TO CLASSIFY THE FOOD
LATER.
RESPONSE
CODES
WRITE FOODS MENTIONED HOW MANY TIMES?
NO . . . . . . . . . . . 2
DON'T KNOW . . . 88
Duck or chicken eggs
YES . . . . . . .. . . . . 1
NO . . . . . . . . . . . 2
DON'T KNOW . . . 88
Fresh or dried fish YES . . . . . . .. . . . . 1
NO . . . . . . . . . . . 2
DON'T KNOW . . . 88
Small rice field fish YES . . . . . . .. . . . . 1
NO . . . . . . . . . . . 2
DON'T KNOW . . . 88
Any foods made from beans, nuts, or seeds
YES . . . . . . .. . . . . 1
NO . . . . . . . . . . . 2
DON'T KNOW . . . 88
Cheese, yogurt, or other milk products
YES . . . . . . .. . . . . 1
NO . . . . . . . . . . . 2
DON'T KNOW . . . 88
Breastmilk
YES . . . . . . .. . . . . 1
NO . . . . . . . . . . . 2
DON'T KNOW . . . 88
Any oil, fats, or butter, or foods made with
any of these
YES . . . . . . .. . . . . 1
NO . . . . . . . . . . . 2
DON'T KNOW . . . 88
Any sugary foods such as sweets, candies,
cakes, or biscuits
YES . . . . . . .. . . . . 1
NO . . . . . . . . . . . 2
DON'T KNOW . . . 88
Any packaged snacks such as chips
YES . . . . . . .. . . . . 1
NO . . . . . . . . . . . 2
DON'T KNOW . . . 88
Condiments for flavor, such as soy sauce,
prahok
YES . . . . . . .. . . . . 1
NO . . . . . . . . . . . 2
DON'T KNOW . . . 88

NOURISH Project Baseline Survey Report 70
OTHER FOODS: PLEASE WRITE DOWN OTHER
FOODS (TO THE RIGHT OF THIS BOX) THAT
RESPONDENT MENTIONED BUT ARE NOT IN
THE LIST BELOW. THIS WILL ALLOW THE
SURVEY SUPERVISOR TO CLASSIFY THE FOOD
LATER.
RESPONSE
CODES
WRITE FOODS MENTIONED HOW MANY TIMES?
CHECK CATEGORIES
all ‘no’ >> go to 85. If at least one ‘yes’ or all ‘DK’ go to 86
106. DID [child’s name] EAT ANY OTHER
SOLID, SEMI-SOLID, OR SOFT FOODS
YESTERDAY DURING THE DAY OR AT
NIGHT?
IF ‘YES’ PROBE: What kind of solid, semi-solid,
or soft foods did [child’s name] eat?
1 = Yes >> go back to
list and record foods
eaten. Then continue.
2 = No >> skip to 87
88 = Don’t Know >>
skip to 87
107. HOW MANY TIMES DID [child’s name]
EAT SOLID, SEMI-SOLID, OR SOFT
FOODS OTHER THAN LIQUIDS
YESTERDAY DURING THE DAY OR AT
NIGHT?
___ ____
DON'T KNOW . . . 88

NOURISH Project Baseline Survey Report 71
VIII. CHILD CARE AND DEVELOPMENT
Check age of child:
Child age 0-5 months End Interview
Child age 6-23 months Continue with this module. Child age over 23 months End Interview
QUESTION RESPONSE
108. IN THE PAST 3 DAYS, DID YOU OR ANY
HOUSEHOLD MEMBER AGE 15 OR OVER
ENGAGE IN ANY OF THE FOLLOWING
ACTIVITIES WITH (CHILD’S NAME):
If yes, ask:
WHO ENGAGED IN THIS ACTIVITY WITH (CHILD’S
NAME)?
Read and circle all that apply. a) TOLD STORIES TO (CHILD’S NAME)?
b) SANG SONGS TO OR WITH (CHILD?
c) TOOK (CHILD) OUTSIDE THE HOME?
d) PLAYED WITH (CHILD)?
e) NAMED, COUNTED OR DREW THINGS WITH (CHILD)?
f) SHOW OR TEACH (CHILD) SOMETHING NEW?
g) TALK WITH (CHILD) AND ASK SIMPLE QUESTIONS?
h) PRAISE (CHILD) FOR WHAT S/HE IS LEARNING?
i) SHOW AFFECTION TO (CHILD)?
j) HIT (CHILD) FOR MISBEHAVING?
k) CRITICIZE OR YELL AT (CHILD)?
Mother Father Grandmother Other
Told Stories 1 2 3 4
Sang Songs 1 2 3 4
Took on outing 1 2 3 4
Played 1 2 3 4
Counted, Drew 1 2 3 4
Teach/show new 1 2 3 4
Talk/ask questions 1 2 3 4
Praise for learning 1 2 3 4
Show affection 1 2 3 4
Hit 1 2 3 4
Yell 1 2 3 4
88 QUESTIONS Everyday
1
Several
times/week
2
Once /
week
3
A few times/
month
4
Several times/
year
5
Not at
all
6
a) HOW OFTEN DO YOU TALK
ABOUT (child’s name) YOUR
CHILD’S WEIGHT AND
HEIGHT WITH YOUR SPOUSE
(OR PARENTS OF THE CHILD)
□ □ □ □ □ □
b) HOW OFTEN DO YOU TALK
ABOUT YOUR CHILD’S FEEDING
WITH YOUR SPOUSE?
□ □ □ □ □ □
c) HOW OFTEN DO YOU TALK
ABOUT (child’s name) NEW SKILLS
/DEVELOPMENT WITH YOUR
SPOUSE?
□ □ □ □ □ □
d) HOW OFTEN DO YOU TALK
WITH YOUR SPOUSE ABOUT
CARE OF (child’s name)?
□ □ □ □ □ □
e) HOW OFTEN DO YOU TALK
ABOUT PARENTING WITH
OTHER PERSONS (NOT SPOUSE
AND PARENTS)
□ □ □ □ □ □
f) HOW OFTEN DO YOU TALK
ABOUT (child’s name) FUTURE? □ □ □ □ □ □

NOURISH Project Baseline Survey Report 72
QUESTION RESPONSE 89. WHEN DO YOU FEEL STRESSED OR WORRIED? Family does not help/support .. . . .1
Husband causes trouble. . . . . . . .. 2
When sick . . . . . ... . .. . . . . . . …. . . . 3
Child is sick . . . . . . . .. . . . . . . …. . . . 4
Child is not obedient. . . . . .. . . . . . . .5
Neighbors are in conflict . . . . . . . . . 6
Family is in conflict . . . . . . . . . . . . . . 7
Income poor . . . . . . . . . . . . . . . . . . .. 8
Not enough food ……. . . . . . . . . .. . . 9
Other _______________________ 99
90. WHEN DO YOU FEEL HAPPY? Family helps/supports . . . . . . .. . . . 1
Husband plays with child . . . . . . . . . 2
Husband does not cause trouble. . 3
Husband is kind……………. . . . . . . . . 4
Not sick . . . . ….. ... . .. . . . . . . …. . . . 5
Child is not sick . . . . . . . .. . . . . . . . . 6
Child is obedient. . . . . . . . .. . . . . . . . 7
Neighbors are in harmony . . . . . . . . 8
Family harmony . . . . . . . . . . . . . . . . 9
Family standard of living. . . . . . . . .. 10
Enough food ……. . . . . . . . . . . . . . . . 11
When get income . . . . . . . . . . . . . . . 12
Other _______________________ 99
91. ON A REGULAR DAY, HOW MANY HOURS DO YOU
SPEND TIME TALKING, WALKING, AND/OR PLAYING
WITH (child’s name)?
________ HOURS
________ MINUTES
92. ON A REGULAR DAY, HOW MANY HOURS DOES A
DIFFERENT ADULT SPEND TIME TALKING,
WALKING, AND/OR PLAYING WITH (child’s name)?
________ HOURS
________ MINUTES
WHO IS THE ADULT?
Mother . . . . . . . . . . . . . . . . . . . .. . . . 1
Father . . . . . . . . . . . . . . . . . . . . . . . . 2
Grandmother/father . . . . .. . . . . . . . 3
Aunt . . . . . . . . . . . . . . . . . . . . . . . . . . 4
None . . . . . . . . . . . . . . . . . . . . . . . . . 5
Other ________________________99
93. (child’s name) LETS ME KNOW WHEN S/HE IS FULL
Yes . . . . . . . . . . . . . . . . . . . . . . . . . . 1
No . . . . . . . . . . . . . . . . . . . . . . . . . . 2
Don't Know . . . . . . . . . . . . . . . . . . . 88
94. (child’s name) LETS ME KNOWS WHEN S/HE IS
HUNGRY
Yes . . . . . . . . . . . . . . . . . . . . . . . . . . 1
No . . . . . . . . . . . . . . . . . . . . . . . . . . 2
Don't Know . . . . . . . . . . . . . . . . . . . 88
95. I LET (child’s name) DECIDE HOW MUCH TO EAT
Yes . . . . . . . . . . . . . . . . . . . . . . . . . . 1
No . . . . . . . . . . . . . . . . . . . . . . . . . . 2
Don't Know . . . . . . . . . . . . . . . . . . . 88
96. I KEEP TRACK OF HOW MUCH FOOD THE CHILD
EATS EVERY MEAL
Yes . . . . . . . . . . . . . . . . . . . . . . . . . . 1
No . . . . . . . . . . . . . . . . . . . . . . . . . . 2
Don't Know . . . . . . . . . . . . . . . . . . . 88
This is the final section of the interview. It is about your ideas and opinions only. There are no right or wrong answers. I will read a
statement. Tell me if you agree, somewhat agree, or disagree with each statement.
97. I PLAY A CRUCIAL ROLE IN MY CHILD’S
DEVELOPMENT AND GROWTH
Agree . . . . . . . . . . . . . . . . . . . . . . . . 1
Somewhat agree . . . . . . . . . . . . . . 2
Disagree . . . . . . . . . . . . . . . . . . . . . 3
Don't Know . . . . . . . . . . . . . . . . . . . 88
98. EVEN WHEN I AM BUSY WITH MY WORK, I CAN
MAKE TIME FOR MY CHILD IN ORDER TO TAKE
CARE OF HIM/HER.
Agree . . . . . . . . . . . . . . . . . . . . . . . . 1
Somewhat agree . . . . . . . . . . . . . . 2
Disagree . . . . . . . . . . . . . . . . . . . . . 3
Don't Know . . . . . . . . . . . . . . . . . . . 88

NOURISH Project Baseline Survey Report 73
QUESTION RESPONSE 99. I THINK PRAISING CHILDREN WHENEVER HE/SHE
TRIES TO DO SOMETHING NEW IS IMPORTANT
Agree . . . . . . . . . . . . . . . . . . . . . . . . 1
Somewhat agree . . . . . . . . . . . . . . 2
Disagree . . . . . . . . . . . . . . . . . . . . . 3
Don't Know . . . . . . . . . . . . . . . . . . . 88
100. A CHILD SHOULD BE ABLE TO EAT WHATEVER
S/HE WANTS FOR SNACKS WHEN HUNGRY
Agree . . . . . . . . . . . . . . . . . . . . . . . . 1
Somewhat agree . . . . . . . . . . . . . . 2
Disagree . . . . . . . . . . . . . . . . . . . . . 3
Don't Know . . . . . . . . . . . . . . . . . . . 88
101. I WILL RETRY NEW FOODS FOR THE YOUNG CHILD
IF THEY ARE REJECTED AT FIRST
Agree . . . . . . . . . . . . . . . . . . . . . . . . 1
Somewhat agree . . . . . . . . . . . . . . 2
Disagree . . . . . . . . . . . . . . . . . . . . . 3
Don't Know . . . . . . . . . . . . . . . . . . . 88
102. IT IS IMPORTANT TO HELP OR ENCOURAGE A
YOUNG CHILD TO EAT
Agree . . . . . . . . . . . . . . . . . . . . . . . . 1
Somewhat agree . . . . . . . . . . . . . . 2
Disagree . . . . . . . . . . . . . . . . . . . . . 3
Don't Know . . . . . . . . . . . . . . . . . . . 88
103. IT IS IMPORTANT FOR ADULT CAREGIVERS TO
DECIDE HOW MUCH A CHILD EATS
Agree . . . . . . . . . . . . . . . . . . . . . . . . 1
Somewhat agree . . . . . . . . . . . . . . 2
Disagree . . . . . . . . . . . . . . . . . . . . . 3
Don't Know . . . . . . . . . . . . . . . . . . . 88
104. WHEN DO YOU USUALLY WATCH TV?
Morning . . . . . . . . . . . . . . . . . . . . . . 1
Afternoon . . . . . . . . . . . . . . . . . . . . 2
Evening . . . . . . . . . . . . . . . . . . . . . . 3
Night . . . . . . . . . . . . . . . . . . . . . . . . 4
No set time usually . . . . . . . . . . . . . 5
Do not watch. . . . . . . . . . . . . . . . . . 6 END
INTERVIEW
105. WHAT STATIONS DO YOU MAINLY WATCH?
TV5……. . . . . . . . . . . . . . . . . . . . . . . 1
HangMeas TV. . . . . . . . . . . . . . . . . 2
CNC TV . . . . . . . . . . . . . . . . . . . . . 3
My TV . . . . . . . . . . . . . . . . . . . . . . . 4
Bayon TV . . . . . . . . . . . . . . . . . . . . . 5
TVK . . . . . . . . . . . . . . . . . . . . . . . .. . 6
SEATV . . . . . . . . . . . . .. . . . . . . . . . . 7
CTN. . . . . . . . . . . . . . . . . . . . . . . . . . 8
Other ______________________99
106. WHO ELSE USUALLY WATCHES WITH YOU? Children . . . . . . . . . . . . . . . . . . . . . . 1
Husband ……………. . . . . . . . . . . . . . 2
Other family. . . . . . . . . . . . . . . . . . . 3
Neighbor . . . . . . . . . . . . . . . .. . . . . . 4
Other _______________________99

NOURISH Project Baseline Survey Report 74
QUESTIONNAIRE ID#___________
Women of Reproductive Age
IDENTIFICATION
PROVINCE
DISTRICT
COMMUNE
VILLAGE
CLUSTER NUMBER
HOUSEHOLD CODE
. . . . . . . . . . . . . . . . . . . . . . . . . . . . . . . .
. . . . . . . . . . . . . . . . . . . . . . . . . . . . . . . .
. . . . . . . . . . . . . . . . . . . . . . . . . . . . . . . .
. . . . . . . . . . . . . . . . . . . . . . . . . . . . . . . .
. . . . . . . . . . . . . . . . . . . . . . . . . . . . . . . .
. . . . . . . . . . . . . . . . . . . . . . . . . . . . . . . .
HOUSEHOLD VISIT
DATE
INTERVIEWER'S NAME AND
CODE
SUPERVISOR NAME AND CODE
. . . . . . . . . . . . . . . . . . . . . . . . . . . . . . . .
. . . . . . . . . . . . . . . . . . . . . . . . . . . . . . . .
. . . . . . . . . . . . . . . . . . . . . . . . . . . . . . . .
TIME INTERVIEW STARTED
TIME INTERVIEW COMPLETED
Hello. My name is _______________________________________. I am working with the
NOURISH Project. We are conducting a survey about nutrition in Cambodia. The information we
collect will help to plan services for villages like yours. You were selected for the survey. I would like
to ask you some questions. The questions usually take about 1 hour. READ THE CONSENT FORM.
SIGNATURE OF INTERVIEWER: _____________________________ DATE:
___________________
RESPONDENT AGREES TO BE INTERVIEWED . . . . . . . . . . . . 1
RESPONDENT DOES NOT AGREE TO BE INTERVIEWED . . . . 2 END
Do you have any questions?
May I begin the interview now?

NOURISH Project Baseline Survey Report 75
1. BASIC INFORMATION
QUESTION RESPONSE
1. IN WHAT MONTH AND YEAR WERE YOU BORN?
IF DON’T KNOW, KHMER MONTH AND YEAR BORN?
2. HOW OLD WERE YOU AT YOUR LAST BIRTHDAY?
Gregorian Month ___________
Gregorian Year ___ ___ ___ ___
Don't Know . . . . . . . . . . . . . .88
_______________________
________ Years
3. HAVE YOU EVER ATTENDED SCHOOL?
4. WHAT IS THE HIGHEST LEVEL OF SCHOOL YOU
ATTENDED?
Yes . . . . . . . . . . . . . . . . . . . . . . . . . . 1
No . . . . . . . . . . . . . . . . . . . . . . . . . . 2 SKIP TO Q5
Don't Know . . . . . . . . . . . . . . . . . . .88
Primary (1-6) . . . . . . . . . . . . . . . . .. 1
Lower Secondary (7-9) . . . . ... . . . 2
Upper Secondary (10-12) . . . .. . . 3
Higher. . . . . . . . . . . . . . . . . . . . .. . 4
Other_______________________00
No Answer. . . . . . . . . . . . . . . . . . …99
5. HAVE YOU EVER BEEN MARRIED?
Yes . . . . . . . . . . . . . . . . . . . . . . . . . . 1
No . . . . . . . . . . . . . . . . . . . . . . . . . . 2 SKIP TO Q11
Don't Know . . . . . . . . . . . . . . . . . . .88
6. WHAT IS YOUR MARITAL STATUS?
Currently married. . . . . . . . . . . . . . 1
Widowed . . . . . . . . . . . . . . . . . . . . 2
Divorced . . . . . . . . . . . . . . . . . . . . . 3 SKIP TO Q11
No Answer . . . . . . . . . . . . . . . . . . . 99
7. DID YOUR (LAST) (HUSBAND/PARTNER) EVER
ATTEND SCHOOL?
8. WHAT IS THE HIGHEST LEVEL OF SCHOOL HE
ATTENDED?
Yes . . . . . . . . . . . . . . . . . . . . . . . . . . 1
No . . . . . . . . . . . . . . . . . . . . . . . . . . 2 SKIP TO Q9
Don't Know . . . . . . . . . . . . . . . . . . .88
Primary (1-6) . . . . . . . . . . . . . . . . .. 1
Lower Secondary (7-9) . . . . ... . . . 2
Upper Secondary (10-12) . . . .. . . 3
Higher. . . . . . . . . . . . . . . . . . . . .. . 4
No Answer. . . . . . . . . . . . . . . . . . …99
9. HOW OLD IS YOUR (LAST) (HUSBAND/PARTNER)? Under 20. . . . . . . . . . . . . . . . . . . . . . 1
20-29. . . . . . . . . . . . . . . . . . . . . . . . 2
30-39. . . . . . . . . . . . . . . . . . . . . . . . 3
40-49. . . . . . . . . . . . . . . . . . . . . . . . 4
50-59. . . . . . . . . . . . . . . . . . . . . . . . 5
60 or over . . . . . . . . . . . . . . . . . . . . 6
Don't Know . . . . . . . . . . . . . . . . . . . 88
Age: _______
10. WHAT IS YOUR HUSBAND'S MAIN OCCUPATION?
THAT IS, WHAT KIND OF WORK DOES HE MAINLY
DO?
Farmer . . . . . . . . . . . . . . . . . . …. . ..1
Factory . . . . . . . . . . . . . . . . . . . …. .. 2
Retail…….. . . . . . . . . . . . . . . . . . . ….3
Tailor/sewing……….. . . . . . . . . . . ….4
Motor taxi……………………………………..5
Construction/carpenter…………………6
Teacher or official………………………….7
Unemployed …………………………………8
Other _______________________00
Don’t know……………………………… … 88
11. WHAT IS YOUR OCCUPATION, THAT IS, WHAT KIND
OF WORK DO YOU MAINLY DO? (Circle the main type of
work)
Farmer . . . . . . . . . . . . . . . . . . …. . ..1
Factory . . . . . . . . . . . . . . . . . . . …. .. 2
Retail…….. . . . . . . . . . . . . . . . . . . ….3
Motor taxi……………………………………..4

NOURISH Project Baseline Survey Report 76
QUESTION RESPONSE Construction/carpenter…………………5
Teacher or official………………………….6
Unemployed …………………………………7
Housewife …………………,…………………8
Daily labor (no regular work)………..9
Don’t know……………………………… … 88
As you know, some women take up other jobs for which they are paid
in cash or kind. Others sell things, have a small business or work
outside sometimes.
12. HAVE YOU DONE ANY SUCH WORK IN THE LAST 12
MONTHS?
Yes . . . . . . . . . . . . . . . . . . . . . . . . . . 1
No . . . . . . . . . . . . . . . . . . . . . . . . . . 2
Don't Know . . . . . . . . . . . . . . . . . . .88
13. IF YES, WHAT KIND OF WORK IS THIS?
____________________________
____________________________
14. DO YOU USUALLY WORK THROUGHOUT THE
YEAR, OR DO YOU WORK SEASONALLY, OR ONLY
ONCE IN A WHILE?
All Year. . . . . . . . . . . . . . . . . . . . . . . . 1
Wet Season . . . . . . . . . . . . . . . . . .. . 2
Dry Season . . . . . . . . . . . . . . . . . . . . 3
Sometimes. . . . . . . . . . . . . . . . . . . . . 4
No answer.. . . . . . . . . . . . . . . . . . . .. 99
15. ARE YOU PAID IN CASH OR KIND FOR THIS WORK
OR ARE YOU NOT PAID AT ALL?
Cash. . . . . . . . . . . . . . . . . . . . . . . . . . . 1
In Kind . . . . . . . . . . . . . . . . . . . . . . . . 2
Both cash and in-kind. . . . . . . . . . . 3
Not paid. . . . . . . . . . . . . . . . . . . . . . . 4
No answer.. . . . . . . . . . . . . . . . . . . .. 99
16. DOES YOUR FAMILY HAVE AN ID POOR CARD?
Request to see the card.
Yes Observed. . . . . . . . . . . . . . .. . …. 1
Yes Not Observed . . . . . . . . . . . . …. 2
No . . . . . . . . . . . . . . . . . . . . . . . . .. …. 3
Don't Know . . . . . . . . . . . . . . . .. . . …88
No answer.. . . . . . . . . . . . . . . . . . . .. 99
17. DOES THE HOUSEHOLD OWN ANY
AGRICULTURAL LAND (NOT IN COMPOUND)?
Yes . . . . . . . . . . . . . . . . . . . . ….. . . .. 1
No . . . . . . . . . . . . . . . . . . . . . . . …... .. 2 SKIP TO Q.19
Don't Know . . . . . . . . . . . . . . . . . …….88
18. HOW MANY METERS OR HECTARES OF
AGRICULTURAL LAND DO MEMBERS OF THIS
HOUSEHOLD OWN?
Sq. Meter 1 #_______
A 2 #_______
Hectares 3 #_______
Ray 4 #_______
Kong 5 #_______
Don't Know 88 #_______
19. DOES YOUR HOUSEHOLD GROW ANY FOOD
AT HOME FOR CONSUMPTION?
Request to see the garden.
Yes Observed. . . . . . . . . . . . . ….. .. . 1
Yes Not Observed . . . . . . . . . . ….. 2
No . . . . . . . . . . . . . . . . . . . . . . . . ……3 SKIP TO Q.25
Don't Know . . . . . . . . . . . . . . . .. . …88
20. IF YOUR HOUSEHOLD GROWS ANY FOOD IN
THE HOME COMPOUND, WHAT DO YOU
GROW? (CIRCLE ALL GROWN AT DIFFERENT
TIMES OF THE YEAR.)
Ptee (Amaranth) . . . . . . . . . .. . .. . 1
Moringa. . . . . . . . . . . .. . . . . .. . . . . 2
Pumpkin . . . . . . . . . . . . . . . . . . . . . 3
Sweet Potato . . . . . . . . . . . . . . . . . 4
Long Bean . . . . . . . . . . . . . . . . . . . .5
Jackfruit. . . . . . . . . . . . . . . . . . . . .. 6
Mango. . . . . . . . . . . . . . . . . . . . . . . 7
Banana . . . . . . . . . . . . . . . . . . .. . . .8
Other ______________________ 00
Don’t know . . . . . . . . . . . . . . . . . … 88
21. IF YOUR HOUSEHOLD GROWS FOOD AT
HOME, WHAT DO YOU DO WITH THE
PRODUCE? (Circle all answers given).
Eat . . . . . . . . . . . .. . . . . . . . . . . . . 1
Sell. . . . . . . . . . . . . . . . . . . . .. . . . . 2
Give to family and friends. . . . . . . 3
Give to neighbors. . . . . . . . . . . . . .4
Give to animals . . . . . . . . . . . . . .. . 5
Throw away. . . . . . . . . . . . . . . . . . 6
Other ______________________ 00

NOURISH Project Baseline Survey Report 77
QUESTION RESPONSE Don’t know . . . . . . . . . . . . . . . . . . .88
22. IF YOU SELL SOME, HOW MUCH MONEY DO
YOU MAKE FROM SELLING THESE EACH YEAR?
___________ Riel
[Ask only if she grows ptee, yardlong bean, moringa, or
sweet potato in #20. If no, SKIP TO Q25]
23. HOW MUCH OF ______ THAT YOU GROW DID
YOUR HOUSEHOLD EAT IN THE PAST WEEK?
None Bunch ½ kilo 1 kilo 2-5 kilos More
Amaranth 0 1 2 3 4 5
Moringa 0 1 2 3 4 5
Sweet potato0 1 2 3 4 5
Long bean 0 1 2 3 4 5
Ask only if she grows and eats ptee, yardlong bean,
moringa, or sweet potato in #20. If no, SKIP TO Q25]
24. WHO EATS THE PRODUCE USUALLY?
(Read answers and circle all answers given).
Men . . .. . . . . . . . . . . . . . . . . . .. . .1
Women . . .. . . . . . . . . . . . . . . .. . . 2
Pregnant women. . .. . . . . . . .. ... . . 3
Children over 1 year . . . ... . .. . . ... .4
Children 1 year – 2 years. . . . . . .. ...5
Children over 2 years . . . . . . . . . ...6
Other _______________________ 00
Don’t know . . . . . . . . . . . . . . . . . . ...88
Now I would like to ask you about children.
25. HOW MANY CHILDREN DO YOU ALREADY HAVE?
__ __
26. ARE YOU PREGNANT NOW?
Yes . . . . . . . . . . . . . . . . . . . . . . . .. . ..1 SKIP TO Q.29
No . . . . . . . . . . . . . . . . . . . . . . . . … 2
Don't Know . . . . . . . . . . . . . . . . … . 88
No answer.. . . . . . . . . . . . . . . . . . . ..99
27. HAVE YOU BEEN PREGNANT IN THE PAST 12
MONTHS?
Yes . . . . . . . . . . . . . . . . . . . . . . . .. . ..1
No . . . . . . . . . . . . . . . . . . . . . . . . … 2 SKIP TO Q.31
No answer.. . . . . . . . . . . . . . . . . . . ..99
28. WAS IT FULL TERM PREGNANCY?
Yes . . . . . . . . . . . . . . . . . . . . . . . .. . ..1
No . . . . . . . . . . . . . . . . . . . . . . . . … 2
No answer.. . . . . . . . . . . . . . . . . . . ..99
29. HOW MUCH WEIGHT DID THE HEALTH
WORKER ADVISE YOU TO GAIN DURING
PREGNANCY?
Less than 10 kg. . . . . . . . . . . . . .. . ..1
10-12.0 kg . . . . . . . . . . . . . . . . . . . . 2
12.1- 14.9kg . . . . . . . . . . . . . . . . . . 3
14.9-17.9 kg . . . . . . . . . . . . . . . . . …4
18 kg or more. . . . . . . . . . . . . . . . … 5
Don't Know . . . . . . . . . . . . . . . . … . 88
30. HOW MUCH WEIGHT DID YOU GAIN DURING
PREGNANCY?
Less than 10 kg. . . . . . . . . . . . . .. . ..1
10-12.0 kg . . . . . . . . . . . . . . . . . . . . 2
12.1- 14.9kg . . . . . . . . . . . . . . . . . . 3
14.9-17.9 kg . . . . . . . . . . . . . . . . . …4
18 kg or more. . . . . . . . . . . . . . . . … 5
Don't Know . . . . . . . . . . . . . . . . … . 88
2. WEIGHT AND HEIGHT (Women who are not pregnant only.)
31. Weight in kg __ __. __
32. Height in cm __ __ __. __
3. ANEMIA IF AGE <18 AND NOT MARRIED; CAREGIVER MUST GIVE CONSENT: DETERMINE WHO IS
ADULT RESPONSIBLE/CAREGIVER FOR ADOLESCENT AND ASK THE FOLLOWING.
As part of this survey, we are asking people all over the province to take an anemia test. Anemia is a
serious health problem that usually results from a genetic disorder, poor nutrition, infection, or chronic

NOURISH Project Baseline Survey Report 78
disease. For the anemia testing, we will need a few drops of blood from a finger. The equipment used to
take the blood is clean and completely safe. It has never been used before and will be thrown away after
each test. The blood will be tested for anemia immediately, and the result will be told to you and
(NAME OF ADOLESCENT) right away. The result will be kept strictly confidential and will not be
shared with anyone other than members of our survey team. Do you have any questions?
You can say yes to the test for (NAME OF ADOLESCENT), or you can say no. It is up to you to
decide.
Will you allow (NAME OF ADOLESCENT) to take the anemia test?
Yes
No
CIRCLE RESPONSE, AND GET SIGNATURE/MARK IF YES
Signature or Thumb Print of Guardian: __________________________________
IF OVER 18: As part of this survey, we are asking people all over the province to take an anemia
test. Anemia is a serious health problem that usually results from genetic disorder, poor nutrition,
infection, or chronic disease. We ask that women old take part in anemia testing in this survey and
give a few drops of blood from a finger or heel. The equipment used to take the blood is clean and
completely safe. It has never been used before and will be thrown away after each test. The blood
will be tested for anemia immediately, and the result will be told to you right away. The result will be
kept strictly confidential and will not be shared with anyone other than members of our survey
team. Do you have any questions? You can say yes to the test, or you can say no. It is up to you to
decide. Will you participate in the anemia test?
Yes
No
CIRCLE RESPONSE AND GET SIGNATURE/MARK IF YES
Signature or Thumb Print of Guardian: __________________________________
33. GRAMS PER DECILITER __ __ . __
4. HYGIENE AND SANITATION
QUESTION RESPONSE
34. DO YOU DO ANYTHING TO THE
WATER TO MAKE IT SAFER TO
DRINK?
Yes . . . . . . . . . . . . . . . . . . . . . . . . . . . . 1
No . . . . . . . . . . . . . . . . . . . . . . . . . . . . . 2 SKIP TO Q38
Don't Know . . . . . . . . . . . . . . . . . . . . . 88
35. WHAT DO YOU USUALLY DO TO
MAKE THE WATER SAFER TO
DRINK?
(Confirm by observation)
Boil . . . . . . . . . . . . . . . . . . . . . …. . . . . .1
Filter . . . . . . . . . . . . . . . . . . . . . . . . . . . 2 SKIP TO Q37
Nothing . . . . . . . . . . . . . . . . . . . . . . . . 3 SKIP TO Q38
Chlorine . . . . . . . . . . . . . . . . . . . . . . . . 4
Buy drinking water . . . . . . . . . . . . . . 5
Other _________________________99
No answer . . . . . . . . . . . . . . . . . . . . . . 00
Based on answer above:
Water treatment device observed . . . . 1
Water treatment device not observed. 2
36. PLEASE SHOW ME WHAT HAPPENS TO
THE WATER AFTER TREATED.
Transferred to a covered, sealed, clean container. .1
Transferred to a an uncovered/unsealed, dirty
container………………………………………………………………
2

NOURISH Project Baseline Survey Report 79
QUESTION RESPONSE Kept in the container where it was boiled …………….3
37. HOW OFTEN IS THE FILTER CLEANED?
(Confirm by observation)
Daily . . . . . . . . . . . . . . . . . . . . . . . . . . . . 1
Every 2-3 days . . . . . . . . . . . . . . . . . . . ..2
Weekly . . . . . . . . . . . . . . . . . . . . . . . . . . 3
Monthly . . . . . . . . . . . . . . . . . . . . . . . . 4
Every few months. . . . . . . . . . . . . . . . . .5
Every year . . . . . . . . . . . . . . . . . . . . . . . .6
Do not remember. . . . . . . . . . . . . . . . . .9
Other _______________99
Observed:
Filter looks clean . . . . . . . . . . . . . . . . . 1
Filter looks dirty. . . . . . . . . . . . . . . . . . 2
38. WHAT KIND OF TOILET FACILITY DO
MEMBERS OF YOUR HOUSEHOLD
USUALLY USE?
(Confirm by observation)
Flush or pour flush toilet
Flush to piped sewer system . . . . . . . .1
Flush to septic tank . . . . . . . . . . . . . . . 2
Flush to pit latrine . . . . . . . . . . . . . . . . 3
Flush to somewhere else . . . . . . . . . . .4
Flush, don't know where . . . . . . . . . . .5
Pit latrine
Ventilated improved pit latrine .. . . . .6
Pit latrine with slab . . . . . . . . . . . . . . . 7
Pit latrine without slab/ open pit . . . 8
Composting toilet . . . . . . . . . . . . . . . . 9
Bucket toilet . . . . . . . . . . . . . . . . . . . 10
Hanging toilet/hanging latrine . . . . . 11
No facility/bush/field . . . . . . . . . . . . . 12 SKIP TO Q.41
Use another person/family’s latrine..13 SKIP TO Q41
Other _________________________99
(SPECIFY)
Answer above is confirmed by observation
Observed . . . . . . . . . . . . . .. . . . . .. 1
Not observed . . . . . . . . . . . . . . . . 2
39. DO YOU SHARE YOUR TOILET
FACILITY WITH OTHER HOUSEHOLDS?
Yes . . . . . . . . . . . . . . . . . . . . . . . . . . 1
No . . . . . . . . . . . . . . . . . . . . . . . . . . 2 SKIP TO Q.41
Don't Know . . . . . . . . . . . . . . . . . . . 88
40. HOW MANY HOUSEHOLDS USE YOUR
TOILET FACILITY?
Number ____ ____ ____
Don't know . . . . . . . .. 88
41. PLEASE SHOW ME WHERE MEMBERS
OF YOUR HOUSEHOLD MOST OFTEN
WASH THEIR HANDS.
Observed . . . . . . .. . . . . . . . . . . . . . .. . . . ….... 1
Not observed, not in dwelling/yard/plot . ... 2
Not observed, no permission to see . . . . . . . 3
Not observed, other reason . . . . . . . . . . . . . 4
[Note that anal cleansing water inside latrine is not considered hand
washing station]
42. OBSERVATION ONLY: OBSERVE
PRESENCE OF WATER AT THE SPECIFIC
PLACE FOR HANDWASHING.
Water is available . . . . . . . . . . . . . . . . . . . .. . 1
Water is not available . . . . . . . . . .. . . . . . . .2
43. OBSERVATION ONLY: OBSERVE
PRESENCE OF SOAP, DETERGENT, OR
OTHER CLEANSING AGENT.
Soap or detergent (bar, liquid, powder) . . .. 1
Ash, mud, sand . . . . . . . . . . . . . . . .. . . .. . . . 2
None. . . . . . . . . . . . . . . . . .. . . . . . .. . . . . . . 3

NOURISH Project Baseline Survey Report 80
QUESTION RESPONSE 44. OBSERVATION ONLY: OBSERVE
HANDWASHING STATION
(Circle all observed)
Near to platform (feeding/eating) place. . … 1
Within 10metres from toilet ………………………2
Protected from persons/ animals……..…..…...3
Water falls freely……………………………...…..….. 4
45. OBSERVATION ONLY: OBSERVE
PRESENCE OF A SEPARATE
HANDWASHING STATION
Tippy Tap …… . . . . . . . . . . . . . . . . ….. . . . .. . 1
Tippy Tap with soap . . . . .. . . . . . . . . . . . , .2
Happy Tap . . . . . . . . . . . . . . . . . . . ….. . . . .. . 3
Happy Tap with soap . . . . .. . . . . . . . . . . . , 4
No separate handwashing station . . . . . . . , 5
Other: ______________________________99
5. DIET
QUESTION
46. PLEASE DESCRIBE EVERYTHING THAT YOU ATE YESTERDAY DURING THE DAY OR NIGHT,
WHETHER AT HOME OR OUTSIDE THE HOME.
A) THINK ABOUT WHEN YOU FIRST WOKE UP YESTERDAY. DID YOU EAT ANYTHING AT THAT
TIME?
IF YES: Please tell me everything you ate at that time.
PROBE: Anything else? UNTIL RESPONDENT SAYS NOTHING ELSE. THEN CONTINUE TO PART B).
IF NO, CONTINUE TO PART B).
B) WHAT DID YOU EAT NEXT?
Please tell me everything you ate at that time. PROBE: Anything else?
UNTIL RESPONDENT SAYS NOTHING ELSE. REPEAT QUESTION B).
IF RESPONDENT MENTIONS MIXED DISHES LIKE A PORRIDGE, SAUCE, OR SOUP, PROBE:
C) WHAT INGREDIENTS WERE IN THAT [MIXED DISH]? PROBE: ANYTHING ELSE?
AS THE RESPONDENT RECALLS FOODS, UNDERLINE THE CORRESPONDING FOOD AND ENTER ‘1’ IN
THE RESPONSE BOX NEXT TO THE FOOD GROUP. IF THE FOOD IS NOT LISTED IN ANY OF THE FOOD
GROUPS BELOW, WRITE THE FOOD IN THE BOX LABELED ‘OTHER FOODS.’ IF FOODS ARE USED IN
SMALL AMOUNTS FOR SEASONING OR AS A CONDIMENT, INCLUDE THEM UNDER THE CONDIMENTS
FOOD GROUP. ONCE THE RESPONDENT FINISHES RECALLING FOODS EATEN, READ EACH FOOD
GROUP WHERE ‘1’ WAS NOT ENTERED IN THE RESPONSE BOX, ASK AND ENTER ‘1’ IF RESPONDENT
SAYS YES, ‘2’ IF NO, AND ‘88’ IF DON’T KNOW: OTHER FOODS: PLEASE WRITE DOWN OTHER FOODS (TO THE RIGHT OF
THIS BOX) MENTIONED BUT ARE NOT IN THE LIST BELOW. THIS WILL
ALLOW THE SURVEY SUPERVISOR TO CLASSIFY THE FOOD LATER.
RESPONSE CODES
WRITE FOODS
MENTIONED:
FOOD MADE FROM RICE, NOODLES, PORRIDGE Yes . . . . . . .. . . . . 1
No . . . . . . . . . . . 2
Don't Know . …. . 88
BEANS Yes . . . . . . .. . . . . 1
No . . . . . . . . . . . 2
Don't Know . …. . 88
NUTS AND SEEDS Yes . . . . . . .. . . . . 1
No . . . . . . . . . . . 2
Don't Know . …. . 88
PUMPKIN, CARROTS, SQUASH, OR SWEET POTATOES THAT
ARE YELLOW OR ORANGE INSIDE
Yes . . . . . . .. . . . . 1
No . . . . . . . . . . . 2
Don't Know . …. . 88
WHITE POTATOES OR ANY OTHER FOODS MADE FROM
ROOTS (CASSAVA, TARO, TURNIP)
Yes . . . . . . .. . . . . 1
No . . . . . . . . . . . 2
Don't Know . …. . 88

NOURISH Project Baseline Survey Report 81
OTHER FOODS: PLEASE WRITE DOWN OTHER FOODS (TO THE RIGHT OF
THIS BOX) MENTIONED BUT ARE NOT IN THE LIST BELOW. THIS WILL
ALLOW THE SURVEY SUPERVISOR TO CLASSIFY THE FOOD LATER.
RESPONSE CODES
WRITE FOODS
MENTIONED:
ANY DARK GREEN LEAFY VEGETABLES SUCH AS AMARANTH
LEAVES, MORINGA, MORNING GLORY, WATER SPINACH
Yes . . . . . . .. . . . . 1
No . . . . . . . . . . . 2
Don't Know . …. . 88
RIPE MANGOES, JACKFRUIT, RIPE PAPAYA
Yes . . . . . . .. . . . . 1
No . . . . . . . . . . . 2
Don't Know . …. . 88
ANY OTHER FRUITS OR VEGETABLES
Yes . . . . . . .. . . . . 1
No . . . . . . . . . . . 2
Don't Know . …. . 88
LIVER, KIDNEY, HEART, OR OTHER ORGAN MEATS
Yes . . . . . . .. . . . . 1
No . . . . . . . . . . . 2
Don't Know . …. . 88
FLESH FOODS (IE MEAT, SUCH AS BEEF, PORK, CHICKEN, OR
DUCK)
Yes . . . . . . .. . . . . 1
No . . . . . . . . . . . 2
Don't Know . …. . 88
WILD ANIMALS LIKE FROGS, CRABS, INSECTS
Yes . . . . . . .. . . . . 1
No . . . . . . . . . . . 2
Don't Know . …. . 88
DUCK OR CHICKEN EGGS
Yes . . . . . . .. . . . . 1
No . . . . . . . . . . . 2
Don't Know . …. . 88
FRESH OR DRIED FISH Yes . . . . . . .. . . . . 1
No . . . . . . . . . . . 2
Don't Know . …. . 88
ANY FOODS MADE FROM BEANS, NUTS, OR SEEDS
Yes . . . . . . .. . . . . 1
No . . . . . . . . . . . 2
Don't Know . …. . 88
CHEESE, YOGURT, OR OTHER MILK PRODUCTS
Yes . . . . . . .. . . . . 1
No . . . . . . . . . . . 2
Don't Know . …. . 88
ANY OIL, FATS, OR BUTTER, OR FOODS MADE WITH ANY OF
THESE
Yes . . . . . . .. . . . . 1
No . . . . . . . . . . . 2
Don't Know . …. . 88
ANY SUGARY FOODS SUCH AS CHOCOLATES, SWEETS,
CANDIES, PASTRIES, CAKES, OR BISCUITS
Yes . . . . . . .. . . . . 1
No . . . . . . . . . . . 2
Don't Know . …. . 88
ANY SALTY FOODS SUCH AS PACKAGED SNACKS (IE CHIPS)
Yes . . . . . . .. . . . . 1
No . . . . . . . . . . . 2
Don't Know . …. . 88
CONDIMENTS FOR FLAVOR, SUCH AS SOY SAUCE, PRAHOK
Yes . . . . . . .. . . . . 1
No . . . . . . . . . . . 2
Don't Know . …. . 88


