GEOPHYSICAL RESEARCH LETTERS, VOL. ???, NO. , PAGES 1?? , Novel aerosol/gas inlet for aircraft based measurements Suresh Dhaniyala, Richard C. Flagan, Karena A. McKinney, Paul O. Wennberg California Institute of Technology, Pasadena, CA Abstract A novel inlet has been designed for selective sampling of gas and aerosol phases of volatile species from high-speed aircraft. A multi-stage flow system brings the flow nearly isokinetically towards the sampling port. Two small airfoil-shaped “blades” are placed close to the sample port to provide the flow conditions required for aerosol and gas sampling. Aerosols are sampled with these blades positioned to operate the inlet as a counterflow virtual impactor (CVI). The inlet design enables sampling of particles as small as 0.1 μm from a high-speed aircraft at stratospheric conditions, a substantial improvement over that possible with previous CVI designs. For gas sampling, one of the blades is moved by a stepper motor to occlude the inlet opening and gas is sampled perpendicular to the bulk flow. Boundary layer suction is used to prevent sampling gas in contact with the impactor walls. This is one of the first designs of an inlet that enables gas sampling free of wall contact. The inlet was flown on the NASA ER-2 aircraft during the SOLVE 2000 campaign to study aerosol/gas partitioning of nitric acid in the lower stratosphere. Data from the flight tests show that the inlet flow characteristics are broadly in agreement with computational fluid dynamics (CFD) simulations. Introduction Aerosols play many important roles in determining earth’s climate and atmospheric chemistry. One example is the chemical and microphysical effects resulting from the formation of polar stratospheric clouds (PSCs) in the winter- time polar stratospheres. PSCs are comprised of particles containing HNO 3 ,H 2 SO 4 , and H 2 O, of both solid and liquid phase [Hanson and Mauersberger , 1988; Carslaw et al., 1994]. The composition of PSCs varies strongly with temperature, progressing from binary H 2 SO 4 /H 2 O mixtures at ∼ 200 K to ternary HNO 3 /H 2 SO 4 /H 2 O solutions and solid HNO 3 hydrates at ∼ 190K and below for typical stratospheric conditions [Fahey et al., 1989; Dye et al., 1992]. These particles play a central role in the springtime catalytic destruction of polar ozone [WMO , 1998], but 1
Transcript
GEOPHYSICAL RESEARCH LETTERS, VOL. ???, NO. , PAGES 1?? ,
Novel aerosol/gas inlet for aircraft based measurements
Suresh Dhaniyala, Richard C. Flagan, Karena A. McKinney, Paul O. WennbergCalifornia Institute of Technology, Pasadena, CA
Abstract
A novel inlet has been designed for selective sampling of gas and aerosol phases of volatile species from high-speed
aircraft. A multi-stage flow system brings the flow nearly isokinetically towards the sampling port. Two small
airfoil-shaped “blades” are placed close to the sample port to provide the flow conditions required for aerosol and gas
sampling. Aerosols are sampled with these blades positioned to operate the inlet as a counterflow virtual impactor
(CVI). The inlet design enables sampling of particles as small as 0.1 µm from a high-speed aircraft at stratospheric
conditions, a substantial improvement over that possible with previous CVI designs. For gas sampling, one of the
blades is moved by a stepper motor to occlude the inlet opening and gas is sampled perpendicular to the bulk
flow. Boundary layer suction is used to prevent sampling gas in contact with the impactor walls. This is one of
the first designs of an inlet that enables gas sampling free of wall contact. The inlet was flown on the NASA ER-2
aircraft during the SOLVE 2000 campaign to study aerosol/gas partitioning of nitric acid in the lower stratosphere.
Data from the flight tests show that the inlet flow characteristics are broadly in agreement with computational fluid
dynamics (CFD) simulations.
Introduction
Aerosols play many important roles in determining earth’s climate and atmospheric chemistry. One example is the
chemical and microphysical effects resulting from the formation of polar stratospheric clouds (PSCs) in the winter-
time polar stratospheres. PSCs are comprised of particles containing HNO3, H2SO4, and H2O, of both solid and
liquid phase [Hanson and Mauersberger , 1988; Carslaw et al., 1994]. The composition of PSCs varies strongly with
temperature, progressing from binary H2SO4/H2O mixtures at ∼ 200 K to ternary HNO3/H2SO4/H2O solutions
and solid HNO3 hydrates at ∼ 190K and below for typical stratospheric conditions [Fahey et al., 1989; Dye et al.,
1992]. These particles play a central role in the springtime catalytic destruction of polar ozone [WMO , 1998], but
1
2 DHANIYALA ET AL.: AEROSOL/GAS INLET
the thermodynamics of their formation and growth are largely unknown. A knowledge of the PSC processes are
critical for quantitative modeling of ozone depletion.
In the dry polar stratospheres, nitric acid is the one of the most condensible gas phase species [WMO , 1998] and
the most important constituent of PSCs. Determining the nitric acid partitioning between the aerosol and gas phase
in these clouds is central to understanding PSC thermodynamics. Measurements of gas and condensed phase nitric
acid in PSCs, under varying atmospheric conditions, are required to accurately characterize this highly temperature
sensitive partitioning. Laboratory measurements of PSC microphysics and thermodynamics are hampered by the
difficulty of reproducing atmospheric conditions, particularly those leading to the nucleation of solids, such as nitric
acid hydrates. Thus, in-situ measurements are needed. In theory, nitric acid partitioning could be determined in-situ
by using a sampler capable of discriminating between aerosols and gas, followed by a single analytical method for
nitric acid detection.
PSC particles range in sizes from 0.1 to 20 µm in diameter [Dye et al., 1992; DelNegro et al., 1997] and representative
sampling over this entire size range is required for quantitative measurement of nitric acid in the condensed phase.
This measurement requires aerosols to be sampled with the exclusion of ambient gas, with a small particle cut-size
(0.1µm). Particles must be sampled without any thermal modifications because PSCs are highly volatile and their
compositions are very sensitive to small changes in temperature. Similarly, measurements of nitric acid in the gas-
phase require sampling ambient air with the exclusion of particles larger than 0.1 µm in diameter. Gas sampling must
be accomplished without vapor transfer to or from the cold walls or particles. The difficulties of aerosol/gas sampling
in PSCs are further compounded by the high-altitudes at which the clouds form (16-24 km), necessiating sampling
from high-speed aircraft, like the NASA ER-2, with cruise speeds of 0.7 M. These challenges have to be overcome
in order to make accurate and quantitative measurements of nitric acid partitioning between aerosols and gas in PSCs.
Measurements of semi-volatiles on aerosols are often made by anisokinetic inhalation followed by evaporation and
detection [Fahey et al., 1989; Dye et al., 1992]. When the flow enters a forward facing probe (Figure 1) at a velocity
well below that of the free-stream air flow, particles larger than a characteristic critical size are aerodynamically
DHANIYALA ET AL.: AEROSOL/GAS INLET 3
concentrated in the sample. Smaller particles and the gas phase are also sampled, but at concentrations equivalent
to those in the ambient air. The critical size for enhanced particle concentration in the inlet depends on the size
of the probe, among other factors, and can to some extent be tailored to the size range of interest. Estimations of
the cut size based on the inlet diameter alone (i.e. assuming an ideal tube in the unperturbed flow) are, however,
often overly simplistic. The probe is generally mounted on a larger body that disturbs the air flow well upstream
of the probe inlet, so the characteristic dimension that determines the size-dependent sampling efficiency may be
much larger than the probe inlet itself. The resulting particle enhancements in the probe are strongly dependent on
particle size, and a clear cut-size does not exist. In addition, the concentrations of aerosol constituents that can be
measured with simple, forward facing probes are limited to those that can be detected above the concentration of
the vapors that are sampled simultaneously.
A counterflow virtual impactor (CVI) can be used to collect particles with the exclusion of the surrounding gas. The
CVI separates particles from gas by discharging a clean gas flow out of the probe inlet [Twohy and Rogers , 1993].
Only those particles with sufficient inertia to penetrate through the counterflowing gas are carried to the analyzer.
The original application of the CVI was for cloud droplet sampling. Well-defined size cuts, typically Dp>∼ 10µm,
were achieved by using a relatively long probe that penetrates outside the flow region perturbed by the body on which
the probe is mounted. Application of the CVI to sampling PSCs with particle diameters ranging from 0.1 to 20 µm
[Dye et al., 1992; DelNegro et al., 1997] would, however, require small inlet diameters and lead to unacceptably low
sampling rates. For measurements of nitric acid partitioning in PSCs, we require an inlet that can sample small parti-
cles at high volume flow rates, as is possible with anisokinetic inlets, while excluding gas, as is possible with CVI inlets.
Even if the size selection issues are addressed, airborne measurements of aerosols that require deceleration of flow
remain subject to substantial thermal biases. This deceleration leads to aerodynamic heating by adiabatic compres-
sion, inducing evaporation of volatile and semivolatile constituents from the particles in the sample. The loss of
volatile species from particles and the resultant enrichment of these vapors in the gas results in biasing both the
particle and gas-phase measurements. The bias can be minimized in measurements in the lower troposphere by
sampling from aircraft with low flight speeds. Unfortunately, slow-flying aircraft are not available for measurements
4 DHANIYALA ET AL.: AEROSOL/GAS INLET
in stratosphere where the typical flight Mach numbers of 0.7 to 0.8 leads to a temperature increase of ∼ 20 K upon
deceleration. Therefore, for successful sampling of PSCs from aircraft, the probe design must ensure that the flow is
not decelerated at any point prior to entering the detection region.
To sample gas with the exclusion of particles, a number of airborne samplers have used back-facing inlets (e.g.,
Kondo et al. [1997]). These inlets sample from a direction opposite to the freestream flow velocity as illustrated by
the schematics in Figure 1. This sampling technique has several drawbacks. The sampled gas is in contact with the
cold outer walls of these back-facing inlets, possibly leading to condensational loss of some sampled species. The
recirculation zones at the entrance of the inlets act as particle traps that can contaminate gas samples and bias the
gas-phase measurements. Even though most particles may be excluded by sampling from a backward facing inlet,
the size dependent sampling efficiency is not well known.
This paper describes a new inlet that has been designed to enable direct analysis of both aerosols and the gas phase
with a single detection technique. Within this inlet, thermal modifications of the sampled gas are minimized using
aerodynamic pumping to prevent deceleration of the gas until very close to the point of separation. A switching
feature enables selective gas or aerosol sampling with a single inlet. In one mode, aerosols are sampled while the gas
phase is excluded (aerosol mode). In the second mode, the gas phase is sampled without contamination from the
aerosol phase (gas mode). In the aerosol mode, the inlet is operated as a counterflow impactor, with a multi-stage
flow system upstream to obtain a particle cut-size smaller than that reported with earlier counterflow impactor
designs. In the gas mode, ambient gas is sampled perpendicular to the bulk flow streamlines. A “boundary-layer”
suction technique is used to avoid sampling the gas that is in contact with the cold inlet walls. The use of a narrow
rectangular slit rather than a circular aperture provides a large sample volume, allowing detection of even small
nitric acid concentrations in the aerosol phase.
The analyzer used in the initial application of this inlet is the Caltech chemical ionization mass spectrometer (CIMS)
described in detail by Mckinney [2002]. CIMS is a fast-response, selective, and sensitive method for detecting nitric
acid, and together with the new inlet, provides a powerful tool for studying nitric acid partitioning between the gas
DHANIYALA ET AL.: AEROSOL/GAS INLET 5
and aerosol phases in the polar stratosphere [Mckinney, 2002]. The sampling inlet and instrument were flown on the
NASA ER-2 aircraft as part of the SOLVE (SAGE III ozone loss and validation experiment) campaign during the
winter of 1999-2000 [Newman and Harris , 2001]. Here we describe the design of the inlet, and its characterization
and performance during flights of the ER-2.
Figure 1. Schematic diagram illustrating sampling by front and back facing inlets.
Approach
Aerodynamic Separation
The sampling inlet employs inertial separation to sample gas while excluding particles or, particles while excluding
gas. The switch between these two operating modes is accomplished by moving one aerodynamic component and
adjusting the flow of the counterflow/carrier gas within the probe. In the aerosol sampling mode, the inlet functions
similar to a counterflow virtual impactor. In this mode, particles are injected through a clean counterflow gas that
prevents vapors from entering the analysis region. In the gas sampling mode, gas is drawn from a region that is
aerodynamically depleted of particles. Gas from the boundary layer regions of the flows are discharged to prevent
contamination from particles deposited on or vapors desorbing from surfaces.
6 DHANIYALA ET AL.: AEROSOL/GAS INLET
The tendency of a particle to deviate from the gas flow is determined by the ratio of inertial forces to viscous forces
acting on the particle. For low particle Reynolds numbers the viscous drag force (reference) can be approximated by
Stokes law modified by a slip correction Cc, to account for noncontinuum effects. This dimensionless ratio, known
as the Stokes number [Flagan and Seinfeld , 1988], is given by:
St =ρpCcDp
2U
18µW(1)
where ρp is the particle density, Dp is the particle diameter, U is the characteristic flow velocity, µ is the gas viscosity,
and W is characteristic dimension of the flow. When the Stokes number exceeds a critical value, typically in the
range of 0.3 to 1.0, particles inertially deviate from the gas flow, while for smaller values, the particles tend to follow
the gas flow. For aerosol samples, we seek to capture the particles that are inertially deposited in the counterflow
gas stream. For gas analysis, the flow is designed to remove particles from the sampled gas stream. In each case, a
critical value of the Stokes number defines the separation threshold.
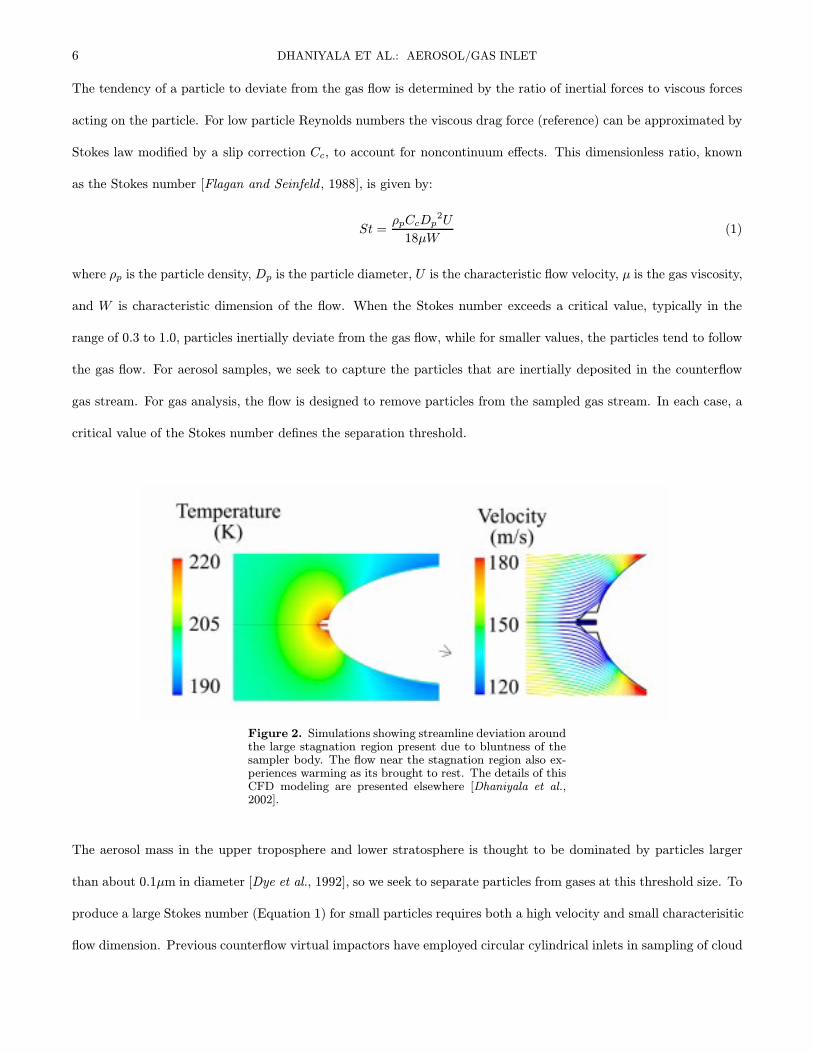
Figure 2. Simulations showing streamline deviation aroundthe large stagnation region present due to bluntness of thesampler body. The flow near the stagnation region also ex-periences warming as its brought to rest. The details of thisCFD modeling are presented elsewhere [Dhaniyala et al.,2002].
The aerosol mass in the upper troposphere and lower stratosphere is thought to be dominated by particles larger
than about 0.1µm in diameter [Dye et al., 1992], so we seek to separate particles from gases at this threshold size. To
produce a large Stokes number (Equation 1) for small particles requires both a high velocity and small characterisitic
flow dimension. Previous counterflow virtual impactors have employed circular cylindrical inlets in sampling of cloud
DHANIYALA ET AL.: AEROSOL/GAS INLET 7
droplets. However, for the conditions of PSC sampling (aircraft velocity 200 ms−1, ambient pressure 50 mbar), the
flow rate through a CVI with a circular cross-section designed with an 0.1 µm size cut (jet width of ∼ 2 mm) would
be too low for quantitative chemical analysis. We, therefore, employ a linear separation geometry to increase the
flow rate. The sampling probe in our design has a rectangular jet with a half-width, W , of 2 mm and length 2 cm,
providing for a large sample flow rate and a critical Stokes number sufficient for the impaction of particles with a
diameter of ∼ 0.1 µm.
Design of an inlet with jet characteristics determined from Equation 1 is not sufficient to ensure that the desired
size cut will actually be realized in flight. A blunt sampler placed in free stream decelerates flow well upstream
of the impaction region, as illustrated in Figure 2, increasing the particle size threshold that will enter the inlet.
Flow deceleration also results in compressional heating, which can alter the composition of sample particles. The
aerodynamics of the entire inlet must be considered to avoid such biases and enable the threshold size to be pushed
into the submicron size regime.
We present here a multi-stage inlet that incorporates flow features that result in a small cut-size for the particles
sampled in the aerosol mode and particle-free sampling in the gas mode. This aerosol/gas separation inlet is com-
prised of four components: (i) an outer shroud that ensures that the flow entering the separation region approaches
parallel to the inlet axis; (ii) an inner shroud that employs aerodynamic pumping to ensure that the gas does not
decelerate until it enters a well-defined small separation region; (iii) guide blades that, with minor movement, either
create the inertial impactor to collect aerosols or form the separator that excludes particles from the sampled gas;
and (iv) the sampling probe that conveys the collected aerosol or gas to the CIMS analyzer. Figure 3 illustrates this
sampling/separation system.
Flow Modeling
A computational fluid dynamics (CFD) program, FLUENT (FLUENT Inc.), was used to optimize the design. Flow
in and around the aerosol/gas inlet and particle trajectories in the two modes were simulated. FLUENT uses a
finite-volume formulation [Patankar , 1980] to solve the mass, momentum, and energy conservation equations. Be-
8 DHANIYALA ET AL.: AEROSOL/GAS INLET
Figure 3. Schematic diagram of the inlet showing the different components.
cause the inlet is flown on a high-speed aircraft (ER-2, speed ∼ 0.7 Mach), the air flow must be treated as fully
compressible. The Reynolds number, based on the aircraft velocity and the length scale of the flow channels in the
inlet, is high, and turbulent effects may be important. FLUENT has been used extensively in modeling of particle
trajectories in compressible, transonic, and even supersonic flows [Adamopoulos and Petropakis , 1999; Yilmaz and
Cliffe, 2000], and is well suited for the present calculations. Turbulent transport is modeled using the two-equation
k − ε model [Launder and Spalding, 1972, 1974].
The inlet geometry is inherently three-dimensional. Two-dimensional flow modeling can, however, capture the inlet
performance without significant loss of accuracy. The two-dimensional domain used for simulating the inlet flow
is shown in Figure 3 (side view), and represents a cross-section perpendicular to the mirror plane of symmetry of
the inlet. In the third dimension the outer shroud extends 10.2 cm, while the inner shroud extends 7.6 cm and is
DHANIYALA ET AL.: AEROSOL/GAS INLET 9
symmetrically located inside the outer shroud (see Figure 3). The sample probe has the same width as the inner
shroud, but the slit opening extends only over the central 2 cm of the probe. The guide blades are 6.35 cm wide
extending 2.175 cm on either side of the slit opening. This configuration was adopted to minimize any edge effects,
so that the side walls of the shrouds do not directly impact the sample to be analyzed. The main region of flow
interest corresponds to the location of the slit opening. To verify that the two-dimensional simulations capture the
essential features of the flow and particle separation, limited three-dimensional simulations have been performed. In
both two and three-dimensional modeling, symmetry boundary conditions are used, whenever appropriate, to reduce
the computational domain.
Inlet Design
Incident Flow Control: Outer shroud design
The particle and gas sampling characteristics of the inlet depend on the incident flow in the vicinity of the inlet, which
in turn is influenced by the aircraft orientation and the presence of the aircraft body. The aircraft angle of attack,
pitch, and roll all affect the direction of the flow at the inlet location. Under aircraft cruise conditions, incident flow
angle deviations of ∼ 2◦ are typical. The outer shroud is designed to straighten the flow towards the inlet to negate
any deviations in free-stream flow angle. The outer shroud directs the flow without separation, shock formation or
streamline deviations by using thin, airfoil-shaped leading edges (NACA 0009). Similar shaped shroud edges have
been studied and tested before [Murphy and Schein, 1998] and found appropriate for typical flight conditions on the
ER-2 aircraft.
The shroud shape optimization and performance evaluation requires simulations with the inlet placed in a large
domain. These simulations are performed with far-field boundary conditions of undisturbed ambient pressure and
aircraft velocity. Flow fields resulting from these simulations show that the airfoil-shaped leading edges of the shroud
prevent flow separation at the entrance. The thin cross-sections of the shroud leading edges are required to minimize
distortion of the streamlines entering the shroud. This ensures that the particles enter the shroud largely isokinetically.
10 DHANIYALA ET AL.: AEROSOL/GAS INLET
To determine the effectiveness of the shroud in straightening the flow, simulations were performed for several angles
of attack. For typical operating conditions (angle of attack of 2 degrees, ambient pressure 50 mbar, aircraft velocity
of 0.7 Mach), the modeled streamlines and particle trajectories in the vicinity of the shroud are shown in Figure 4.
The optimized shroud shape and dimensions produce flow fields within the shroud that are largely independent of
incident flow angles. Trajectories of large (1.0 µm diameter) particles are also straightened by the shroud as they
head towards the sampling region.
Figure 4. The simulated particle trajectories (1 µm) andgas pathlines for ambient pressure of 50 mbar and flow di-rected at an angle of 2 degrees.
The pressure fields (Fig. 5) at the edges of the outer shroud calculated in the large-domain simulations provide the
boundary conditions at the shroud entrance and exit. Subsequent simulations are then limited to within the domain
enclosed by the outer shroud. This facilitates high resolution simulations of flow features in the region of interest
near the sampling port. As illustrated in Fig. 6, streamlines within the shroud pass through the different sections of
the multi-stage inlet without experiencing deviations due to blunt body effects.
DHANIYALA ET AL.: AEROSOL/GAS INLET 11
Figure 5. Simulation results showing the calculated pres-sure field in the large domain for ambient conditions of 50mbpressure and free stream velocity of Mach 0.7. These pres-sures are then used to obtain the appropriate boundary con-ditions at the shroud entrance and exit.
Thermal State Control: Inner shroud design
Enclosed within the outer shroud is a second, inner shroud. This device ensures that the flow is not decelerated as
it approaches the blunt sample probe. It is comprised of two symmetrical sections of a modified half-airfoil shape
(NACA 63-021) with a long “nose” projecting in the front. There are two flow regions associated with the inner
shroud: (i) the exterior region between the inner and outer shrouds; and (ii) the channels formed by the two half-
sections of the inner shroud and the sample probe. Similar to flow characteristics around an airfoil, a region of low
pressure exists downstream of the leading edge of the inner shroud. Most of the flow that enters the inner shroud is
discharged into this low pressure region. The pressure drop between the entrance and exit of the inner shroud pumps
the air through its channel, preventing the sample from decelerating before entering the particle separator. The
particle separator and the associated deceleration region is located only a few millimeters from the sample entrance,
minimizing the time that the temperature is perturbed by adiabatic compression. Moreover, particles and gas are
12 DHANIYALA ET AL.: AEROSOL/GAS INLET
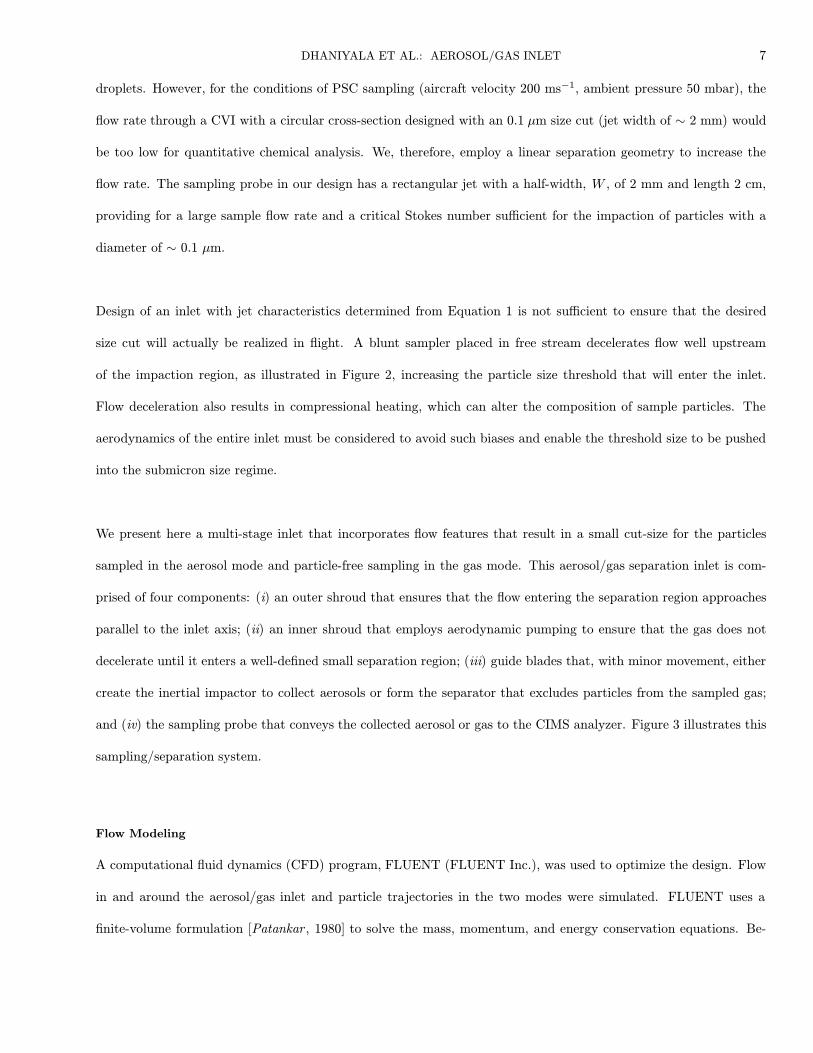
Figure 6. Streamlines inside the outer shroud, coloredby flow temperature (ambient pressure of 50mb), show theabsence of any significant compressional heating along theflow path towards the sampler.
sampled from the central 10-20% of this channel flow to avoid sampling of air that has been in contact with the
wall. To counter boundary layer growth into the central flow, the smooth walls of the inner shroud channel diverge
with a half-angle of ∼ 4◦. The long nose at the entrance to the channel ensures that the entering streamlines are
not significantly affected by the bluntness of the downstream section. The leading edges of the nose are thin (in
proportion to the narrow channel opening) and airfoil-shaped (NACA 0009) to minimize streamline deviations, and,
hence, anisokinetic aerosol sampling effects.
Simulations in the domain defined by the outer shroud with the appropriate boundary conditions show that the inner
shroud design provides more than enough aerodynamic pumping to prevent flow deceleration within the channel.
Indeed, the flow actually accelerates, leading to aerodynamic cooling of the entering gas as shown in Fig. 6. This
cooling does not significantly affect the partitioning of semi-volatiles. Because the mixing ratios of the species
DHANIYALA ET AL.: AEROSOL/GAS INLET 13
of interest are extremely small, mass transfer limitations imply a relaxation time for condensation that is long
compared to the short particle residence time in the channel. This prevents significant condensational change in
particle composition within the channel. On the other hand, if the inner shroud were not used, the deceleration
of the flow by a blunt particle sampler would heat the gas over a larger distance and longer period of time. Since
the vapor pressure increases rapidly with increasing temperature, and since the relaxation time for evaporation is
comparable to the particle residence time in the compressionally heated region, this would lead to substantial loss
of particulate material to the vapor phase.
Switchable Particle Separator: Guide blade design
Figure 7. Schematic diagram illustrating the configurationof the guide blades and operation of the inlet in the twosampling modes - gas and aerosol.
Inside the inner shroud and directly in front of the sample slit, there are two small flow directors called ‘guide blades’
(Fig. 7). The adjustable positioning of these two guide blades enables selective aerosol or gas sampling with the
required particle separation characteristics.
14 DHANIYALA ET AL.: AEROSOL/GAS INLET
Aerosol Mode
The inlet is operated in the aerosol mode by positioning the guide blades symmetrically about the centerline of
the sample probe. At the downstream end of the guide blades, the flow accelerates producing yet another region
of low pressure. This low pressure region provides the aerodynamic pumping required to form a high-velocity jet
between the guide blades, simultaneously maintaining the thermodynamic state of the gas by delaying deceleration,
and enabling separation of small particles from the gas. The aerosol that passes between the guide blades impinges
on an opposing flow of clean nitrogen that is discharged from the slit entrance of the sample probe. The opposing
jet prevents gases from being drawn into the sample probe. Those particles that penetrate through the opposing jet
flow are conveyed to the analytical section of the instrument by additional nitrogen carrier gas.
Figure 8 shows simulations of the aerosol mode operation. Flow simulations including the counter-flowing gas are
computationally intensive. Design of the shape, size, and location of the guide blades was facilitated by first simu-
lating particle impaction onto the solid probe (i.e. excluding the entrance slot from the sample probe inlet). Once
a serviceable design was developed, simulations of the full geometry including the opposed jet flow were performed
to optimize the design. The simulations show that appropriate positioning of the guide blades results in a narrow,
high-velocity jet directed towards the sample probe slit (Figure 8). Particle trajectories are calculated using the
obtained flow field and Stokes drag on the particle. The Knudsen numbers associated with particle-flow interactions
are ∼ 1, so non-continuum effects are important in particle transport calculations. This is accounted for by using
the Cunningham slip correction factor based on the local pressure values.
The temperature histories of 0.7µm diameter particles as they pass through the outer shroud, into the inner shroud,
between the guide blades, and on to the sample probe entrance are shown in Figure 9. The slight deceleration that
occur at the entrance to the inner shroud and guide blades raise the temperature by at most 2K, for transit times of
∼ 100 µs (inner shroud) and ∼ 20 µs (guide blades). The major gas deceleration region is confined to a small volume
extending approximately 2 mm from the sample probe entrance. Given a typical flight speed of 200 ms−1, the time
that sampled particles are exposed to gas that has been heated by deceleration or by mixing with the counterflowing
gas is limited to ∼ 10µs. Particle trajectories near the guide blades, shown in Fig. 10, suggest that all particles of
DHANIYALA ET AL.: AEROSOL/GAS INLET 15
0.7 µm diameter directed towards the inlet penetrate through the counterflow gas and into the sample probe.
Figure 8. Streamlines near the sample probe showing theflow temperatures in the jet with the guide blades in positionfor aerosol sampling.
Gas Mode
To create the gas mode, a stepper motor moves one of the blades forward to occlude the sampling port. The nitrogen
counter flow is reduced so that oncoming air is drawn into the sample probe. Air entering the sample probe is drawn
between the guide blades perpendicular to the bulk flow. Inertia prevents particles from entering with the sampled
air. The low pressure regions at the downstream end of the guide blades provide boundary-layer suction to remove
the air that has been in contact with the blade walls. The shape and positioning of the guide blades were optimized
with CFD simulations to ensure that there are no recirculation zones in the sampling region. Thus, as shown by the
calculated gas pathlines in Fig. 11, only air that has been protected from direct contact with the surfaces of the inlet
is drawn into the analytical section of the probe. Any contamination of the sampled air by particles that may have
deposited on to the inlet surfaces is therefore minimized. Condensational loss of vapors from the sampled air to the
cold walls is also prevented. The thin leading edges of these blades are also airfoil-shaped (NACA 0009) to prevent
16 DHANIYALA ET AL.: AEROSOL/GAS INLET
Figure 9. Plot of particle temperature as it passes fromthe ambient to the sampler showing minimal compressionalheating experienced by the particle till just before enteringthe sample probe.
flow separation and streamline distortion. The tracks of 0.3 µm diameter particles, shown in Fig. 12, illustrate the
exclusion of these particles from the gas sample. Warm nitrogen carrier gas is added to the probe to minimize the
residence time of the sampled gases, thereby minimizing the response time of the gas sampling and analysis system.
Particle Collection Efficiency
The calculated collection efficiency curves for the two modes of inlet operation are obtained by tracking particle
motion towards the sample probe as a function of particle size. The flow at the shroud entrance is first seeded with a
uniform concentration of particles. Particle collection efficiencies, defined as the ratio of the particle flux through the
sample probe slit to the particle flux through an identical cross-section in the undisturbed flow far upstream of the
inlet, are then calculated. Figure 13 shows the resulting particle collection efficiencies for the aerosol- and gas-mode
operation of the inlet at two different ambient pressure conditions representative of the planned use of the instrument
DHANIYALA ET AL.: AEROSOL/GAS INLET 17
Figure 10. Trajectories of 0.7 µm diameter particles are shown for guide blades in position for aerosol sampling.
(50 and 80 mbar). The sizes of particles collected in the aerosol-mode shifts toward smaller sizes as the pressure is
reduced due to increased slip between the particles and the gas. The aerosol mode inlet particle cut-size is ∼ 0.2-0.4
µm (for stratospheric particles of density 1.6 gm cm−3, ambient pressure of 50 to 80 mbar, and a sampling efficiency
of 50%). The gas-mode particle exclusion efficiency exhibits a weaker dependence on ambient pressure. Particles
larger than 0.1µm are effectively excluded from the sampled gases.
Sample Probe and Analysis
At the downstream end of the multi-stage inlet is the sample probe with a slit sampling port centered along its length.
The rectangular slit has a width of 2 mm and stretches over a length of 2 cm. Clean nitrogen gas is added just down-
stream of the sampling port through two narrow opposing channels to provide a curtain gas covering the slit opening.
The majority of this added nitrogen acts as carrier gas for the sampled aerosol/gas, while a small excess provides
the counterflow gas in the aerosol mode. The carrier gas conveys the aerosol/gas sample to the mass spectrometer
through a 30 cm long flow tube of circular cross-section. The flow tube is maintained at elevated temperatures
18 DHANIYALA ET AL.: AEROSOL/GAS INLET
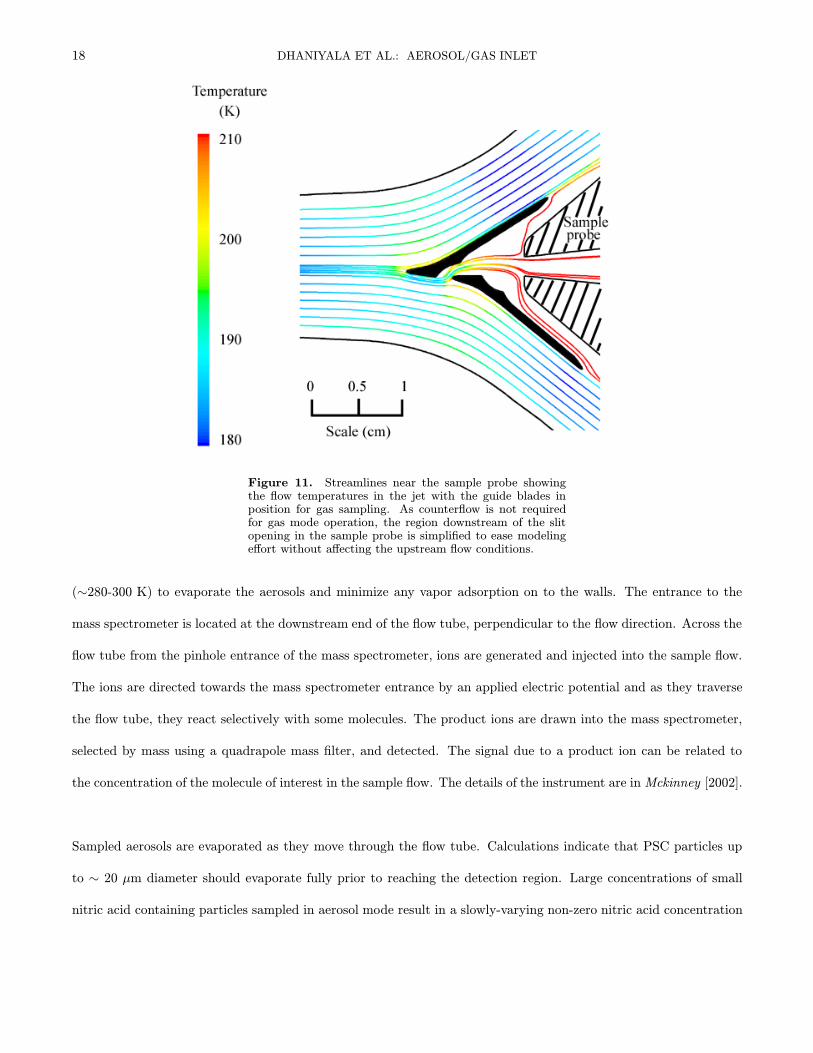
Figure 11. Streamlines near the sample probe showingthe flow temperatures in the jet with the guide blades inposition for gas sampling. As counterflow is not requiredfor gas mode operation, the region downstream of the slitopening in the sample probe is simplified to ease modelingeffort without affecting the upstream flow conditions.
(∼280-300 K) to evaporate the aerosols and minimize any vapor adsorption on to the walls. The entrance to the
mass spectrometer is located at the downstream end of the flow tube, perpendicular to the flow direction. Across the
flow tube from the pinhole entrance of the mass spectrometer, ions are generated and injected into the sample flow.
The ions are directed towards the mass spectrometer entrance by an applied electric potential and as they traverse
the flow tube, they react selectively with some molecules. The product ions are drawn into the mass spectrometer,
selected by mass using a quadrapole mass filter, and detected. The signal due to a product ion can be related to
the concentration of the molecule of interest in the sample flow. The details of the instrument are in Mckinney [2002].
Sampled aerosols are evaporated as they move through the flow tube. Calculations indicate that PSC particles up
to ∼ 20 µm diameter should evaporate fully prior to reaching the detection region. Large concentrations of small
nitric acid containing particles sampled in aerosol mode result in a slowly-varying non-zero nitric acid concentration
DHANIYALA ET AL.: AEROSOL/GAS INLET 19
Figure 12. Trajectories of 0.3 µm diameter particles are shown for guide blades in position for gas sampling.
in the flow. The nitric acid signal is due to the integrated content of the particles, and individual particles are not
resolved. If a small number concentration of large (> 7 µm diameter) PSC particles are sampled, however, signals
attributed to individual particles are observed. Each large particle evaporates into a relatively small volume of gas,
due to the flow velocity and diffusion rate. The resulting nitric acid concentration in this small volume is very high
(∼ 100 ppbv) and is detected as a short-duration burst (125 ms). When the particle number concentrations are low
enough, the frequency of the single-particle signals is less than the data sampling rate (8 Hz) and single particles are
detected. For the sample volume of this inlet, this corresponds to an ambient particle number concentration of ∼
10−4 cm−3. Analysis of this particle population and their contribution to the ozone loss process have been presented
elsewhere [Fahey et al., 2001; Northway et al., 2002; Mckinney, 2002].
20 DHANIYALA ET AL.: AEROSOL/GAS INLET
Figure 13. Collection efficiency curves for the inlet oper-ating in the two modes - Gas and Aerosol - at two differentambient pressures. In the aerosol mode, the inlet has a cutsize of around 0.2-0.4, while, in the gas mode particles largerthan ∼ 0.1 µm are not sampled.
Fabrication
The flow optimization led to rather complex and delicate shapes for the inner shroud, guide blades, and other surfaces
in the inlet. To produce these structures with the necessary precision, AutoCAD design files of the different parts
were exported directly for precision computer-aided manufacturing. The parts with thin cross-sections (guide blades
and shroud) were manufactured using wire electrical discharge machining (EDM), in which a solid block of steel (for
guide blades) or aluminum (for the outer shroud) is cut to the required shape by repeated electrical discharges along
a thin, taut wire. The inner shroud and the sample probe were precision machined using a computer-controlled mill.
The sample probe is made of teflon for thermal isolation of the counterflow gas and the aerosol/gas sample from the
cold external flow.
DHANIYALA ET AL.: AEROSOL/GAS INLET 21
A stepper motor, positioned within the inner shroud, moves the guide blade between the aerosol and gas sampling
modes. The blade movement from one position to the other takes ∼ 3− 4s.
Experimental Characterization
The extreme inlet flow conditions for which the sample probe was designed complicate laboratory evaluation of the
inlet flow and particle capture characteristics. Even if the flows could be reproduced, seeding the high-speed, low
pressure, and high-volumetric flow rate with particles of known properties make controlled laboratory testing of
this inlet difficult at best. The inlet has, however, been instrumented to enable validation of a number of key flow
parameters during test flights of the ER-2. The primary inlet performance test is based on a comparison of pressure
measurements at different locations within the inlet with the CFD predictions.
The following pressure measurements were made within the inlet during ER-2 test flights: (i) static pressure at the
center of the inner shroud wall; (ii) static pressure inside the sampling probe; and (iii) differential pressure at the
exits of the inner shroud channel. The locations of the pressure probes are shown in Figure 3 as P1, P2 and P3
respectively. The measurements were made using MKS pressure gauges, maintained at 10-20 ◦C, with a range of
0-100 mbar for P1, 0-1000 mbar for P2 and +/- 100 mbar for P3.
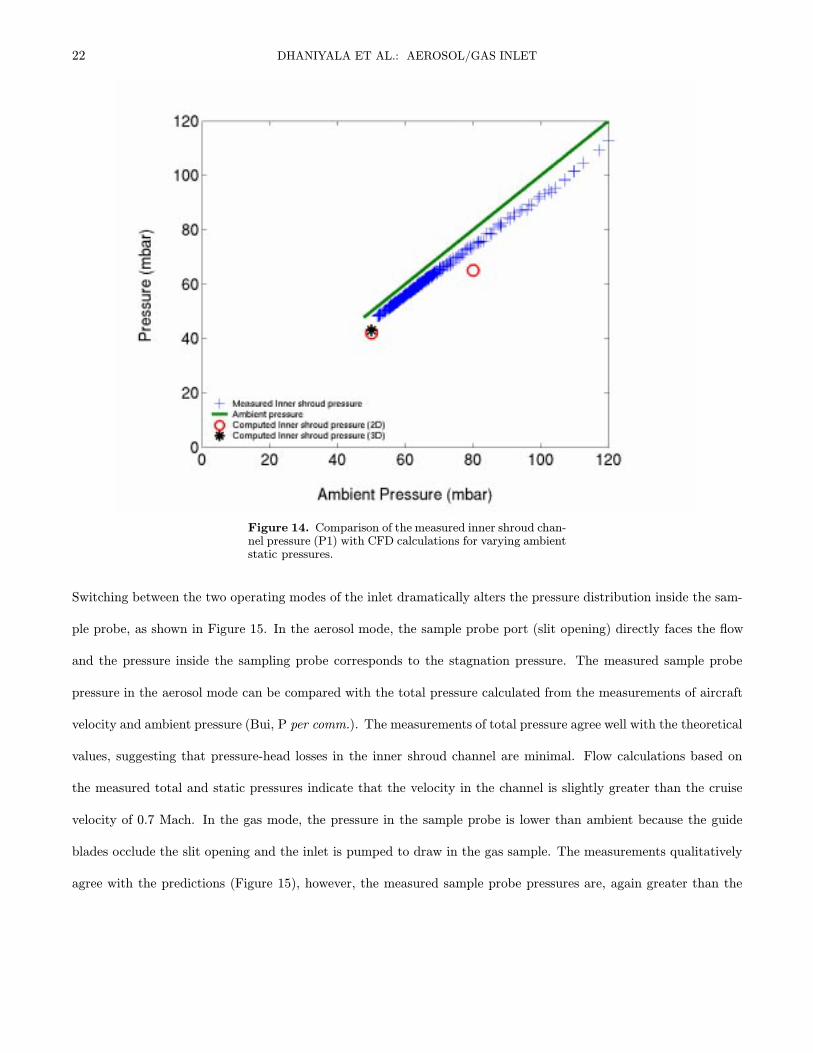
The static pressure is measured at the center of the inner shroud channel (P1), through a carefully drilled pressure
port flush with the surface. The static pressure is plotted as a function of ambient pressure in Figure 14 and com-
pared with static pressures obtained from CFD simulations. As predicted by simulations, the channel static pressure
is lower than ambient pressure, indicating accelerated flows in the channel (No pressure-head loss is assumed; based
on measurements shown in Figure 15, this assumption is valid). A ∼ 10% discrepancy exists, however, between the
measured and predicted channel pressures. Also plotted in Figure 14 is static pressure obtained from simulations
of inlet flow with a three-dimensional domain under ambient pressure conditions of 50 mbar. The 3D simulation
results match calculations in two-dimensions, justifying the computationally less intensive simulations with the two-
dimensional domain.
22 DHANIYALA ET AL.: AEROSOL/GAS INLET
Figure 14. Comparison of the measured inner shroud chan-nel pressure (P1) with CFD calculations for varying ambientstatic pressures.
Switching between the two operating modes of the inlet dramatically alters the pressure distribution inside the sam-
ple probe, as shown in Figure 15. In the aerosol mode, the sample probe port (slit opening) directly faces the flow
and the pressure inside the sampling probe corresponds to the stagnation pressure. The measured sample probe
pressure in the aerosol mode can be compared with the total pressure calculated from the measurements of aircraft
velocity and ambient pressure (Bui, P per comm.). The measurements of total pressure agree well with the theoretical
values, suggesting that pressure-head losses in the inner shroud channel are minimal. Flow calculations based on
the measured total and static pressures indicate that the velocity in the channel is slightly greater than the cruise
velocity of 0.7 Mach. In the gas mode, the pressure in the sample probe is lower than ambient because the guide
blades occlude the slit opening and the inlet is pumped to draw in the gas sample. The measurements qualitatively
agree with the predictions (Figure 15), however, the measured sample probe pressures are, again greater than the
DHANIYALA ET AL.: AEROSOL/GAS INLET 23
predicted values by ∼ 10%.
Figure 15. Comparison of the measured sample probe pres-sures (P2) with the CFD calculations for varying aircraft-measured total pressures. The theoretical total pressure val-ues in the aerosol mode are calculated based on aircraft ve-locity and ambient static pressure.
There are several possible explanations for the discrepancy between the measured and simulated pressures. The
simulations do not account for the influences of the airflow around the aircraft, particularly around the wing-pod
on which the inlet is mounted. The pressure under the wing is higher than that in the freestream, so the pressures
within the inlet should also be somewhat higher than predicted based upon the free stream flow conditions. We
have attempted to account for the actual pressure under the wing based upon pressure measurements made by JPL
H2O instrument [May, 1998] at a location in the pod similar to ours, but this effort is rather crude. Also, the heat
transfer to and from the inlet walls has been neglected in our calculations. If the flows are modeled considering the
non-adiabatic conditions, the flow temperatures and pressures will be slightly higher and in better agreement with
24 DHANIYALA ET AL.: AEROSOL/GAS INLET
the measurements.
Towards understanding the potential impact of this ∼ 10% discrepancy in the inner shroud channel pressure, sim-
ulations were performed with slower gas speeds in the channel. The simulations suggest that the the guide plate
jet velocity is insensitive to small variations in the channel velocity. Since the particle capture characteristics are
dependent only on the jet velocity, they are not very sensitive to small changes (such as the drop in velocity from
0.8M (simulated) to 0.7M (observed)) in channel velocities. Also, with the observed channel pressures being close to
that of the ambient, the cooling in the channel will be insignificant.
The exact location of the guide blades with respect to the sampling probe is critical for the inlet operation. During
some of our flight measurements, we observed that improper mounting of the blades resulted in small changes to
the blade position. This was seen to dramatically alter the pressure fields in the vicinity of the sampling port and,
hence, the flow and particle trajectory characteristics in this region. In the next version of our inlet, currently under
construction, we have reduced the slit width to 1 mm to make the flows less sensitive to small changes in the location
of the guide blades, and improved the guide blade holding hardware.
Measurements of the pressures within the inlet during pitch and roll maneuvers probe the effectiveness of the shroud
in straightening the incident flow. These flight maneuvers produce flows directed non-symmetrically towards the sam-
pling probe. Figure 16 shows the differential static pressures measured at the exits of the inner shroud as function of
the plane pitch angles. For typical pitch angles experienced by the ER-2 aircraft (±2◦), the differential pressure across
the inner shroud exit is very small and uncorrelated with the pitch angle. The data spread of ±0.5mbar corresponds
to measurement noise and the low resolution of the pressure gauge. The effect of flight roll on the flow around inner
shroud is also minimal (Figure 17). Even for large roll angles (up to 20◦), pressure measurements indicate that, as
predicted, the flow around the inlet shroud remains symmetrical. The inlet performance is, therefore, insensitive to
incident flow angles. The ∼ 0.5 mbar difference in the mean differential pressures measured in the aerosol and gas
modes (Figures 16 and 17) is consistent with that obtained from our simulations.
DHANIYALA ET AL.: AEROSOL/GAS INLET 25
Figure 16. Shroud effect - The differential pressure mea-sured at the inner shroud exit (P3) is seen to be independentof the aircraft pitch angle
Conclusions
A novel multi-stage inlet design for selective gas and particulate phase measurement of volatile species from high-
speed aircraft is presented here. In the aerosol mode, the inlet enables sampling particles greater than 0.1µm diameter
while excluding ambient gas from the sample. In the gas mode, the primary feature of the inlet is the elimination
of wall contact or recirculation zones that add to measurement uncertainty. The CFD simulations are tested by
comparing the results with flight measurements. The inlet pressure measurements agree with the CFD predictions
at the different locations in the inlet. This inlet represents one of the first efforts to sample gas without wall contact.
Acknowledgment
The authors would like to thank Fred Eisele, Nate Hazen, Jim Oliver, and Dave Tanner for their help in designing
the inlet and Joe Haggerty for his expertise in fabricating the different inlet components. We would also like to
26 DHANIYALA ET AL.: AEROSOL/GAS INLET
Figure 17. Shroud effect - The differential pressure mea-sured at the inner shroud exit (P3) is seen to be independentof the aircraft roll angle
thank Prof. Hans G. Hornung for valuable discussions about the inlet flow. We gratefully acknowledge the support
of NASA and NSF for this project.
DHANIYALA ET AL.: AEROSOL/GAS INLET 27
References
Adamopoulos, K., and H. Petropakis, Simulation of distribution of discrete inert particles in two phase supersonic mixing, Journal ofFood Engineering , 42 , 59–66, 1999.
Carslaw, K. S., B. P. Luo, S. L. Clegg, T. Peter, P. Brimblecombe, and P. J. Crutzen, Stratospheric aerosol growth and HNO3 gas phasedepletion from coupled HNO3 and water uptake by liquid particles, Geophysical Research Letters, 21 , 2479–2482, 1994.
DelNegro, L., et al., Evaluating the role of NAT, NAD, and liquid H2SO4/H2O/HNO3 solutions in Antarctic polar stratospheric cloudaerosol: Observations and implications, Journal of Geophysical Research-Atmospheres, 102 , 13,255–13,282, 1997.
Dhaniyala, S., R. Flagan, P. Wennberg, M. Northway, R. Gao, D. Fahey, and T. Bui, Particle sampling characteristics of the noaa er-2reactive nitrogen inlets, Journal of Geophysical Research-Atmospheres, 2002.
Dye, J., D. Baumgardner, B. Gandrud, S. Kawa, K. Kelly, M. Loewenstein, G. Ferry, K. Chan, and B. Gary, Particle-size distributionsin arctic polar stratospheric clouds, growth and freezing of sulfuric-acid droplets, and implications for cloud formation, Journal ofGeophysical Research-Atmospheres, 97 , 8015–8034, 1992.
Fahey, D., K. Kelly, G. Ferry, L. Poole, J. Wilson, D. Murphy, M. Loewenstein, and K. Chan, Insitu measurements of total reactivenitrogen, total water, and aerosol in a polar stratospheric cloud in the antarctic, Journal of Geophysical Research-Atmospheres, 94 ,11,299–11,315, 1989.
Fahey, D. W., et al., The detection of large HNO3-containing particles in the winter arctic stratosphere, Science, 291 , 1026–1031, 2001.Flagan, R., and J. Seinfeld, Fundamentals of air pollution engineering , Prentice-Hall, 1988.Hanson, D., and K. Mauersberger, Laboratory studies of the nitric acid trihydrate: Implications for the south polar stratosphere,
Geophysical Research Letters, 15 , 855–858, 1988.Kondo, Y., et al., Performance of an aircraft instrument for the measurement of NOy, Journal of Geophysical Research-Atmospheres,
102 , 28,663–28,671, 1997.Launder, B., and D. Spalding, Mathematical models of turbulence, Academic, New York , 1972.Launder, B., and D. Spalding, The numerical computation of turbulent flow, Comp. Methods in Appl. Mech. Eng., 3 , 269, 1974.May, R., Open-path, near-infrared tunable diode laser spectrometer for atmospheric measurements of h2o, Journal of Geophysical
Research-Atmospheres, 103 , 19,161–19,172, 1998.Mckinney, K. e. a., 2002.Murphy, D., and M. Schein, Wind tunnel tests of a shrouded aircraft inlet, Aerosol Science and Technology , 28 , 33–39, 1998.Newman, P., and N. Harris, An overview of the SOLVE-THESEO 2000 campaign, Journal of Geophysical Research-Atmospheres, 2001.Northway, M., et al., An analysis of large HNO3-containing particles sampled in the Arctic stratosphere during the winter of 1999-2000,
Journal of Geophysical Research, 2002.Patankar, S., Numerical heat transfer and fluid flow , Taylor and Francis, 1980.Twohy, C. H., and D. Rogers, Airflow and water-drop trajectories at instrument sampling points around the beechcraft king air and
lockheed electra, J. Atmos. Ocean. Technol., 10 , 566–578, 1993.WMO, Scientific Assessment of Ozone Depletion: 1998 (Rep, 44), World Meteorological Organization, Geneva, Switzerland, 1999, 1998.Yilmaz, S., and K. Cliffe, Particle deposition simulation using the CFD code FLUENT, Journal of the Institute of Energy , 73 , 65–68,


![Airborne measurements of carbonaceous aerosol soluble in ... · recently been used to quantify carbonaceous aerosol online from aircraft [Bahreini et al., 2003]. These methods provide](https://static.documents.pub/doc/80x56/5f12744e800d890f890d626f/airborne-measurements-of-carbonaceous-aerosol-soluble-in-recently-been-used.jpg)


