Novel Capability for Microscale In-situ Imaging of Temperature and Deformation Fields under Dynamic Loading A. Keyhani 1 & R. Yang 1 & M. Zhou 1 Received: 9 November 2018 /Accepted: 10 February 2019 /Published online: 12 March 2019 # Society for Experimental Mechanics 2019 Abstract To understand the mesoscale mechanisms responsible for the behavior of heterogeneous materials and to validate models, it is important to experimentally measure the deformation and temperature fields at the microstructure level. So far, there has been no methods that can yield such measurements simultaneously for dynamic experiments. Here, we report the development of a novel capability for simultaneous time- and space-resolved recording of both fields over the same microstructure area of a sample with micron-level spatial resolutions and microsecond time resolutions. Referred to as MINTED (Microscale In-situ Imaging of Dynamic Temperature and Deformation Fields), the system cohesively integrates a high-speed visible light (VL) camera and a state-of-the-art high-speed infrared (IR) camera via a custom-designed dichroic beam splitter-lens assembly. The combined VL and IR images allow the deformation fields to be obtained through digital image correlation (DIC) and the temperature fields over the same area to be obtained through pixel-level calibration of the differing emissivities of heterogeneous constituents in microstructures. Experiments are conducted on granular sucrose in a Kolsky bar [or split-Hopkinson pressure bar (SHPB)] environment, yielding both microstructure level fields along with overall material response. The strain and temper- ature fields provide detailed first-time insight into the processes of fracture, friction, shear localization, and hotspot development in the microstructures. Keywords Dynamic thermo-mechanical response . High-speed visible and infrared imaging . Split-Hopkinson pressure bar (SHPB) . Heterogeneous materials (HM) . Sucrose Introduction The thermo-mechanical response of heterogeneous materials under dynamic loading is of great importance in many appli- cations. Dynamic loading events can cause severe damage and energy dissipation, leading to the formation of temperature spikes in a wide range of materials, including, e.g., metals [1–4], polymers [5], composites [6], ceramics [7], shape mem- ory alloys (SMAs) [8, 9], and energetic materials [10, 11]. One class of temperature spikes are referred to as hotspots, and can cause thermal softening, thermal runaway, or even the onset of chemical reactions in energetic materials [12]. Local failure and formation of temperature spikes result from several fac- tors, such as strain localization due to heterogeneity in the microstructure, material property mismatch between constitu- ents, and the existence of defects such as voids, cracks and inclusions. Field et al. [10, 11] provided evidence for the mechanisms contributing to the formation of hotspots. Subsequently, computational and experimental approaches have been widely used to study mechanisms responsible for heat generation in heterogeneous materials. Specifically for energetic materials, computational studies have enhanced un- derstanding of heating mechanisms. However, these studies are limited in terms of the resolution of fine-scale physics and require experimental data for calibration and validation. On the other hand, experiments have provided insights into un- derlying heating mechanisms. For example, it is known that inelasticity [13, 14], void collapse, inter-particle contact, and internal fracture and friction [15, 16] are dominant heating mechanisms in energetic materials and other heterogeneous materials. However, experiments have not allowed full under- standing and detailed quantification of the underlying mecha- nisms primarily due to the lack of abilities to directly measure, in time- and space-resolved manner, the thermal and mechan- ical fields at the microstructural level for dynamic conditions. * M. Zhou [email protected]1 The George W. Woodruff School of Mechanical Engineering, School of Materials Science and Engineering, Georgia Institute of Technology, Atlanta, GA 30332-0405, USA Experimental Mechanics (2019) 59:775–790 https://doi.org/10.1007/s11340-019-00495-2
Transcript
Novel Capability for Microscale In-situ Imaging of Temperatureand Deformation Fields under Dynamic Loading
A. Keyhani1 & R. Yang1& M. Zhou1
Received: 9 November 2018 /Accepted: 10 February 2019 /Published online: 12 March 2019# Society for Experimental Mechanics 2019
AbstractTo understand the mesoscale mechanisms responsible for the behavior of heterogeneous materials and to validate models, it isimportant to experimentally measure the deformation and temperature fields at the microstructure level. So far, there has been nomethods that can yield such measurements simultaneously for dynamic experiments. Here, we report the development of a novelcapability for simultaneous time- and space-resolved recording of both fields over the same microstructure area of a sample withmicron-level spatial resolutions and microsecond time resolutions. Referred to as MINTED (Microscale In-situ Imaging ofDynamic Temperature and Deformation Fields), the system cohesively integrates a high-speed visible light (VL) camera and astate-of-the-art high-speed infrared (IR) camera via a custom-designed dichroic beam splitter-lens assembly. The combined VLand IR images allow the deformation fields to be obtained through digital image correlation (DIC) and the temperature fields overthe same area to be obtained through pixel-level calibration of the differing emissivities of heterogeneous constituents inmicrostructures. Experiments are conducted on granular sucrose in a Kolsky bar [or split-Hopkinson pressure bar (SHPB)]environment, yielding both microstructure level fields along with overall material response. The strain and temper-ature fields provide detailed first-time insight into the processes of fracture, friction, shear localization, and hotspot developmentin the microstructures.
The thermo-mechanical response of heterogeneous materialsunder dynamic loading is of great importance in many appli-cations. Dynamic loading events can cause severe damage andenergy dissipation, leading to the formation of temperaturespikes in a wide range of materials, including, e.g., metals[1–4], polymers [5], composites [6], ceramics [7], shape mem-ory alloys (SMAs) [8, 9], and energetic materials [10, 11]. Oneclass of temperature spikes are referred to as hotspots, and cancause thermal softening, thermal runaway, or even the onset ofchemical reactions in energetic materials [12]. Local failureand formation of temperature spikes result from several fac-tors, such as strain localization due to heterogeneity in the
microstructure, material property mismatch between constitu-ents, and the existence of defects such as voids, cracks andinclusions. Field et al. [10, 11] provided evidence for themechanisms contributing to the formation of hotspots.Subsequently, computational and experimental approacheshave been widely used to study mechanisms responsible forheat generation in heterogeneous materials. Specifically forenergetic materials, computational studies have enhanced un-derstanding of heating mechanisms. However, these studiesare limited in terms of the resolution of fine-scale physics andrequire experimental data for calibration and validation. Onthe other hand, experiments have provided insights into un-derlying heating mechanisms. For example, it is known thatinelasticity [13, 14], void collapse, inter-particle contact, andinternal fracture and friction [15, 16] are dominant heatingmechanisms in energetic materials and other heterogeneousmaterials. However, experiments have not allowed full under-standing and detailed quantification of the underlying mecha-nisms primarily due to the lack of abilities to directly measure,in time- and space-resolved manner, the thermal and mechan-ical fields at the microstructural level for dynamic conditions.
1 The GeorgeW.Woodruff School ofMechanical Engineering, Schoolof Materials Science and Engineering, Georgia Institute ofTechnology, Atlanta, GA 30332-0405, USA
The experimental study of the thermo-mechanical responseof such heterogeneous materials at the microstructure levelunder dynamic loading has been especially challenging dueto limitations of existing techniques for deformation and tem-perature measurements at high speeds and high spatial resolu-tions over the same area of a sample. As a result, dynamicexperiments have been limited to either mechanical deforma-tion or thermal responses. Specifically, these experimentshave been based on indirect/implied correlations between de-formation mechanisms and thermal responses [11, 15, 17],without quantitative measurements that can directly relatethe mechanical and thermal events.
For time-resolved temperature measurements in dynamicexperiments, researchers have used several approaches includ-ing embedded electrical sensors [18, 19], optical pyrometry[20], Raman spectroscopy [21], Neutron resonance spectros-copy [22], and reflectance thermometry [23, 24]. All of theseapproaches have some advantages and disadvantages. For ex-ample, embedded electrical sensors can measure the tempera-ture of a sample with high accuracy and is independent of thesample properties. However, thick sensors do not equilibratewith the sample quickly enough and thin sensors may breakbefore or during experiments, as a result, the technique cannotbe used for highly dynamic events. This challenge can beavoided by using non-contact approaches including opticalpyrometry and Raman spectroscopy. However, these non-contact approaches so far offer bulk average measures, requirethe knowledge of the sample properties such as radiance andemissivity, and do not offer high spatial resolutions. The re-flectance thermometry approach uses light reflected from thesample rather than radiation emitted by the sample, whichdoes not require knowledge of the properties of the samplebut again requires the adherence of an extrinsic material on thesample and depends on thermal equilibration between thesample and the extrinsic material film [23, 24]. None of thesemethods allow simultaneous recording of both deformationand temperature fields over an area of a sample’smicrostructure.
The work by Coffey and Jacobs [25] was an early attemptto estimate the temperature achieved during deformation inimpact experiments. The technique uses heat-sensitive filmswhich darken upon exposure to heat. Since darkening levelsof the heat-sensitive films depend on both temperature andtime, the time of deformation must be known to estimate tem-perature levels based on calibration curves. Later, heat-sensitive films along with high-speed photography were usedto study primary failure mechanisms in polymer bounded ex-plosives (PBXs) at the macroscale [10]. However, this tech-nique cannot reveal the underlying mechanisms at micronlevels. In the 1980s and 1990s, advances in infrared detectorsmade it possible to measure temperature in real time withmicroscale spatial resolutions. For example, Marchand andDuffy [2], Zehnder and Rosakis [26] and Zhou et al. [3] used
an integrated system of infrared thermal detectors to measuretemperature variations along lines across cracks and shearbands in metals. High-speed photography was also used tostudy the associated mechanical processes, but at different(larger) size scales.
Measuring temperatures of a material with thermocouples,spot pyrometers, heat sensitive films, or infrared temperaturedetectors along lines or over small areas has provided usefulinformation and insight. The measurements, to various de-grees, are averaged over space and time, or only available oversmall domains. For example, Costin et al. [27] used only oneinfrared detector and homogenized the temperature over a spotsize of 1 mm. Later, Hartley et al. [1] used a linear array ofinfrared detectors and measured the temperature over a spotsize of 20 μm. Similarly, Merchand and Duffy [2], and Zhouet al. [3] used linear arrays of 12-16 infrared detectors withspot sizes of 35 − 100 μm. In the first spatial temperaturemeasurement effort, Guduru et al. [4] developed and used aspatial array of 8 × 8 infrared detectors, with each detectormeasuring the average temperature over an area of 110 ×110 μm. These methods are quite advanced and are still infurther development. However, so far the spatial or temporalresolutions certainly show need for significant improvementbefore full characterization of events at the microstructurelevel at high loading rates are possible. In particular, for het-erogeneous materials, the differing emissivities of multipleconstituents must be accounted for in order for correct tem-peratures to be obtained. This task requires an independentimage of the evolving material microstructure that is in addi-tion to the IR image as deformation occurs. Existing capabil-ities do not offer such independent images.
For quasi-static conditions, infrared (IR) cameras havebeen used along with visible light (VL) cameras for simulta-neous temperature and deformation measurements. For exam-ple, an experimental environment consist of VL and IR cam-eras was used to measure temperature and deformation fieldsduring glass forming [28]. The VL and IR imaging was not atnormal incidence since the cameras have different angles ofview. Further, the measurement was macroscopic and not mi-croscopic. A dichroic mirror was used to separate VL and IRemissions from the sample surface to achieve imaging at nor-mal angle [29, 30] in a setup for quasi-static conditions with amaximum stain rate of 5 × 10⁻³ s−1. High-speed infrared cam-eras have recently developed to a point where capturing time-and space-resolved measurements over areas on the order ofmillimeters is now possible, at resolutions of microns andmicroseconds. Although the IR imaging capabilities are stillnot on par with visible spectrum imaging, simultaneous mea-surements for deformations rates on the order of 103 s−1 typ-ical of Kolsky bar (or split-Hopkinson bars) can be achieved.
The split-Hopkinson pressure bar (SHPB) or Kolsky barapparatus (KBA) is a well-established experimental techniquefor characterizing materials and structures under dynamic
776 Exp Mech (2019) 59:775–790
loads. The SHPB apparatus was established by Hopkinson[31], with further developments by Kolsky [32]. Since itsadvent, it has been improved and extended for a wide rangeof applications such as dynamic compression and tension tests[33, 34], torsion tests (torsional split-Hopkinson bar or TSHB)[35, 36], the Brazilian test [37, 38], fracture toughness mea-surements [39–41], wave separation and dispersion tests[42–44], dynamic loading experiments on geotechnical mate-rials [45] and soft materials [46], and other high strain rateexperiments [47]. The SHPB apparatus or the KBA providesstress-strain, strain-time, and strain rate-time relations [48],which can be used to validate constitutive relations of mate-rials at high strain rates [49]. The SHPB apparatus also hasbeen used along with infrared detectors to analyze the overallthermo-mechanical response of materials [5, 6]. The classicdevices allow for only macro-scale analyses of dynamic re-sponse of materials. For meso-scale analyses of deformationin materials, the SHPB apparatus has been used along withhigh-speed photography [17, 38, 49, 50] and high-speed x-rayimaging [51].
In this paper, we report the development of a novel capa-bility for simultaneous, time-resolved and space-resolved re-cording of both the temperature field and the deformation fieldover the same microstructure area of a sample with micron-level spatial resolutions and microsecond temporal resolu-tions. Referred to as MINTED (Microscale In-situ Imagingof DynamicTemperature andDeformation Fields), the systemcohesively integrates a high-speed visible light (VL) cameraand a state-of-the-art high-speed infrared (IR) camera via acustom-designed dichroic beam splitter-lens assembly. Thecombined VL and IR images allow the deformation fields tobe obtained through digital image correlation (DIC) and thetemperature fields over the same area to be obtained throughpixel-level calibration of the differing emissivities of hetero-geneous constituents in microstructures. Experiments are con-ducted on granular sucrose which is widely used as a simulantof energetic crystals [52] in a KBA or SHPB environment,yielding both microstructure level fields along with overallmaterial response. The strain and temperature provide detailedfirst-time insight into the processes of fracture, friction, shearlocalization, and hotspot development in the microstructures.In particular, the correlation between hotspots, microstructure,and local deformation mechanisms is analyzed.
Experimental Layout
The overall configuration of the MINTED system in a SHPBenvironment is illustrated in Fig. 1. To simultaneously capturedeformation and temperature fields, the visible (VL) and in-frared (IR) parts of the emission spectrum from the samplepass through a sapphire window and are separated by a di-chroic beam splitter. VL is reflected and IR is transmitted. The
VL reflection efficiency of the dichroic beam splitter and theIR transmission efficiency are both greater than 85%. The VLcamera is mounted vertically, while the IR camera is mountedhorizontally, directly facing the sample surface. The sample isencased in a specimen holder, as discussed later. The IR emis-sion passes through a set of custom-designed correction lensesto correct wave-front distortions induced by the non-normalincidence of the IR beam at the beam splitter which has a finitethickness. The IR and VL cameras are synchronized in timeand calibrated in spatial positions (see below), consequently,the VL and IR images can be coordinated for the extraction ofthe deformation and temperature fields. A triggering system isdesigned and built to operate the two cameras simultaneously.Two sets of sensors are placed close to the incident bar todetect the motion of the bar and trigger the cameras and otherdevices via a control box. The control box also activates elec-tric solenoid valves to run an air gun to start the exper-iment and secure the loading mechanism. Illustrationsand pictures of the experimental setup are shown inFigs. 1 and 2, respectively.
High-Speed Photography of Deformation Fields
A Phantom v2512 camera, which can operate at 25,700 fps at1 megapixel (MP) resolution and 1,000,000 frames per second(fps) at 128 × 32 pixels, is used to record the VL images. AnInfinity K1 long-distance microscope lens is used along withthe VL camera to zoom in far enough to capture high-resolution micro-scale images. The VL lens magnificationfactor is 2.09 and the working distance is 145 mm. The VLimages are captured by the high-speed camera, with a framerate of 100,000 fps, a spatial resolution of 13.4 μm, and a fieldof view (FOV) of 6.9 × 4.3 mm to record the deformation ofthe sample.
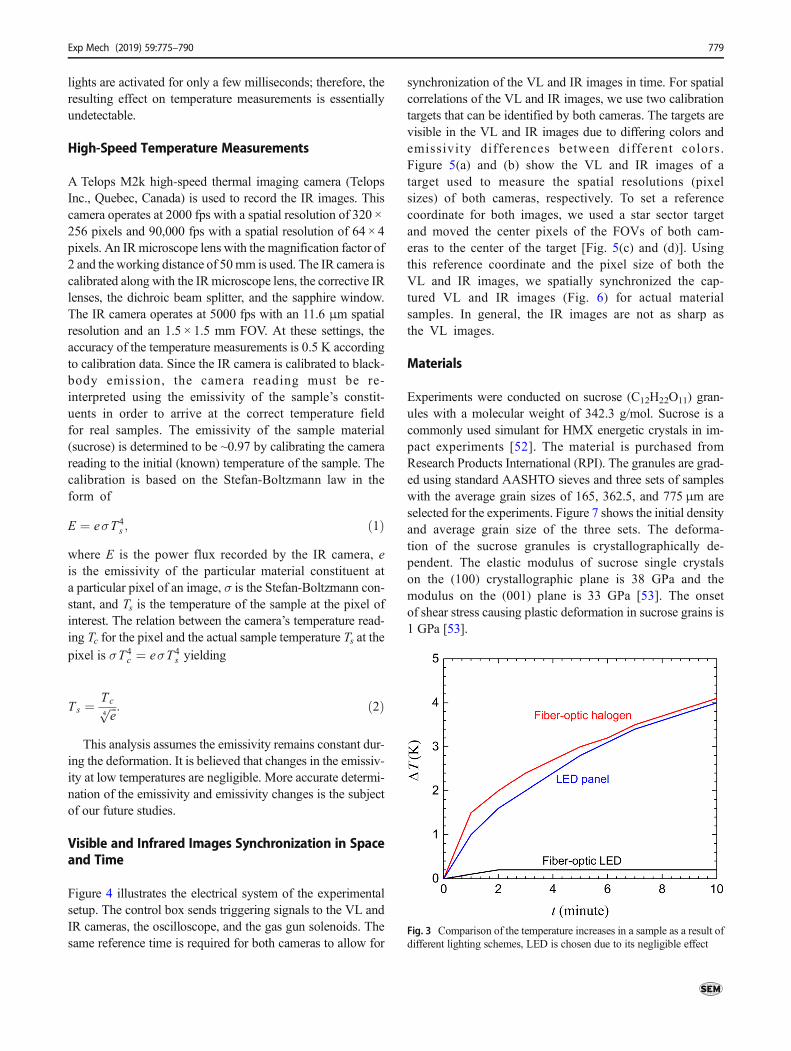
Selecting a proper illumination light source for high-speedimaging in this experimental layout is challenging. A suffi-ciently bright light source is necessary at framing rates around100,000 fps; however, due to the high level of heat generationby a powerful light source, temperature measurements arelikely to be affected. In addition, the custom-designed dichroicbeam splitter-lens assembly is very close to the specimen con-finement box and the sample (< 5 mm), leaving only a verytight space for an illuminating light source. To overcome thesechallenges, four LED light sources along with fiber optics areused. The LED light sources are placed far from the sample,and the light is projected onto the sample through opticalfibers, as shown in Fig. 2. This configuration minimizesheating relative to other light sources, such as halogen lights,and permits proper placement within the tight space of theexperimental setup. We tested the temperature interferenceof three available lighting options including fiber-optic halo-gens, LED panels, and fiber-optic LEDs, the latter of whichhas the least effect on the sample temperature (see Fig. 3).
Exp Mech (2019) 59:775–790 777
Since the system of integrated VL and IR cameras can also beused for quasi-static experiments, the temperature interferenceanalysis of the illumination is carried out over a relatively long
period of 10min (Fig. 3). The fiber-optic LEDs used result in a0.2 K increase in the temperature of the sample after 10 min.However, for the experiments conducted, the illuminating
Fig. 1 Experimental setup for simultaneous high-speed infrared (IR) and visible (VL) imaging of microscale temperature and deformation fields underdynamic conditions; (a) configuration of the split-Hopkinson bar apparatus and visible and infrared cameras, (b) relative positons of the confinement box, thedichroic beam splitter, the visible microscope lens, and the infrared lens assembly, and (c) relative positions of visible and infrared fields of view
Fig. 2 Pictures of the MINTEDexperimental system; (a) overallview of the components, and (b)close-up view of the dichroicbeam splitter, the VL and IRlenses, and LED lighting
778 Exp Mech (2019) 59:775–790
lights are activated for only a few milliseconds; therefore, theresulting effect on temperature measurements is essentiallyundetectable.
High-Speed Temperature Measurements
A Telops M2k high-speed thermal imaging camera (TelopsInc., Quebec, Canada) is used to record the IR images. Thiscamera operates at 2000 fps with a spatial resolution of 320 ×256 pixels and 90,000 fps with a spatial resolution of 64 × 4pixels. An IRmicroscope lens with the magnification factor of2 and the working distance of 50mm is used. The IR camera iscalibrated along with the IRmicroscope lens, the corrective IRlenses, the dichroic beam splitter, and the sapphire window.The IR camera operates at 5000 fps with an 11.6 μm spatialresolution and an 1.5 × 1.5 mm FOV. At these settings, theaccuracy of the temperature measurements is 0.5 K accordingto calibration data. Since the IR camera is calibrated to black-body emission, the camera reading must be re-interpreted using the emissivity of the sample’s constit-uents in order to arrive at the correct temperature fieldfor real samples. The emissivity of the sample material(sucrose) is determined to be ~0.97 by calibrating the camerareading to the initial (known) temperature of the sample. Thecalibration is based on the Stefan-Boltzmann law in theform of
E ¼ eσT 4s ; ð1Þ
where E is the power flux recorded by the IR camera, eis the emissivity of the particular material constituent ata particular pixel of an image, σ is the Stefan-Boltzmann con-stant, and Ts is the temperature of the sample at the pixel ofinterest. The relation between the camera’s temperature read-ing Tc for the pixel and the actual sample temperature Ts at thepixel is σT4
c ¼ eσT4s yielding
Ts ¼ Tcffiffiffie4
p : ð2Þ
This analysis assumes the emissivity remains constant dur-ing the deformation. It is believed that changes in the emissiv-ity at low temperatures are negligible. More accurate determi-nation of the emissivity and emissivity changes is the subjectof our future studies.
Visible and Infrared Images Synchronization in Spaceand Time
Figure 4 illustrates the electrical system of the experimentalsetup. The control box sends triggering signals to the VL andIR cameras, the oscilloscope, and the gas gun solenoids. Thesame reference time is required for both cameras to allow for
synchronization of the VL and IR images in time. For spatialcorrelations of the VL and IR images, we use two calibrationtargets that can be identified by both cameras. The targets arevisible in the VL and IR images due to differing colors andemissivity differences between different colors.Figure 5(a) and (b) show the VL and IR images of atarget used to measure the spatial resolutions (pixelsizes) of both cameras, respectively. To set a referencecoordinate for both images, we used a star sector targetand moved the center pixels of the FOVs of both cam-eras to the center of the target [Fig. 5(c) and (d)]. Usingthis reference coordinate and the pixel size of both theVL and IR images, we spatially synchronized the cap-tured VL and IR images (Fig. 6) for actual materialsamples. In general, the IR images are not as sharp asthe VL images.
Materials
Experiments were conducted on sucrose (C12H22O11) gran-ules with a molecular weight of 342.3 g/mol. Sucrose is acommonly used simulant for HMX energetic crystals in im-pact experiments [52]. The material is purchased fromResearch Products International (RPI). The granules are grad-ed using standard AASHTO sieves and three sets of sampleswith the average grain sizes of 165, 362.5, and 775 μm areselected for the experiments. Figure 7 shows the initial densityand average grain size of the three sets. The deforma-tion of the sucrose granules is crystallographically de-pendent. The elastic modulus of sucrose single crystalson the (100) crystallographic plane is 38 GPa and themodulus on the (001) plane is 33 GPa [53]. The onsetof shear stress causing plastic deformation in sucrose grains is1 GPa [53].
Fig. 3 Comparison of the temperature increases in a sample as a result ofdifferent lighting schemes, LED is chosen due to its negligible effect
Exp Mech (2019) 59:775–790 779
Loading Configuration
A classic compression split-Hopkinson bar (SHPB) or Kolskybar setup is used for the dynamic compression of the samplesas discussed below. The striker (projectile), and incident andtransmission bars are made from the C350maraging steel witha density of ρ = 7800 Kg/m3 and a Young’s modulus of E =210 GPa, yielding a bar wave speed of
c ¼ ffiffiffiffiffiffiffiffiE=ρ
p ¼ 5188 m=s. The length of the striker is Lst =50 cm. With this configuration, the duration of the generatedcompressive pulse in the incident bar is τ = 2Lst/c = 0.2 ms.The length and the diameter of each bar (incident and trans-mission) is 152.4 cm (5 ft) and 1.27 cm (0.5 in), respectively.
The Sucrose grains are confined in a box with a sapphirewindow. Loading is through two indenters, as illustrated in
Fig. 8. The internal dimensions of the confinement box are5 × 7 × 5 mm. The confinement box is designed such that theends of the incident bar and the transmission bar are placedinside the indenters (not visible). This design prevents lateralmovements of the confinement box and the sample relative tothe lenses in order to ensure the safety of the optics and inorder to maintain the focal distance between the sample andthe lenses necessary for capturing sharp images. The relativepositions of the confinement box, the incident bar, and thetransmission bar are shown in Fig. 1(b). Themaximum overallstrain rate in the experiments carried out is 1260 ± 90 s−1.
In a standard SHPB apparatus, the overall stress, strain andstrain rates in the sample can be calculated using the signalsobtained by strain gages mounted on the bars. A requirementfor this calculation is that the sample is relatively small and
Fig. 5 (a) and (b): visible andinfrared images of a target forresolution determination,respectively. (c) and (d): visibleand infrared images of a starsector target for alignment,respectively. The resolution of allimages is 320 × 256 pixels
Fig. 4 Schematic illustration ofelectrical and control devices
780 Exp Mech (2019) 59:775–790
wave reverberations due to impedance mismatch between thebars and the sample are equilibrated quickly. In this work, theconfinement box causes the wave reverberations to be moresignificant relative to cases without the confinement box. Assuch the standard calculations are less accurate. In this paper,the overall strain and strain rate in the samples are calculatedbased on the relative distance of the indenters (engineeringstrain, ΔL/L0, where L0 = 5 mm is the initial length of thesample in the loading direction). The relative distance betweenthe indenters are obtained from the VL images. This is moreaccurate than using the bar signals. As for stress, we chose tobe silent rather than reporting less than reliable readings andfocus on the deformation and heating at the microstructurelevel instead. It is certainly desirable to obtain the overallstress on the sample in the future.
Results and Discussion
The experiments here focus on the evaluation of the capabil-ities of the developed MINTED system. We begin by subject-ing the three materials to loading under the conditionsdiscussed above. The recorded images are computationally
analyzed. The temperature fields reported here reflect inter-pretation accounting for the emissivity effect based on equa-tion 2. The temperature fields are analyzed in conjunctionwith the deformation fields to correlate the locations ofhotspots with microstructure features. Digital image correla-tion (DIC) analyses are carried out to obtain the strain fieldsfor comparison with the temperature fields. The use of thethree sets of samples allows the effects of grain size on theresponses of the materials to be analyzed. During the experi-ments, the environment temperature and humidity are 296.3 ±0.25 K and 42.9 ± 0.8 % , respectively.
Deformation Mechanisms
Under compression, the sucrose grains are fractured andsmaller crushed particles hold together and form a coherentcompact, in what is known as the briquetting process. Sucrosehas a high level of briquetting tendency under compression,unlike other organic materials such as coal and sodium chlo-ride [54]. Figure 9 shows an SEM image of material C�d0 ¼ 775 μm� �
after the experiment. This figure shows thatsome grains have sizes similar to the sizes of the initial grains,suggesting that these grains may not have fractured under
Fig. 7 Initial grain size anddensity of materials
Fig. 6 Relative positions of visible and infrared fields of view for (a) the undeformed sample and (b) the deformed sample
Exp Mech (2019) 59:775–790 781
loading. This figure also provides visual evidence ofbriquetting. Micro densification is important for achievingsufficient areas of contact between the particles in a compactin order for the whole sample to remain coherent after thepressure is released (i.e., briquetting). Although organic parti-cles such as sodium chloride, coal, and sucrose are known tobe brittle [55], these materials behave plastically if they aresmall and subjected to high levels of compressive stress [56].The critical size of a particle for transition from fragmentationto plastic deformation is uncertain and varies over a consider-able range of factors.
Figure 10 shows the stages of overall deformation (engi-neering strain,ΔL/L0, where L0 = 5 mm is the initial length of
the sample in the loading direction) in the materials as a func-tion of time during the experiments. The overall strain in thesample is calculated using the relative positions of the in-denters recorded in the VL images. Three stages are observed:(1) fragmentation of grains (0 ≤ t < 0.56 ms), (2)briquetting (0.56 ≤ t < 1.18 ms), and (3) unloading(t ≥ 1.18 ms). The three materials show similar deforma-tion trends; therefore, we mainly discuss material C inthis section. Figure 10 also shows the times of the in-frared images captured at a rate of one frame for every 20visible images based on the framing rates of the two cameras.In addition, this figure denotes the infrared images with andwithout temperature increase.
Fig. 8 Illustration of theconfinement box, the sample, andthe sapphire window for thecompression experiments
Fig. 9 SEM image of material Cafter the experiment
782 Exp Mech (2019) 59:775–790
In the first stage of deformation (0 ≤ t < 0.56 ms), materialC (sieve 30) is compressed by 38% and inter-granular voidcollapse occurs, as shown in Fig. 11. Fine grains (d ≤ 50 μm)resulting from fragmentation flow between large grains (d ≥250 μm) and fill the voids in between. The filled voids do notexperience as extensive deformation as unfilled voids. In thisstage, the IR camera captures two infrared images and neithershows appreciable temperature increase. In the second stageof deformation (0.56 ≤ t < 1.18 ms), the material is furthercompressed by 10% and unlike in the first stage, a limitedamount of fragmentation is observed. Four IR images are
captured in this stage, with the latter two images showingincreases in temperature inside the material. In the last stage(t ≥ 1.18 ms), partial unloading occurs as the overall straindecreases from 47.1% to 41.2%. The two IR images associatedwith the third stage show significant temperature increase inthe material.
Temperature Fields
The two major heating mechanisms in the materials are plasticdeformation and friction. Sucrose is known to be brittle ingeneral, but can deform plastically if the grains are smalland high levels of compressive stresses are present.According to our observations, grain fragmentation in the firststage does not directly lead to heat generation; however, frag-mentations affect heat generation by facilitating inelastic de-formation and, more importantly, localized frictional heatingalong fragmented faces.
Experimentally, it is challenging to quantify the con-tribution of each underlying mechanism to the formationof hotspots. However, the simultaneous visible and in-frared images allow the locations of the hotspots with respectto microstructure features to be identified. The localized tem-perature spikes or hotspots are responsible for thermal soften-ing, thermal runaway, and ignition in energetic materials.Identification of the locations of the hotspots is important forunderstanding the underlying mechanisms leading to forma-tion of the hotspots. For example, a hotspot inside a grain andfar from interfacial boundaries most likely results from inelas-tic deformation, while a hotspot at a boundary likely results
Fig. 11 Visible image sequence of inter-granular void collapse (material C)
Fig. 10 Overall strain in the material as a function of time. The solid andhollow circles show the temperature frames with and without temperatureincrease, respectively
Exp Mech (2019) 59:775–790 783
from frictional dissipation. In addition, knowledge of the po-tential locations of hotspots can be used to modify the localthermo-mechanical response of materials by changing theconstituent and interfacial properties.
Figure 12(a) and (b) show a sequence of visible images andthe corresponding temperature fields for material C, respec-tively. The first infrared image showing temperature increaseis captured at t = 0.8 ms, which occurs in the second stage ofdeformation. Due to the highly non-uniform stress distribu-tions, some grains experience little deformation or failure. Asa result, a few large grains (d ≥ 250 μm) remain in the bri-quette. Inelastic deformation occurs after micro-squashing.Therefore, unfragmented or partially fragmented grains showlittle plastic deformation in the interior but mostly frictionalheating and deformation at or near the boundaries. The bound-aries of larger grains are the primary locations of hotspots, asshown in Fig. 12(b), suggesting the primary role of interfacialfriction in the formation of these hotspots.
Variations in grain size of the materials provide perturba-tions to the thermo-mechanical processes, causing tempera-ture distributions to differ. Figure 13 shows the temperaturedistributions in the three materials at t = 1.23 ms. Despite thehigher overall temperature levels, the temperature fields in thematerials with smaller grain sizes (materials A and B) are lesslocalized. Materials with smaller grains experience more en-ergy dissipation, since smaller grains are more likely to under-go plastic deformation, and their high surface to volume ratiosfacilitate frictional dissipation. As a result, the samples withsmaller initial grain sizes show higher amounts of heating andhigher overall temperatures than materials with larger grainsizes. However, despite the higher amounts of overall heat
generation, the materials with smaller grains have lower levelsof peak temperatures. This reduction in localized heating re-sults from two factors. First, energy dissipation from plasticdeformation spreads more widely in and is less localized.Second, frictional heating is more uniformly distributed sincemore sites for frictional heating exist.
Figure 14(a) and (b) show the average temperature and thepeak temperature levels of the materials. The materialswith larger grain sizes have lower average temperaturesbut higher peak temperatures. Specifically, the difference be-tween the average and peak temperatures in material Ad0 ¼ 165 μm� �
is only 1.3 K, while the difference in materialC d0 ¼ 775 μm� �
is 16.5 K. The uncertainty in temperaturemeasurements is 0.5 K according to calibration data. The cor-relation between local deformation and temperature inhotspots is discussed in the next section.
Digital Image Correlation (DIC) Analysisof Deformation
Hotspots result from various deformation mechanisms; there-fore, the deformation fields are very useful in the determina-tion of dominant mechanisms contributing to the formation ofhotspots. To obtain the strain fields, we performed digital im-age correlation (DIC) analysis, a widely used non-contacttechnique for measuring material deformation. The analysisis carried out with the Ncorr, an open-source subset-basedpackage with enhanced algorithms [57]. This package usesthe reliability-guided digital image correlation (RG-DIC)framework [58]. Since displacements are at discrete locations,strain fields calculated directly from displacements tend to be
Fig. 12 Visible and infrared image sequences of material C. No temperature increase is observed for t < 0.8 ms
784 Exp Mech (2019) 59:775–790
noisy and unreliable. To address this issue, Ncorr uses a 2DSavitzky-Golay (SG) digital differentiator based on theprinciple of local least-square fitting with two-dimensionalpolynomials [59].
DIC analysis assumes displacement continuity in the re-gion of interest (ROI) where the correlation is performed.The incorporation of discontinuities in DIC analyses is anopen problem in the literature. For the cases when the discon-tinuity path is known, the displacement field on each side ofthe discontinuity can be analyzed separately [60]. A potentialdrawback of this approach is that the displacements at or nearthe discontinuities/interfaces cannot be calculated directly. Weare aware of attempts to obtain the displacements in the neigh-borhood of an interface via extrapolation. Even so, tractioncontinuity across the interface cannot be ensured. A DIC anal-ysis is even more complex and less reliable when arbitrarycrack initiation sites and propagation paths exist. Because ofthese reasons and the significant fragmentation in the firststage of deformation, the DIC analysis is only performed forthe second stage of deformation when the material isbriquetted. Therefore, the obtained strain fields from theDIC analysis are not representative of the total deformation
from the very beginning of loading. In general, out-of-planemovements of grains are unavoidable and these movementspartially degrade the DIC results. Out-of-plane movements ofgrains are restricted during the second stage as a result ofbriquetting. After briquetting, the sample has planar surfaces.These surfaces remain planar during the deformation processas a result of confinement. For confined compacted sugarsamples, Forsberg and Siviour (2009) performed 2D-DICand 3D digital volume correlation (DVC), and showed thatthe results of 2D and 3D analysis are very close [61]. Toestimate the distortion levels of IR and VL images, we useddistortion targets which consist of arrangement of identicalspeckles with known distances. The long-distance microscopelenses used for the IR and VL imaging showed negligiblelevels of distortion.
Figure 15 shows the reference image, the final image, andthe subset size with respect to the microstructure for the DICanalysis. The natural pattern of the briquette is used for theDIC analysis [61]. To compensate for the lack of a specklepattern, a large circular subset with a diameter of 50 pixels(0.67 mm) and a total number of 1964 pixels is used. Thesubset size is large enough to circumscribe the largest grain
Fig. 13 Temperature fields in the materials at t = 1.23 ms; (a) material A, (b) material B, and (c) material C
Fig. 14 (a) Average temperaturelevels in the materials and (b)peak temperature levels in thematerials as functions of time. Att = 0.83 ms, material Bd0 ¼ 363 μm� �
is at the initialtemperature state. The error barsshow the uncertainty intemperature measurements
Exp Mech (2019) 59:775–790 785
in the reference image [see Fig. 15(a)]. In the second stage, theaverage stain rate is 153 s−1 and the maximum strain rate is697 s−1 which occurs at the beginning of this stage. Therefore,with a temporal resolution of 10μs, the average strain increasebetween successive frames is 1.5 × 10⁻³ and the maximumstrain increase between successive frames is 7 × 10⁻³ whichoccurs only for the first few frames.
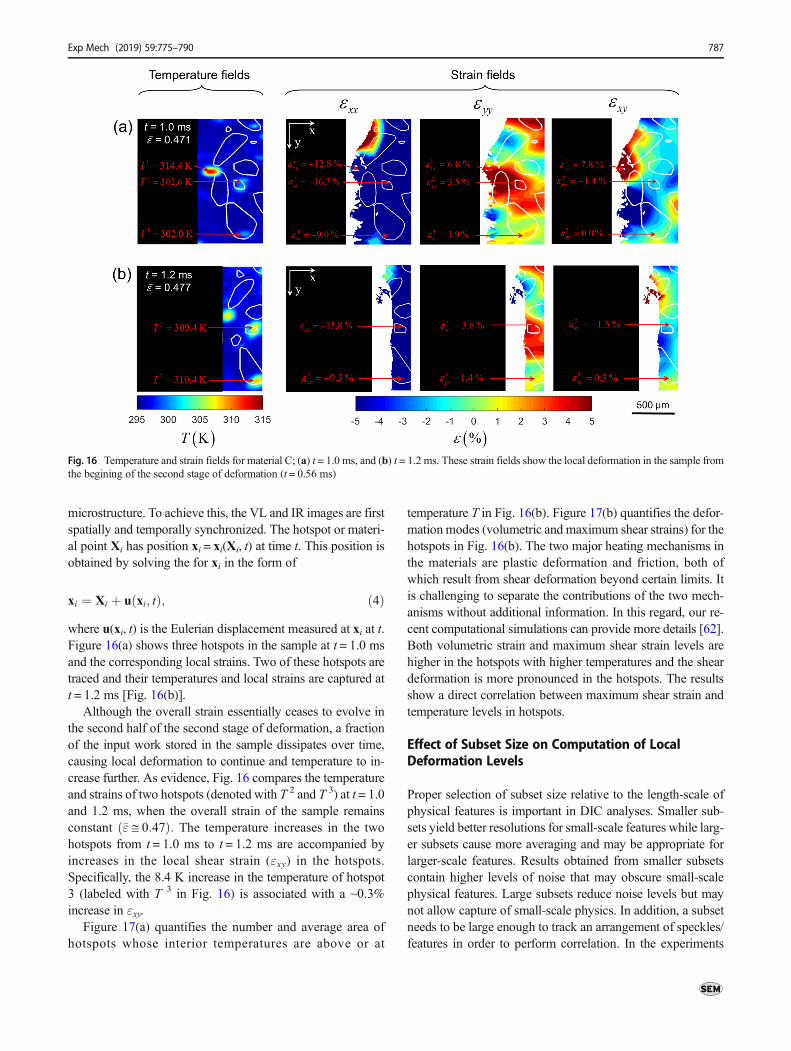
Figure 16 shows the temperature and Almansi strain fieldsof material C at t = 1.0 and 1.2 ms. The Almansi strain tensoris defined through
ε ¼ 1
2I−F−T F−1� �
; ð3Þ
where I and F are the second-order identity and thedeformation gradient tensors, respectively. The super-scripts "-T" and "-1" denote the inverse transpose and inverseof tensors, respectively. The strain fields show the local defor-mation in the sample from the beginning of the second stageof deformation (t = 0.56 ms). Therefore, these strain fields are
not representative of the total deformation in the sample sincethe very beginning of loading. Since the temperature of thematerial does not begin to increase appreciably until the latterpart of the second stage of deformation, the deformationmechanisms involved in the second stage are primarily re-sponsible for the temperature increase in the material. Thestrain fields indicate highly heterogeneous deformation. Thenormal strains show regions of instantaneous expansion andcontraction in both axial directions. The shear strains showvertices or shear in both the clockwise and counterclockwisedirections. These features are consistent with the flow of gran-ular materials.
Correlation between Deformation and Temperaturein Hotspots
With the VL and IR image sequences, the unique MINTEDcapability allows the determination and tracing of the trajec-tories of hotspots or material points with respect to the
Fig. 15 (a) The reference imageand the subset size, and (b) 2 outof the 63 intermediate frames andthe final image used for the DICanalysis. The black dash lineshows the external boundaries ofthe sample and the red dash lineshows the FOVof the IR camera
786 Exp Mech (2019) 59:775–790
microstructure. To achieve this, the VL and IR images are firstspatially and temporally synchronized. The hotspot or materi-al point Xi has position xi = xi(Xi, t) at time t. This position isobtained by solving the for xi in the form of
xi ¼ Xi þ u xi; tð Þ; ð4Þwhere u(xi, t) is the Eulerian displacement measured at xi at t.Figure 16(a) shows three hotspots in the sample at t = 1.0 msand the corresponding local strains. Two of these hotspots aretraced and their temperatures and local strains are captured att = 1.2 ms [Fig. 16(b)].
Although the overall strain essentially ceases to evolve inthe second half of the second stage of deformation, a fractionof the input work stored in the sample dissipates over time,causing local deformation to continue and temperature to in-crease further. As evidence, Fig. 16 compares the temperatureand strains of two hotspots (denoted with T 2 and T 3) at t = 1.0and 1.2 ms, when the overall strain of the sample remainsconstant �ε ≅ 0:47ð Þ: The temperature increases in the twohotspots from t = 1.0 ms to t = 1.2 ms are accompanied byincreases in the local shear strain (εxy) in the hotspots.Specifically, the 8.4 K increase in the temperature of hotspot3 (labeled with T 3 in Fig. 16) is associated with a ~0.3%increase in εxy.
Figure 17(a) quantifies the number and average area ofhotspots whose interior temperatures are above or at
temperature T in Fig. 16(b). Figure 17(b) quantifies the defor-mationmodes (volumetric and maximum shear strains) for thehotspots in Fig. 16(b). The two major heating mechanisms inthe materials are plastic deformation and friction, both ofwhich result from shear deformation beyond certain limits. Itis challenging to separate the contributions of the two mech-anisms without additional information. In this regard, our re-cent computational simulations can provide more details [62].Both volumetric strain and maximum shear strain levels arehigher in the hotspots with higher temperatures and the sheardeformation is more pronounced in the hotspots. The resultsshow a direct correlation between maximum shear strain andtemperature levels in hotspots.
Effect of Subset Size on Computation of LocalDeformation Levels
Proper selection of subset size relative to the length-scale ofphysical features is important in DIC analyses. Smaller sub-sets yield better resolutions for small-scale features while larg-er subsets cause more averaging and may be appropriate forlarger-scale features. Results obtained from smaller subsetscontain higher levels of noise that may obscure small-scalephysical features. Large subsets reduce noise levels but maynot allow capture of small-scale physics. In addition, a subsetneeds to be large enough to track an arrangement of speckles/features in order to perform correlation. In the experiments
Fig. 16 Temperature and strain fields for material C; (a) t = 1.0 ms, and (b) t = 1.2 ms. These strain fields show the local deformation in the sample fromthe begining of the second stage of deformation (t = 0.56 ms)
Exp Mech (2019) 59:775–790 787
here, the natural pattern of the briquetted sample is used forthe DIC analysis. To compensate for the lack of a specklepattern, the subset needs to be large enough to capture bound-aries of grains in order to calculate the deformation fieldsinside grains. Therefore, a large circular subset with a diameterof 0.67 mm (50 pixels) that circumscribes the largest grain inthe sample is used [see Fig. 15(a)].
Hotspots are important physical features in the experimentsperformed here. Hotspot 2 (labeled with T 2 in Fig. 16) is at theboundary of a small grain with a size of 0.173 mm next toanother grain with a size of 0.3 mm. Therefore, a good corre-lation can be achieved even with subset sizes smaller than0.67 mm (50 pixels) for the neighborhood of hotspot 2.Figure 18 shows the strain components associated withhotspot 2 at t = 1.0 and 1.2 ms for subset sizes 0.4 − 0.94mm (30 − 70 pixels). The smallest subset with a size of0.4 mm (30 pixels) yields the highest level of εxy but thelowest levels of εxx and εyy in hotspot 2. As the subset sizeincreases to 0.94 mm (70 pixels), εxy decreases and the normalstrains (i.e., εxx and εyy) reach constant levels. The increase inεxy with decreasing the subset size shows that the shear defor-mation is more localized. Since this localized deformationoccurred at a grain boundary, this shear deformation resultsfrom friction. This observation is consistent with what we see
in our recent computational study [62]. In addition, the in-crease in εxy associated with the 6.4 K increase in the temper-ature of hotspot 2 from t = 1.0 ms to t = 1.2 ms is perspicuouswith small subsets. Specifically, the increase in εxy from t =1.0 ms to t = 1.2 ms is 1.4% for the subset size of 0.4 mm (30pixels) while the increase is only 0.1% for the subset size of0.64 mm (50 pixels).
Conclusion
A novel capability (MINTED, or microscale in-situ imagingof temperature and deformation fields under dynamic load-ing) for time-resolved and space-resolved measurements ofthe temperature and deformation fields at the microstructurelevel for dynamic conditions is developed. The method inte-grates a state-of-the-art high-speed infrared (IR) camera and ahigh-speed visible light (VL) camera in a split-Hopkinsonpressure bar (SHPB) or Kolsky bar apparatus. To simulta-neously capture deformation and temperature fields at normalincidence, the visible (VL) and infrared (IR) emissions fromthe sample are separated by a dichroic beam splitter. The beamsplitter reflects VL light and directs the light into the VLcamera. This is a general capability that can be used to study
Fig. 18 Variations in local strains(εxx, εyy, and εxy) inside hotspot 2(labeled with T 2 in Fig. 16)during the second stage ofdeformation as a function ofsubset size; (a)t = 1.0 ms, and (b) t = 1.2 ms.Here, ε denotes the overall strainoccurred in the sample during thesecond stage of deformation
Fig. 17 (a) Number and averagearea of hotspots whose interiortemperatures are above or attemperature T, and (b) localvolumetric and maximum shearAlmansi strains in hotspots asfunctions of hotspot temperaturefor material C at t = 1.2 ms[Fig. 16(b)]
788 Exp Mech (2019) 59:775–790
deformation, failure and heating in a range of materials, in-cluding metals, composites, ceramics, soft materials, and en-ergetic materials.
To demonstrate the capabilities of theMINTED system, weperformed experiments on sucrose granules, which are widelyused as a simulant of energetic crystals. The experiments in-volve three sucrose materials with the average grain sizes of165, 362.5, and 775 μm. The samples are confined in a boxbehind a sapphire window. Under loading, the grains arefragmented, squashed, and briquetted. The materials undergosignificant temperature increases in the briquetting stage.Despite higher overall temperature levels, the temperaturefields in the materials with smaller grain sizes are less local-ized. The unique capability here for simultaneous measure-ments of deformation and temperature fields allows the deter-mination and tracing of the locations of hotspots or materialpoints with respect to the material microstructure features. Theresults show that the boundaries of unfragmented grains arethe primary locations of hotspots. The maximum shear strainlevels are locally higher than volumetric strain levels in thehotspots, and there is a direct correlation between maximumshear strain and temperature levels in hotspots.
Acknowledgements The authors gratefully acknowledge support fromthe Air Force Office of Scientific Research through grant FA9550-15-1-0499 (Dr. Martin Schmidt). Experiments were performed at the DynamicProperty Research Laboratory (DPRL) at Georgia Tech.
References
1. Hartley KA, Duffy J, Hawley RH (1987) Measurement of the tem-perature profile during shear band formation in steels deforming athigh strain rates. J Mech Phys Solids 35(3):283–301. https://doi.org/10.1016/0022-5096(87)90009-3
2. Marchand A, Duffy J (1988) An experimental study of the formationprocess of adiabatic shear bands in a structural steel. J Mech PhysSolids 36(3):251–283. https://doi.org/10.1016/0022-5096(88)90012-9
3. Zhou M, Rosakis AJ, Ravichandran G (1996) Dynamically propa-gating shear bands in impact-loaded prenotched plates—I.Experimental investigations of temperature signatures and propa-gation speed. J Mech Phys Solids 44(6):981–1006. https://doi.org/10.1016/0022-5096(96)00003-8
4. Guduru PR, Rosakis AJ, Ravichandran G (2001) Dynamic shearbands: an investigation using high speed optical and infrared diag-nostics. Mech Mater 33(7):371–402. https://doi.org/10.1016/S0167-6636(01)00051-5
5. Li Z, Lambros J (2001) Strain rate effects on the thermomechanicalbehavior of polymers. Int J Solids Struct 38(20):3549–3562. https://doi.org/10.1016/S0020-7683(00)00223-7
7. Goretta KC, Park ET, Koritala RE, Cuber MM, Pascual EA, ChenN, de Arellano-López AR, Routbort JL (1998) Thermomechanicalresponse of polycrystalline BaZrO3. Physica C 309(3):245–250.https://doi.org/10.1016/S0921-4534(98)00588-7
8. Mukherjee K, Sircar S, DahotreNB (1985) Thermal effects associatedwith stress-induced martensitic transformation in a Ti-Ni alloy. MaterSci Eng 74(1):75–84. https://doi.org/10.1016/0025-5416(85)90111-9
9. McCormick PG, Liu Y, Miyazaki S (1993) Intrinsic thermal-mechanical behaviour associated with the stress-induced martens-itic transformation in NiTi. Mater Sci Eng A 167(1):51–56. https://doi.org/10.1016/0921-5093(93)90336-D
10. Field J, Bourne N, Palmer S, Walley S, Sharma J, Beard B (1992)Hot-spot ignition mechanisms for explosives and propellants [anddiscussion]. Philos Trans R Soc London A 339(1654):269–283.https://doi.org/10.1098/rsta.1992.0034
11. Field JE, Swallowe GM, Heavens SN (1982) Ignition mechanismsof explosives during mechanical deformation. Proc R Soc LondonA 382(1782):231–244. https://doi.org/10.1098/rspa.1982.0099
12. Tarver CM, Chidester SK, Nichols AL (1996) Critical conditionsfor impact- and shock-induced hot spots in solid explosives. J PhysChem 100(14):5794–5799. https://doi.org/10.1021/jp953123s
13. Winter RE, Field JE (1975) The role of localized plastic flow in theimpact initiation of explosives. Proc R Soc London A 343(1634):399–413. https://doi.org/10.1098/rspa.1975.0074
14. Guirguis RH (2000) Ignition due to macroscopic shear. AIP ConfProc 505(1):647–650. https://doi.org/10.1063/1.1303556
15. Skidmore C, Phillips D, Asay B, Idar D, Howe P, Bolme D (2000)Microstructural effects in PBX 9501 damaged by shear impact. AIPConf Proc 505(1):659–662. https://doi.org/10.1063/1.1303559
16. Menikoff R (2005) Elastic-plastic response of HMX. Researchhighlights.
17. Ravindran S, Tessema A, Kidane A (2017)Multiscale damage evo-lution in polymer bonded sugar under dynamic loading. MechMater 114:97–106. https://doi.org/10.1016/j.mechmat.2017.07.016
18. Bloomquist D, Sheffield S (1981) Shock-compression temperaturerise in polymethyl methacrylate determined from resistivity of em-bedded copper foils. Appl Phys Lett 38(3):185–187. https://doi.org/10.1063/1.92272
19. Bloomquist D, Sheffield S (1980) Thermocouple temperature mea-surements in shock-compressed solids. J Appl Phys 51(10):5260–5266. https://doi.org/10.1063/1.327480
20. Boboridis K, Obst AW (2003) A high-speed four-channel infraredpyrometer. AIP Conf Proc 684(1):759–764. https://doi.org/10.1063/1.1627219
21. Long DA (1977) Raman spectroscopy. McGraw-Hill, New York22. Yuan V, Bowman JD, Funk D, Morgan G, Rabie R, Ragan C,
Quintana J, Stacy H (2005) Shock temperature measurement usingneutron resonance spectroscopy. Phys Rev Lett 94(12):125504.https://doi.org/10.1103/PhysRevLett.94.125504
23. Dolan DH, Ao T, Seagle CT (2013) Reflectance thermometry indynamic compression experiments. AIP Conf Proc 1552(1):767–770. https://doi.org/10.1063/1.4819639
24. Dolan DH, Seagle CT, Ao T (2013) Dynamic temperature measure-ments with embedded optical sensors. SANDIA report noSAND2013-8203.
25. Coffey C, Jacobs S (1981) Detection of local heating in impact orshock experiments with thermally sensitive films. J Appl Phys52(11):6991–6993. https://doi.org/10.1063/1.328664
26. Zehnder AT, Rosakis AJ (1991) On the temperature distribution atthe vicinity of dynamically propagating cracks in 4340 steel. JMech Phys Solids 39(3):385-415. https://doi.org/10.1016/0022-5096(91)90019-K
27. Costin L, Crisman E, Hawley RH, Duffy J (1980) On thelocalisation of plastic flow in mild steel tubes under dynamic tor-sional loading. Proc 2nd Conf mechanical properties of materials athigh rates of strain, Oxford, England, pp 90–100.
28. Soudre-Bau L, Meshaka Y, Parent G, Boulet P, Le Corre B, JeandelG (2013) Combined temperature and deformation measurementduring glass forming in a real scale setup. Exp Mech 53(9):1773–1781. https://doi.org/10.1007/s11340-013-9764-z
29. Bodelot L, Charkaluk E, Sabatier L, Dufrénoy P (2011)Experimental study of heterogeneities in strain and temperaturefields at the microstructural level of polycrystalline metals throughfully-coupled full-field measurements by digital image correlationand infrared thermography. Mech Mater 43(11):654–670. https://doi.org/10.1016/j.mechmat.2011.08.006
30. Bodelot L, Sabatier L, Charkaluk E,Dufrénoy P (2009) Experimentalsetup for fully coupled kinematic and thermal measurements at themicrostructure scale of an AISI 316L steel. Mater Sci Eng A 501(1):52–60. https://doi.org/10.1016/j.msea.2008.09.053
31. Bertram Hopkinson FRS (1914) A method of measuring the pres-sure produced in the detonation of high, explosives or by the impactof bullets. Philos Trans R Soc London A 213(497-508):437–456.https://doi.org/10.1098/rsta.1914.0010
32. Kolsky H (1949) An investigation of the mechanical properties ofmaterials at very high rates of loading. Proc Phys Soc B 62(11):676
33. Davies EDH, Hunter SC (1963) The dynamic compression testingof solids by the method of the split Hopkinson pressure bar. J MechPhys Solids 11(3):155–179. https://doi.org/10.1016/0022-5096(63)90050-4
34. Staab GH, Gilat A (1991) A direct-tension split Hopkinson bar forhigh strain-rate testing. Exp Mech 31(3):232–235. https://doi.org/10.1007/bf02326065
35. Gilat A, Cheng C-S (2000) Torsional split Hopkinson bar tests atstrain rates above 104s−1. Exp Mech 40(1):54–59. https://doi.org/10.1007/bf02327548
36. Hartley K, Duffy J, Hawley R (1985) The torsional Kolsky (split-Hopkinson) bar. Metals handbook 8:218–228.
37. Wang QZ, Li W, Xie HP (2009) Dynamic split tensile test of flat-tened Brazilian disc of rock with SHPB setup. Mech Mater 41(3):252–260. https://doi.org/10.1016/j.mechmat.2008.10.004
38. Grantham SG, Siviour CR, Proud WG, Field JE (2004) High-strainrate Brazilian testing of an explosive simulant using speckle metrol-ogy. Meas Sci Technol 15(9):1867. https://doi.org/10.1088/0957-0233/15/9/025
39. Jiang F, Vecchio KS (2009) Hopkinson bar loaded fracture experi-mental technique: a critical review of dynamic fracture toughnesstests. Appl Mech Rev 62(6):060802-060839. https://doi.org/10.1115/1.3124647
40. Chen R, Xia K, Dai F, Lu F, Luo SN (2009) Determination ofdynamic fracture parameters using a semi-circular bend techniquein split Hopkinson pressure bar testing. Eng Fract Mech 76(9):1268–1276. https://doi.org/10.1016/j.engfracmech.2009.02.001
41. Wang QZ, Feng F, Ni M, Gou XP (2011) Measurement of mode Iand mode II rock dynamic fracture toughness with cracked straightthrough flattened Brazilian disc impacted by split Hopkinson pres-sure bar. Eng Fract Mech 78(12):2455–2469. https://doi.org/10.1016/j.engfracmech.2011.06.004
42. Zhao H, Gary G (1997) A new method for the separation of waves.Application to the SHPB technique for an unlimited duration ofmeasurement. J Mech Phys Solids 45(7):1185–1202. https://doi.org/10.1016/S0022-5096(96)00117-2
43. Bacon C (1998) An experimental method for considering disper-sion and attenuation in a viscoelastic Hopkinson bar. Exp Mech38(4):242–249. https://doi.org/10.1007/bf02410385
44. Bacon C (1999) Separation of waves propagating in an elastic orviscoelastic Hopkinson pressure bar with three-dimensional effects.Int J Impact Eng 22(1):55–69. https://doi.org/10.1016/S0734-743X(98)00048-7
45. FrewD, ForrestalMJ, ChenW (2001) A split Hopkinson pressure bartechnique to determine compressive stress-strain data for rock mate-rials. Exp Mech 41(1):40–46. https://doi.org/10.1007/BF02323102
46. Song B, Chen W (2004) Dynamic stress equilibration in splitHopkinson pressure bar tests on soft materials. Exp Mech 44(3):300–312. https://doi.org/10.1007/bf02427897
47. Othman R (2018) The Kolsky-Hopkinson bar machine: selectedtopics. Springer International Publishing, Cham.
48. Lindholm US (1964) Some experiments with the split hopkinsonpressure bar. J Mech Phys Solids 12(5):317–335. https://doi.org/10.1016/0022-5096(64)90028-6
49. Noble JP, Goldthorpe BD, Church P, Harding J (1999) The use ofthe Hopkinson bar to validate constitutive relations at high rates ofstrain. J Mech Phys Solids 47(5):1187–1206. https://doi.org/10.1016/S0022-5096(97)00090-2
50. Chen JJ, Guo BQ, Liu HB, Liu H, Chen PW (2014) DynamicBrazilian test of brittle materials using the Split Hopkinson pressurebar and digital image correlation. Strain 50(6):563–570. https://doi.org/10.1111/str.12118
51. Hudspeth M, Claus B, Dubelman S, Black J, Mondal A, Parab N,Funnell C, Hai F, Qi ML, Fezzaa K, Luo SN, Chen W (2013) Highspeed synchrotron x-ray phase contrast imaging of dynamic mate-rial response to split Hopkinson bar loading. Rev Sci Instrum 84(2):025102. https://doi.org/10.1063/1.4789780
52. Yeager JD, Higginbotham Duque AL, Shorty M, Bowden PR, StullJA (2018) Development of inert density mock materials for HMX. JEnerg Mater 36(3):253–265. https://doi.org/10.1080/07370652.2017.1375049
53. Ramos K, Bahr D (2007) Mechanical behavior assessment of su-crose using nanoindentation. J Mater Res 22(7):2037–2045. https://doi.org/10.1557/jmr.2007.0249
54. Hardman J, Lilley B (1970) Deformation of particles duringbriquetting. Nature 228(5269):353. https://doi.org/10.1038/228353b0
55. Huffine CL (1953) A study of the bonding and cohesion achievedin the compression of particulate materials. Columbia University,New York City.
56. Bridgman PW (1952) Physics of high pressure. Bell, London.57. Blaber J, Adair B, Antoniou A (2015) Ncorr: open-source 2D dig-
58. Pan B (2009) Reliability-guided digital image correlation for imagedeformation measurement. Appl Opt 48(8):1535–1542. https://doi.org/10.1364/AO.48.001535
59. Pan B, Xie H, Guo Z, Hua T (2007) Full-field strain measurementusing a two-dimensional Savitzky-Golay digital differentiator indigital image correlation. Opt Eng 46(3):033601. https://doi.org/10.1117/1.2714926
60. Rubino V, Rosakis AJ, Lapusta N (2017) Understanding dynamicfriction through spontaneously evolving laboratory earthquakes.Nat Commun 8:15991. https://doi.org/10.1038/ncomms15991
61. Forsberg F, Siviour CR (2009) 3D deformation and strain analysisin compacted sugar using x-ray microtomography and digital vol-ume correlation. Meas Sci Technol 20(9):095703. https://doi.org/10.1088/0957-0233/20/9/095703
62. Keyhani A, Kim S, Horie Y, Zhou M (2018) Energy dissipation inpolymer-bonded explosives with various levels of constituent plas-ticity and internal friction. Comput Mater Sci 159:136–149. https://doi.org/10.1016/j.commatsci.2018.12.008
Publisher’s Note Springer Nature remains neutral with regard to jurisdic-tional claims in published maps and institutional affiliations.