NREL is a national laboratory of the U.S. Department of Energy Office of Energy Efficiency & Renewable Energy Operated by the Alliance for Sustainable Energy, LLC This report is available at no cost from the National Renewable Energy Laboratory (NREL) at www.nrel.gov/publications. Contract No. DE-AC36-08GO28308 Novel Electrolyzer Applications: Providing More Than Just Hydrogen J. Eichman, K. Harrison, and M. Peters National Renewable Energy Laboratory Technical Report NREL/TP-5400-61758 September 2014
Transcript
NREL is a national laboratory of the U.S. Department of Energy Office of Energy Efficiency & Renewable Energy Operated by the Alliance for Sustainable Energy, LLC This report is available at no cost from the National Renewable Energy Laboratory (NREL) at www.nrel.gov/publications.
Contract No. DE-AC36-08GO28308
Novel Electrolyzer Applications: Providing More Than Just Hydrogen J. Eichman, K. Harrison, and M. Peters National Renewable Energy Laboratory
Technical Report NREL/TP-5400-61758 September 2014
NREL is a national laboratory of the U.S. Department of Energy Office of Energy Efficiency & Renewable Energy Operated by the Alliance for Sustainable Energy, LLC This report is available at no cost from the National Renewable Energy Laboratory (NREL) at www.nrel.gov/publications.
Contract No. DE-AC36-08GO28308
National Renewable Energy Laboratory 15013 Denver West Parkway Golden, CO 80401 303-275-3000 • www.nrel.gov
Novel Electrolyzer Applications: Providing More Than Just Hydrogen J. Eichman, K. Harrison, and M. Peters National Renewable Energy Laboratory
Prepared under Task No. HT12.2A10
Technical Report NREL/TP-5400-61758 September 2014
NOTICE
This report was prepared as an account of work sponsored by an agency of the United States government. Neither the United States government nor any agency thereof, nor any of their employees, makes any warranty, express or implied, or assumes any legal liability or responsibility for the accuracy, completeness, or usefulness of any information, apparatus, product, or process disclosed, or represents that its use would not infringe privately owned rights. Reference herein to any specific commercial product, process, or service by trade name, trademark, manufacturer, or otherwise does not necessarily constitute or imply its endorsement, recommendation, or favoring by the United States government or any agency thereof. The views and opinions of authors expressed herein do not necessarily state or reflect those of the United States government or any agency thereof.
This report is available at no cost from the National Renewable Energy Laboratory (NREL) at www.nrel.gov/publications.
Available electronically at http://www.osti.gov/scitech
Available for a processing fee to U.S. Department of Energy and its contractors, in paper, from:
U.S. Department of Energy Office of Scientific and Technical Information P.O. Box 62 Oak Ridge, TN 37831-0062 phone: 865.576.8401 fax: 865.576.5728 email: mailto:[email protected]
Available for sale to the public, in paper, from:
U.S. Department of Commerce National Technical Information Service 5285 Port Royal Road Springfield, VA 22161 phone: 800.553.6847 fax: 703.605.6900 email: [email protected] online ordering: http://www.ntis.gov/help/ordermethods.aspx
Cover Photos: (left to right) photo by Pat Corkery, NREL 16416, photo from SunEdison, NREL 17423, photo by Pat Corkery, NREL 16560, photo by Dennis Schroeder, NREL 17613, photo by Dean Armstrong, NREL 17436, photo by Pat Corkery, NREL 17721.
NREL prints on paper that contains recycled content.
This report is available at no cost from the National Renewable Energy Laboratory (NREL) at www.nrel.gov/publications.
Acknowledgments Funding for this report came from the U.S. Department of Energy’s Fuel Cell Technologies Office in the Office of Energy Efficiency and Renewable Energy. This paper is an activity within Monterey Gardiner’s effort on hydrogen for energy storage, which is focused on the valuation of multiple energy vectors and identification of research and development gaps required to accelerate commercialization of fuel cell technologies for energy storage. The authors would like to acknowledge the contributions from Dan Rastler (EPRI) and Kathy Ayers (Proton Onsite) for reviewing this work.
iv
This report is available at no cost from the National Renewable Energy Laboratory (NREL) at www.nrel.gov/publications.
List of Abbreviations and Acronyms AC alternating current
DC direct current
FERC Federal Energy Regulatory Commission
GHG greenhouse gas
ISO-NE Independent System Operator New England
kW kilowatt
MW megawatt
NREL National Renewable Energy Laboratory
NYISO New York Independent System Operator
PEM proton exchange membrane
RTP real-time pricing
SOEC solid oxide electrolyzer
T&D transmission and distribution
TOU time-of-use
v
This report is available at no cost from the National Renewable Energy Laboratory (NREL) at www.nrel.gov/publications.
Executive Summary Despite the fact that many electrolyzer projects have been installed, there is little operational data available to quantify their response and flexibility. Electrolyzers electrochemically separate water into hydrogen and oxygen using electricity as the feedstock. This work explores the operational flexibility of electrolyzers by performing experimental tests on a proton exchange membrane (PEM) and an alkaline electrolyzer. Many applications value flexibility, particularly with the addition of increased intermittent renewables and new regulations for both stationary and transportation emissions. Test results are compared to the operational requirements for participation in end-user facility energy management, transmission and distribution system support, and wholesale electricity market services.
The hydrogen produced from electrolyzers can be used for many different applications and can be integrated into different system architectures. The applications include hydrogen for vehicle fueling, industrial processes, power generation, and injection into the natural gas pipeline. Hydrogen can also be methanized and used for similar applications. Hydrogen production and storage can be combined with power generation equipment including fuel cells, reciprocating engines, combustion turbines, and steam turbines, resulting in a storage device with the ability to time shift delivery of electricity for electric grid applications. In this way, hydrogen can be used to support increased intermittent renewable generation.
For the applications considered the following factors are important: (1) the time it takes to respond to a change in power set-point, (2) the time it takes to settle after a power set-point change, (3) the rate at which the device can change power consumption, (4) the lower operation limit or the minimum turndown level, and (5) the time it takes to start up and shut down. The findings are as follows:
• Small electrolyzer systems (~40 kW units) begin changing their electricity demand within milliseconds of a set-point change.
• The settling time after a set-point change is on the order of seconds.
• Electrolyzers can reduce their electrical consumption for an unlimited amount of time.
• Electrolyzers can start up and shut down in several minutes.
In addition, a frequency disturbance correction test was performed to test the ability of an electrolyzer to accelerate the speed at which the grid frequency can be restored. For this test, an isolated grid consisting of a diesel generator, load bank, and electrolyzer was perturbed by changing the load bank’s set-point. The time that it takes to restore the frequency was examined for both the case with and without the support of the electrolyzer. In all cases, adjusting the electricity demand for the electrolyzer corresponding to the load bank’s change, the system was able to restore the frequency faster with the support of the electrolyzer than without.
When comparing the performance metrics for electrolyzers with the requirements for supporting end-user energy management, transmission and distribution system support, and wholesale electricity markets, the following conclusions are made:
vi
This report is available at no cost from the National Renewable Energy Laboratory (NREL) at www.nrel.gov/publications.
• Electrolyzers acting as demand response devices can respond sufficiently fast and for a long enough duration to participate in energy management on the utility scale and at end user facilities. Furthermore, electrolyzers can be operated to support a variety of applications while also providing hydrogen for industrial processes, transportation fuel, or heating fuel.
• Favorable operating properties and a variety of potential system architectures showcase the flexibility of electrolyzer systems. Electrolyzers can operate as a stand-alone device, participating in one or more of the applications presented while also providing a hydrogen product for sale or for integration into a storage system using a fuel cell, reciprocating engine, combustion turbine, steam turbine, or other power generation device. Electrolytic hydrogen can also be methanized, resulting in a renewable methane product.
Based on the findings, the authors recommend that electrolysis devices be considered in the planning and selection process for supporting end-user energy management, transmission and distribution system support, and wholesale electricity markets. Their operational flexibility and the variety of potential systems configurations in which they can be included make them an ideal candidate from a technical point of view. Future work should quantify the economic potential that electrolyzers can provide, the impact on electrolyzer lifetime resulting from dynamic operation, and system flexibility for megawatt-scale installations.
vii
This report is available at no cost from the National Renewable Energy Laboratory (NREL) at www.nrel.gov/publications.
Table of Contents List of Figures .......................................................................................................................................... viii List of Tables ............................................................................................................................................ viii 1 Introduction ........................................................................................................................................... 1 2 Background ........................................................................................................................................... 2
2.1 End-User Energy Management ........................................................................................................ 2 2.2 Transmission and Distribution Support ........................................................................................... 3 2.3 Wholesale Market Services .............................................................................................................. 3
3 Approach ............................................................................................................................................... 6 3.1 End-User Energy Management ........................................................................................................ 7 3.2 Transmission and Distribution (T&D) Support ............................................................................... 8 3.3 Wholesale Market Services .............................................................................................................. 8
4.1.1 Response Time and Ramp Rate ........................................................................................... 10 4.1.1.1 Initial Response Time ................................................................................................. 13 4.1.1.2 Settling Time or Total Response Time ....................................................................... 13 4.1.1.3 Ramp Rate .................................................................................................................. 14
4.1.2 Turndown ............................................................................................................................. 15 4.1.3 Startup and Shutdown .......................................................................................................... 15
4.2 Comparison to Application Requirements ..................................................................................... 16 4.2.1 End-User Energy Management ............................................................................................ 16 4.2.2 Transmission and Distribution Support ............................................................................... 16 4.2.3 Wholesale Market Services .................................................................................................. 17
4.2.3.1 Regulation .................................................................................................................. 17 4.2.3.2 Load-Following and Fast Energy Markets ................................................................. 19 4.2.3.3 Operating Reserves .................................................................................................... 19 4.2.3.4 Summary .................................................................................................................... 19
This report is available at no cost from the National Renewable Energy Laboratory (NREL) at www.nrel.gov/publications.
List of Figures Figure 1. Ramp-up tests for PEM electrolyzer ....................................................................................... 11 Figure 2. Ramp-up tests for alkaline electrolyzer .................................................................................. 11 Figure 3. Ramp-down tests for PEM electrolyzer .................................................................................. 12 Figure 4. Ramp-down tests for alkaline electrolyzer ............................................................................. 12 Figure 5. Initial response time comparison ............................................................................................ 13 Figure 6. Ramp completion at 0.2 seconds ............................................................................................ 14 Figure 7. Maximum ramping experienced .............................................................................................. 14 Figure 8. Electrolyzer variable operation ................................................................................................ 15 Figure 9. Load increase frequency support for alkaline and PEM electrolyzers ................................ 18 Figure 10. Load shed frequency support for alkaline and PEM electrolyzers .................................... 18 Figure 11. Summary of electrolyzer flexibility compared to electricity market requirements .......... 20
List of Tables Table 1. Electrolyzer Parameters [17] ..................................................................................................... 10 Table 2. Summary of Response Time and Duration for Each Application .......................................... 22
1
This report is available at no cost from the National Renewable Energy Laboratory (NREL) at www.nrel.gov/publications.
1 Introduction U.S. legislation such as the Clean Air Act and the Energy Policy Act demonstrates the ever-growing interest to increase energy independence. These, and many other pieces of state and federal legislation, focus on reducing energy consumption, greenhouse gas (GHG) emissions, and criteria pollutant emissions. California’s Assembly Bill 32, for example, mandates the reduction of GHG to 1990 levels by 2020. Achieving these goals will require changes to many of the contributing sectors, including the electric and transportation sectors. From the electric sector, renewable generation presents an opportunity to reduce emissions while also improving energy independence and security. Renewable portfolio standards are being used as a mechanism to increase the amount of renewable generation; however, increasing intermittent renewables presents challenges for operation and reliability of the grid.
Hydrogen has many uses within the transportation and industrial sectors, such as ammonia production, petroleum refining, and food hydrogenation. For the transportation sector, similar benefits with respect to emissions and energy independence and security can be realized by increasing the efficiency of vehicles and converting to a non-carbon fuel like hydrogen or a carbon neutral biofuel. Various initiatives including California’s Alternative Renewable Fuel and Vehicle Technology Program (ARFVTP) pursue alternative and renewable fuel technologies for vehicles in an effort to reduce emissions and improve air quality. In addition, California Assembly Bill 1505 describes the importance of hydrogen fuel for enabling energy independence and reducing GHG emissions and establishes a requirement that 33% of the hydrogen produced or dispensed by fueling stations that receive state funds must be from eligible renewable resources.
For greater implementation of hydrogen production from electrolysis, it is important that electrolyzers be cost competitive in addition to providing societal benefits. This work explores the ability of electrolyzers to support the electric, transportation, and even industrial sectors in new and unique ways that have the potential to reduce the cost of hydrogen and increase the revenue to the system. Electrolyzers can support the electric sector by modulating their electricity consumption profile, effectively acting as responsive industrial loads. This responsive behavior can provide value to the owner and the system while simultaneously providing hydrogen for use in vehicles, industrial processes, or injection into the natural gas pipeline.
2
This report is available at no cost from the National Renewable Energy Laboratory (NREL) at www.nrel.gov/publications.
2 Background Electrolyzers leverage well-developed technology that uses electricity to separate water into hydrogen and oxygen [1, 2]. The major types of electrolyzers being produced and developed include proton exchange membrane (PEM), alkaline with liquid electrolyte, alkaline with solid electrolyte, and solid oxide electrolyzer (SOEC). Alkaline and PEM cells are currently being manufactured in small sizes (several kilowatts) up to large, utility-scale systems (multi-megawatt) [3]. While less mature than liquid alkaline and PEM devices, SOEC and solid electrolyte alkaline promise higher performance [4].
Hydrogen is currently used for a wide variety of applications. These applications include hydrocracking of petroleum, hydrodesulfurization to remove sulfur, hydrogenation of oils, production of ammonia for fertilizers, superconductivity, cryogenics, and power generation in a stationary or mobile fuel cell or combustion device. Additionally, hydrogen can be injected into the natural gas system as a form of energy storage. Two techniques currently being pursued are (1) direct injection of hydrogen into the natural gas pipeline or (2) methanization of hydrogen and injection of synthetic and potentially renewable natural gas.
There is also potential to use electrolyzers in tandem with fuel cells, which generate electricity electrochemically by reacting a fuel (typically hydrogen) and an oxidant (typically oxygen) to create a hydrogen energy storage device. A similar analysis to the one presented here can be performed for the fuel cell and is the topic of future work.
Electrolyzers, in addition to making hydrogen, can contribute to a variety of electrical sector applications including end-user energy management, transmission and distribution (T&D) system support, integration of renewables, and wholesale electric market services. These applications are examined in more detail below.
There are very few items in the literature on the operational flexibility of electrolyzer systems. Applications for electrolyzers have the potential to provide value to a number of associated parties including facility owners, T&D system operators, or load-serving entities. Additionally, increasing the renewables on the grid is likely to increase the challenges with managing the grid and the flexibility requirements. Thus, the value for responsive loads is likely to increase as more intermittent renewables come online. The research presented here seeks to quantify the ability of electrolyzers to operate in a variety of applications including end-use energy management, T&D support, and wholesale market services.
2.1 End-User Energy Management The price that utility customers pay for electricity varies depending on the rate structure to which they subscribe. These structures typically include charges for T&D of electricity, basic use charges, and electricity generation charges, but the type and price for each item can vary substantially across the world. T&D charges account for the cost of local and regional lines, transformers, substations, and other equipment to support. The basic use charge includes the cost of billing and meter reading, maintenance, and replacement. Generation charges are often separated into an energy charge for the amount of energy consumed and a capacity or demand charge based on the highest average consumption for any interval during a day, month, or year (typically a15-minute period) [5, 6, 7].
3
This report is available at no cost from the National Renewable Energy Laboratory (NREL) at www.nrel.gov/publications.
An electrolyzer placed at an end-user facility, while increasing the amount of electricity consumed, can potentially reduce the average cost of electricity in several ways. For customers who are participating in time-of-use (TOU) or real-time pricing (RTP) rate structures, the price of electricity varies depending on the time of day, day of the week, and season. Use of electrolyzers will necessarily increase energy consumption but the time of consumption is adjustable. This allows electrolyzers to purchase electricity to produce hydrogen during times of low demand and reduce production during times of high demand. Customers who experience large demand spikes from equipment startup or intermittent operation resulting in demand charges can rapidly modulate the electricity consumption of an electrolyzer to offset the increase in demand.
The end user must establish a need or a sink for produced hydrogen. On-site hydrogen can be used directly for vehicle refueling, power generation, or an industrial process, as well as sold to another customer with a hydrogen demand. Near-term end users include industrial complexes, university campuses, combined heat and power facilities, commercial buildings, and off-grid facilities. These facilities have sufficient demand and infrastructure to warrant rate structures that include demand charges. Considering potential end users, this work will establish the flexibility of electrolyzers to reduce their electrical consumption to compensate for the demand spikes and take advantage of TOU, RTP, and other rate structures.
2.2 Transmission and Distribution Support The Federal Energy Regulatory Commission (FERC) recognizes that, to some extent, generation, transmission, and demand response are substitutes for each other. Demand response has the ability to reduce or defer the need for new T&D system expansions [8] and according to FERC Order 1000 and Order 890, public utility transmission providers must consider demand response and energy efficiency on a comparable basis for transmission planning, preventing undue discrimination [9]. While installing a demand response device will increase the demand, a device that is flexible has the ability to change its output and, depending on the location, this change can impact transmission or distribution bottlenecks. Additionally, there are opportunities to use the power electronics associated with converting the alternating current (AC) from the grid and converting it to direct current (DC) for use by the electrolyzer. In the process, rectifiers and other power electronics have the potential to provide several benefits, including power quality (voltage swell and sag, harmonics, and momentary outages) and power factor correction; however, the tests that were performed for this work cannot assess the ability of electrolyzers to provide these distribution services and will be the topic of future work.
2.3 Wholesale Market Services The grid must balance generation with demand nearly instantaneously and provide additional capacity to maintain system reliability. Energy and ancillary service markets have been established to procure the necessary resources. The ancillary service markets explored for this work include load following, regulation, spinning reserve, non-spinning reserve, and other reserves (i.e., replacement or supplemental). Load-following reconciles energy mismatches and is often separated into load-following up (increasing generation or reducing demand) and load-following down (reducing generation or increasing demand). Regulation provides real-time adjustments to maintain the desired frequency and, like load-following is often separated into both up and down products. Spinning and non-spinning reserve are additional capacity that is
4
This report is available at no cost from the National Renewable Energy Laboratory (NREL) at www.nrel.gov/publications.
available to come online in the event of a generator failure or other contingency. Other reserves have different names depending on the system operator administering the market. Historically, generators bid into the markets and provide the necessary resources; however, system operators are adapting to include the use of demand-side management tools. The set-point of equipment including air conditioners, lighting, fans, pumps, and electrolyzers can be modulated to provide support to the grid. Different demand response programs allow those resources to participate in different markets. For example, demand response devices have value on the regional planning level, and can participate in the direct load control program, which would allow these resources to provide reserves. It is possible for electrolyzers (depending on their flexibility) to participate in a number of different markets. For example, if an electrolyzer is operating at 80% capacity then in addition to the hydrogen produced, 80% (less the minimum operating point) of the capacity could be used for providing regulation up, load-following up, spinning or non-spinning reserve and 20% of the capacity could provide regulation down and load-following down.
The value of energy and ancillary service markets varies based on the specific resource considered and the current market conditions. Additionally, each service has a different required response time and duration. Estimates for the price range, response speed, duration, and cycle time are presented in a 2006 report by Kirby and a 2010 report by Denholm, et al. [10, 11]. The ability of electrolyzers to respond quickly and for a sufficiently long time will determine into which markets they can bid. For the markets considered in this work, regulation has the shortest response speed at around 1 minute, while reserves have the longest required duration at several hours. A few papers have been published that explore the flexibility of hydrogen storage systems using fuel cells and electrolyzers [12, 13]. These papers support the idea that a hydrogen fuel cell and electrolyzer can be used to mitigate frequency variations, and as a result, should be able to bid into the regulation market. However, the models presented did not include system dynamics but rather assumed that fuel cells operating on hydrogen and electrolyzers can respond sufficiently fast. In 2011, an experiment was performed by Hydrogenics Corporation that successfully demonstrated the ability of their electrolyzer to follow a power regulation signal, thereby providing frequency regulation [14]. Therefore, it is possible for an electrolyzer to provide frequency support, but it is unclear from Hydrogenics’ work how fast an electrolyzer can respond. These questions are particularly important as the generation landscape continues to shift with increasing clean and renewable generation.
Increasing the amount of intermittent renewables on the grid will increase the occurrence of overgeneration and the need for operational flexibility. Additional flexibility will be needed to address faster ramp rates and longer duration ramps than were previously experienced [15, 16]. In order for electrolyzers to provide support for renewables they must be able to respond to the renewable signal and have sufficient response time that they can mitigate fluctuations. This concept has been tested previously at the National Wind Technology Center operated by the National Renewable Energy Laboratory (NREL) and at a site in North Dakota. In March 2009, NREL released a report detailing the Wind-to-Hydrogen Project. This project integrates renewable wind and solar generation with two electrolyzers to generate hydrogen for use in hydrogen vehicles. The findings show that electrolyzers can be responsive in support of renewables and explore novel configurations to increase system efficiency when connecting these resources [17]. Also, in a 2009 report titled “Wind-to-Hydrogen Energy Pilot Project,” researchers from the Basin Electric Power Cooperative and the University of North Dakota explored the ability of electrolyzers to mitigate wind intermittency and transmission capacity
5
This report is available at no cost from the National Renewable Energy Laboratory (NREL) at www.nrel.gov/publications.
limitations while providing hydrogen for two trucks and a tractor converted to operate on hydrogen. For this study, several electrolyzer ramp-rate tests were performed and it was found that the system responds to load changes in 3–7 seconds with an available ramp rate between 37.5 and 37.7 liters/hour/amp, which corresponds to nearly 4% of rated power per minute. The recommended minimum load point was 43% of rated power, as recommended by the manufacturer [18]. The work presented here will leverage the findings from the North Dakota study and directly use the data and results from the NREL study to better understand the ability of electrolyzers to support the integration of renewables.
Several studies have analyzed the concept of using electrolyzers both with and without fuel cells to smooth renewable generation, provide grid services, and benefit from the price difference in on-peak and off-peak electricity [19, 20, 21, 22, 23]. These studies establish that there are opportunities for electrolyzers to lower the cost of hydrogen production using electrolysis by making use of multiple markets and otherwise curtailed renewable energy under the assumption that they can respond fast enough. The next step for analyzing renewable integration concepts with electrolyzers is to include more detailed electrolyzer performance characteristics, which are outlined in this paper.
The use of dispatchable loads like an electrolyzer to increase the system flexibility represents a key opportunity to address the challenges with intermittent renewables. Many of the grid system operators and transmission organizations have adopted or are exploring the different techniques for integrating the use of dispatchable loads into their portfolio [9]. FERC has issued several orders that support the growing role of demand response, one of which is FERC Order 745. Additionally, FERC has established several orders in an effort to appropriately value resources that are flexible (i.e., can ramp fast and provide capacity for an extended period of time) including Order 755 and Order 784. The use of dispatchable technologies to provide support represents an opportunity for the grid to procure some capacity for operation and for the equipment owner to increase revenue and enhance economic competitiveness.
6
This report is available at no cost from the National Renewable Energy Laboratory (NREL) at www.nrel.gov/publications.
3 Approach In order to establish the ability of an electrolyzer to support different applications, first the requirements for each application described qualitatively in the previous section must be established on a quantitative basis. Then, the flexibility of the electrolyzer is established from experimental data. Finally, the application requirements are compared to the electrolyzer flexibility and conclusions are drawn.
Typical electrolyzer operation entails constant operation at a given power set-point and minimization of the number of starts that the equipment experiences. There can be fluctuations in weekly and seasonal hydrogen demand so storage and supply-side flexibility are used to buffer the fluctuations. The applications explored here are different than constant operation and often require more variable operation. Each application has the potential to add additional value beyond the baseload production of hydrogen, and achieving this increase in value results in different operating requirements for electrolyzers. Like other demand response devices, providing a demand reduction often comes with some costs. For example, a commercial building that wishes to provide demand response with its lighting must weigh the value of the light for their tenants versus the value of the payment for providing the demand reduction service. Similarly for electrolyzers, providing demand reductions comes at the expense of making hydrogen. If the electrolyzer and hydrogen storage are sized appropriately it is possible for the system to provide hydrogen to meet the customer demand without perturbation while also supporting the grid. Every application has different requirements, including:
• Initial response time: The time it takes to begin changing load, following a set-point change.
• Ramp rate: The speed at which the amount of electricity consumption can change.
• Energy capacity: The amount of hydrogen that can be stored for use in meeting the hydrogen demand. Under baseload operation the energy capacity is less important because the hydrogen production is predictable; however, with new operating schemes the energy capacity must be considered in greater detail.
• Power capacity: The total rated power for the device. The size ranges from kilowatts to megawatts and is important for establishing the amount of response that is available during any given instant.
• Minimum turndown: The lowest operating point, after which the device must turn off. A higher minimum turndown reduces the amount of power capacity that can be used for each application.
• Startup time: The time that it takes to start the device. For the purpose of this paper, startup times are separated into two classes, cold start and warm start. As their names suggest, a cold start represents a start with the unit having been off for sufficient time to lose benefit from energy stored in the electrolyzer (e.g., thermal energy for lubricants and coolants). The warm start represents a start with the unit having been off or in standby for a short time such that it can benefit from energy stored in the electrolyzer.
• Shutdown time: The amount of time that it takes to drop load.
7
This report is available at no cost from the National Renewable Energy Laboratory (NREL) at www.nrel.gov/publications.
Many of these properties have a time-dependent component and can be heavily influenced by the balance-of-plant and controls strategies employed for the equipment. For example, the speed at which an electrolyzer can increase its load varies if the device is operating at 50% output or at 90% output.
Hydrogen demand is different depending on the use for the hydrogen, but the inclusion of hydrogen storage can greatly mitigate the challenges with hydrogen supply because it can be stored for use at a later time. Electrolysis plants—central or distributed—have some storage capability to balance the production with the consumption. While the energy capacity of the hydrogen storage may have to increase to accommodate some of the applications considered, tank sizes are scalable and there are a variety of storage techniques, including above ground gaseous or liquid storage and underground storage of gaseous hydrogen. In addition, some hydrogen supply systems already include storage requirements due to variability in demand, which may reduce the marginal increase in storage resulting from these applications. The following section examines the requirements for each application and how electrolyzers must perform to enhance operational flexibility or improve economic competitiveness.
3.1 End-User Energy Management Electrolyzers can be used to support end-user energy management for facilities that have a need or a sink for hydrogen by (1) reducing the demand charge by rapidly turning down during demand spikes resulting from inrush current and/or startup procedures when switching on a piece of equipment or from other times of high demand and (2) allowing a facility to capitalize on TOU, RTP, and other rate structures to purchase electricity during times of low electricity costs without disturbing the required demand for hydrogen.
Increased power consumption during startup can increase the electricity demand resulting in a higher demand charge. While the startup time for the equipment and inrush current can be on the order of milliseconds, the utility typically calculates the average demand over an interval of 15 minutes. Thus, as long as an electrolyzer can adjust its electricity demand in enough time to affect a 15-minute average, it is possible for the facility to offset a demand spike with a demand reduction using an electrolyzer.
Calculation of demand charges and system diagnostics rely on sub-hourly intervals; however, revenue from energy charges are assessed using a lower resolution. Historically, electricity has been sold based on the total usage over a given time period, typically monthly. With the development of new rate structures and metering infrastructure there is now the ability to select different prices for each interval (hourly or even less). These prices can be based on a variety of factors including demand or ambient temperature. If electrolyzers can change their operation during a given interval then it is possible for electrolyzers to capitalize on differences in the price of electricity, assuming that the hydrogen demand is met.
Other end-use challenges include voltage swell and sag, voltage flicker, and unbalanced three-phase load. These issues are most often addressed using other, typically lower cost, alternatives, but using an electrolyzer to mitigate these issues represents an opportunity to reduce the total cost of an electrolysis system by not having to purchase additional equipment to support power quality. However, determining whether electrolyzers can provide support for these services is not
8
This report is available at no cost from the National Renewable Energy Laboratory (NREL) at www.nrel.gov/publications.
a question that can be answered by the tests performed for this work. Additional tests should be performed to determine the ability of an electrolyzer to mitigate power quality issues.
3.2 Transmission and Distribution (T&D) Support T&D support, as mentioned before, has two components: one for electrical equipment reduction or deferral and one for system stability and power quality. The tests performed for this work were not designed to assess the potential to provide distribution services or power quality. As a result, the focus will be on T&D deferral. Demand response devices can reduce their load during times of high demand. If a particular transmission line is nearing capacity it is possible to call on demand response devices located on that circuit to reduce their load. It is possible that this reduction can allow the transmission planner to delay the installation of a new line or the upgrade of an existing line. Transmission planning typically occurs on the yearly timeframe and ensures that sufficient transmission line capacity is available to meet the peak load. To support T&D deferral devices must be able to respond on the order of minutes to hours for a duration of hours [11].
3.3 Wholesale Market Services In addition to an understanding of the considerations for renewable integration, types of markets, and previous work for electrolyzer grid integration, a quantitative measure is necessary to understand the requirements for a device to participate in wholesale electricity markets. The ability of electrolyzers to participate in the wholesale electricity market is contingent on the electrolyzer operating characteristics in comparison to the required response time, duration, and cycle time of each market. As noted in Kirby 2006, regulation requires the fastest response time, on the minute timescale, and must be maintained for 15 minutes at a time [10]. Slightly slower than regulation are the load-following and fast-energy markets, which require roughly a 10-minute response time and must be maintained for 10 minutes to several hours. Operating reserves consist of spinning, non-spinning, and replacement or supplemental reserve. Spinning reserve must increase immediately and respond to full power within 10 minutes and must have the ability to be maintained for up to 2 hours. Non-spinning reserve must respond to full power within 10 minutes and be able to maintain that output for up to 2 hours, but it does not need to start immediately. Lastly, the replacement or supplemental reserve must respond in less than 30–60 minutes (depending on the region considered) and must be able to maintain generation for 2 hours.
Additionally there are restrictions on the minimum power capacity allowed for bidding into the market. The system operator for each region decides the limitations for that region. The minimum size can be as low as a unit that can sustain a 100 kW load reduction, as in the case of New York Independent System Operator’s (NYISO) curtailment program [24], and a unit with a capacity as large as 50 MW for E.ON (European investor-owned utility) and 30 MW for Energie Baden-Württemberg AG, Rheinisch-Westfälisches Elektrizitätswerk AG, and VET (European control area) for minute-reserve power in Germany as of 2006 [25]. There are also a variety of values between 100 kW and 50 MW, including NYISO, PJM (an eastern interconnection regional transmission operator), California Independent System Operator (at 1 MW) [26, 27], Independent System Operator New England, and the primary and secondary control markets in Germany (at 10 MW) [25, 27]. The minimum bid values have decreased over the years to make way for smaller devices. In addition, for demand response and some energy storage devices, the
9
This report is available at no cost from the National Renewable Energy Laboratory (NREL) at www.nrel.gov/publications.
capacity can represent an aggregation of different sources as long as the aggregated value is above the minimum bid level. As will be shown in this paper, responsive loads, particularly electrolyzers that can respond sufficiently fast and for the prescribed duration, have the potential to support multiple electricity markets, including reliability and energy markets.
10
This report is available at no cost from the National Renewable Energy Laboratory (NREL) at www.nrel.gov/publications.
4 Results The goal of this work is to determine the operational flexibility of electrolyzers and their potential for supporting the grid, as well as end users. The results first present the testing that was performed and then compare the test results to the requirements for participating in each application, which was established in the previous section. Testing was performed as part of NREL’s Wind-to-Hydrogen Project and presented first at the U.S. Department of Energy’s 2012 Hydrogen and Fuel Cells Program Annual Merit Review [28]. The Wind-to-Hydrogen Project seeks to explore opportunities to convert renewable electricity into hydrogen for use in transportation, testing, and other end uses. The project integrates wind turbine and solar photovoltaic generation with load banks, electrolyzers, a hydrogen storage system, and a fuel cell, each of which can be connected to an AC or DC bus bar. This enables the seamless interchange of equipment on the system to explore various configurations. Additional information about the electrolyzers and tests performed can be found in NREL’s technical report titled, “The Wind-to-Hydrogen Project: Operational Experience, Performance Testing, and Systems Integration” [17].
Electrolyzers have been suggested as an option for flexible demand response devices and even energy storage devices when considering pipeline injection or with the use of a fuel cell to generate electricity; however, the literature lacks data to support the fact that electrolyzers are flexible devices capable of meeting the operational requirements for these configurations. Results from this work should enable interested parties to better assess the ability of electrolyzers to support a variety of different applications.
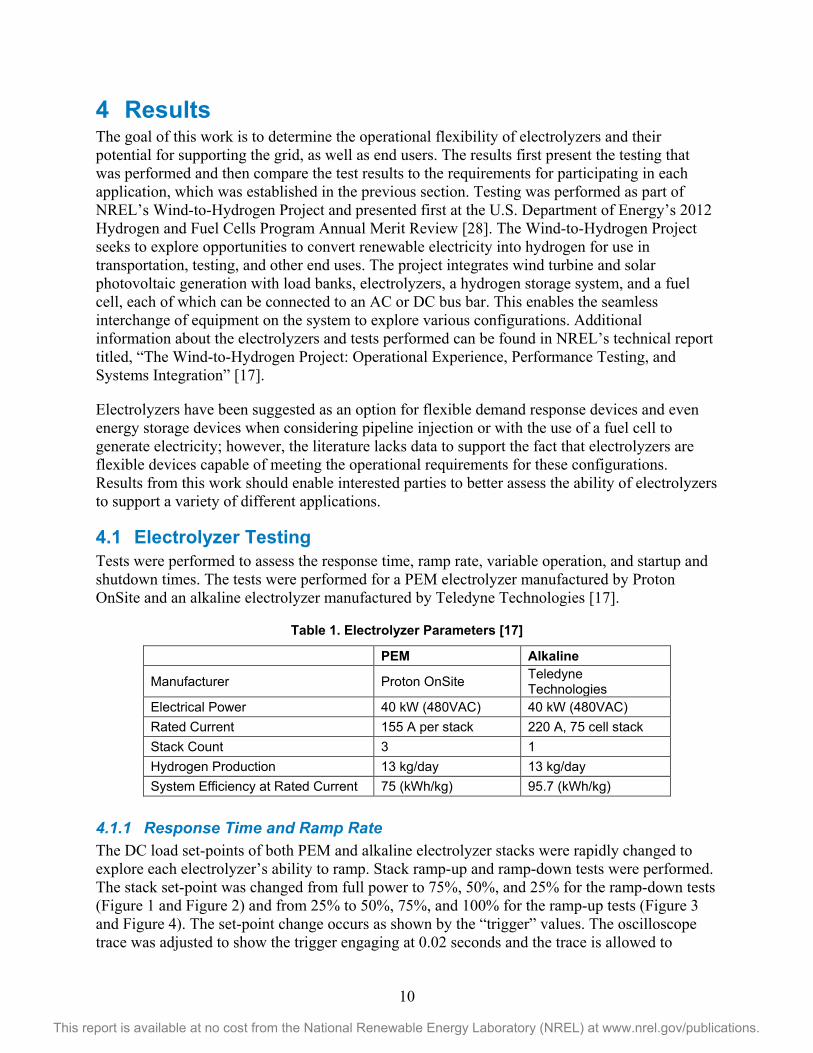
4.1 Electrolyzer Testing Tests were performed to assess the response time, ramp rate, variable operation, and startup and shutdown times. The tests were performed for a PEM electrolyzer manufactured by Proton OnSite and an alkaline electrolyzer manufactured by Teledyne Technologies [17].
Table 1. Electrolyzer Parameters [17]
PEM Alkaline
Manufacturer Proton OnSite Teledyne Technologies
Electrical Power 40 kW (480VAC) 40 kW (480VAC) Rated Current 155 A per stack 220 A, 75 cell stack Stack Count 3 1 Hydrogen Production 13 kg/day 13 kg/day System Efficiency at Rated Current 75 (kWh/kg) 95.7 (kWh/kg)
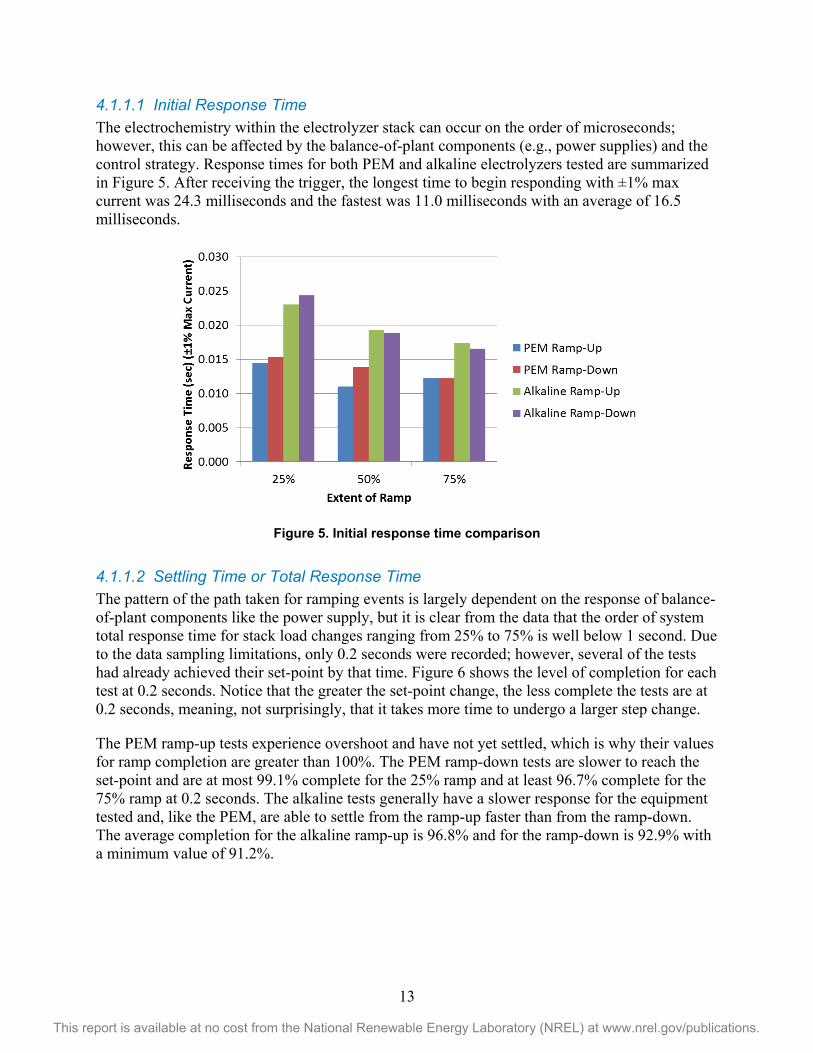
4.1.1 Response Time and Ramp Rate The DC load set-points of both PEM and alkaline electrolyzer stacks were rapidly changed to explore each electrolyzer’s ability to ramp. Stack ramp-up and ramp-down tests were performed. The stack set-point was changed from full power to 75%, 50%, and 25% for the ramp-down tests (Figure 1 and Figure 2) and from 25% to 50%, 75%, and 100% for the ramp-up tests (Figure 3 and Figure 4). The set-point change occurs as shown by the “trigger” values. The oscilloscope trace was adjusted to show the trigger engaging at 0.02 seconds and the trace is allowed to
11
This report is available at no cost from the National Renewable Energy Laboratory (NREL) at www.nrel.gov/publications.
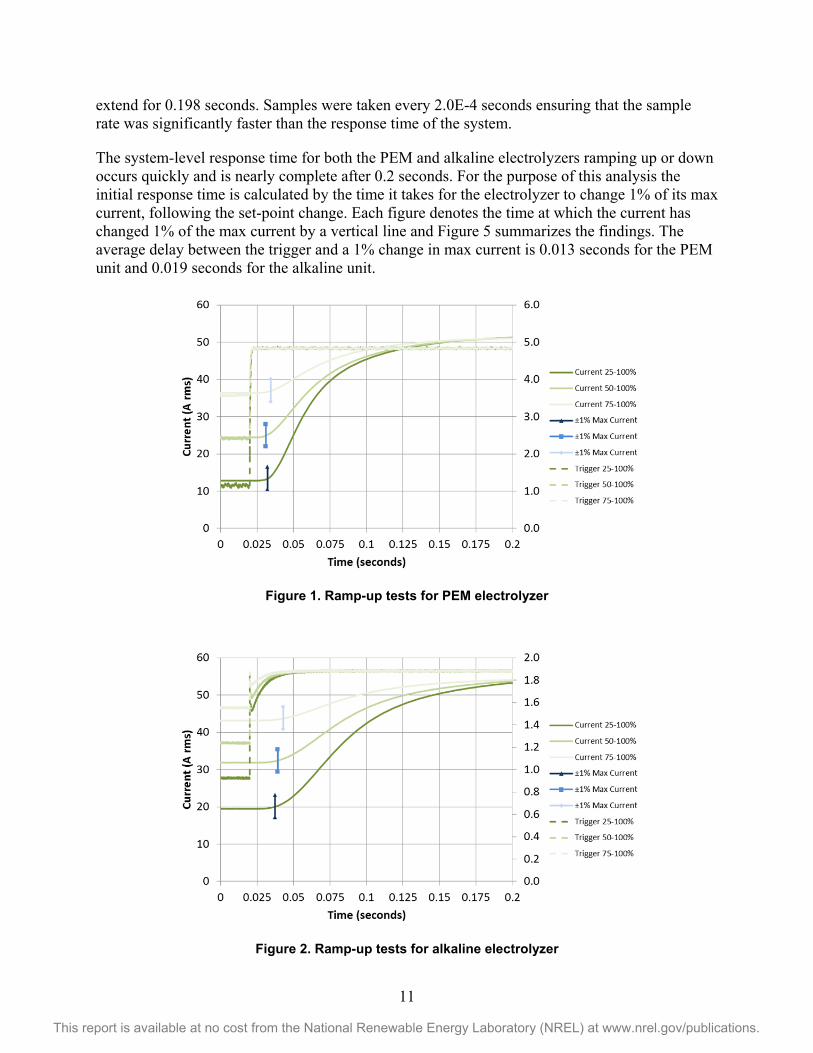
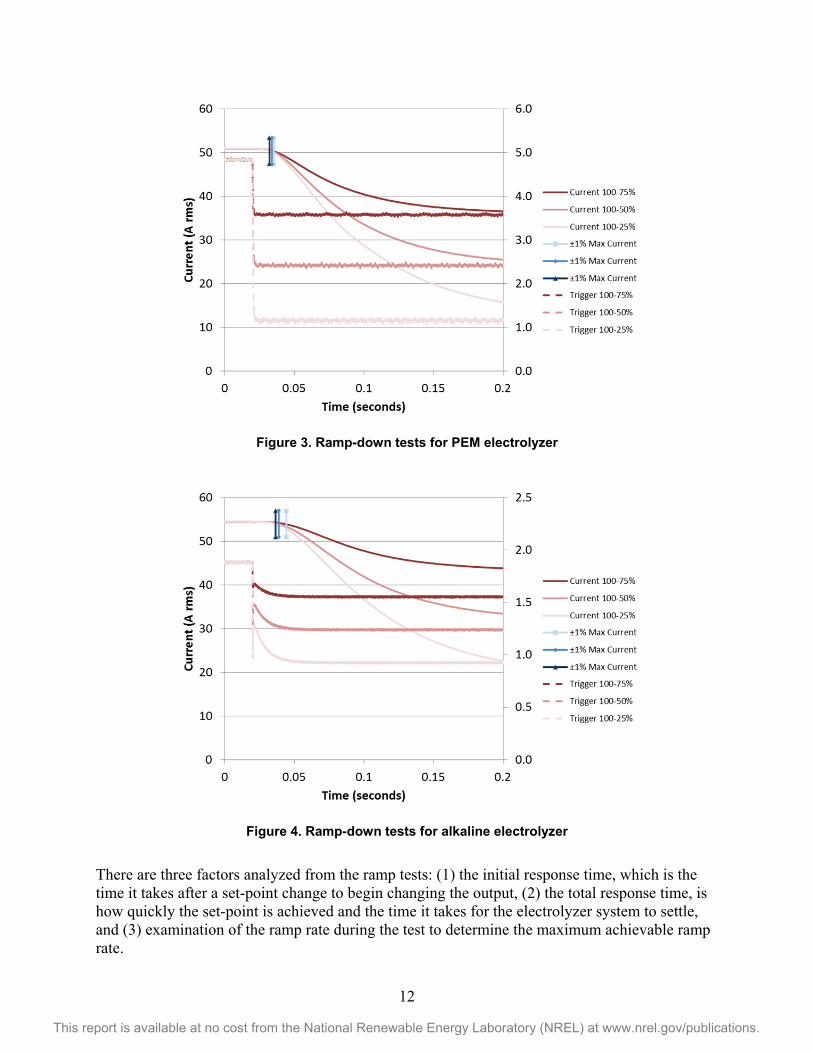
extend for 0.198 seconds. Samples were taken every 2.0E-4 seconds ensuring that the sample rate was significantly faster than the response time of the system.
The system-level response time for both the PEM and alkaline electrolyzers ramping up or down occurs quickly and is nearly complete after 0.2 seconds. For the purpose of this analysis the initial response time is calculated by the time it takes for the electrolyzer to change 1% of its max current, following the set-point change. Each figure denotes the time at which the current has changed 1% of the max current by a vertical line and Figure 5 summarizes the findings. The average delay between the trigger and a 1% change in max current is 0.013 seconds for the PEM unit and 0.019 seconds for the alkaline unit.
Figure 1. Ramp-up tests for PEM electrolyzer
Figure 2. Ramp-up tests for alkaline electrolyzer
12
This report is available at no cost from the National Renewable Energy Laboratory (NREL) at www.nrel.gov/publications.
Figure 3. Ramp-down tests for PEM electrolyzer
Figure 4. Ramp-down tests for alkaline electrolyzer
There are three factors analyzed from the ramp tests: (1) the initial response time, which is the time it takes after a set-point change to begin changing the output, (2) the total response time, is how quickly the set-point is achieved and the time it takes for the electrolyzer system to settle, and (3) examination of the ramp rate during the test to determine the maximum achievable ramp rate.
13
This report is available at no cost from the National Renewable Energy Laboratory (NREL) at www.nrel.gov/publications.
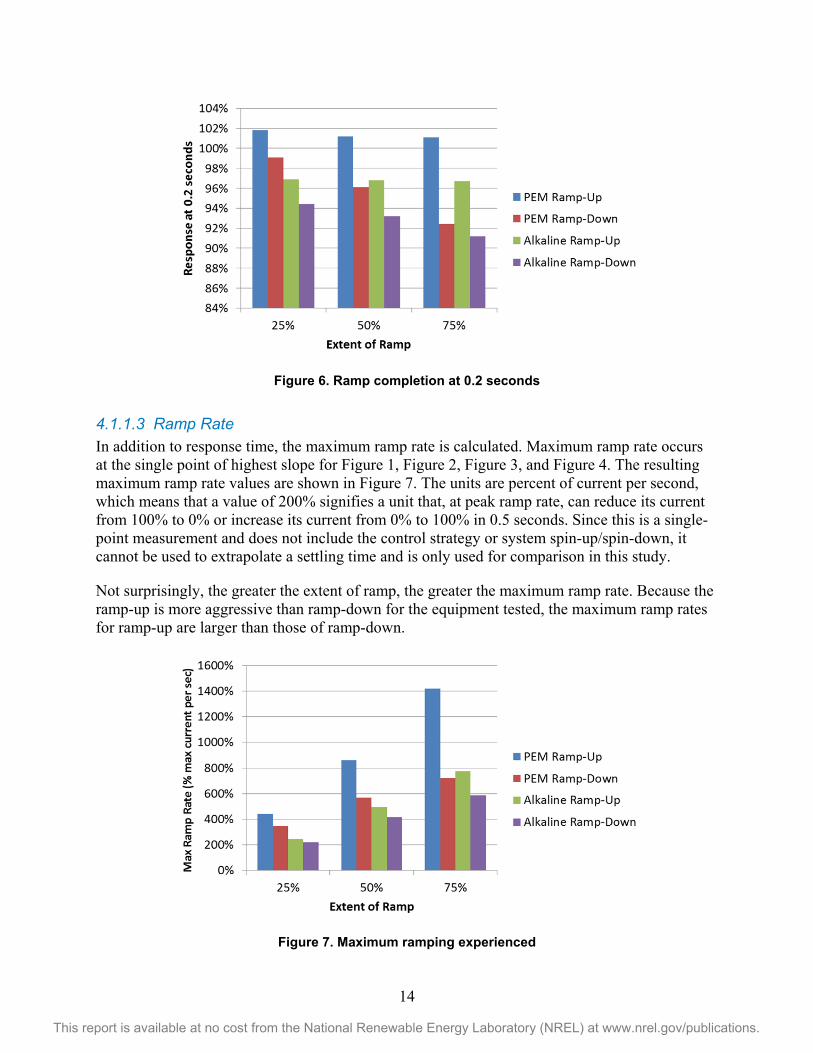
4.1.1.1 Initial Response Time The electrochemistry within the electrolyzer stack can occur on the order of microseconds; however, this can be affected by the balance-of-plant components (e.g., power supplies) and the control strategy. Response times for both PEM and alkaline electrolyzers tested are summarized in Figure 5. After receiving the trigger, the longest time to begin responding with ±1% max current was 24.3 milliseconds and the fastest was 11.0 milliseconds with an average of 16.5 milliseconds.
Figure 5. Initial response time comparison
4.1.1.2 Settling Time or Total Response Time The pattern of the path taken for ramping events is largely dependent on the response of balance- of-plant components like the power supply, but it is clear from the data that the order of system total response time for stack load changes ranging from 25% to 75% is well below 1 second. Due to the data sampling limitations, only 0.2 seconds were recorded; however, several of the tests had already achieved their set-point by that time. Figure 6 shows the level of completion for each test at 0.2 seconds. Notice that the greater the set-point change, the less complete the tests are at 0.2 seconds, meaning, not surprisingly, that it takes more time to undergo a larger step change.
The PEM ramp-up tests experience overshoot and have not yet settled, which is why their values for ramp completion are greater than 100%. The PEM ramp-down tests are slower to reach the set-point and are at most 99.1% complete for the 25% ramp and at least 96.7% complete for the 75% ramp at 0.2 seconds. The alkaline tests generally have a slower response for the equipment tested and, like the PEM, are able to settle from the ramp-up faster than from the ramp-down. The average completion for the alkaline ramp-up is 96.8% and for the ramp-down is 92.9% with a minimum value of 91.2%.
14
This report is available at no cost from the National Renewable Energy Laboratory (NREL) at www.nrel.gov/publications.
Figure 6. Ramp completion at 0.2 seconds
4.1.1.3 Ramp Rate In addition to response time, the maximum ramp rate is calculated. Maximum ramp rate occurs at the single point of highest slope for Figure 1, Figure 2, Figure 3, and Figure 4. The resulting maximum ramp rate values are shown in Figure 7. The units are percent of current per second, which means that a value of 200% signifies a unit that, at peak ramp rate, can reduce its current from 100% to 0% or increase its current from 0% to 100% in 0.5 seconds. Since this is a single-point measurement and does not include the control strategy or system spin-up/spin-down, it cannot be used to extrapolate a settling time and is only used for comparison in this study.
Not surprisingly, the greater the extent of ramp, the greater the maximum ramp rate. Because the ramp-up is more aggressive than ramp-down for the equipment tested, the maximum ramp rates for ramp-up are larger than those of ramp-down.
Figure 7. Maximum ramping experienced
15
This report is available at no cost from the National Renewable Energy Laboratory (NREL) at www.nrel.gov/publications.
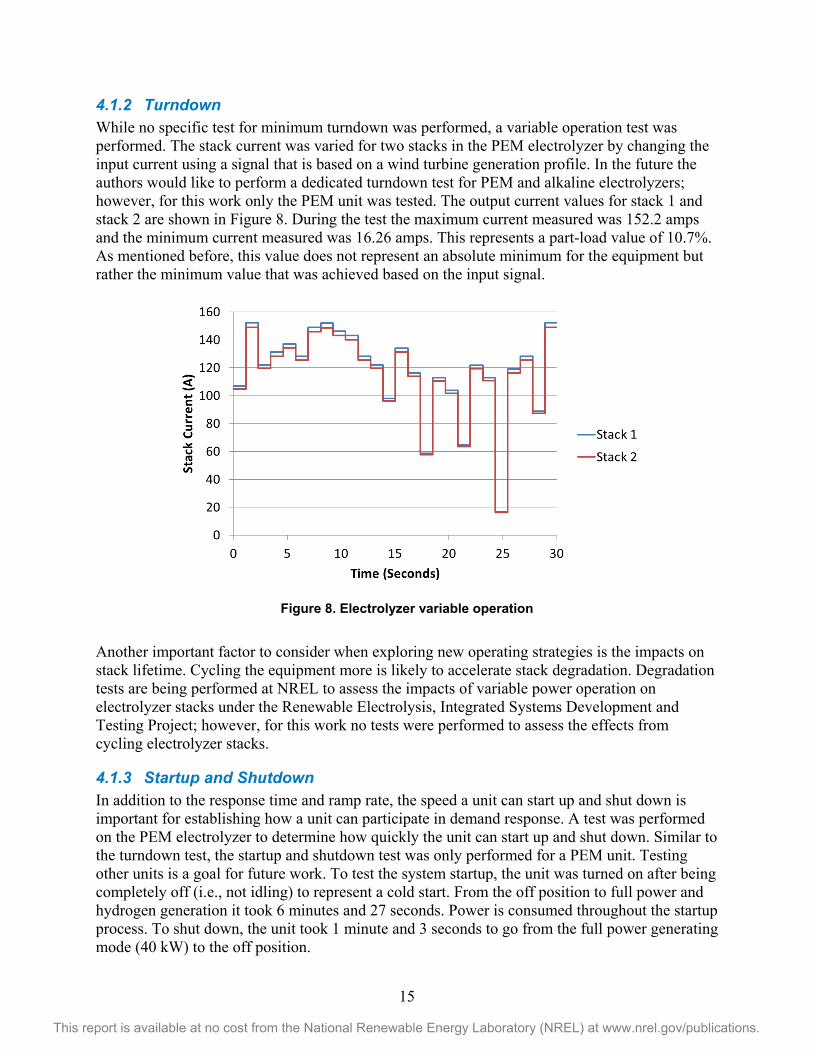
4.1.2 Turndown While no specific test for minimum turndown was performed, a variable operation test was performed. The stack current was varied for two stacks in the PEM electrolyzer by changing the input current using a signal that is based on a wind turbine generation profile. In the future the authors would like to perform a dedicated turndown test for PEM and alkaline electrolyzers; however, for this work only the PEM unit was tested. The output current values for stack 1 and stack 2 are shown in Figure 8. During the test the maximum current measured was 152.2 amps and the minimum current measured was 16.26 amps. This represents a part-load value of 10.7%. As mentioned before, this value does not represent an absolute minimum for the equipment but rather the minimum value that was achieved based on the input signal.
Figure 8. Electrolyzer variable operation
Another important factor to consider when exploring new operating strategies is the impacts on stack lifetime. Cycling the equipment more is likely to accelerate stack degradation. Degradation tests are being performed at NREL to assess the impacts of variable power operation on electrolyzer stacks under the Renewable Electrolysis, Integrated Systems Development and Testing Project; however, for this work no tests were performed to assess the effects from cycling electrolyzer stacks.
4.1.3 Startup and Shutdown In addition to the response time and ramp rate, the speed a unit can start up and shut down is important for establishing how a unit can participate in demand response. A test was performed on the PEM electrolyzer to determine how quickly the unit can start up and shut down. Similar to the turndown test, the startup and shutdown test was only performed for a PEM unit. Testing other units is a goal for future work. To test the system startup, the unit was turned on after being completely off (i.e., not idling) to represent a cold start. From the off position to full power and hydrogen generation it took 6 minutes and 27 seconds. Power is consumed throughout the startup process. To shut down, the unit took 1 minute and 3 seconds to go from the full power generating mode (40 kW) to the off position.
16
This report is available at no cost from the National Renewable Energy Laboratory (NREL) at www.nrel.gov/publications.
4.2 Comparison to Application Requirements In the previous sections, the requirements for a variety of potential applications for electrolyzers have been explored and tests were performed to determine the ability for electrolyzers to support those applications. Each of the application areas will be explored. The purpose of this study was to determine in which applications electrolyzers can participate. The electrolyzers tested for this study are relatively small, 40 kW-sized units (i.e., not large MW to 10s of MWs utility-scale units). Additional interactions may arise from larger units; however, as will be shown, electrolyzer systems can, in principle, participate in electricity markets while also providing hydrogen as a product because of their rapid response and ability to provide services for long durations.
4.2.1 End-User Energy Management In order to support the requirements for end-user energy management, electrolyzers must be able to change their load point rapidly and significantly to make a change in the 15-minute average electricity consumption. It was shown that electrolyzer systems can change their load point rapidly, on the order of milliseconds, and can shut down in just over a minute. Additionally, the load-point changes are significant. A 75% load shed or 75% load increase was presented, but does not represent the maximum load change possible since the minimum turndown is even greater.
As a result, it is possible for electrolyzers to provide significant dispatchability to change an end user’s demand profile and potentially reduce the demand charge. With TOU or RTP rate structures, dispatchability represents an opportunity to reduce the electricity charges by purchasing electricity at a time of low cost and reducing the production during times when electricity costs are high. Again, it should be noted that the end user must establish a need or sink for the produced hydrogen. It is important to also consider the electrolyzer and storage unit sizing to ensure that sufficient hydrogen is produced to meet the hydrogen demand; however, in principle it is possible for electrolyzers to participate in end-user energy management.
4.2.2 Transmission and Distribution Support There is growing precedent for demand response providing grid services as noted in yearly FERC Assessment of Demand Response & Advanced Metering Staff Reports dating back as far as 2006. With FERC Orders 1000 and 890, which remove barriers and undue discrimination against demand response devices and energy efficiency measures wishing to participate in transmission planning, it is clear that there is a strong interest in using demand response to support the T&D system. T&D deferral requires a response on the order of minutes to hours for a duration of hours [11]. This is similar to the requirements for end-user energy management. As noted from the tests performed, it is possible for electrolyzers to respond within minutes for a set-point change or a full shutdown. As with the end-user energy management, the duration is not a concern, assuming that there is sufficient hydrogen stored to satisfy the hydrogen customers. This rapid response allows for T&D planners to utilize electrolyzers located on congested lines to reduce transmission line congestion by lowering the electric demand from the electrolyzers. Responsive devices on a line can possibly delay or even remove the need for additional transmission lines if the devices have sufficient capacity to alleviate congestion.
17
This report is available at no cost from the National Renewable Energy Laboratory (NREL) at www.nrel.gov/publications.
4.2.3 Wholesale Market Services Providing market services represents an opportunity for the electrolyzer equipment to supplement the value from producing hydrogen and support the grid. Results from the electrolyzer testing will be compared to the requirements for the regulation markets, load-following and fast energy markets, and operating reserve markets.
4.2.3.1 Regulation Regulation markets require a response time on the order of minutes, which must be maintained for 30 minutes. The electrolyzer systems tested can respond much faster than a minute with response times on the order of hundredths of a second and can significantly change their load point in less than 1 second. This means that electrolyzers can respond quickly enough to participate in regulation markets. As for the energy capacity requirement of providing 30 minutes, providing any duration of load reduction is simple for a demand response device because the device needs only to reduce its demand. Also, with a very low part-load point (in the case of the PEM unit), electrolyzers can bid a significant portion of their demand toward regulation up. Similarly, with a low part-load and fast ramping capability, an electrolyzer could operate below its rated power point and also provide regulation down with the remaining capacity. In this way the electrolyzer system can modulate the amount of hydrogen that is being produced to support participation in arbitrage as well as ancillary service markets, all while producing hydrogen. Satisfying the hydrogen demand and also receiving additional revenue from electricity markets represents a different operating strategy than the traditional baseload operation. Plant operators will need to operate their equipment to satisfy hydrogen production requirements while also coordinating with the grid.
Many companies, particularly storage companies, recognize the value of providing regulation and are targeting the regulation market. When combined with a limited need for regulation services, this creates an environment where devices providing regulation must compete to provide the higher value services. Consequently, it is not sufficient that a device be able to provide regulation services but it must be able to provide those services at a low cost. Determining the wear and tear and resulting cost for an electrolyzer to provide regulation is outside the scope of this work but is an important consideration when deciding whether to pursue a device that can provide regulation or any other ancillary services.
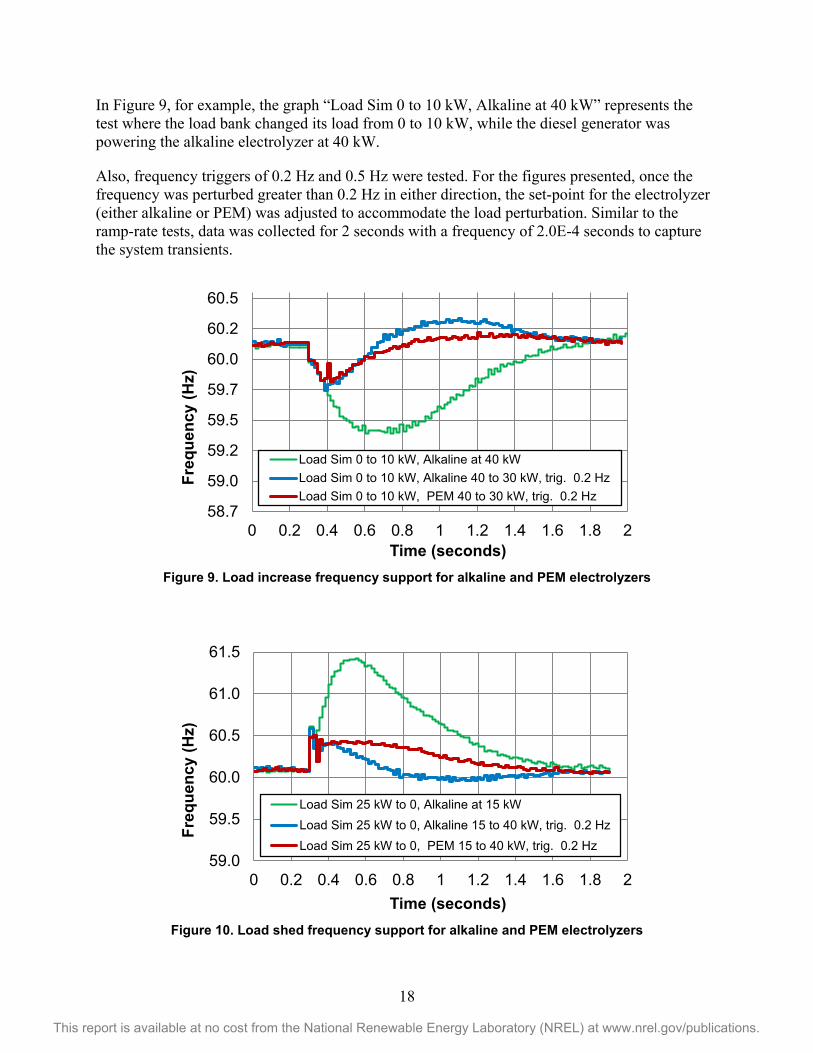
In addition to comparing the response to the minimum requirements a test was performed to assess the ability of electrolyzers to provide frequency disturbance correction (or frequency response). A microgrid was established consisting of a 120 kW diesel generator, a load simulator (i.e., resistive load bank), and the 40 kW PEM or alkaline electrolyzer [29]. The diesel generator provides the required electricity to power the electrolyzers. The resistive load was used to disturb the weak microgrid created by the diesel generators. Adding resistive load, for example, slows the generator down causing a drop in frequency.
At 0.3 seconds on the graphs below, the load bank is commanded to either increase load to create an under-frequency disturbance (Figure 9) or reduce load to create an over-frequency disturbance (Figure 10). Several load changes were tested including 10, 20, and 25 kW increases and decreases. The “natural” or un-mitigated response of the microgrid is shown on both figures. This was the control test where load was added to the microgrid but the electrolyzers were not online and ready to respond with load shifts of their own to mitigate the frequency disturbance.
18
This report is available at no cost from the National Renewable Energy Laboratory (NREL) at www.nrel.gov/publications.
In Figure 9, for example, the graph “Load Sim 0 to 10 kW, Alkaline at 40 kW” represents the test where the load bank changed its load from 0 to 10 kW, while the diesel generator was powering the alkaline electrolyzer at 40 kW.
Also, frequency triggers of 0.2 Hz and 0.5 Hz were tested. For the figures presented, once the frequency was perturbed greater than 0.2 Hz in either direction, the set-point for the electrolyzer (either alkaline or PEM) was adjusted to accommodate the load perturbation. Similar to the ramp-rate tests, data was collected for 2 seconds with a frequency of 2.0E-4 seconds to capture the system transients.
Figure 9. Load increase frequency support for alkaline and PEM electrolyzers
Figure 10. Load shed frequency support for alkaline and PEM electrolyzers
58.7
59.0
59.2
59.5
59.7
60.0
60.2
60.5
0 0.2 0.4 0.6 0.8 1 1.2 1.4 1.6 1.8 2
Freq
uenc
y (H
z)
Time (seconds)
Load Sim 0 to 10 kW, Alkaline at 40 kWLoad Sim 0 to 10 kW, Alkaline 40 to 30 kW, trig. 0.2 HzLoad Sim 0 to 10 kW, PEM 40 to 30 kW, trig. 0.2 Hz
59.0
59.5
60.0
60.5
61.0
61.5
0 0.2 0.4 0.6 0.8 1 1.2 1.4 1.6 1.8 2
Freq
uenc
y (H
z)
Time (seconds)
Load Sim 25 kW to 0, Alkaline at 15 kWLoad Sim 25 kW to 0, Alkaline 15 to 40 kW, trig. 0.2 HzLoad Sim 25 kW to 0, PEM 15 to 40 kW, trig. 0.2 Hz
19
This report is available at no cost from the National Renewable Energy Laboratory (NREL) at www.nrel.gov/publications.
Given enough time, the diesel generator will compensate for the load disturbance; however, this can result in a large increase or decrease in the frequency. The time that it takes for the frequency to be restored to between ±0.2 Hz is increased by adjusting the set-point of the electrolyzer. While the control strategies for the diesel generator and the electrolyzers can impact the speed at which the frequency is restored, it is clear that allowing the electrolyzers to help compensate for load perturbations can provide frequency regulation support for the grid. This result is echoed by a test performed by Hydrogenics in which an electrolyzer was used to respond to the grid frequency regulation signal [14].
4.2.3.2 Load-Following and Fast Energy Markets Load-following and fast energy markets have more relaxed requirements for the response time but there are greater requirements for the duration. A unit participating in the load-following or fast energy market must respond within 10 minutes and maintain the response for between 10 minutes and several hours. Testing shows that PEM and alkaline electrolyzers can respond much quicker than the required 10 minutes, and as discussed in the previous section on regulation markets, electrolyzers can provide a significant portion of their capacity for as long as needed to provide load following up or demand reduction to participate in the fast energy markets. As the required duration increases, electrolyzer facilities must ensure that their hydrogen customers are supplied sufficiently; therefore, providing energy for longer durations may require additional hydrogen storage capacity or oversizing the electrolyzer unit.
Similar to regulation up and load-following up, an electrolyzer can respond fast enough to provide load-following down and other down products; however, this implies that the unit is not already at full capacity. Being able to provide both up and down products allows for the electrolyzer device to modulate the hydrogen production to ensure that the hydrogen customers have sufficient hydrogen and that the storage is maintained appropriately. In this way electrolyzers can engage in arbitrage, while also participating in other electricity markets and providing hydrogen as a product.
4.2.3.3 Operating Reserves The last wholesale market service explored is operating reserves. While operating reserves consist of a variety of different reserve products, the response time must be less than 10 minutes for spinning and non-spinning with durations up to 2 hours; for replacement or supplemental reserves, the response time must be less than 30–60 minutes for a duration of 2 hours. The ramp down speed for electrolyzers is sufficiently fast to provide operating reserves by turning down part of the electrolyzer capacity (on the order of seconds) or the total unit capacity by turning off the electrolyzer (63 seconds for the PEM unit). Similar to the description for regulation and load-following and fast energy markets, a demand response device can provide the demand reduction for extended periods of time because it represents turning the electrolyzer down or off, which can be done rapidly and reliably.
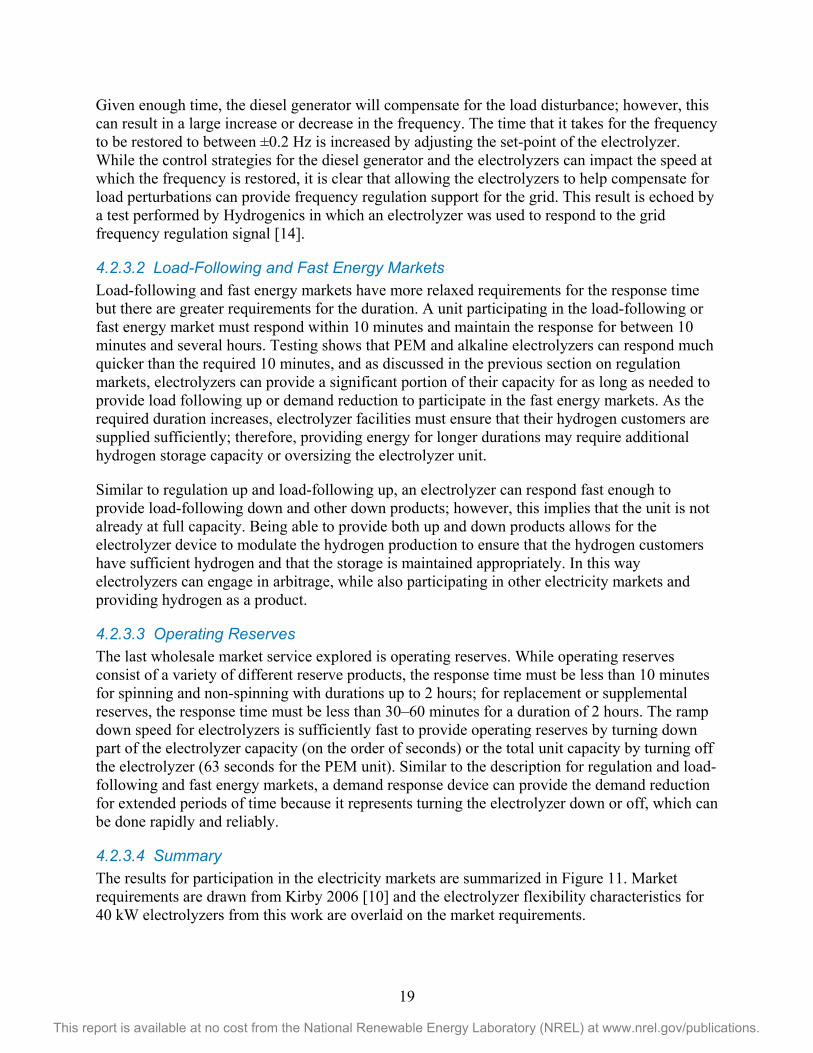
4.2.3.4 Summary The results for participation in the electricity markets are summarized in Figure 11. Market requirements are drawn from Kirby 2006 [10] and the electrolyzer flexibility characteristics for 40 kW electrolyzers from this work are overlaid on the market requirements.
20
This report is available at no cost from the National Renewable Energy Laboratory (NREL) at www.nrel.gov/publications.
Figure 11. Summary of electrolyzer flexibility compared to electricity market requirements1
Electrolyzers can respond faster than the required response time for spinning reserve and regulation (i.e., lower than the blue bar) and for longer duration than required for load-following and replacement/supplemental reserve (i.e., higher than the red bar). This shows that, technically, electrolyzers have sufficient flexibility to participate in all of the aforementioned electricity markets.
1 Electrolyzer data based on experimental testing of 40 kW PEM and alkaline units and market requirements are drawn from Kirby 2006.
21
This report is available at no cost from the National Renewable Energy Laboratory (NREL) at www.nrel.gov/publications.
5 Conclusions This work seeks to establish the flexibility of electrolyzers and the requirements for electrolyzers to operate in a variety of different applications. Using a PEM and an alkaline electrolyzer, tests were performed to assess the ramping, variable operation, frequency disturbance correction, and startup and shutdown capabilities. Results from the testing show the following:
• Small electrolyzer systems (~40 kW) begin changing their electricity demand within milliseconds of a set-point change. The PEM unit responded (i.e., max current change of ±1%) within an average of 13.2 milliseconds after a set-point change and the alkaline unit responded within an average of 19.9 milliseconds.
• The settling time after a set-point change is on the order of seconds. Most of the tests, including the 75% demand change tests, had nearly settled after 0.2 seconds. Based on the response trajectory, every demand change value (25%, 50%, and 75%) for both electrolyzer types settled to the prescribed set-point in less than 1 second.
• Electrolyzers can reduce their electrical consumption for an unlimited amount of time. However, other safety and control systems (e.g., system pressure and gas crossover) may need further design considerations to accommodate the lower production levels.
• Larger set-point changes are associated with higher maximum ramp rates. Additionally, ramping up an electrolyzer exhibited higher maximum ramp rates than were exhibited while ramping down.
• Electrolyzers exhibit low part-load operation capabilities. During the variable operation test the unit was turned down 90% of capacity to 10% part-load. While there was no test to determine the maximum turndown, the variable operation test shows that electrolyzers have a wide operating range.
• Electrolyzers can start up and shut down rather quickly. For the small unit tested (~40 kW), it took 6 minutes and 27 seconds for the PEM unit to execute a cold start and 1 minute and 3 seconds to turn off.
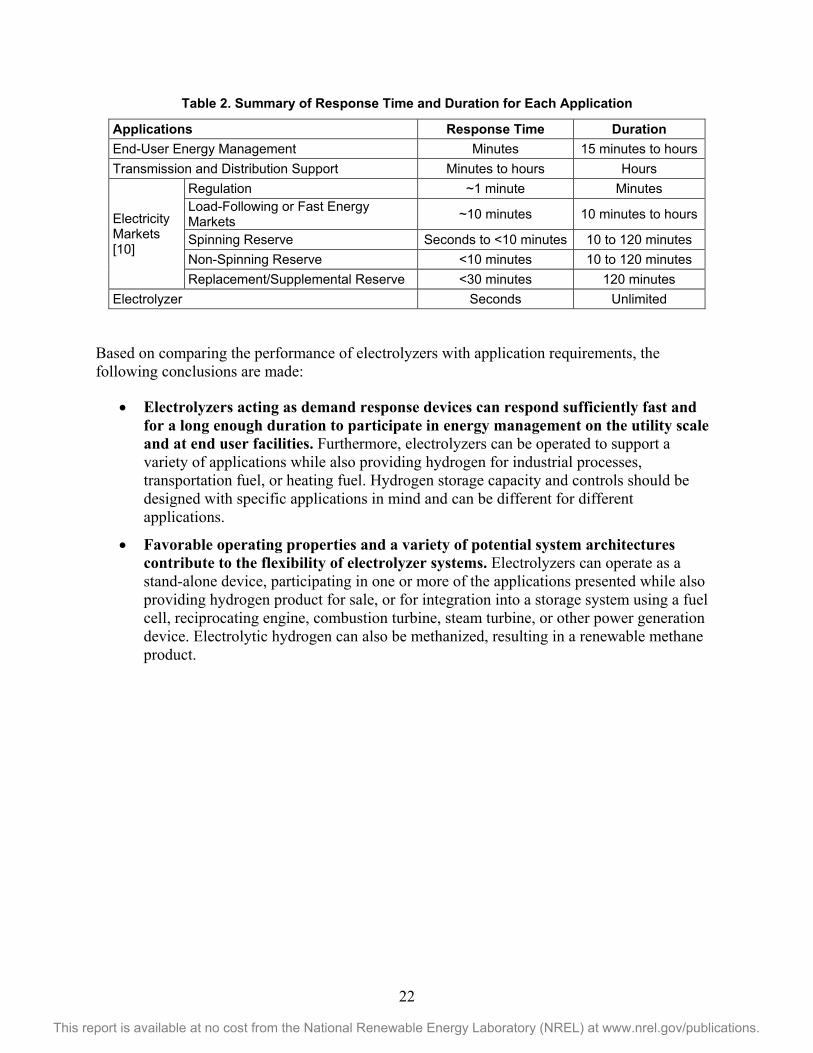
The requirements were established for supporting end-user energy management, transmission and distribution system support, and wholesale electricity markets. The findings are summarized in Table 2 and compared to the requirements for providing each service.
22
This report is available at no cost from the National Renewable Energy Laboratory (NREL) at www.nrel.gov/publications.
Table 2. Summary of Response Time and Duration for Each Application
Applications Response Time Duration End-User Energy Management Minutes 15 minutes to hours Transmission and Distribution Support Minutes to hours Hours
Electricity Markets [10]
Regulation ~1 minute Minutes Load-Following or Fast Energy Markets ~10 minutes 10 minutes to hours
Spinning Reserve Seconds to <10 minutes 10 to 120 minutes Non-Spinning Reserve <10 minutes 10 to 120 minutes Replacement/Supplemental Reserve <30 minutes 120 minutes
Electrolyzer Seconds Unlimited
Based on comparing the performance of electrolyzers with application requirements, the following conclusions are made:
• Electrolyzers acting as demand response devices can respond sufficiently fast and for a long enough duration to participate in energy management on the utility scale and at end user facilities. Furthermore, electrolyzers can be operated to support a variety of applications while also providing hydrogen for industrial processes, transportation fuel, or heating fuel. Hydrogen storage capacity and controls should be designed with specific applications in mind and can be different for different applications.
• Favorable operating properties and a variety of potential system architectures contribute to the flexibility of electrolyzer systems. Electrolyzers can operate as a stand-alone device, participating in one or more of the applications presented while also providing hydrogen product for sale, or for integration into a storage system using a fuel cell, reciprocating engine, combustion turbine, steam turbine, or other power generation device. Electrolytic hydrogen can also be methanized, resulting in a renewable methane product.
23
This report is available at no cost from the National Renewable Energy Laboratory (NREL) at www.nrel.gov/publications.
6 Future Work This work informs stakeholders on the operational and transient flexibility of electrolyzers as a means of producing hydrogen and providing additional energy management. As future systems are expected to represent larger loads (>1 MW per system), the ability to modulate these loads will be important as more systems enter the market. Additional testing to assess the flexibility of large units should be done to ensure that the responsiveness of electrolyzers can be achieved for large-scale systems.
The next step is to assess the economic value proposition for electrolyzed hydrogen systems participating in these grid ancillary support markets. That would entail understanding whether participation in one or more applications will reduce operation costs for the end user, increase the integration of renewable generation, and increase revenue from T&D support and wholesale market services. It is important to establish the competitiveness of electrolyzers versus other alternatives. Currently, the majority of hydrogen is produced using steam methane reformation. This process takes a gaseous fuel (typically natural gas) and converts it to hydrogen, and it is less expensive than electrolysis, primarily because of the difference in feedstock costs for natural gas versus electricity and the ability to release CO2 into the environment without any penalty [30]. However, additional revenue streams, from reducing end-user facility electricity costs or payments for T&D support or wholesale electricity market services, can improve the value proposition for electrolyzers.
This work did not consider the impacts of degradation on the stack or system; however, other NREL activities are exploring the impacts of variable electrolyzer operation on lifetime and stack performance. This remains an important question, particularly when establishing the business case for electrolyzer participation in various applications.
24
This report is available at no cost from the National Renewable Energy Laboratory (NREL) at www.nrel.gov/publications.
7 References 1. Carmo, M.; Fritz, D.L.; Mergel, J.; Stolten, D. “A comprehensive review on PEM water
electrolysis.” International Journal of Hydrogen Energy (38:12), 2013; pp. 4901-4934.
2. Zoulias, E.; Varkaraki, E.; Lymberopoulos, N.; Christodoulou, C.N.; Karagiorgis, G.N. A Review on Water Electrolysis. Pilermi, Greece: Centre for Renewable Energy Sources (CRES); Nicosia, Cyprus: Frederick Research Center (FRC), 2006. http://www.cres.gr/kape/publications/papers/dimosieyseis/ydrogen/A%20REVIEW%20ON%20WATER%20ELECTROLYSIS.pdf.
3. Ruth, M. Current (2009) State-of-the-Art Hydrogen Production Cost Estimate Using Water Electrolysis: Independent Review. NREL/BK-6A1-46676. Golden, CO: National Renewable Energy Laboratory, 2009.
4. Bhandari, R.; Trudewind, C.A.; Zapp, P. “Life cycle assessment of hydrogen production via electrolysis – a review.” Journal of Cleaner Production (Article in Press).
5. Ong, S.; Denholm, P.; Doris, E. The Impacts of Commercial Electric Utility Rate Structure Elements on the Economics of Photovoltaic Systems. NREL/TP-6A2-46782. Golden, CO: National Renewable Energy Laboratory, 2010.
6. “Tariff Schedule TOU-8: Time-of-use - General Service - Large.” Southern California Edison. Updated November 2013. https://www.sce.com/NR/sc3/tm2/pdf/ce54-12.pdf.
7. Metering Best Practices: A Guide to Achieving Utility Resource Efficiency. Efficiency Solutions LLC and Pacific Northwest National Laboratory for the Federal Energy Management Program and U.S. Department of Energy, 2011. http://www1.eere.energy.gov/femp/pdfs/mbpg.pdf.
8. Assessment of Demand Response & Advanced Metering. AD-06-2-000. Washington, DC: Federal Energy Regulatory Commission, 2006. (Revised 2008). http://www.ferc.gov/legal/staff-reports/demand-response.pdf.
9. Assessment of Demand Response & Advanced Metering. Washington, DC: Federal Energy Regulatory Commission, 2013. http://www.ferc.gov/legal/staff-reports/2013/oct-demand-response.pdf.
10. Kirby, B. Demand Response for Power System Reliability: FAQ. ORNL/TM-2006/565. Oak Ridge, TN: Oak Ridge National Laboratory, 2006.
11. Denholm, P.; Ela, E.; Kirby, B.; Milligan, M. The Role of Energy Storage with Renewable Electricity Generation. NREL/TP-6A2-47187. Golden, CO: National Renewable Energy Laboratory, 2010.
12. Li, X.; Song, Y.-J.; Han, S.-B. “Frequency control in micro-grid power system combined with electrolyzer system and fuzzy PI controller.” Journal of Power Sources (180:1), 2008; pp. 468-475.
13. Vidyanandan, K.V.; Senroy, N. “Frequency regulation in microgrid using wind - Fuel cell - Diesel generator.” IEEE Power and Energy Society General Meeting, 2012.
This report is available at no cost from the National Renewable Energy Laboratory (NREL) at www.nrel.gov/publications.
14. “Hydrogenics Successfully Completes Utility-Scale Grid Stabilization Trial with Ontario’s Independent Electricity System Operator.” Hydrogenics press release, 2011. http://www.hydrogenics.com/about-the-company/news-updates/2011/06/16/hydrogenics-successfully-completes-utility-scale-grid-stabilization-trial-with-ontario’s-independent-electricity-system-operator.
15. Investigating a Higher Renewables Portfolio Standard in California. Energy and Environmental Economics Inc., ECCO International and DNV KEMA, 2013.
16. Integration of Renewable Resources: Operational Requirements and Generation Fleet Capability at 20% RPS. Prepared by GE Energy Consulting, California Independent System Operator, Pacific Northwest National Laboratory, PLEXOS, and Nexant. Folsom, CA: California ISO, 2010.
17. Harrison, K.W.; Martin, G.D.; Ramsden, T.G.; Kramer, W.E.; Novachek, F.J. The Wind-to-Hydrogen Project: Operational Experience, Performance Testing, and Systems Integration. NREL/TP-550-44082. Golden, CO: National Renewable Energy Laboratory, 2009.
18. Rebenitsch, R.; Bush, R.; Boushee, A.; Woeste, J.; Stevens, B.G.; Peters, R.R.; Williams, K.D.; Bennett, K. Wind-to-Hydrogen Energy Pilot Project: Basin Electric Power Cooperative. 2009-EERC-06-11. Basin Electric Power Cooperative, University of North Dakota, U.S. Department of Energy, 2009. http://www.osti.gov/bridge/product.biblio.jsp?osti_id=951588.
19. Kroposki, B.; Levene, J.; Harrison, K.; Sen, P.K.; Novachek, F. Electrolysis: Information and Opportunities for Electric Power Utilities. NREL/TP-581-40605. Golden, CO: National Renewable Energy Laboratory, 2006.
20. Saur, G.; Ramsden, T. Wind Electrolysis: Hydrogen Cost Optimization. NREL/TP-5600-50408. Golden, CO: National Renewable Energy Laboratory, 2011.
21. Steward, D.; Saur, G.; Penev, M.; Ramsden, T. Lifecycle Cost Analysis of Hydrogen Versus Other Technologies for Electrical Energy Storage. NREL/TP-560-46719. Golden, CO: National Renewable Energy Laboratory, 2009.
22. Roadmap for the Realisation of a Wind Hydrogen Economy in the Lower Elbe Region. ChemCoast e.V., Ludwig Bölkow Systemtechnik and Becker Büttner Held, 2013. http://www.lbst.de/download/2013/ChemCoast_Executive%20Summary_Windwasserstoff-Produktion_final_engl.pdf.
23. Thomas, C.E.; Kuhn, I.F., Jr. “Electrolytic Production and Dispensing of Hydrogen.” Proceedings of the 1995 DOE Hydrogen Program Review, 1995; pp. 127-174. http://www.osti.gov/scitech/servlets/purl/125382.
25. Riedel, S.; Weigt, H. Electricity Markets Working Papers: German Electricity Reserve Markets. WP-EM-20. Dresden University of Technology and Energy Economics and Public Sector Management, 2007. http://hannesweigt.de/paper/wp_em_20_riedel_weigt_Germany_reserve_markets.pdf.
This report is available at no cost from the National Renewable Energy Laboratory (NREL) at www.nrel.gov/publications.
26. Market Access for Smaller Size Intelligent Electricity Generation (MASSIG): Market potentials, trends and marketing options for Distributed Generation in Europe. Intelligent Energy Europe, Energy Economics Group, Fraunhofer ISE, Technical University of Lodz, The University of Manchester and EMD International A/S, 2008. http://www.iee-massig.eu/papers_public/MASSIG_Deliverable2.1_Market_Potentials_and_Trends.pdf.
27. Cutter, E.; Alagappan, L.; Price, S. “Impacts of Market Rules on Energy Storage Economics. Energy and Environmental Economics.” Presented at the 32nd IAEE International Conference, 2009. http://www.usaee.org/usaee2009/submissions/OnlineProceedings/8025-Energy%20Storage_Paper%20E3.pdf.
28. Harrison, K.; Ainscough, C.; Saur, G. “Renewable Electrolysis Integrated System Development & Testing.” Project ID PD031. Presented at the 2012 DOE Hydrogen and Fuel Cells Program Annual Merit Review, 2012. http://www.hydrogen.energy.gov/pdfs/review12/pd031_harrison_2012_o.pdf.
29. Harrison, K.; Mann, M.; Terlip, D.; Peters, M. “Potential for Distributed and Central Electrolysis to Provide Grid Support Services.” Hydrogen and Fuel Cell Technical Highlights. NREL/FS-5600-54658. Golden, CO: National Renewable Energy Laboratory, 2012.
30. Ramsden, T.; Ruth, M.; Diakov, V.; Laffen, M.; Timbario, T. A. Hydrogen Pathways: Updated Cost, Well-to-Wheels Energy Use, and Emissions for the Current Technology Status of Ten Hydrogen Production, Delivery, and Distribution Scenarios. NREL/TP-6A10-60528. Golden, CO: National Renewable Energy Laboratory, 2013. http://www.nrel.gov/docs/fy14osti/60528.pdf.