NOVEL ICE DETECTION METHODOLOGY AND SYSTEM FOR SAFER AND GREENER AVIATION Nicolas Fezans (1) , Christoph Deiler (2) (1)(2) DLR (German Aerospace Center), Institute of Flight Systems, Lilienthalplatz 7, Braunschweig, 38108, Germany (1) Email: [email protected], (2) Email: [email protected]A novel robust ice detection methodology for the early detection of icing related flight performance degradation is presented. Based on data of 75, 689 flights with modern commercial airliners, a maxi- mum aircraft fleet’s performance variation is esti- mated. The evaluation of results indicates that an expected influence of icing could be clearly sep- arated. The developed methodology is energy based and fuses aircraft body and engine influ- ences on flight performance, which allows to reli- ably calculated a deviation from an available refer- ence. This difference in flight performance is conse- quently used to detect an aerodynamic degradation. The novel methodology provides large capabilities and shows a good detection reliability with no false alarm even within maneuvering flight, wind shear, turbulence and sideslip. Nomenclature Symbols α angle of attack rad β angle of side slip rad δ Detection distance m Δf function δl distance m η elevator deflection rad Φ bank angle rad ξ aileron deflection rad ζ rudder deflection rad C D drag coefficient C D0 zero lift drag coefficient (ΔC D ) crit drag coefficient threshold ΔC e D equivalent drag coefficient C L lift coefficient ˙ E energy change, power W g gravitational acceleration m/s 2 H altitude m k ice icing severity factor Ma Mach number m AC aircraft mass kg ˙ m AC derivative of the aircraft mass kg/s n load factor m N 1 engine fan speed P percentile/ quantile q dynamic pressure Pa S Wing wing surface area m 2 t time s u, v, w translational velocities m/s V velocity m/s x, y, z body fixed coordinates Subscripts & Abbreviations a aerodynamic system CAS calibrated airspeed comp compensation term corr corrected FDR flight data recorder IAS indicated airspeed IPS ice protection system k kinematic system opt optimal QAR quick access recorder ref reference TAS true airspeed tot total w wind 1. INTRODUCTION Icing can have a hazardous impact on the aircraft performance. In case of icing aircraft operational limitations might need to be adapted to remain in a safe flight envelope. During the last decades vari- ous accidents worldwide have shown the potential severity of icing-induced degradations as well as pi- lot’s difficulties to recognize and cope with the cor- responding changes in aircraft behavior [1–3]. The main degradation due to airframe (especially wing) icing manifests itself in a reduced stall angle of at- tack and increased drag. In the past, these effects of the icing phenomena have been investigated in various studies for different airfoils and icing cases (e.g. [4–6]) as well as for complete aircraft [7–10].
Transcript
NOVEL ICE DETECTION METHODOLOGY AND SYSTEM FOR SAFERAND GREENER AVIATION
Nicolas Fezans (1), Christoph Deiler (2)
(1)(2)DLR (German Aerospace Center), Institute of Flight Systems,Lilienthalplatz 7, Braunschweig, 38108, Germany
A novel robust ice detection methodology for theearly detection of icing related flight performancedegradation is presented. Based on data of 75, 689flights with modern commercial airliners, a maxi-mum aircraft fleet’s performance variation is esti-mated. The evaluation of results indicates that anexpected influence of icing could be clearly sep-arated. The developed methodology is energybased and fuses aircraft body and engine influ-ences on flight performance, which allows to reli-ably calculated a deviation from an available refer-ence. This difference in flight performance is conse-quently used to detect an aerodynamic degradation.The novel methodology provides large capabilitiesand shows a good detection reliability with no falsealarm even within maneuvering flight, wind shear,turbulence and sideslip.
Nomenclature
Symbolsα angle of attack radβ angle of side slip radδDetection distance m∆f functionδl distance mη elevator deflection radΦ bank angle radξ aileron deflection radζ rudder deflection radCD drag coefficientCD0 zero lift drag coefficient(∆CD)crit drag coefficient threshold∆CD equivalent drag coefficientCL lift coefficientE energy change, power Wg gravitational acceleration m/s2
H altitude mkice icing severity factorMa Mach numbermAC aircraft mass kgmAC derivative of the aircraft mass kg/s
n load factor mN1 engine fan speedP percentile/ quantileq dynamic pressure PaSWing wing surface area m2
t time su, v, w translational velocities m/sV velocity m/sx, y, z body fixed coordinates
Icing can have a hazardous impact on the aircraftperformance. In case of icing aircraft operationallimitations might need to be adapted to remain in asafe flight envelope. During the last decades vari-ous accidents worldwide have shown the potentialseverity of icing-induced degradations as well as pi-lot’s difficulties to recognize and cope with the cor-responding changes in aircraft behavior [1–3]. Themain degradation due to airframe (especially wing)icing manifests itself in a reduced stall angle of at-tack and increased drag. In the past, these effectsof the icing phenomena have been investigated invarious studies for different airfoils and icing cases(e.g. [4–6]) as well as for complete aircraft [7–10].
0 10
0
0.5
1
1.5
α[◦]
CL[−
]
0.05 0.1
0
0.5
1
1.5
CD[−]
A 320 “ATRA”Generic Icing
Figure 1. Comparison of A 320 “ATRA” lift and drag curve with and without generic icing influence
One major effect of aircraft ice accretion is a sig-nificant drag increase due to surface roughnesschanges, parasitic influence of ice protuberances,and local flow separation. Another effect of icingis a change of the aircraft lift behavior, with non-linearities in the lift curve starting at a lower angleof attack than on the clean profile/wing (e.g. ear-lier or more abrupt flow detachment with increasingangle of attack). Figure 1 illustrates the typical esti-mated icing-induced modification of the lift and dragcurves on the example of the DLR A 320 ATRA (Ad-vanced Technology Research Aircraft) research air-craft. The generic icing curves shown in figure 1are based on a light to moderate generic degrada-tion with 25 % more zero lift drag, a 50 % higher polarcurvature and 20 % reduced stall angle of attack.
Modern aircraft are equipped with anti-ice sys-tems preventing ice accretion on critical parts orde-icing installations to remove ice shapes with acertain size. But these systems mainly are de-signed to fulfill existing certification requirements(Appendix C), which do not cover all icing types likefor example supercooled large droplets (SLD) icing(nowadays covered by Appendix O). This means,that for existing aircraft there is a remaining (yet rel-atively remote) risk of ice accretion. Furthermore,all different existing ice protection systems (IPS) re-quire an additional significant amount of energy onboard. In case of thermal protection systems usu-ally bleed air is used, which causes a reduction ofthe engine effectiveness and an increased fuel con-sumption. A deliberate activation of the IPS is nec-essary for efficient flight operations, which raises thedemand for a reliable information about the currentdegradation, safety risk and therefore need to acti-vate the IPS. This information could be provided bythe herein proposed detection method.
This paper presents a novel methodology and sys-tem for the on-board surveillance of aircraft per-formance and its use for ice detection purposes.By providing pilots with a warning at a very earlystage of ice accretion, aircraft safety is significantlyincreased in icing conditions, which was alreadyshown by Bragg et al. in [11]. At that very stage,anti-ice / de-ice can be applied as countermeasuresand the region in which icing conditions are en-countered could still be left safely. The system withthe herein proposed detection methodology can pro-vide crucial information to the pilots while only re-quiring the sensor information that is available onall modern airliners and business jets. The devel-oped system relies on the change in flight perfor-mance (i.e. steady flight states) contrary to the manyfailed attempts (e.g [11–16]) based on the estima-tion of changes in the aircraft’s dynamic behavior.The change / degradation in the flight performanceis an indicator of ice accretion that is both robustand highly available: unlike the approaches basedon the detection of changes in the aircraft dynam-ical behavior, it can be used also during steadyflight conditions (most of an operating flight) and candetect icing effects significantly before approachingstall. Apart from the safety improvement providedby this detection method, a more targeted use of ex-tremely energy-consuming devices such as anti-icesystems could possibly be enabled.
Section 2 presents a first feasibility study that wasmade based on the data recorded by TUIfly duringtheir regular operations. A brief descriptions of de-tection methodology and system implementation aregiven in section 3. First results to proof the detectionreliability on the example of the DLR A 320 ATRA arefinally shown in section 4.
2
2. NOMINAL VARIATION OF FLIGHTPERFORMANCE WITHIN A FLEET
Within a fleet of a single aircraft type the flight per-formance characteristics of each individual aircraftslightly differs. Some of the factors causing theflight performance variations across airplanes fromthe same type are:
• production tolerances,
• aircraft skin repairs,
• aircraft skin contamination (e.g. dirt),
• engine aging causing reduced efficiency,
• or engine contamination (e.g. dirt).
In order to be able to detect icing through the detec-tion of flight performance changes, the other factors(i.e. nonrelated to icing) must be significantly lowerthan degradations caused by icing. Besides, themethodology proposed hereafter (section 3) usesthe standard aircraft sensors and the measurementerror (calibration and noise) also introduces varia-tions in the determination of the aircraft flight perfor-mance.
All in all, the aircraft flight performance can beseen as follows
FlightPerformance
= nominal Aircraft Flight Performance
+ nominal Engine Influence
+ Variation,
and the “Variation” part gathers the effects men-tioned previously and is here the part that need tobe analyzed.
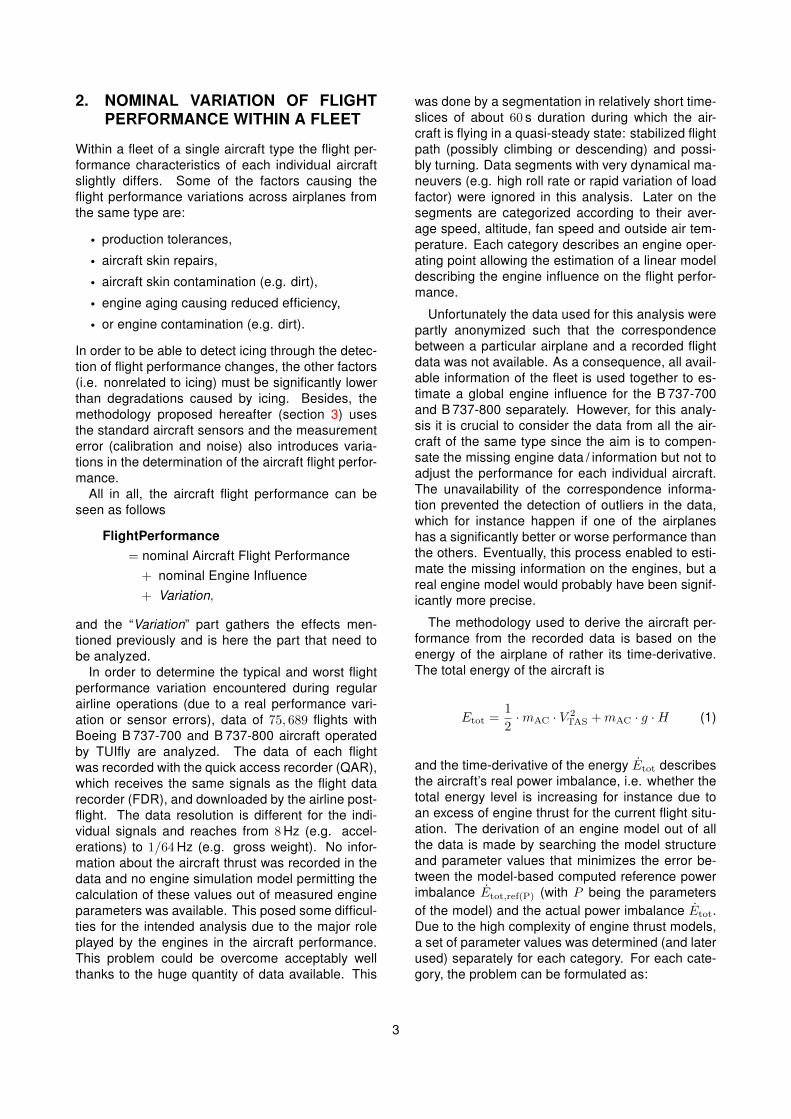
In order to determine the typical and worst flightperformance variation encountered during regularairline operations (due to a real performance vari-ation or sensor errors), data of 75, 689 flights withBoeing B 737-700 and B 737-800 aircraft operatedby TUIfly are analyzed. The data of each flightwas recorded with the quick access recorder (QAR),which receives the same signals as the flight datarecorder (FDR), and downloaded by the airline post-flight. The data resolution is different for the indi-vidual signals and reaches from 8 Hz (e.g. accel-erations) to 1/64 Hz (e.g. gross weight). No infor-mation about the aircraft thrust was recorded in thedata and no engine simulation model permitting thecalculation of these values out of measured engineparameters was available. This posed some difficul-ties for the intended analysis due to the major roleplayed by the engines in the aircraft performance.This problem could be overcome acceptably wellthanks to the huge quantity of data available. This
was done by a segmentation in relatively short time-slices of about 60 s duration during which the air-craft is flying in a quasi-steady state: stabilized flightpath (possibly climbing or descending) and possi-bly turning. Data segments with very dynamical ma-neuvers (e.g. high roll rate or rapid variation of loadfactor) were ignored in this analysis. Later on thesegments are categorized according to their aver-age speed, altitude, fan speed and outside air tem-perature. Each category describes an engine oper-ating point allowing the estimation of a linear modeldescribing the engine influence on the flight perfor-mance.
Unfortunately the data used for this analysis werepartly anonymized such that the correspondencebetween a particular airplane and a recorded flightdata was not available. As a consequence, all avail-able information of the fleet is used together to es-timate a global engine influence for the B 737-700and B 737-800 separately. However, for this analy-sis it is crucial to consider the data from all the air-craft of the same type since the aim is to compen-sate the missing engine data / information but not toadjust the performance for each individual aircraft.The unavailability of the correspondence informa-tion prevented the detection of outliers in the data,which for instance happen if one of the airplaneshas a significantly better or worse performance thanthe others. Eventually, this process enabled to esti-mate the missing information on the engines, but areal engine model would probably have been signif-icantly more precise.
The methodology used to derive the aircraft per-formance from the recorded data is based on theenergy of the airplane of rather its time-derivative.The total energy of the aircraft is
Etot =1
2·mAC · V 2
TAS +mAC · g ·H (1)
and the time-derivative of the energy Etot describesthe aircraft’s real power imbalance, i.e. whether thetotal energy level is increasing for instance due toan excess of engine thrust for the current flight situ-ation. The derivation of an engine model out of allthe data is made by searching the model structureand parameter values that minimizes the error be-tween the model-based computed reference powerimbalance Etot,ref(P) (with P being the parametersof the model) and the actual power imbalance Etot.Due to the high complexity of engine thrust models,a set of parameter values was determined (and laterused) separately for each category. For each cate-gory, the problem can be formulated as:
3
3 660 3 680 3 700 3 720 3 740 3 760 3 780 3 800
−1012
t [s]
Eto
t[M
W]
54 200
54 300
mAC
[kg]
225
226
227
VTAS
[m/s
] 7 2407 2607 2807 3007 320
H[m
]
78
80
82
84
N1
[%]
Figure 2. Example of automatically selected quasi steady segments in flight data
Popt = argminP
( ∑segments
(Etot,ref(P) − Etot
)2)(2)
Later, in each category the vector of optimal pa-rameter values Popt is used and the correspondingpower imbalance (Etot,ref(Popt)) will be compared tothe actual power imbalance Etot.
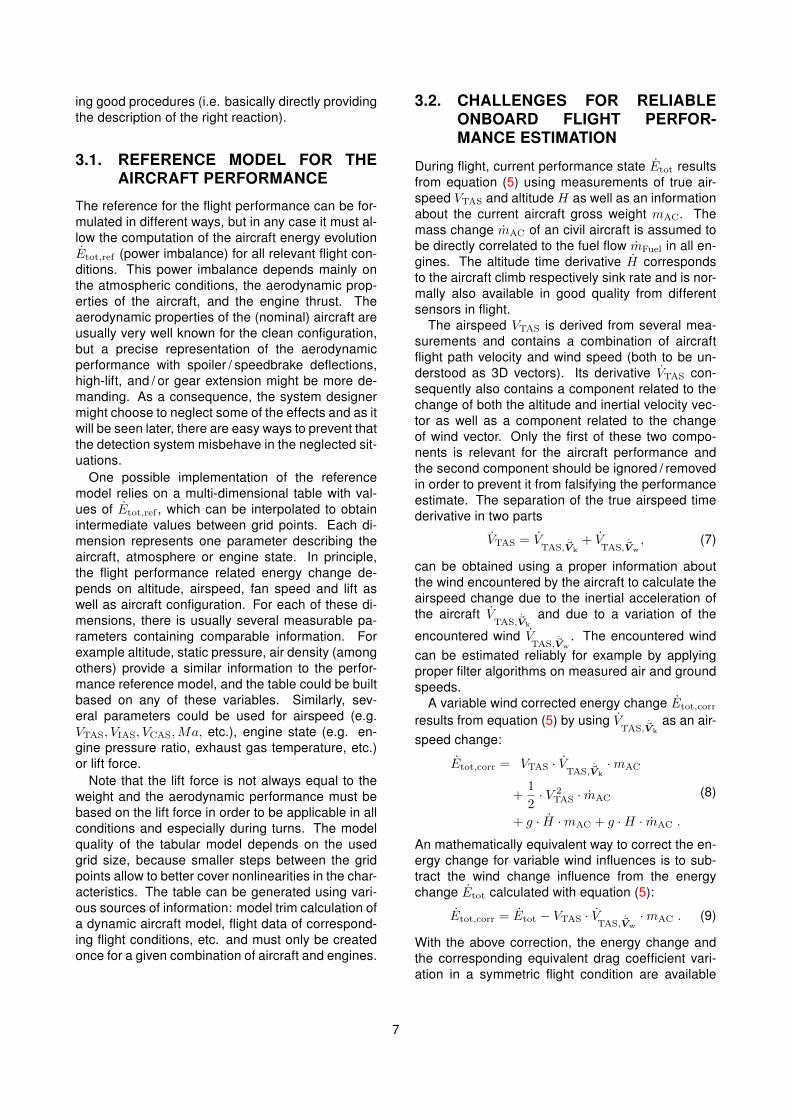
In practice, before being able to find Popt by solv-ing the problem of equation (2) the data need tobe preprocessed. This preprocessing includes thedetection and cleanup of erroneous data (whichcan for instance happen at times when some on-board computers are being reset) as well as bring-ing the individual channels to the same constantsampling rate and time base. Then, the data aresearched for steady engine and quasi-steady flightconditions for which several engine and flight pa-rameters only slightly vary inside predefined bound-aries. According to these conditions the flight dataare segmented resulting in time slices of steady con-ditions with an individual length between 60 s and120 s. For each time slice mean values of altitude,speed / Mach number, temperature, gross weight,engine fan speed, fuel flow, and energy change arecalculated and used for further evaluation. Usingonly mean values over data segments with steadyflight conditions allows to reduce the data signif-icantly although all necessary information is stillavailable. An example of such segments is givenin the time histories of several aircraft observationvariables in figure 2. In the case shown in this figure,segments during cruise flight right after the aircraft
climbed to 24, 000 ft (7, 315 m) are selected. Withstabilized engine conditions the aircraft speed onlycontains small variations and the quasi steady flightassumption is valid.
With this method 202, 797 segments are extractedfrom the B 737-700 data and 5, 161, 814 segmentsfrom the B 737-800 data. To use a regression tech-nique for the estimation of the engine influence onthe recorded aircraft flight performance, the data iscategorized. It is possible to reliably estimate theengine model parameter values within a categoryonly if this category contains enough segments. Inthe B 737-700 data base the 340 categories with thehighest number of segments were selected and sim-ilarly in the B 737-800 data base the 750 categorieswith the highest number of segments were selected.The lowest number of segments in these categorieswere respectively 271 in the the B 737-700 case and572 in the B 737-800 case. In both cases, an affineadjustment of the performance based on only threeengine parameters (the fan speed N1, the fuel flowmFuel, and the Mach number Ma) was found suf-ficient. Note that when applying an affine adjust-ment with only 3 linear terms (one per parameter)on data sets containing several hundreds of datapoints, there is no real risk of overfit.
Eventually, Etot,ref(Popt) (the reference power im-balance corrected from some of the unknowns af-fecting the engine thrust) can be written as:
with ∆f being the optimal affine adjustment of theengine thrust model on the considered category.
4
0.02 0.03 0.04 0.05 0.060
0.2
0.4
0.6
0.8
175%
CD
0
150%
CD
0
75%
CD
0
200%
CD
0
225%
CD
0
125%
CD
0
B 737-700
CD [-]
CL
[-]
0.02 0.03 0.04 0.05 0.060
0.2
0.4
0.6
0.8
175%
CD
0
150%
CD
0
75%
CD
0
200%
CD
0
225%
CD
0
125%
CD
0
B 737-800
CD [-]
CL
[-]
Nominal Polar (P0) (L/D)optIced Polar P99
Estimated Detection Accuracy P99.9
P100
Figure 3. Obtained equivalent drag coefficient (P99,P99.9 & P100) within the two aircraft fleets
The remaining deviations between the expectedpower imbalance Etot,ref(Popt) and the actual powerimbalance Etot (rate of change of the aircraft to-tal energy) are the variations of the flight perfor-mance within the considered aircraft fleet. Thesevariations are known to exist and need to be char-acterized in order to check the feasibility of a reli-able icing detection system based on the monitor-ing of the aircraft performance. “Reliable” includeshere (among others) the need to effectively detectthe performance degradation due to icing while pre-venting false alarms.
While the chosen energy-based approach encom-passes all aspects of the flight performance and es-pecially the couplings between the involved physi-cal parameters, the scaling of the power imbalanceEtot,ref(Popt)− Etot into a nondimensional equivalentdrag coefficient variation ∆CD eases the physicalinterpretation (same order of magnitude for differentspeeds, current lift, or even aircraft type) and lateron the definition of threshold values for the detec-tion system (see section 3). This scaling is realizedas follows:
∆CD =Etot,ref(Popt) − Etot
VTAS · q · SWing(4)
The equivalent drag coefficient ∆CD computed us-ing equation (4) describes the aircraft flight perfor-mance variation inside the fleet, mostly but not onlyresulting from variation of the aircraft aerodynamicperformance (e.g. due to dirt, damages, or ice ac-cretion). Other possible causes for this variation aresensor errors, unaccounted wind influences (e.g.downdrafts), and variations in the actual engine per-formance.
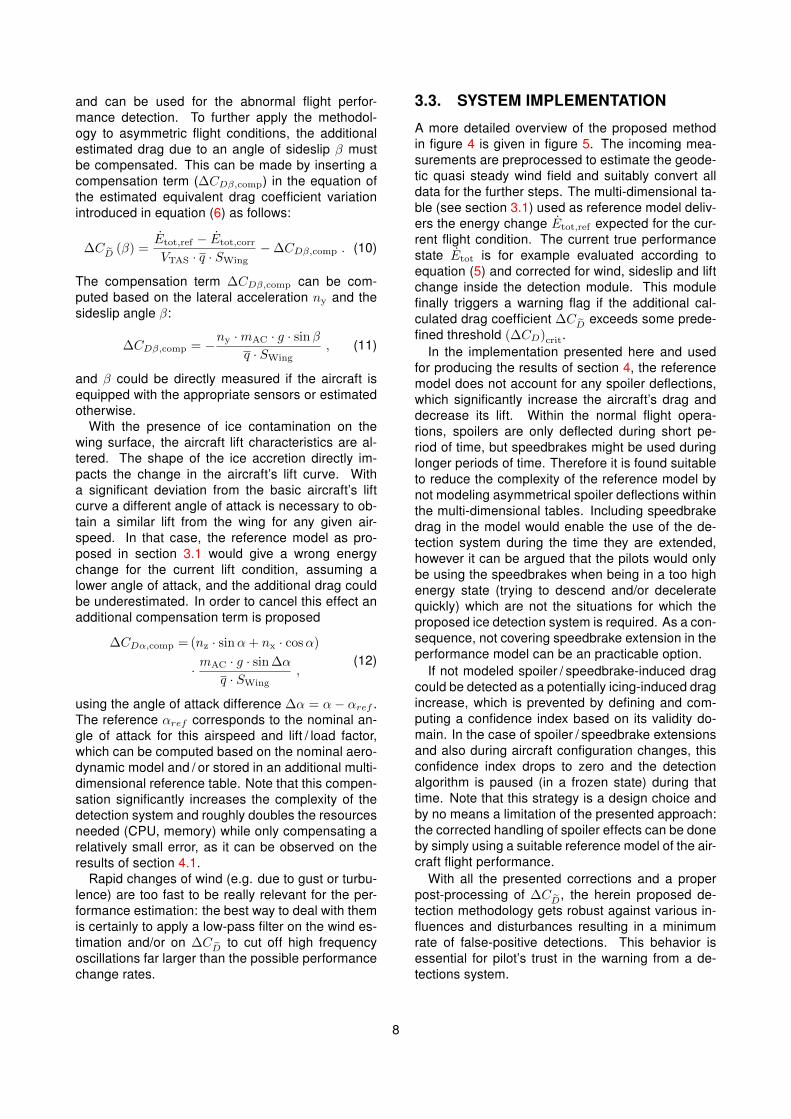
In order to represent the data (millions of datapoints) in an intelligible way, convex hulls (in the(∆CD,CL)-plane) corresponding to several quan-tiles of the data were computed and representedgraphically in figure 3 for the B 737-700 (left) andB 737-800 (right). On these individual figures:
• the black line represents the nominal drag polarof the aircraft,
• the dot-dashed gray lines are defined as byshifting the nominal drag polar by steps of25 % CD0 and serve as grid in this figure,
• the red line represents an expected drag polarwith moderate ice accretion comparable to fig-ure 1,
• the green area represents schematically theaccuracy that the authors expect to be ableto reach with performance monitoring systemshown later in section 3,
• the areas defined by the three cyan (with differ-ent brightness levels) polygon lines are the con-vex hulls of the selected data quantiles (99 %99.9 % and 100 %).
There is several sources of errors affecting thisanalysis: a limited knowledge on the engine powercharacteristics of these two aircraft types, a lowresolution (sampling-time and quantization) of therecorded data, a missing vertical wind information(which can hardly be recovered from the data avail-able), and the fact that the B 737-800 data includeaircraft equipped with different types of winglets.Note that these sources of errors are affecting thisanalysis of the recorded flight data but would not af-fect a detection system running aboard the aircraft.
5
After considering the knowledge gained from thedata and the sensitivity of the results to the differentsources of errors, an educated guess was made forthe performance estimation uncertainty that can bereached in practice by an onboard system using thestandard aircraft instrumentation (air data and iner-tial reference systems). The corresponding achiev-able precision is represented by the green areas infigure 3.
The results of this FDR / QAR data analysis sup-port the initial guess that it is possible to monitorthe aircraft performance of all aircraft from a com-plete fleet using the regular sensors and with a levelof precision that permits to detect the performancedegradation that is induced by the ice accretion ata very early stage (before this degradation of theperformance reaches a critical level). The way theFDR / QAR data was processed in the analysis pre-sented in this section was strongly tailored to a post-flight analysis. While some of the ideas used in thevarious processing steps can be reused for design-ing a real-time onboard detection system, numer-ous other refinements are needed for that applica-tion and will be shown in section 3 along with thedescription of the detection system.
3. DETECTION METHODOLOGY
In contrast to various published attempts to detecticing on changes of the dynamic aircraft behavior[11–17], the proposed method is focused on theflight performance changes. It is commonly known,that icing mainly affects the aircraft’s drag (see fig-ure 1), but none of the available methods is basedon this effect. A major advantage of monitoring flightperformance characteristics and not the aircraft’sdynamic behavior is that no (additional) dynamic ex-citation is required. Such an excitation is not accept-able during normal operations as stated in [14], es-pecially when flying with an icing degraded aircraft,which has a decreased maximum lift angle of attack.
The basic idea of the herein proposed detec-tion method is to compare the current (possibly ice-influenced) aircraft flight performance characteris-tics with a known reference, as schematically rep-resented in figure 4.
The flight performance can be formulated as apower imbalance (change of total energy) Etot inboth cases (current state and reference), which al-lows to represent the changed aircraft characteris-tics in only one significant value and reduces thedetection module complexity. Moreover, it combinesthe influences of aerodynamics and engines on the
DetectionModule
Performance ReferenceEtot,ref
Etot
Performance State
Warning
Figure 4. Basic principle of the detection method
aircraft performance. The power imbalance Etot isanalytically derived through:
Etot = VTAS · VTAS ·mAC +1
2· V 2
TAS · mAC
+ g · H ·mAC + g ·H · mAC ,(5)
with the altitude change H referenced to the sur-rounding air. The same scaling / conversion of thispower imbalance into an equivalent drag coefficientvariation as for the analysis of section 2 is used:
∆CD ≈Etot,ref − Etot
VTAS · q · SWing. (6)
This non-dimensional value is now well compara-ble to a predefined threshold and indicating an ab-normal performance variation when exceeding thethreshold value, independent from any trim condi-tion. The fleet data evaluation in section 2 providessome concrete and objective data to define a suit-able detection threshold, which guarantees a mini-mum expectable false detection rate with the stan-dard sensor equipment and all possible influenceson flight performance during normal airline opera-tion. With the results shown in figure 3 a thresholdvalue
(∆CD)crit = 30 % CD0
is conservatively defined, which suitably exceedsthe detected performance variation. Generallyspeaking the choice of such a threshold is alwaystrade-off between sensitivity and the probability ofgenerating false alarms. For a given thresholdvalue, the risk of generating false alarms might bereduced by improving the processing or by activat-ing the system only under some particular condi-tions (e.g. for icing this could be based on somerange of outside air temperature). The need tobe prevent false alarms as much as possible, isthat they could induce hazardous reactions (e.g.from the pilots) in otherwise totally safe situations.Even though this is not part of the scope of thepresent paper, it should be noticed that the risk ofinducing hazardous reactions can be alleviated bya good human-machine interface design (makingmessages very understandable and precise to pre-vent confusion and misinterpretation) and by defin-
6
ing good procedures (i.e. basically directly providingthe description of the right reaction).
3.1. REFERENCE MODEL FOR THEAIRCRAFT PERFORMANCE
The reference for the flight performance can be for-mulated in different ways, but in any case it must al-low the computation of the aircraft energy evolutionEtot,ref (power imbalance) for all relevant flight con-ditions. This power imbalance depends mainly onthe atmospheric conditions, the aerodynamic prop-erties of the aircraft, and the engine thrust. Theaerodynamic properties of the (nominal) aircraft areusually very well known for the clean configuration,but a precise representation of the aerodynamicperformance with spoiler / speedbrake deflections,high-lift, and / or gear extension might be more de-manding. As a consequence, the system designermight choose to neglect some of the effects and as itwill be seen later, there are easy ways to prevent thatthe detection system misbehave in the neglected sit-uations.
One possible implementation of the referencemodel relies on a multi-dimensional table with val-ues of Etot,ref , which can be interpolated to obtainintermediate values between grid points. Each di-mension represents one parameter describing theaircraft, atmosphere or engine state. In principle,the flight performance related energy change de-pends on altitude, airspeed, fan speed and lift aswell as aircraft configuration. For each of these di-mensions, there is usually several measurable pa-rameters containing comparable information. Forexample altitude, static pressure, air density (amongothers) provide a similar information to the perfor-mance reference model, and the table could be builtbased on any of these variables. Similarly, sev-eral parameters could be used for airspeed (e.g.VTAS, VIAS, VCAS,Ma, etc.), engine state (e.g. en-gine pressure ratio, exhaust gas temperature, etc.)or lift force.
Note that the lift force is not always equal to theweight and the aerodynamic performance must bebased on the lift force in order to be applicable in allconditions and especially during turns. The modelquality of the tabular model depends on the usedgrid size, because smaller steps between the gridpoints allow to better cover nonlinearities in the char-acteristics. The table can be generated using vari-ous sources of information: model trim calculation ofa dynamic aircraft model, flight data of correspond-ing flight conditions, etc. and must only be createdonce for a given combination of aircraft and engines.
3.2. CHALLENGES FOR RELIABLEONBOARD FLIGHT PERFOR-MANCE ESTIMATION
During flight, current performance state Etot resultsfrom equation (5) using measurements of true air-speed VTAS and altitude H as well as an informationabout the current aircraft gross weight mAC. Themass change mAC of an civil aircraft is assumed tobe directly correlated to the fuel flow mFuel in all en-gines. The altitude time derivative H correspondsto the aircraft climb respectively sink rate and is nor-mally also available in good quality from differentsensors in flight.
The airspeed VTAS is derived from several mea-surements and contains a combination of aircraftflight path velocity and wind speed (both to be un-derstood as 3D vectors). Its derivative VTAS con-sequently also contains a component related to thechange of both the altitude and inertial velocity vec-tor as well as a component related to the changeof wind vector. Only the first of these two compo-nents is relevant for the aircraft performance andthe second component should be ignored / removedin order to prevent it from falsifying the performanceestimate. The separation of the true airspeed timederivative in two parts
VTAS = VTAS,~Vk
+ VTAS,~Vw
, (7)
can be obtained using a proper information aboutthe wind encountered by the aircraft to calculate theairspeed change due to the inertial acceleration ofthe aircraft V
TAS,~Vkand due to a variation of the
encountered wind VTAS,~Vw
. The encountered wind
can be estimated reliably for example by applyingproper filter algorithms on measured air and groundspeeds.
A variable wind corrected energy change Etot,corr
results from equation (5) by using VTAS,~Vk
as an air-
speed change:
Etot,corr = VTAS · VTAS,~Vk
·mAC
+1
2· V 2
TAS · mAC
+ g · H ·mAC + g ·H · mAC .
(8)
An mathematically equivalent way to correct the en-ergy change for variable wind influences is to sub-tract the wind change influence from the energychange Etot calculated with equation (5):
Etot,corr = Etot − VTAS · VTAS,~Vw
·mAC . (9)
With the above correction, the energy change andthe corresponding equivalent drag coefficient vari-ation in a symmetric flight condition are available
7
and can be used for the abnormal flight perfor-mance detection. To further apply the methodol-ogy to asymmetric flight conditions, the additionalestimated drag due to an angle of sideslip β mustbe compensated. This can be made by inserting acompensation term (∆CDβ,comp) in the equation ofthe estimated equivalent drag coefficient variationintroduced in equation (6) as follows:
∆CD (β) =Etot,ref − Etot,corr
VTAS · q · SWing−∆CDβ,comp . (10)
The compensation term ∆CDβ,comp can be com-puted based on the lateral acceleration ny and thesideslip angle β:
∆CDβ,comp = −ny ·mAC · g · sinβq · SWing
, (11)
and β could be directly measured if the aircraft isequipped with the appropriate sensors or estimatedotherwise.
With the presence of ice contamination on thewing surface, the aircraft lift characteristics are al-tered. The shape of the ice accretion directly im-pacts the change in the aircraft’s lift curve. Witha significant deviation from the basic aircraft’s liftcurve a different angle of attack is necessary to ob-tain a similar lift from the wing for any given air-speed. In that case, the reference model as pro-posed in section 3.1 would give a wrong energychange for the current lift condition, assuming alower angle of attack, and the additional drag couldbe underestimated. In order to cancel this effect anadditional compensation term is proposed
∆CDα,comp = (nz · sinα+ nx · cosα)
· mAC · g · sin ∆α
q · SWing,
(12)
using the angle of attack difference ∆α = α− αref .The reference αref corresponds to the nominal an-gle of attack for this airspeed and lift / load factor,which can be computed based on the nominal aero-dynamic model and / or stored in an additional multi-dimensional reference table. Note that this compen-sation significantly increases the complexity of thedetection system and roughly doubles the resourcesneeded (CPU, memory) while only compensating arelatively small error, as it can be observed on theresults of section 4.1.
Rapid changes of wind (e.g. due to gust or turbu-lence) are too fast to be really relevant for the per-formance estimation: the best way to deal with themis certainly to apply a low-pass filter on the wind es-timation and/or on ∆CD to cut off high frequencyoscillations far larger than the possible performancechange rates.
3.3. SYSTEM IMPLEMENTATION
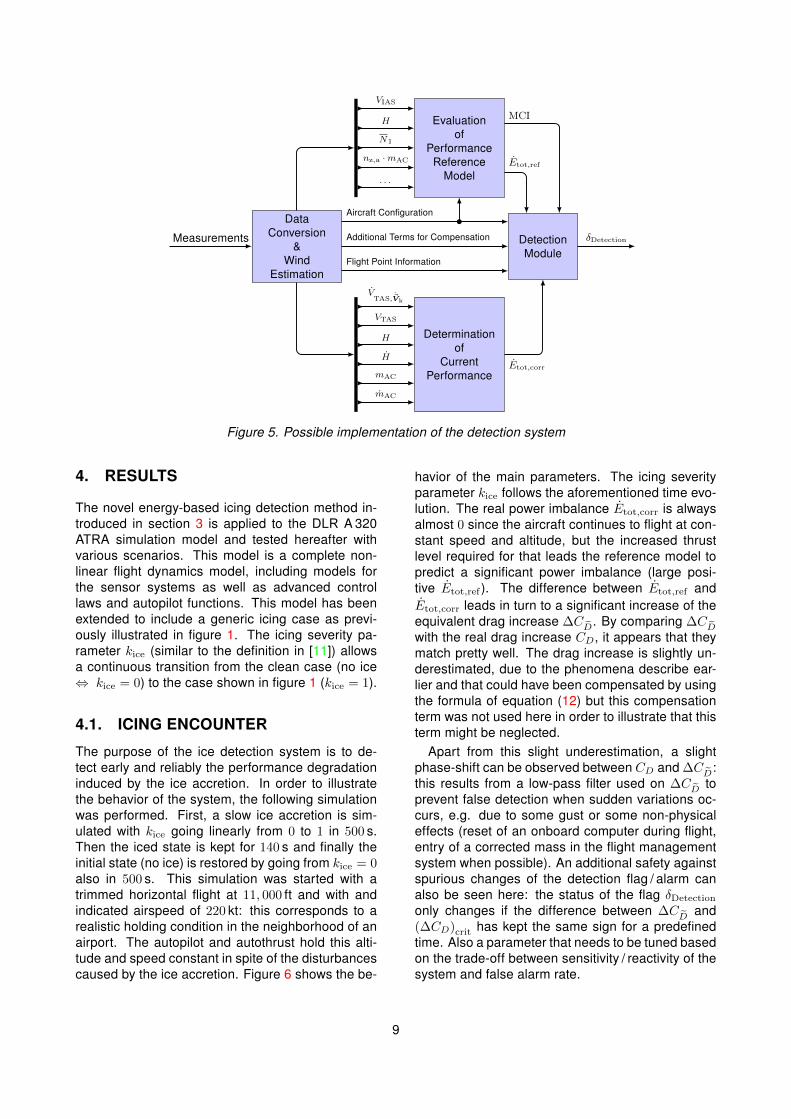
A more detailed overview of the proposed methodin figure 4 is given in figure 5. The incoming mea-surements are preprocessed to estimate the geode-tic quasi steady wind field and suitably convert alldata for the further steps. The multi-dimensional ta-ble (see section 3.1) used as reference model deliv-ers the energy change Etot,ref expected for the cur-rent flight condition. The current true performancestate Etot is for example evaluated according toequation (5) and corrected for wind, sideslip and liftchange inside the detection module. This modulefinally triggers a warning flag if the additional cal-culated drag coefficient ∆CD exceeds some prede-fined threshold (∆CD)crit.
In the implementation presented here and usedfor producing the results of section 4, the referencemodel does not account for any spoiler deflections,which significantly increase the aircraft’s drag anddecrease its lift. Within the normal flight opera-tions, spoilers are only deflected during short pe-riod of time, but speedbrakes might be used duringlonger periods of time. Therefore it is found suitableto reduce the complexity of the reference model bynot modeling asymmetrical spoiler deflections withinthe multi-dimensional tables. Including speedbrakedrag in the model would enable the use of the de-tection system during the time they are extended,however it can be argued that the pilots would onlybe using the speedbrakes when being in a too highenergy state (trying to descend and/or deceleratequickly) which are not the situations for which theproposed ice detection system is required. As a con-sequence, not covering speedbrake extension in theperformance model can be an practicable option.
If not modeled spoiler / speedbrake-induced dragcould be detected as a potentially icing-induced dragincrease, which is prevented by defining and com-puting a confidence index based on its validity do-main. In the case of spoiler / speedbrake extensionsand also during aircraft configuration changes, thisconfidence index drops to zero and the detectionalgorithm is paused (in a frozen state) during thattime. Note that this strategy is a design choice andby no means a limitation of the presented approach:the corrected handling of spoiler effects can be doneby simply using a suitable reference model of the air-craft flight performance.
With all the presented corrections and a properpost-processing of ∆CD, the herein proposed de-tection methodology gets robust against various in-fluences and disturbances resulting in a minimumrate of false-positive detections. This behavior isessential for pilot’s trust in the warning from a de-tections system.
8
Evaluationof
PerformanceReference
Model
DataConversion
&Wind
Estimation
Measurements
VIAS
H
N1
nz,a ·mAC
. . .
Determinationof
CurrentPerformance
DetectionModule
Etot,ref
MCI
Etot,corr
δDetection
VTAS,~Vk
VTAS
H
H
mAC
mAC
Aircraft Configuration
Additional Terms for Compensation
Flight Point Information
Figure 5. Possible implementation of the detection system
4. RESULTS
The novel energy-based icing detection method in-troduced in section 3 is applied to the DLR A 320ATRA simulation model and tested hereafter withvarious scenarios. This model is a complete non-linear flight dynamics model, including models forthe sensor systems as well as advanced controllaws and autopilot functions. This model has beenextended to include a generic icing case as previ-ously illustrated in figure 1. The icing severity pa-rameter kice (similar to the definition in [11]) allowsa continuous transition from the clean case (no ice⇔ kice = 0) to the case shown in figure 1 (kice = 1).
4.1. ICING ENCOUNTER
The purpose of the ice detection system is to de-tect early and reliably the performance degradationinduced by the ice accretion. In order to illustratethe behavior of the system, the following simulationwas performed. First, a slow ice accretion is sim-ulated with kice going linearly from 0 to 1 in 500 s.Then the iced state is kept for 140 s and finally theinitial state (no ice) is restored by going from kice = 0also in 500 s. This simulation was started with atrimmed horizontal flight at 11, 000 ft and with andindicated airspeed of 220 kt: this corresponds to arealistic holding condition in the neighborhood of anairport. The autopilot and autothrust hold this alti-tude and speed constant in spite of the disturbancescaused by the ice accretion. Figure 6 shows the be-
havior of the main parameters. The icing severityparameter kice follows the aforementioned time evo-lution. The real power imbalance Etot,corr is alwaysalmost 0 since the aircraft continues to flight at con-stant speed and altitude, but the increased thrustlevel required for that leads the reference model topredict a significant power imbalance (large posi-tive Etot,ref ). The difference between Etot,ref andEtot,corr leads in turn to a significant increase of theequivalent drag increase ∆CD. By comparing ∆CDwith the real drag increase CD, it appears that theymatch pretty well. The drag increase is slightly un-derestimated, due to the phenomena describe ear-lier and that could have been compensated by usingthe formula of equation (12) but this compensationterm was not used here in order to illustrate that thisterm might be neglected.
Apart from this slight underestimation, a slightphase-shift can be observed between CD and ∆CD:this results from a low-pass filter used on ∆CD toprevent false detection when sudden variations oc-curs, e.g. due to some gust or some non-physicaleffects (reset of an onboard computer during flight,entry of a corrected mass in the flight managementsystem when possible). An additional safety againstspurious changes of the detection flag / alarm canalso be seen here: the status of the flag δDetection
only changes if the difference between ∆CD and(∆CD)crit has kept the same sign for a predefinedtime. Also a parameter that needs to be tuned basedon the trade-off between sensitivity / reactivity of thesystem and false alarm rate.
9
0 500 1 000
0
1
t [s]
δ Detection
[-] 0
0.5
1kice
[-]
0 500 1 0000
0.01
0.02
t [s]
∆C
D[-
]
∆CD
∆CD
(∆CD)crit
0
1
2
E[M
W]
Etot,corr
Etot,ref
Figure 6. Behavior of the detection system during slow aerodynamic changes of the A 320 due to icing
0 50 100 150 200
−1
0
1
t [s]
ww
[m/s
]
−10
−5
0
v w[m
/s]
−15
−10
−50
uw
[m/s
]
simulated estimated
0 50 100 150 200
0
1
t [s]
δ Detection
[-] 0
0.01
0.02∆C
D[-
]∆CD
∆CD
(∆CD)crit
0
5
E[M
W]
Etot,corr
Etot,ref
Figure 7. Behavior of the detection system in the presence of turbulence and wind shear
0 10 20 30
0
1
t [s]
δ Detection
[-]
9101112
β[◦
]
0 10 20 300
0.01
0.02
t [s]
∆C
D[-
] ∆CDβ,comp
∆CD
(∆CD)crit∆C
D(β)
0
1
2
E[M
W]
Etot,corr
Etot,ref
Figure 8. Behavior of the detection system during steady heading sideslip with β = 10◦
0 10 20 30 40 50−10
010
t [s]
ζ[◦
]
−200
20
ξ[◦
]
−2
0
2
η[◦
]
−500
50
Φ[◦
]
−100
10
β[◦
]
1
1.5
nz,a
[-]
0 10 20 30 40 50
0
1
t [s]
δ Detection
[-]
0
0.05
0.1
∆C
D[-
] ∆CDβ,comp
∆CD
(∆CD)crit∆C
D(β)
−10
0
E[M
W]
Etot,corr
Etot,ref
Figure 9. Behavior of the detection system during maneuvers (aircraft in “direct law”)
10
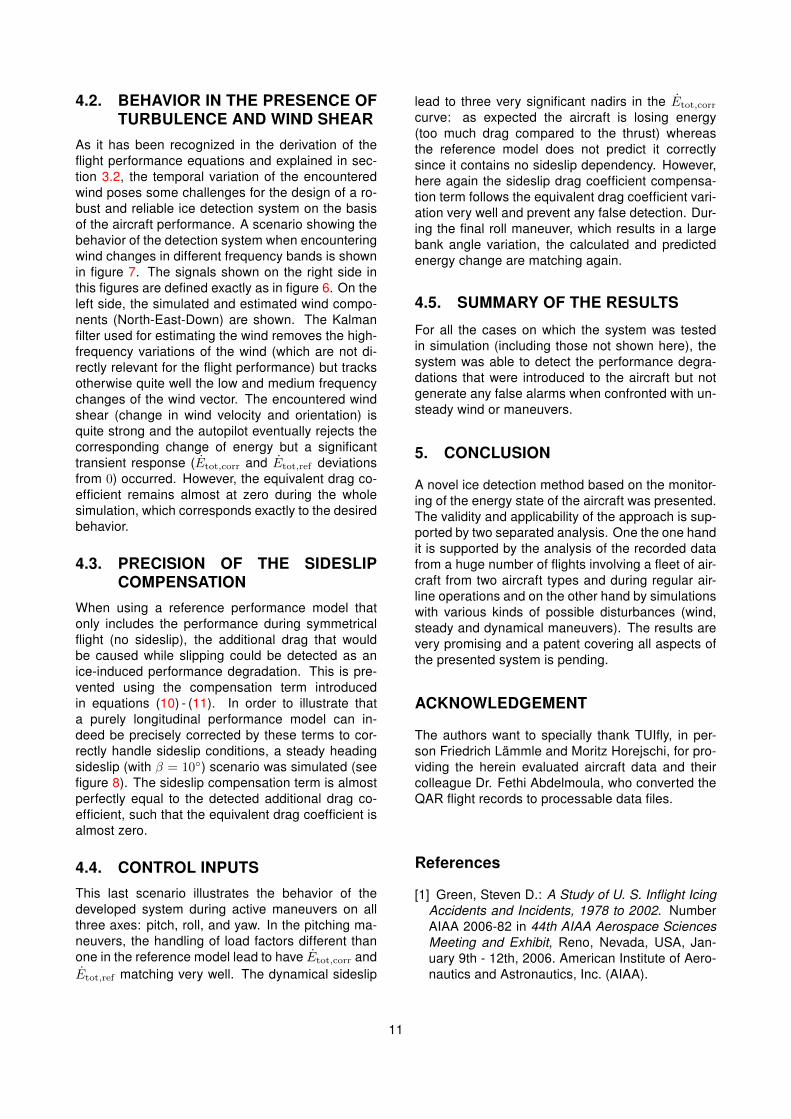
4.2. BEHAVIOR IN THE PRESENCE OFTURBULENCE AND WIND SHEAR
As it has been recognized in the derivation of theflight performance equations and explained in sec-tion 3.2, the temporal variation of the encounteredwind poses some challenges for the design of a ro-bust and reliable ice detection system on the basisof the aircraft performance. A scenario showing thebehavior of the detection system when encounteringwind changes in different frequency bands is shownin figure 7. The signals shown on the right side inthis figures are defined exactly as in figure 6. On theleft side, the simulated and estimated wind compo-nents (North-East-Down) are shown. The Kalmanfilter used for estimating the wind removes the high-frequency variations of the wind (which are not di-rectly relevant for the flight performance) but tracksotherwise quite well the low and medium frequencychanges of the wind vector. The encountered windshear (change in wind velocity and orientation) isquite strong and the autopilot eventually rejects thecorresponding change of energy but a significanttransient response (Etot,corr and Etot,ref deviationsfrom 0) occurred. However, the equivalent drag co-efficient remains almost at zero during the wholesimulation, which corresponds exactly to the desiredbehavior.
4.3. PRECISION OF THE SIDESLIPCOMPENSATION
When using a reference performance model thatonly includes the performance during symmetricalflight (no sideslip), the additional drag that wouldbe caused while slipping could be detected as anice-induced performance degradation. This is pre-vented using the compensation term introducedin equations (10) - (11). In order to illustrate thata purely longitudinal performance model can in-deed be precisely corrected by these terms to cor-rectly handle sideslip conditions, a steady headingsideslip (with β = 10◦) scenario was simulated (seefigure 8). The sideslip compensation term is almostperfectly equal to the detected additional drag co-efficient, such that the equivalent drag coefficient isalmost zero.
4.4. CONTROL INPUTS
This last scenario illustrates the behavior of thedeveloped system during active maneuvers on allthree axes: pitch, roll, and yaw. In the pitching ma-neuvers, the handling of load factors different thanone in the reference model lead to have Etot,corr andEtot,ref matching very well. The dynamical sideslip
lead to three very significant nadirs in the Etot,corr
curve: as expected the aircraft is losing energy(too much drag compared to the thrust) whereasthe reference model does not predict it correctlysince it contains no sideslip dependency. However,here again the sideslip drag coefficient compensa-tion term follows the equivalent drag coefficient vari-ation very well and prevent any false detection. Dur-ing the final roll maneuver, which results in a largebank angle variation, the calculated and predictedenergy change are matching again.
4.5. SUMMARY OF THE RESULTS
For all the cases on which the system was testedin simulation (including those not shown here), thesystem was able to detect the performance degra-dations that were introduced to the aircraft but notgenerate any false alarms when confronted with un-steady wind or maneuvers.
5. CONCLUSION
A novel ice detection method based on the monitor-ing of the energy state of the aircraft was presented.The validity and applicability of the approach is sup-ported by two separated analysis. One the one handit is supported by the analysis of the recorded datafrom a huge number of flights involving a fleet of air-craft from two aircraft types and during regular air-line operations and on the other hand by simulationswith various kinds of possible disturbances (wind,steady and dynamical maneuvers). The results arevery promising and a patent covering all aspects ofthe presented system is pending.
ACKNOWLEDGEMENT
The authors want to specially thank TUIfly, in per-son Friedrich Lämmle and Moritz Horejschi, for pro-viding the herein evaluated aircraft data and theircolleague Dr. Fethi Abdelmoula, who converted theQAR flight records to processable data files.
References
[1] Green, Steven D.: A Study of U. S. Inflight IcingAccidents and Incidents, 1978 to 2002. NumberAIAA 2006-82 in 44th AIAA Aerospace SciencesMeeting and Exhibit, Reno, Nevada, USA, Jan-uary 9th - 12th, 2006. American Institute of Aero-nautics and Astronautics, Inc. (AIAA).
11
[2] N.N., Final Report (BFU 5X011-0/98). Bun-desstelle für Flugunfalluntersuchung, April, 2001,Braunschweig, DE.
[4] Gray, Vernon H.: Prediction of aerodynamicpenalties caused by ice formations on various air-foils. Technical Note D-2166, National Aeronau-tics and Space Administration (NASA), Washing-ton, D.C., USA, February, 1964.
[5] N.N.: Ice Accretion Simulation. AGARD Advi-sory Report 344, Advisory Group for AerospaceResearch & Development (AGARD) - Fluid Dy-namics Panel Working Group 20, North AtlanticTreaty Organization (NATO), Neuilly-Sur-Seine,France, December, 1997.
[6] Broeren, Andy P.; Whalen, Edward A.; Busch,Greg T. and Bragg, Michael B.: AerodynamicSimulation of Runback Ice Accretion. Journal ofAircraft, Vol. 47, No. 3, pp. 924–939, May-June,2010.
[7] Ranuado, Richard J.; Batterson, J. G.; Reehorst,Andrew L.; Bond, T.H. and O’Mara, T. M.: De-termination Of Longitudinal Aerodynamic Deriva-tives Using Flight Data From An Icing ResearchAircraft. Number AIAA 89-0754 in 27th AIAAAerospace Science Meeting, Reno, Nevada,USA, January 9th - 12th, 1989. American Instituteof Aeronautics and Astronautics, Inc. (AIAA).
[8] Ratvasky, Thomas P. and Ranuado, Richard J.:Icing Effects on Aircraft Stability and Control De-termined from Flight Data. Preliminary Results.Number AIAA 93-0398 in 31st AIAA AerospaceScience Meeting and Exhibit, Reno, Nevada,USA, January 11th - 14th, 1993. American Insti-tute of Aeronautics and Astronautics, Inc. (AIAA).
[9] Lee, Sam; Barnhart, Billy P. and Ratvasky,Thomas P.: Dynamic Wind-Tunnel Testing of aSub-Scale Iced S-3B Viking. Number AIAA 2010-7986 in AIAA Atmospheric and Space Environ-ments Conference, Toronto, Ontario Canada, Au-gust 2th - 5th, 2010. American Institute of Aero-nautics and Astronautics, Inc. (AIAA).
[10] Gingras, David R.: Requirements and Mod-eling of In-flight Icing Effects for Flight Train-ing. Number AIAA 2013-5075 in AIAA ModelingAnd Simulation Technologies (MST) Conference,Boston, Massachusetts, USA, August 19th - 22th,
2013. American Institute of Aeronautics and As-tronautics, Inc. (AIAA).
[11] Bragg, Michael B.; Basar, Tamer; Perkins,William R.; Selig, Michael S.; Voulgaris, Pet-ros G.; Melody, James W. and Sater, Nadine B.:Smart icing systems for aircraft icing safety. 40thAIAA Aerospace Sciences Meeting and Exhibit,Reno, Nevada, USA, January 14th-17th, 2002.American Institute of Aeronautics and Astronau-tics, Inc. (AIAA).
[12] Bragg, Michael B.; Perkins, William R.; Sarter,Nadine B.; Basar, Tamer; Voulgaris, Petros G.;Gurbacki, Holly M.; Melody, James W. and Mc-Cray, Scott A.: An Interdisciplinary Approach toInflight Aircraft Icing Safety. 36th AIAA AerospaceSciences Meeting and Exhibit, Reno, Nevada,USA, January 12th - 15th, 1998. American Insti-tute of Aeronautics and Astronautics, Inc. (AIAA).
[13] Myers, Thomas T.; Klyde, David H. and Mag-daleno, Raymond E.: The Dynamic Icing Detec-tion System (DIDS). 38th AIAA Aerospace Sci-ence Meeting and Exhibit, Reno, Nevada, USA,January 10th - 13th, 1999. American Institute ofAeronautics and Astronautics, Inc. (AIAA).
[14] Melody, James W.; Basar, Tamer; Perkins,William R. and Voulgaris, Petros G.: ParameterIdentification for Inflight Detection and Character-ization of Aircraft Icing. Control Engineering Prac-tice, Vol. 8, No. 9, pp. 985–1001, September,2000.
[15] Aykan, Rahmi; Hajiyev, Chingiz and Caliskan,Fikret: Aircraft Icing Detection, Identification andReconfigurable Control Based On Kalman Filter-ing and Neural Networks. AIAA AtmosphericFlight Mechanics Conference and Exhibit, SanFrancisco, California, USA, August 15th - 18th,2005. American Institute of Aeronautics and As-tronautics, Inc. (AIAA).
[16] Gingras, David R.; Barnhart, Billy P.; Ranu-ado, Richard J.; Ratvasky, Thomas P. and Morelli,Eugene A.: Envelope Protection for In-Flight IceContamination. 47th Aerospace Science Meeting,Orlando, Florida, USA, January 5th - 8th, 2009.American Institute of Aeronautics and Astronau-tics, Inc. (AIAA).
[17] Dong, Yiqun and Ai, Jianliang: Research oninflight parameter identification and icing locationdetection of the aircraft. Aerospace Science andTechnology, Vol. 29, No. 1, pp. 305 – 312, August,2013.