NOVEL ORGANIC AMENDMENTS TO IMPROVE SOIL FERTILITY
AND PLANT NUTRITION
A Thesis Submitted to the College of
Graduate Studies and Research
In Partial Fulfillment of the Requirements
For the Degree of Master of Science
in the Department of Soil Science
University of Saskatchewan
Saskatoon, Canada
By
Jocelyn J. Stefankiw
©Copyright Jocelyn J. Stefankiw, June 2012. All rights reserved.
i
PERMISSION TO USE
In presenting this thesis in partial fulfillment of the requirements for a Postgraduate
degree from the University of Saskatchewan, I agree that the libraries of this University may
make it freely available for inspection. I further agree that permission for copying of this thesis
in any manner, in whole or in part, for scholarly purposes may be granted by the professor or
professors who supervised my thesis work or, in their absence, by the Head of the Department or
the Dean of the College in which my thesis work was done. It is understood that any copying,
publication, or use of this thesis or parts thereof for financial gain shall not be allowed without
my written permission. It is also understood that due recognition shall be given to me and to the
University of Saskatchewan in any scholarly use which may be made of any material in my
thesis.
Requests for permission to copy or to make other use of material in this thesis in whole or
part should be addressed to:
Head of the Department of Soil Science
University of Saskatchewan
51 Campus Drive
Saskatoon, Saskatchewan
S7N 5A8
ii
ABSTRACT
There is worldwide demand for organic materials that would be suitable for addition to
soils to improve fertility and thereby enhance the production of annual crops and forages. The
expansion of biofuel production worldwide has resulted in co-products from fermentation such
as distillers’ grain that, when fed to cattle, enable the nutrients used in ethanol production to be
recycled by land application of the manures. Other organic co-products from bioenergy
production include chars that are left behind from combustion. Leguminous crop residues have a
high nitrogen content compared to many other residues and could act as useful “green manures”
when added to soil. Such materials have potential as soil amendments but have not been
extensively evaluated. The overall objective of the work described in this thesis was to determine
the fertility benefits that may be realized by adding these amendments to soil. In this thesis work,
three types of novel organic amendments (dried distillers’ grains and solubles (DDGS)-fed cattle
manure, alfalfa pellets, and biochar) were evaluated for their effect on plant growth and nutrition
and soil fertility in specific, promising applications. Three studies were implemented: 1) a study
on the effect of adding different types of DDGS-fed cattle manure on canola growth and
nutrition in the growth chamber, 2) a field reclamation study with alfalfa pellets and biochar
added to disturbed soils near a potash mine, and 3) a growth-chamber study on use of biochar to
improve canola growth and the use efficiency of added fertilizer nutrients on two contrasting
Saskatchewan soils.
In the manure study, the effect of wheat and corn DDGS-fed cattle manure (fresh and
composted) on canola biomass yield, canola N, P, K, and S concentration, soil available N, P, K,
S, Cu, Zn, and the recovery of added manure N was determined. Four rates of manure (60, 120,
180, and 240 t ha-1
) were applied to two contrasting Saskatchewan soils (Brown and Black
iii
Chernozems) in controlled environment conditions, and canola was grown over a five week
period.
The reclamation study examined the effect of the addition of oat hull-based biochar and
alfalfa pellets on biomass of tall wheatgrass and the concentration of N, P, K, and S as well as on
soil concentrations of available N, P, K, S, and cation exchange capacity. Two plot areas
adjacent to the PCS Cory Potash Mine (near Saskatoon) were utilized, including one on a
degraded level area and one on a tailings pond containment berm. The amendments were applied
in the fall of 2009 and the site was seeded with tall wheatgrass (Thinopyrum elongatum) in the
spring of 2010. Plants were harvested from one m2 areas in each plot in the fall of 2010 and the
soil in each plot was sampled in the spring and fall of 2010.
The evaluation of biochar to improve plant growth and recovery of fertilizer nutrient was
conducted in the growth chamber using biochar derived from willow feedstock. The willow
biochar was added at 5, 10, and 20 t ha-1
rates alone, and also a treatment with biochar at 10 t ha-1
with urea and superphosphate fertilizer. The plant N, P, K, and S concentration, soil N, P, K, and
S, and N recovery by canola were analyzed following a five-week growth period of canola on
Brown and Black Chernozem soils.
In the DDGS-fed manure study, the wheat-based DDGS-fed composted cattle manure
added the most nutrient per unit weight of added manure of the different manure sources
evaluated. Distillers grain fed cattle manure is higher in nutrient content than regular grain ration
manure. The composting process further increases the concentration of nutrient ions in the
manure and toxicity effects were observed at high rates of application (180 and 240 t ha-1
). In the
reclamation field trial, there was increased biomass of tall wheatgrass on soil amended with
alfalfa pellets that is attributed to increased soil N availability, as also shown in increased soil
iv
nitrate contents. The biochar treatment on the berm resulted in increased soil organic carbon
(SOC) contents. Biochar added to two Saskatchewan agricultural soils under controlled
environment conditions revealed no significant effect of biochar, without or with fertilizer, on
the canola yield, nutrient concentration, or fertilizer N recovery by canola grown on the two
soils.
All three types of organic amendments studied have different characteristics and potential
for enhancing soil fertility, plant growth, and nutrition. Manure feed-source (such as wheat or
corn DDGS) and processing (composting) all must be considered when determining rates of
application for maximizing plant growth and nutrition in the first year following application.
Including DDGS in the ration followed by composting will increase the nutrient concentration in
the manure per unit weight, necessitating lower application rates of manure product. Alfalfa
pellets provide a slow release fertilizer that can be beneficial in increasing plant growth in
reclamation of disturbed soils. Biochar appears to have relatively little impact on plant growth
and nutrient recovery in the year of application. Further field-scale research on the application of
these amendments is required to determine the long-term effects on plant growth and nutrition.
v
ACKNOWLEDGEMENTS
I would like to acknowledge a number of people for their support and assistance in this
project. I would like to thank my co-supervisors, Dr. Jeff Schoenau and Dr. Richard Farrell, for
their guidance and advice along the research process. I am very appreciative of the mentorship
and committed time and effort that I have received along this process from Dr. Schoenau. My
advisory committee, including Dr. Derek Peak and Dr. Diane Knight, has also provided guidance
and different viewpoints for my project. I would like to thank Cory Fatteicher who has assisted
in my learning of many soil and plant analysis procedures in the laboratory as well as provided a
helping hand and words of encouragement when required. I would like to extend a heartfelt
thank-you to Jesse, my mother and father, and all of my family and friends for providing support,
understanding, and encouragement throughout the whole process.
I would like to thank the Agriculture Development Fund, the Beef Cattle Research Fund,
and the Saskatchewan Potash Producers Association environmental group for financial
assistance. Thank-you also to Dr. Xiying Hao with the Agriculture and Agri-Food Canada
Research Centre in Lethbridge, Alberta for her support in supplying the manure.
vi
TABLE OF CONTENTS
PERMISSION TO USE ............................................................................................................ i
ABSTRACT.............................................................................................................................. ii
ACKNOWLEDGEMENTS ......................................................................................................v
TABLE OF CONTENTS ........................................................................................................ vi
LIST OF TABLES ................................................................................................................ viii
LIST OF FIGURES ..................................................................................................................x
LIST OF SYMBOLS AND ABBREVIATIONS .................................................................... xv
1.0 INTRODUCTION ..........................................................................................................1
2.0 LITERATURE REVIEW ..............................................................................................5 2.1 Soils and organic amendments ......................................................................................5 2.2 Novel organic amendments ...........................................................................................7
2.2.1 Dried distillers’ grains and solubles-fed cattle manure and compost .......................8 2.2.2 Alfalfa pellets ...................................................................................................... 12
2.2.3 Biochar ................................................................................................................ 14
3.0 BEHAVIOR OF DIFFERENT DDGS-FED FRESH AND COMPOSTED CATTLE
MANURES .............................................................................................................................. 17 3.1 Introduction ................................................................................................................ 17 3.2 Materials and methods ................................................................................................ 21
3.2.1 Pot study protocol ................................................................................................ 21 3.2.2 Manure amendments ............................................................................................ 25
3.2.3 Soil lab analysis ................................................................................................... 26 3.2.4 Plant analyses ...................................................................................................... 28
3.2.5 Statistical analysis ................................................................................................ 29 3.3 Results and discussion................................................................................................. 29
3.3.1 Manure characteristics ......................................................................................... 29 3.3.2 Canola plant biomass yield................................................................................... 32
3.3.3 Manure nitrogen recovery .................................................................................... 35 3.3.4 Canola P, K, and S ............................................................................................... 39
3.3.5 Soil cations and anions ......................................................................................... 41 3.3.6 Soil pH, salinity, and organic carbon .................................................................... 44
3.4 Conclusion .................................................................................................................. 48
4.0 APPLICATION OF ALFALFA PELLETS AND BIOCHAR TO RECLAIM
PRODUCTIVITY OF A DISTURBED SOIL ........................................................................ 51 4.1 Introduction ................................................................................................................ 51
vii
4.2 Materials and Methods ................................................................................................ 53 4.2.1 Site selection ........................................................................................................ 53
4.2.2 Plot design ........................................................................................................... 55 4.2.3 Field operations ................................................................................................... 57
4.2.4 Soil analysis ......................................................................................................... 58 4.2.5 Plant analysis ....................................................................................................... 60
4.2.6 Statistical analysis ................................................................................................ 61 4.3 Results and Discussion ................................................................................................ 61
4.3.1 Degraded area soil properties ............................................................................... 61 4.3.2 Berm area soil properties...................................................................................... 66
4.3.3 Fall 2010 plant harvest ......................................................................................... 69 4.4 Conclusion .................................................................................................................. 72
5.0 AMENDMENT OF TWO AGRICULTURAL SOILS WITH BIOCHAR TO
IMPROVE PLANT NUTRITION AND FERTILIZER USE EFFICIENCY ...................... 74 5.1 Introduction ................................................................................................................ 74
5.2 Materials and methods ................................................................................................ 77 5.2.1 Treatment properties ............................................................................................ 77
5.2.2 Biochar properties ................................................................................................ 80 5.2.3 Soil analysis ......................................................................................................... 82
5.2.4 Plant analysis ....................................................................................................... 83 5.2.5 Statistical analysis ................................................................................................ 83
5.3 Results and discussion................................................................................................. 83 5.3.1 Canola nutrient concentration ............................................................................... 85
5.3.2 Soil results ........................................................................................................... 86 5.4 Conclusion .................................................................................................................. 90
6.0 GENERAL DISCUSSION AND CONCLUSIONS ..................................................... 92
7.0 REFERENCES ............................................................................................................. 96
APPENDIX A: BEHAVIOR OF DDGS TRITICALE FRESH MANURE AND BARLEY-
FED FRESH MANURE ........................................................................................................ 108
APPENDIX B: FIELD DATA .............................................................................................. 118
APPENDIX C: BIOCHAR GROWTH CHAMBER STUDY ............................................. 133
viii
LIST OF TABLES
Table 2.1 Nutrient content of manure from wheat dried distillers’ grains and solubles
(DDGS)-fed cattle at four different DDGS diet rations. The rations consisted of 5%
mineral supplements, 10% barley silage, and 85% grain. The DDGS was substituted for part
of the grain in the ration (adapted from Hao et al., 2009). .....................................................9
Table 3.1 Soil properties of initial soils used in the growth chamber studies collected in the
fall of 2009. ....................................................................................................................... 22
Table 3.2 Rate of manure addition on a weight basis and corresponding N, P, and K rates for
dried distillers’ grains and solubles (DDGS) wheat fresh and composted and DDGS corn
fresh and composted manure treatments. ............................................................................ 24
Table 3.3 Cattle diet for the dried distillers’ grains and solubles (DDGS)-fed cattle manure
trials. ................................................................................................................................ 25
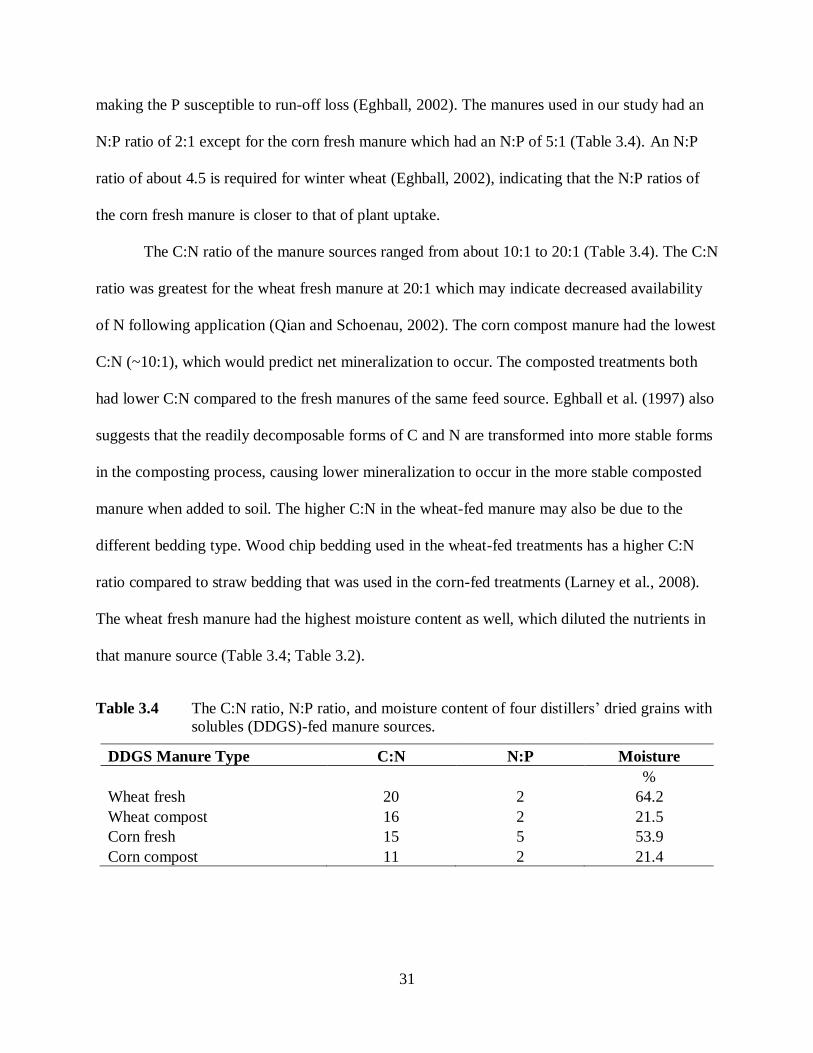
Table 3.4 The C:N ratio, N:P ratio, and moisture content of four distillers’ dried grains with
solubles (DDGS)-fed manure sources. ................................................................................ 31
Table 3.5 Mean dry canola total N, P, K and S content for dried distillers’ grains and solubles
(DDGS) wheat fresh and composted, and DDGS corn fresh and composted treatments at 0,
30, 60, 90, and 120 g kg-1
rates on the Brown soil. ............................................................. 36
Table 3.6 Mean dry canola total N, P, K and S content for dried distillers’ grains and solubles
(DDGS) wheat fresh and composted, and DDGS corn fresh and composted treatments at 0,
30, 60, 90, and 120 g kg-1
rates on the Black soil. ............................................................... 37
Table 3.7 Mean N recovery (nitrogen uptake efficiency) for dried distillers’ grains and
solubles (DDGS) wheat fresh and composted, and DDGS corn fresh and composted
treatments at 30, 60, 90, and 120 g kg-1
rates on the Brown and Black soils. ....................... 38
Table 3.8 Mean soil available NO3-N and NH4-N concentration for DDGS wheat fresh and
composted and DDGS corn fresh and composted manure treatments at 0, 30, 60, 90, and
120 g kg-1
rates on the Brown and Black soils. ................................................................... 40
Table 3.9 Mean soil K, PO4-P, SO4-S and extractable Cu and Zn concentration for dried
distillers’ grains and solubles (DDGS) wheat fresh and composted and DDGS corn fresh and
composted manure treatments at 0, 30, 60, 90, and 120 g kg-1
rates on the Brown soil. ....... 43
Table 3.10 Mean soil K, PO4-P and SO4-S, Cu, and Zn concentration for dried distillers’grains
and solubles (DDGS) wheat fresh and composted and DDGS corn fresh and composted
manure treatments at 0, 30, 60, 90, and 120 g kg-1
rates on the Black soil. .......................... 44
Table 3.11 Mean soil pH for dried distillers’ grains and solubles (DDGS) wheat fresh and
composted and DDGS corn fresh and composted manure treatments at 0, 30, 60, 90, and 120
g kg-1
rates on the Brown and Black soils. .......................................................................... 46
Table 4.1 Soil amendments and application rates used at the PCS–Cory Division site†. ........... 56
Table 4.2 Chemical properties of the oat hull biochar and alfalfa pellets applied at the PCS–
Cory Division site. ............................................................................................................. 57
Table 4.3 Soil pH, electrical conductivity (EC), cation exchange capacity (CEC), and organic
carbon (OC) concentration on the Degraded area for all six treatments. (AP5 = alfalfa pellets
at 5 t ha-1
; AP10 = alfalfa pellets at 10 t ha-1
; AP20-alfalfa pellets at 20 t ha-1
; B5 = biochar
at 5 t ha; B5u =biochar at 5 t ha-1
plus urea at 50 kg N ha-1
). Soil samples were taken in the
spring of 2010 at the 0–15 cm depth. .................................................................................. 62
ix
Table 4.4 Soil pH, electrical conductivity (EC), cation exchange capacity (CEC), and organic
carbon (OC) concentration on the Degraded area for all six treatments. (AP5 = alfalfa pellets
at 5 t ha-1
; AP10 = alfalfa pellets at 10 t ha-1
; AP20-alfalfa pellets at 20 t ha-1
; B5 = biochar
at 5 t ha; B5u = biochar at 5 t ha-1
plus urea at 50 kg N ha-1
). Soil samples were taken in the
fall of 2010 at the 0–15 cm depth. ...................................................................................... 63
Table 4.5 Soil NO3, NH4, PO4, SO4, and K (Kelowna extractable) concentration on the
Degraded area for all six treatments. (AP5 = alfalfa pellets at 5 t ha-1
; AP10 = alfalfa pellets
at 10 t ha-1
; AP20-alfalfa pellets at 20 t ha-1
; B5 = biochar at 5 t ha-1
; B5u = biochar at 5 t ha-
1 plus urea at 50 kg N ha
-1). Soil samples were taken in the spring of 2010 at the 0–15 cm
depth. ................................................................................................................................ 64
Table 4.6 Soil NO3, NH4, PO4, SO4, and K (Kelowna extractable) concentration on the
Degraded area for all six treatments. (AP5 = alfalfa pellets at 5 t ha-1
; AP10 = alfalfa pellets
at 10 t ha-1
; AP20 = alfalfa pellets at 20 t ha-1
; B5 = biochar at 5 t ha-1
; B5u = biochar at 5 t
ha-1
plus urea at 50 kg N ha-1
). Soil samples were taken in the fall of 2010 at the 0–15 cm
depth. ................................................................................................................................ 64
Table 4.7 Soil pH, electrical conductivity (EC), cation exchange capacity (CEC), and organic
carbon (OC) concentration on the Berm for all three treatments. (AP5=alfalfa pellets at 5 t
ha-1; B5=biochar at 5 t ha-1). Soil samples were taken in the spring of 2010 at the 0-15 cm
depth. ................................................................................................................................ 66
Table 4.8 Soil pH, electrical conductivity (EC), cation exchange capacity (CEC), and organic
carbon (OC) concentration on the Berm for all three treatments. (AP5=alfalfa pellets at 5 t
ha-1
; B5=biochar at 5 t ha-1
). Soil samples were taken in the fall of 2010 at the 0-15 cm
depth. ................................................................................................................................ 67
Table 4.9 Soil NO3, NH4, PO4, SO4, and K (Kelowna extractable) concentration on the Berm
for all three treatments. (AP5 = alfalfa pellets at 5t ha-1
; B5 = biochar at 5 t ha-1
). Soil
samples were taken in the spring of 2010 at the 0–15 cm depth. ......................................... 68
Table 4.10 Soil NO3, NH4, PO4, SO4, and K (Kelowna extractable) concentration on the Berm
for all three treatments. (AP5 = alfalfa pellets at 5 t ha-1
; B5 = biochar at 5 t ha-1
). Soil
samples were taken in the fall of 2010 at the 0–15 cm depth. .............................................. 68
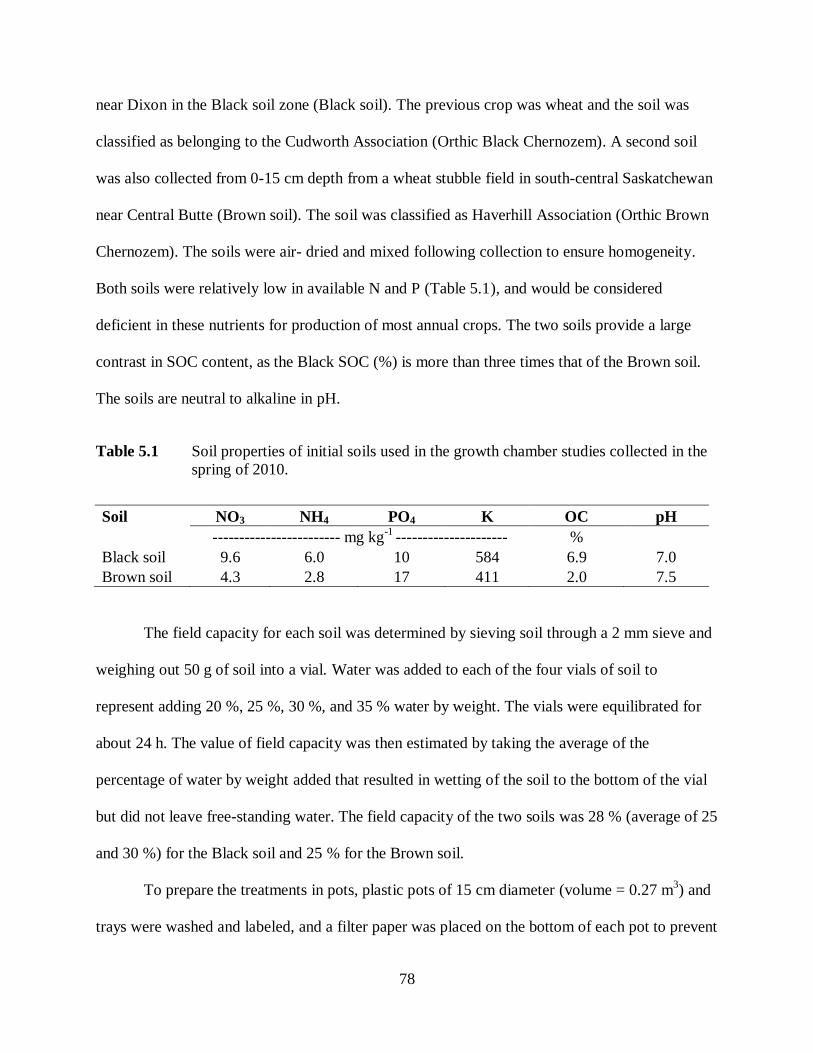
Table 5.1 Soil properties of initial soils used in the growth chamber studies collected in the
spring of 2010. ................................................................................................................... 78
Table 5.2 Rates of biochar and the relative N rates added (biochar N + fertilizer N) for each
treatment on the Black and Brown soils.............................................................................. 80
Table 5.3 Properties of the two biochars that were used in the thesis research. (P=total P from
acid digest, C, N, and S are from analysis on the Leco C, N, and S analyzer). .................... 81
Table 5.4 Mean canola dry matter canola P and K concentration for willow biochar at 5, 10,
and 20 t ha-1
, biochar (10 t ha-1
) plus fertilizer, fertilizer and control treatments on the Brown
soil. ................................................................................................................................ 86
Table 5.5 Mean canola dry matter canola P and K concentration for willow biochar at 5, 10,
and 20 t ha-1
, biochar (10 t ha-1
) plus fertilizer, fertilizer and control treatments on the Black
soil. ................................................................................................................................ 86
Table 5.6 Mean soil pH, soil organic carbon (SOC), and available NO3-N, NH4-N, and PO4- P
concentration for willow biochar added at 5, 10, and 20 t ha-1
, biochar (10 t ha-1
) plus
fertilizer, fertilizer, and control treatments on the Brown soil. ............................................ 87
x
Table 5.7 Mean soil pH, soil organic carbon (SOC), and available NO3-N, NH4-N, and PO4- P
concentration for willow biochar added at 5, 10, and 20 t ha-1
, biochar (10 t ha-1
) plus
fertilizer, fertilizer and control treatments on the Black soil. ............................................... 87
Table 5.8 Mean N recovery by canola plants for willow biochar added at 5, 10, and 20 t ha-1
,
willow biochar (10 t ha-1
) plus fertilizer, fertilizer alone, and control treatments on the
Brown and Black soils. ...................................................................................................... 89
APPENDIX A
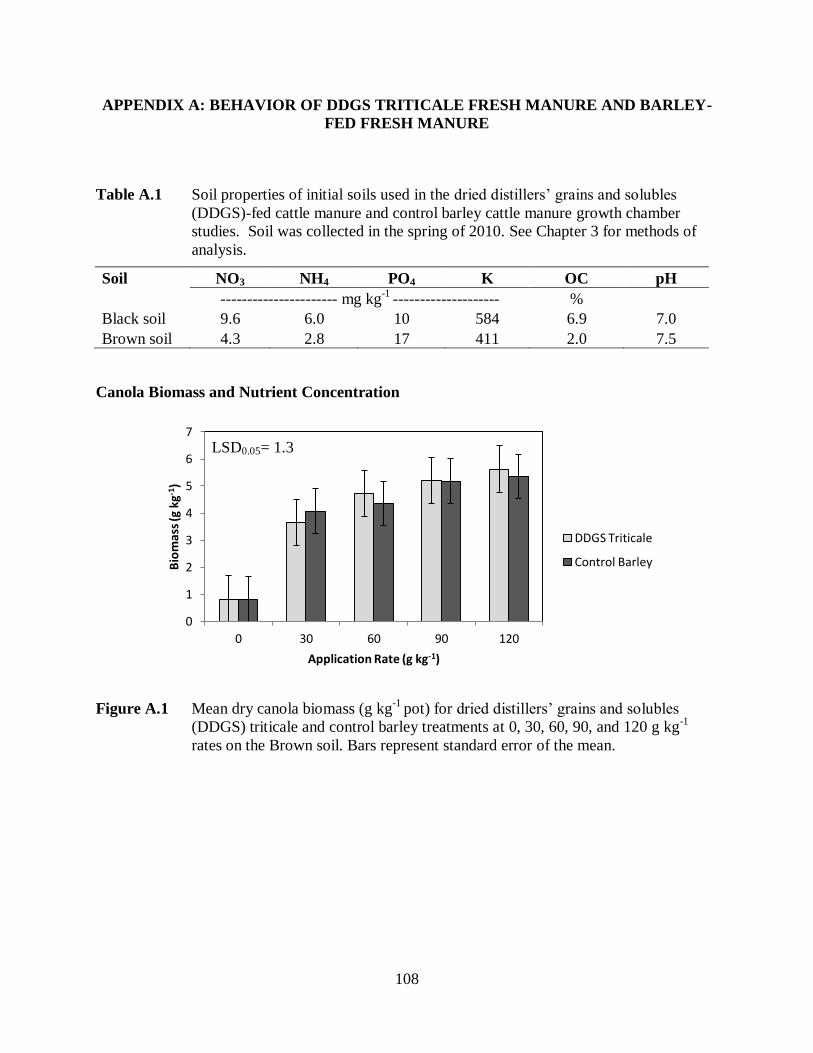
Table A.1 Soil properties of initial soils used in the dried distillers’ grains and solubles
(DDGS)-fed cattle manure and control barley cattle manure growth chamber studies. Soil
was collected in the spring of 2010. See Chapter 3 for methods of analysis. ....................... 18
Table A.2 Mean N recovery for dried distillers’ grains and solubles (DDGS) triticale manure
and control barley manure treatments at 0, 30, 60, 90, and 120 g kg-1
rates on the Black soil.
.......................................................................................................................... 110
Table A.3 Mean dry plant K, S, Cu, and Zn concentration for dried distillers’ grains and
solubles (DDGS) triticale manure and control barley manure treatments at 0, 30, 60, 90, and
120 g kg-1
rates on the Brown soil. ................................................................................... 112
Table A.4 Mean dry plant K, S, Cu, and Zn concentration for dried distillers’ grains and
solubles (DDGS) triticale and control barley treatments at 0, 30, 60, 90, and 120 g kg-1
rates
on the Black soil. ............................................................................................................. 112
Table A.5 Mean soil electrical conductivity (EC), pH, and soil organic carbon (SOC)
concentration for dried distillers’ grains and solubles (DDGS) triticale and barley control
manure treatments at 0, 30, 60, 90, and 120 g kg-1
rates on the Brown soil. ...................... 116
Table A.6 Mean soil electrical conductivity (EC), pH, and soil organic carbon (SOC) for
DDGS triticale and control barley treatments at 0, 30, 60, 90, and 120 g kg-1
rates on the
Black soil. ........................................................................................................................ 116
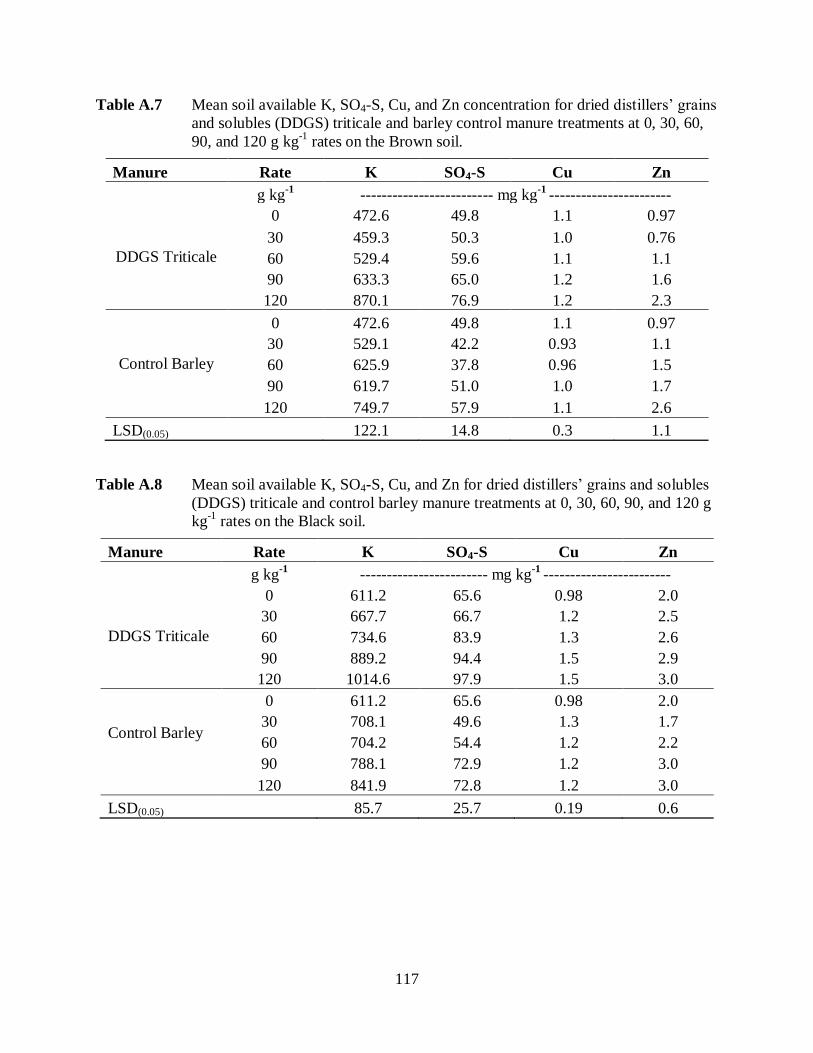
Table A.7 Mean soil available K, SO4-S, Cu, and Zn concentration for dried distillers’ grains
and solubles (DDGS) triticale and barley control manure treatments at 0, 30, 60, 90, and 120
g kg-1
rates on the Brown soil. .......................................................................................... 117
Table A.8 Mean soil available K, SO4-S, Cu, and Zn for dried distillers’ grains and solubles
(DDGS) triticale and control barley manure treatments at 0, 30, 60, 90, and 120 g kg-1
rates
on the Black soil. ............................................................................................................. 117
APPENDIX B
Table B.1 Properties of oat hull-based biochar used in field study. Data analysis from ALS
Laboratories. .................................................................................................................... 118
Table B.2 Initial soil properties in the fall of 2009 in the control plots for the Degraded area
and the Berm area taken at two depth ranges. ................................................................... 118
Table B.3 Initial soil nutrient concentrations in the fall of 2009 in the control plots for the
Degraded area and the Berm area taken at two depth ranges. ............................................ 119
Table B.4 Soil pH, electrical conductivity (EC), cation exchange capacity (CEC), and
organic carbon (OC) concentration on the Degraded area for all six treatments.
(AP5=alfalfa pellets at 5 t ha-1
; AP10= alfalfa pellets at 10 t ha-1
; AP20=alfalfa pellets at
20 t ha-1
; B5=biochar at 5 t ha; B5u=biochar at 5 t ha-1
plus urea at 50 kg N ha-1
). Soil
samples were taken in the spring of 2010 at the 15-30 and 30-60 cm depths. .................... 120
xi
Table B.5 Soil pH, electrical conductivity (EC), cation exchange capacity (CEC), and
organic carbon (OC) concentration on the Degraded area for all six treatments.
(AP5=alfalfa pellets at 5 t ha-1
; AP10= alfalfa pellets at 10 t ha-1
; AP20=alfalfa pellets at
20 t ha-1
; B5=biochar at 5 t ha; B5u=biochar at 5 t ha-1
plus urea at 50 kg N ha-1
). Soil
samples were taken in the fall of 2010 at the 15-30 and 30-60 cm depths....................... 120
Table B.6 Soil NO3, NH4, PO4, SO4, and K (Kelowna extractable) concentration on the
Degraded area for all six treatments. (AP5=alfalfa pellets at 5 t ha-1
; AP10= alfalfa pellets at
10 t ha-1
; AP20=alfalfa pellets at 20 t ha-1
; B5=biochar at 5 t ha-1
; B5u=biochar at 5 t ha-1
plus urea at 50 kg N ha-1
). Soil samples were taken in the spring of 2010 at the 15-30 and
30-60 cm depths. .............................................................................................................. 121
Table B.7 Soil NO3, NH4, PO4, SO4, and K (Kelowna extractable) concentration on the
Degraded area for all six treatments. (AP5=alfalfa pellets at 5 t ha-1
; AP10= alfalfa pellets at
10 t ha-1
; AP20=alfalfa pellets at 20 t ha-1
; B5=biochar at 5 t ha-1
; B5u=biochar at 5 t ha-1
plus urea at 50 kg N ha-1
). Soil samples were taken in the fall of 2010 at the 15-30 and 30-60
cm depths. ........................................................................................................................ 121
Table B.8 Mean cations and the calculated soil cation exchange capacity (CEC) on the
degraded area for all six treatments. (AP5=alfalfa pellets at 5 t ha-1
; AP10= alfalfa pellets at
10 t ha-1
; AP20=alfalfa pellets at 20 t ha-1
; B5=biochar at 5 t ha-1
; B5u=biochar at 5 t ha-1
plus urea at 50 kg N ha-1
). Soil samples were taken in the spring of 2010 at the 0-15, 15-30,
and 30-60 cm depths. ....................................................................................................... 122
Table B.9 Mean cations and the calculated soil cation exchange capacity (CEC) on the
degraded area for all six treatments. (AP5=alfalfa pellets at 5 t ha-1
; AP10= alfalfa pellets at
10 t ha-1
; AP20=alfalfa pellets at 20 t ha-1
; B5=biochar at 5 t ha-1
; B5u=biochar at 5 t ha-1
plus urea at 50 kg N ha-1
). Soil samples were taken in the fall of 2010 at the 0-15, 15-30, and
30-60 cm depths. .............................................................................................................. 123
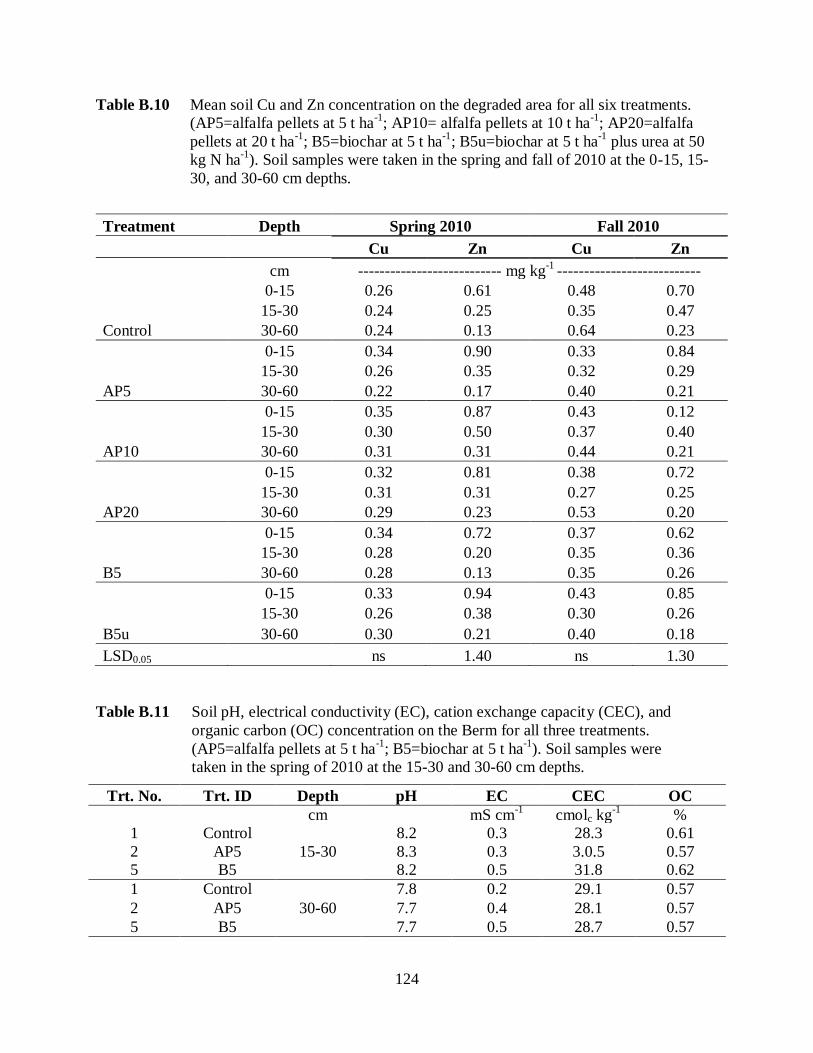
Table B.10 Mean soil Cu and Zn concentration on the degraded area for all six treatments.
(AP5=alfalfa pellets at 5 t ha-1
; AP10= alfalfa pellets at 10 t ha-1
; AP20=alfalfa pellets at 20 t
ha-1
; B5=biochar at 5 t ha-1
; B5u=biochar at 5 t ha-1
plus urea at 50 kg N ha-1
). Soil samples
were taken in the spring and fall of 2010 at the 0-15, 15-30, and 30-60 cm depths. ........... 124
Table B.11 Soil pH, electrical conductivity (EC), cation exchange capacity (CEC), and
organic carbon (OC) concentration on the Berm for all three treatments. (AP5=alfalfa pellets
at 5 t ha-1
; B5=biochar at 5 t ha-1
). Soil samples were taken in the spring of 2010 at the 15-30
and 30-60 cm depths. ....................................................................................................... 124
Table B.12 Soil pH, electrical conductivity (EC), cation exchange capacity (CEC), and
organic carbon (OC) concentration on the Berm for all three treatments. (AP5=alfalfa pellets
at 5 t ha-1
; B5=biochar at 5 t ha-1
). Soil samples were taken in the fall of 2010 at the 15-30
and 30-60 cm depths. ....................................................................................................... 125
Table B.13 Soil NO3-N, NH4-N, PO4-P, SO4-S, and K (Kelowna extractable) concentration
on the Berm for all three treatments. (AP5=alfalfa pellets at 5 t ha-1
; B5=biochar at 5 t ha-1
).
Soil samples were taken in the spring of 2010 at the 15-30 and 30-60 cm depth. .............. 125
Table B.14 Soil NO3-N, NH4-N, PO4-P, SO4-S, and K (Kelowna extractable) concentration
on the Berm for all three treatments. (AP5=alfalfa pellets at 5 t ha-1
; B5=biochar at 5 t ha-1
).
Soil samples were taken in the fall of 2010 at the 15-30 and 30-60 cm depth. ................... 125
Table B.15 Mean soil cation concentrations and soil cation exchange capacity (CEC) on the
Berm area for alfalfa (5 t ha-1
), biochar (5 t ha-1
) and control at three depth ranges in the
spring of 2010. ................................................................................................................. 126
xii
Table B.16 Soil cation exchange capacity (CEC) as a total of mean base cations on the Berm
area for alfalfa (5 t ha-1
), biochar (5 t ha-1
) and control at three depth ranges in the fall of
2010. .......................................................................................................................... 126
Table B.17 Mean soil Cu and Zn concentration on the Berm for all three treatments.
(AP5=alfalfa pellets at 5 t ha-1
; B5=biochar at 5 t ha-1
). Soil samples were taken in the spring
and fall of 2010 at the 0-15, 15-30, and 30-60 cm depths. ................................................. 127
Table B.18 Plant species and plant growth observations (fall of 2010) for treatments: control,
alfalfa at 5, 10, and 20 t ha-1
, biochar at 5 t ha-1
, and biochar (5 t ha-1
) + urea. Plots 1 to 24
were on the Degraded area while plots 25 to 36 were on the Berm area. ........................... 128
Table B.19 Plant species and plant growth observations (fall of 2010) for treatments on the
berm area.(control, alfalfa at 5 t ha-1
, and biochar at 5 t ha-1
. ............................................ 129
APPENDIX C
Table C.1 Mean canola Cu and Zn concentration for willow biochar at 5, 10, and 20 t ha-1,
biochar (10 t ha-1) plus fertilizer, fertilizer and control treatments on the Brown soil. ...... 133
Table C.2 Mean canola Cu and Zn concentration for willow biochar at 5, 10, and 20 t ha-1
,
biochar (10 t ha-1
) plus fertilizer, fertilizer and control treatments on the Black soil. ......... 134
Table C.3 Mean electrical conductivity (EC) and soil extractable Cu and Zn for biochar at 5,
10, and 20 t ha-1
, biochar (10 t ha-1
) plus fertilizer, fertilizer and control treatments on the
Brown soil. ...................................................................................................................... 134
Table C.4 Mean electrical conductivity (EC) and soil extractable Cu and Zn for willow
biochar at 5, 10, and 20 t ha-1
, biochar (10 t ha-1
) plus fertilizer, fertilizer and control
treatments on the Black soil. ............................................................................................ 134
LIST OF FIGURES
Figure 1.1 Project flow chart outlining studies on alfalfa pellets, biochar, and DDGS-fed cattle
manure. ................................................................................................................................4
Figure 3.1 N, P, K, and S concentration of four distillers’ grains and solubles (DDGS) manure
sources used in the growth chamber studies. Bars represent standard error of the mean. .. 30
Figure 3.2 Mean dry biomass for canola grown on a Brown soil amended with manure from
cattle fed wheat-based dried distillers’ grains and solubles (DDGS) (fresh and composted)
and corn-based DDGS (fresh and composted) manure treatments at 0, 30, 60, 90, and 120 g
kg-1
rates. Bars represent standard error of the mean. .......................................................... 33
Figure 3.3 Mean dry biomass for canola grown on a Black soil amended with manure from
cattle fed wheat-based dried distillers’ grains and solubles (DDGS) (fresh and composted)
and corn-based DDGS (fresh and composted) manure treatments at 0, 30, 60, 90, and 120 g
kg-1
rates. Bars represent standard error of the mean. .......................................................... 33
Figure 3.4 Mean soil electrical conductivity (EC) and soil organic carbon (SOC) for dried
distillers’ grains and solubles (DDGS) wheat fresh and composted and DDGS corn fresh
and composted manure treatments at 0, 30, 60, 90, and 120 g kg-1
rates on the Brown soil.
................................................................................................................................ 47
Figure 3.5 Mean soil electrical conductivity (EC) and soil organic carbon (SOC) content for
dried distillers’ grains and solubles (DDGS) wheat fresh and composted and DDGS corn
xiii
fresh and composted manure treatments at 0, 30, 60, 90, and 120 g kg-1
rates on the Black
soil. ................................................................................................................................ 48
Figure 4.1 Southwest facing photographs of the experimental plots in the (A) Degraded area and
(B) the Berm area in the fall of 2009. ................................................................................. 54
Figure 4.2 Diagram of the experimental plots in (A) the Degraded area adjacent to berm and (B)
the Berm area itself. The field plots were located at the PCS–Cory Division site. ............... 55
Figure 4.3 Plant biomass of vegetation (predominantly grass) collected from the Berm area plots
in the fall of 2010. .............................................................................................................. 70
Figure 4.4 Plant total N concentration (mg N kg-1
of dry plant matter) from plots on the Berm
area in the fall of 2010. Error bars represent standard error of the mean.............................. 70
Figure 4.5 Plant total P concentration (mg kg-1
dry plant material) from plots on the Berm area in
the fall of 2010. Bars represent standard error of the mean. ................................................ 71
Figure 5.1 Oat hull biochar (A) and willow biochar (B). ........................................................... 82
Figure 5.2 Mean canola dry matter biomass for willow biochar added at 5, 10, and 20 t ha-1
,
biochar (10 t ha-1
) plus N and P fertilizer, fertilizer and control treatments on the Brown
soil. ................................................................................................................................ 84
Figure 5.3 Mean canola dry matter biomass for willow biochar added at 5, 10, and 20 t ha-1
,
biochar (10 t ha-1
) plus N and P fertilizer, fertilizer and control treatments on the Black
soil. ................................................................................................................................ 85
APPENDIX A
Figure A.1 Mean dry canola biomass (g kg-1
pot) for dried distillers’ grains and solubles
(DDGS) triticale and control barley treatments at 0, 30, 60, 90, and 120 g kg-1
rates on the
Brown soil. Bars represent standard error of the mean. ..................................................... 108
Figure A.2 Mean dry plant biomass for distillers’ grains and solubles (DDGS) triticale and
barley control manure treatments at 0, 30, 60, 90, and 120 g kg-1
rates on the Black soil.
Bars represent standard error of the mean. ........................................................................ 109
Figure A.3 Mean dry plant N concentration for DDGS triticale and control barley treatments
at 0, 30, 60, 90, and 120 g kg-1
rates on the Brown soil. Bars represent standard error of the
mean. .......................................................................................................................... 110
Figure A.4 Mean dry plant N concentration for distillers’ grains and solubles (DDGS)
triticale and barley control manure treatments at 0, 30, 60, 90, and 120 g kg-1
rates on the
Black soil. Bars represent standard error of the mean. ...................................................... 110
Figure A.5 Mean dry canola P concentration for distillers’ grains and solubles (DDGS)
triticale manure and control barley manure treatments at 0, 30, 60, 90, and 120 g kg-1
rates
on the Brown soil. Bars represent standard error of the mean. .......................................... 111
Figure A.6 Mean dry plant P concentration for DDGS triticale and control barley treatments
at 0, 30, 60, 90, and 120 g kg-1
rates on the Black soil. Bars represent standard error of the
mean. .......................................................................................................................... 112
Figure A.7 Mean soil available NO3 for distillers’ grains and solubles (DDGS) triticale and
control barley manure treatments at 0, 30, 60, 90, and 120 g kg-1
rates on the Brown soil.
Bars represent standard error of the mean. ........................................................................ 112
Figure A.8 Mean soil NO3 concentration for DDGS triticale and control barley treatments at
0, 30, 60, 90, and 120 g kg-1
rates on the Black soil. Bars represent standard error of the
mean. .......................................................................................................................... 113
xiv
Figure A.9 Mean soil NH4 concentration for dried distillers’ grains and solubles (DDGS)
triticale and barley control manure treatments at 0, 30, 60, 90, and 120 g kg-1
rate on the
Brown soil. Bars represent standard error of the mean. ..................................................... 113
Figure A.10 Mean soil NH4 for dried distillers’ grains and solubles (DDGS) triticale and
control barley treatments at 0, 30, 60, 90, and 120 g kg-1
rates on the Black soil. Bars
represent standard error of the mean. ................................................................................ 113
Figure A.11 Mean soil PO4 concentration for dried distillers’ grains and solubles (DDGS)
triticale and barley control manure treatments at 0, 30, 60, 90, and 120 g kg-1 rates on the
Brown soil. Bars represent standard error of the mean. ..................................................... 115
Figure A.12 Mean soil PO4 concentration for dried distillers’ grains and solubles (DDGS)
triticale and control barley treatments at 0, 30, 60, 90, and 120 g kg-1
rates on the Black soil.
Bars represent standard error of the mean. ........................................................................ 115
APPENDIX B
Figure B.1 Plant biomass on the Degraded are in the fall of 2010 for six treatments.
(AP5=alfalfa pellets at 5 t ha-1
; AP10= alfalfa pellets at 10 t ha-1
; AP20=alfalfa pellets at 20 t
ha-1
; B5=biochar at 5 t ha; B5u=biochar at 5 t ha-1
plus urea at 50 kg N ha-1
) .................... 119
Figure B.2 Adding amendments in the spring of 2010 by hand spreading and raking into the
tilled surface soil. ............................................................................................................. 129
Figure B.3 Site visit on June 2010 (A) and site visit in July 2010 (B) showed Berm area that
was vegetating unevenly with a variety of species. Both photos are facing west. .............. 130
Figure B.4 Site visit in June 2010 showed plots on the Degraded area to show differences,
although there was a diversity of plant species (facing southwest). ................................... 130
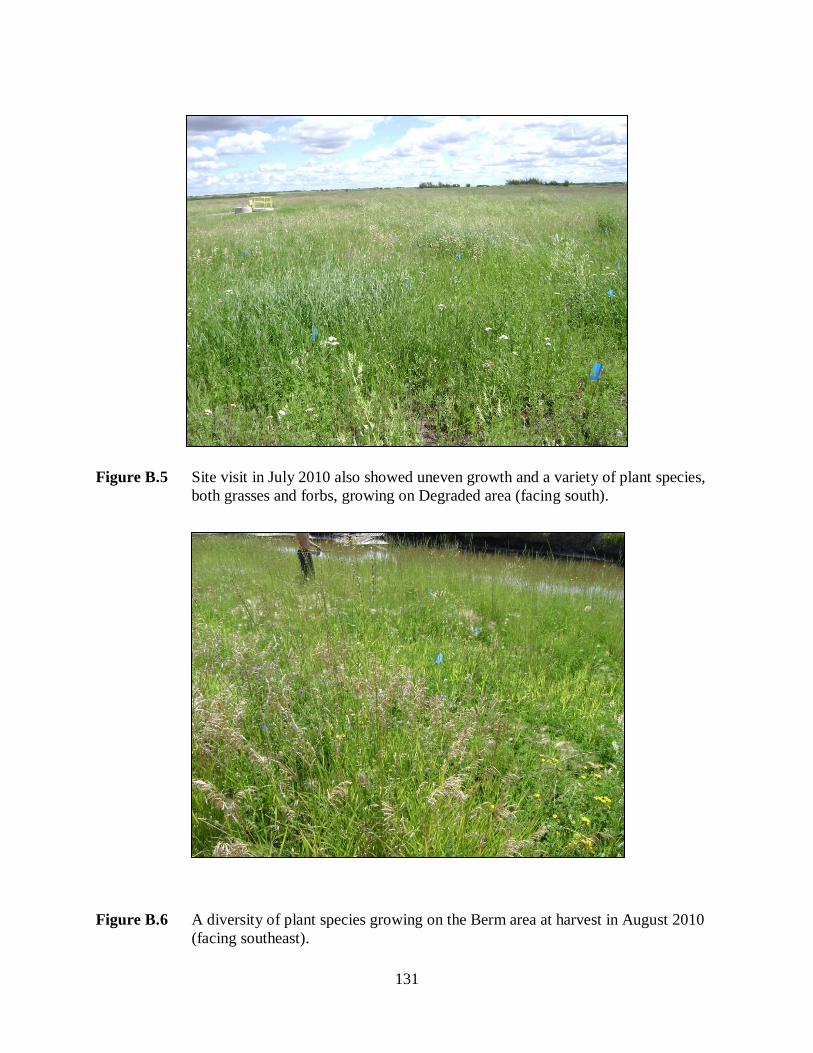
Figure B.5 Site visit in July 2010 also showed uneven growth and a variety of plant species,
both grasses and forbs, growing on Degraded area (facing south). .................................... 131
Figure B.6 A diversity of plant species growing on the Berm area at harvest in August 2010
(facing southeast). ............................................................................................................ 131
Figure B.7 A diversity of plant species growing on the Degraded area at harvest time in
August 2010. .................................................................................................................... 132
Figure B.8 Harvesting plant material in August 2010 by cutting about 2 to 5 cm above
ground level from a squire meter area then bagging the material for each plot. ................. 132
APPENDIX C
Figure C.1 Harvesting stage of canola for the willow biochar pot study. .............................. 133
xv
LIST OF SYMBOLS AND ABBREVIATIONS
AB Alberta
Al aluminum
ANOVA analysis of variance
C carbon
Ca calcium
CaCl2 calcium chloride
CEC cation exchange capacity
CH4 methane
CO2 carbon dioxide
Cu copper
DDGS dried distillers’ grains and solubles
DTPA Diethylenetriaminepentaacetic acid
EC electrical conductivity
(g) gas
GLM general linear model
H2O2 hydrogen peroxide
K potassium
KCl potassium chloride
LSD Fischer’s least significant difference
Mg magnesium
N nitrogen
xvi
Na sodium
NH3 ammonia
NH4 ammonium form of nitrogen; NH4+; NH4-N
NO3
nitrate; NO3-; NO3-N
N2O nitrous oxide
NUE nitrogen use efficiency
P phosphorus
PO4 phosphate form of phosphorus; PO4-P
rpm revolutions per minute
S sulphur
SK Saskatchewan
SOC soil organic carbon
SO2 sulfite
SO4 sulphate form of sulphur; SO4-S
SOM soil organic matter
Zn zinc
1
1.0 INTRODUCTION
There are global concerns surrounding the decreasing levels of organic matter in soils as
a result of anthropogenic activities. Soil organic matter (SOM) levels can decrease significantly
over time due to reduced C inputs and accelerated losses associated with cultivation and erosion.
The addition of organic amendments like manure can increase the organic matter content in soils
(Reeves, 1997; Ladha et al., 2011), and contribute significantly to the long-term nutrient
supplying power of the soil (Schoenau and Davis, 2006). The need for increased SOM and
nutrients that will enhance plant nutrition and growth strengthens the demand for new sources of
organic amendments that can be added to soil.
Perhaps the best known and most widely used organic amendment in agriculture is
manure, which has long been applied in conventional agricultural systems to increase soil
fertility and crop yields. Conventionally fed cattle manure, a well-documented soil amendment,
provides a long-term source of nutrients to the soil and can influence soil properties such as
increasing soil C and N concentrations, soil pH, cation exchange capacity, and soil available P
and K concentrations (Schoenau et al., 2010; Eghball et al., 2004). Distillers’ grains is a by-
product of the ethanol production process that is recently being incorporated into cattle rations in
western Canada (Feed Opportunities from Biofuel Industries, 2010). Manure from cattle fed
distillers’ grains was determined to have higher nutrient content than cattle fed conventional
grain rations (Hao et al. 2009). Hao et al. (2009) concluded that more research is required to
study the behavior of dried distillers’ grains and solubles (DDGS)-fed cattle manure and its
effects on soil quality and plant nutrition. For example, it is likely that the nutrient content and
performance of the manure as a fertilizer will depend on distillers’ grain source and will also be
influenced by manure processing practices such as composting. Therefore, there is a need to
2
investigate the effect of different distillers’ grain feedstocks and the composting of the manure
on its behavior as an organic fertilizer in prairie soils.
Alfalfa pellets represent a green manure that is a simply processed (pelletized) form of
plant residue. This is in contrast to animal manures derived from plant material that has gone
through a digestive tract. Alfalfa pellets can also provide a slow-release form of N and P
fertilizer, which is beneficial for improving the soil quality in degraded soils (Agehara and
Warncke, 2005). Alfalfa can have similar C:N (13:1 to 17:1) ratios compared to manure but may
produce different concentrations of available nutrients as it breaks down in the soil. Compared to
urea fertilizer, alfalfa pellets had approximately 30 to 50 % lower N availability in a five week
incubation study (Qian et al., 2011). However, alfalfa pellets are attractive compared to animal
manures, owing to their ease of handling, transport and application.
Biochars are novel organic amendments that are a co-product of bioenergy production
created when organic materials are combusted under low or no oxygen in a process termed
pyrolysis. Chars are reported to improve the efficiency and plant recovery of fertilizers in highly
weathered soils due to increased adsorptive surface area provided by the char (Calvelo Peirera et
al., 2011). Biochar amendments have a high concentration of recalcitrant C and low
concentration of N (C:N up to 700:1) with relatively small concentrations of other nutrients such
as P (Verheijen et al., 2009). The efficacy of biochars as soil amendments has not yet been
extensively studied in soils from temperate regions, with little or no information available from
the northern Great Plains. They may play a role in improving the soil carbon content and in
enhancing nutrient availability and recovery in agricultural soils and disturbed lands requiring
reclamation.
3
It is postulated that adding DDGS-fed cattle manure, alfalfa pellets, and biochar to
Saskatchewan soils will increase soil fertility and plant growth. The overall objective of the
research described in this thesis is to determine the effect of adding fresh and composted DDGS-
fed cattle manure, alfalfa pellets, and biochar on plant nutrient uptake and yield and soil
available nutrients and chemical properties using relevant soils and site conditions in the
evaluations. Specifically, the effects of DDGS-fed cattle manure and biochar are evaluated on
agricultural soils, with canola grown as a high nutrient demanding crop under controlled
environment conditions, using low fertility Brown and Black Chernozem soils collected from
typical farm fields. The effects of alfalfa pellet and biochar application were evaluated on a
disturbed soil adjacent to a potash mine, with the intent of evaluating their suitability in
reclaiming the disturbed soil and promoting growth of vegetation. Finally, the ability of biochar
to improve canola growth, nutrition, and recovery of fertilizer nitrogen is investigated on two
contrasting Saskatchewan agricultural soils in the growth chamber. A flow chart of the layout of
the project is presented in Figure 1.1. The thesis is organized as follows:
1) Literature Review (Chapter 2)
2) Behavior of Different DDGS-fed Fresh and Composted Cattle Manures (Chapter
3)
3) Application of Alfalfa Pellets and Biochar To Reclaim Productivity of a
Disturbed Soil (Chapter 4)
4) Amendment of Two Agricultural Soils With Biochar To Improve Plant Nutrition
and Fertilizer Use Efficiency (Chapter 5)
5) General Discussion and Conclusions (Chapter 6)
4
Figure 1.1 Project flow chart outlining studies on alfalfa pellets, biochar, and DDGS-fed
cattle manure.
5
2.0 LITERATURE REVIEW
2.1 Soils and organic amendments
Organic amendments have long been used as an effective way to increase the soil organic
matter (SOM) content and to provide and help retain nutrients for enhanced plant growth. The
value of organic amendments as fertilizers is dependent on their composition and rates of
decomposition. For example, much of the N in organic amendments is in organic form and
requires mineralization by microbes to be rendered plant available. Most synthetic fertilizers are
readily available for plant uptake in the first year of application but do not provide a continuous
release of nutrients over time like organic amendments do. Bulluck et al. (2002) conducted a
study in Virginia and Maryland where organic amendments, including composted cotton-gin
trash, composted yard waste, and cattle manure, increased the soil organic carbon (SOC) content
and cation exchange capacity (CEC) of the soil compared to the treatments that used synthetic
fertilizer.
Organic amendments enhance the storage and cycling of C and N in soil ecosystems in
soil microbial processes such as mineralization. Mineralization rates in soil are affected by
factors such as C:N ratio of the organic matter, the C:N of the consuming microbial biomass, and
the texture and porosity of the soil (Hassink et al., 1993). Different types of organic amendments
have differing N mineralization potential, which affects the plant uptake of nutrients over time
(Levi-Minzi et al., 1990). Organic amendments such as cattle manure provide high levels of total
organic N to soil and act as a long term N fertilizer (Gong et al., 2011). The quality or
degradability of the organic amendment will also affect the release rate of plant available N
(Booth et al., 2005). Some types of organic amendments such as rye straw can actually decrease
the organic C in the soil, likely because of the straw contributing to porosity and aeration (Levi-
6
Minzi et al., 1990). Farmyard manure and municipal refuse compost were found to increase or at
least maintain the organic matter in the soil (Levi-Minzi et al., 1990). The mineralization of
organic C and N over time provides a slow release of nutrients for plant growth past the first year
of application.
Soil organic carbon (SOC) can be an indicator of soil quality and can have varying
decomposition rates because of the C existing in different SOM fractions. Density fractions of
SOM are categorized into heavy, medium, or light. The heavy fraction SOM has the lowest
decomposition rate and contains plant material that is no longer distinguishable while the light
fraction has the highest decomposition rate and consists of recognizable plant material (Hassink
et al., 1997). Farmyard manure increased the C in the heavy fraction to a greater extent than
chaff or alfalfa in a study in northern Netherlands after 25 years of manure application. The
medium SOM fraction had the greatest proportion of SOM after 15 years of manure application.
The light and medium fractions were determined to be early indicators of SOM quality in the soil
as affected by soil management (Hassink et al., 1997).
Many studies conducted on organic matter dynamics in soil have encompassed effects
over one or two years (short term) or three to several years (long term). A short term (11-month)
study in Denmark, Sweden claimed that long term incubation studies do not improve the
understanding of N dynamics following application of household compost and sewage sludge
because the crop roots compete for immobilized N (Debosz et al., 2002). Paul (1984) concluded
that the long-term (e.g. seven years) decomposition of organic matter is a function of the
substrate composition and that there is a stabilizing effect to soil over time. Other authors stress
that long term studies are required to determine the turn-over of various fractions of organic
7
matter and to reveal the effect of organic amendments on long-term soil quality (Larney et al.,
2005; Gong et al., 2011).
Organic fertilizers can be important to restoring the level of organic matter in soils that
have been degraded. In addition to agricultural activities, other anthropogenic disturbances such
as oil and gas exploration and mining activities can also decrease the soil productivity and
organic matter content. Organic matter additions are an integral part of restoring these degraded
soils. In many cases, these soils have been stripped of topsoil which is then replaced following
the disturbance. A study in southern Alberta examined the restorative effects of soil amendments
including compost, manure, wheat straw, and alfalfa hay on three oil and gas sites. Alfalfa hay
increased the soil plant available N content to the greatest extent because of the enhanced
mineralization of N from the alfalfa hay compared to the other soil amendments (Larney et al.,
2005). There are various types of organic amendments that have potential for agricultural and
reclamation purposes to enhance plant growth and improve soil quality.
2.2 Novel organic amendments
Novel organic amendments are arising due to the expansion of industries such as biofuel
and bioenergy production that create organic co- or by-products containing carbon and plant
nutrients. There as an increasing need for an end-use for dried distillers’ grains and solubles
(DDGS), a by-product of the ethanol distillation process. The pyrolysis process produces
biochar, a high C by-product, which may have potential as a soil amendment. The transformation
of alfalfa pellets as a processed form of plant residue used solely as a livestock feed source to an
organic amendment creates another novel organic amendment opportunity.
There have been numerous studies on manure, which is a “conventional” organic
amendment used for centuries, with numerous studies on its effects as an amendment, both short-
8
and long-term. There is opportunity for novel organic amendments to have potential beneficial
effects on soil fertility and plant nutrition.
2.2.1 Dried distillers’ grains and solubles-fed cattle manure and compost
Ethanol production plants are present in each of the Prairie Provinces in Canada and
produce high volumes of DDGS. Approximately 290 kg of DDGS is produced from one tonne of
wheat grain and an 80 million L ethanol plant can produce 70,000 tonne of DDGS (Government
of Alberta, 2010). The increased need for a value-added use of DDGS has initiated recent
research on distillers’ grains as feed source for beef cattle (Walter et al., 2010). The ethanol
production process removes the starch from the grains, resulting in a by-product higher in protein
compared to unprocessed grain, such as barley. The DDGS can be added to beef cattle diets as a
portion of the protein required (Spiehs et al., 2002). A study conducted by Walter et al. (2010)
found that cattle on a ration of 20 to 40 % corn DDGS (as replacement of a portion of the barley
fed in ration) had increased dry matter intake and reduced amount of days that the beef cattle
were required to be on feed before slaughter.
An additional finding as a result of the animal nutrition studies was that the DDGS-fed
cattle produced manure of different nutrient composition than conventional grain ration-fed
cattle (Hao et al., 2009). The increase in protein from the addition of DDGS in cattle feed results
in a cattle manure that is higher in N (Hao et al., 2009). The P content in the DDGS is also higher
compared to unprocessed barley grain, which results in higher N and P content in the DDGS-fed
cattle manure (Table 2.1) (Hao et al., 2009). The differences in manure composition related to
feed source can affect soil nutrient availability and plant production as well as nutrient loss
through run-off and erosion.
9
Table 2.1 Nutrient content of manure from wheat dried distillers’ grains and solubles
(DDGS)-fed cattle at four different DDGS diet rations. The rations consisted of
5% mineral supplements, 10% barley silage, and 85% grain. The DDGS was
substituted for part of the grain in the ration (adapted from Hao et al., 2009).
Diet (%DDGS) N P Ca Mg K SO4
---------------------------------- g kg-1
------------------------------------
0 3.7 0.34 1.36 0.87 12.7 4.4
20 6.9 0.57 0.95 0.39 13.3 6.0
40 7.1 0.57 0.73 0.21 12.4 7.4
60 12.8 0.88 0.69 0.07 16.0 10.1
60 + Ca † 11.2 0.76 0.80 0.07 16.0 9.6 †1% of Ca was added to the ration to increase feed Ca:P from 1.1:1 to 1.6:1.
Adding DDGS as a portion of cattle rations can have effects on greenhouse gas
emissions. Addition of DDGS as a portion of cattle feed rations decreased the methane (CH4)
emissions from cattle in a study by McGinn et al. (2009). In the same study, they found that
increased N content in the DDGS fed cattle manure resulted in manure that may increase the
volatilization process causing increased N losses from DDGS amended soil. Hao et al. (2011)
studied the greenhouse gas emissions from the composting of wheat DDGS fed cattle manure
and found that the CH4 and CO2 emissions were similar to barley-fed cattle manure but the N2O
emissions were higher in the DDGS fed cattle manure. Greenhouse gas emissions may be
important when considering the handling and storage of the DDGS-fed cattle manure.
Composting is an aerobic process in which microbes break down organic matter, thereby
changing the physical and chemical parameters of the material (Larney et al., 2006). To compost
cattle manure, the manure is commonly placed into long piles called windrows where it is
aerated to encourage microbial activity that is vital to the composting process. Factors that affect
microbial growth and activity such as temperature and water content can, in turn, change the
composition and rate at which the compost is formed (Larney et al., 2006). Composted material
is much lower in moisture than the initial manure, and composting concentrates the nutrients in
10
the manure (Richard et al., 2002). Larney and coauthors (2008) recorded a mean water loss of
77.5% from the composting of wood chip bedding manure.
The composting process can change the C and N dynamics and C:N ratio of the manure
due to the significant C loss as the microbes consume the C in the fresh manure and release CO2.
While most of the N is conserved, there is a transformation of NH4-N form to NO3-N form in the
nitrification process during composting (Larney et al., 2006). Some of the N can be also be lost
in the composting process through conversion of NH4 to NH3(g) which is lost to the atmosphere
(volatilization). The microbial, physical, and chemical processes that occur during composting
can increase the stability of the manure compared to fresh manure. The C and N are in more
stable forms in compost because intense microbial activity has already occurred in the
composting process (Eghball, 2002).
Crop uptake of N and P applied as fresh versus composted manure has been investigated
in a few studies. In a three-year study on a southern Alberta soil, the dry matter yield of barley
was not significantly different between composted and fresh manure types (Miller et al., 2004).
In the same study, fresh manure amendment resulted in higher N availability than the composted
manure, especially in the straw bedding treatment. Manure that has been through the composting
process has different C and N contents, and thus mineralization rates are likely to differ from
fresh manure (Eghball, 2002).
A lower C:N ratio of soil or manure increases the N available for plant uptake, which is
associated with increased plant growth and plant biomass production (Qian and Schoenau, 2002).
Different types of manure will also have different concentrations of inorganic N (Miller et al.,
2010). Cattle manure collected from pens with wood chip bedding had a C:N ratio of 26:1
compared to straw bedding manure with a C:N ratio of 15:1 (Larney et al., 2008). Straw bedding
11
manure with the narrower C:N ratio had greater concentrations of NO3 but lower levels of NH4
than the wood chip bedding with wider C:N ratios in fresh and composted cattle manures.
Overall the straw bedding manures with narrower C:N produced a greater release of N over time
(Miller et al., 2010).
Matching the crop N uptake with manure N application rate is important to ensure that
the nutrients are not lost and that the plant’s nutrient needs will be met for greatest production
potential. Mooleki et al. (2004) found that with increased application rate of feedlot cattle
manure, there was also increased concentrations of available N in the soil following harvest of
the plants. In the same study, only seven to ten % of the N applied as cattle manure was
recovered in the first year of application on a Saskatchewan soil. Miller et al. (2004) found that
on a Dark Brown Chernozem near Lethbridge, Alberta there was no difference in N recovery
from fresh versus composted manure over a three year period, with values ranging from two to
11 %. Manure N recovery was significantly lower than fertilizer N recovery in the same study
(mean fertilizer N recovery of 19 %). Eghball and Power (1999) found that manure N recovery
for corn was 17 % for fresh manure and 12 % for composted manure over a four year period, and
was significantly lower than the N recovery for inorganic N fertilizer (45 %). Determining the
characteristics of the manure such as available and total N as well as N recovery can help in the
understanding of N availability for plant uptake in the year of application and subsequent years.
Manure is a significant source of other nutrients, especially P. The majority of P in
manure is of high availability to plants in the form of PO4-P, with the availability in composted
manure reported to be higher than fresh manure (Eghball and Power, 1999). The composting
process concentrates non-volatile inorganic nutrients such as P and K in the manure because
some organic carbon and moisture is lost during decomposition and composting (Larney et al.,
12
2008). Inorganic P in beef cattle fresh manure and composted manure can be applied at rates that
are too high to be retained in the soil, and the soluble P is lost through leaching and run-off
(Eghball, 2003).
High rates of manure application can increase the levels of salinity in agricultural soils by
adding salts. Wood chip bedded cattle manure was observed to have lower salinity effects on
surface soil compared to straw bedded cattle manure (Larney et al., 2008). Hurisso et al., (2011)
found that fresh dairy manure at a rate of 44.8 Mg ha-1
increased the soil salinity to 0.68 dS m-1
.
Saskatchewan regulations for manure applications state that manure application should not
increase the soil electrical conductivity (EC) by more than one dS m-1
and manure should not be
applied to soil over four dS m-1
where salts are already elevated (The Prairie Provinces
Committee on Livestock Development and Manure Management, 2001). Increased salinity due
to addition of compost products can be an issue in agricultural operations and can decrease plant
growth at high rates of application (Roca-Perez et al., 2009). Manure applied at the correct rate
for reduced losses of nutrients and risk of salinity following application is important for
maximizing the beneficial effects of manure on soil quality and plant nutrition.
2.2.2 Alfalfa pellets
Alfalfa pellets have traditionally been used as a feed source for livestock and poultry but
can also be used as a sustainable organic amendment that is beneficial for crop growth. Miyasaka
et al. (2001) found that alfalfa pellets, added to soil as an organic fertilizer, were effective in
improving plant growth and soil conditions predominantly due to increased soil moisture content
on a silty clay loam off the coast of Hawaii. When using organic fertilizers such as alfalfa pellets,
N release characteristics of the organic amendment are also important for determining the
effectiveness of the fertilizer (Agehara and Warncke, 2005).
13
Alfalfa pellets can be effective in improving soil-water relations and plant N nutrition.
Alfalfa pellets can expand to four times their original size when swelled with water and are
reported to increase the soil water holding capacity (Stoklas, 1999). Barley plants had increased
germination rate and plant health in a treatment with 90 % sand and 10 % alfalfa pellets (Stoklas,
1999).
In greenhouse trials conducted by the Crop Diversification Centre in Brooks, Alberta in
2005, there were favorable results for alfalfa pellets as a soil amendment for remediation
(Savidov and Bansal, 2005). These authors found that with the alfalfa pellet amended treatment
there was increased growth of barley (plant height, stem diameter, and leaf width) grown in
brine-contaminated soil from an actual brine spill site. Plants in the trials with the alfalfa pellet
amendment were also noted to have increased uptake and content of Na and Cl in the plant
tissue. The results of the study indicate that pelletized alfalfa has potential as an amendment for
reclamation.
Dehydrated alfalfa products can have beneficial effects on plant growth but timing of
application is also important. Alfalfa powder addition to a Saskatchewan soil from the Brown
soil zone improved canola biomass yield (Qian et al., 2011). However, application of alfalfa
pellets to soil directly before planting may have negative effects on seed germination due the
allelopathic chemicals in the pellets. Alfalfa excretes phytotoxic chemicals such as saponins and
salicylic acid as it decomposes. These allelopathic properties of alfalfa pellets were reported to
decrease weed germination in rice but disappeared 10 to 25 days after application (Xuan et al.,
2005).
The N in alfalfa products is released in the soil over time in plant available forms.
Alfalfa mulch added at the highest rate (3.9 and 5.2 t ha-1
that was equivalent to 162 and 184 kg
14
N ha-1
respectively) to a range of Manitoba soils over two years had N uptake in oats similar to
the 20 and 60 kg N ha-1
ammonium nitrate fertilizer treatments (Wiens et al., 2006). In the same
study, the alfalfa mulch treatments resulted in N recovery values of 11 to 68 % over two years.
2.2.3 Biochar
Biochar is a relatively stable, inert form of black C material that is created using
technology called pyrolysis (Chan et al., 2007). In pyrolysis the biochar is produced by heating
(roasting) organic material, such as crop residue and wood by-products, at high temperatures in
the absence of oxygen. The recalcitrant C in biochar creates the potential to increase the amount
of C stored in soils when biochar is amended to soil. Lehmann (2007) has pointed out that
biochar can be a significant tool for C sequestration in soils.
In addition to adding a recalcitrant form of SOC to soil, biochar has the potential to
reduce pollution from inefficient use of fertilizers through increased nutrient retention. The
increased fertilizer use efficiency associated with biochar is attributed to its role in preventing the
leaching of N and increasing the availability of N to the plant, thus enhancing N cycling (Stelner
et al., 2008). The low biodegradability of biochar, high porosity, and high surface area create a
soil amendment that is stated to contribute to long term soil quality (Stelner et al., 2008).
Biochar has been found to increase the immobilization of N in soil; therefore, timing of
biochar addition is important to ensure that N is not immobilized during times of increased plant
N requirements (Bruun et al., 2011). In a study testing biochar amendment on soil treated with
biosolids, biochar decreased the rate of N leached from the soil solution, possibly through
immobilization as well as sorption (Knowles et al., 2011).
Research conducted by Rondon et al. (2006) on beans found that there was improved
biological N fixation and therefore increased biomass production with soils amended with
15
biochar. The increased biological N fixation was likely due to the increased availability of other
nutrients due to the biochar addition (Rondon et al., 2006). Growth chamber trials conducted on
a nutrient depleted Alfisol showed that there were no significant increases in plant yield with the
application of biochar alone but the biochar plus N fertilizer treatments resulted in a significant
increase in plant yield (Chan et al., 2007). At rates over 50 t ha-1
of biochar, the soil also had
decreased tensile strength and increased moisture holding ability. Chan et al. (2007) state that
biochar has potential to improve N fertilizer use efficiency as well as increase SOC, soil cation
exchange capacity (CEC), and soil pH.
The material that the biochar is produced from, as well as the temperature and duration of
the pyrolysis process, can affect the properties of biochar. For example, biochar with a high pH
can buffer acidic soils to create a more favorable soil for nutrient retention (Clough and Condron,
2010).
Biochar may affect uptake of nutrients other than N. In soils where biochar and no N
fertilizer was applied, the uptake of K, Ca and P by radish was increased at the 50 and 100 t ha-1
rates of biochar addition (Chan et al., 2007). In this same experiment, the addition of N fertilizer
increased the N uptake in radish, which was balanced by an increase in K uptake. Biochar
created from pyrolysis of greenwaste can have increased levels of P and K which can provide
nutrients to the plant (Chan et al., 2007). Conversely, Kimetu et al. (2008) found that biochar
addition had no effect on plant uptake of P, K, Ca, or Mg compared to control treatments with no
biochar. The type of biochar and soil may affect the nutrient retention of the biochar amended
soil.
Biochar can increase the soil cation exchange capacity in highly weathered soils. In
Anthrosols with and without biochar, Liang et al. (2006) found that biochar increased the CEC of
16
soils when the organic matter from plant material was separated from more recalcitrant organic
C. These authors also calculated the surface charge to be higher in the soils containing biochar,
as a result of both increased negative charge density and surface area.
Studies of biochar amendment effect on plant growth and crop productivity have reported
variable effects. In a severely degraded soil in Kenya, biochar amendment increased SOC by
45% and the biochar plus N fertilizer increased uptake of N in plants over N fertilizer alone
(Kimetu et al., 2008). Compared to other organic amendments such as green manure, animal
manure, and saw dust, biochar was found to reverse declines in crop productivity, although long-
term studies are required to determine the effectiveness of the biochar amendment in sustaining
productivity (Kimetu et al., 2008). In the work in Kenya (Kimetu et al., 2008), the biochar had a
greater positive effect on the soil that was not as severely degraded. This claim suggests that
even the prairie soils in Saskatchewan, which may be considered to be of relatively higher
quality and SOC than degraded tropical soils, would have potential benefits from biochar
addition.
Most research with biochar amendment to date has been focused on nutrient poor soil in
tropical regions. There is a need for research on biochar as a soil amendment as it pertains to
soils in temperate regions of the world where soils are relatively more nutrient rich. Woolf
(2008) states that it is important to study all types of agricultural soils to determine the potential
of biochar as an amendment on a global scale.
17
3.0 BEHAVIOR OF DIFFERENT DDGS-FED FRESH AND COMPOSTED CATTLE
MANURES
3.1 Introduction
Cattle manure has been long used as a soil amendment because it is a significant source
of nutrients for plant growth. There is a high variation among different manure sources and each
manure type will have its own unique characteristics and behave differently in soils. Nutrient
composition of manure depends on factors such as animal species, animal age, feed composition,
and storage (Eghball et al., 2002). The N contained in manure is mainly in organic N form and
needs to be mineralized by microbes to the plant available forms NH4+ and NO3
- to become
available for plant uptake. Mineralization of manure nutrients is dependent on factors that affect
microbial populations including moisture, temperature, C:N ratio, and particle size of manure
(Eghball et al., 2002). Understanding the characteristics of manure that affect the mineralization
of N such as C:N as well as available N, P, K, and S is important when attempting to match
nutrient availability in the applied manure to plant requirements. Nutrient availability in manure
is also variable between manure types.
Manure from cattle fed different grain feedstock and rations may contain different
concentrations of nutrients. Feed rations in many cattle operations have recently included a
portion of DDGS, a by-product of the ethanol production process. Walter et al. (2010) reported
that cattle performance (weight gain per amount of feed consumed) was improved in treatments
where up to 40% of corn DDGS was included in the feed ration compared to traditional barley-
fed cattle. In a study with grazing beef steers in Nebraska, cattle supplemented with corn DDGS
feed displayed an increase in body weight gain per hectare compared to fertilized and non-
fertilized grass treatments (Greenquist et al., 2009). Moreover, cattle fed rations consisting of 40
18
and 60 % wheat DDGS had up to 125 % increase in crude protein in their diet compared to a
traditional barley ration (Hao et al., 2009). The high potential for DDGS fed beef cattle warrants
more research on the manure from the DDGS-fed cattle.
Manure composition is affected by diet and the proportion of DDGS in feed. A diet of
40% and 60% wheat DDGS in cattle feedlot rations in southern Alberta resulted in a three-fold
increase in manure NH4+ content which was directly correlated to crude protein levels in the
cattle diet (Hao et al., 2009). Crude protein that is not absorbed during the digestion of DDGS is
excreted and hydrolyzed, resulting in high NH4+ content in the manure (Hao et al., 2009). Corn
DDGS fed at 2.3 kg per day to beef cattle improved pasture forage [smooth brome (Bromus
inermis)] growth as a result of the cattle manure returned to the soil surface, which created
increased N availability compared to the non-fertilized, non-supplemented treatment (also
grazed) (Greenquist et al., 2009).
Adding DDGS to cattle feed rations may influence manure chemical properties such as
pH and electrical conductivity (EC). Manure pH was positively correlated with increasing
proportion of DDGS in feed, which reflected increasing manure NH4+ content (Hao et al., 2009).
Elevated EC values were evident in the cattle manure as DDGS in the feed ration increased,
which is likely because of the increased concentration of NH4+, SO4
2-, and K
+ in the manure
(Hao et al., 2009).
Different feedstocks of DDGS include wheat, corn, triticale, and sorghum including
mixes of sorghum and barley or corn (US Grains Council, 2009). Wheat DDGS is more
commonly produced in ethanol plants in Canada due to the higher availability of wheat grain
compared to corn grain in the Prairie Provinces with more than 0.26 million tonnes of wheat
DDGS produced annually (Feed Opportunities from Biofuel Industries, 2010). A study on wheat
19
versus corn DDGS feedstock in cattle rations determined that cattle dry matter intake of wheat
DDGS was increased compared to corn DDGS had decreased dry matter intake (Walter et al.,
2010). Increased dry matter intake is favourable for beef cattle operations to improve cattle
weight gain. Wheat DDGS in a ration fed to dairy cattle resulted in a greater P excretion
compared to corn DDGS- fed treatment (Undi et al., 2011).
Manure storage and handling also has a large influence on the resulting nutrient
concentration and availability in manure. Composting manure is a common practice for manure
storage that decreases the volume of manure to be hauled and concentrates manure nutrients.
Additionally, composting decreases weed seed and pathogen levels because the heat generated
by microbial activity during composting decreases the viability of the seeds (Erickson et al.,
2009). The composting process can change manure nutrient levels and C and N dynamics
compared to the initial fresh manure. Net N immobilization occurred in swine-straw manure over
a six-week composting process, although approximately 2-3 % of the N was mineralized as well
during this time (Cambardella et al., 2003). These authors suggest that NO3-N is lost during the
composting process through denitrification. A study on composting beef cattle manure revealed a
loss of up to 40 % of total N in the composted manure compared to fresh manure of the same
source (Eghball et al., 1997).
The composting process can decrease the mineralizable C and N in the manure and thus
increase the stability of the manure. The stability of composted manures is strongly dependent on
the age or duration of composting (Cambardella et al., 2003). Nitrogen mineralization can be
lower for composted manure than fresh manure, but can still contribute to significant increases in
the available N pool for crop growth (Eghball et al., 2002; Whalen et al., 2008). Mineralization
20
that occurs during composting can result in reduced water and C content and thus the
concentration of nutrients and ions in composted manure is increased (Larney et al., 2006).
Recovery of N varies between different manure sources and can be related to N
mineralization and N availability. The C:N ratio as well as the composition of the carbon and
nitrogen in the manure can affect mineralization. Qian and Schoenau (2002) suggest that C:N
ratio of manure is negatively correlated with net N mineralization. These authors reported that
manure C:N ratios above 15:1 resulted in decreased available N supply rates. The amount of N
mineralized from manure is also affected by the composition of the C and N in the manure
(Eghball et al., 2002). The release of N from manure can continue in subsequent years following
the first year of application and there can be a build-up of residual N in the soil as a result of
successive manure applications (Mallory et al., 2010).
Soil organic carbon is often used as an indicator of soil quality and manure can be a
source of SOC. Soil amended with composted manure had to significantly higher SOC levels
compared to plots where compost was not added in a sandy loam soil near Ste. Anne de
Bellevue, Québec (Whalen et al., 2008).
Manure is a significant source of P and most of the P in composted manure was is in
inorganic form (Eghball, 2003). The N:P ratio of manure is important for determining if there
may be loss of P to the environment because often the N and P requirements of plants are
different from concentration of those nutrients in manure. Decreasing the amount of P in the
animal diet can result in decreased levels of P in the resulting manure (McCallister et al., 2010).
A decrease in P input of 33 to 45% in feedlot cattle diets decreased the P in manure by 40-50 %
(Satter et al., 2002). Hao et al. (2009) determined that total P levels in cattle fed a ration
21
including 40 and 60 % DDGS had significantly increased manure total P levels compared to
barley-fed cattle manure.
The objective of this study was to compare the effects of adding fresh and composted
manure from cattle fed wheat-based DDGS and corn-based DDGS on biomass and nutrient
uptake by canola and residual soil nutrients. The concentrations of soil and plant nutrients were
used to assess the fertilizing effects of four different manures: wheat-based DDGS-fed fresh
cattle manure, wheat-based DDGS-fed composted cattle manure, corn-based DDGS-fed fresh
cattle manure, and corn-based DDGS-fed composted cattle manure. The four types of manures
were grown on two contrasting Saskatchewan soils at five different rates: 0, 60, 120, 180, and
240 t ha-1
. The research work described was conducted in controlled environment conditions in
the phytotron facilities at the University of Saskatchewan.
The hypothesis of this study was that composting will increase manure nutrient content,
resulting in lower rates required to meet plant nutrient demand and that the DDGS feedstock
(wheat versus corn) will influence manure fertilizer value.
3.2 Materials and Methods
Canola (Brassica napus Invigor 5030) was grown in controlled environmental conditions
over 35 days with four different DDGS-fed cattle manure amendments: wheat based DDGS-fed
fresh cattle manure (wheat fresh), wheat-based DDGS-fed composted cattle manure (wheat
compost), corn-based DDGS-fed fresh cattle manure (corn fresh), and corn-based DDGS-fed
composted cattle manure (corn compost).
3.2.1 Pot study protocol
Two soils from different soil-climatic zones in Saskatchewan were selected for the study.
The first soil was collected from the top 0-15 cm of control (unmanured, unfertilized) plots in a
22
long-term manure field trial that was planted to wheat in 2009 (Mooleki et al., 2004). The soil,
collected in September 2009, is a Black Chernozem belonging to the Cudworth Association in
the Black soil zone (LSD NW 21-37-23 W2M) (Black soil). The second soil type was collected
from the 0-15 cm depth from a wheat stubble field near Central Butte, Saskatchewan. The
second soil, also collected in September 2009, is of the Haverhill Association located in the
Brown soil zone (LSD NW 30-20-3 W3M) (Brown soil). Properties of the two soils are shown in
Table 3.1.
The soils were air-dried and mixed to ensure they were homogeneous, then passed
through a 2-mm sieve. The NO3- and NH4
+ were determined by extracting with 2 M KCl at a
1:10 soil:solution (weight:volume) ratio and analyzing colorimetrically (Keeney, 1982).
Available P and K were extracted using the modified Kelowna reagent as described by Qian et
al. (1994) and quantified using the colorimetric method. Organic C was determined using LECO
Carbon Analyzer combustion. The pH and EC (electrical conductivity) was determined using a
1:2 soil:deionized water solution.
The soils were low in available N and P, and the Brown soil was especially low in
organic carbon (Table 3.1). The pH is neutral to slightly basic and the EC (salinity) is low (non-
saline) in both soils.
Table 3.1 Soil properties of initial soils used in the growth chamber studies collected in the
fall of 2009.
Soil NO3 NH4 PO4 K SO4 OC† pH EC‡
-------------------------- mg kg-1
------------------- % mS cm-1
Black soil 13.7 10.3 9.9 710.1 6.9 3.4 7.9 0.17
Brown soil 11.3 8.3 17.4 436.4 2.0 1.7 7.7 0.22
† OC denotes organic carbon
‡ EC denotes electrical conductivity.
23
The field capacity for each soil was determined by sieving soil through a 2-mm sieve and
weighing out 50 g of soil into four vials. Water was added to each of the four vials of soil to
represent 20, 25, 30, and 35% water by weight. The vials were equilibrated for 24 h. The value
of field capacity was estimated as the average of the percentage of water by weight added that
resulted in movement of the wetting front to the bottom of the vial but did not produce free-
standing water. The estimated field capacity values of the two soils were 28 % for the Black soil
and 25 % for the Brown soil.
Pots of 15 cm diameter and trays were washed, labeled, and a filter paper placed on the
bottom of each pot to prevent soil leakage. The amendments were weighed out for each pot
(Table 3.2) and the amendment and 900 g of soil were mixed in a bucket followed by placement
into the correct labeled pot. Pots were weighed and watered with distilled water to 80% field
capacity and left on the lab bench for 48 hours to equilibrate. After the equilibration was
complete, the pots were seeded with 10 canola seeds (Brassica napus Invigor 5030) and 100 g of
soil was placed on top ensuring no large lumps were on the surface. The pots were watered again
to 80 % field capacity and the total weight of each pot was recorded.
The pots were placed in a growth chamber with 16 hour days at 24oC and 8 hour nights at
21oC. The humidity was not controlled in the growth chamber. The pots were moistened on the
soil surface twice daily for the first 7 days and watered daily to 80 % field capacity over 35 days.
The pots were re-randomized weekly to account for any uneven light or air distribution. Sticky
traps were placed in the chamber to control fly infestation. Notes were taken daily and visual
observations were made of the plants. Photos were also taken periodically to track the growth of
the plants.
24
Table 3.2 Rate of manure addition on a weight basis and corresponding N, P, and K manure
rates for dried distillers’ grains and solubles (DDGS) wheat fresh and composted
and DDGS corn fresh and composted manure treatments.
Manure Rate
-------------------------------DDGS Manure------------------------------
Wheat Fresh
Wheat
Compost Corn Fresh
Corn Compost
g kg-1 t ha
-1 ------------------------- N Rate (mg kg-1
) ----------------------------
0 0 0 0 0 0
30 60 216 474 219 312
60 120 432 948 438 624
90 180 648 1422 657 936
120 240 864 1896 876 1248
--------------------------- P Rate (mg kg-1
) ------------------------------
0 0 0 0 0 0
30 60 120 288 41 130
60 120 241 576 82 260
90 180 361 864 123 390
120 240 481 1152 164 520
---------------------------- K Rate (mg kg-1
) -------------------------------
0 0 0 0 0 0
30 60 183 564 144 366
60 120 366 1128 287 732
90 180 549 1692 431 1098
120 240 732 2256 575 1464
The canola plants were harvested from the pots on day 35 in the growth chamber. The
plants were beginning to bolt at the time of harvest. The plants were harvested by cutting the
stems about 0.5 cm from soil level at the base and placing in labeled paper bags. The bags of
plant material were oven-dried at 40oC, weighed, then ground using a coffee grinder to
approximately 0.5 mm size and placed into plastic vials until further lab analysis. The soil from
the pots was laid out to air dry at 30oC, then passed through a 2-mm sieve (roots removed) and
placed in plastic vials for further lab analysis.
25
3.2.2 Manure amendments
Manures were obtained from the University of Lethbridge Research station in Lethbridge,
Alberta. Manures were received frozen and kept in the freezer before use, at which time they
were thawed overnight and mixed before applying to the various treatments.
The beef cattle diet that resulted in the manures for this study was based on a diet of
barley silage, barley grain, mineral supplement and the two DDGS grain sources (Table 3.3). The
DDGS grain was included as a portion of the feed from 40 to 60 % based on recommended
standard practice.
Table 3.3 Cattle diet for the dried distillers’ grains and solubles (DDGS)-fed cattle manure
trials.
DDGS Manure
Treatment Feed % of Diet
Wheat (Fresh/Compost)
Wheat DDGS 60
Barley Grain 25
Barley Silage 10
Mineral Supplement 5
Corn (Fresh/Compost)
Corn DDGS 40
Barley Grain 46
Barley Silage 9
Mineral Supplement 5
The fresh manures were collected within one to five weeks of completion of a four to five
month feeding trial. A portion of the fresh manures collected were frozen while the rest was
composted for 100 days, followed by 100 days of curing. Bedding materials used in the trials
consisted of straw bedding for corn DDGS and wood chip bedding in the wheat DDGS trials.
The four manure types were analyzed for nutrient content prior to adding to the soil.
Available N, P, K, and S in the manures were analyzed using the sulfuric acid digest method and
determined on the Varian SpectraAA 220 flame atomic absorption spectrometer (Varian
Australia, 2000) (See Section 3.2.4).
26
The apparent N recovery by the canola plants was calculated with the following formula
from Mooleki et al. (2004):
3.2.3 Soil lab analysis
Soils (initial soils and treated soils) were analyzed for nutrient content and chemical
properties. The NO3-N and NH4-N were determined using 2M KCl extracts (Keeney and Nelson,
1982). Approximately 5.0 (±0.1) g of soil was extracted with 50 mL of 2M KCl solution. The
soil:KCl suspension was shaken on a rotary shaker at 142 rpm for 1 h then filtered through VWR
454 filter paper into plastic vials. The vials were capped and placed in the fridge/freezer to await
colorimetric analysis on the Technicon AutoAnalyzer II (Tarrytown, NY).
Available P and K were determined using the Modified Kelowna method (Qian et al.,
1994). An extracting solution was prepared by measuring 28 mL of acetic acid, 38.5 mL of
ammonium acetate, and 1.11 g of ammonium fluoride into a 2 L bottle. Soil was measured into
plastic bottles at a measurement of 3 g along with 30 mL of Kelowna extracting solution. Bottles
were shaken horizontally on a shaker at 160 rpm for 5 min then poured through VWR No. 454
filter paper into vials. The P in the extracts was determined colorimetrically using the Technicon
Authoanalyzer II. The Varian SpectraAA 220 flame atomic absorption spectrometer (Varian
Australia, 2000) was used to determine the concentration of K in the extract.
Available SO4-S was extracted using 20.0 (±0.1) g of soil, which was weighed into a 100
mL extraction bottle containing 40 mL of 0.01 M CaCl2 solution. The extraction bottles with
solution were placed on the rotary shaker to be shaken at 142 rpm for 30 min. The solution in
[3.1]
27
each bottle was filtered through VWR No. 454 filter paper into plastic vials then analyzed
colorimetrically using the Technicon Autoanalyzer II.
For extraction of bioavailable Cu and Zn, a diethylenetriaminepentaacetic acid (DTPA)
solution was prepared using 0.005 M DTPA, 0.01 M calcium chloride, and 0.1 M triethanolamine
(pH 7.3) (Lindsay and Norvell, 1978). Ten g of the DTPA solution was added to 1 g of soil and
shaken for 2 h. The suspension was then filtered through VWR No. 454 filter paper and the
filtrate analyzed for Cu and Zn concentration using a Varian SpectraAA 220 flame atomic
absorption spectrometer (Varian Australia, 2000).
Prior to analysis of organic carbon in the soils, the sieved soil samples were sub-sampled
and ball ground to pass through a 0.5 mm mesh sieve to provide a more uniform sample. The C
632 Carbon Determinator (Leco Corporation, St. Joseph, Missouri USA) was used for dry
combustion of organic carbon at a temperature of 842oC for determination of percentage of total
organic carbon (Wang and Anderson, 1998). At least four blanks with just a ceramic boat (no
material) were run as well as standard material samples. Once there were consistent readings for
the standard material samples, a curve was set up, and samples of 0.15 g were weighed into the
ceramic boats. The sample material in each boat was placed into the oven for approximately 120
seconds when the organic C content in the sample was recorded.
Soil pH and EC were determined using a 1:2 (w/v) soil:water extraction. Approximately
20 g of soil was added to an extraction bottle with 40 mL of distilled water and shaken on a
rotary shaker at 142 rpm for 20 min then left to settle for 1 h. The supernatant solutions were
filtered through Whatman 1 filter paper into plastic vials that were then capped (Rhoades, 1982).
Soil pH measurements were obtained by inserting a pH probe into the extractant and the reading
recorded from a Beckman pH meter. A Beckman EC meter was used for the EC measurements
28
(Richards, 1969) by inserting the probe into the extraction solution and recording the reading.
The probe was rinsed thoroughly with distilled water between each measurement for both pH
and EC.
3.2.4 Plant and manure analyses
Total plant and manure N, P, and K was determined using the sulphuric acid-peroxide
digest method (Thomas et al., 1997). Finely ground plant or manure material (0.2500 to 0.3000
g) was weighed into each 100 mL digestion tube. Two checks that included 0.0300 g of glycine
and two blank tubes were included with each set of digests. In the fume hood, 5 mL of 18M
sulphuric acid was added to each tube and mixed with a vortex mixer. The heating block in the
fume hood was heated to 360oC before samples were placed in the block. The tubes, once on the
heating block, were heated for 30 minutes then removed and cooled for about 20 min at which
time 0.5 mL of 30 % (v/v) hydrogen peroxide was added to each tube and mixed with a vortex
mixer. The rack of tubes was then returned to the heating block and the process was repeated six
times. When the solution was colorless, hydrogen peroxide was added to each tube and the glass
tubes were returned to the heating block to be heated 60 min to remove all hydrogen peroxide.
Once the rack of glass tubes was removed and allowed to cool overnight, deionized water was
added to each tube just below the volume line while mixing on a vortex mixer. The tubes were
again allowed to cool from the chemical reaction after added the water. When the tubes were
again at room temperature the tubes were carefully filled with deionized water to the volume line
which is at exactly 75 mL. The tubes were capped with a rubber stopper and inverted five to six
times to mix well. The solution was sub-sampled into a vial and the rest of the solution was
disposed of as hazardous waste. The extracts were placed in the fridge/freezer until colorimetric
analysis on the Technicon Autoanalyzer II.
29
Total plant S was determined using a Leco TruSpec Sulphur Analyzer. Ball ground plant
material was weighed into a ceramic boat and placed in the LECO Sulphur analyzer. The S in the
samples is converted to SO2 by combustion over a 3 min period and SO2 concentration from the
sample combustion is compared to standard material samples in order to determine S
concentration in the plant material.
3.2.5 Statistical analysis
The experimental design was a completely randomized design. The R Statistical Program
(Crawley, 2007) was used to analyze the data using general linear models and one-way ANOVA.
Linear regressions were also performed in the R program for SOC and EC. A probability level of
p ≤0.05 was used to assess if treatments produced a significant effect on the parameter measured.
Significant differences between treatments were determined using mean separation with Fischer
least significant difference (LSD) at p ≤0.05.
3.3 Results and Discussion
3.3.1 Manure characteristics
The manure treatments were added on a fresh weight basis in this study to simulate how
manure would be applied in the field. As the N content of the manures used varied, the rate of N
added as manure varied for the different sources (Table 3.2). The manure with the highest N and
P content was the wheat compost (Figure 3.1). The wheat compost has the highest N content of
all the manure sources and both of the composted manures had increased P content compared to
the fresh manure of the same feedstock. The wheat compost amendment is more concentrated in
total N compared to the other manure treatments (Figure 3.1) and adds more N to the soil for a
given manure rate. Manure composition is influenced by animal diet, age, and breed as well as
collection, storage, and exposure to climatic variables (Eghball, 2002).
30
Figure 3.1 N, P, K, and S concentration of four distillers’ grains and solubles (DDGS)
manure sources used in the growth chamber studies. Bars represent standard error
of the mean.
The composted manures had higher N and P contents compared to the fresh cattle
manures (Figure 3.1). Overall, the wheat compost manure had the highest nutrient contents,
making this manure a more concentrated nutrient source. The composting process concentrates
nutrients because of the evaporation of water and loss of carbon as CO2, decreasing the volume
of material (Larney et al., 2006). Significant mass loss can occur during the composting process.
Eghball et al. (1997) reported a mass loss of 20 % over a 100-day composting period in
windrows. Four manures tested by Eghball (2002) had increased NO3-N and EC in the
composted manure versus the fresh manure from the same source.
The N:P ratio of manure is smaller than that of soil and required by plants; therefore the
addition of manure based on plant N requirements may exceed the P holding capacity in the soil,
0
20
40
60
80
100
120
N P K S
Nu
trie
nt C
on
cen
tra
tio
n (g
kg-1
)
Nutrient
DDGS wheat fresh manure
DDGS wheat compost manure
DDGS corn fresh manure
DDGS corn compost manure
31
making the P susceptible to run-off loss (Eghball, 2002). The manures used in our study had an
N:P ratio of 2:1 except for the corn fresh manure which had an N:P of 5:1 (Table 3.4). An N:P
ratio of about 4.5 is required for winter wheat (Eghball, 2002), indicating that the N:P ratios of
the corn fresh manure is closer to that of plant uptake.
The C:N ratio of the manure sources ranged from about 10:1 to 20:1 (Table 3.4). The C:N
ratio was greatest for the wheat fresh manure at 20:1 which may indicate decreased availability
of N following application (Qian and Schoenau, 2002). The corn compost manure had the lowest
C:N (~10:1), which would predict net mineralization to occur. The composted treatments both
had lower C:N compared to the fresh manures of the same feed source. Eghball et al. (1997) also
suggests that the readily decomposable forms of C and N are transformed into more stable forms
in the composting process, causing lower mineralization to occur in the more stable composted
manure when added to soil. The higher C:N in the wheat-fed manure may also be due to the
different bedding type. Wood chip bedding used in the wheat-fed treatments has a higher C:N
ratio compared to straw bedding that was used in the corn-fed treatments (Larney et al., 2008).
The wheat fresh manure had the highest moisture content as well, which diluted the nutrients in
that manure source (Table 3.4; Table 3.2).
Table 3.4 The C:N ratio, N:P ratio, and moisture content of four distillers’ dried grains with
solubles (DDGS)-fed manure sources.
DDGS Manure Type C:N N:P Moisture
%
Wheat fresh 20 2 64.2
Wheat compost 16 2 21.5
Corn fresh 15 5 53.9
Corn compost 11 2 21.4
32
3.3.2 Canola plant biomass yield
In both the Brown and Black soils, the wheat fresh manure tended to produce the highest
canola biomass (Figure 3.2 and Figure 3.3). At lower rates of manure addition, composted
manures tended to result in higher yield than fresh manures. These results contrast with Miller et
al. (2004) where there was no significant difference in barley dry matter yield between
composted or fresh manure treatments. The results of Miller et al. (2004) were based on three
years of field applied manure amendments on a Dark Brown Chernozemic soil in Lethbridge,
Alberta. Their results may have differed from the results in this study because of environmental
conditions and differences in manure composition. Work by Eghball and Power (1999) revealed
higher corn plant biomass in composted treatments compared to fresh manure over a three-year
field study on a silty clay loam soil in Nebraska. It is important to note that restricted rooting
volume in a pot can create differences in response compared to what may be observed in the
field with the same amendment. Nutrients may be concentrated in the pot, which is evident in the
composted manure treatments that appear to produce a toxic effect when added at the higher
rates as indicated by decreased the plant biomass.
The corn fresh manure has significantly lower biomass compared to the other treatments
at the 90 g kg-1
and 120 g kg-1
rates on the Brown soil. This manure source has lower N content
compared to the composted manures but similar to the wheat fresh manure (Figure 3.1). The
decreased biomass in the corn fresh manure treatment is not understood because of the
similarities with the other manures.
33
Figure 3.2 Mean dry biomass for canola grown on a Brown soil amended with manure from
cattle fed wheat-based dried distillers’ grains and solubles (DDGS) (fresh and
composted) and corn-based DDGS (fresh and composted) manure treatments at 0,
30, 60, 90, and 120 g kg-1
rates. Bars represent standard error of the mean.
Figure 3.3 Mean dry biomass for canola grown on a Black soil amended with manure from
cattle fed wheat-based dried distillers’ grains and solubles (DDGS) (fresh and
composted) and corn-based DDGS (fresh and composted) manure treatments at 0,
30, 60, 90, and 120 g kg-1
rates. Bars represent standard error of the mean.
0
1
2
3
4
5
6
7
8
0 30 60 90 120
Bio
mas
s (g
kg-1
so
il)
Manure Rate (g kg-1)
DDGS Wheat Fresh Manure
DDGS Wheat Compost
DDGS Corn Fresh Manure
DDGS Corn Compost
0
1
2
3
4
5
6
7
8
0 30 60 90 120
Bio
mas
s (g
kg-1
so
il)
Manure Rate (g kg-1)
DDGS Wheat Fresh Manure
DDGS Wheat Compost
DDGS Corn Fresh Manure
DDGS Corn Compost
LSD0.05= 1.1
LSD0.05=0.85
34
The composted and fresh manure evaluation on the Black soil showed that the DDGS
wheat fresh manure resulted in the highest biomass, which occurred at the 120 g kg-1
rate (Figure
3.3). Canola grown on the Black soil yielded lower as a result of a negative response to higher
rates of the wheat composted manure compared to the canola grown on the Brown soil. The
canola biomass in the treatment amended with wheat compost manure at the highest rate (120 g
kg-1
) on the Black soil was not significantly higher than the control treatment.
All manure amendments on the Brown soil resulted in little to no increase, and even a
decrease in biomass at the 90, and 120 g kg-1
rates compared to the two lower rates (Figure 3.2).
This trend was similar in the Black soil treatments, although there was still increased biomass in
the highest rate compared to the 60 g kg-1
rate in the wheat fresh manure treatment, indicating
that this manure was still supplying nutrients to canola. Canola biomass was higher when corn
compost manure was applied compared to the corn fresh manure treatment at all rates. The wheat
fresh treatment resulted in higher plant biomass than the wheat composted treatment at the 60,
90, and 120 g kg-1
rates.
At the lowest rate of addition (30 g kg-1
) the composted treatments for both the wheat and
corn-fed manures had higher canola biomass compared to the corresponding fresh manure type.
Decreased biomass yields at the highest rates can be due to the toxic effects of manure as a result
of excessive ion loading. This toxic affect, often termed ‘salt effect’, is especially evident in the
wheat compost manure on the Black soil. The high concentration of cations such as K in the
wheat compost treatment illustrates the reason for the toxicity and can be due to decreased
osmotic potential (Figure 3.1). These results indicate that high rates of composted manure may
be especially deleterious due to their concentrated nature.
35
The wheat fresh manure increased canola biomass with increasing rate on the Black soil
indicating the wheat fresh did not produce the same toxic effects as the wheat compost at the
highest rate. Helgason et al. (2007) also found increased plant growth with manure addition
which followed a similar trend to plant N uptake.
3.3.3 Manure nitrogen recovery
The two composted manures increased plant N concentration with increasing rate of
addition to the Brown and Black soils (Table 3.5; Table 3.6). The composted amendments also
resulted in a greater increase in plant N concentration at the high rates of application than fresh
manures. Canola grown on soil amended with wheat compost manure at the 120 g kg-1
rate had
the highest N concentration in both soils. Increase in canola N concentration relates back to the
N added in the manures (Table 3.2).
The composting process decreases the N:P and C:N ratio of manures (Eghball et al.,
1997). The N concentrated in the composted manures gives rise to a greater rate of N added per
unit of manure. Nitrogen is lost in the composting process through NH3 loss during turning of
windrows, which can provide lower concentrations of NH4+ for nitrification to NO3
- (Tiquia et
al., 2002). However, greater losses of C than N and losses of water result in compost with higher
N concentrations than fresh manure (Miller et al., 2004).
Composting may also stabilize some of the N. Miller et al. (2004) reported increased
plant N uptake in a fresh manure treatment compared to a composted manure treatment on a
Dark Brown Chernozem in the treatments with 39 and 77 t ha-1
rates of added manure.
36
Table 3.5 Mean dry canola total N, P, K and S concentration for dried distillers’ grains and
solubles (DDGS) wheat fresh and composted, and DDGS corn fresh and
composted treatments at 0, 30, 60, 90, and 120 g kg-1
rates on the Brown soil.
DDGS Manure Rate N P K S
g kg-1
---------------------------- % -------------------------------
Wheat Fresh
0 1.1 0.35 2.1 0.83
30 0.8 0.26 1.8 0.58
60 1.0 0.26 2.5 0.70
90 1.2 0.28 3.0 0.57
120 1.9 0.34 4.0 0.85
Wheat Compost
0 1.2 0.33 2.2 1.20
30 1.0 0.28 2.4 0.67
60 1.8 0.35 3.9 0.72
90 3.0 0.42 5.1 0.78
120 3.6 0.43 6.4 0.61
Corn Fresh
0 1.0 0.32 2.0 0.98
30 1.0 0.33 2.3 0.82
60 1.1 0.30 2.3 0.66
90 1.1 0.30 2.7 0.65
120 1.2 0.31 3.0 0.85
Corn Compost
0 1.3 0.36 2.3 0.96
30 0.9 0.26 2.2 0.61
60 1.4 0.28 3.4 0.80
90 2.2 0.34 4.5 0.70
120 2.8 0.37 5.4 0.67
LSD(0.05) 0.40 0.06 0.88 0.45
Crop N recovery increased with increasing manure rate in the wheat fresh manure and the
corn compost manure treatments on the Brown soil (Table 3.7). There is a decrease in N
recovery in the wheat compost manure at the highest rate of manure addition. The decrease may
be due to a toxic effect from the high concentration of ions from this manure source, as well as
the supply of available N beyond what the canola plants could assimilate. The corn composted
treatment also decreased in N recovery as rate increased and had lower N recovery values
compared to all other treatments. This manure had increased total N concentration compared to
37
the fresh manures (Figure 3.1) and a narrow C:N value, therefore it is uncertain why this manure
had lower N recovery.
Table 3.6 Mean dry canola total N, P, K and S content for dried distillers’ grains and
solubles (DDGS) wheat fresh and composted, and DDGS corn fresh and
composted treatments at 0, 30, 60, 90, and 120 g kg-1
rates on the Black soil.
Similar to the Brown soil results, canola grown on the corn compost and the wheat fresh
manure recovered manure N to a greater extent than other treatments in the Black soil (Table
3.7). The wheat compost at the highest rate showed a decrease in N recovery in the Black soil,
likely due to toxicity effects and N supplied in surplus of plant needs.
DDGS Manure Rate N P K S
g kg-1
-------------------------- % -------------------------
Wheat Fresh
0 1.2 0.18 3.3 1.4
30 1.1 0.30 3.3 1.3
60 1.1 0.31 3.4 1.1
90 1.5 0.36 4.1 1.2
120 1.8 0.39 4.2 1.3
Wheat Compost
0 1.3 0.18 3.0 1.3
30 1.4 0.35 3.8 0.9
60 2.6 0.42 5.0 1.0
90 3.5 0.45 6.2 0.9
120 4.1 0.51 5.1 0.8
Corn Fresh
0 1.2 0.20 2.4 1.2
30 1.1 0.30 2.7 0.9
60 1.2 0.33 3.2 0.9
90 1.3 0.33 3.3 0.9
120 1.4 0.35 3.4 1.1
Corn Compost
0 1.0 0.19 2.1 0.8
30 1.2 0.29 3.2 0.7
60 1.5 0.31 3.7 0.7
90 2.2 0.36 4.3 0.8
120 2.8 0.39 5.4 0.8
LSD(0.05) 0.55 0.06 1.23 0.6
38
Table 3.7 Mean N recovery (nitrogen uptake efficiency) for dried distillers’ grains and
solubles (DDGS) wheat fresh and composted, and DDGS corn fresh and
composted treatments at 30, 60, 90, and 120 g kg-1
rates on the Brown and Black
soils.
DDGS Manure Rate N Recovery
Brown Soil Black Soil
g kg-1
----------------------%----------------------
Wheat Fresh
30 8 7
60 10 7
90 11 9
120 13 10
Wheat Compost
30 7 6
60 9 8
90 10 7
120 8 3
Corn Fresh
30 5 1
60 5 5
90 4 4
120 4 4
Corn Compost
30 6 8
60 8 7
90 10 9
120 11 10
Overall low N recovery values of cattle manure N by the canola (<10 %) agree with
results of Mooleki et al. (2004) in field trials in Saskatchewan. They also report crop recovery of
fresh cattle manure N in year of application in Saskatchewan to be less than 10 % of the applied
cattle manure N. Much of the N in cattle manure is in organic form and is mineralized slowly to
plant-available inorganic forms NH4+ and NO3
- (Eghball, 2002). Nitrogen recovery values in a
silty clay loam soil in Nebraska over four growing seasons of corn resulted in fresh manure
treatments having a plant N recovery value of 20 % which was higher than the reported N
recovery of 13.7% for composted manure (Eghball and Power, 1999).
Soil NO3-N in the 120 g kg-1
wheat compost manure treatment (mean NO3 = 10.7 mg N
kg-1
) was significantly higher than all other treatments in the Brown soil and greatly elevated
39
(>100 mg N kg-1
) in the Black soil at 90 and 120 g kg-1
rates compared to the two lower rates
(Table 3.8). The increased available NO3-N is indicative of excess N not utilized by the plant and
may have caused plant toxicity at the highest manure rates. The excess NO3-N in the soil after
plant growth may be because of the decreased biomass and thus decreased N uptake at the two
highest rates of manure addition in the Black soil.
Soil NH4-N contents at the end of the growth period were relatively low for all treatments
on the Black and Brown soils (Table 3.8; Table 3.9). Mean NH4-N ranged from 4 mg kg
-1 in the
control treatment to 8.8 mg kg
-1 in the wheat composted treatment at the 60 g kg
-1 rate on the
Brown soil with the highest concentration of 10.3 mg kg
-1 in the wheat fresh (120 mg
kg
-1)
treatment. Mean soil residual NH4-N is relatively low in all treatments because most of the N in
the manure is added in the organic form that only slowly mineralizes to inorganic plant available
forms. Also, NH4-N would be rapidly nitrified to NO3-N (Qian and Schoenau, 1994).
3.3.4 Canola P, K, and S
The canola P and K concentrations were increased by manure amendment to the greatest
extent in the wheat compost manure treatments on the both the Brown and Black soils (Table 3.5
and Table 3.6). The canola P concentrations did not differ between treatments in the fresh
manures types on both soils (Table 3.5 and Table 3.6). The canola P concentration in the wheat
compost manure treatment at 120 g kg-1
rate was significantly higher than all other treatments
and rates on the Black soil (Table 3.6). Although all treatments resulted in a significant increase
in plant P concentration at the lowest rate (30 g kg-1
) compared to controls, the increase in plant
P concentration above 30 g kg-1
rate was not large except with the wheat compost manure on the
Black soil.
40
Table 3.8 Mean soil available NO3-N and NH4-N concentration following harvest of canola
following 35-day growth period for wheat-basded distillers’ grains and solubles
(DDGS) fresh and composted and DDGS corn fresh and composted manure
treatments at 0, 30, 60, 90, and 120 g kg-1
rates on the Brown and Black soils.
The increase in canola P concentration in the composted manures compared to fresh
manures may reflect lower availability of P in the fresh manure sources and/or a lower rate of P
added per unit weight of manure addition. Similar canola P uptake was observed between fresh
and composted manure treatments on a Dark Brown Chernozem in Alberta, which disagrees with
our results (Miller et al., 2004). The different results may be due to different manure types in our
study and the DDGS feedstocks. There also may have been dilution effect with the increased
DDGS Manure
Treatment Rate
Soil Type
Brown Soil Black Soil
NO3-N NH4-N NO3-N NH4-N
g kg-1
----------------------- mg kg-1
---------------------
Wheat Fresh
0 2.1 5.3 3.1 7.2
30 2.5 5.2 4.4 8.2
60 1.7 4.9 2.0 9.3
90 2.5 5.7 1.9 8.7
120 2.0 6.7 2.5 10.3
Wheat Compost
0 1.9 6.5 5.6 7.7
30 1.7 7.3 3.0 6.3
60 1.2 8.8 8.1 7.6
90 2.6 7.5 38.8 8.2
120 10.7 8.4 103.4 9.2
Corn Fresh
0 1.9 5.0 4.8 6.8
30 3.5 6.0 4.0 6.8
60 2.8 6.9 4.3 7.1
90 4.6 6.4 4.7 6.7
120 4.2 6.1 4.3 6.7
Corn Compost
0 2.1 4.0 4.2 5.7
30 3.2 5.2 3.0 7.2
60 3.0 6.3 3.2 7.8
90 4.0 7.6 3.8 9.5
120 3.0 7.1 4.8 8.9
LSD(0.05) 3.5 2.6 11.2 2.5
41
plant biomass causing decreased plant P concentration when comparing the 0 and 30 g kg-1
treatments. The composting process concentrates the P in the manure causing a higher level of
plant available P in the soil per unit of manure added (Eghball et al., 1997).
Similar to P, plant K concentration increased with increasing rate in the composted
manure treatments to a greater extent than the fresh manure treatments on both the Black and
Brown soils (Table 3.5 and Table 3.6). Plant K concentration was highest in the composted
manure treatments at the 90 and 120 g kg-1
rate on the Black soil (Table 3.6). Composted
treatments at the higher rates resulted in increased plant K content compared to their
corresponding fresh manure treatments of the same feed type (Table 3.5). The composting
process concentrates K elevating the K content in the resulting composted manures (Figure 3.1).
Increased K in the composted manures is likely the reason for K accumulation in the plant tissue
and is reflective of the soil K levels in both of the composted treatments.
Sulphur content of canola tissue was more variable than K or P on both the Black and
Brown soils. There was a tendency for S concentration to remain the same or decrease with
manure addition, although not significantly so. This may reflect the relatively high available S
content of the soil and low amount of S added in the manure.
3.3.5 Soil cations and anions
In line with the high K content of the manures (Figure 3.1), extractable K in the soil
increased with increasing rate, and was highest in the composted manure sources on both the
Brown and Black soils (Table 3.9 and Table 3.10). In both soils the extractable K is higher in the
wheat composted manure treatment compared to the other manure types. The corn compost
treatment resulted in a significant increase in soil K concentration at the two highest rates
42
compared to the 30 g kg-1
rate (Table 3.9 and Table 3.10). Mooleki et al. (2004) also found
elevated levels of soil exchangeable K following manure application in central Saskatchewan.
The elevated levels of soil K were consistent with plant tissue K content. The composting
process likely concentrated the K in the composted manure treatments. Eghball et al. (1997)
reported losses of K in the windrow composting process due to leaching from rainfall events. In
this pot study, the K that was not taken up by the plant was accumulated in the soil.
Soil PO4-P and SO4-S followed similar trends for the Black soil and the Brown soil, with
the wheat compost manure having the greatest impact on increasing soil residual P and S at a
given rate compared to the other manure treatments (Table 3.9; Table 3.10). Soil available P and
S increase as manure rate increases. The wheat fresh manure and corn compost manure have a
very similar effect on the soil P levels at each rate. The wheat compost treatment adds more P
and S, which are reflected in the soil nutrient levels following plant growth. The increase in soil
P in the composted manure treatments is because during the composting process, manure P is
concentrated and may be mineralized, with up to 75 % of P being in inorganic labile form
(Eghball, 2003). The soil extractable P concentrations in the composted manure treatments were
all near or above the 100 mg extractable P per kg soil concentration threshold where no response
to P fertilizer addition would be expected.
Soil extractable Cu levels were slightly increased with manure amendment while effects
on extractable Zn were variable in the Brown soil (Table 3.8). Lipoth and Schoenau (2004) noted
that addition of cattle manure to four Saskatchewan soils resulted in only small increases in
extractable metal micronutrients.
43
Table 3.9 Mean soil K, PO4-P, SO4-S and extractable Cu and Zn concentration for dried
distillers’ grains and solubles (DDGS) wheat fresh and composted and DDGS
corn fresh and composted manure treatments at 0, 30, 60, 90, and 120 g kg-1
rates
on the Brown soil.
Addition of manure tended to increase soil extractable Zn and Cu slightly in the Black
soil (Table 3.10). Composted manure forms resulted in greater soil Zn at the same rate of manure
addition. Similar results were observed in a study by Lipoth and Schoenau (2007) where addition
of manure to a Black sandy loam soil in field trials increased the extractable Cu. Analytical error
in either the extraction process or the atomic absorption analyses may account for the very low
DDGS
Manure
Treatment Rate K PO4-P SO4-S Cu Zn
g kg-1
------------------------------ mg kg-1
-----------------------------
Wheat Fresh
0 412 11.0 33.0 0.90 8.5
30 551 42.0 45.0 0.93 5.8
60 647 68.0 51.0 0.95 5.9
90 752 101.0 63.0 1.00 6.2
120 913 134.0 72.0 1.05 8.0
Wheat
Compost
0 431 12.0 48.0 0.87 10.2
30 787 98.0 65.0 0.87 7.7
60 1132 147.0 92.0 0.88 7.0
90 1432 241.0 115.0 1.00 8.0
120 1840 380.0 146.0 1.07 10.0
Corn Fresh
0 422 10.0 35.0 0.88 4.3
30 536 21.0 42.0 0.95 5.2
60 640 39.0 49.0 1.06 6.4
90 746 44.0 67.0 1.05 6.5
120 862 46.0 78.0 1.04 6.4
Corn Compost
0 395 10.0 37.0 0.90 5.2
30 607 44.0 45.0 0.90 5.5
60 762 80.0 52.0 0.92 5.8
90 1015 121.0 69.0 0.93 6.5
120 1161 138.0 81.0 0.94 7.5
LSD(0.05) 112 40.0 22.0 0.10 0.4
44
soil extractable Cu in the 30, 60 and 90 g kg-1
wheat compost treated soils compared to all others
(Table 3.10).
Table 3.10 Mean soil K, PO4-P and SO4-S, Cu, and Zn concentration for dried distillers’
grains and solubles (DDGS) wheat fresh and composted and DDGS corn fresh
and composted manure treatments at 0, 30, 60, 90, and 120 g kg-1
rates on the
Black soil.
3.3.6 Soil pH, salinity, and organic carbon
Both corn composted and fresh manure treated soil in general had higher pH values than
the wheat-based manure sources (Table 3.11). The DDGS corn-based feed source may result in
DDGS
Manure
Treatment Rate K PO4-P SO4-S Cu Zn
g kg-1
---------------------------- mg kg-1
----------------------------
Wheat Fresh
0 644 6.5 44.0 0.88 9.0
30 780 38.0 58.0 0.99 8.7
60 925 72.0 68.0 1.00 9.5
90 989 100.0 66.0 1.10 9.2
120 1142 115.0 75.0 1.20 11.5
Wheat
Compost
0 658 7.0 46.0 0.91 8.5
30 1009 97.0 67.0 0.07 5.0
60 1383 143.0 91.0 0.03 5.0
90 1738 263.0 124.0 0.03 3.8
120 2204 453.0 183.0 1.20 16.8
Corn Fresh
0 661 4.3 48.0 0.85 8.8
30 769 17.0 65.0 0.96 10.2
60 891 41.0 64.0 1.10 10.9
90 984 55.0 66.0 1.10 11.1
120 1061 60.0 71.0 1.10 10.5
Corn Compost
0 662 4.0 46.0 0.89 9.3
30 837 39.0 47.0 0.90 11.5
60 994 86.0 55.0 0.97 12.5
90 1280 140.0 82.0 1.00 18.3
120 1456 168.0 92.0 1.00 19.5
LSD(0.05) 239 52.0 21.0 0.11 3.9
45
slightly more basic manure than DDGS wheat-fed manure. Eghball (2002) also noted that
manure greatly increased the pH of acidic soils and was linked to calcium being applied in the
cattle diets. In the Black soil, the wheat composted manure treatment at the 120 g kg-1
rate was
significantly lower in pH compared to all other treatments (Table 3.11). The trend in pH was
different in the Black soil compared to the Brown soil in that the wheat compost manure was the
only manure type that caused a decrease in pH in the Black soil. The pH was not greatly affected
by other manure treatments.
Soil electrical conductivity (EC), a measure of salt content, was related to rate of manure
application. The EC increased with increasing rate in all treatments and especially for the wheat
cattle composted manure treatment in both the Black and Brown soils (Figure 3.4; Figure 3.5).
The wheat composted manure at 90 and 120 g kg-1
rates had significantly elevated EC levels
compared to all other treatments on the Black soil (Figure 3.5). These treatments may show signs
of plant toxicity because of the high salts added in the manure. Hao et al. (2009) also reported
that soil EC increased with increasing portion of DDGS in feed and with increasing rate of
manure addition.
Electrical conductivity levels above 1-2 mS cm-1
(1:2 soil:water suspension) may be
harmful to the growth of some crops in Saskatchewan (Saskatchewan Agriculture Knowledge
Centre, 2008). Guidelines for Alberta, Manitoba, and Saskatchewan state that manure should not
be applied to soil if it has an electrical conductivity greater than or equal to 4 mS cm-1
because
there is a risk of adding too many salts such as NH4, K, Ca, Mg, and Na (The Prairie Province’s
Committee on Livestock Development and Manure Management, 2001). The high EC in the
wheat compost manure treatments is consistent with the decrease in plant biomass at the highest
rates because of the salinity affecting plant growth.
46
Table 3.11 Mean soil pH for dried distillers’ grains and solubles (DDGS) wheat fresh and
composted and DDGS corn fresh and composted manure treatments at 0, 30, 60,
90, and 120 g kg-1
rates on the Brown and Black soils.
DDGS Manure Treatment
Rate pH
g kg-1
soil Brown Soil Black Soil
Wheat Fresh
0 7.5 7.8
30 7.5 7.8
60 7.6 7.8
90 7.5 7.8
120 7.5 7.7
Wheat Compost
0 7.5 7.7
30 7.5 7.8
60 7.6 7.6
90 7.5 7.6
120 7.5 7.3
Corn Fresh
0 7.5 7.8
30 7.6 7.9
60 7.7 7.8
90 7.7 7.8
120 7.7 7.8
Corn Compost
0 7.5 7.7
30 7.7 7.6
60 7.7 7.7
90 7.7 7.7
120 7.6 7.7
LSD(0.05) 0.2 0.2
Soil organic C concentration increased as rate increased for wheat compost manure
treatment, with the 120 g kg-1
rate having significantly higher organic C than all other treatments
on both the Brown and Black soils (Figure 3.4; Figure 3.5). The wheat compost manure at 90 g
kg-1
rate and the wheat fresh manure at 120 g kg-1
rate are the only other two treatments that have
significantly increased SOC content compared to the control on the Black soil (Figure 3.5). The
other manure types do not have a significant rate effect on SOC. Whalen et al. (2008) observed a
similar trend with SOC content from cattle composted manure application in a field study in
47
Quebec. In this study, SOC increased at a rate of 1.35 Mg C ha-1
yr-1
as a result of manure
addition and significant C inputs from adding composted manure to soil. The stabilized nature of
the C in the composted manure may contribute to greater sequestration of C in the soil.
Figure 3.4 Mean soil electrical conductivity (EC) and soil organic carbon (SOC) for dried
distillers’ grains and solubles (DDGS) wheat fresh and composted and DDGS
corn fresh and composted manure treatments at 0, 30, 60, 90, and 120 g kg-1
rates
on the Brown soil.
0.0
0.5
1.0
1.5
2.0
2.5
3.0
3.5
4.0
4.5
0 10 20 30 40 50 60 70 80 90 100 110 120 130
EC (
mS
cm-1
)
Manure Rate (g kg-1)
DDGS Wheat Fresh Manure
DDGS Wheat Compost
DDGS Corn Fresh Manure
DDGS Corn Compost
0.0
1.0
2.0
3.0
4.0
5.0
6.0
0 10 20 30 40 50 60 70 80 90 100 110 120 130
SOC
(%
)
Manure Rate (g kg-1)
48
Figure 3.5 Mean soil electrical conductivity (EC) and soil organic carbon (SOC) content for
dried distillers’ grains and solubles (DDGS) wheat fresh and composted and
DDGS corn fresh and composted manure treatments at 0, 30, 60, 90, and 120 g
kg-1
rates on the Black soil.
3.4 Conclusion
The wheat-based DDGS fresh manure produced the highest biomass yield and resulted in
the highest N recovery compared to all other manures in this study. The DDGS-fed composted
cattle manure contained elevated concentrations of N and P which were concentrated through the
composting process. Application of the wheat DDGS-fed composted manure resulted in greater
0.0
0.5
1.0
1.5
2.0
2.5
3.0
3.5
4.0
4.5
0 10 20 30 40 50 60 70 80 90 100 110 120 130
EC (
mS
cm-1
)
Manure Rate (g kg-1)
DDGS Wheat Fresh Manure
DDGS Wheat Compost
DDGS Corn Fresh Manure
DDGS Corn Compost
0.0
1.0
2.0
3.0
4.0
5.0
6.0
0 10 20 30 40 50 60 70 80 90 100 110 120 130
SOC
(%
)
Manure Rate (g kg-1)
49
accumulation of nutrients in plant material and soil than the other sources, and was associated
with toxicity to canola at rates above 60 g kg-1
(90 and 120 t ha-1
). The increased concentration
of salts in the wheat DDGS -fed composted manure treatments was likely a cause of the decrease
in plant biomass with increased rate of manure addition. The plant biomass yield also reflects the
N recovery values which decreased at the highest rates of addition for the wheat DDGS -fed
composted manure treatments. The toxic effects at high rates appeared to be more pronounced in
the Black soil compared to the Brown soil. The N in wheat DDGS manures in general was
recovered by canola to a greater extent compared to the corn DDGS manures.
Composted treatments resulted in higher soil residual P levels compared to the fresh
manure treatments, in line with higher manure P content. The increased P in the composted
manures has the potential for P loading in soil and would require reduced rates to avoid
excessive build-up of PO4-P in the soil. Phosphorus-based applications of manure would better
match crop demand than N-based manure applications.
The wheat DDGS compost manure application resulted in a trend of increased soil EC,
SOC, P, and S with increasing rates. Loss of dry matter content and moisture in composting
concentrates the anions and cations (salts) in the remaining solids. A toxic effect is possible if the
wheat DDGS -fed composted cattle manure is applied at high rates over short intervals. Even a
single application at a high rate of 120 g kg-1
may be detrimental.
The Black soil and Brown soil responded in a similar manner to the addition of the
different manures under controlled environment conditions. Out of the four DDGS-fed manures
studied, the wheat-based DDGS fresh manure at 180 t ha-1
on the Brown soil and the wheat-
based DDGS fresh manure at 240 t ha-1
on the Black soil is the manure and rates that resulted in
50
the highest biomass yield, favourable N recovery, and low toxic effects. Evaluation of DDGS-fed
cattle manures under field conditions where environmental conditions differ is suggested.
Meeting crop nutrient demands is important with the application of manure and it is
important to consider that cattle feed source and manure processing such as composting creates
manure with increased levels of nutrients such as N and P. The composting process creates a
more stable and uniform manure product that is more concentrated in nutrients and cations
compared to fresh manure, therefore, rates should be adjusted downward accordingly for DDGS-
based composted manures. The optimum rate of manure is very much influenced by feed grain
source and manure processing.
51
4.0 APPLICATION OF ALFALFA PELLETS AND BIOCHAR TO RECLAIM
PRODUCTIVITY OF A DISTURBED SOIL
4.1 Introduction
Traditionally, farm yard manure has been used as an organic amendment in agricultural
operations to increase the soil N and P fertility and nutrient cations in the soil (Wahid et al.,
1998). In addition, organic amendments have been used in the reclamation of contaminated or
disturbed soils for many years (Wahid et al., 1998; Grigg et al., 2006; Park et al., 2010). Organic
composts and municipal wastes can improve soil fertility, increase plant growth, and enhance
bioremediation (Park et al., 2010). Moreover, municipal solid waste compost has been shown to
increase soil productivity in salt-affected soils (Lakhdar et al., 2011).
Saskatchewan is the world’s largest producer of potassium fertilizers, all of which are a
product of the mining and refining of potash deposits. As with any large construction, however,
the establishment of potash mines and refineries is associated with significant ecosystem
disturbance. Moreover, there is the potential for soil salinization through seepage from tailings
ponds and pipeline breaks causing brine spills, as well as from aeolian deposits of refinery dust.
In addition to minimizing risks, the reclamation of any disturbed or salt-affected soils is often
required, and one of the least invasive and most cost-effective methods of accomplishing this is
phytoremediation. Phytoremediation is the name given to a set of technologies that involve the
use of plants to remediate contaminated or disturbed sites. Of particular interest is the technique
known as phytostabilization, which uses plants and plant roots to prevent contaminant migration
via wind and water erosion, leaching, and soil dispersion (USEPA, 2000). Phytoaccumulation,
on the other hand, involves the uptake of soil constituents into the plant tissue, which, when
52
followed by plant removal, results in extraction of the contaminant from the site. An example is
the use of native, hyperaccumulating halophytes to decrease Na+ concentrations in salt-affected
soils (Keiffer and Ungar, 2002). Regardless of the mechanism involved, phytoremediation often
requires the application of soil amendments to achieve enhanced plant germination and growth
(Neuman and Ford, 2006).
Organic amendments can assist in the successful reclamation of degraded or salt-affected
soils by improving soil quality. Park et al. (2010) suggest that organic amendments play an
important role in improving rhizosphere conditions for plant growth by enhancing the plant-
available nutrient supply and reducing contaminant bioavailability. However, the release of
nutrients from organic sources depends on the chemical composition of the organic amendment
(Agehara and Warncke, 2005). Thus, Puschell et al. (2011) concluded that the amount of
amendment required was plant-specific and that even low rates can have beneficial effects on the
reclamation of mine spoil banks.
Keiffer and Ungar (2002) reported that increased germination of autumn-sown halophytic
plant species on salt-affected sites was associated with increased soil moisture. Alfalfa pellets,
which absorb water and can swell to nearly three times their original size, can increase the water
holding capacity of the soil (Qian et al., 2008). Moreover, alfalfa powder applied as a soil
amendment has been shown to increase the plant uptake of nutrients such as P, K, and S (Qian et
al., 2011). Thus, alfalfa pellets appear to have potential as a low-cost, natural way to add organic
matter, increase the supply of both plant-available nutrients and water, and promote plant growth
for reclamation purposes.
Biochar has been used as a soil amendment to improve the agronomic qualities of
degraded soils for centuries (See Chapter 2: Literature Review); thus, there is potential to use
53
biochar as an amendment for the purpose of reclaiming contaminated or degraded soils. Fellet et
al. (2011) used biochar to increase the cation exchange capacity and water holding capacity of
mine spoil soils in Italy and to promote phytostabilization by assisting in the development of a
“green cover”. Stelner et al. (2008) concluded that treatments with charcoal (a form of biochar)
increased plant N uptake, as well as N retention in a highly weathered soil in Brazil. Clough and
Condron (2010) and Gathorne-Hardy et al. (2009) also reported that biochar increased the
efficiency of N fertilizers in degraded tropical soils and in some temperate soils. However, few
studies have assessed the performance of biochar in the reclamation of degraded soils in
temperate regions.
The objective of this study was to evaluate the effect of adding alfalfa pellets or biochar
on soil conditions and plant growth at the perimeter of the PotashCorp-Cory Division mine and
refinery. Experimental plots were established at two locations: (1) a degraded soil adjacent to a
brine containment pond and (2) on the berm surrounding the brine containment pond. Effects of
the amendments on soil chemical properties (EC, pH), soil and plant nutrients (C, N, P, K, Cu,
and Zn), and grass yield were determined following the first year of application.
The hypothesis of this study was that the addition of the alfalfa pellet and biochar
amendments will improve the soil quality and increase plant growth on degraded soils.
4.2 Materials and Methods
4.2.1 Site selection
The research plots were located at the Potash Corporation of Saskatchewan (PCS) Cory
Division mine and refinery, located approximately 6.5 km west of the city of Saskatoon, along
Highway 7. A site visit was carried out on September 29, 2009 to select a suitable location for
the field studies, with two areas selected as being appropriate for reclamation trials due to their
54
low percentage of plant cover. The first site (termed the “Degraded” area) was located
approximately 30 m south of a containment pond, in an area disturbed by excavation activity
during construction of the berm surrounding the pond (Figure 4.1A). The second site (termed the
“Berm” area) was located on the south sloping face of the berm itself (Figure 4.1B).
Figure 4.1 Southwest facing photographs of the experimental plots in the (A) Degraded area
and (B) the Berm area in the fall of 2009.
Soil samples (0–30 and 30–60 cm) were collected from the Degraded area at the time of
the initial site selection. The electrical conductivity (EC in a 1:2 soil:water paste) of the samples
was found to be relatively low, averaging 0.11 (±0.01) mS cm-1
at 0–30 cm and 0.12 (±0.03) mS
cm-1
at 30–60 cm (Appendix B – Table B.2). The low ECs in the Degraded area led to the
decision to have a companion trial on the Berm, which was thought to be more impacted by salt.
Indeed, ECs were about 6- to 13-times greater in the Berm plots [averaging 0.63 (±0.30) mS cm-1
at 0–30 cm and 1.54 (±0.69) mS cm-1
at 30-60 cm] than in the Degraded area. The clay Berm
consisted of material that was hauled in to create a containment area for saline clay tailings from
the refinery; consequently, the Berm plots were on a steep (ca. 10%) slope.
A B
55
4.2.2 Plot design
Plots (2 m x 2 m) in the Degraded area were set-up in a Randomized Complete Block
Design (RCBD) with six treatments replicated four times (Figure 4.2A). The six treatments were:
the control (unamended); alfalfa pellets at 5, 10 and 20 t ha-1
; and biochar at 5 t ha-1
with or
without added urea (46-0-0) fertilizer (50 kg N ha-1
=109 kg urea ha-1
) (see Table 4.1). Each
block ran east to west.
Figure 4.2 Diagram of the experimental plots in (A) the Degraded area adjacent to berm and
(B) the Berm area itself. The field plots were located at the PCS–Cory Division site.
1 5 2 4 6 3
5 4 1 3 2 6
4 1 6 5 2 3
5 6 2 4 1 3
2 m
2m
NA
5 2 1
1 5 2
1 2 6
5 1 2
2 m
2m
NB
5
56
Plots (2 m x 2 m) in the Berm area were set-up in a Randomized Complete Block Design
(RCBD) with three treatments replicated four times (Figure 4.2B). The three treatments were the
control (unamended; Trt. 1); alfalfa pellets at 5 t ha-1
(Trt. 2) and biochar at 5 t ha-1
(Trt. 5).
Each block ran east to west across the slope of the berm.
Table 4.1 Soil amendments and application rates used at the PCS–Cory Division site†.
Trt No. Amendment Type Application Rate
t ha-1
kg ha-1
kg per 4 m2 plot
1 Control 0 0 0
2 Alfalfa pellets 5 5000 2
3 Alfalfa pellets 10 10000 4
4 Alfalfa pellets 20 20000 8
5 Biochar 5 5000 2
6 Biochar + Urea‡ 5 5000 2
† All six treatments were applied at the Degraded site, but only Treatments 1, 2 and 5 were
applied at the Berm site. ‡ 109 kg urea ha
-1or 44 g urea per 4 m
-2 plot.
The Biochar used in this study was produced from oat hull feedstock by Titan Resources
(Craik, SK). The alfalfa pellets were manufactured and supplied by Western Alfalfa Milling Co.,
Ltd. (Norquay, SK). The total C, N and S contents of the biochar and alfalfa pellets were
determined using a Leco analyzer. Total P content of the biochar and alfalfa pellets was
determined by ALS Laboratories (Saskatoon, SK). Results of the analyses are summarized in
Table 4.2. Treatment No. 6 consisted of biochar supplemented with urea (46-0-0) fertilizer,
which was applied (broadcast) at a rate of 50 kg N ha-1
or 44 g of urea per 4 m2 plot.
The experimental plots were established on October 5, 2009. The soils were prepared by
first roto-tilling the surface to a depth of approximately 10 cm to break-up the soil and prepare a
57
level seed bed. After roto-tilling, the amendments (pre-weighed) were applied by spreading
evenly over the plot area by hand and then gently raking the amendment into the topsoil layer.
Table 4.2 Chemical properties of the oat hull biochar and alfalfa pellets applied at the PCS–
Cory Division site.
Amendment C N S P C:N C:S
- - - - - - - - - - % - - - - - - - - - -
Biochar 71.4 1.54 0.12 2.5 46 1020
Alfalfa Pellets 73.8 4.1 0.57 0.2 18 130
4.2.3 Field operations
The plots were sampled on May 7, 2010, with three soil cores (0–60 cm, at 15-cm depth
intervals) collected from each plot using a Dutch auger. For each sampling depth, the cores were
combined into a single composite sample and returned to the Department of Soil Science in
Saskatoon for processing and analysis. Each plot was then seeded with tall wheatgrass
(Thinopyrum elongatum) at a rate of 5 g m-2
. The pre-weighed seed was spread evenly over each
plot by hand and raked into the surface layer of soil. Digital photography was used to record the
status of the plant communities on June 7 and July 14, 2010 (see Appendix B, Figure B.3; Figure
B.4; Figure B.5).
The plots were harvested for above-ground biomass on August 6, 2010. The dominant
plant species in each plot was recorded prior to harvest; a representative sample of the above-
ground biomass was collected from a 1-m2 area in the southwest corner of each plot by cutting
the plants ca. 5 cm above the soil surface. The plant samples were placed in cloth bags and
returned to the Department of Soil Science.
Soil samples also were taken from each plot at harvest, with three soil cores (0–60 cm, at
15-cm depth intervals) collected from each plot using a Dutch auger. For each sampling depth,
58
three cores were combined into a single composite sample and returned to the Department of
Soil Science for processing and analysis.
Soil samples were air-dried at 30oC, then pulverized to pass through a 2-mm sieve. The
processed, dried samples were then put into vials for further lab analysis. The plant samples
were air-dried in a forced-air oven at 30oC in the cloth bags, weighed for yield, then sub-sampled
and ground. The ground plant material was placed in vials for further lab analysis.
4.2.4 Soil analysis
Soil pH and electrical conductivity (EC) were determined using 1:2 (w/v) soil:water
extracts; i.e., 20 g of soil was weighed into extraction bottles to which 40 mL of distilled water
was added. The bottles were shaken on a rotary shaker at 142 rpm for 20 minutes and then left to
settle for one hour. The supernatant solutions were filtered (Whatman No. 1 filter paper) into
plastic vials which were then capped (Rhoades, 1982). Soil pH measurements were obtained by
inserting a pH probe into the extractant and the reading recorded from a Beckman pH meter. A
Beckman EC meter was used for the EC measurements (Richards, 1969) by inserting the probe
into the extraction solution and recording the reading. The probe was rinsed thoroughly with
distilled water between each measurement for both pH and EC.
The concentrations of NO3 and NH4 were determined using 2M KCl extracts (Keeney
and Nelson, 1982). Approximately 5.0 (±0.1) g of soil was extracted with 50 mL of 2M KCl
solution by shaking the soil:KCl suspension on a rotary shaker at 142 rpm for one hour, filtering
the suspension (VWR No. 454 filter paper) into plastic vials, and storing the vials in a
refrigerator/freezer until the available N could be colorimetrically determined using the
Technicon Autoanalyzer II (Tarrytown, NY).
59
Available P and K were extracted using the Modified Kelowna method (Qian et al.,
1994). The extracting solution was prepared by combining 28 mL of 0.25M acetic acid, 38.5 mL
of 0.25M sodium acetate, and 1.11 g of 0.015M ammonium flouride in a 2-L bottle.
Approximately 3.00 (±0.1) g of soil was weighed into a small plastic bottle along with 30 mL of
the Kelowna solution. The resulting suspensions were shaken on a reciprocating shaker at 160
rpm for 5 minutes, filtered (VWR No. 454 filter paper) into plastic vials, and stored in a
refrigerator/freezer until the extracts could be analyzed. The P in the extracts was determined
colorimetrically using the Technicon Autoanalyzer II. The Varian SpectraAA 220 flame atomic
absorption spectrometer (Varian Australia, 2000) was used for analysis of K in the extract.
Available SO4–S was extracted using 20.0 (±0.1) g of soil, which was weighed into a
100-mL extraction bottle containing 40 mL of 0.01M CaCl2 solution. The bottles were placed on
the rotary shaker and shaken at 142 rpm for 30 minutes; the solution in each bottle was then
filtered (VWR No. 454 filter paper) into a plastic vial and placed in a refrigerator/freezer to await
analysis colorimetrically on the Technicon Autoanalyzer II.
Degraded soil can be deficient in micronutrient metals such as Cu and Zn; therefore, soil
samples from 2010 were analyzed for Cu and Zn. Plant available Cu and Zn were extracted using
a diethylenetriaminepentaacetic acid (DTPA) solution (Lindsay and Norvell, 1978). The DTPA
solution was prepared using 0.005 M DTPA, 0.01 M CaCl2, and 0.1 M triethanolamine (pH 7.3).
Ten grams of the DTPA solution was added to about one gram of soil and shaken at 142 rpm for
two h. The suspension was then filtered (VWR No. 454 filter paper) and the filtrate analyzed for
Cu and Zn concentration using a Varian SpectraAA 220 flame atomic absorption spectrometer
(Varian Australia, 2000).
60
Cation exchange capacity (CEC) was determined using an ammonium acetate extraction
with 40 mL of 1M ammonium acetate and 10 g of soil combined and shaken at 142 rpm for
approximately 5 min (Hendershot et al., 1993). The concentrations of exchangeable Na+, Ca
2+,
Mg2+
, and K+ in the extracts were determined using a SpectraAA 220 Atomic Absorption
Spectrometer (Varian Australia Pty Ltd., Mulgrave, Victoria, Australia), and calculating the CEC
(cmolc kg-1
) based on the sum of the NH4OAc-extractable cations (Equation 4.1).
230390120200/
ppmNappmKppmMgppmCakgcmolcCEC [4.1]
Prior to analysis of soil organic C, and to obtain a more uniform sample size, sub-samples
of the sieved soils were ball milled to pass a 100 mesh sieve. Percentage total organic carbon
(TOC) was then determined via combustion at 842°C (Wang and Anderson, 1998) using the
Leco 632 Carbon Determinator (Leco Corporation, St. Joseph, Missouri USA).
4.2.5 Plant analysis
Total plant N, P, and K were determined using the sulphuric acid-peroxide digest method
(Thomas et al., 1997). Finely ground plant material (0.2500 to 0.3000 g) was weighed into a 100
mL glass digestion tube and, under a fume hood, 5 mL of concentrated (18M) sulphuric acid was
added to each tube. The soil:H2SO4 suspensions were then mixed on a vortex mixer and placed
in a heating block that was pre-heated to 360oC. Once on the heating block, the suspensions were
digested for 30 minutes then removed and cooled for about 20 minutes, at which time 0.5 mL of
30% (v/v) H2O2 (hydrogen peroxide) was added to each tube which was then mixed on a vortex
mixer. The digestion tubes were then returned to the heating block and the process repeated until
the solution became colorless (about six times). Once the solution was colorless, 0.05 mL H2O2
was added to each tube and the tubes returned to the heating block for an additional 60 minutes
61
to remove all the H2O2. The tubes were then removed from the heating block and allowed to cool
overnight; the next day, deionized water was added to each tube to just below the volume line
while vortexing. The tubes were again allowed to cool to room temperature at which time they
were brought to a final volume of 75 mL with deionized water. The tubes were then capped with
a rubber stopper, inverted five to six times to mix well, and then sub-sampled into a vial. The
extrant was analysed for N, P, and K concentration using the Technicon Autoanalyzer II.
Total plant S was determined using a Leco TruSpec Sulphur Analyzer. Ball ground plant
material was weighed (approx. 0.010 ±0.001 g) into a ceramic boat and placed in the LECO
Sulphur analyzer. The sulphur in the samples is converted to SO2 during a three minute
combustion, and the SO2 concentration output was recorded.
4.2.6 Statistical analysis
The R Statistical Program was used to analyze the data using General Linear Model
(GLM) and a one-way analysis of variance (ANOVA). Significant differences between
treatments were determined using mean separation with Fischer least significant different (LSD)
at p ≤ 0.05.
4.3 Results and Discussion
4.3.1 Degraded area soil properties
Surface applications of the soil amendments often produced significant changes in the
chemical properties in the upper 0–15 cm of the soil profile, but rarely had any significant effect
on the properties of the sub-surface (15–30 and 30–60 cm depth) soils. Consequently, only the
data for the surface soils (0–15 cm depth) will be considered in the following discussion1.
1 Note: data for all three sampling depths (0–15, 15–30 and 30–60 cm depths) are shown in Appendix B.
62
Surface (0–15 cm) soils in the Degraded area were classified as being slightly alkaline
(with pHs ranging from 7.3–7.7) and non-saline (EC < 2 mS cm-1
) (Table 4.3; Table 4.4). These
values are similar to those reported elsewhere for the PCS–Cory Division mine/refinery site
(Farrell et al., 2010) and indicate that there have been minimal salt effects from the nearby
tailings pond. Surface ECs in the biochar-amended plots were slightly, but not significantly,
greater than those in the control plots in the fall of 2010, which presumably reflects an effect of
the biochar itself. The EC values in the Degraded area are 0.2-0.3 mS cm-1
, which is less than 4
mS cm-1
when some restriction on growth of non-salt tolerant plants may occur (Saskatchewan
Ministry of Agriculture, 2008).
Table 4.3 Soil pH, electrical conductivity (EC), cation exchange capacity (CEC), and
organic carbon (OC) concentration on the Degraded area for all six treatments.
(AP5 = alfalfa pellets at 5 t ha-1
; AP10 = alfalfa pellets at 10 t ha-1
; AP20-alfalfa
pellets at 20 t ha-1
; B5 = biochar at 5 t ha; B5u =biochar at 5 t ha-1
plus urea at 50
kg N ha-1
). Soil samples were taken in the spring of 2010 at the 0–15 cm depth.
Trt. No. Trt. ID pH EC CEC OC
mS cm-1
cmolc kg-1
%
1 Control 6.2 0.2 10.0 0.9
2 AP5 7.5 0.2 11.3 1.2
3 AP10 7.7 0.2 11.6 1.3
4 AP20 7.7 0.2 11.5 1.1
5 B5 7.4 0.3 11.8 1.1
6 B5u 7.5 0.2 11.6 1.3
LSD0.05 ns ns ns ns
The addition of alfalfa pellets or biochar to the plots resulted in only small increases in
the organic carbon content of the surface soils (Table 4.3). Moreover, SOC content did not vary
from spring 2010 to fall 2010 (Tables 4.3 and 4.4). Not surprisingly, given that the biochar and
alfalfa pellets were surface applied, amendment effects were not observed in the subsurface (i.e.,
at 15–30 or 30–60 cm depth). Nevertheless, reclaiming soil by establishing grasslands is known
63
to increase soil organic carbon over time (Nelson et al., 2008), which is beneficial to the long-
term soil health.
Table 4.4 Soil pH, electrical conductivity (EC), cation exchange capacity (CEC), and
organic carbon (OC) concentration on the Degraded area for all six treatments.
(AP5 = alfalfa pellets at 5 t ha-1
; AP10 = alfalfa pellets at 10 t ha-1
; AP20-alfalfa
pellets at 20 t ha-1
; B5 = biochar at 5 t ha; B5u = biochar at 5 t ha-1
plus urea at 50
kg N ha-1
). Soil samples were taken in the fall of 2010 at the 0–15 cm depth.
Trt. No. Trt. ID pH EC CEC OC
mS cm-1
cmolc kg-1
%
1 Control 6.0 0.1 9.3 0.8
2 AP5 7.6 0.1 10.3 1.3
3 AP10 7.5 0.1 10.4 1.4
4 AP20 7.4 0.1 10.2 1.4
5 B5 7.5 0.2 10.2 1.0
6 B5u 7.5 0.2 10.5 1.4
LSD0.05 ns ns ns ns
Cation exchange capacity (CEC) was significantly higher in the upper 0–15 cm of the soil
profile compared to the 30–60 cm depth (see Appendix B, Table B.8; Table B.9). Whereas, the
amendment additions resulted in small increases in CEC (Tables 4.3 and 4.4), treatment
differences were not significant. Spring CEC values in the surface horizon ranged from 10.0
cmolc kg-1
in the control to 11.8 cmolc kg-1
in the biochar (5 t ha-1
) treatment. Cation exchange
capacity in the fall samples decreased slightly, relative to the spring samples, ranging from 9.3
cmolc kg-1
in the control to 10.5 cmolc kg-1
in the biochar + urea treatment. The small decrease in
CEC observed in the fall samples presumably reflects the effects of plant uptake. Likewise, the
small increase in CEC in the topsoil layer of this sandy degraded area most likely reflects the
small increase in soil organic matter content (Liang et al., 2006).
The addition of both alfalfa pellets and biochar to the soil initially resulted in small
increases in the mean NO3-N concentration in the top 0-15 cm of the soil profile (Table 4.5). Due
to large inherent spatial variability, however, treatment differences were not significant. Alfalfa
64
pellets had no significant effect on the concentration of NH4-N in the upper 0-15 cm, although
other studies have shown that microbial decomposition and mineralization of the alfalfa pellets
releases NH4+ ions into the environment (Godde and Conrad, 2000; Qian et al., 2011). This
suggests that there was incomplete decomposition of the alfalfa pellets.
Table 4.5 Soil NO3, NH4, PO4, SO4, and K (Kelowna extractable) concentration on the
Degraded area for all six treatments. (AP5 = alfalfa pellets at 5 t ha-1
; AP10 =
alfalfa pellets at 10 t ha-1
; AP20-alfalfa pellets at 20 t ha-1
; B5 = biochar at 5 t ha-1
;
B5u = biochar at 5 t ha-1
plus urea at 50 kg N ha-1
). Soil samples were taken in the
spring of 2010 at the 0–15 cm depth.
Trt.
No. Trt. ID NO3–N NH4–N PO4–P SO4–S K
------------------------------------- mg kg-1
----------------------------------------
1 Control 3.1 6.6 4.5 4.0 297.9
2 AP5 8.2 6.0 4.7 4.7 388.8
3 AP10 6.5 5.3 6.8 4.3 410.9
4 AP20 8.2 7.3 6.0 5.5 417.1
5 B5 9.8 12.1 5.3 9.6 473.4
6 B5u 10.9 6.5 9.1 6.0 438.2
LSD0.05 ns ns ns ns ns
Table 4.6 Soil NO3, NH4, PO4, SO4, and K (Kelowna extractable) concentration on the
Degraded area for all six treatments. (AP5 = alfalfa pellets at 5 t ha-1
; AP10 =
alfalfa pellets at 10 t ha-1
; AP20 = alfalfa pellets at 20 t ha-1
; B5 = biochar at 5 t
ha-1
; B5u = biochar at 5 t ha-1
plus urea at 50 kg N ha-1
). Soil samples were taken
in the fall of 2010 at the 0–15 cm depth.
Trt.
No. Trt. ID NO3–N NH4–N PO4–P SO4–S K
------------------------------------ mg kg-1
---------------------------------------
1 Control 1.0 1.7 4.8 1.5 206.6
2 AP5 2.3 2.6 6.0 1.7 287.3
3 AP10 1.4 2.6 9.5 1..3 321.0
4 AP20 2.6 2.9 6.3 2.8 228.0
5 B5 2.5 2.4 4.2 2.6 221.2
6 B5u 1.9 2.7 7.8 1.7 242.7
LSD0.05 ns ns 3.4 ns ns
65
By the fall of 2010, any inorganic N added as a result of the soil amendments was not
apparent; i.e., the inorganic N pool in the soil had been depleted during the growing season by
plant uptake (Table 4.6). Again, as in the spring, there was no significant difference between
treatments.
In general, extractable soil P levels were quite low in the Degraded area, ranging from
4.5–9.1 mg PO4-P kg-1
in the spring and from 4.2–9.5 mg PO4-P kg-1
in the fall (Tables 4.5 and
4.6). Whereas there were no significant treatment differences in the spring samples, significant
treatment effects were observed in the fall samples (p = 0.001). Soil available P levels in the
biochar plus urea treatment were higher than those in either the control or biochar-amended
plots. Likewise, the alfalfa (10 t ha-1
) treatment exhibited significantly higher soil available P
concentrations than the control. There was also evidence from the fall vs. spring data that the
alfalfa pellets may have acted as a source of available/extractable P, whereas the biochar may
have acted as a sink for this P. That is, fall available P levels in the soils amended with alfalfa
pellets tended to be comparable to, or greater than those found in the spring; conversely, fall
available P levels in the soils amended with biochar tended to be lower than those measured in
the spring (see Tables 4.5 and 4.6).
As the alfalfa pellets decompose in the soil, plant available P can be released through
mineralization, explaining the increase in soil available P in the topsoil layer. Alfalfa pellets
improved the uptake of nutrients in a growth chamber experiment with canola (Qian et al., 2008;
2011). In the biochar + urea treatment, the increase in soil P also may reflect enhanced release of
the native soil-P as a result of an increase in the soil pH associated with urea hydrolysis and
dissolution of the soil organic matter (Hartikainan et al., 1996).
66
The soil amendments had no significant effect on available sulphur (i.e., SO4–S) in either
the spring or fall (Table 4.5 and 4.6). Much like the available N, however, there was significant
depletion of the available SO4–S pool during the growing season. Similar trends were observed
for ammonium acetate extractable K (Table 4.5 and 4.6), Ca, Na, and Mg (Appendix B, Table
B.8; Table B.9). Likewise, the concentrations of extractable Cu and Zn in the soils exhibited no
significant treatment effect (Appendix B - Table B.10).
4.3.2 Berm area soil properties
Soils in the Berm area were naturally more alkaline and slightly more saline than soils in
the Degraded area, and were less affected by the biochar and alfalfa pellet amendments (Tables
4.7 and 4.8). Likewise, the CEC in the Berm soils was about 2.5-times greater than that in the
Degraded area. These differences presumably reflect the fact that the Berm is a “constructed
soil” likely derived from carbonate- or gypsum-rich C-horizon material with a high clay content.
Table 4.7 Soil pH, electrical conductivity (EC), cation exchange capacity (CEC), and
organic carbon (OC) concentration on the Berm for all three treatments.
(AP5=alfalfa pellets at 5 t ha-1; B5=biochar at 5 t ha-1). Soil samples were
taken in the spring of 2010 at the 0-15 cm depth.
Trt. No. Trt. ID pH EC CEC OC
mS cm-1
cmolc kg-1
%
1 Control 8.3 0.4 26.2 0.8
2 AP5 8.1 0.5 25.9 0.7
5 B5 8.2 0.5 27.7 0.9
LSD0.05 ns ns ns 0.2
The initial soil organic carbon content of the Berm soils (Table 4.7) was comparable to
that of the Degraded soils (Table 4.3), which again is thought to be an artifact of the Berm
construction. The biochar treatment resulted in a small, but significant (p = 0.01) increase in
SOC compared to the control and alfalfa pellet treatment (Table 4.7). This is consistent with the
67
high carbon content (~70 % C) and relative recalcitrance of the biochar. Steinbeiss et al. (2009)
also reported increases in SOC in a silty clay soil amended with biochar. Novak et al. (2009) also
observed a significant increase in SOC in a highly weathered sandy acidic soil amended with 2%
biochar.
Table 4.8 Soil pH, electrical conductivity (EC), cation exchange capacity (CEC), and
organic carbon (OC) concentration on the Berm for all three treatments.
(AP5=alfalfa pellets at 5 t ha-1
; B5=biochar at 5 t ha-1
). Soil samples were
taken in the fall of 2010 at the 0-15 cm depth.
Trt. No. Trt. ID pH EC CEC OC
mS cm-1
cmolc kg-1
%
1 Control 8.1 0.4 24.2 0.5
2 AP5 8.1 0.3 26.1 0.6
5 B5 8.2 0.3 25.9 0.7
LSD0.05 ns ns ns ns
No significant difference in organic carbon was observed between treatments in the fall
samples, though the response pattern was similar to that observed in the spring, with the biochar
treatment having slightly higher organic carbon (Table 4.8). Biochar provides a recalcitrant form
of organic carbon when added to the soil. However, the biochar may not have been added at a
high enough rate to produce a detectable increase in total organic C content of the soil over the
longer term. An increase in SOC was observed in a growth chamber study on an Australian
Alfisol after radishes were grown for six weeks (Chan et al., 2007). The biochar may only have a
significant effect on soil SOC in extremely degraded soils such as highly weathered tropical
soils.
Concentrations of inorganic N were considerably lower in the unamended Berm soils
(Table 4.9) than in the soils from the Degraded area (Table 4.5). Conversely, concentrations of
SO4–S were much higher in the Berm soils than the Degraded soils. Again, these differences
68
presumably reflect the composition of the soil materials used to construct the Berm, and are
consistent with the types of gypsum-containing materials present at the PCS–Cory Division site
(Farrell et al. 2011). Available P concentrations in the Berm and Degraded area soils were not
significantly different; the same was true of the NH4OAc-extractable soil K (Table 4.9) and the
DTPA-extractable Cu and Zn (Appendix B, Table B.10).
Table 4.9 Soil NO3, NH4, PO4, SO4, and K (Kelowna extractable) concentration on the
Berm for all three treatments. (AP5 = alfalfa pellets at 5t ha-1
; B5 = biochar at 5 t
ha-1
). Soil samples were taken in the spring of 2010 at the 0–15 cm depth.
Trt. No. Trt. ID NO3–N NH4–N PO4–P SO4–S K
------------------------------------ mg kg-1
-------------------------------------
1 Control 0.5 2.8 4.8 36.4 227.9
2 AP5 0.8 2.6 4.6 13.5 383.7
5 B5 0.3 2.5 4.2 13.9 410.0
LSD0.05 ns ns ns ns ns
Treatment effects were generally not significant for available N on the berm, though there
was a small increase in available N associated with the Alfalfa pellet treatment (Table 4.9).
Biochar, on the other hand, had no significant effect on available N. These results are similar to
those reported by Gathorne-Hardy et al. (2009), who suggested that biochar would have a greater
effect on soils with low water holding capacity due to its capacity to retain both water and
nutrients.
Table 4.10 Soil NO3, NH4, PO4, SO4, and K (Kelowna extractable) concentration on the
Berm for all three treatments. (AP5 = alfalfa pellets at 5 t ha-1
; B5 = biochar at 5 t
ha-1
). Soil samples were taken in the fall of 2010 at the 0–15 cm depth.
Trt. No. Trt. ID NO3–N NH4–N PO4–P SO4–S K
------------------------------------ mg kg-1
-----------------------------------
1 Control 1.0 1.7 4.8 1.5 206.6
2 AP5 2.3 2.6 6.0 1.7 287.3
5 B5 2.5 2.4 4.2 2.6 221.2
LSD0.05 ns ns ns ns ns
69
Changes to the soil nutrient pools in the Berm area (Tables 4.9 and 4.10) followed the
same trends during the growing season as those observed in the Degraded area (see Tables 4.5
and 4.6). That is, whereas there was a general decrease in available S and K during the growing
season, there was no such decrease in available P. In addition, there was a small increase in the
soil concentration of NO3-N in the fall samples with the largest increases occurring in the plots
amended with biochar and alfalfa pellets (see Tables 4.9 and 4.10).
4.3.3 Fall 2010 plant harvest
There was greater diversity in the plant community in the Degraded area than on the
Berm; though, in both areas, tall wheatgrass (Thinopyrum elongatum L.) and alfalfa (Medicago
sativa L.) were the dominant plant species (Appendix B - Table B.18). In the Berm area only,
foxtail barley (Hordeum jubatum L.) was present in three of four plots amended with alfalfa
pellets and in one of the four plots amended with biochar, but was not present in the control
(unamended) plots (Appendix B - Table B.19). In the Degraded area, the yield data were
confounded by the variation in plant community composition and, as a result, there were no
significant treatment differences (p > 0.05) (Figure 4.3). The alfalfa treatment at 20 t ha-1
produced the highest mean yield on the Degraded area, although not significantly (Appendix B -
Figure B.1).
On the Berm, the harvested plant biomass was significantly (p < 0.05) greater in the
alfalfa treatment compared to the control; the biochar treatment, on the other hand, did not differ
significantly from the either the control or the alfalfa pellet treatment (Figure 4.3). Zvomuya et
al. (2008) found that the soil incorporation of alfalfa hay significantly increased the grain yield of
spring wheat in a field experiment in southern Alberta. Alfalfa pellets increase the soil water
holding capacity, which is important for plant growth in a semi-arid region. Wahid et al. (1998)
70
observed that increased water holding capacity with organic matter additions of farmyard manure
and clover mulch was partly responsible for the increased plant growth and yield of wheat. Little
benefits were likely recognized as a result of the increased water holding capacity with alfalfa
pellet addition because of the high precipitation in 2010.
Figure 4.3 Plant biomass of vegetation (predominantly grass) collected from the Berm area
plots in the fall of 2010.
Figure 4.4 Plant total N concentration (mg N kg-1
of dry plant matter) from plots on the Berm
area in the fall of 2010. Error bars represent standard error of the mean.
0
500
1000
1500
2000
2500
3000
3500
4000
4500
Control Alfalfa-2 Biochar
Bio
mas
s (g
ha
-1)
Treatment
0
2000
4000
6000
8000
10000
12000
14000
16000
18000
20000
Control Alfalfa-2 Biochar
Pla
nt
Tota
l N (
mg
kg-1
)
Treatment
LSD0.05 = 1008
LSD0.05 = 6616
71
Alfalfa pellets release N continuously in the slow mineralization phase (Agahara and
Warncke, 2005), but overall, plant N concentration (kg N ha-1
) on the Berm was not significantly
different between treatments (Figure 4.4). Despite a higher yield of the alfalfa pellet treatment,
lower plant N concentration resulted in similar plant N concentration among treatments. In the
alfalfa treatment, higher biomass production because of improved soil water conditions could
have resulted in the lower concentration of plant N compared to the plots with lower biomass. In
other studies biochar addition resulted in increased NH3 retention in soils receiving urea
fertilizers (Clough and Condron, 2010).
Figure 4.5 Plant total P concentration (mg kg-1
dry plant material) from plots on the Berm
area in the fall of 2010. Bars represent standard error of the mean.
Phosphorus concentration in plants grown on biochar amended soils in the Berm area was
significantly higher than that in either the control or alfalfa treatments (Figure 4.5). Biochar has
been reported to provide a slow release of P to the soil, and to increase as soil pH decreases
(Warren et al., 2009). In the present study, however, soil pH was generally unaffected (or
increased slightly) in response to the biochar additions. Thus, it is likely that the enhanced plant
0
200
400
600
800
1000
1200
1400
Control Alfalfa Pellets Biochar
Pla
nt
Tota
l P (
mg
kg-1
)
Treatment
LSD0.05 = 345
72
uptake of N and P observed in biochar amended soil reflects some small contribution of the oat
hull biochar itself; i.e., provides a small, direct contribution to the N and P nutrition of the plants
(see Table 4.2).
Plant concentration of K, S, Na, Cu, and Zn from soils in the Degraded or Berm areas
showed no significant treatment effect. There was also no significant difference among
treatments in plant content of N or P on the Degraded area site (Appendix B, Table B.5).
4.4 Conclusion
The addition of alfalfa pellets, biochar, or biochar + urea did not significantly affect plant
growth or nutrient uptake on the Degraded area during the first season following application of
the amendments. Biochar + urea increased the soil extractable phosphate levels at the start of the
growing season (i.e., in the spring following application) and at harvest in the fall. These effects
were attributed to pH effects associated with the amendment additions. The application of alfalfa
pellets (at 10 t ha-1
rate) also resulted in increased levels of available soil P in the fall of 2010.
However, the increase in soil P in the alfalfa and biochar + urea treatments was not reflected in
plant uptake of P. Phosphorus is relatively immobile in the soil, and is unlikely to migrate very
far during a single growing season; thus, given that the amendments were surface-applied, it may
not have migrated into the root zone to be available for plant uptake. The Degraded area also
experienced a wide variety of different plant species growing on it that contributed to high
variability in measured plant parameters.
Biochar applications initially increased the SOC content in the Berm area, though no
significant effect was observed in the fall. The plant-N concentration was increased in the
biochar treatment compared to the alfalfa treatment; a similar observation was made regarding
plant-P. Alfalfa pellets increased soil NO3-N levels in the fall on the Berm. Improved soil N
73
availability and water relations may have been contributing factors to the alfalfa treatment
resulting in significantly higher yield of grass on the berm site than control and biochar
treatments.
The Berm and the Degraded area were both relatively low in SOC and nutrients. Neither
of the sites contained high amounts of salts that would inhibit plant growth but the increased salts
at lower levels in the soil profile indicate that there may be some movement of salts from the
tailings pond into the Berm.
Addition of alfalfa pellets was beneficial in increasing the plant growth and likely can
have positive benefits as a soil amendment for revegetation of Berm areas. Biochar can increase
the soil carbon and may have positive implications as a soil amendment, especially when
combined with fertilizer. Although this study encompassed only a single year, it is predicted that
both types of organic amendments will provide benefits to soil quality and plant growth in future
years. Examining the effects of both alfalfa pellets and biochar on saline field sites in future
studies is recommended to determine potential of each amendment to enhance soil quality and
plant growth on highly salt affected areas.
74
5.0 AMENDMENT OF TWO AGRICULTURAL SOILS WITH BIOCHAR TO
IMPROVE PLANT NUTRITION AND FERTILIZER USE EFFICIENCY
5.1 Introduction
Biochar is created by heating organic matter to very high temperatures (200 to 750oC) in
the absence of oxygen or under low oxygen conditions (Novak et al., 2009b). This process,
called pyrolysis, is used for the production of biogas, with biochar as a by-product consisting of
what remains of the organic material. Biochar is mostly C that is highly resistant to microbial
breakdown and chemical degradation (Paris et al., 2005). Recently biochar has been the focus of
many research projects to assess its use as a soil amendment in modern agriculture.
Few studies have been conducted on biochar as a soil amendment in temperate climates.
Most research to date has been focused on highly weathered, nutrient poor tropical soils where it
has been shown that the most consistent effect of biochar is to significantly enhance the SOC
levels (Novak et al., 2009a). One study conducted in a temperate region in Italy showed an
increased yield of durum wheat over a two-year period with addition of wood-derived biochar at
rates of 30 and 60 t ha-1
(Vaccari et al., 2011). Char has been found to be an important natural
component in the Black Chernozem soils in Saskatchewan (Ponomarenko and Anderson, 2001).
Char in Saskatchewan soils is derived from past prairie and forest fires and is a natural
phenomenon. Amendment with chars could increase the soil fertility and quality in prairie soils,
enhancing production especially in soils low in organic carbon. The positive effect of the biochar
in temperate regions suggests potential for use in soils of the northern Great Plains of North
America.
75
Soil C increases as a result of biochar addition thus increasing the C:N ratio of the soil
(Steiner et al., 2008). However, biochar is a recalcitrant form of organic C in the soil compared
to other organic matter sources, therefore the increased C:N ratio does not have a great effect on
N mineralization and immobilization by microbes compared to plant residues and fresh organic
amendments. The C:N ratio in organic amendments, such as manure, can help predict the N
availability with more N available at a C:N less than 15:1. Some biochars may have a portion of
decomposable C which may lead to immobilization and a decrease in available N for plant
uptake, as was noted in a study where a large amount of biochar (100 t ha-1
) was added (Steiner
et al., 2009). The different C and N forms in biochar create a need for different methods of
estimating nutrient availability in the soil following biochar application. Response of plant
growth and N uptake to biochar amendment is a reasonable approach.
The responses of the soil microbial population are affected by biochar type. Steinbeiss et
al. (2009) discovered that different types of biochar promoted the growth of different microbial
populations that were adapted to break the material down (Steinbeiss et al., 2009). These authors
suggested that some biochars have a stimulatory effect on microbial activity, which in turn
increases the rate of degradation of other SOM. Biochar also has been observed to enhance
beneficial plant-soil associations such as with soil mycorrhizae (Warnock et al., 2007).
Methods for improving the N use efficiency or the N recovery from fertilizers are being
sought after in agricultural operations (Jackson et al., 2008). The large surface area of biochars
can promote increased retention of nutrients, including available N and cations (Steinbeiss et al.,
2009). For example, in England the addition of biochar improved the efficiency of fertilizer N
uptake in barley with increasing rate of fertilizer addition (Gathorne-Hardy et al., 2009). Chan et
76
al. (2007) also observed enhanced N recovery by radish when biochar was added along with
commercial fertilizer.
Studies focusing on soil N improvement using biochar as a soil amendment have shown
variable effects. Novak et al. (2009a) observed that there was no effect on soil N with any rate of
biochar addition to a U.S. coastal plain soil in South Carolina, likely because the N in the biochar
was not in a bioavailable form and the soil N status was initially low. Biochar properties may
affect the N cycling processes in the soil, by increasing aeration and providing a stable form of
C. This was suggested to result in decreased nitrous oxide emissions (Lehmann et al., 2006).
Steiner et al. (2009) reported increased soil N retention and increased radish N uptake on a
highly weathered soil in Brazil with biochar (100 t ha-1
) added along with N fertilizer (Chan et
al., 2007). Moderate rates of biochar addition to tropical, acidic soils in Columbia improved the
N fixation by common beans (Phaseolus vulgaris L.) by increasing the availability of B and Mo
(at a biochar rate of 60 g kg-1
), although high biochar rates (90 g kg-1
) decreased the N fixation
rate (Rondon et al., 2006).
Biochar can increase the cation exchange capacity (CEC) in the soil compared to non-
amended tropical soils (Liang et al., 2006). These authors suggest that biochar increased the
surface area and provided exchange sites for ion sorption, and thus increased the CEC and cation
fertility. Biochar increased pH in acidic soils due to the increased retention of Ca and Mg, and
was reported to enhance the availability of other nutrients in soils as a result (Yuan et al., 2011;
Rondon et al., 2006; Vaccari et al., 2011).
Soil P is released from addition of bone char, although this may be related to soil acidity
as the dissolution of P from calcium phosphates contained in the bone char would be more
pronounced in acidic soils (Warren et al., 2009; Atkinson et al., 2010). It is likely that the release
77
of P and cations from biochar would be of less significance in soils of neutral to alkaline pH and
relatively high organic matter and clay content, typical of agricultural soils in western Canada.
Biochar feedstock and pyrolysis temperature affects the properties of biochar as a soil
amendment. Perier et al. (2011) suggest that pyrolysis temperature can affect the porosity and the
surface area of the biochar, thus affecting its properties as a soil amendment and its influence on
parameters such as CEC. Pyrolysis of different crop residues resulted in different biochar
properties. For example, increased soil pH was noted with addition of legume biochars compared
to canola and rice straw based biochars (Yuan et al., 2011). Biochar derived from willow (Titan
Resources, Craik, Saskatchewan) was used in this study as the supply of oat-hull biochar used in
the potash mine site field study described in Chapter 4 was exhausted.
The objective of this study was to evaluate the effect of a biochar derived from willow on
canola growth, canola nutrient uptake, and soil nutrient concentration in two contrasting
Saskatchewan soils (Black and Brown). The willow biochar was applied at three rates: 5, 10, and
20 t ha-1
with an additional treatment of willow biochar at 10 t ha-1
along with commercial
fertilizer. The trials were conducted under controlled environment conditions in a phytotron at
the University of Saskatchewan. Effects of the amendment on canola biomass yield and soil
chemical properties (EC, pH), soil elements (C, N, P, K, Cu, Zn) post-harvest were determined.
The hypothesis of this study was that the willow-based biochar amendment will improve
nitrogen recovery and enhance the growth of canola.
5.2 Materials and methods
5.2.1 Treatment properties
Soil was collected in the spring of 2010 from the top 0-15 cm of control (unmanured,
unfertilized for 13 years) plots at a long-term field research site in east-central Saskatchewan
78
near Dixon in the Black soil zone (Black soil). The previous crop was wheat and the soil was
classified as belonging to the Cudworth Association (Orthic Black Chernozem). A second soil
was also collected from 0-15 cm depth from a wheat stubble field in south-central Saskatchewan
near Central Butte (Brown soil). The soil was classified as Haverhill Association (Orthic Brown
Chernozem). The soils were air- dried and mixed following collection to ensure homogeneity.
Both soils were relatively low in available N and P (Table 5.1), and would be considered
deficient in these nutrients for production of most annual crops. The two soils provide a large
contrast in SOC content, as the Black SOC (%) is more than three times that of the Brown soil.
The soils are neutral to alkaline in pH.
Table 5.1 Soil properties of initial soils used in the growth chamber studies collected in the
spring of 2010.
Soil NO3 NH4 PO4 K OC pH
------------------------ mg kg-1
--------------------- %
Black soil 9.6 6.0 10 584 6.9 7.0
Brown soil 4.3 2.8 17 411 2.0 7.5
The field capacity for each soil was determined by sieving soil through a 2 mm sieve and
weighing out 50 g of soil into a vial. Water was added to each of the four vials of soil to
represent adding 20 %, 25 %, 30 %, and 35 % water by weight. The vials were equilibrated for
about 24 h. The value of field capacity was then estimated by taking the average of the
percentage of water by weight added that resulted in wetting of the soil to the bottom of the vial
but did not leave free-standing water. The field capacity of the two soils was 28 % (average of 25
and 30 %) for the Black soil and 25 % for the Brown soil.
To prepare the treatments in pots, plastic pots of 15 cm diameter (volume = 0.27 m3) and
trays were washed and labeled, and a filter paper was placed on the bottom of each pot to prevent
79
soil leakage. The amendments were weighed out for each pot (See Table 5.2 for rates) and the
amendment and 900 g of soil were mixed in a bucket then put into the pot. The biochar was
incorporated into 1 kg of soil in each pot to provide rates of 5, 10, and 20 t ha-1
(2.5, 5, and 10 g
kg-1
soil) for the biochar trials and 10 t ha-1
for the biochar plus fertilizer treatment and with a
fertilized control and a control with no amendments for each soil type (Table 5.2). Four
replicates were used for each treatment.
Pots were weighed and watered with distilled water to bring the soil to 80 % field
capacity and left on the lab bench for 48 h to equilibrate. Following equilibration, each pot was
seeded with 10 canola seeds (Brassica napus Invigor 5030 seed). Then the remaining 100 g of
soil was placed on top ensuring no large lumps were on the surface. The pots were watered again
to 80 % field capacity and the total weight of each pot was recorded.
For the fertilizer and the biochar plus fertilizer treatments, urea (46-0-0) was added at a
rate of 200 mg N kg-1
soil for every 1 kg pot and triple superphosphate (0-45-0) was added at a
rate of 20 mg P kg-1
per pot. The actual amount of each fertilizer added to each 1-kg pot was
0.435 g urea and 0.0813 g triple superphosphate. The rates of biochar added to each pot and the
relative N rates (Table 5.2) were calculated based on the amount of fertilizer or biochar added
and the percentage of N in that amendment, with biochar containing 0.92 % N and urea
consisting of 46 % total N.
The pots were placed in a growth chamber with 16-hour days at 24oC and 8-hour nights
at 21oC to represent summer growing conditions and encourage rapid growth of canola. The
humidity was not controlled in the growth chamber and the pots were moistened on the soil
surface twice daily for the first seven days and watered daily to 80% field capacity over the
80
remainder of the 35-day period. The pots were randomized weekly to ensure even light and air
distribution.
Table 5.2 Rates of biochar and the relative N rates added (biochar N + fertilizer N) for each
treatment on the Black and Brown soils.
Treatment Biochar Rate N rate
t ha-1
† g kg-1
soil mg kg-1
soil
Control 0 0 0
Biochar 5 2.5 240
Biochar 10 5 480
Biochar 20 10 960
Biochar + Urea Fertilizer 10 5 680
Urea Fertilizer 0 0 200
† t ha-1
assumes a soil depth of 0.15 m and a bulk density of 1.3 g cm-3
.
The canola plants were harvested on day 35 in the growth chamber. The plants were in
the vegetative state at about the 4- to 6-leaf stage at the time of harvest (Appendix C – Figure
C.1). The plants were then harvested by cutting at the base and placing in labeled paper bags.
The bags of plant material were oven-dried at 40oC, then ground and placed into vials for further
lab analysis. The soil from the pots was laid out to air-dry at 30oC then put through a 2 mm sieve
and placed in vials for further lab analysis.
5.2.2 Biochar properties
The willow biochar used in this growth chamber study had a higher C:N ratio and was
lower in total N, P and S compared to the oat hull biochar (Table 5.3) that was used in the field
study described in Chapter 4. The C:N ratio in the biochar in this study are lower than values
reported for biochars in other studies. For example, Chan et al. (2007) determined that biochar
produced from feedstock of grass clippings, cotton trash, and plant prunings had a C:N of 200.
81
The external surface area of willow biochar used in the research described in this chapter
and the oat hull biochar used in the previous chapter was measured using the helium void method
on the NOVA BET Surface Area Analyzer. The mean surface area was determined from two
replicates for the unground oat hull biochar and three replicates from the willow biochar.
Different methods of surface area measurement probe either external (BET) or total
(EGME) specific surface area. For organic materials, chemical interactions with EGME may
overestimate specific surface area; whereas for materials with internal pore space or interlayers
BET measurements may underestimate surface area. Soil organic matter and humus have been
shown to have an EGME surface area of 560-800 m2 g
-1 (Chlou et al., 1990).
Table 5.3 Properties of the two biochars that were used in the thesis research. (P=total P
from acid digest, C, N, and S are from analysis on the Leco C, N, and S analyzer).
Biochar Type P C N S C:N
Surface
Area
---------------------- % ------------------------- m2 g
-1
Oat Hull Biochar 2.95 71.4 1.54 0.12 46.4 13.4
Willow Biochar 0.15 91.3 0.92 0.05 99.2 24.7
Willow biochar had higher surface area compared to the oat hull biochar despite the
larger apparent particle size (Figure 5.1). In a study by Pereira et al (2011), willow biochar that
underwent pyrolysis at higher temperatures (550oC) had a specific surface area of 149 m
2 g
-1
while it was as low as 3 m2 g
-1 when produced at lower temperatures (400
oC). The low surface
area of the willow biochar in our study may reflect a low temperature pyrolysis, as higher
temperatures result in a more ashy material. Surface area that was higher for the willow biochar
may influence the nutrient holding capacity and cation exchange capacity (CEC) of the biochar
(Liang et al., 2006).
82
Figure 5.1 Oat hull biochar (A) and willow biochar (B).
5.2.3 Soil analysis
Soil available NO3-N and NH4-N were determined by a 2M KCl extraction (Keeney and
Nelson, 1982) in a 10:1 solution:soil ratio. Available P and K was determined using the Modified
Kelowna method (Qian et al., 1994) while SO4 was extracted in a 0.01 M CaCl2 solution at a 2:1
solution:soil ratio. Automated colorimetry was used to determine the inorganic N, P, and S,
extracts using the Technicon AutoAnalyzer II. Detailed descriptions of the methodology are
found in Chapter 3.
For analysis of Cu and Zn, a DTPA solution was prepared using 0.005 M DTPA, 0.01 M
CaCl2, and 0.1 M triethanolamine (pH 7.3) (Lindsay and Norvell, 1978). Ten grams of the DTPA
solution was added to one gram of soil and shaken for two hours. The solution from the bottles
was filtered and the supernatant was analyzed using atomic absorption spectroscopy.
The sieved soil samples were sub-sampled and ball ground to provide a more uniform
sample for determination of organic carbon using the LECO Carbonator at 842oC according to
the procedure described by Wang and Anderson (1998).
A B
83
For the pH measurements (Rhoades, 1982), a pH meter was used by inserting the probe
into the supernatant from a 2:1 water:soil suspension and recording the reading. An EC meter
was used for the EC measurements (Richards, 1969) by inserting the probe into the extraction
solution and recording the reading.
5.2.4 Plant analysis
Total plant N, P, and K were determined using the sulphuric acid-peroxide digest method
(Thomas et al., 1997). Into digestion tubes, 0.25 g of ground plant material is added and heated
to 360oC with sulphuric acid and peroxide six times. The solution was then sub-sampled into a
vial. The digest solutions were then colormitrically analyzed on the Technicon Autoanalyzer II
for element concentration as described in section 5.2.3. The Leco Sulphur Analyzer was used for
analysis of total S in plant material. Ball ground plant material was weighed into a ceramic boat
and placed in the oven of instrument where it was combusted to SO2 in a stream of O2 at 1000oC.
The SO2 is measured using an infrared detector.
5.2.5 Statistical analysis
The experimental design was a completely randomized design. The R Statistical Program
was used to analyze the data using the general linear model and one-way ANOVA. Significant
differences (p<0.05) between treatments were determined using the Fischer least significant
difference (LSD) test.
5.3 Results and discussion
The willow biochar alone treatments did not significantly increase canola biomass yield
over the unfertilized control nor did combining the biochar with N and P fertilizer have any
enhancement over fertilizer alone on plant biomass (Figure 5.2; Figure 5.3). As expected,
fertilizer N and P significantly (p<0.05) enhanced canola dry plant biomass. The canola grown
84
on the biochar plus fertilizer treatment was not significantly different from the fertilizer alone
treatment in biomass, plant nutrient concentration (Table 5.4; Table 5.5), or soil nutrient
concentrations (Table 5.6; Table 5.7). As well, there was no significant biochar rate effect for the
concentration of most nutrients in the canola plant and soil. The reason for lack of effect of the
biochar on these parameters may be that the soils used in this research were not as nutrient poor
and acidic as soils used in other research where biochar increased the biomass of plants grown on
biochar amended soils (Novak et al., 2009a; Atkinson et al., 2010). These authors also applied
higher rates of biochar (up to 100 t ha-1
) than used in the current study.
Figure 5.2 Mean canola dry matter biomass for willow biochar added at 5, 10, and 20 t ha
-1,
biochar (10 t ha-1
) plus N and P fertilizer, fertilizer and control treatments on the
Brown soil.
0.0
1.0
2.0
3.0
4.0
5.0
Can
ola
Bio
mas
s (g
)
Control
Biochar Brown 5
Biochar Brown 10
Biochar Brown 20
Biochar + Fertilizer Brown
Fertilizer Brown
LSD0.05= 0.92
85
Figure 5.3 Mean canola dry matter biomass for willow biochar added at 5, 10, and 20 t ha-1
,
biochar (10 t ha-1
) plus N and P fertilizer, fertilizer and control treatments on the
Black soil.
5.3.1 Canola nutrient concentration
In both Black and Brown soils, canola N concentration was significantly higher in the
biochar plus urea and the urea treatments than other treatments (Figure 5.3), which is expected
from the addition of commercial N fertilizer. The biochar plus fertilizer and the fertilizer alone
treatments had significantly lower canola P concentration in the Brown soil (Table 5.4). This is
likely due to a growth dilution effect. Canola K concentrations increased in both of the fertilized
treatments compared to all other treatments, except in the Black soil where the control and two
fertilized treatments were significantly higher in plant K than the biochar treatments at the three
different rates (Table 5.5). Increase in plant K with urea fertilization could be due to enhanced K
availability in soil from NH4+ ions displacing K from interlayer sites in the clay minerals.
There was no significant effect of treatment on plant Cu and Zn concentration except for
the Zn concentration on the Brown soil which was significantly higher in the biochar plus
fertilizer treatment compared to the control, fertilizer, and biochar at 5 and 10 t ha-1
rates
0.0
1.0
2.0
3.0
4.0
5.0 C
ano
la B
iom
ass
(g)
Control
Biochar Black 5
Biochar Black 10
Biochar Black 20
Biochar + Fertilizer Black
Fertilizer Black
LSD0.05= 0.74
86
(Appendix C – Table C.1; Table C.2). The urea fertilizer acidifies the rhizosphere in the urea
nitrification process and this may have enhanced Zn availability in this calcareous soil
(Hartikainen and HliHalla, 1996).
Table 5.4 Mean canola dry matter canola P and K concentration for willow biochar at 5, 10,
and 20 t ha-1
, biochar (10 t ha-1
) plus fertilizer, fertilizer and control treatments on
the Brown soil.
Treatment Biochar Rate N P K
t ha-1
--------------------------- mg kg-1
----------------------------
Control 0 16877 3310 30755
Biochar 5 13595 3256 25954
Biochar 10 14217 2874 31008
Biochar 20 12966 2867 26953
Biochar + Fertilizer 10 25623 1706 46173
Fertilizer 0 26265 1710 44297
LSD(0.05)
7534 625 9652
Table 5.5 Mean canola dry matter canola P and K concentration for willow biochar at 5, 10,
and 20 t ha-1
, biochar (10 t ha-1
) plus fertilizer, fertilizer and control treatments on
the Black soil.
Treatment Biochar Rate N P K
t ha-1
---------------------------- mg kg-1
----------------------------
Control 0 16399 1809 39320
Biochar 5 11830 1652 28185
Biochar 10 13109 1783 27559
Biochar 20 11509 1717 27371
Biochar + Fertilizer 10 25128 1717 45951
Fertilizer 0 26142 1755 43738
LSD(0.05)
5399 ns 10451
5.3.2 Soil results
The soil pH was significantly increased with biochar amendment in all treatments
compared to the control on both the Black and Brown soils (Table 5.6; Table 5.7). Biochar also
increased soil pH in acidic soils in the study by Chan et al. (2007) where the highest rates of
87
biochar increased the pH from 4.8 in the control to 6.0 in the 100 t ha-1
biochar treatment. Soil
electrical conductivity was not significantly affected by the treatments on both soils (Appendix
C).
Table 5.6 Mean soil pH, soil organic carbon (SOC), and available NO3-N, NH4-N, and PO4-
P concentration for willow biochar added at 5, 10, and 20 t ha-1
, biochar (10 t ha-1
)
plus fertilizer, fertilizer, and control treatments on the Brown soil.
Treatment
Biochar
Rate pH SOC NO3-N NH4-N PO4-P
t ha-1
% ------------------ mg kg-1
--------------
Control 0 7.5 1.4 6.1 2.3 16.9
Biochar 5 7.9 1.5 3.3 3.0 19.3
Biochar 10 7.9 1.6 1.8 1.6 16.8
Biochar 20 7.9 1.6 2.4 3.1 16.0
Biochar + Fertilizer 10 7.8 1.8 3.4 4.3 19.5
Fertilizer 0 7.8 2.0 3.5 4.2 21.3
LSD(0.05) 0.15 ns ns 1.4 2.6
Table 5.7 Mean soil pH, soil organic carbon (SOC), and available NO3-N, NH4-N, and PO4-
P concentration for willow biochar added at 5, 10, and 20 t ha-1
, biochar (10 t ha-1
)
plus fertilizer, fertilizer and control treatments on the Black soil.
Treatment
Biochar
Rate pH SOC NO3-N NH4-N PO4-P
t ha-1
% ----------------- mg kg-1
----------------
Control 0 6.8 3.3 4.0 4.4 11.7
Biochar 5 7.9 3.4 2.3 3.5 11.5
Biochar 10 7.8 3.5 3.4 3.7 12.8
Biochar 20 7.7 3.6 2.2 3.3 12.9
Biochar + Fertilizer 1 0 7.8 3.5 4.8 5.2 16.6
Fertilizer 0 7.8 3.4 5.6 4.5 17.2
LSD(0.05) 0.16 0.23 3.4 0.9 1.6
The high rate of biochar (20 t ha-1
) and biochar (10 t ha-1
) plus urea fertilizer treatments
had significantly higher SOC concentration compared to the control treatment on the Black soil
(Table 5.7). Although not significant at p<0.05, there was a trend of increasing organic carbon
88
with increasing rate of biochar addition in the Black soil treatments. These results agree with
Chan et al. (2007), who also found that there was an increase in SOC content with biochar
addition to an Australian Alfisol over a period of six weeks in a growth chamber study. There
was no significant effect of treatment on the SOC content in the Brown soil even though the
Brown soil had a lower initial SOC than the Black soil.
In the Black soil, available soil NO3-N in the biochar plus urea fertilizer treatment was
slightly elevated compared to the biochar amended treatments at 5 and 20 t ha-1
rates but was not
significantly different from the control (Table 5.7). Overall, soil NO3-N levels after canola
harvest were low and similar among treatments. There was no significant difference in soil NO3-
N among the treatments on the Brown soil but there was a slightly but significantly higher NH4-
N concentration in the fertilizer alone and biochar plus fertilizer treatments when compared to
the control and the biochar at 10 t ha-1
rate (Table 5.6). The NH4-N concentrations in the Black
soil were decreased in the biochar alone treatments at 5 and 20 t ha-1
rates compared to the
control, biochar plus fertilizer, and fertilizer treatments (Table 5.7). Novak et al. (2009a) also
indicated that biochar did not improve the N status of their soil in a growth chamber study
conducted on a soil from the south-eastern coast of the USA.
Soil extractable PO4-P in the Black soil was slightly higher in the fertilizer alone and
biochar plus fertilizer treatment compared to other treatments (Table 5.7). This is explained by
the fertilizer amendment containing urea and superphosphate. No effect of the biochar with
fertilizer was observed on soil N and P compared to the fertilizer alone. The biochar itself adds
little P to the soil and the P is of low bioavailability.
The extractable Cu concentrations in the two soils were not significantly different among
treatments on both soils but there was a significant effect on soil Zn concentration in the Black
89
soil but not the Brown soil (Appendix C – Table C.3; Table C.4). The Zn concentrations were
significantly higher in the urea fertilizer treatment compared to all other treatments for the Black
soil. Urea hydrolysis and nitrification may have affected the availability of metal micronutrients
in the fertilized treatments (Hartikainen and YliHalla, 1996).
The calculation of recovery of added N by canola plants in the amendments (biochar, N
from added urea) revealed that biochar N was not recovered by the canola (Table 5.8). This
supports the concept of biochar N being of an inert nature, as the biochar added 240 mg N kg-1
soil in the low biochar rate. The N recovery values for the N in the added urea fertilizer treatment
(44 to 47 %) are within the range of what would be expected from an inorganic fertilizer N
sourced to a prairie soil. Eghball and Power (1999) found N recovery from N fertilizer to be
~45% which is similar to the results in our research.
Table 5.8 Mean N recovery by canola plants for willow biochar added at 5, 10, and
20 t ha-1
, willow biochar (10 t ha-1
) plus fertilizer, fertilizer alone, and control
treatments on the Brown and Black soils.
Treatment Biochar Rate N Rate N uptake N Recovery
t ha-1
mg kg-1
mg kg-1
soil %
Brown soil
Biochar 5 240 11.7 -1
Biochar 10 480 10.5 -1
Biochar 20 960 9.1 -1
Biochar + Fertilizer 10 680 99.6 45
Fertilizer 0 200 102.6 44
Black soil
Biochar 5 240 15.2 -3
Biochar 10 480 15.1 -1
Biochar 20 960 15.4 -1
Biochar + Fertilizer 10 680 108.6 47
Fertilizer 0 200 116.2 47
The biochar plus fertilizer treatment N recovery values were nearly identical to the
fertilizer alone, indicating that biochar did not enhance efficiency of recovery of N fertilizer in
90
this experiment. These results differ from Chan et al. (2007) where biochar significantly
increased N recovery by radish grown on an acidic, highly weathered, Australian soil. These
authors also reported that the biochar treatment had decreased concentrations of Al and increased
pH, K, and available P in the soil which may have also contributed to the increased plant growth
and plant N recovery. No such effects on available nutrients were observed in this study. The
study by Chan et al. (2007) also used higher rates of biochar addition, with differences between
biochar amended and control treatments observed at biochar rates of 50 t ha-1
and 100 t ha-1
.
Biochar added along with fertilizer at increasing fertilizer rates increased the N use efficiency of
barley on field plots in the United Kingdom (Gathorne-Hardy et al., 2009). Further evaluations
biochar are needed on the prairies to evaluate effects on N recovery under field conditions.
5.4 Conclusion
Willow biochar added to two contrasting Saskatchewan soils at rates of 5, 10, and
20 t ha-1
did not result in increased yield, nutrient availability, or recovery of N by canola over a
five-week growth period. The biochar did increase the SOC significantly in the Black soil which
is beneficial to soil quality, although no effect on extractable available nutrients were observed in
the biochar alone treatments compared to the control.
The relatively high organic matter and clay content of prairie soils along with neutral to
alkaline pH contributes to high ion sorption and exchange capacity. As such, these soils
inherently may not be as responsive to added black carbon sources compared to acidic, highly
weathered tropical soils where “terra preta” (charcoal affected soils) had originated and reported
to improve agricultural soils in the Amazon. Many of the beneficial properties of biochar are due
to its ability to increase the pH of acidic soils, thus increasing the retention of cations as well as
91
improving P and N fertility in the soil. Biochar application may have benefits if fertilizer can be
retained in the soil for longer periods until the plant can access it.
Higher rates of biochar than used in this controlled environment study have been used in
other research projects. The feasibility and practicality of biochar application on a large scale
would be improved if decreased rates of biochar could be applied to soil, such as 1 t ha-1
instead
of 10 or 100 t ha-1
. Hauling and applying many t ha-1
of biochar long distances from its area of
production would require large, consistent yield benefits to be realized in order to be economical.
The lowest rate of biochar that can produce a significant positive effect on N recovery
and plant growth would be important to determine when considering feasibility of biochar as an
amendment on agricultural soils. As well, the performance of biochar originating from different
source materials and manufacturing processes needs to be evaluated. Biochar as an amendment
in Saskatchewan may have greatest potential benefits on soils that are highly degraded with
coarse texture and of very low organic matter content. Further long-term field studies should be
conducted to determine the benefits of biochar on soils of the northern Great Plains.
92
6.0 GENERAL DISCUSSION AND CONCLUSIONS
The organic amendments studied each had unique effects on soil nutrient status and plant
growth and nutrient uptake. The effects of the amendments were generally positive, but the
manure and alfalfa pellets were more effective in enhancing soil nutrient availability, uptake and
plant yield than the biochar. Each of the amendments is perceived to have different applications
for the agricultural and environmental industries as an amendment to improve soil fertility and
plant growth.
Application of DDGS-fed cattle manure to two Saskatchewan soils resulted in significant
increases in canola yield and N and P uptake. Composting, through its effect on reducing water
content and concentrating the nutrients, resulted in greater canola growth enhancement than fresh
manure at lower rates of manure application (e.g. 60 t ha-1
), but resulted in toxicity effects at the
high rates (e.g. 240 t ha-1
). The toxicity effect was especially evident for the composted DDGS
wheat-fed manure treatments. The increased nutrients in the composted treatments will affect the
optimum rates of manure application. To avoid toxicity and overloading of the soil with P,
composted DDGS wheat-fed cattle manure should be applied at lower manure rates on a weight
basis compared to the fresh manures. The concentrated nature of the composted manure can be
construed as a benefit though, since hauling and application costs will be lower per unit of
nutrient in the manure.
The effectiveness of the manure depends on the feed source as demonstrated by the
higher nutrient concentration in the DDGS wheat-fed composted manure compared to the DDGS
corn-fed composted manure. The type of DDGS that feedlot operations purchase may be
different, and in each case it is recommended that the manure be sampled and analyzed to take
93
into consideration the large variation in manure nutrient properties that can arise based on
different feed sources. The bedding type can also affect the nutrient concentration and the
subsequent decomposition and nutrient release from that manure. In this study, the DDGS wheat-
fed manures were on wood chip bedding while the DDGS corn manures were on straw bedding.
It is recommended that future trials with DDGS-fed cattle manure include field studies that
compare different feed sources, bedding materials, and manure processing.
Land application of alfalfa pellets is a novel use for a product which has traditionally
been used for livestock feed. In comparison to many cattle manures, the low C:N ratio, high
degradability and overall uniformity of the alfalfa pellets makes it attractive as an organic
amendment to be applied to degraded soils. Alfalfa pellets increased soil available N and grass
biomass on the berm area of a disturbed degraded potash mine tailings pond site. Increase in
plant biomass in the alfalfa pellet treatment is likely a result of the increase in soil available
nitrogen, but may also be related to improved soil water status. More work is suggested to
elucidate the effects of alfalfa amendment on soil physical properties like soil water infiltration,
water storage capacity, and aggregation. Compared to alfalfa pellets, biochar amendment was not
effective in improving plant growth and nutrition on the degraded soils. However, only one type
of biochar was evaluated in this study, and, like for manures, the organic source and method of
manufacturing of biochar can have large impacts on its behavior as a soil amendment. The
evaluation of several biochars of differing source materials and manufacturing is recommended
for future work.
The willow-based biochar did not have a significant effect on improving plant growth or
fertilizer recovery of urea and triple superphosphate on the loamy textured Brown and Black
Chernozem soils under controlled environment conditions. Biochar did significantly increase the
94
pH of the soil, in agreement with the results of other studies. The increase in pH may be a main
factor in the enhanced nutrient holding capacity of biochar treated soils observed in other studies
on acidic, tropical soils. However, Saskatchewan soils that typically have neutral to alkaline pH
combined with a high clay and humus content will have a high colloidal reactive surface such
that further enhancement by char addition may produce little benefit.
High rates of biochars (e.g. 100 t ha-1
) that have been used in other studies may not be
feasible for use in agriculture on the prairies in terms of spreading over whole fields, as
transportation and application costs will be high if the site of application is far from the char
production facility. Special equipment or altering the physical form of the biochar may be
required for successful biochar application to prairie soils, as the char was difficult to handle and
apply. More research is required to determine the feasibility and effectiveness of adding low
rates of biochar on a large field scale in temperate regions. These studies should be conducted
using a variety of agricultural crops with different plant nutrition requirements and be conducted
in nutrient and SOC poor soils to determine the fertilizer retention and recovery in field plots.
Also, biochar from different feedstocks and created at different pyrolysis temperatures may have
different effects on soil properties. Long term studies that are five years or longer on a variety of
biochar types would determine the lasting effects of biochar and if the biochar can inhibit or slow
down soil degradation and nutrient loss over time in prairie agricultural soils. The development
of equipment or creating an easier handling form of the biochar, such as pellets, would make
large-scale application more feasible.
Recommendations for future research include longer term field studies on a wide range of
soils with DDGS-fed manures, plant residue pellets, and biochars originating from a number of
different sources. Different combinations of organic materials such as alfalfa pellets used
95
together with biochar may be more suitable options for organic amendments added to degraded
soils. Severely degraded sites in the prairies should be the focus of future studies to assess the
effects on soil quality produced by biochar amendments over long term. Salt affected sites would
be an option for future studies using alfalfa pellets and biochar.
96
7.0 REFERENCES
Agehara, S., and D.D. Warncke. 2005. Soil moisture and temperature effects on nitrogen release
from organic nitrogen sources. Soil Sci. Soc. Am. J. 69: 1844-1855.
Akhter, J., K. Mahmood, K.A. Malik, S. Ahmed, and R. Murray. 2003. Amelioration of a saline
sodic soil through cultivation of a salt-tolerant grass Leptochloa fusca. Environ. Conserv.
30:168-174.
Atkinson, C.J., J.D. Fitzgerald, and N.A. Hipps. 2010. Potential mechanisms for achieving
agricultural benefits from biochar application to temperate soils: a review. Plant Soil.
337:1-18.
Booth, M.S., J.M. Stark, and E. Rastetter. 2005. Controls on nitrogen cycling in terrestrial
ecosystems: a synthetic analysis of literature data. Ecological Monogr. 75:139-157.
Bruun, E.W., D. Muller-Stover, P. Ambus, and H. Hauggaard-Nielsen. 2011. Application of
biochar to soil and N2O emissions: potential effects of blending fast-pyrolysis biochar
with anaerobically digested slurry. Eur. J. Soil Sci. 62:581-589.
Bulluck, L.R., M. Brosius, G.K. Evanylo, and J.B. Ristaino. 2002. Organic and synthetic fertility
amendments influence soil microbial, physical and chemical properties on organic and
conventional farms. Applied Soil Ecology. 19:147-160.
Calvelo Pereira, R., J. Kaal, M. Camps Arbestain, R. Pardo Lorenzo, W. Aitkenhead, M. Hedley,
F. Macias, J. Hindmarsh, and J.A. Macia-Agullo. 2011. Contribution to characterisation
of biochar to estimate the labile fraction of carbon. Organ. Geochemistry. 42:1331-1342.
Chan, K.Y., L. Van Zwieten, I., Meszaros, A. Downie, and S. Joseph. 2007. Agronomic values
of greenwaste biochar as a soil amendment. Australian J. of Soil Res. 45: 629-634.
97
Chien, S.H., D. Sompongse, J. Henao, and D.T. Hellums. 1987. Greenhouse evaluation of
phosphorus availability from compacted phosphate rocks with urea or with urea and triple
superphosphate. Fert. Res. 14:245-256.
Clough, T.J., and L.M. Condron. 2010. Biochar and the nitrogen cycle: Introduction. J. Environ.
Qual. 39:1218-1223.
Crawley, M. 2007. The R Book. John Wiley and Sons. Sussex, England.
Eghball, B., and J.F. Power. 1999. Composted and noncomposted manure application to
conventional and no-tillage systems: Corn yield and nitrogen uptake. Agron. J. 91:819-
825.
Eghball, B., B.J. Wienhold, J.E. Gilley, and R.A. Eigenberg. 2002. Mineralization of manure
nutrients. J. of Soil and Water Conserv. 57:470-473.
Eghball, B. 2002. Soil properties as influenced by phosphorous- and nitrogen-based manure and
compost applications. Agron. J. 94:128-135.
Erickson, M.C., J. Liao, L. Ma, X. Jiang, and M.P. Doyle. 2009. Pathogen inactivation in cow
manure compost. Compost Sci.17:229-236.
Farrell, R.E., D. Richman, and F. Krijnen. 2010. PotashCorp–Cory 2010: Analyses of soil
samples from the vicinity of the PotashCorp–Cory Division Site. Saskatchewan Centre
for Soil Research, Department of Soil Science, University of Saskatchewan, Saskatoon,
SK.
Feed Opportunities from Biofuel Industries. 2010. Wheat DDGS Feed Guide.
http://www.wcfin.ca/Portals/0/DDGS%20Feed%20Guide_FINAL.pdf (accessed 9 Mar.
2010).
98
Fellet, G., L. Marchiol, G. Delle Vedove, and A. Peressotti. 2011. Application of biochar on
mine tailings: Effects and perspectives for land reclamation. Chemosphere 83:1262-1267.
Gathorne-Hardy, A., J. Knight, and J. Woods. 2009. Biochar as a soil amendment positively
interacts with nitrogen fertiliser to improve barley yields in the UK. Presented at IOP
Conf. Series: Earth and Environ. Sci. 6: Climate Change: Global Risks, Challenges and
Decisions. Paper P37.45.
Gerzabek, M.H., G. Gaberhauer, and H. Kirchmann. 2001. Soil organic matter pools and carbon-
13 natural abundances in particle size fractions of a long-term agricultural field
experiment receiving organic amendments. Soil Sci. Am. J. 65: 652-358.
Gong, W., X. Yan, J. Wang, T. Hu, and Y. Gong. 2011. Long-term applications of chemical and
organic fertilizers on plant-available nitrogen pools and nitrogen management index.
Biol. Fertil. Soils. 47:767-775.
Government of Alberta. 2010. Canadian Biofuel Industry: Western Canada Perspective and
Opportunities. http://www1.agric.gov.ab.ca/$department/deptdocs.nsf/all/crop12127
(accessed 8 Jan. 2012).
Greenquist, M.A., T.J. Klopfenstein, W.H. Schacht, G.E. Erickson, K.J. Vander Pol, M.K.
Luebbe, K.R. Brink, A.K. Schwarz, and L.B. Baleseng. 2009. Effects of nitrogen
fertilization and dried distillers grains supplementation: forage use and performance of
yearling steers. J. Anim. Sci. 87:3639-3646.
Gregorich, E.G., K.J. Greer, D.W. Anderson, and B.C. Liang. 1998. Carbon distribution and
losses: erosion and depositional effects. Soil and Tillage Res. 47: 291-302.
99
Hao, X., M.B. Benke, D.J. Gibb, A. Stronks, G. Travis, and T.A. McAllister. 2009. Effects of
dried distillers’ grains with soluble (wheat-based) in feedlot cattle diets on feces and
manure composition. J. Environ. Qual. 38: 1709-1718.
Hao, X., M.B. Benke, F.J. Larney, and T.A. McAllister. 2011. Greenhouse gas emissions when
composting manure from cattle fed wheat dried distillers’ grains with solubles. Nutr.
Cycl. Agroecosyst. 89:105-114.
Hartikainen, H. And M. YliHalla. 1996. Solubility of soil phosphorus as influenced by urea.
Zeitschrift Fur Pflanzenernahrung Und Bodenkunde. 159:327-332.
Hendershot, W.H., H. Lalonde, and M. Duquette. Chapter 19: Ion Exchange and Exchangeable
cations. In: M.R. Carter, editor, Soil Sampling Methods and Analysis. Can. Society of
Soil Sci., CRC Press: Boca Raton, FL.
Hurisso, T.T., J.G. Davis, J.E. Brummer, M.E. Stromberger, F.H. Stonaker, B.C. Kondratieff,
M.R. Booher, and D.A. Goldhamer. 2011. Earthworm abundance and species
composition in organic forage production systems of northern Colorado receiving
different soil amendments. Applied Soil Ecology. 48:219-226.
Jackson, L.E., M. Burger, and T.R. Cavagnaro. 2008. Roots, nitrogen transformations, and
ecosystem services. Annu. Rev. Plant Biol. 59:341-363.
Keeney, D.R. and D.W. Nelson. 1982. Nitrogen – inorganic forms. In: A.L. Page, R.H. Miller,
and D.R. Keeney (eds.). Methods of soil analysis. Part 2. Chemical and microbiological
properties. Agronomy Monograph no. 9. 2nd Edition. ASA-SSSA: Madison, WI, USA. p.
643-698.
100
Keiffer, C.H. and I.A. Ungar. 2001. The effect of competition and edaphic conditions on the
establishment of halophytes on brine effected soils. Wetlands Ecology and Manage.
9:469-481.
Keiffer, C.H. and I.A. Ungar. 2002. Germination and establishment of halyphytes on brine-
affected soils. J. of Applied Ecology. 39:402-415.
Knowles, O.A., B.H. Robinson, A. Contangelo, and L. Clucas. 2011. Biochar for the mitigation
of nitrate leaching from soil amended with biosolids. Sci. of the Total Environ. 409:
3206-3210.
Ladha, J.K., C.K. Reddy, A.T. Padre, and C. van Kessel. 2011. Role of nitrogen fertilization in
sustaining organic matter in cultivated soils. J. Environ. Qual. 40:1756-1766.
Lakhdar, A., C. Hafsi, A. Debez, F. Montemurro, N. Jedidi, and C. Abdelly. 2011. Assessing
solid waste compost application as a practical approach for salt-affected soil reclamation.
Acta Acriculturae Scandinavica Section B – Soil and Plant Science. 61:284-288.
Larney, F.J., O. Akinremi, R.L. Lemke, V.E. Klaasen, and H.H. Janzen. 2005. Soil responses to
topsoil replacement and organic amendments in wellsite reclamation. Can. J. Soil Sci.
85:307-317.
Larney, F.J., D.M. Sullivan, K.E. Buckley, and Bahman Eghball. 2006. The role of composting
in recycling manure nutrients. Can. J. Soil Sci. 86:597-611.
Larney, F.J., A.F. Olson, J.J. Miller, P.R. DeMaere, F. Zvomuya, and T.A. McAllister. 2008.
Physical and chemical changes during composting of wood chip-bedded and straw-
bedded beef cattle feedlot manure. J. Environ. Qual. 37:725-735.
Lehmann, J. 2007. Bio-energy in the black. Frontiers in Ecology and the Environ. 5: 381-387.
101
Levi-Minzi, R., R. Riffaldi, and A. Saviozzi. 1990. Carbon mineralization in soil amended with
different organic materials. Agric., Ecosystems and Environ. 31: 325-335.
Liang, B., L. Lehmann, D. Solomon, J. Kinyangi, J. Grossman, B. O’Neill, J.O. Skjemstad, J.
Thies, F. J. Luizao, J. Petersen, and E.G. Neves. 2006. Black carbon increases cation
exchange capacity in soils. Soil Sci. Am. J. 70: 1779-1730.
Lindsay, W.L. and W.A. Norvell. 1978. Development of DTPA soil test for zinc, iron,
manganese, and copper. Soil Sci. Soc. Am. J. 42:421-428.
Lipoth, S.L. and J.J. Schoenau. 2007. Copper, zinc, and cadmium accumulation in two prairie
soils and crops as influenced by repeated applications of manure. J. Plant Nutr. Soil Sci.
170:378-386.
Liu, K., A.M. Hammermeister, M.H. Entz, T. Astatkie, P.R. Warman, and R.C. Martin. 2010.
Nitrogen availability in an organic potato crop following 3-year transition under
contrasting farming systems. J. of Sustainable Agric. 34:824-835.
Mallory, E.B., T.S. Griffin, and G.A. Porter. 2010. Seasonal nitrogen availability from current
and past applications of manure. Nutr. Cycling Agroecosystems. 88:351-360.
McGinn, S.M., Y.H. Chung, K.A. Beauchemin, A.D. Iwaasa, and C. Grainger. 2009. Use of corn
distillers’ dried grains to reduce enteric methane loss from beef cattle. Can. J. Anim. Sci.
89:409-413.
Miller, J.J., B.W. Beasley, F.J. Larney, and B.M. Olson. 2004. Barley dry matter yield, crop
uptake and soil nutrients under fresh and composted manure containing straw or wood-
chip bedding. Can. J. Plant Sci. 84:987-999.
102
Miller, J.J., B.W. Beasley, C.F. Drury, and B.J. Zebarth. 2010. Available nitrogen and
phosphorus in soil amended with fresh or composted cattle manure containing straw or
wood-chip bedding. Can. J. Soil Sci. 90:341-354.
Miyasaka, S.C., J.R. Hollyer, and L.S. Kodani. 2001. Mulch and compost effects on yield and
corm rots of taro. Field Crops Res. 71: 101-112.
Mooleki, S.P., J.J. Schoenau, J.L. Charles, and G. Wen. 2004. Effect of rate, frequency and
incorporation of feedlot cattle manure on soil nitrogen availability, crop performance and
nitrogen use efficiency in east-central Saskatchewan. Can. J. Soil Sci. 84:199-210.
Nakhone, L.N. and M.A. Tabatabai. 2008. Nitrogen mineralization of leguminous crops in soils.
J. Plant Nutr. Soil Sci. 171:231-241.
Nelson, J.D.J., J.J. Schoenau, and S.S. Malhi. 2008. Soil organic carbon changes and distribution
in cultivated and restored grassland soils in Saskatchewan. Nutr. Cycling
Agroecosystems. 82: 137-148.
Neuman, D and K.L. Ford. 2006. Phytostabilization as a remediation alternative at mine sites.
U.S. Bureau of Land Management Papers. Technical Note 420.
Nourbakhsh, F. And A.R. Sheikh-Hosseini. 2006. A kinetic approach to evaluate salinity effects
on carbon mineralization in a plant residue-amended soil. J. of Zhejiang Univ. SCI. B.
7:788-793.
Novak, J.M., W.J. Busscher, D.L. Laird, M. Ahmedna, D.W. Watts, and M.A.S. Niandou.
2009A. Impact of biochar amendment on fertility of a southeastern coastal plain soil. Soil
Sci. 174:105-112.
Novak, J.M., I. Lima, B. Xing, J.W. Gaskin, C. Steiner, K.C. Das, M. Ahmedna, D. Rehrah,
D.W. Watts, W.J. Busscher, and H. Schomberg. 2009B. Characterization of designer
103
biochar produced at different temperatures and their effects on a loamy sand. Annals of
Environ. Sci. 3:195-206.
Paris, O., C.Zollfrank, G.A Zickler. 2005. Decomposition and carbonisation of wood
biopolymers – a microstructural study of softwood pyrolysis. Carbon 43:53–66.
Park, J.H., D. Lamb, P. Paneerselvam, G. Choppala, N. Bolan, and J. Chung. 2010. Role of
organic amendments on enhanced bioremediation of heavy metal(loid) contaminated
soils. J. of Hazardous Materials. 185:549-574.
Puschel, D., J. Rydlova, R. Sudova, M. Gryndler, and M. Vosatka. 2011. The potential of
mycorrhizal inoculation and organic amendment to increase yields of Galega orientalis
and Helianthus tuberosus in a spoil-bank substrate. J. Plant Nutr. Soil Sci. 174:664-672.
Qian, P., J.J. Schoenau, and R.E. Karamanos. 1994. Simultaneous extraction of available
phosphorus and potassium with a new soil test – a modification of Kelowna extraction.
Commun. in Soil Sci. and Plant Anal. 25:627-635.
Qian, P. and J.J. Schoenau. 2002. Availability of nitrogen in solid manure amendments with
different C:N ratios. Can. J. Soil Sci. 82:219-225.
Qian, P., J. J. Schoenau, T. King, and C. Fatteicher. 2008. Effect of soil amendment with alfalfa
pellets and glycerol on nutrition and growth of wheat. Soils and Crops Workshop.
Saskatoon, Canada: University of Saskatchewan (CD).
Qian, P., J.J. Schoenau, T. King, and C. Fatteicher. 2011. Effect of soil amendment with alfalfa
powders and distillers grains on nutrition and growth of canola. J. of Plant Nutr. 34:1403-
1417.
Reeves, D.W. 1997. The role of soil organic matter in maintaining soil quality in continuous
cropping systems. Soil and Tillage Res. 43:131-167.
104
Richard, T.L., Hamelers, H.V.M., Veeken, A. And Silva, T. 202 Moisture relationships in
composting processes. Compost Sci. Util. 10:286-302.
Rondon, M.A., J. Lehmann, J. Ramirez, and M. Hurtado. 2006. Biological nitrogen fixation by
common beans (Phaseolus vulgaris L.) increases with bio-char additions. Biol. Fertil.
Soils. 43:699-708.
Saskatchewan Agriculture Knowledge Centre. 2008. The Nature and Management of Salt-
Affected Land in Saskatchewan.
http://www.agriculture.gov.sk.ca/Default.aspx?DN=2d20bb89-4290-4eea-b265-
dfd3a155cc51 (accessed 4 Mar. 2012).
Saskatchewan Ministry of Agriculture. 2008. Irrigation Certification: developing a prosperous
and sustainable irrigation industry.
http://www.agriculture.gov.sk.ca/Default.aspx?DN=88bd0590-0078-4796-bfad-
aa653f3516fc (accessed 4 Mar. 2012).
Saskatchewan Petroleum Industry/Government Environmental Committee (SPIGEC). Revised
2009. Saskatchewan Upstream Petroleum Sites Remediation Guidelines.
http://www.er.gov.sk.ca/adx/aspx/adxGetMedia.aspx?DocID=3891,3620,3384,5460,2936
,Documents&MediaID=27255&Filename=PDB+ENV+07+-
+SPIGEC4+Upstream+Contaminated+Sites+Remediation+Guideline.pdf (accessed 8
Nov. 2011).
Savidov, N. and V. Bansal. 2005. Barley production on saline soil using different soil
amendments.
Schoenau, J.J, and J.G. Davis. 2006. Optimizing soil and plant responses to land-applied manure
nutrients in the Great Plains of North America. Can. J. Soil Sci. 86(4):587-595.
105
Spiehs, M.J., M.H. Whitney, and G.C. Shurson. 2002. Nutrient database for distiller’s dried
grains with solubles produced from new ethanol plants in Minnesota and South Dakota. J.
Anim. Sci. 80:2639-2645.
Steiner, C., B. Glaser, W.G. Teixeira, J. Lehmann, W.E.H. Blum, and W. Zech. 2008. Nitrogen
retention and plant uptake on a highly weathered central Amazonian Ferralsol amended
with compost and charcoal. J. Plant Nutr. Soil Sci. 171:893-899.
Stoklas, U.F. 1999. Variations in plant response to organic and inorganic amendments in sand.
Composting Council of Canada 9th Annual Conference, Nov. 1999.
The Prairie Province’s Committee on Livestock Development and Manure Management. 2001.
Tri- Provincial Manure Application and Use Guidelines: Saskatchewan. Saskatchewan
Agriculture, Food and Rural Revitilization.
www.agriculture.gov.sk.ca/Default.aspx?DN=57305010-14e4-4459-b2cd-fd09317acee7
(accessed on 4 March 2012).
Thomas, R.L., R.W. Sheird, and J.R. Moyer. 1967. Comparison of conventional and automated
procedures for N, P, and K analysis of plant material using a single digestion. Agronomy
Journal, 59: 240-243.
Tiquia, S.M., T.L. Richard, and M.S. Honeyman. 2002. Carbon, nutrient, and mass loss during
composting. Nutr. Cycling in Agroecosystems. 62:15-24.
Uchimiya, M., L.H. Wartelle, K.T. Klasson, C.A. Fortier, and I.M. Lima. 2011. Influence of
pyrolysis temperature on biochar property and function as a heavy metal sorbent in soil.
J. of Agric. and Food Chem. 59:2501-2510.
106
Undi, M., S. Li, J.C. Plaizier, K.H. Ominski, A. Brule-Babel, and K.M. 2011. Wittenberg.
Canadian Society of Animal Science 60th Annual Meeting, 4-5 May 2011, Halifax, NS.
In: J. Animal. Sci. 91:517.
US Grains Council. 2009. Nutrient Composition of DDGS.
http://www.grains.org/images/stories/DDGS_user_handbook/09%20-
%20Nutrient%20content%20of%20DDGS%20-
%20Variability%20and%20measurement.pdf (accessed 9 Mar. 2012).
Verheijen, F.G.A., S. Jeffery, A.C. Bastos, M. van der Velde, and I. Diafas. 2009. Biochar
application to soils: A scientific review of effects on soil properties, processes, and
functions. EUR 24099 EN, Office for the Official Publications of the European
Communities. Lumxemboug.
Wahid, A., S. Akhtar, I. Ali, and E. Rasul. 1998. Amelioration of saline-sodic soils with organic
matter and their use for wheat growth. Commun. Soil Sci. Plant Anal. 29:2307-2318.
Walter, L.J., J.L. Aalhus, W.M. Robertson, T.A. McAllister, D.J. Gibb, M.E.R Dugan, and J.J.
McKinnon. 2010. Evaluation of wheat or corn dried distillers’ grains and solubles on
performance and carcass characteristics of feedlot steers. Can. J. Anim. Sci. 90: 259-269.
Wang, D. and D.W. Anderson. 1998. Direct measurement of organic carbon content in soils by
the Leco CR-12 carbon analyzer. Commun. Soil Sci. Plant Anal. 29:15-21.
Warren, G.P., J.S. Robinson, and E. Someus. 2009. Dissolution of phosphorus from animal bone
char in 12 soils. Nutr. Cycling Agroecosystems. 84:167-178.
Whalen, J.K., H. Benslim, Y. Jiao, and B.K. Sey. 2008. Soil organic carbon and nitrogen pools
as affected by compost applications to a sandy-loam soil in Quebec. Can J. Soil Sci.
88:443-450.
107
Wiens, M.J., M.H. Entz, R.C. Martin, and A.M. Hammermeister. 2006. Agronomic benefits of
alfalfa mulch applied to organically managed spring wheat. Can. J. Plant Sci. 86: 121-
131.
Woolf, D. 2008. Biochar as a soil amendment: A review of the environmental implications.
http://orgprints.org/13268/1/Biochar_as_a_soil_amendment_-_a_review.pdf (accessed
28 Nov. 2011).
Xuan, T.D., S. Tawata, T.D. Khanh, and I.M. Chung. 2005. Decomposition of allelopathic plants
in soil. J. Agron. & Crop Sci. 191: 162-171.
Yuan, J, R. Xu, W. Qian, and R. Wang. 2011. Comparison of the ameliorating effects on an
acidic ultisol between four crop straws and their biochars. J. Soils Sediments. 11:741-
750.
Zvomuya, F., F.J. Larney, P.R. DeMaere, and A.F. Olson. 2008. Organic amendment effects on
crop productivity and nutrient uptake on reclaimed natural gas wellsites. Nutr. Cycling
Agroecosystems. 80:223-232.
108
APPENDIX A: BEHAVIOR OF DDGS TRITICALE FRESH MANURE AND BARLEY-
FED FRESH MANURE
Table A.1 Soil properties of initial soils used in the dried distillers’ grains and solubles
(DDGS)-fed cattle manure and control barley cattle manure growth chamber
studies. Soil was collected in the spring of 2010. See Chapter 3 for methods of
analysis.
Soil NO3 NH4 PO4 K OC pH
---------------------- mg kg-1
-------------------- %
Black soil 9.6 6.0 10 584 6.9 7.0
Brown soil 4.3 2.8 17 411 2.0 7.5
Canola Biomass and Nutrient Concentration
Figure A.1 Mean dry canola biomass (g kg-1
pot) for dried distillers’ grains and solubles
(DDGS) triticale and control barley treatments at 0, 30, 60, 90, and 120 g kg-1
rates on the Brown soil. Bars represent standard error of the mean.
0
1
2
3
4
5
6
7
0 30 60 90 120
Bio
mas
s (g
kg-1
)
Application Rate (g kg-1)
DDGS Triticale
Control Barley
LSD0.05= 1.3
109
Figure A.2 Mean dry plant biomass for distillers’ grains and solubles (DDGS) triticale and
barley control manure treatments at 0, 30, 60, 90, and 120 g kg-1
rates on the
Black soil. Bars represent standard error of the mean.
Figure A.3 Mean dry plant N concentration for DDGS triticale and control barley treatments
at 0, 30, 60, 90, and 120 g kg-1
rates on the Brown soil. Bars represent standard
error of the mean.
0
1
2
3
4
5
6
7
0 30 60 90 120
Bio
mas
s (g
kg-1
)
Application Rate (g kg-1)
DDGS Triticale
Control Barley
0
5000
10000
15000
20000
25000
30000
35000
40000
45000
0 30 60 90 120
Pla
nt
N (
mg
kg-1
)
Application Rate (g kg-1)
DDGS Triticale
Control Barley
LSD0.05= 9378
LSD0.05= 1.5
110
Figure A.4 Mean dry plant N concentration for distillers’ grains and solubles (DDGS)
triticale and barley control manure treatments at 0, 30, 60, 90, and 120 g kg-1
rates
on the Black soil. Bars represent standard error of the mean.
Table A.2 Mean N recovery for dried distillers’ grains and solubles (DDGS) triticale manure
and control barley manure treatments at 0, 30, 60, 90, and 120 g kg-1
rates on the
Black soil.
Manure Type Rate N Recovery
Brown Soil Black Soil
g kg-1
------------- % --------------
DDGS
Triticale
30 18 25
60 22 22
90 18 17
120 16 14
Control Barley
30 30 18
60 25 19
90 22 18
120 20 17
0
5000
10000
15000
20000
25000
30000
35000
40000
45000
0 30 60 90 120
Pla
nt
N (
mg
kg-1
)
Application Rate (g kg-1)
DDGS Triticale
Control Barley
LSD0.05= 8770
111
Figure A.5 Mean dry canola P concentration for distillers’ grains and solubles (DDGS)
triticale manure and control barley manure treatments at 0, 30, 60, 90, and 120 g
kg-1
rates on the Brown soil. Bars represent standard error of the mean.
Figure A.6 Mean dry plant P concentration for DDGS triticale and control barley treatments
at 0, 30, 60, 90, and 120 g kg-1
rates on the Black soil. Bars represent standard
error of the mean.
0
500
1000
1500
2000
2500
3000
3500
4000
4500
5000
0 30 60 90 120
Pla
nt
P (
mg
kg-1
)
Application Rate (g kg-1)
DDGS Triticale
Control Barley
0
500
1000
1500
2000
2500
3000
3500
4000
0 30 60 90 120
Pla
nt
P (
mg
kg-1
)
Application Rate (g kg-1)
DDGS Triticale
Control Barley
LSD0.05= 584
LSD0.05=503
112
Table A.3 Mean dry plant K, S, Cu, and Zn concentration for dried distillers’ grains and
solubles (DDGS) triticale manure and control barley manure treatments at 0, 30,
60, 90, and 120 g kg-1
rates on the Brown soil.
Manure Rate K S Cu Zn
g kg-1
---------------------------- mg kg-1
---------------------------
DDGS Triticale
0 30754.5 0.82 3.45 24.6
30 45814.9 0.74 3.00 18.7
60 59206.1 0.67 4.35 24.2
90 63060.1 0.40 4.13 22.1
120 62730.0 0.35 3.90 23.8
Control Barley
0 30754.5 0.82 3.45 24.6
30 43042.5 0.70 2.90 19.2
60 51928.2 0.70 3.30 25.3
90 59676.4 0.66 4.80 22.6
120 60852.2 0.64 4.20 26.1
LSD(0.05) 10547.5 ns ns ns
Table A.4 Mean dry plant K, S, Cu, and Zn concentration for dried distillers’ grains and
solubles (DDGS) triticale and control barley treatments at 0, 30, 60, 90, and 120 g
kg-1
rates on the Black soil.
Manure
Rate K S Cu Zn
g kg-1
------------------------ mg kg-1
-----------------------
DDGS Triticale
0 39319.9 0.53 3.60 27.9
30 52543.3 0.71 3.75 25.3
60 60803.2 0.54 3.30 34.3
90 60889.8 0.54 4.13 27.5
120 62562.8 0.34 4.20 31.3
Control Barley
0 39319.9 0.53 3.60 9.33
30 41357.7 0.71 2.70 6.86
60 54410.1 0.94 2.70 4.12
90 55631.7 0.82 3.60 5.85
120 60203.5 0.42 4.13 7.98
LSD(0.05) 11607.5 0.44 ns ns
113
Soil nutrient concentration
Figure A.7 Mean soil available NO3 for distillers’ grains and solubles (DDGS) triticale and
control barley manure treatments at 0, 30, 60, 90, and 120 g kg-1
rates on the
Brown soil. Bars represent standard error of the mean.
Figure A.8 Mean soil NO3 concentration for DDGS triticale and control barley treatments at
0, 30, 60, 90, and 120 g kg-1
rates on the Black soil. Bars represent standard error
of the mean.
-10
0
10
20
30
40
50
60
70
0 30 60 90 120
NO
3 (m
g kg
-1)
Application Rate (g kg-1)
DDGS Triticale
Control Barley
-20
-10
0
10
20
30
40
50
60
70
80
90
0 30 60 90 120
NO
3 (
mg
kg-1
)
Application Rate (g kg-1)
DDGS Triticale
Control Barley
LSD0.05=35.7
LSD0.05=50
114
Figure A.9 Mean soil NH4 concentration for dried distillers’ grains and solubles (DDGS)
triticale and barley control manure treatments at 0, 30, 60, 90, and 120 g kg-1
rates
on the Brown soil. Bars represent standard error of the mean.
Figure A.10 Mean soil NH4 for dried distillers’ grains and solubles (DDGS) triticale and
control barley treatments at 0, 30, 60, 90, and 120 g kg-1
rates on the Black soil.
Bars represent standard error of the mean.
0
1
2
3
4
5
6
7
8
0 30 60 90 120
NH
4 (m
g kg
-1)
Application Rate (g kg-1)
DDGS Triticale
Control Barley
0
1
2
3
4
5
6
7
8
0 30 60 90 120
NH
4 (m
g kg
-1)
Application Rate (g kg-1)
DDGS Triticale
Control Barley
LSD 0.05=1.3
LSD0.05=2.1
115
Figure A.11 Mean soil PO4 concentration for dried distillers’ grains and solubles (DDGS)
triticale and barley control manure treatments at 0, 30, 60, 90, and 120 g kg-1
rates on the Brown soil. Bars represent standard error of the mean.
Figure A.12 Mean soil PO4 concentration for dried distillers’ grains and solubles (DDGS)
triticale and control barley treatments at 0, 30, 60, 90, and 120 g kg-1
rates on the
Black soil. Bars represent standard error of the mean.
0
10
20
30
40
50
60
70
80
90
100
0 30 60 90 120
Soil
PO
4 (m
g kg
-1)
Application Rate (g kg-1)
DDGS Triticale
Control Barley
-20
0
20
40
60
80
100
0 30 60 90 120
Soil
PO
4 (m
g kg
-1)
Application Rate (g kg-1)
DDGS Triticale
Control Barley
LSD0.05=9.7
LSD 0.05=16.1
116
Table A.5 Mean soil electrical conductivity (EC), pH, and soil organic carbon (SOC)
concentration for dried distillers’ grains and solubles (DDGS) triticale and barley
control manure treatments at 0, 30, 60, 90, and 120 g kg-1
rates on the Brown soil.
Manure Rate EC pH SOC
g kg-1
mS cm-1
%
DDGS Triticale
0 0.49 7.5 1.4
30 0.54 7.2 1.5
60 0.63 7.0 3.0
90 0.82 7.1 1.7
120 1.22 7.1 1.9
Control Barley
0 0.49 7.5 1.4
30 0.53 7.3 1.5
60 0.58 7.4 1.6
90 0.49 7.6 1.6
120 0.86 7.6 1.8
LSD(0.05) 0.30 0.4 ns
Table A.6 Mean soil electrical conductivity (EC), pH, and soil organic carbon (SOC) for
DDGS triticale and control barley treatments at 0, 30, 60, 90, and 120 g kg-1
q
rates on the Black soil.
Manure Rate EC pH SOC
g kg-1
mS cm-1
%
Triticale
0 0.55 6.8 3.3
30 0.63 7.0 3.4
60 0.79 7.1 3.6
90 1.12 7.1 3.6
120 1.37 7.1 3.8
Control
Barley
0 0.55 6.8 3.3
30 0.52 7.4 3.3
60 0.71 7.2 3.4
90 0.89 7.1 3.6
120 1.03 7.1 3.7
LSD(0.05) 0.46 0.36 0.24
117
Table A.7 Mean soil available K, SO4-S, Cu, and Zn concentration for dried distillers’ grains
and solubles (DDGS) triticale and barley control manure treatments at 0, 30, 60,
90, and 120 g kg-1
rates on the Brown soil.
Manure Rate K SO4-S Cu Zn
g kg-1
------------------------- mg kg-1
-----------------------
DDGS Triticale
0 472.6 49.8 1.1 0.97
30 459.3 50.3 1.0 0.76
60 529.4 59.6 1.1 1.1
90 633.3 65.0 1.2 1.6
120 870.1 76.9 1.2 2.3
Control Barley
0 472.6 49.8 1.1 0.97
30 529.1 42.2 0.93 1.1
60 625.9 37.8 0.96 1.5
90 619.7 51.0 1.0 1.7
120 749.7 57.9 1.1 2.6
LSD(0.05) 122.1 14.8 0.3 1.1
Table A.8 Mean soil available K, SO4-S, Cu, and Zn for dried distillers’ grains and solubles
(DDGS) triticale and control barley manure treatments at 0, 30, 60, 90, and 120 g
kg-1
rates on the Black soil.
Manure Rate K SO4-S Cu Zn
g kg-1
------------------------ mg kg-1
------------------------
DDGS Triticale
0 611.2 65.6 0.98 2.0
30 667.7 66.7 1.2 2.5
60 734.6 83.9 1.3 2.6
90 889.2 94.4 1.5 2.9
120 1014.6 97.9 1.5 3.0
Control Barley
0 611.2 65.6 0.98 2.0
30 708.1 49.6 1.3 1.7
60 704.2 54.4 1.2 2.2
90 788.1 72.9 1.2 3.0
120 841.9 72.8 1.2 3.0
LSD(0.05) 85.7 25.7 0.19 0.6
118
APPENDIX B: FIELD DATA
Table B.1 Properties of oat hull-based biochar used in field study. Data analysis from ALS
Laboratories.
Oat Hull Biochar
Property Concentration
%
Moisture 0.1
Total N 2.4
P 2.5
K 1.5
S 0.1
Na 0.8
Ca 4.6
Mg 0.2
Cu 0.0
Fe 0.4
Mn 0.0
Zn 0.0
Table B.2 Initial soil properties in the fall of 2009 in the control plots for the Degraded area
and the Berm area taken at two depth ranges.
Plot Area Block Depth pH EC OC
Degraded Area
cm
mS cm-1
%
1 0-30 7.68 0.099 0.491
30-60 7.67 0.107 0.254
2 0-30 7.31 0.128 0.767
30-60 7.37 0.098 0.363
3 0-30 7.3 0.108 0.693
30-60 7.68 0.163 0.258
4 0-30 7.63 0.119 1.146
30-60 7.53 0.093 0.638
Berm Area
1 0-30 7.72 0.425 0.366
30-60 7.44 1.09 0.310
2 0-30 8.27 1.13 0.475
30-60 7.84 2.43 0.350
3 0-30 8.32 0.39 0.422
30-60 8.09 0.687 0.307
4 0-30 7.87 0.581 0.400
30-60 7.44 1.95 0.281
119
Figure B.1 Plant biomass on the Degraded are in the fall of 2010 for six treatments.
(AP5=alfalfa pellets at 5 t ha-1
; AP10= alfalfa pellets at 10 t ha-1
; AP20=alfalfa
pellets at 20 t ha-1
; B5=biochar at 5 t ha; B5u=biochar at 5 t ha-1
plus urea at 50 kg
N ha-1
).
Table B.3 Initial soil nutrient concentrations in the fall of 2009 in the control plots for the
Degraded area and the Berm area taken at two depth ranges.
Plot Area Block Depth PO4-P K NO3-N NH4-N
cm ------------------- mg kg-1
------------------
Degraded
Area
1 0-30 1.82 163.40 3.70 4.05
30-60 1.07 113.00 3.27 3.74
2 0-30 2.45 235.00 3.87 4.47
30-60 1.30 117.50 3.14 4.40
3 0-30 3.01 163.40 3.91 5.37
30-60 2.16 73.90 3.55 4.83
4 0-30 4.18 242.70 3.89 5.28
30-60 3.20 128.70 3.82 4.84
Berm Area
1 0-30 0.39 402.10 3.64 5.03
30-60 0.61 385.50 2.63 5.29
2 0-30 1.34 767.90 2.69 4.91
30-60 0.51 593.70 2.51 5.23
3 0-30 0.32 346.40 3.66 5.78
30-60 0.35 165.80 3.21 6.41
4 0-30 0.41 326.70 3.49 6.45
30-60 0.53 188.90 3.40 7.80
Table B.4 Soil pH, electrical conductivity (EC), cation exchange capacity (CEC), and
organic carbon (OC) concentration on the Degraded area for all six treatments.
0
50
100
150
200
250
300
350
400
Control AP5 AP10 AP20 B5 B5u
Bio
mas
s (g
m-2
)
Treatment
LSD(0.05) = ns
120
(AP5=alfalfa pellets at 5 t ha-1
; AP10= alfalfa pellets at 10 t ha-1
; AP20=alfalfa
pellets at 20 t ha-1
; B5=biochar at 5 t ha; B5u=biochar at 5 t ha-1
plus urea at 50 kg
N ha-1
). Soil samples were taken in the spring of 2010 at the 15-30 and 30-60 cm
depths.
Trt. No. Trt. ID Depth pH EC CEC OC
cm mS cm-1
cmolc kg-1
%
1 Control
15-30
6.3 0.11 8.9 0.61
2 AP5 7.6 0.14 9.0 0.91
3 AP10 7.7 0.14 9.7 0.81
4 AP20 7.7 0.16 9.2 0.78
5 B5 7.6 0.15 7.8 0.62
6 B5u 7.6 0.26 9.0 0.86
1 Control
30-60
6.3 0.09 7.2 0.35
2 AP5 7.7 0.12 7.5 0.52
3 AP10 7.7 0.12 7.4 0.57
4 AP20 7.7 0.13 7.5 0.48
5 B5 7.6 0.13 6.8 0.37
6 B5u 7.6 0.13 7.9 0.55
Table B.5 Soil pH, electrical conductivity (EC), cation exchange capacity (CEC), and
organic carbon (OC) concentration on the Degraded area for all six treatments.
(AP5=alfalfa pellets at 5 t ha-1
; AP10= alfalfa pellets at 10 t ha-1
; AP20=alfalfa
pellets at 20 t ha-1
; B5=biochar at 5 t ha; B5u=biochar at 5 t ha-1
plus urea at 50 kg
N ha-1
). Soil samples were taken in the fall of 2010 at the 15-30 and 30-60 cm
depths.
Trt. No. Trt. ID Depth pH EC CEC OC
cm mS cm-1
cmolc kg-1
%
1 Control
15-30
6.1 0.1 8.5 0.44
2 AP5 7.6 0.1 9.3 0.84
3 AP10 7.6 0.1 9.3 0.98
4 AP20 7.5 0.1 8.8 0.76
5 B5 7.5 0.1 8.6 0.59
6 B5u 7.5 0.2 9.1 0.78
1 Control
30-60
6.1 0.1 7.1 0.37
2 AP5 7.6 0.1 7.5 0.54
3 AP10 7.6 0.1 8.0 0.57
4 AP20 7.5 0.1 7.9 0.50
5 B5 7.5 0.1 7.4 0.39
6 B5u 7.7 0.1 7.5 0.51
121
Table B.6 Soil NO3, NH4, PO4, SO4, and K (Kelowna extractable) concentration on the
Degraded area for all six treatments. (AP5=alfalfa pellets at 5 t ha-1
; AP10=
alfalfa pellets at 10 t ha-1
; AP20=alfalfa pellets at 20 t ha-1
; B5=biochar at 5 t ha-1
;
B5u=biochar at 5 t ha-1
plus urea at 50 kg N ha-1
). Soil samples were taken in the
spring of 2010 at the 15-30 and 30-60 cm depths.
Trt.
No. Trt. ID Depth NO3–N NH4–N PO4–P SO4–S K
cm ----------------------------- mg kg-1
-----------------------------
1 Control
15-30
2.03 3.61 0.49 3.07 178.5
2 AP5 2.49 4.83 0.50 3.72 256.3
3 AP10 3.32 4.21 0.79 3.51 274.8
4 AP20 2.68 4.82 0.66 4.05 228.2
5 B5 3.14 4.82 0.15 5.25 203.0
6 B5u 4.59 4.76 1.39 4.12 253.6
1 Control
30-60
0.73 2.43 0.23 2.31 138.0
2 AP5 0.65 3.43 0.37 3.14 167.5
3 AP10 1.26 3.51 0.36 2.91 175.1
4 AP20 0.64 3.65 0.41 2.68 150.8
5 B5 0.87 3.08 0.03 3.55 133.6
6 B5u 1.05 3.27 0.81 3.05 187.1
Table B.7 Soil NO3, NH4, PO4, SO4, and K (Kelowna extractable) concentration on the
Degraded area for all six treatments. (AP5=alfalfa pellets at 5 t ha-1
; AP10=
alfalfa pellets at 10 t ha-1
; AP20=alfalfa pellets at 20 t ha-1
; B5=biochar at 5 t ha-1
;
B5u=biochar at 5 t ha-1
plus urea at 50 kg N ha-1
). Soil samples were taken in the
fall of 2010 at the 15-30 and 30-60 cm depths.
Trt.
No. Trt. ID Depth NO3–N NH4–N PO4–P SO4–S K
cm - - - - - - - - - - mg kg-1
- - - - - - - - - -
1 Control
15-30
0.89 1.21 2.32 1.87 147.2
2 AP5 1.57 1.63 3.34 1.44 213.5
3 AP10 1.34 0.68 3.54 0.94 283.5
4 AP20 1.36 1.74 2.64 1.56 233.6
5 B5 1.91 2.13 4.09 1.97 196.2
6 B5u 1.91 2.01 2.73 1.78 232.9
1 Control
30-60
0.47 1.13 1.73 1.19 90.1
2 AP5 0.75 1.39 2.33 1.19 139.9
3 AP10 0.68 1.38 2.70 1.02 157.7
4 AP20 1.05 1.63 2.09 1.47 135.1
5 B5 1.49 1.78 2.63 2.21 103.0
6 B5u 0.69 1.57 2.73 1.89 136.7
122
Table B.8 Mean cations and the calculated soil cation exchange capacity (CEC) on the
degraded area for all six treatments. (AP5=alfalfa pellets at 5 t ha-1
; AP10=
alfalfa pellets at 10 t ha-1
; AP20=alfalfa pellets at 20 t ha-1
; B5=biochar at 5 t ha-1
;
B5u=biochar at 5 t ha-1
plus urea at 50 kg N ha-1
). Soil samples were taken in the
spring of 2010 at the 0-15, 15-30, and 30-60 cm depths.
Treatment Depth Ca Mg Na K CEC
cm -------------------------- cmol kg-1
--------------------------
Control 0-15 7.3 1.1 0.06 0.76 9.2
15-30 5.2 1.2 0.09 0.46 6.9
30-60 4.1 1.12 0.14 0.35 5.8
AP5 0-15 7.8 1.6 0.06 1.0 10.5
15-30 6.7 1.6 0.09 0.66 9.0
30-60 5.6 1.6 0.09 0.43 7.7
AP10 0-15 7.6 1.6 0.08 1.1 10.4
15-30 6.9 1.6 0.07 0.70 9.3
30-60 5.3 1.6 0.08 0.45 7.5
AP20 0-15 7.5 1.5 0.07 1.1 10.2
15-30 6.7 1.5 0.09 0.59 8.9
30-60 5.7 1.4 0.10 0.39 7.6
B5 0-15 7.3 1.5 0.09 1.2 10.1
15-30 5.6 1.5 0.08 0.52 7.6
30-60 5.1 1.5 0.11 0.34 7.0
B5u 0-15 7.4 1.5 0.10 1.1 10.1
15-30 6.3 1.5 0.09 0.65 8.5
30-60 5.8 1.4 0.11 0.48 7.8
LSD(0.05) 3.4
123
Table B.9 Mean cations and the calculated soil cation exchange capacity (CEC) on the
degraded area for all six treatments. (AP5=alfalfa pellets at 5 t ha-1
; AP10=
alfalfa pellets at 10 t ha-1
; AP20=alfalfa pellets at 20 t ha-1
; B5=biochar at 5 t ha-1
;
B5u=biochar at 5 t ha-1
plus urea at 50 kg N ha-1
). Soil samples were taken in the
fall of 2010 at the 0-15, 15-30, and 30-60 cm depths.
Treatment Depth Ca K Na Mg CEC
cm -------------------------- cmolc kg-1
-----------------------------
Control
0-15 7.1 0.65 0.03 1.5 9.3
15-30 6.4 0.41 0.04 1.6 8.5
30-60 5.0 0.28 0.11 1.8 7.1
AP5
0-15 8.0 0.75 0.02 1.6 10.3
15-30 7.0 0.53 0.03 1.7 9.3
30-60 5.5 0.32 0.07 1.6 7.5
AP10
0-15 8.1 1.0 0.06 1.7 10.9
15-30 7.0 0.61 0.05 1.7 9.4
30-60 5.9 0.53 0.04 1.8 8.2
AP20
0-15 7.7 0.85 0.03 1.6 10.2
15-30 6.6 0.47 0.03 1.7 8.8
30-60 6.0 0.28 0.03 1.6 7.9
B5
0-15 8.0 0.67 0.05 1.5 10.2
15-30 6.6 0.44 0.04 1.5 8.6
30-60 5.6 0.26 0.05 1.6 7.5
B5u
0-15 8.0 0.76 0.02 1.7 10.5
15-30 7.0 0.53 0.03 1.6 9.1
30-60 5.6 0.32 0.05 1.5 7.5
LSD0.05 2.5
124
Table B.10 Mean soil Cu and Zn concentration on the degraded area for all six treatments.
(AP5=alfalfa pellets at 5 t ha-1
; AP10= alfalfa pellets at 10 t ha-1
; AP20=alfalfa
pellets at 20 t ha-1
; B5=biochar at 5 t ha-1
; B5u=biochar at 5 t ha-1
plus urea at 50
kg N ha-1
). Soil samples were taken in the spring and fall of 2010 at the 0-15, 15-
30, and 30-60 cm depths.
Treatment Depth Spring 2010 Fall 2010
Cu Zn Cu Zn
cm --------------------------- mg kg-1
---------------------------
Control
0-15 0.26 0.61 0.48 0.70
15-30 0.24 0.25 0.35 0.47
30-60 0.24 0.13 0.64 0.23
AP5
0-15 0.34 0.90 0.33 0.84
15-30 0.26 0.35 0.32 0.29
30-60 0.22 0.17 0.40 0.21
AP10
0-15 0.35 0.87 0.43 0.12
15-30 0.30 0.50 0.37 0.40
30-60 0.31 0.31 0.44 0.21
AP20
0-15 0.32 0.81 0.38 0.72
15-30 0.31 0.31 0.27 0.25
30-60 0.29 0.23 0.53 0.20
B5
0-15 0.34 0.72 0.37 0.62
15-30 0.28 0.20 0.35 0.36
30-60 0.28 0.13 0.35 0.26
B5u
0-15 0.33 0.94 0.43 0.85
15-30 0.26 0.38 0.30 0.26
30-60 0.30 0.21 0.40 0.18
LSD0.05
ns 1.40 ns 1.30
Table B.11 Soil pH, electrical conductivity (EC), cation exchange capacity (CEC), and
organic carbon (OC) concentration on the Berm for all three treatments.
(AP5=alfalfa pellets at 5 t ha-1
; B5=biochar at 5 t ha-1
). Soil samples were
taken in the spring of 2010 at the 15-30 and 30-60 cm depths.
Trt. No. Trt. ID Depth pH EC CEC OC
cm mS cm-1
cmolc kg-1
%
1 Control
15-30
8.2 0.3 28.3 0.61
2 AP5 8.3 0.3 3.0.5 0.57
5 B5 8.2 0.5 31.8 0.62
1 Control
30-60
7.8 0.2 29.1 0.57
2 AP5 7.7 0.4 28.1 0.57
5 B5 7.7 0.5 28.7 0.57
125
Table B.12 Soil pH, electrical conductivity (EC), cation exchange capacity (CEC), and
organic carbon (OC) concentration on the Berm for all three treatments.
(AP5=alfalfa pellets at 5 t ha-1
; B5=biochar at 5 t ha-1
). Soil samples were
taken in the fall of 2010 at the 15-30 and 30-60 cm depths.
Trt. No. Trt. ID Depth pH EC CEC OC
cm mS cm-1
cmolc kg-1
%
1 Control
15-30
8.2 0.5 28.6 0.57
2 AP5 8.2 0.4 27.7 0.49
5 B5 8.3 0.6 30.6 0.50
1 Control
30-60
8.0 0.9 30.7 0.45
2 AP5 8.2 0.7 30.9 0.43
5 B5 7.8 1.7 32.3 0.52
Table B.13 Soil NO3-N, NH4-N, PO4-P, SO4-S, and K (Kelowna extractable) concentration
on the Berm for all three treatments. (AP5=alfalfa pellets at 5 t ha-1
; B5=biochar
at 5 t ha-1
). Soil samples were taken in the spring of 2010 at the 15-30 and 30-60
cm depth.
Trt. No. Trt. ID Depth NO3–N NH4–N PO4–P SO4–S K
cm -------------------------------- mg kg-1
------------------------------
1 Control
15-30
0.81 3.65 0.01 24.9 446.6
2 AP5 1.12 3.74 0.01 19.5 486.4
5 B5 0.83 3.46 0.01 26.1 634.2
1 Control
30-60
0.86 4.47 0.01 93.4 310.6
2 AP5 1.00 3.69 0.01 100.2 390.0
5 B5 0.83 3.42 0.01 121.8 446.2
Table B.14 Soil NO3-N, NH4-N, PO4-P, SO4-S, and K (Kelowna extractable) concentration
on the Berm for all three treatments. (AP5=alfalfa pellets at 5 t ha-1
; B5=biochar
at 5 t ha-1
). Soil samples were taken in the fall of 2010 at the 15-30 and 30-60
cm depth.
Trt. No. Trt. ID Depth NO3–N NH4–N PO4–P SO4–S K
cm -------------------------------- mg kg-1
------------------------------
1 Control 15-30 0.15 2.45 4.83 22.6 485.0
2 AP5 0.22 2.11 5.54 17.4 487.2
5 B5 0.21 2.46 4.15 26.0 532.4
1 Control 30-60 0.14 2.59 6.01 103.1 450.3
2 AP5 0.15 2.80 5.69 60.4 457.5
5 B5 0.10 3.11 5.89 176.4 575.0
126
Table B.15 Mean soil cation concentrations and soil cation exchange capacity (CEC) on the
Berm area for alfalfa (5 t ha-1
), biochar (5 t ha-1
) and control at three depth ranges
in the spring of 2010.
Treatment Depth Ca Mg Na K CEC
cm ------------------------- cmolc kg-1
-------------------------
1 - Control 0-15 20.2 1.8 0.80 1.4 24.2
15-30 20.9 2.4 3.0 1.1 27.4
30-60 23.0 3.6 2.4 0.80 29.8
2 - Alfalfa 0-15 20.1 2.1 1.5 1.1 24.8
15-30 21.9 2.7 3.7 1.3 29.6
30-60 22.6 3.5 1.2 1.0 28.3
5 - Biochar 0-15 20.3 2.0 1.4 1.7 25.3
15-30 21.8 3.0 3.8 1.6 30.2
30-60 23.1 3.8 0.72 1.1 28.8
LSD(0.05) ns
Table B.16 Soil cation exchange capacity (CEC) as a total of mean base cations on the Berm
area for alfalfa (5 t ha-1
), biochar (5 t ha-1
) and control at three depth ranges in the
fall of 2010.
Treatment Depth Ca K Na Mg CEC
cm -------------------------- cmolc kg-1
-------------------------------
Control
0-15 20.3 1.2 0.65 2.0 24.2
15-30 22.9 1.1 2.2 2.4 28.6
30-60 22.5 0.92 3.7 3.5 30.7
Alfalfa
0-15 22.3 1.1 0.60 2.1 26.1
15-30 22.0 1.2 1.6 2.9 27.7
30-60 23.3 0.96 3.3 3.3 30.9
Biochar
0-15 21.2 1.3 1.3 2.1 25.9
15-30 23.6 1.4 3.1 2.6 30.6
30-60 23.3 1.0 4.5 3.4 32.3
LSD(0.05)
ns
127
Table B.17 Mean soil Cu and Zn concentration on the Berm for all three treatments.
(AP5=alfalfa pellets at 5 t ha-1
; B5=biochar at 5 t ha-1
). Soil samples were taken in
the spring and fall of 2010 at the 0-15, 15-30, and 30-60 cm depths.
Treatment Depth Spring 2010 Fall 2010
Cu Zn Cu Zn
cm --------------------------- mg kg
-1 ---------------------------
Control
0-15 0.89 0.71 0.91 0.52
15-30 1.24 0.86 1.10 0.59
30-60 1.37 0.93 1.29 0.70
AP5
0-15 0.95 0.70 1.10 0.63
15-30 1.24 0.835 1.16 0.46
30-60 1.38 1.155 1.43 0.68
B5
0-15 1.05 0.78 0.94 0.52
15-30 1.37 0.95 1.28 0.65
30-60 1.32 1.32 1.61 0.96
LSD0.05
0.62 ns ns ns
128
Table B.18 Plant species and plant growth observations (fall of 2010) for treatments: control,
alfalfa at 5, 10, and 20 t ha-1
, biochar at 5 t ha-1
, and biochar (5 t ha-1
) + urea. Plots
1 to 24 were on the Degraded area while plots 25 to 36 were on the Berm area.
Plot Treatment Plant Species Notes
1 Biochar hairy golden aster, wormwood, alfalfa
low plant growth, mostly
forbs
2 Biochar+Urea
tall Wheatgrass, alfalfa, hairy golden
aster
3 Alfalfa-5 tall Wheatgrass, alfalfa, wormwood
4 Alfalfa-20 tall wheatgrass tall, dense vegetation
5 Control alfalfa wormwood low growth, mostly forbs
6 Alfalfa-10 smooth brome
7 Biochar tall wheatgrass denser grass
8 Alfalfa-20 alfalfa, hairy golden aster low growth
9 Control tall wheatgrass, hairy golden aster
10 Alfalfa-10 alfalfa, unknown grass low growth
11 Alfalfa-5
smooth brome, many flowered aster,
tall wheatgrass one tall clover plant
12 Biochar+Urea
13 Alfalfa-20 smooth brome, tall wheatgrass sparse vegetation
14 Control
tall wheatgrass, wormwood, hairy
golden aster Good growth
15 Biochar+Urea alfalfa low growth
16 Biochar smooth brome, unknown grass, alfalfa
17 Alfalfa-5 alfalfa, tall wheatgrass sparse grass
18 Alfalfa-10
hairy golden aster, alfalfa tall
wheatgrass, many flowered aster
19 Control alfalfa, hairy golden aster low growth
20 Biochar alfalfa sparse vegetation
21 Alfalfa-5 clover, wormwood, tall wheatgrass one tall clover plant
22 Alfalfa-20 tall wheatgrass, brome, alfalfa dense tall wheatgrass
23 Biochar+Urea hairy golden aster, brome
24 Alfalfa-10
tall wheatgrass, hairy golden aster,
clover dense vegetation
25 Biochar tall wheatgrass, alfalfa
129
Table B.19 Plant species and plant growth observations (fall of 2010) on the Berm area for
treatments: control, alfalfa pellets (alfalfa) at 5 t ha-1
, and biochar at 5 t ha-1
.
Plot Treatment Plant Species Notes
26 Control tall wheatgrass, alfalfa
27 Alfalfa tall wheatgrass, alfalfa
28 Control tall wheatgrass, alfalfa
29 Alfalfa tall wheatgrass, alfalfa, foxtail barley
30 Biochar tall wheatgrass, alfalfa, foxtail barley
31 Control tall wheatgrass, alfalfa
32 Biochar tall wheatgrass, alfalfa
33 Alfalfa tall wheatgrass, alfalfa, foxtail barley
34 Biochar tall wheatgrass, alfalfa
35 Alfalfa tall wheatgrass, alfalfa, foxtail barley
36 Control tall wheatgrass, alfalfa mostly alfalfa
Figure B.2 Adding amendments in the spring of 2010 by hand spreading and raking into the
tilled surface soil.
130
Figure B.3 Site visit on June 2010 (A) and site visit in July 2010 (B) showed Berm area
that was vegetating unevenly with a variety of species. Both photos are facing
west.
Figure B.4 Site visit in June 2010 showed plots on the Degraded area to show differences,
although there was a diversity of plant species (facing southwest).
A B
131
Figure B.5 Site visit in July 2010 also showed uneven growth and a variety of plant species,
both grasses and forbs, growing on Degraded area (facing south).
Figure B.6 A diversity of plant species growing on the Berm area at harvest in August 2010
(facing southeast).
132
Figure B.7 A diversity of plant species growing on the Degraded area at harvest time in
August 2010.
Figure B.8 Harvesting plant material in August 2010 by cutting about 2 to 5 cm above
ground level from a square meter area then bagging the material for each plot.
133
APPENDIX C: BIOCHAR GROWTH CHAMBER STUDY
Figure C.1 Harvesting stage of canola for the willow biochar pot study.
Table C.1 Mean canola Cu and Zn concentration for willow biochar at 5, 10, and 20 t ha-1,
biochar (10 t ha-1) plus fertilizer, fertilizer and control treatments on the Brown
soil.
Treatment Biochar Rate Zn Cu
t ha-1
---------- mg kg-1
--------
Control 0 24.6 3.5
Biochar 5 24.9 3.4
Biochar 10 22.4 3.9
Biochar 20 21.8 3.9
Biochar + Fertilizer 10 11.9 4.7
Fertilizer 0 12.7 4.1
LSD(0.05)
10.5 ns
134
Table C.2 Mean canola Cu and Zn concentration for willow biochar at 5, 10, and 20 t ha-1
,
biochar (10 t ha-1
) plus fertilizer, fertilizer and control treatments on the Black
soil.
Treatment Biochar Rate Zn Cu
t ha-1
---------- mg kg-1
--------
Control 0 27.9 3.6
Biochar 5 25.9 2.7
Biochar 10 23.4 3.2
Biochar 20 21.6 2.7
Biochar + Fertilizer 10 21.7 3.0
Fertilizer 0 27.4 5.7
LSD(0.05)
ns ns
Table C.3 Mean electrical conductivity (EC) and soil extractable Cu and Zn for biochar at 5,
10, and 20 t ha-1
, biochar (10 t ha-1
) plus fertilizer, fertilizer and control treatments
on the Brown soil.
Treatment Biochar Rate EC Zn Cu
t ha-1
mS cm-1
---------- mg kg-1
------
Control 0 0.49 0.97 1.06
Biochar 5 0.45 4.19 0.90
Biochar 10 0.47 0.69 0.91
Biochar 20 0.46 0.58 0.92
Biochar + Fertilizer 10 0.40 0.64 0.99
Fertilizer 0 0.43 0.69 0.92
LSD(0.05)
ns ns ns
Table C.4 Mean electrical conductivity (EC) and soil extractable Cu and Zn for willow
biochar at 5, 10, and 20 t ha-1
, biochar (10 t ha-1
) plus fertilizer, fertilizer and
control treatments on the Black soil.
Treatment Biochar Rate EC Zn Cu
t ha-1
mS cm-1
---------- mg kg-1
------
Control 0 0.55 1.9 0.98
Biochar 5 0.56 1.6 1.01
Biochar 10 0.51 1.7 1.00
Biochar 20 0.61 1.9 0.95
Biochar + Fertilizer 10 0.49 1.9 1.00
Fertilizer 0 0.50 2.8 0.98
LSD(0.05)
ns 0.47 ns