+ All Categories
Home > Documents > Novel Potent Lactam Acetylene EP4 Agonists Stimulate ... · Novel Potent Lactam Acetylene EP4...

Novel Potent Lactam Acetylene EP4 Agonists Stimulate ... · Novel Potent Lactam Acetylene EP4...

Date post: 14-Mar-2020
Category:
Upload: others
View: 23 times
Download: 0 times
Share this document with a friend
1
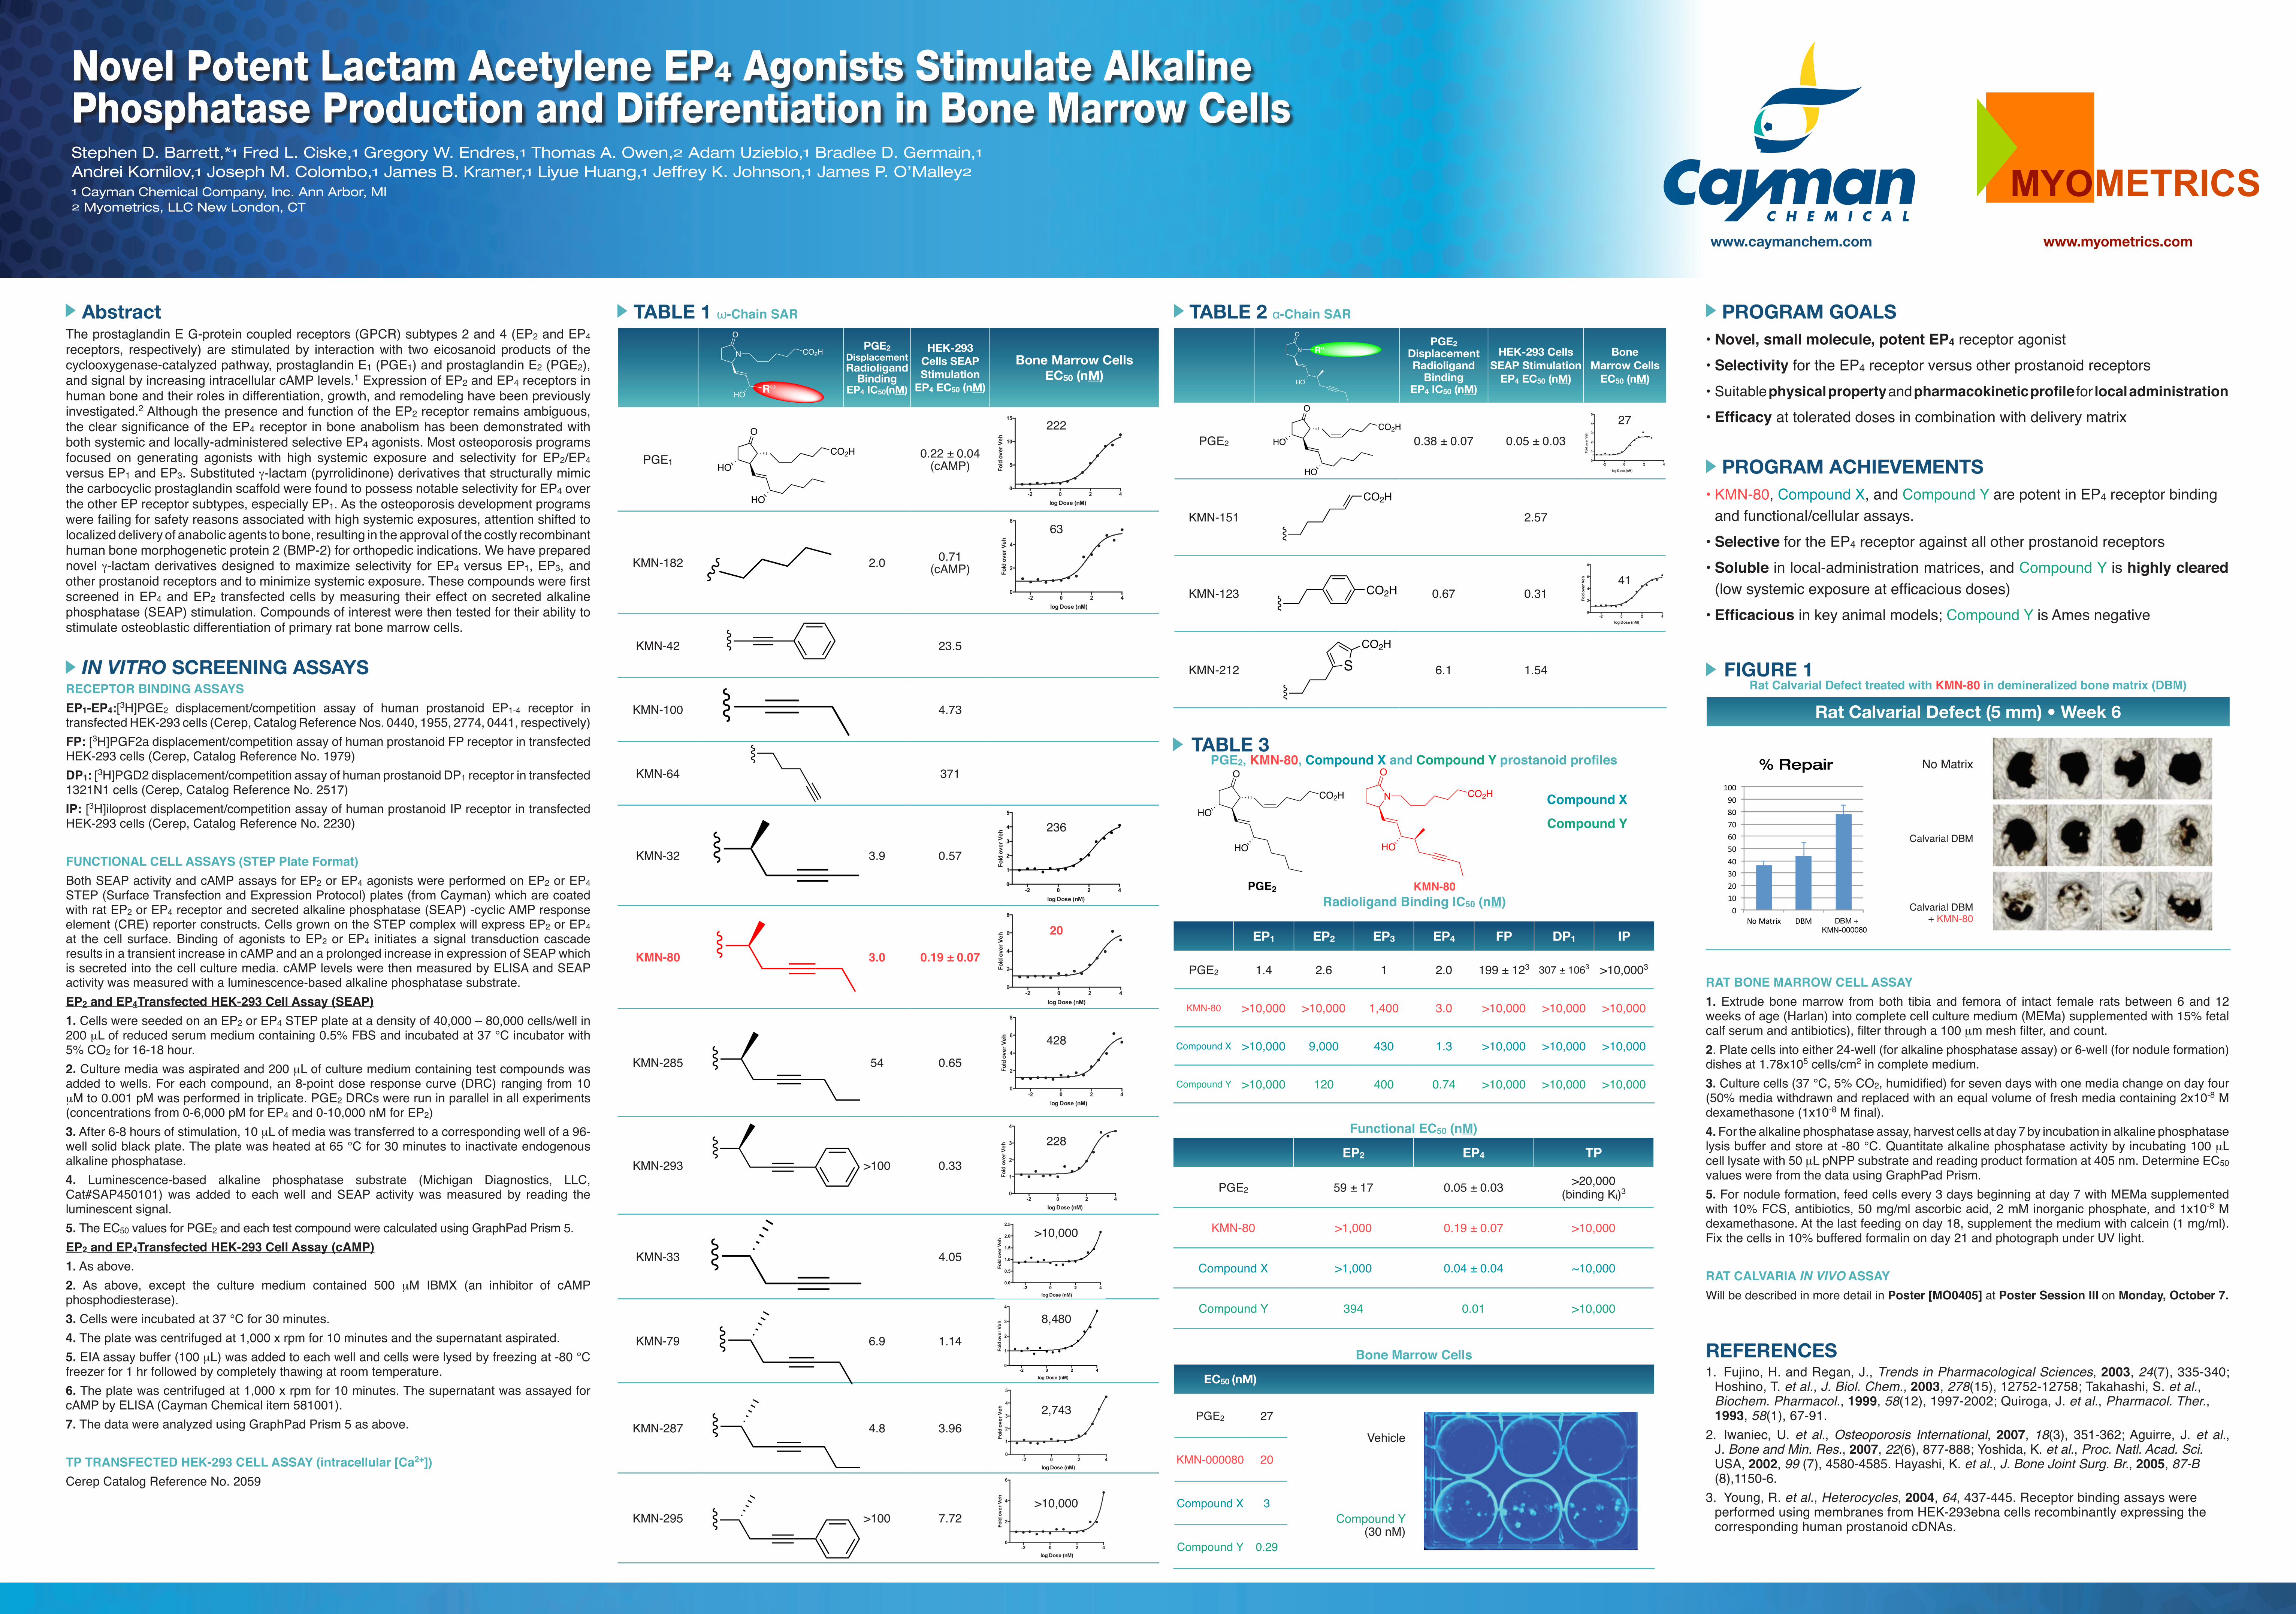
www.caymanchem.com www.myometrics.com Novel Potent Lactam Acetylene EP 4 Agonists Stimulate Alkaline Phosphatase Production and Differentiation in Bone Marrow Cells Stephen D. Barrett,* 1 Fred L. Ciske, 1 Gregory W. Endres, 1 Thomas A. Owen, 2 Adam Uzieblo, 1 Bradlee D. Germain, 1 Andrei Kornilov, 1 Joseph M. Colombo, 1 James B. Kramer, 1 Liyue Huang, 1 Jeffrey K. Johnson, 1 James P. O’Malley 2 1 Cayman Chemical Company, Inc. Ann Arbor, MI  2 Myometrics, LLC New London, CT PGE 2 Displacement Radioligand Binding EP 4 IC 50 (nM) HEK-293 Cells SEAP Stimulation EP 4 EC 50 (nM) Bone Marrow Cells EC 50 (nM) PGE 2 0.38 ± 0.07 0.05 ± 0.03 -2 0 2 4 0 1 2 3 4 5 log Dose (nM) Fold over Veh KMN-151 2.57 KMN-123 0.67 0.31 -2 0 2 4 0 2 4 6 8 log Dose (nM) Fold over Veh KMN-212 6.1 1.54 O HO HO CO 2 H CO 2 H CO 2 H S CO 2 H TABLE 2 α-Chain SAR N O R α HO TABLE 3 PGE 2 , KMN-80, Compound X and Compound Y prostanoid profiles EP 1 EP 2 EP 3 EP 4 FP DP 1 IP PGE 2 1.4 2.6 1 2.0 199 ± 12 3 307 ± 106 3 >10,000 3 KMN-80 >10,000 >10,000 1,400 3.0 >10,000 >10,000 >10,000 Compound X >10,000 9,000 430 1.3 >10,000 >10,000 >10,000 Compound Y >10,000 120 400 0.74 >10,000 >10,000 >10,000 Abstract The prostaglandin E G-protein coupled receptors (GPCR) subtypes 2 and 4 (EP 2 and EP 4 receptors, respectively) are stimulated by interaction with two eicosanoid products of the cyclooxygenase-catalyzed pathway, prostaglandin E 1 (PGE 1 ) and prostaglandin E 2 (PGE 2 ), and signal by increasing intracellular cAMP levels. 1 Expression of EP 2 and EP 4 receptors in human bone and their roles in differentiation, growth, and remodeling have been previously investigated. 2 Although the presence and function of the EP 2 receptor remains ambiguous, the clear significance of the EP 4 receptor in bone anabolism has been demonstrated with both systemic and locally-administered selective EP 4 agonists. Most osteoporosis programs focused on generating agonists with high systemic exposure and selectivity for EP 2 /EP 4 versus EP 1 and EP 3 . Substituted g-lactam (pyrrolidinone) derivatives that structurally mimic the carbocyclic prostaglandin scaffold were found to possess notable selectivity for EP 4 over the other EP receptor subtypes, especially EP 1 . As the osteoporosis development programs were failing for safety reasons associated with high systemic exposures, attention shifted to localized delivery of anabolic agents to bone, resulting in the approval of the costly recombinant human bone morphogenetic protein 2 (BMP-2) for orthopedic indications. We have prepared novel g-lactam derivatives designed to maximize selectivity for EP 4 versus EP 1 , EP 3 , and other prostanoid receptors and to minimize systemic exposure. These compounds were first screened in EP 4 and EP 2 transfected cells by measuring their effect on secreted alkaline phosphatase (SEAP) stimulation. Compounds of interest were then tested for their ability to stimulate osteoblastic differentiation of primary rat bone marrow cells. PGE 2 Displacement Radioligand Binding EP 4 IC 50 (nM) HEK-293 Cells SEAP Stimulation EP 4 EC 50 (nM) Bone Marrow Cells EC 50 (nM) PGE 1 0.22 ± 0.04 (cAMP) -2 0 2 4 0 5 10 15 log Dose (nM) Fold over Veh KMN-182 2.0 0.71 (cAMP) -2 0 2 4 0 2 4 6 log Dose (nM) Fold over Veh KMN-42 23.5 KMN-100 4.73 KMN-64 371 KMN-32 3.9 0.57 -2 0 2 4 0 1 2 3 4 5 log Dose (nM) Fold over Veh KMN-80 3.0 0.19 ± 0.07 -2 0 2 4 0 2 4 6 8 log Dose (nM) Fold over Veh KMN-285 54 0.65 -2 0 2 4 0 2 4 6 8 log Dose (nM) Fold over Veh KMN-293 >100 0.33 -2 0 2 4 0 1 2 3 4 log Dose (nM) Fold over Veh KMN-33 4.05 -2 0 2 4 0.0 0.5 1.0 1.5 2.0 2.5 log Dose (nM) Fold over Veh KMN-79 6.9 1.14 -2 0 2 4 0 1 2 3 4 log Dose (nM) Fold over Veh KMN-287 4.8 3.96 -2 0 2 4 0 1 2 3 4 5 log Dose (nM) Fold over Veh KMN-295 >100 7.72 -2 0 2 4 0 2 4 6 log Dose (nM) Fold over Veh IN VITRO SCREENING ASSAYS RECEPTOR BINDING ASSAYS EP 1 -EP 4 :[ 3 H]PGE 2 displacement/competition assay of human prostanoid EP 1-4 receptor in transfected HEK-293 cells (Cerep, Catalog Reference Nos. 0440, 1955, 2774, 0441, respectively) FP: [ 3 H]PGF2a displacement/competition assay of human prostanoid FP receptor in transfected HEK-293 cells (Cerep, Catalog Reference No. 1979) DP 1 : [ 3 H]PGD2 displacement/competition assay of human prostanoid DP 1 receptor in transfected 1321N1 cells (Cerep, Catalog Reference No. 2517) IP: [ 3 H]iloprost displacement/competition assay of human prostanoid IP receptor in transfected HEK-293 cells (Cerep, Catalog Reference No. 2230) FUNCTIONAL CELL ASSAYS (STEP Plate Format) Both SEAP activity and cAMP assays for EP 2 or EP 4 agonists were performed on EP 2 or EP 4 STEP (Surface Transfection and Expression Protocol) plates (from Cayman) which are coated with rat EP 2 or EP 4 receptor and secreted alkaline phosphatase (SEAP) -cyclic AMP response element (CRE) reporter constructs. Cells grown on the STEP complex will express EP 2 or EP 4 at the cell surface. Binding of agonists to EP 2 or EP 4 initiates a signal transduction cascade results in a transient increase in cAMP and an a prolonged increase in expression of SEAP which is secreted into the cell culture media. cAMP levels were then measured by ELISA and SEAP activity was measured with a luminescence-based alkaline phosphatase substrate. EP 2 and EP 4 Transfected HEK-293 Cell Assay (SEAP) 1. Cells were seeded on an EP 2 or EP 4 STEP plate at a density of 40,000 – 80,000 cells/well in 200 µL of reduced serum medium containing 0.5% FBS and incubated at 37 °C incubator with 5% CO 2 for 16-18 hour. 2. Culture media was aspirated and 200 µL of culture medium containing test compounds was added to wells. For each compound, an 8-point dose response curve (DRC) ranging from 10 µM to 0.001 pM was performed in triplicate. PGE 2 DRCs were run in parallel in all experiments (concentrations from 0-6,000 pM for EP 4 and 0-10,000 nM for EP 2 ) 3. After 6-8 hours of stimulation, 10 µL of media was transferred to a corresponding well of a 96- well solid black plate. The plate was heated at 65 °C for 30 minutes to inactivate endogenous alkaline phosphatase. 4. Luminescence-based alkaline phosphatase substrate (Michigan Diagnostics, LLC, Cat#SAP450101) was added to each well and SEAP activity was measured by reading the luminescent signal. 5. The EC 50 values for PGE 2 and each test compound were calculated using GraphPad Prism 5. EP 2 and EP 4 Transfected HEK-293 Cell Assay (cAMP) 1. As above. 2. As above, except the culture medium contained 500 µM IBMX (an inhibitor of cAMP phosphodiesterase). 3. Cells were incubated at 37 °C for 30 minutes. 4. The plate was centrifuged at 1,000 x rpm for 10 minutes and the supernatant aspirated. 5. EIA assay buffer (100 µL) was added to each well and cells were lysed by freezing at -80 °C freezer for 1 hr followed by completely thawing at room temperature. 6. The plate was centrifuged at 1,000 x rpm for 10 minutes. The supernatant was assayed for cAMP by ELISA (Cayman Chemical item 581001). 7. The data were analyzed using GraphPad Prism 5 as above. TP TRANSFECTED HEK-293 CELL ASSAY (intracellular [Ca 2+ ]) Cerep Catalog Reference No. 2059 Functional EC 50 (nM) EP 2 EP 4 TP PGE 2 59 ± 17 0.05 ± 0.03 >20,000 (binding K i ) 3 KMN-80 >1,000 0.19 ± 0.07 >10,000 Compound X >1,000 0.04 ± 0.04 ~10,000 Compound Y 394 0.01 >10,000 Bone Marrow Cells EC 50 (nM) PGE 2 27 Vehicle KMN-000080 20 Compound X 3 Compound Y (30 nM) Compound Y 0.29 O HO HO CO 2 H N O R ω HO CO 2 H REFERENCES 1. Fujino, H. and Regan, J., Trends in Pharmacological Sciences, 2003, 24(7), 335-340; Hoshino, T. et al., J. Biol. Chem., 2003, 278(15), 12752-12758; Takahashi, S. et al., Biochem. Pharmacol. , 1999, 58(12), 1997-2002; Quiroga, J. et al., Pharmacol. Ther. , 1993, 58(1), 67-91. 2. Iwaniec, U. et al., Osteoporosis International, 2007, 18(3), 351-362; Aguirre, J. et al., J. Bone and Min. Res., 2007, 22(6), 877-888; Yoshida, K. et al., Proc. Natl. Acad. Sci. USA, 2002, 99 (7), 4580-4585. Hayashi, K. et al., J. Bone Joint Surg. Br., 2005, 87-B (8),1150-6. 3. Young, R. et al., Heterocycles, 2004, 64, 437-445. Receptor binding assays were performed using membranes from HEK-293ebna cells recombinantly expressing the corresponding human prostanoid cDNAs. O HO PGE 2 CO 2 H HO N O HO CO 2 H Compound X Compound Y FIGURE 1 Rat Calvarial Defect treated with KMN-80 in demineralized bone matrix (DBM) Rat Calvarial Defect (5 mm) • Week 6 No Matrix Calvarial DBM Calvarial DBM + KMN-80 TABLE 1 ω-Chain SAR 222 63 236 20 428 228 >10,000 8,480 2,743 >10,000 Radioligand Binding IC 50 (nM) PROGRAM GOALS Novel, small molecule, potent EP 4 receptor agonist Selectivity for the EP 4 receptor versus other prostanoid receptors • Suitable physical property and pharmacokinetic profile for local administration Efficacy at tolerated doses in combination with delivery matrix PROGRAM ACHIEVEMENTS • KMN-80, Compound X, and Compound Y are potent in EP 4 receptor binding and functional/cellular assays. Selective for the EP 4 receptor against all other prostanoid receptors Soluble in local-administration matrices, and Compound Y is highly cleared (low systemic exposure at efficacious doses) Efficacious in key animal models; Compound Y is Ames negative RAT BONE MARROW CELL ASSAY 1. Extrude bone marrow from both tibia and femora of intact female rats between 6 and 12 weeks of age (Harlan) into complete cell culture medium (MEMa) supplemented with 15% fetal calf serum and antibiotics), filter through a 100 µm mesh filter, and count. 2. Plate cells into either 24-well (for alkaline phosphatase assay) or 6-well (for nodule formation) dishes at 1.78x10 5 cells/cm 2 in complete medium. 3. Culture cells (37 °C, 5% CO 2 , humidified) for seven days with one media change on day four (50% media withdrawn and replaced with an equal volume of fresh media containing 2x10 -8 M dexamethasone (1x10 -8 M final). 4. For the alkaline phosphatase assay, harvest cells at day 7 by incubation in alkaline phosphatase lysis buffer and store at -80 °C. Quantitate alkaline phosphatase activity by incubating 100 µL cell lysate with 50 µL pNPP substrate and reading product formation at 405 nm. Determine EC 50 values were from the data using GraphPad Prism. 5. For nodule formation, feed cells every 3 days beginning at day 7 with MEMa supplemented with 10% FCS, antibiotics, 50 mg/ml ascorbic acid, 2 mM inorganic phosphate, and 1x10 -8 M dexamethasone. At the last feeding on day 18, supplement the medium with calcein (1 mg/ml). Fix the cells in 10% buffered formalin on day 21 and photograph under UV light. RAT CALVARIA IN VIVO ASSAY Will be described in more detail in Poster [MO0405] at Poster Session III on Monday, October 7. 27 41 KMN-80
Transcript

www.caymanchem.com www.myometrics.com

Novel Potent Lactam Acetylene EP4 Agonists Stimulate Alkaline Phosphatase Production and Differentiation in Bone Marrow CellsStephen D. Barrett,*1 Fred L. Ciske,1 Gregory W. Endres,1 Thomas A. Owen,2 Adam Uzieblo,1 Bradlee D. Germain,1 Andrei Kornilov,1 Joseph M. Colombo,1 James B. Kramer,1 Liyue Huang,1 Jeffrey K. Johnson,1 James P. O’Malley2

1 Cayman Chemical Company, Inc. Ann Arbor, MI   2 Myometrics, LLC New London, CT

PGE2 DisplacementRadioligand

Binding EP4 IC50 (nM)

HEK-293 CellsSEAP Stimulation

EP4 EC50 (nM)

Bone Marrow Cells

EC50 (nM)

PGE2 0.38 ± 0.07 0.05 ± 0.03-2 0 2 4

0

1

2

3

4

5

log Dose (nM)

Fold

ove

r Veh

KMN-151 2.57

KMN-123 0.67 0.31

KMN-123IC50 = 41 nM (n = 3)

-2 0 2 40

2

4

6

8

log Dose (nM)

Fold

ove

r V

eh

KMN-212 6.1 1.54

O

HO

HO

CO2H

CO2H

CO2H

SCO2H

TABLE 2 α-Chain SAR

N

O

HO

TABLE 3 PGE2, KMN-80, Compound X and Compound Y prostanoid profiles

EP1 EP2 EP3 EP4 FP DP1 IP

PGE2 1.4 2.6 1 2.0 199 ± 123 307 ± 1063 >10,0003

KMN-80 >10,000 >10,000 1,400 3.0 >10,000 >10,000 >10,000

Compound X >10,000 9,000 430 1.3 >10,000 >10,000 >10,000

Compound Y >10,000 120 400 0.74 >10,000 >10,000 >10,000

AbstractThe prostaglandin E G-protein coupled receptors (GPCR) subtypes 2 and 4 (EP2 and EP4 receptors, respectively) are stimulated by interaction with two eicosanoid products of the cyclooxygenase-catalyzed pathway, prostaglandin E1 (PGE1) and prostaglandin E2 (PGE2), and signal by increasing intracellular cAMP levels.1 Expression of EP2 and EP4 receptors in human bone and their roles in differentiation, growth, and remodeling have been previously investigated.2 Although the presence and function of the EP2 receptor remains ambiguous, the clear significance of the EP4 receptor in bone anabolism has been demonstrated with both systemic and locally-administered selective EP4 agonists. Most osteoporosis programs focused on generating agonists with high systemic exposure and selectivity for EP2/EP4 versus EP1 and EP3. Substituted g-lactam (pyrrolidinone) derivatives that structurally mimic the carbocyclic prostaglandin scaffold were found to possess notable selectivity for EP4 over the other EP receptor subtypes, especially EP1. As the osteoporosis development programs were failing for safety reasons associated with high systemic exposures, attention shifted to localized delivery of anabolic agents to bone, resulting in the approval of the costly recombinant human bone morphogenetic protein 2 (BMP-2) for orthopedic indications. We have prepared novel g-lactam derivatives designed to maximize selectivity for EP4 versus EP1, EP3, and other prostanoid receptors and to minimize systemic exposure. These compounds were first screened in EP4 and EP2 transfected cells by measuring their effect on secreted alkaline phosphatase (SEAP) stimulation. Compounds of interest were then tested for their ability to stimulate osteoblastic differentiation of primary rat bone marrow cells.

PGE2 DisplacementRadioligand

Binding EP4 IC50(nM)

HEK-293 Cells SEAP Stimulation

EP4 EC50 (nM)

Bone Marrow CellsEC50 (nM)

PGE10.22 ± 0.04

(cAMP)

-2 0 2 40

5

10

15

log Dose (nM)

Fold

ove

r Veh

KMN-182 2.0 0.71 (cAMP)

-2 0 2 40

2

4

6

log Dose (nM)

Fold

ove

r Veh

KMN-42 23.5

KMN-100 4.73

KMN-64 371

KMN-32 3.9 0.57

-2 0 2 40

1

2

3

4

5

log Dose (nM)

Fold

ove

r Veh

KMN-80 3.0 0.19 ± 0.07

-2 0 2 40

2

4

6

8

log Dose (nM)Fo

ld o

ver V

eh

KMN-285 54 0.65

-2 0 2 4

0

2

4

6

8

log Dose (nM)

Fold

ove

r Veh

KMN-293 >100 0.33

-2 0 2 4

0

1

2

3

4

log Dose (nM)

Fold

ove

r Veh

KMN-33 4.05

-2 0 2 40.0

0.5

1.0

1.5

2.0

2.5

log Dose (nM)

Fold

ove

r Veh

KMN-79 6.9 1.14

-2 0 2 4

0

1

2

3

4

log Dose (nM)

Fold

ove

r Veh

KMN-287 4.8 3.96

-2 0 2 4

0

1

2

3

4

5

log Dose (nM)

Fold

ove

r Veh

KMN-295 >100 7.72

-2 0 2 4

0

2

4

6

log Dose (nM)

Fold

ove

r Veh

IN VITRO SCREENING ASSAYSRECEPTOR BINDING ASSAYSEP1-EP4:[3H]PGE2 displacement/competition assay of human prostanoid EP1-4 receptor in transfected HEK-293 cells (Cerep, Catalog Reference Nos. 0440, 1955, 2774, 0441, respectively)FP: [3H]PGF2a displacement/competition assay of human prostanoid FP receptor in transfected HEK-293 cells (Cerep, Catalog Reference No. 1979) DP1: [3H]PGD2 displacement/competition assay of human prostanoid DP1 receptor in transfected 1321N1 cells (Cerep, Catalog Reference No. 2517) IP: [3H]iloprost displacement/competition assay of human prostanoid IP receptor in transfected HEK-293 cells (Cerep, Catalog Reference No. 2230)

FUNCTIONAL CELL ASSAYS (STEP Plate Format)Both SEAP activity and cAMP assays for EP2 or EP4 agonists were performed on EP2 or EP4 STEP (Surface Transfection and Expression Protocol) plates (from Cayman) which are coated with rat EP2 or EP4 receptor and secreted alkaline phosphatase (SEAP) -cyclic AMP response element (CRE) reporter constructs. Cells grown on the STEP complex will express EP2 or EP4 at the cell surface. Binding of agonists to EP2 or EP4 initiates a signal transduction cascade results in a transient increase in cAMP and an a prolonged increase in expression of SEAP which is secreted into the cell culture media. cAMP levels were then measured by ELISA and SEAP activity was measured with a luminescence-based alkaline phosphatase substrate.EP2 and EP4Transfected HEK-293 Cell Assay (SEAP)1. Cells were seeded on an EP2 or EP4 STEP plate at a density of 40,000 – 80,000 cells/well in 200 µL of reduced serum medium containing 0.5% FBS and incubated at 37 °C incubator with 5% CO2 for 16-18 hour.2. Culture media was aspirated and 200 µL of culture medium containing test compounds was added to wells. For each compound, an 8-point dose response curve (DRC) ranging from 10 µM to 0.001 pM was performed in triplicate. PGE2 DRCs were run in parallel in all experiments (concentrations from 0-6,000 pM for EP4 and 0-10,000 nM for EP2) 3. After 6-8 hours of stimulation, 10 µL of media was transferred to a corresponding well of a 96-well solid black plate. The plate was heated at 65 °C for 30 minutes to inactivate endogenous alkaline phosphatase.4. Luminescence-based alkaline phosphatase substrate (Michigan Diagnostics, LLC, Cat#SAP450101) was added to each well and SEAP activity was measured by reading the luminescent signal.5. The EC50 values for PGE2 and each test compound were calculated using GraphPad Prism 5.EP2 and EP4Transfected HEK-293 Cell Assay (cAMP)1. As above.2. As above, except the culture medium contained 500 µM IBMX (an inhibitor of cAMP phosphodiesterase).3. Cells were incubated at 37 °C for 30 minutes.4. The plate was centrifuged at 1,000 x rpm for 10 minutes and the supernatant aspirated.5. EIA assay buffer (100 µL) was added to each well and cells were lysed by freezing at -80 °C freezer for 1 hr followed by completely thawing at room temperature.6. The plate was centrifuged at 1,000 x rpm for 10 minutes. The supernatant was assayed for cAMP by ELISA (Cayman Chemical item 581001).7. The data were analyzed using GraphPad Prism 5 as above.

TP TRANSFECTED HEK-293 CELL ASSAY (intracellular [Ca2+])Cerep Catalog Reference No. 2059

Functional EC50 (nM)

EP2 EP4 TP

PGE2 59 ± 17 0.05 ± 0.03 >20,000 (binding Ki)3

KMN-80 >1,000 0.19 ± 0.07 >10,000

Compound X >1,000 0.04 ± 0.04 ~10,000

Compound Y 394 0.01 >10,000

Bone Marrow Cells

EC50 (nM)

PGE2 27

Vehicle

KMN-000080 20

Compound X 3Compound Y

(30 nM)Compound Y 0.29

O

HO

HO

CO2H

N

O

RωHO

CO2H

REFERENCES1. Fujino, H. and Regan, J., Trends in Pharmacological Sciences, 2003, 24(7), 335-340;

Hoshino, T. et al., J. Biol. Chem., 2003, 278(15), 12752-12758; Takahashi, S. et al., Biochem. Pharmacol., 1999, 58(12), 1997-2002; Quiroga, J. et al., Pharmacol. Ther., 1993, 58(1), 67-91.

2. Iwaniec, U. et al., Osteoporosis International, 2007, 18(3), 351-362; Aguirre, J. et al., J. Bone and Min. Res., 2007, 22(6), 877-888; Yoshida, K. et al., Proc. Natl. Acad. Sci. USA, 2002, 99 (7), 4580-4585. Hayashi, K. et al., J. Bone Joint Surg. Br., 2005, 87-B (8),1150-6.

3. Young, R. et al., Heterocycles, 2004, 64, 437-445. Receptor binding assays were performed using membranes from HEK-293ebna cells recombinantly expressing the corresponding human prostanoid cDNAs.

O

HO

PGE2

CO2H

HON

O

HO

CO2H Compound X

Compound Y

FIGURE 1 Rat Calvarial Defect treated with KMN-80 in demineralized bone matrix (DBM)

Rat Calvarial Defect (5 mm) • Week 6

No Matrix

Calvarial DBM

Calvarial DBM + KMN-80

TABLE 1 ω-Chain SAR

222

63

236

20

428

228

>10,000

8,480

2,743

>10,000

Radioligand Binding IC50 (nM)

PROGRAM GOALS• Novel, small molecule, potent EP4 receptor agonist• Selectivity for the EP4 receptor versus other prostanoid receptors• Suitable physical property and pharmacokinetic profile for local administration• Efficacy at tolerated doses in combination with delivery matrix

PROGRAM ACHIEVEMENTS• KMN-80, Compound X, and Compound Y are potent in EP4 receptor binding

and functional/cellular assays.• Selective for the EP4 receptor against all other prostanoid receptors• Soluble in local-administration matrices, and Compound Y is highly cleared

(low systemic exposure at efficacious doses)• Efficacious in key animal models; Compound Y is Ames negative

RAT BONE MARROW CELL ASSAY1. Extrude bone marrow from both tibia and femora of intact female rats between 6 and 12 weeks of age (Harlan) into complete cell culture medium (MEMa) supplemented with 15% fetal calf serum and antibiotics), filter through a 100 µm mesh filter, and count. 2. Plate cells into either 24-well (for alkaline phosphatase assay) or 6-well (for nodule formation) dishes at 1.78x10⁵ cells/cm2 in complete medium.3. Culture cells (37 °C, 5% CO2, humidified) for seven days with one media change on day four (50% media withdrawn and replaced with an equal volume of fresh media containing 2x10⁻⁸ M dexamethasone (1x10⁻⁸ M final). 4. For the alkaline phosphatase assay, harvest cells at day 7 by incubation in alkaline phosphatase lysis buffer and store at -80 °C. Quantitate alkaline phosphatase activity by incubating 100 µL cell lysate with 50 µL pNPP substrate and reading product formation at 405 nm. Determine EC50 values were from the data using GraphPad Prism.5. For nodule formation, feed cells every 3 days beginning at day 7 with MEMa supplemented with 10% FCS, antibiotics, 50 mg/ml ascorbic acid, 2 mM inorganic phosphate, and 1x10⁻⁸ M dexamethasone. At the last feeding on day 18, supplement the medium with calcein (1 mg/ml). Fix the cells in 10% buffered formalin on day 21 and photograph under UV light.

RAT CALVARIA IN VIVO ASSAYWill be described in more detail in Poster [MO0405] at Poster Session III on Monday, October 7.

27

41

KMN-80

Recommended