18
INVESTOR PRESENTATION November 2018

INVESTOR PRESENTATIONNovember 2018

Certain statements contained in this document, other than statements of historical fact, including, without limitation, those concerning the economicoutlook for the gold mining industry, expectations regarding gold prices, production, total cash costs, all-in sustaining costs, all-in costs, cost savings andother operating results, productivity improvements, growth prospects and outlook of AngloGold Ashanti Limited’s (AngloGold Ashanti) operations,individually or in the aggregate, including the achievement of project milestones, commencement and completion of commercial operations of certain ofAngloGold Ashanti’s exploration and production projects and the completion of acquisitions, dispositions or joint venture transactions, AngloGoldAshanti’s liquidity and capital resources and capital expenditures and the outcome and consequence of any potential or pending litigation or regulatoryproceedings or environmental health and safety issues, are forward-looking statements regarding AngloGold Ashanti’s operations, economicperformance and financial condition.
These forward-looking statements or forecasts involve known and unknown risks, uncertainties and other factors that may cause AngloGold Ashanti’sactual results, performance or achievements to differ materially from the anticipated results, performance or achievements expressed or implied in theseforward-looking statements. Although AngloGold Ashanti believes that the expectations reflected in such forward-looking statements and forecasts arereasonable, no assurance can be given that such expectations will prove to have been correct. Accordingly, results could differ materially from those setout in the forward-looking statements as a result of, among other factors, changes in economic, social and political and market conditions, the success ofbusiness and operating initiatives, changes in the regulatory environment and other government actions, including environmental approvals, fluctuationsin gold prices and exchange rates, the outcome of pending or future litigation proceedings, and business and operational risk management.
For a discussion of such risk factors, refer to AngloGold Ashanti’s annual report on Form 20-F, which was filed with the United States Securities andExchange Commission (“SEC”). These factors are not necessarily all of the important factors that could cause AngloGold Ashanti’s actual results to differmaterially from those expressed in any forward-looking statements. Other unknown or unpredictable factors could also have material adverse effects onfuture results. Consequently, readers are cautioned not to place undue reliance on forward-looking statements. AngloGold Ashanti undertakes noobligation to update publicly or release any revisions to these forward-looking statements to reflect events or circumstances after the date hereof or toreflect the occurrence of unanticipated events, except to the extent required by applicable law. All subsequent written or oral forward-looking statementsattributable to AngloGold Ashanti or any person acting on its behalf are qualified by the cautionary statements herein.
The financial information contained in this market update presentation has not been reviewed or reported on by the Company's external auditors.
This communication may contain certain “Non-GAAP” financial measures. AngloGold Ashanti utilises certain Non-GAAP performance measures andratios in managing its business. Non-GAAP financial measures should be viewed in addition to, and not as an alternative for, the reported operatingresults or cash flow from operations or any other measures of performance prepared in accordance with IFRS. In addition, the presentation of thesemeasures may not be comparable to similarly titled measures other companies may use. AngloGold Ashanti posts information that is important toinvestors on the main page of its website at www.anglogoldashanti.com and under the “Investors” tab on the main page. This information is updatedregularly. Investors should visit this website to obtain important information about AngloGold Ashanti.
DISCLAIMER
2

POSITIONED TO CREATE VALUE THROUGH THE CYCLE
3
Decisive, deliberate action to create sustainable, long-term value through the cycle
Focus on people, safety and sustainability
Supporting our strategy for
sustainable cash flow
improvements and returns
Decisive action on operations; balance
sheet flexibility remains a priority
Consistent delivery; improving cost
management, focus on enhancing margins
Maintaining optionality to deliver
value-adding growth over the long term
Ongoing portfolio improvements
through investment and rationalisation
Towards zero harm, excellence in environmental stewardship, community development

2002 2003 2004 2005 2006 2007 2008 2009 2010 2011 2012 2013 2014 2015 2016 2017 2018YTD
0
5
10
15
20
25
30
35
40
45
All-Injury Frequency Rate (AIFR)per million hours
SAFETYLONG-TERM IMPROVEMENTS CONTINUE
4
• Q3 2018 AIFR of 4.17 – lowest in company history
• AIFR for 9-months improves 34% vs. same period in 2017, zero fatalities in Q3 2018
• Positive reporting and learning culture with respect to High Potential Incidents essential to mitigating high consequence events

46%
23%
17%
14%
Production split
*World Gold Council standard, excludes stockpiles written off
A BALANCED GLOBAL PORTFOLIOSTRONG OPERATING PERFORMANCE, IMPROVING FUNDAMENTALS
5
• Past 5 year performance: Productivity up 58%, AISC down 21%, Corporate and overhead down 71%• Full-year production expected at the top end of guidance, costs trending towards the lower end of the range• Restructuring of the South Africa region almost complete, delivering a more sustainable future for the region• Free cash flow outlook improving as AISC trends down and operation improve predictability• Key projects remain on track, improving the quality of the portfolio• Net debt/adjusted EBITDA ratio at an attractive 1.13 times• Key safety metrics continue to improve, achieving new records and stretching milestones
%
Q3 2018 South Africa
Production 120kozAISC $1,026/oz Q3 2018
AustraliaProduction 148koz
AISC $1,082/oz
Q3 2018 Continental Africa
Production 391kozAISC $834/oz
Q3 2018 Americas
Production 192kozAISC $817/oz

Q3 2018 PRODUCTION FROM RETAINED OPERATIONS STEADY PERFORMANCE Y-O-Y; SIGNIFICANT UPTICK EXPECTED IN Q4 2018
6
Q3 Productionkoz
South Africa117
South Africa120
Australia143
Australia148
Continental Africa380
Continental Africa391
Americas213
Americas192
Q3 2017 Q3 2018
853 851
Am
eric
as • Production impacted by lower grades and reduced volumes from AGA Mineração partly offset by higher feed grades and recoveries at Serra Grande
• Cerro Vanguardia steady y-o-y
Con
tinen
tal
Afr
ica
• Kibali boosted by higher underground tonnage treated and increase in overall grades
• Iduapriem sees increased grades, recoveries, and tonnages• Siguiri impacted by lower grades from mining different pits,
teething issues on Carbon-In-Leach commissioning; hard rock plant commissioning imminent
Aus
tral
ia • Solid quarter at Tropicana with increased head grade and mill throughput; second 6MW ball mill on track for commissioning by year-end
• Sunrise Dam impacted by 6% lower metallurgical recovery and lesser mill throughput with the commissioning of the new flotation-fine grind circuit
Sout
h A
fric
a• Strong performance by Mponeng mine, production improved
25% y-o-y• Surface Operations negatively impacted by volume
processed, grade and mainly recoveries (attributed to volume mined from base of reclaimed Tailings Storage Facility (TSF))

7
Q3 AISC* BY MINEYTD AISC* CURRENTLY AT THE MIDDLE OF THE GLOBAL COST CURVE**
Q3 IMPACTS TO OPERATING COSTS
Sunrise Dam: Shift in mining strategy, higher dilution and higher capex related to the REP and expansion of the tailings facility
Morila: Large stockpile drawdowns
Iduapriem: Improved operational performance offset by higher fuel and mining costs
South Africa: Restructuring plus higher grades at Mponeng
Brazil operations: Reflecting cost management initiatives and the favourable exchange rate
Geita: Higher mining, fuel, and royalty costs; increased stripping
Siguiri: Production from lower grade stockpiles as mine prepares for commissioning of new plant
Tropicana: Higher production and favourable inventory movements
Kibali: Seeing benefits from fully ramped underground production, despite higher royalties
*World Gold Council standard, excludes stockpiles written off**CIBC 2018 Research Estimates; global cost curve median $971/oz
Kibali
CVSA
Tropicana
Siguiri
Geita
Serra Grande
AGA Mineração
Mponeng
Iduapriem
Sadiola
SA Surface Ops
Morila
Sunrise Dam
AISC* by mine Q3 2018 vs. Q3 2017$/oz
Q3 2018 Q3 2017
Q3 2018 Group Avg. $920/oz
Q3 2017 Group Avg. $1,071/oz

CAPITAL PROJECT PIPELINE STOCKING MEDIUM TO LONG TERM
8
Kib
ali • Underground production fully ramped up
• Azambi hydropower plant commissioned in September 2018• Construction for the next phase of TSF on schedule for completion during
Q4 2018O
buas
i • First production on track for end 2019• Spending schedule, 15% in 2018/ 55% in 2019/ 30% in 2020• Major contracts awarded for: demolition of redundant plant, U/G mining• Decision to purchase own equipment fleet adds around $45m to project capex,
cuts operating costs $25/oz
Sigu
iri
• Combination Plant under construction to treat hard and soft ore• Trash screen and CIL tanks commissioned in August, enabling plant to process
transitional material• Construction of new mill is complete; power plant is at testing stage, nearing
completion
Mpo
neng • Aspects of the project delayed partially due to a fatality earlier in the year
• Construction of ore-handling infrastructure complete• ORD at 126 level encountered areas with high geological complexity, requiring
additional secondary support, slowing advance rates
2018-2020E AVGProduction: c.340koz¹
@ AISC $700/oz
2020-2022E AVG Production: c.350koz
@ AISC $800/oz
2018-2020E AVG Production: c.355koz
@ AISC $910/oz
2018-2020E AVGProduction: c268koz@AISC $1,105/oz
¹ Attributable² Obuasi’s first production in 2020 expected at rate of 150-200koz per annum
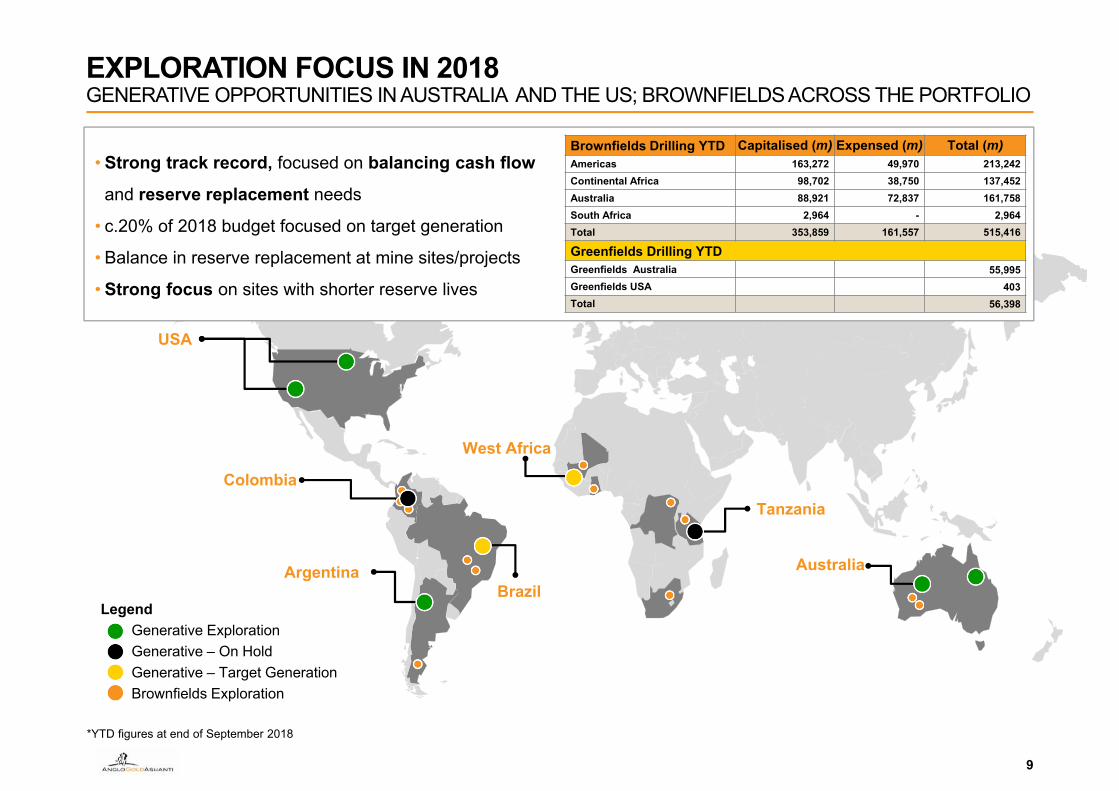
EXPLORATION FOCUS IN 2018GENERATIVE OPPORTUNITIES IN AUSTRALIA AND THE US; BROWNFIELDS ACROSS THE PORTFOLIO
9
LegendGenerative ExplorationGenerative – On HoldGenerative – Target GenerationBrownfields Exploration
Argentina
Colombia
AustraliaBrazil
Tanzania
USA
West Africa
• Strong track record, focused on balancing cash flow
and reserve replacement needs
• c.20% of 2018 budget focused on target generation
• Balance in reserve replacement at mine sites/projects
• Strong focus on sites with shorter reserve lives
Brownfields Drilling YTD Capitalised (m) Expensed (m) Total (m)Americas 163,272 49,970 213,242Continental Africa 98,702 38,750 137,452Australia 88,921 72,837 161,758South Africa 2,964 - 2,964Total 353,859 161,557 515,416
Greenfields Drilling YTDGreenfields Australia 55,995Greenfields USA 403Total 56,398
*YTD figures at end of September 2018

EXPLORATION – FOCUSED AND EFFICIENT
10
• Efficiency improved significantly
• Drilling meters up 63%
• Unit costs down 28%
• Strategic use of portfolio holdings and earn-ins to supplement in-house capacity
Note: Peer group includes Newmont, Barrick, Goldcorp, Kinross, NewcrestSource: Company reports
0
100,000
200,000
300,000
400,000
500,000
600,000
700,000
0
50
100
150
200
250
300
2014 2015 2016 2017 2018E
Cos
ts $
Exploration drilling – costs vs. metres
Costs Drilled metres

EXPLORATION GROWTH PIPELINE
11
Transforming geological targets to gold production
Early-stage exploration Mid-stage exploration Late-stage exploration
Create Value Crystallise Value
Reserve conversion/Pre-feasibility study
Resource delineation/ Conceptual studies Drill testing
Drill target definition
Target identification
Project generation
REGIONAL GREENFIELDS AND MINE SITE EXPLORATION PIPELINES
Brazil Target GenBrazil Target Gen Palmeiras Sul (MSG)Palmeiras Sul (MSG) Cuiaba Ore ExtensionCuiaba Ore Extension
CdS I Ore ExtensionCdS I Ore ExtensionCdS IIICdS IIIArgentina Target GenArgentina Target Gen
NE QueenslandNE Queensland Butcher Well (WA)Butcher Well (WA)Laverton District Targets (WA)Laverton District Targets (WA)
Boston Shaker UG (TJV)Boston Shaker UG (TJV)
Aust. Target GenAust. Target Gen
W. Africa Target GenW. Africa Target Gen Siguiri Block 2Siguiri Block 2Selous (Geita)Selous (Geita)Geita Lease AreaGeita Lease Area
Iduapriem Lease AreaIduapriem Lease Area
MinnesotaMinnesota
Silicon (NV)Silicon (NV)
N. Amer. Target GenN. Amer. Target Gen
Rhyolite (NV)Rhyolite (NV)
Australia
North America
SouthAmerica
Africa

BALANCE SHEET FLEXIBILITYSIGNED A NEW 5-YEAR REVOLVING CREDIT FACILITY END OCTOBER 2018
12
Strong liquidity, no near-dated maturities, ample covenant headroom
Undrawn facilities* at 30 September 2018
A$310mAUD RCF
R4.983bnZAR Facilities
US$1,092mUSD RCFs
US$336mCash
c.$2bn
Net Debt $/m
1000
2000
3000
4000
2012 2013 2014 2015 2016 2017 2018 YTD
-44%
Self-funded development of Tropicana, Kibali
Last-12-months Net debt to adjusted EBITDA ratio
0
1
2
3
2013 2014 2015 2016 2017 2018 YTD
1.13X
Covenant 3.5X
Net Debt to Adjusted EBITDA
*Total calculated with ZAR facility at R14.1398/$ (excluding DMTNP), and AUD facility at 0.7228$ to A$

ON TRACK TO MEET FULL YEAR GUIDANCE
13
2018 FY Guidance CommentaryGold production (000 oz) 3,325 – 3,450 Full-year production expected at the top end of guidance
All-in sustaining costs* ($/oz) 990 – 1,060 Costs for the year trending toward the bottom end of guidance. Operational Excellence programme gaining tractionTotal cash costs ($/oz) 770 – 830
Corporate costs ($m) 70 – 80
Expensed expl./study costs ($m) 115 – 125 Including equity-accounted joint ventures
Total capex ($m) 770 – 860 Previously $800m-$920m. Reduction due to the downward revision of non-sustaining capital expenditure
Sustaining capex ($m) 600 – 670
Non-sustaining capex ($m) 170 – 190 Previously $200m-$250m. Reduction relates mainly to the shift of some Obuasi related expenditure into 2019
*World Gold Council standard, excludes stockpiles written off
SENSITIVITIES(based on $1,250/oz gold price and the same assumptions used for guidance)
AISC ($/oz)
Cash from operating activities before taxes for remaining
3 months of 2018 ($m)10% change in the oil price 5 4
10% change in local currency 62 46
5% change in the gold price 2 55
20koz change in production 7 24
Currency and commodity assumptions
$/R exchange rate 13.17$/A$ exchange rate 0.75$/BRL exchange rate 3.67$/ARS exchange rate 29.09Oil ($/bbl) 74
Both production and cost estimates assume neither operational, labour interruptions or power disruptions, nor further changes to asset portfolio and/or operating mines and have not been reviewed by our external auditors. Other unknown or unpredictable factors could also have material adverse effects on our future results and no assurance can be given that any expectations expressed by AngloGold Ashanti will prove to have been correct. Please refer to the Risk Factors section in AngloGold Ashanti’s annual report on Form 20-F for the year ended 31 December 2017, filed with the United States Securities and Exchange Commission (SEC).
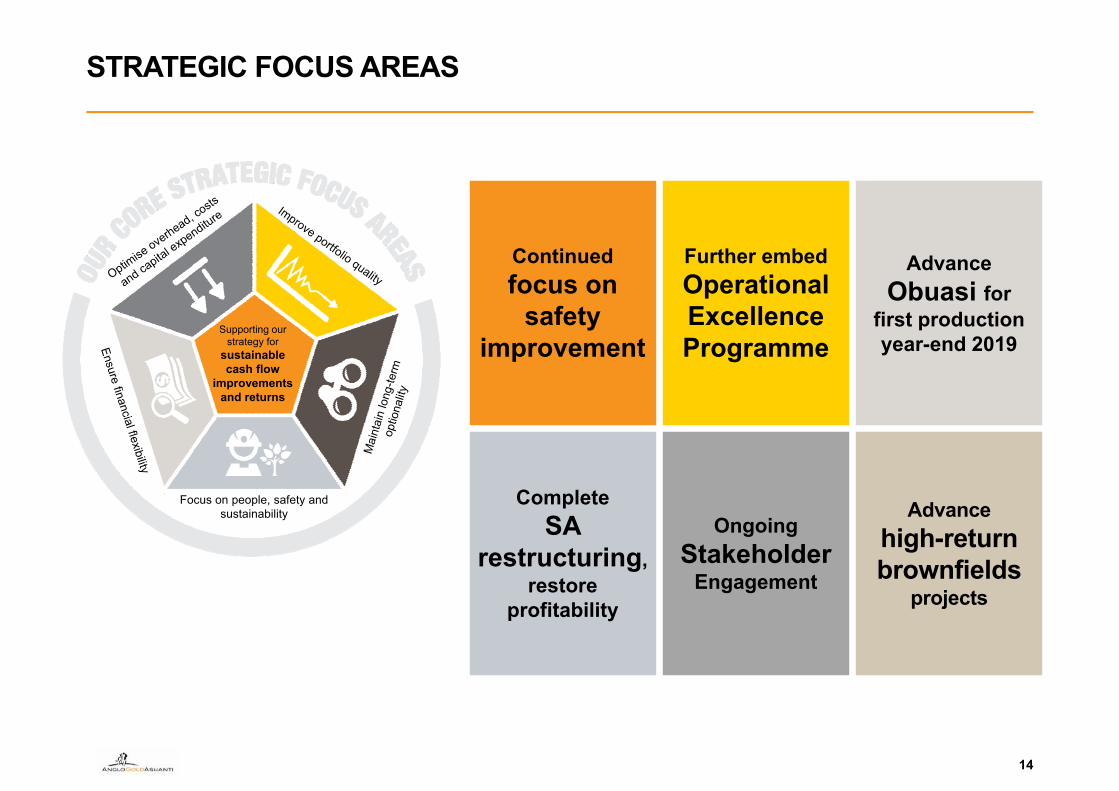
STRATEGIC FOCUS AREAS
14
Focus on people, safety and sustainability
Supporting our strategy for
sustainable cash flow
improvements and returns
Continued focus on
safety improvement
Further embed Operational Excellence Programme
Advance Obuasi for
first production year-end 2019
Complete SA
restructuring, restore
profitability
Ongoing Stakeholder
Engagement
Advance high-return brownfields
projects


Q3 COMPARISON OF KEY METRICS
16
*World Gold Council standard, excludes stockpiles written off
Q3 2018 Q3 2017Excluding closed
& sold ops
Q3 2018 vs.
Q3 2017
Production from operations (kozs) 851 853 0%
Gold price received ($/oz) 1,202 1,270 -5%
Total cash costs ($/oz) 722 743 -3%
Corporate & marketing costs ($m) 18 17 6%
Exploration & evaluation costs ($m) 25 29 -14%
All-in sustaining costs* ($/oz) 920 1,031 -11%
All-in costs* ($/oz) 1,002 1,113 -10%
Adjusted EBITDA ($m) 355 394 -10%
Cash inflow from operating activities ($m) 214 327 -35%
Cash inflow from operating activities less capital expenditure from subsidiary entities ($m) 64 122 -48%
Free cash inflow ($m) 34 82 -59%
Capital expenditure ($m) 163 239 -32%
Free cash inflow excl. SAR redundancies ($m) 43 89 -52%

Q3 COST PERFORMANCE
17
807
722
36 2 4 5
-64
-57 -11
Q3 2017 Inflation Volume & grade Royalties By products Closed & soldops
Exchange Efficiency & other Q3 2018
Total cash cost Q3 2018 vs. prior year Q3$/oz
1,071
920
1 4 5
-85 -15 -6
-55
Q3 2017 Retrenchmentcost
Corporate cost Other Cash cost Rehab & othernon-cash cost
Exploration cost Sustaining capex Q3 2018
All-in sustaining cost Q3 2018 sold vs. prior year Q3Excluding stockpile NRV and other adjustments$/oz

CORPORATE UPDATE – SOUTH AFRICA
18
Reached a three-year wage agreement:• Provides certainty, stability• Agreed with all SA unions• New shift arrangements at Mponeng;
additional face time, greater efficiency
Restructuring largely complete matching on-and off-mine cost structures to ensure appropriate fit for our smaller SA production base
Mitigated forced job losses, initially anticipated at 2,000, through:
• sale of the non-core assets, including healthcare facilities, laboratories and rail networks
• Voluntary separation packages
Tough decisions taken to restructure operations for long-term sustainability of the SA business


