33
Investor Presentation November 2018

Investor PresentationNovember 2018

2
FORWARD LOOKING STATEMENTS
Certain statements contained in this document constitute forward-looking information within the meaning of securities laws. Forward-looking information may relate toChoice Properties REIT’s (the “Trust”) future outlook and anticipated events or results and may include statements regarding the financial position, business strategy,budgets, litigation, projected costs, capital expenditures, financial results, taxes, plans and objectives of or involving the Trust. Particularly, statements regardingfuture results, performance, achievements, prospects or opportunities for the Trust or the real estate industry are forward-looking statements. In some cases,forward-looking information can be identified by such terms such as ‘‘may’’, ‘‘might’’, ‘‘will’’, ‘‘could’’, ‘‘should’’, ‘‘would’’, ‘‘occur’’, ‘‘expect’’, ‘‘plan’’, ‘‘anticipate’’,‘‘believe’’, ‘‘intend’’, ‘‘estimate’’, ‘‘predict’’, ‘‘potential’’, ‘‘continue’’, ‘‘likely’’, ‘‘schedule’’, or the negative thereof or other similar expressions concerning matters that arenot historical facts. The Trust has based these forward-looking statements on factors and assumptions about future events and financial trends that it believes mayaffect its financial condition, results of operations, business strategy and financial needs, including that the Canadian economy will remain stable over the next 12months, that inflation will remain relatively low, that interest rates will remain stable, that tax laws remain unchanged, that conditions within the real estate market,including competition for acquisitions, will be consistent with the current climate, that the Canadian capital markets will provide the Trust with access to equity and/ordebt at reasonable rates when required and that Loblaw will continue its involvement with the Trust. Although the forward-looking statements contained in thisdocument are based upon assumptions that management of the Trust believes are reasonable based on information currently available to management, there canbe no assurance that actual results will be consistent with these forward-looking statements. Forward-looking statements necessarily involve known and unknownrisks and uncertainties, many of which are beyond the Trust’s control, that may cause the Trust’s or the industry’s actual results, performance, achievements,prospects and opportunities in future periods to differ materially from those expressed or implied by such forward-looking statements. These risks and uncertaintiesinclude, among other things, the factors discussed under ‘‘Enterprise Risks and Risk Management’’ section of the Trust’s Report to Unitholders. The forward-lookingstatements made in this presentation relate only to events or information as of the date on which the statements are made in this document. Except as required bylaw, the Trust undertakes no obligation to update or revise publicly any forward-looking statements, whether as a result of new information, future events orotherwise, after the date on which the statements are made or to reflect the occurrence of unanticipated events.
These forward-looking statements are made as of November 7, 2018 and Choice Properties REIT assumes no obligation to update or revise them to reflect newevents or circumstances, except as required by law.

A PREMIER DIVERSIFIED REIT
Choice Properties is an owner, manager and developer of a
high-quality real estate portfolio
3

4
PORTFOLIO
751properties
~67 Msquare feet
of GLA
$15.9 B in Assets
(1) As at September 30, 2018.(2) Based on proportionate share.
(1)(1)
(1),(2)

BUSINESS MODEL
Our primary business goal is to carefully accumulate and aggressively manage a diversified portfolio of high-quality real estate assets and to deliver the benefits of real estate ownership to our unitholders
5

Size, Scale and Reach Canada’s premier REIT comprising of 751 properties spanning ~67M sq. ft.
National footprint concentrated in Canada’s largest markets
Portfolio Stability and Reliability
Portfolio focused on necessity-based retail, and high-quality industrial and office assets
Strategic relationship with Loblaw
Development Potential Backed by a Robust Operating Platform
Established operating platform with a proven track record of success
Transformational development pipeline providing long-term value creation and growth
Well-Positioned Portfolio Supported by Prudent Capital
Structure
Diversified portfolio withoccupancy and staggered lease maturities that support debt service
Financial strength, solid balance sheet and investment grade creditrating (“BBB”)
6
KEY INVESTMENT HIGHLIGHTS

A diversified portfolio with a national footprint concentrated in Canada’s largest markets.
Offering stability throughlong-term leases and a strategic relationship with Loblaw – Canada’s largest retailer.
7
OUR PORTFOLIO
Number of Properties
Square Footage
(M)
Retail 595 46.6
Industrial 112 16.3
Office 18 3.7
Residential 3 0.2
INCOME PRODUCING 728 ~67
Developments 23
TOTAL 751
*As at September 30, 2018.

(1) Base rent for the three months ended September 30, 2018, including straight-line rent.(2) Based on the definitions of Census Metropolitan Area (CMA), from statistics Canada published 2016;
Large Urban: CMA with Population above 500,000; Medium Urban: CMA with Population 100,000 - 499,999; Small Urban: Other areas with population below 99,999.
~72%of base rent from large and medium urban areas
~49% from VECTOM
~77% of base rent in small urban markets is from Loblaw via long-term leases
8
WELL-LOCATED PROPERTIES CONCENTRATED IN ATTRACTIVE MARKETS
Base Rent by Urban Markets(1)(2)
Other LargeCMAs8.1%
Ottawa CMA1.8%
Edmonton CMA6.4%
Montreal CMA6.8%
Vancouver CMA6.9%
Calgary CMA11.1%
Toronto CMA16.3%
Large Urban 57.4%
SmallUrban 27.9%
MediumUrban 14.7%
LoblawSmall Urban
21.4%
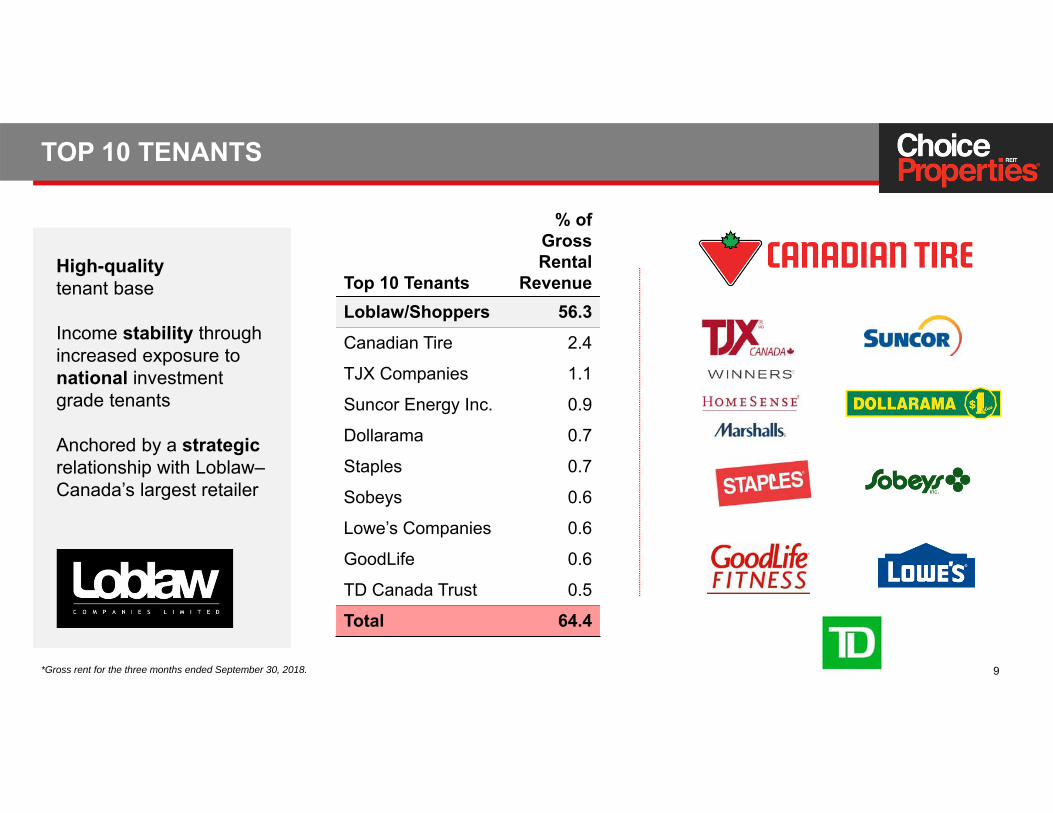
High-quality tenant base
Income stability through increased exposure to national investment grade tenants
Anchored by a strategicrelationship with Loblaw–Canada’s largest retailer
9
TOP 10 TENANTS
Top 10 Tenants
% of Gross Rental
RevenueLoblaw/Shoppers 56.3Canadian Tire 2.4
TJX Companies 1.1
Suncor Energy Inc. 0.9
Dollarama 0.7
Staples 0.7
Sobeys 0.6
Lowe’s Companies 0.6
GoodLife 0.6
TD Canada Trust 0.5
Total 64.4
*Gross rent for the three months ended September 30, 2018.
10
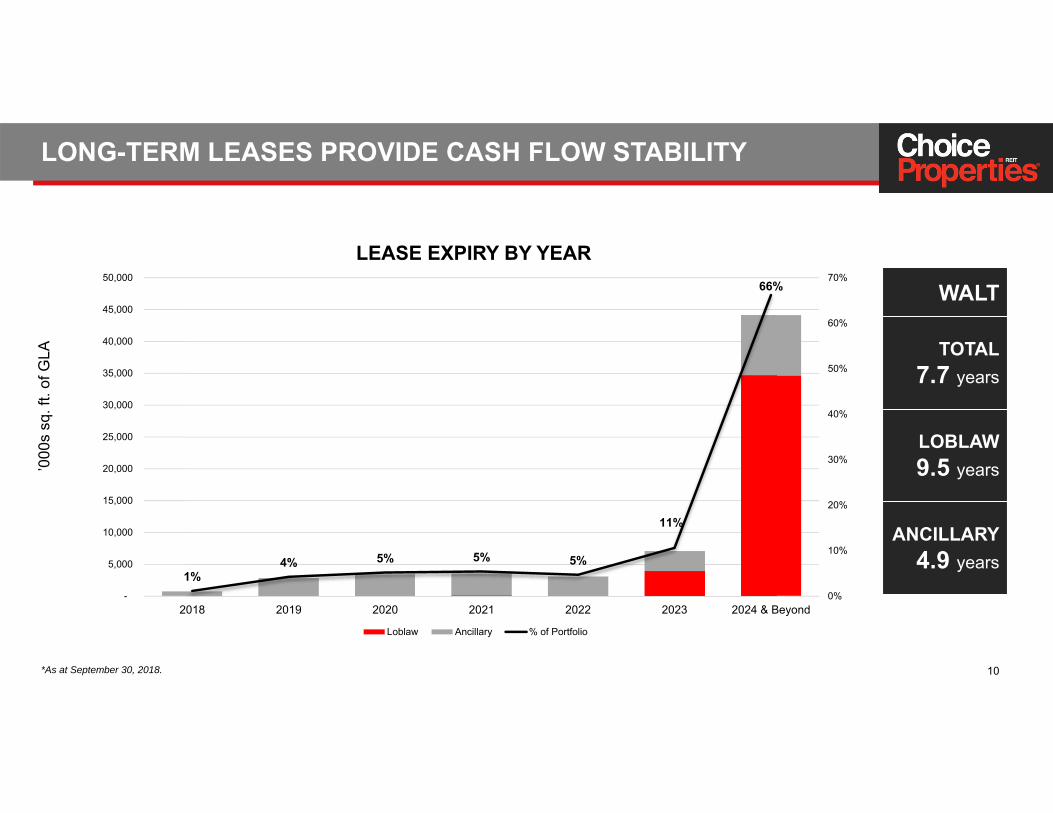
LONG-TERM LEASES PROVIDE CASH FLOW STABILITY
WALT
TOTAL7.7 years
LOBLAW9.5 years
ANCILLARY4.9 years
*As at September 30, 2018.
’000
s sq
. ft.
of G
LA
1%4% 5% 5% 5%
11%
66%
0%
10%
20%
30%
40%
50%
60%
70%
-
5,000
10,000
15,000
20,000
25,000
30,000
35,000
40,000
45,000
50,000
2018 2019 2020 2021 2022 2023 2024 & Beyond
LEASE EXPIRY BY YEAR
Loblaw Ancillary % of Portfolio
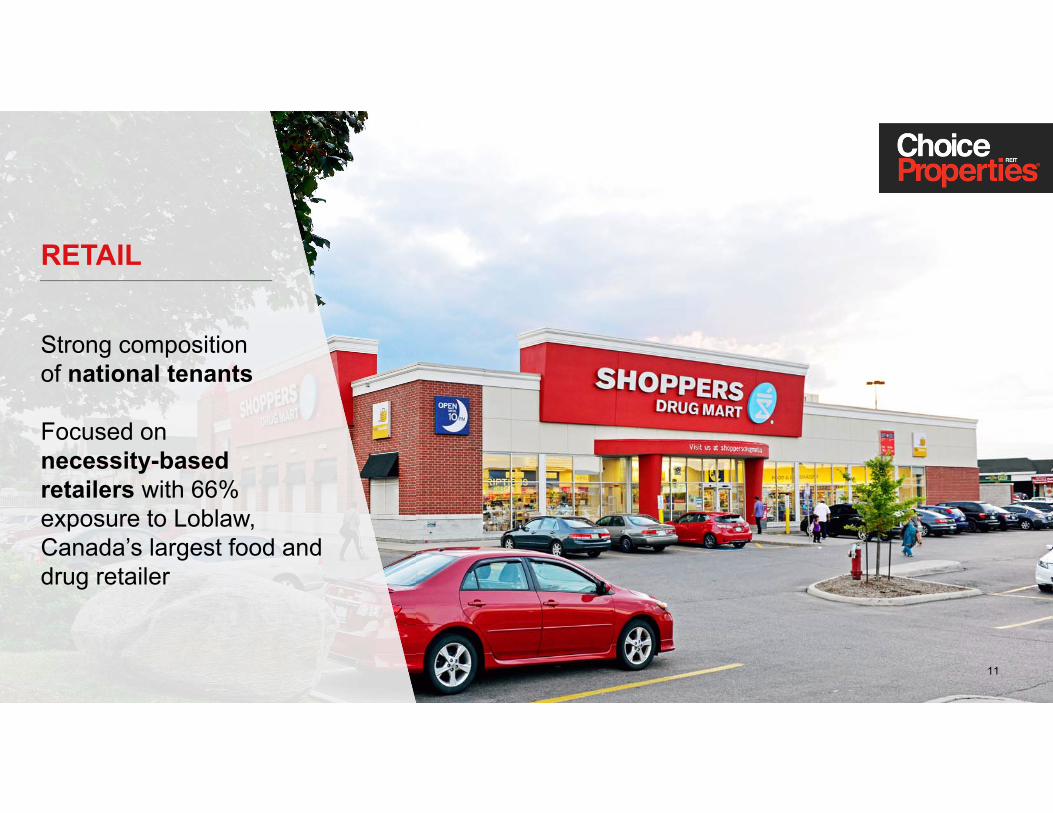
RETAIL
Strong composition of national tenants
Focused on necessity-based retailers with 66% exposure to Loblaw, Canada’s largest food and drug retailer
11

Grocery stores Pharmacies Financial services Liquor stores
12
RETAIL PORTFOLIO FOCUSED ON NECESSITY BASED TENANTS
11%
OTHER NECESSITY BASED RETAIL
E-COMMERCE RESILIENT
Restaurants / cafes Fitness centres Personal services
11%
8%
Loblaw66%
*As at September 30, 2018. Based on gross rental revenue.

Edmonton, AB
GLA(1): 540K sq. feet
Ownership: 50%
13
RETAIL PROPERTIES
Dartmouth, NS
GLA(1): 970K sq. feet
Ownership: 75%
Boucherville, QC
GLA(1): 530K sq. feet
Ownership: 75%
Mississauga, ON
GLA(1): 320K sq. feet
Ownership: 100%
CARREFOUR DE LA RIVE SUD ERIN MILLS POWER CENTRE SOUTH EDMONTON COMMONDARTMOUTH CROSSING
(1) GLA excludes shadow anchors.

INDUSTRIAL
High quality and generic product
Critical Mass in target markets
Readily accommodates a broad range of tenants
14

15
INDUSTRIAL PROPERTIES
CREIT DISTRIBUTION PARK | Calgary, AB | 885K sq. ft.
410 BUSINESS CENTRE | Brampton, ON | 300K sq. ft.
3333 JAMES SNOW PKWY | Milton, ON | 635K sq. ft.
2755 190th STREET | Surrey, BC | 407K sq. ft.

OFFICE
Large office buildings in target cities
Well-located office properties in the
downtown core of some of Canada’s largest cities
16

Montreal, QCGLA: 330K sq. ft.Ownership: 100%Major Tenants: Jarislowsky Fraser McGill University Canadian Bank
17
OFFICE PROPERTIES
Toronto, ON
GLA: 200K sq. ft.
Ownership: 100%Major Tenants: Hospital for Sick Kids Cancer Care Ontario
Toronto, ONGLA: 600K sq. ft.Ownership: 50%Major Tenants: Klick Leo Burnett Towers Watson NORR Limited
Calgary, ABGLA: 580K sq. ft.Ownership: 50%Major Tenants: Alta Gas Ltd. A.E.S.O. MNP
175 BLOOR ST EAST CALGARY PLACE 1010 SHERBROOKE PLACE525 UNIVERSITY

TRANSFORMATIONAL DEVELOPMENT
Development pipeline provides long-term growth and value creation
18

1.9M sq. ft.
$305M invested
$474M total investment
3.4M sq. ft.
$478M invested
$1.2B total investment
78 PROJECTS
0.8M sq. ft.
$67M invested
$386M total investment
0.6M sq. ft.
$76M invested
$255M total investment
0.1M sq. ft.
$30M invested
$60M total investment
REDEVELOPMENT
19
DEVELOPMENT PIPELINE
GREENFIELD INTENSIFICATION TOTAL
45 PROJECTS 4 PROJECTS (2) 7 PROJECTS22 PROJECTS
(1) As at September 30, 2018. Excludes planned future developments. (2) Includes 3 major mixed use development projects currently in the pre-development phase for which the total investment and density is to be determined.
RESIDENTIAL

0.2M sq. ft.
$44M invested
$85M total investment
2.1M sq. ft.
$261M invested
$717M total investment
45 PROJECTS
0.8M sq. ft.
$67M invested
$386M total investment
0.4M sq. ft.
$74M invested
$161M total investment
0.7M sq. ft.
$76M invested
$85M total investment
INDUSTRIAL-GREENFIELD
20
ACTIVE DEVELOPMENT
RETAIL-GREENFIELD
RETAIL-INTENSIFICATIONS & REDEVELOPMENT TOTAL
28 PROJECTS 2 PROJECTS 7 PROJECTS8 PROJECTS
*As at September 30, 2018. Excludes planned future developments.
RESIDENTIAL

21
RETAIL DEVELOPMENT
210K sq. ft.
Anchored by Sobeys and Shoppers Drug Mart
Canada’s best community 2015
Partner: Hopewell Development
MAHOGANY VILLAGE MARKET | Calgary, AB

22
RETAIL DEVELOPMENT
243K sq. ft.
Anchored by Real Canadian Superstore
2332 160 ST | Surrey, BC

23
RETAIL INTENSIFICATION
92K sq. ft.
Expected completion date: 2018
Leasing: 97% committed
Anchored by Loblaws
16900 TRANSCANADA HWY | Montreal, QC
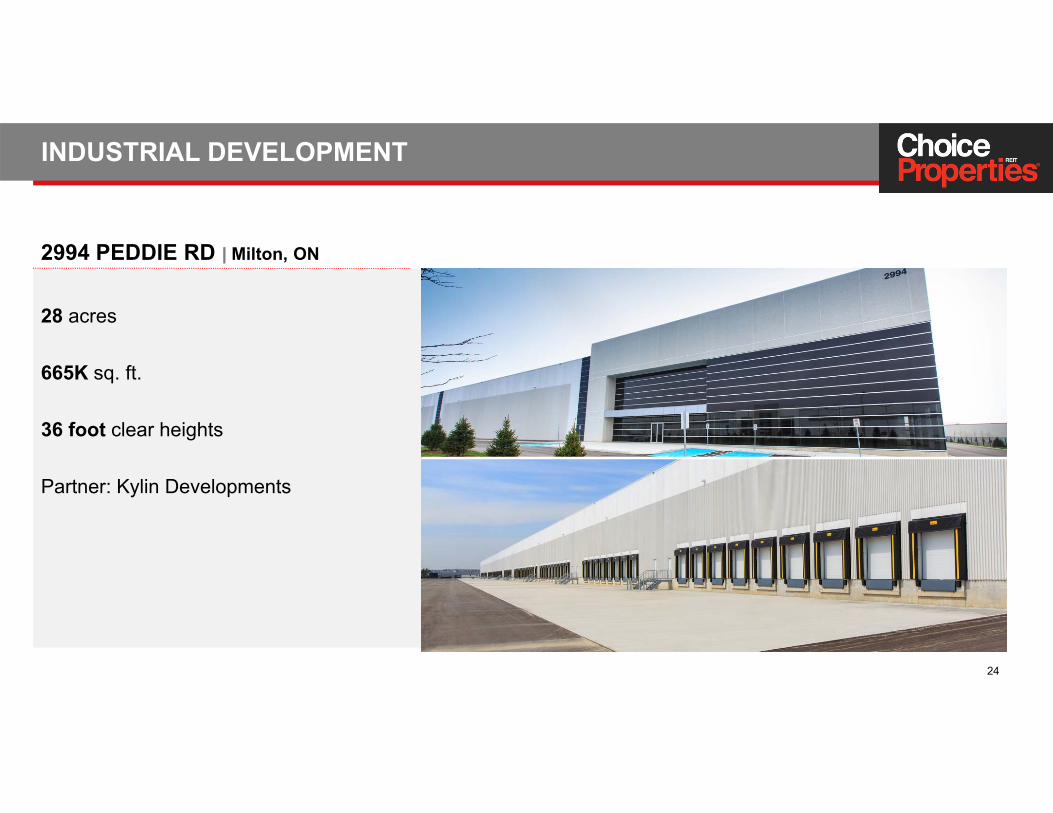
28 acres
665K sq. ft.
36 foot clear heights
Partner: Kylin Developments
24
INDUSTRIAL DEVELOPMENT
2994 PEDDIE RD | Milton, ON

350 units / 3 buildings
330K sq. ft. GLA
Land acquired in Q3 2017
Partner: Woodbourne Canada &CentreCourt Developments
25
RESIDENTIAL DEVELOPMENT
390 DUFFERIN ST | Toronto, ON
WALK SCORE: 97TRANSIT SCORE: 100BIKE SCORE: 53

421 units
275K sq. ft. GLA
Construction Commencement: Q1 2019
Partner: Woodbourne Canada &CentreCourt Developments
26
RESIDENTIAL DEVELOPMENT
39 EAST LIBERTY ST | Toronto, ON
WALK SCORE: 92TRANSIT SCORE: 100BIKE SCORE: 74
27
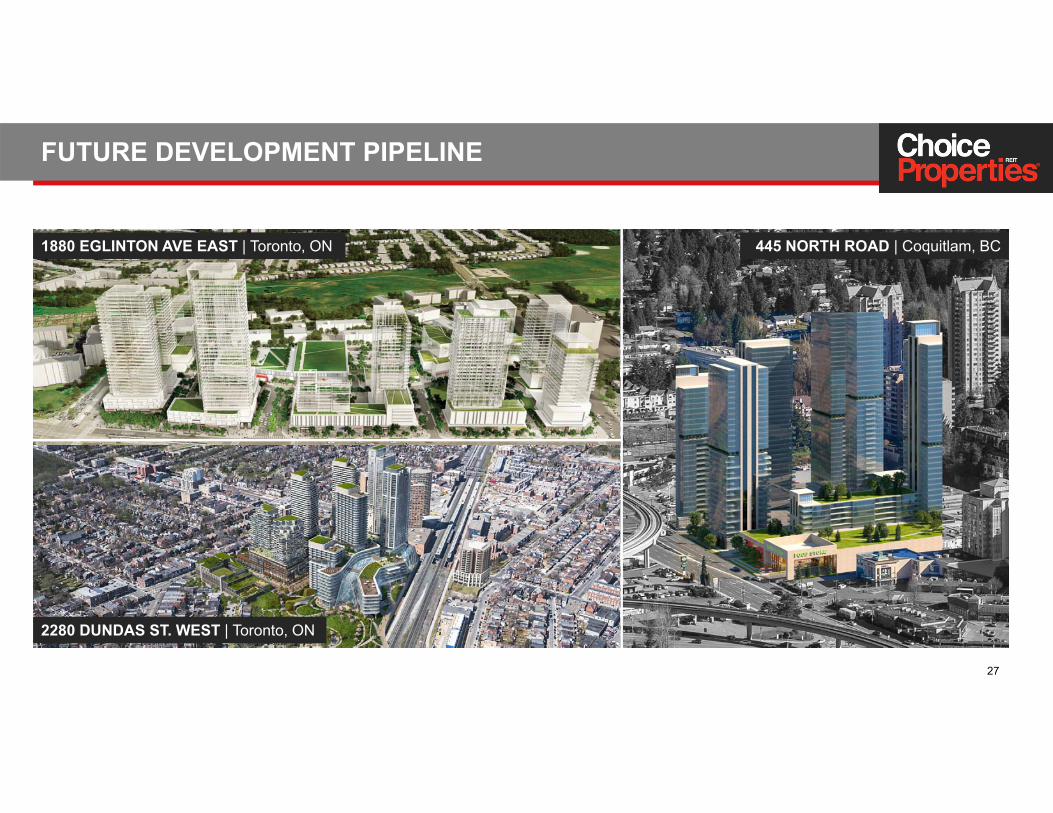
FUTURE DEVELOPMENT PIPELINE
1880 EGLINTON AVE EAST | Toronto, ON
2280 DUNDAS ST. WEST | Toronto, ON
445 NORTH ROAD | Coquitlam, BC

FINANCIAL MANAGEMENT
Choice Properties’ foundation is built upon
maintaining a strong balance sheet, financial flexibility, and
prudent and disciplinedfinancial management
28
$14$138 $172 $104 $126 $85 $137 $138 $77 $38 $40 -
$207-
$300
$550$550
$600$575
$750$550
-
$750
- -
$100
$175
$625
-
0%
6%
11%10%
13%
19%
13%
10%
1% 1%
12%
-
5%
$1,500
-
$200
$400
$600
$800
$1,000
$1,200
$1,400
$1,600
RevolverCapacity
2018 2019 2020 2021 2022 2023 2024 2025 2026 2027 2028 2029 Thereafter
Deb
t Mat
urin
g ($
M)
Mortgages and Construction Loans Current Unsecured Debentures Term Loan Facility % of Debt
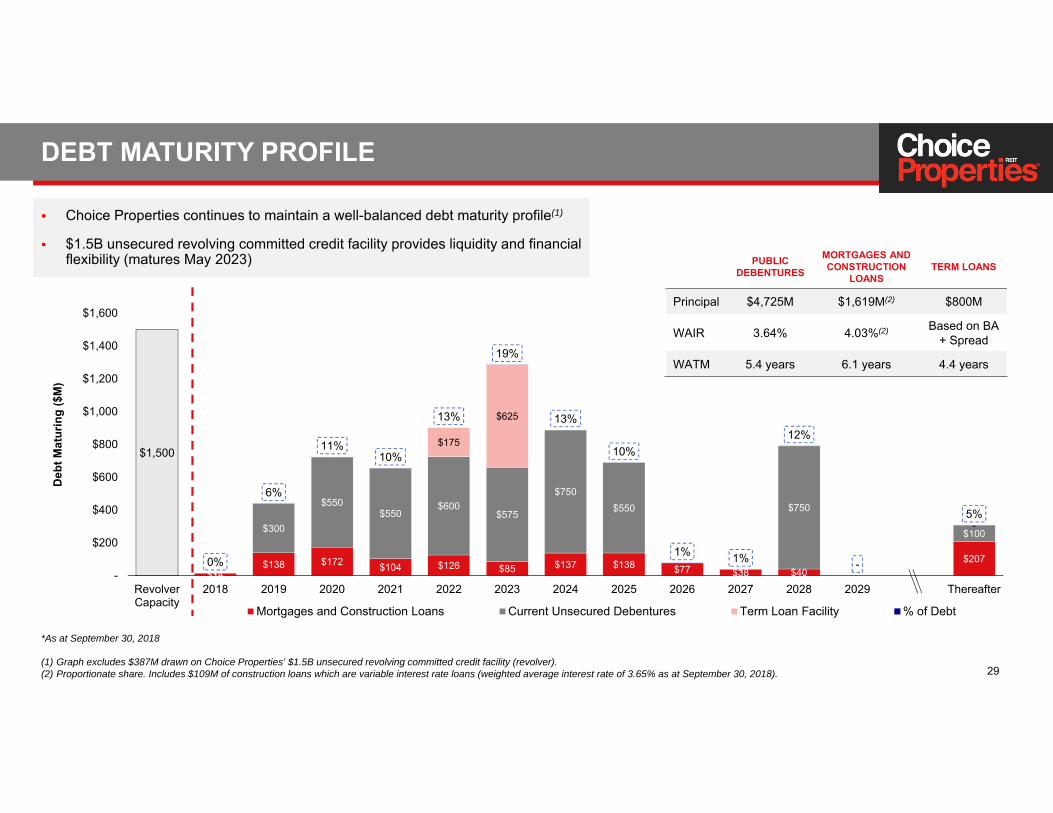
Choice Properties continues to maintain a well-balanced debt maturity profile(1)
$1.5B unsecured revolving committed credit facility provides liquidity and financial flexibility (matures May 2023)
29
DEBT MATURITY PROFILE
*As at September 30, 2018
(1) Graph excludes $387M drawn on Choice Properties’ $1.5B unsecured revolving committed credit facility (revolver).(2) Proportionate share. Includes $109M of construction loans which are variable interest rate loans (weighted average interest rate of 3.65% as at September 30, 2018).
PUBLIC DEBENTURES
MORTGAGES AND CONSTRUCTION
LOANSTERM LOANS
Principal $4,725M $1,619M(2) $800M
WAIR 3.64% 4.03%(2) Based on BA + Spread
WATM 5.4 years 6.1 years 4.4 years

Choice Properties(1) Average REIT/REOCs(2)
BBB (Mid) BBB (High) COMPARISONKey Credit Metrics
Coverage RatiosEBITDA to Interest 3.6x 3.3xDebt Service Coverage 3.1x 2.5x
Leverage RatiosDebt to Total Assets 47% 45% >Debt to EBITDA 8.0x (3) 9.0xSecured Debt to Total Debt 21% 35%
30
SOLID DEBT METRICS
(1) As at September 30, 2018. Ratios exclude one-time non-recurring items.(2) Source: DBRS. Average of H&R, RioCan, First Capital and CT REIT.(3) Normalized EBITDA assuming the CREIT acquisition closed at the beginning of the trailing 12-month period.

Stable, defensive portfolio diversified by asset class and geography and anchored by long term leases with Canada’s largest retailer
Fully integrated management platform with national operating and leasing expertise and in-house development capabilities
Strategic relationship with Loblaw that provides secure and growing cash flows and a dedicated source of acquisition opportunities
Financial stability with BBB credit rating, staggered debt maturities, strong liquidity position and a large pool of unencumbered assets
Well-positioned to navigate the changing retail landscape with a focus on necessity based retail and an established industrial platform
Well-positioned to capitalize on urban mixed-use development opportunities and increase exposure to newly built multi-residential rental properties
Alignment with major shareholder on a long term approach to value creation
31
OUTLOOK – CURRENT POSITION

Organizational integration
Portfolio optimization; explore opportunities for net operating income growth
Portfolio composition; assess existing portfolio and growth/rationalization opportunities
Evaluate existing development pipeline and potential opportunities for intensification and greenfield development
Satisfy Loblaw/Shoppers Drug Mart tenant needs and potential acquisition opportunities
Assess strategies to further strengthen our balance sheet and improve our payout ratio
32
OUTLOOK – NEAR TERM PRIORITIES


