December 25, 2021 1 Statistical Models of Human Response Times For Task Modeling in HCI by Maria Vicente Bonto-Kane North Carolina State University North Carolina State University September 14, 2009 http://www.marivicbontokane.com/research/mbontokaneDefense2009.ppt Robert St. Amant (Adviser)
Transcript
April 21, 2023 1
Statistical Models of Human Response Times
For Task Modeling in HCIby
Maria Vicente Bonto-Kane
North Carolina State UniversityNorth Carolina State University
Usability (Definition)“Usability refers to the efficiency, comfort, safety, and satisfaction with which a wide range of people and under a variety of conditions perform their tasks with a product (i.e., a good or a service). It is much more than a measure of how easily a thing can be used… it encompasses all aspects of the product and its use, including the hardware and software interfaces, the documentation, the packaging and the services associated with the product.” -- Linux Information Project
Markers for Usability (Shneiderman, 1987) Efficiency Learnability Memorability Errors Satisfaction
April 21, 2023 4
Usability“Usability is the extent to which a product can be used by specified users to achieve specified goals with effectiveness, efficiency, and satisfaction, in a specified context of use.” --ISO 9241-11: Guidance on Usability (1998)
Design standards written for 3 main categories:Product usage characteristics
ISO 9241-11(1998) Guidance on UsabilityISO/IEC DTR 9126-4 (2001)
Detailed description of tasks (blueprint) Hierarchical layout of tasks and subtasks
Live User Testing Users perform tasks on software application Often done in a laboratory environment Observations and evaluation done by skilled professionals
Task Modeling Approaches GOMS Modeling Techniques Fitts’s Law Predictions Give estimates for task difficulty and task duration
April 21, 2023 6
Task Analysis
1.1.9.1Facilitate plate labeling and reading
1.1.9.2Facilitate sample plate preparation (serial dilution test compounds)
1.1.9.3Facilitate test plate preparation
1.1.9.4Facilitate test plate incubation
1.1.9.5Facilitate raw data collection
1.1.9Develop program for assay method using HTS line control software (e.g., Beckman-Coulter SAMI)
Determine functions of device to be used during assay.
identify stock solution (deep-well) plates to be used as resources, sample plates to be used as transports, and tip types and other resources.
Integrate bar coder and reader into method.
Integrate pipeting device into HTS line control (SAMI) method – Link pipetting device to other devices to be used in automated process (e.g., Bioworks).
Source: Entzian, K. and Kaber, D (2004). “Goal Directed Task Analysis of High Throughput Molecular Compound Screening”
April 21, 2023 7
Live User Testing
Observations1. Did user accomplish the task? How long did it take?2. What types of errors were made?3. Did the user express any questions, suggestions while doing the
task?4. Did user recognize the icons for their functions?5. Was the Help documentation useful?
April 21, 2023 8
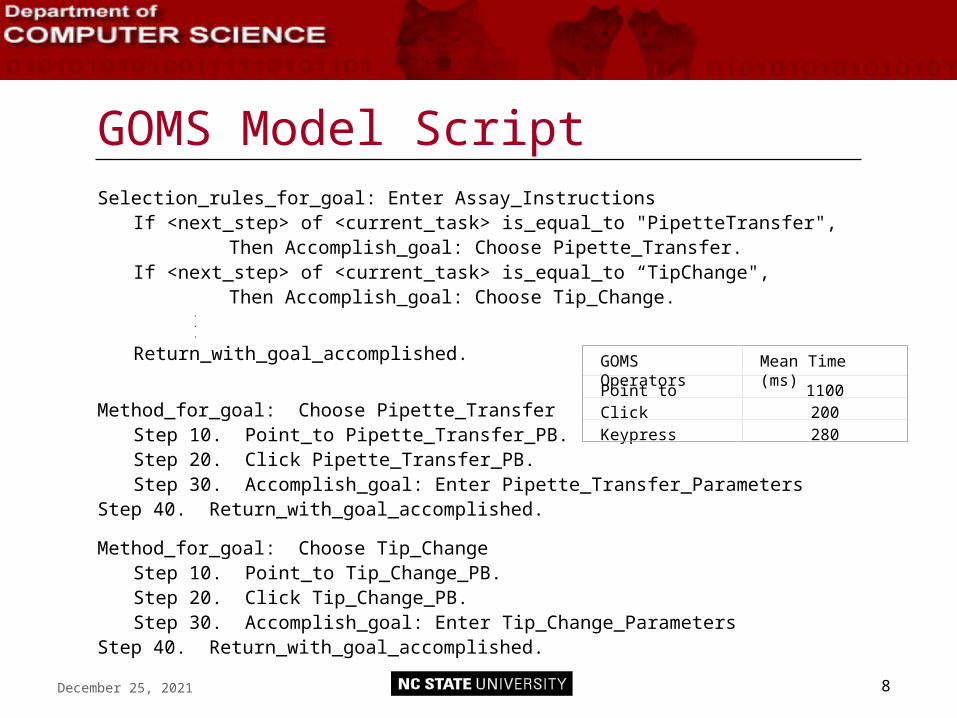
GOMS Model ScriptSelection_rules_for_goal: Enter Assay_Instructions
If <next_step> of <current_task> is_equal_to "PipetteTransfer", Then Accomplish_goal: Choose Pipette_Transfer.
If <next_step> of <current_task> is_equal_to “TipChange", Then Accomplish_goal: Choose Tip_Change.
Limitations of GOMS Approaches Use of point estimates
Not an exact measure But GOMS estimates useful for making decisions
No statistical foundation for its metrics Range? Mean? Standard Deviation? What is the statistical/probability distribution?
Assumes independence of operators A keypress is a keypress regardless of task context Priming? Interference ? in sequences of operators?
Goals and Methods equally probable All goals equally probable All methods equally probable
April 21, 2023 10
Research Goals Initial research goal:
Consider usage patterns for device Design of interface optimized around most probable
patterns of use Current research goals:
Examine characteristics in the execution of task operators
Derive a statistical model distribution of response time (RT) data for some task operators
Examine GOMS assumption of independence among task operators
Provide novel directions for task modeling using statistical modeling of RT data (distributional analysis)
April 21, 2023 11/32
Life Sciences ApplicationHigh Throughput Screening (HTS) environment
April 21, 2023 12/32
Usage Patterns
Published assay procedures from Promega® website
April 21, 2023 13
Usage Patterns
Reset Cursor
Mix
Pipette Transfer
Aspirate
Bulk Dispense
Serial Transfer
Purge Tool
Wash Button
HighDensity Replicate
Next Labware
Plate Read
Set Shelf
End Loop
User Function
Insert BioScript
Clear Marks
Comment
Shift Stack
System Pause
Tip Change
Reset Tip
Pause Labware
Send to Device
Device Control
Begin Loop
Wait for Device
Gripper Move
April 21, 2023 14
Measure of Task Difficulty
W
DbaMT
2log2
Fitts’s LawWhere,
D = Displacement from source to targetW = Width of target areaa and b are constants representing intercept and slope respectivelya = 50msec b = 300msec (one user and mouse) (Raskin, 2000 “The Humane Interface”)
April 21, 2023 15/32
Measure Task Difficulty -- Empirically
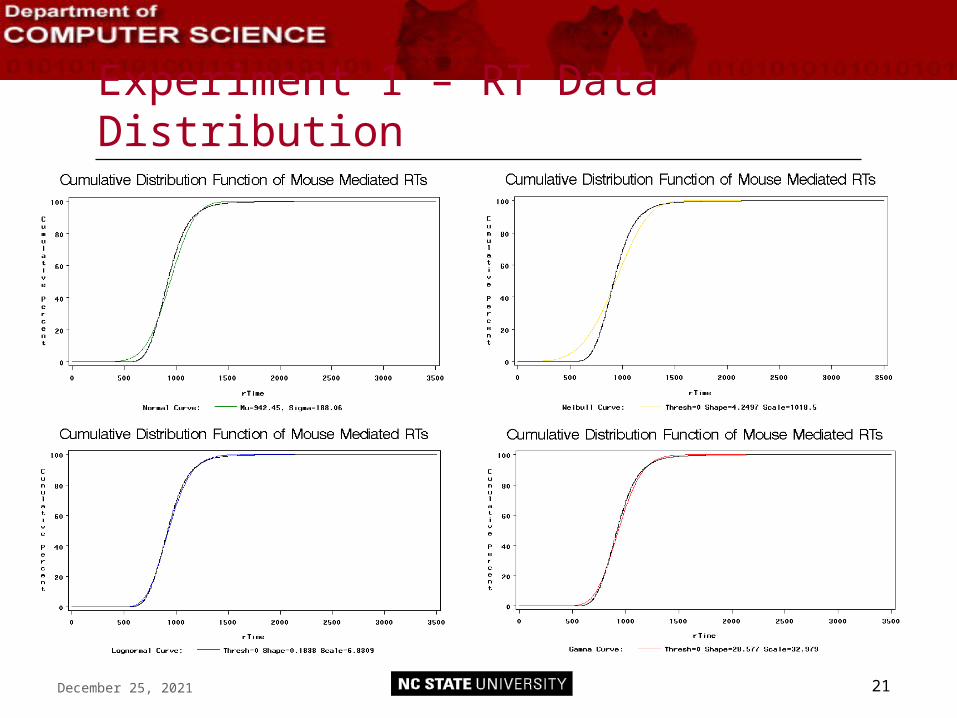
Experiment 1 – Mouse Mediated
April 21, 2023 16
2 x 3 x 2 within subjects design Independent variables:
Random vs. Predictable targets 3 target locations on the toolbar 2 batches of trials
Dependent variable: Reaction Time (speed and accuracy)
Subjects 41 Computer Science students 41 x 2 x 180 trials (14760 data points)
32778Correction Factor 10% of Variance 609.2727 Std Dev
360558.4 Sum
600.4651 Square Root
April 21, 2023 53
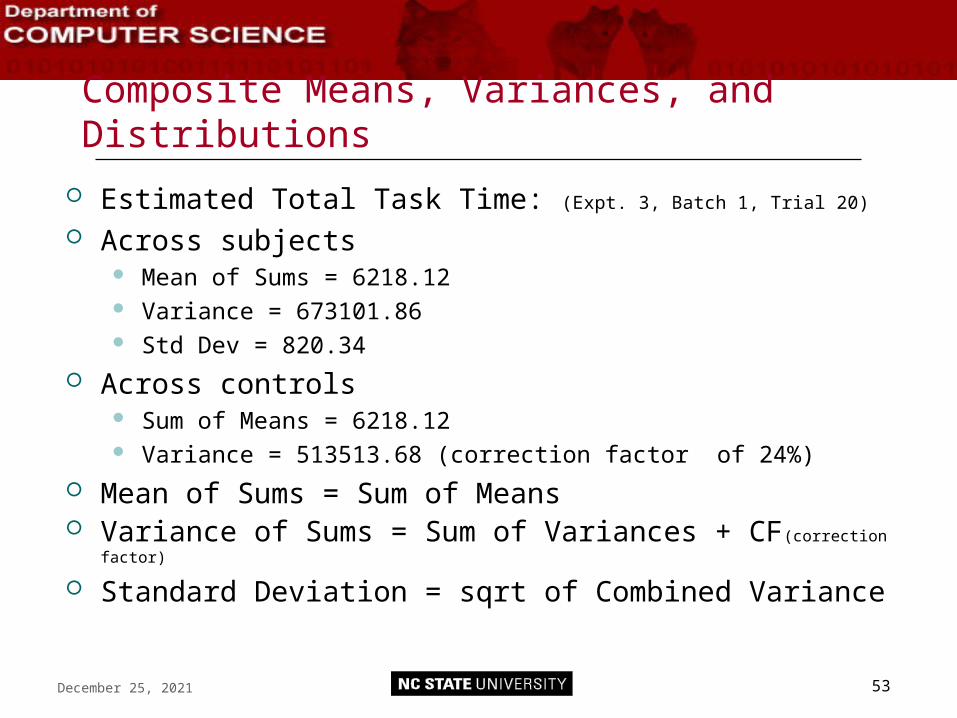
Composite Means, Variances, and Distributions
Estimated Total Task Time: (Expt. 3, Batch 1, Trial 20)
Across subjects Mean of Sums = 6218.12 Variance = 673101.86 Std Dev = 820.34
Across controls Sum of Means = 6218.12 Variance = 513513.68 (correction factor of 24%)
Mean of Sums = Sum of Means Variance of Sums = Sum of Variances + CF(correction factor)
Standard Deviation = sqrt of Combined Variance
April 21, 2023 54
Composite Means, Variances, and Distributions What is the model distribution for the sum of a
sequence of operators?
Kalognormal + Kblognormal + Kclognormal = Total Task Time
What is the model distribution for a sum of lognormal variables? Sums of lognormals is a lognormally distributed variable
– Dufresne (2009) What is the model distribution for a sum of
gamma variables? Sums of gamma variables is gamma as long as they
have the same parameters --Bergstrom
April 21, 2023 55
Composite Means, Variances, and Distributions
Sum of lognormals is a lognormally distributed variable – Dufresne (2009)
Given two random lognormal variates L1 and L2, the distribution of their sum is the convolution of their integrals and the outcome is lognormal.
222
1
21
log2
1
0212
lwew
LL elwl
dlwf
April 21, 2023 56
Composite Means, Variances, and Distributions
What is the model distribution for a sum of gamma variables?
Sums of gamma variables is gamma as long as they have the same parameters –Bergstrom
Proof by induction: Variates from the same gamma distribution, added together
generate the same distribution Equation for convolution of gamma variates
dybe
aeyzdyyfyzfzf ybb
zyzaa
Y
z
xYX
11 1
0
1
0
Composite Means, Variances, and Distributions
April 21, 2023 57
April 21, 2023 58
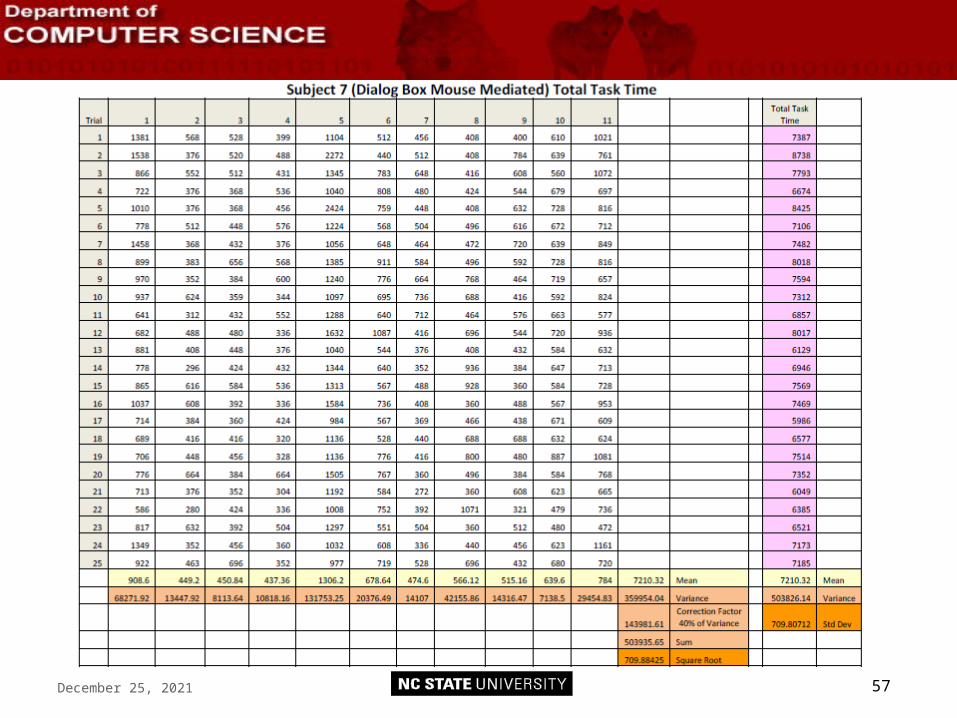
Composite Means, Variances, and Distributions
Subject 7 Total Task Time: (Batch 1, all trials) Across trials:
Mean of Sums = 7210.32 Variance = 503826.14 Std Dev = 709.81
Across controls Sum of Means = 7210.32 Variance = 503935.65 (correction factor of 40%)
Mean of Sums = Sum of Means Variance of Sums = Sum of Variance of each Mean +
correction factor Std Dev = square root of Variance
April 21, 2023 59
Composite Means, Variances, and Distributions
Subject 7: Mean: 7210.32 Standard Deviation: 709.81
Sum of lognormals is lognormal Meanlognormal: 7211.89
Standard Deviationlognormal: 715.45
Scalelognormal: 8.878589
Shapelognormal: 0.098962 Goodness of Fit Tests:
Kolmogorov-Smirnov: D=0.10 p > 0.15 Carmer-von Mises: W-Sq=0.04 p > 0.50
lTotalRTCCCCCCCCCCClllllllllll 1110987654321
April 21, 2023 60
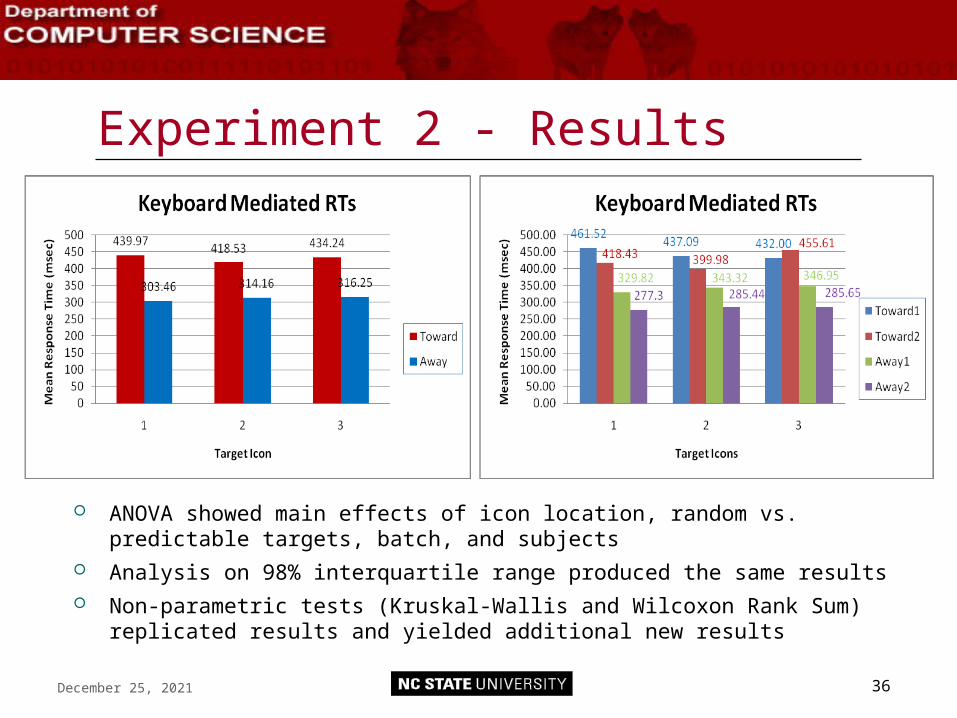
Experiments 3-4-5 – Summary Facilitation and interference effects depending on
context task variables: Sequences of similar operators (reduction in RT by 50%) Mixed sequences of operators elevates RTs Distances accessing screen controls affects RTs
Keyboard responses generally faster Difference of 10-15 msec significant for both
keyboard and mouse RTs Total task completion times can be derived using
composite means and variances
April 21, 2023 61
Experiments 3-4-5 – Summary Verified GOMS approach of computing total
task times from task operators: Composite Means:
Mean of Sums = Sum of Means Composite Variances:
Variance of Sums = Sum of Variances + CF Standard deviation = square root of Variance
Composite distribution: Sum of lognormal variates is lognormal Sum of gamma variates is gamma provided the
variates have the same gamma parameters
April 21, 2023 62
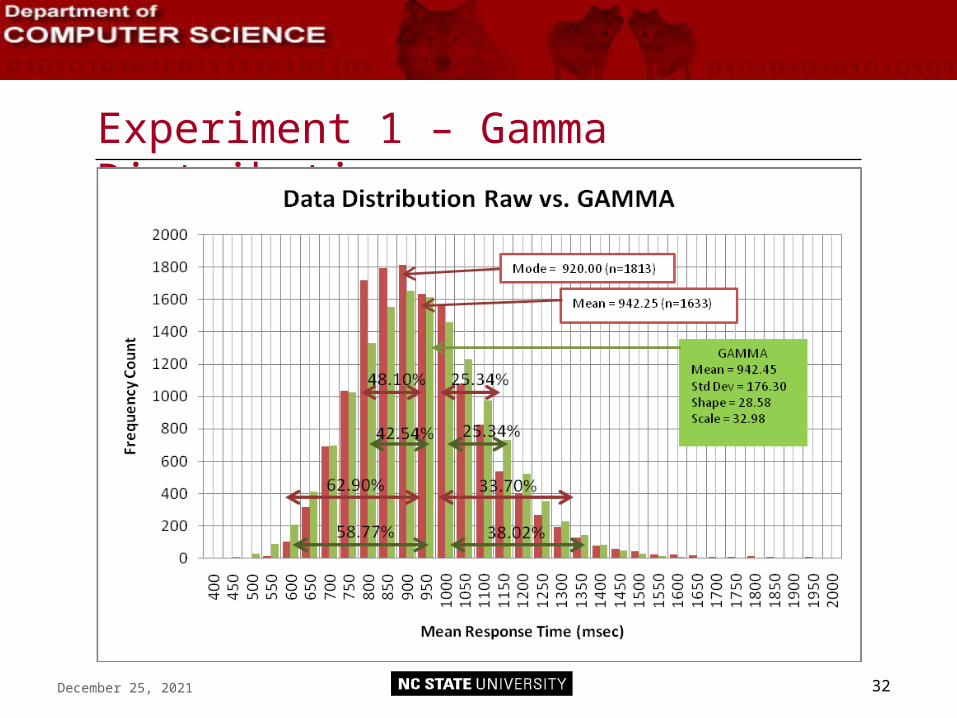
Summary of Overall Findings Distances among control objects affect RT RT data is a skewed distribution favoring
lognormal or gamma distributions Distributional analyses of RT data help make
better predictions for task performance Observations question GOMS assumption of
independence of operators Observations support the approach of using
composite means, variances, and distributions Distributional model analysis provides novel
directions for task modeling approaches
April 21, 2023 63
Value of RT Distributional Analysis
Identifying and using correct model distribution helps with: Performance prediction Performance analysis Performance improvement (usability - task efficiency)
Contact Information Name: Maria Vicente Bonto-Kane Email: [email protected] Education:
PhD candidate Computer Science (NCSU) MS Computer Science (SUNY-Binghamton) MA Experimental Psychology (SUNY-Binghamton)
URL for presentation http://www.marivicbontokane.com/research/mbontokaneOrals2008.ppt
Some publications:Pervasive 2007: It’s About the User by Maria Vicente A. Bonto-Kane, Alvin Chin, Sheila McCarthy, Mayuree Srikulwong, and Paul J. Timmins
Examination of Variance in Production of Task Operators Questions GOMS Ability for a Quick Semi-Automated Usability Assessment of User Interfacesby Maria Vicente A. Bonto-Kane and Robert St. Amant, Grace Hopper Conference 2008
Use of Markov Models for Designing Intelligent Mobile Device Interfaces by Maria Vicente A. Bonto-Kane, Doctoral Colloquium, Pervasive Computing 2007 (Toronto, Canada)