March 25, 202 2 1 Scattering contrast dependence on thermal-expansion-coefficient difference of phases in two- phase system P. Strunz 1,2 , R. Gilles 3 , D. Mukherji 4 , M. Hofmann 5 , D. del Genovese 4 , J. Roesler 4 , M. Hoelzel 3 and V. Davydov 1 1 Nuclear Physics Institute, CZ-25068 Řež near Prague ([email protected]) 2 Research Centre Řež, CZ-25068 Řež near Prague, Czech Republic 3 TU München, ZWE FRM-II, Lichtenbergstr. 1, D-85747 Garching, Germany 4 TU Braunschweig, IfW, Langer Kamp 8, D-38106 Braunschweig, Germany 5 TU Darmstadt c/o FRM II, Lichtenbergstr. 1, D-85747 Garching, Germany Project supported by the European Commission under the 6th Framework Programme through the Key Action: Strengthening the European Research Area, Research Infrastructures. Contract n°: RII3-CT-2003-505925 ' Outline Observation of SANS intensity increase Theory Simulation Experiment • diffraction • SANS Prospective application
Transcript
April 18, 2023 1
Scattering contrast dependence on thermal-expansion-coefficient difference
of phases in two-phase systemP. Strunz1,2, R. Gilles3, D. Mukherji4, M. Hofmann5, D. del Genovese4, J.
Roesler4, M. Hoelzel3 and V. Davydov1
1Nuclear Physics Institute, CZ-25068 Řež near Prague ([email protected])2Research Centre Řež, CZ-25068 Řež near Prague, Czech Republic
Project supported by the European Commission under the 6th Framework Programme through the Key Action: Strengthening the European Research Area, Research Infrastructures. Contract n°: RII3-CT-2003-505925 '
Outline Observation of SANS
intensity increase Theory Simulation
Experiment• diffraction• SANS
Prospective application
April 18, 2023 2
SANS – tool for microstructural characterizationSANS – tool for microstructural characterization
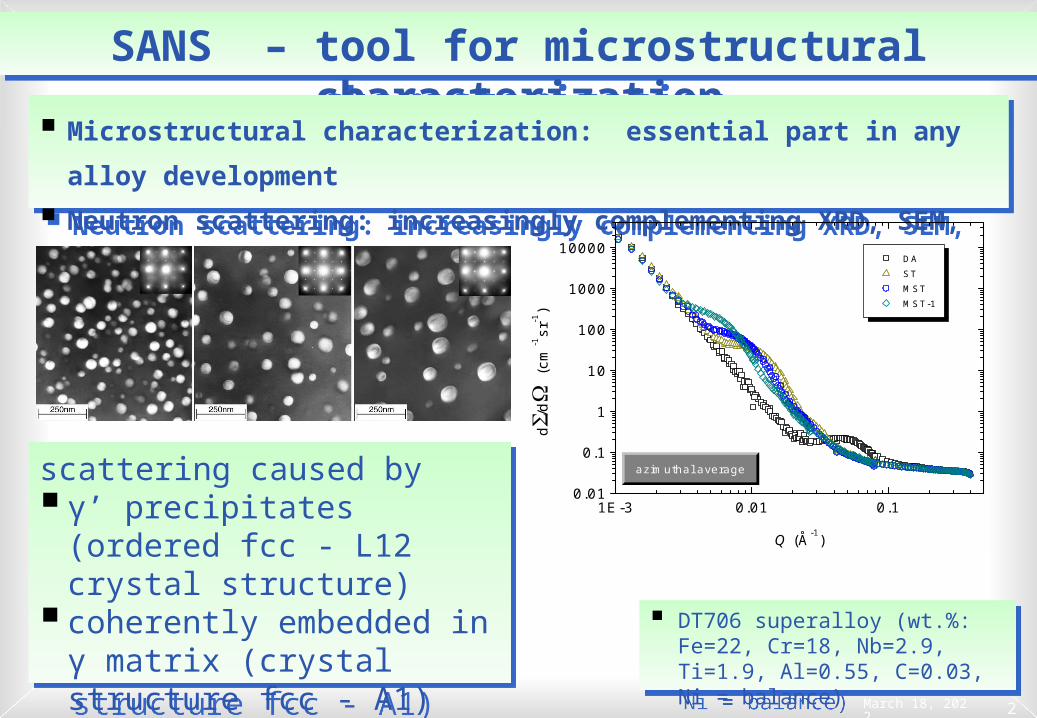
Microstructural characterization: essential part in any alloy development
Neutron scattering: increasingly complementing XRD, SEM, TEM
Microstructural characterization: essential part in any alloy development
Neutron scattering: increasingly complementing XRD, SEM, TEM
scattering caused by γ’ precipitates (ordered fcc -
L12 crystal structure) coherently embedded in γ
matrix (crystal structure fcc - A1)
scattering caused by γ’ precipitates (ordered fcc -
[bm], [bp] not changed but am, ap change with temperature
Can it significantly change the scattering contrast?
Answer: yes, under certain circumstances
Circumstances (fulfilled in superalloys)
low Δ with respect to high volume fraction (to make SANS visible)
Answer: yes, under certain circumstances
Circumstances (fulfilled in superalloys)
low Δ with respect to high volume fraction (to make SANS visible)
)1(
2
33
22
Ta
b
Ta
bTTT
m
m
p
pmp
April 18, 2023 5
Theory – scattering contrastTheory – scattering contrast
Scattering contrast of a two-phase systemScattering contrast of a two-phase system
[bm], [bp] usually unknown, but temperature independent
known [b]alloy
c … volume fraction of γ’ precipitates
[bm], [bp] usually unknown, but temperature independent
known [b]alloy
c … volume fraction of γ’ precipitates
)1(
2
33
22
Ta
b
Ta
bTTT
m
m
p
pmp
)8(
,)(1
12
3
2
cTv
b
Ta
b
TcT
c
alloy
p
p
)5(
11
,
33 Ta
c
Ta
ccTv
pm
c
the average unit cell volume the average unit cell volume
April 18, 2023 6
Theory - integral SANS intensity Theory - integral SANS intensity
when a part of the assymptotic (Porod) region is used: the shape of the scattering curve cannot change (Porod law) only the dependence of the specific interface and sample
thickness on the temperature has to be taken into account =>
when a part of the assymptotic (Porod) region is used: the shape of the scattering curve cannot change (Porod law) only the dependence of the specific interface and sample
thickness on the temperature has to be taken into account =>
where all T-independent parameters are in the constant C2
the ratio (ap/νc1/3)2 is only marginally temperature dependent =>
temperature dependence of intensity driven by numerator in the scattering contrast form:
where all T-independent parameters are in the constant C2
the ratio (ap/νc1/3)2 is only marginally temperature dependent =>
temperature dependence of intensity driven by numerator in the scattering contrast form:
Temperature dependence of the scattering contrastTemperature dependence of the scattering contrast
most probable and extreme values of cR
most probable and extreme values of cR
0 100 200 300 400 500 600 700 800 900
3.6x10¹⁹
3.8x10¹⁹
4.0x10¹⁹
4.2x10¹⁹
4.4x10¹⁹
4.6x10¹⁹
4.8x10¹⁹
5.0x10¹⁹
scattering contrast whenc
R=0.14327
cR=0.05
cR=0.20
temperature evolution of the scattering contrast
scat
terin
g co
ntra
st (
R)2 (
cm-4
)
temperature (°C)
scattering contrast of γ’ in γ matrix, DT706
scattering contrast of γ’ in γ matrix, DT706
April 18, 2023 15
The expressions for SANS scattering contrast dependence on temperature (no phase-composition changes) <= difference in thermal expansions of γ and γ’ in Ni superalloys.
Simulation: this difference is the determining factor for the (Δρ)2 temperature dependence
The hypothesis proven by experiment on a Ni-Fe-base alloy DT706. The evolution of lattice parameters of both phases obtained from the in-situ wide angle neutron diffraction. The theoretical scattering contrast dependence was then successfully fitted to the measured SANS integral intensity.
The magnitude of (ΔρR)2 is firmly connected with the particular shape of the SANS integral intensity temperature dependence => used for the determination of the scattering contrast without the knowledge of the compositions of the individual phases
Investigation of superalloys with no scattering contrast at RT
SummarySummary
April 18, 2023 16
The authors are indebted to SINQ (PSI Villigen, Switzerland) and FRM II (TU Muenchen, Germany) for providing the beam time at the SANS-II facility and diffractometers StressSpec and SPODI
NMI3 support is acknowledged as well (6th Framework Programme ‘Strengthening the European Research Area, Research Infrastructures’ - contract no. RII3-CT-2003-505925
We thank the sample environment group of FRM II (A. Schmidt and A. Pscheidt) for support during the high-temperature experiment
AcknowledgmentsAcknowledgments
April 18, 2023 17
April 18, 2023 18
volume fraction temperature dependencevolume fraction temperature dependence