Relevant • Independent • Objecve Figure 1: Henry Hub Natural Gas Spot Prices (US$ per MMBtu) Source: EIA 7 While Henry Hub is the benchmark North American natural gas price, the higher price of natural gas is mirrored in major trading points across the US and Canada. For example, the monthly bidweek spot natural gas prices for December 1 were AECO-C (C$2.99 per GJ), PG&E Malin (US$3.05 per MMBtu) Chicago Citygate (US$3.25 per MMBtu), Dawn (US$3.63 per MMBtu), SoCal Gas Citygate (US$3.63 per MMBtu), CIG Rockies (US$2.77 per MMBtu) and El Paso San Juan (US$3.15 per MMBtu). 8 From the supply side perspecve, major factors affecng prices include the amount of natural gas produced, as well as the amount of natural gas in storage. From the demand side of the equaon, weather plays an important role, as was the case this past December. According to the US Energy Informaon Administraon (EIA), marketable natural gas producon from January to October averaged 77.5 billion cubic feet per day (Bcfpd) – the first annual producon decline, albeit slight, since 2005. 9 In October 2016, US total producon averaged 75.8 Bcfpd, down from an all-me high of 79.7 Bcfpd in September 2015 and the lowest monthly producon since June 2014 (74.9 Bcfpd). 10 The decline in US total marketable gas producon was caused by a decline in the US shale gas producon, decreasing from a record high of 43.8 Bcfpd in August 2016 to 42.9 Bcfpd in December 2016. 11 And while the Marcellus Shale is at record high levels of producon – November-December 2016 CERI Commodity Report — Natural Gas Natural Gas Market – A Year in Review Paul Kralovic While there are certainly no shortages of highlights, there are two significant events in natural gas markets that define 2016: the upturn in natural gas prices and the US becoming a net exporter of natural gas. Much like crude oil, 2015 ended with low natural gas prices. The daily spot price at Henry Hub on December 23, 2015 was US$1.63 per MMBtu, its lowest point since December 11, 1998. 1 And while prices fluctuated in the early part of 2016, increasing to a high of US$2.54 per MMBtu on January 11, 2016, the price of natural gas promptly plummeted once again, 2 reaching a 2016 low of US$1.49 per MMBtu on March 4, 2016. 3 From that moment, however, prices have rebounded steadily, reaching a record-high in 2016 of US$3.80 per MMBtu on December 7, 2016. 4 This is the highest daily since December 12, 2014 – US$3.91 per MMBtu. Figure 1 illustrates the monthly average Henry Hub price of natural gas from December 2014 to present. The monthly average price at Henry Hub in March 2016 was US$1.73 per MMBtu. 5 And aſter four consecuve months of sub-US$2 per MMBtu prices, the average price at Henry Hub rebounded for the balance of the year, increasing to US$3.59 per MMBtu, the highest since November 2014 (US$4.12 per MMBtu). 6 CERI Commodity Report – Natural Gas Editorial Commiee: Paul Kralovic, Dinara Millington, Megan Murphy, Allan Fogwill About CERI The Canadian Energy Research Instute is an independent, not-for-profit research establishment created through a partnership of industry, academia, and government in 1975. Our mission is to provide relevant, independent, objecve economic research in energy and related environmental issues. For more informaon about CERI, please visit our website at www.ceri.ca or contact us at [email protected].
Transcript
Relevant • Independent • Objective
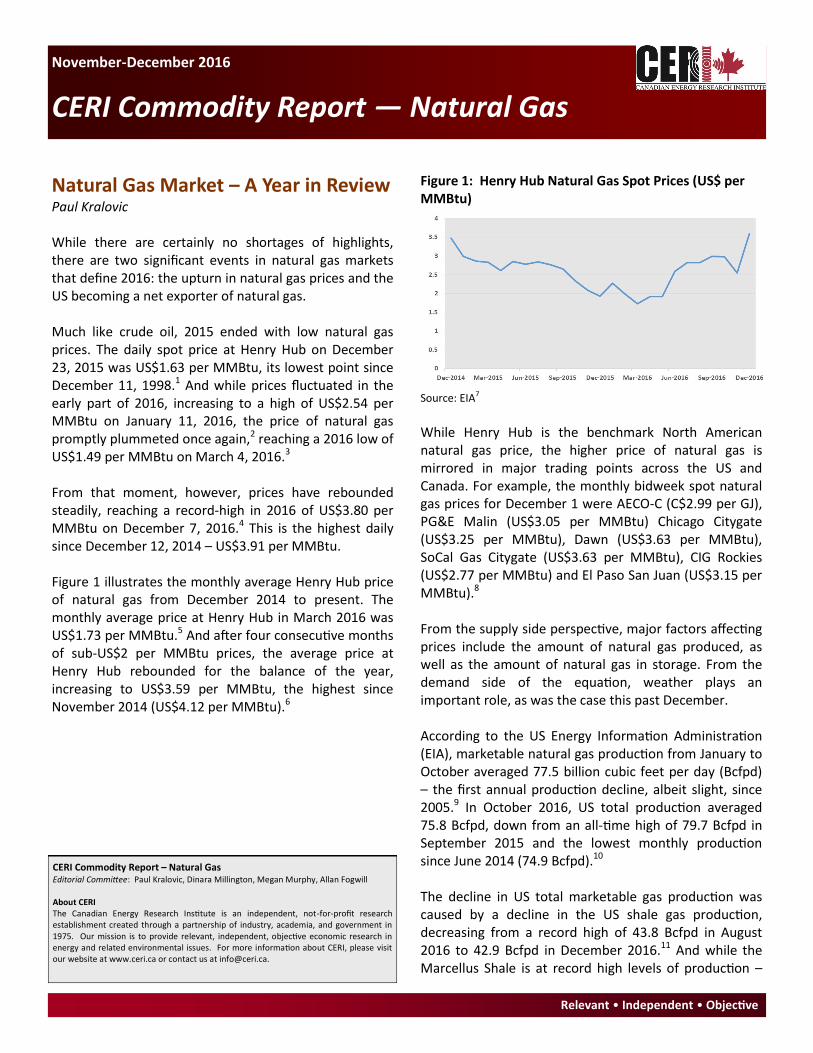
Figure 1: Henry Hub Natural Gas Spot Prices (US$ per MMBtu)
Source: EIA7
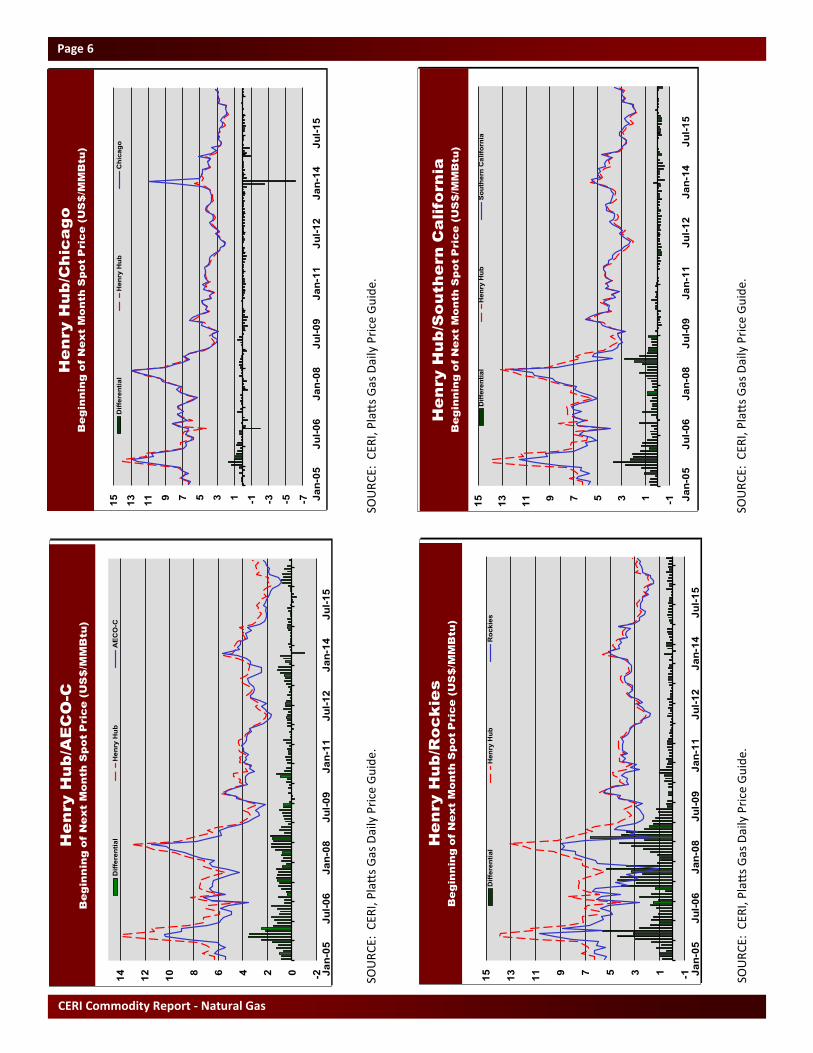
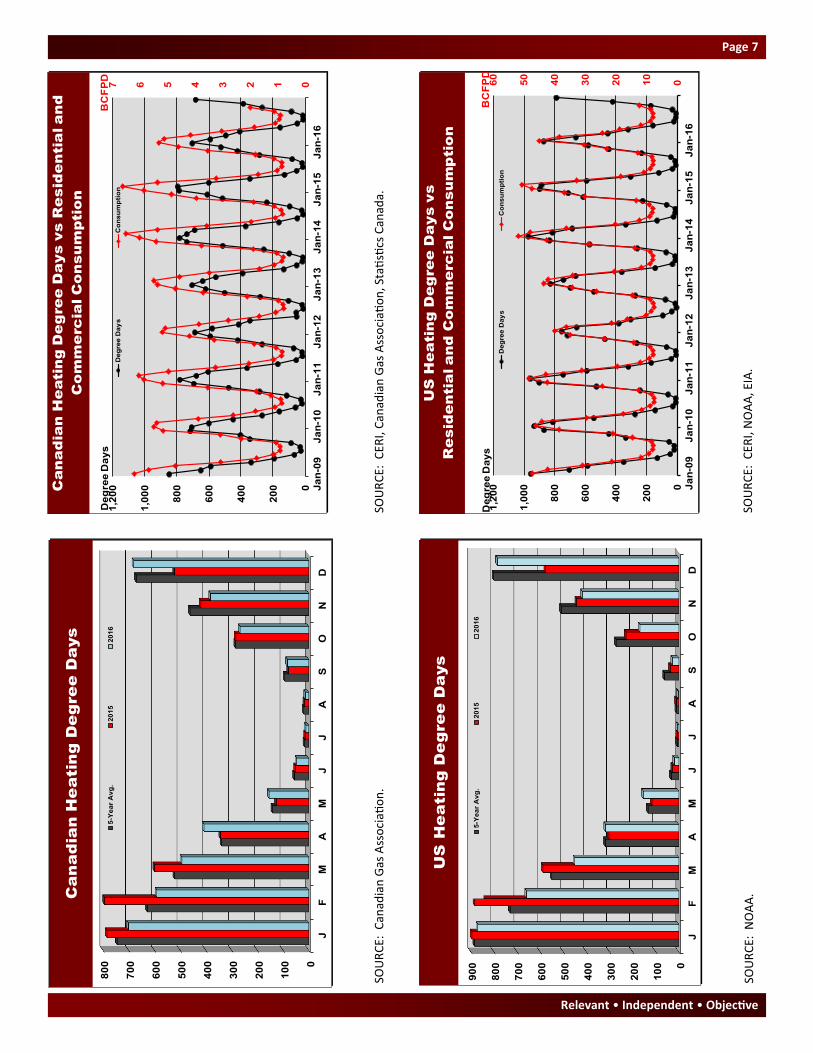
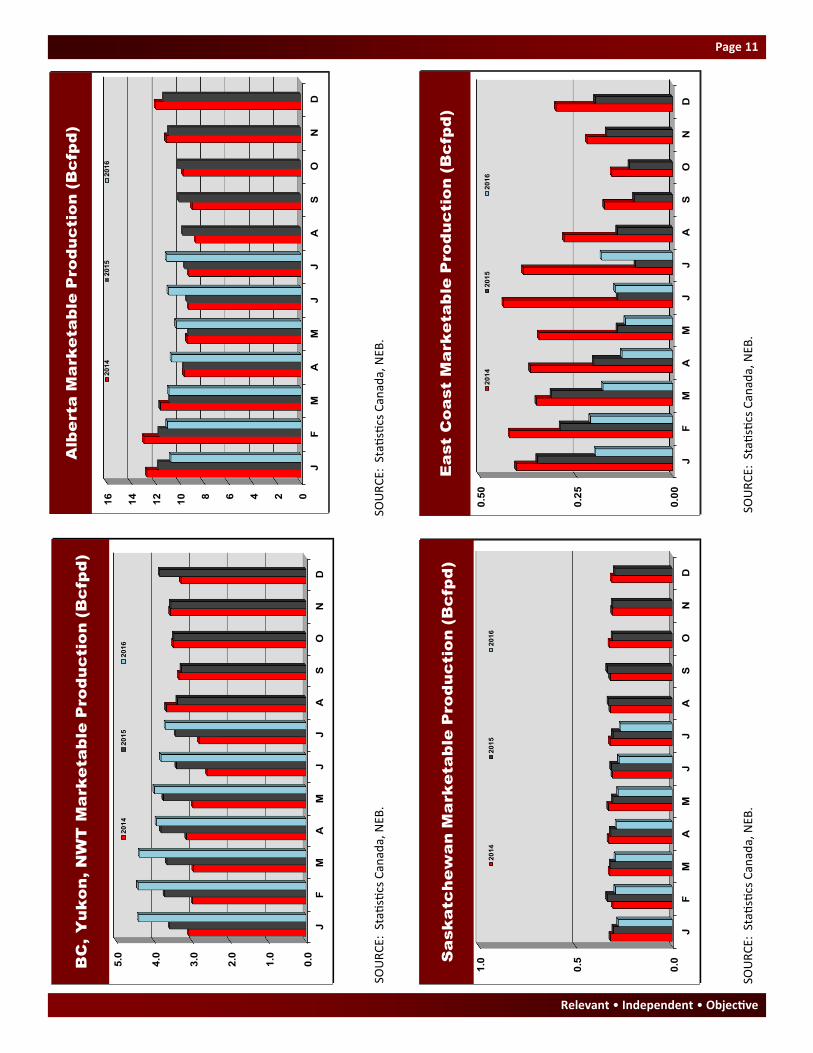
While Henry Hub is the benchmark North American natural gas price, the higher price of natural gas is mirrored in major trading points across the US and Canada. For example, the monthly bidweek spot natural gas prices for December 1 were AECO-C (C$2.99 per GJ), PG&E Malin (US$3.05 per MMBtu) Chicago Citygate (US$3.25 per MMBtu), Dawn (US$3.63 per MMBtu), SoCal Gas Citygate (US$3.63 per MMBtu), CIG Rockies (US$2.77 per MMBtu) and El Paso San Juan (US$3.15 per MMBtu).8 From the supply side perspective, major factors affecting prices include the amount of natural gas produced, as well as the amount of natural gas in storage. From the demand side of the equation, weather plays an important role, as was the case this past December. According to the US Energy Information Administration (EIA), marketable natural gas production from January to October averaged 77.5 billion cubic feet per day (Bcfpd) – the first annual production decline, albeit slight, since 2005.9 In October 2016, US total production averaged 75.8 Bcfpd, down from an all-time high of 79.7 Bcfpd in September 2015 and the lowest monthly production since June 2014 (74.9 Bcfpd).10 The decline in US total marketable gas production was caused by a decline in the US shale gas production, decreasing from a record high of 43.8 Bcfpd in August 2016 to 42.9 Bcfpd in December 2016.11 And while the Marcellus Shale is at record high levels of production –
November-December 2016
CERI Commodity Report — Natural Gas
Natural Gas Market – A Year in Review Paul Kralovic While there are certainly no shortages of highlights, there are two significant events in natural gas markets that define 2016: the upturn in natural gas prices and the US becoming a net exporter of natural gas. Much like crude oil, 2015 ended with low natural gas prices. The daily spot price at Henry Hub on December 23, 2015 was US$1.63 per MMBtu, its lowest point since December 11, 1998.1 And while prices fluctuated in the early part of 2016, increasing to a high of US$2.54 per MMBtu on January 11, 2016, the price of natural gas promptly plummeted once again,2 reaching a 2016 low of US$1.49 per MMBtu on March 4, 2016.3 From that moment, however, prices have rebounded steadily, reaching a record-high in 2016 of US$3.80 per MMBtu on December 7, 2016.4 This is the highest daily since December 12, 2014 – US$3.91 per MMBtu. Figure 1 illustrates the monthly average Henry Hub price of natural gas from December 2014 to present. The monthly average price at Henry Hub in March 2016 was US$1.73 per MMBtu.5 And after four consecutive months of sub-US$2 per MMBtu prices, the average price at Henry Hub rebounded for the balance of the year, increasing to US$3.59 per MMBtu, the highest since November 2014 (US$4.12 per MMBtu).6
CERI Commodity Report – Natural Gas Editorial Committee: Paul Kralovic, Dinara Millington, Megan Murphy, Allan Fogwill About CERI The Canadian Energy Research Institute is an independent, not-for-profit research establishment created through a partnership of industry, academia, and government in 1975. Our mission is to provide relevant, independent, objective economic research in energy and related environmental issues. For more information about CERI, please visit our website at www.ceri.ca or contact us at [email protected].
Relevant • Independent • Objective
Page 2
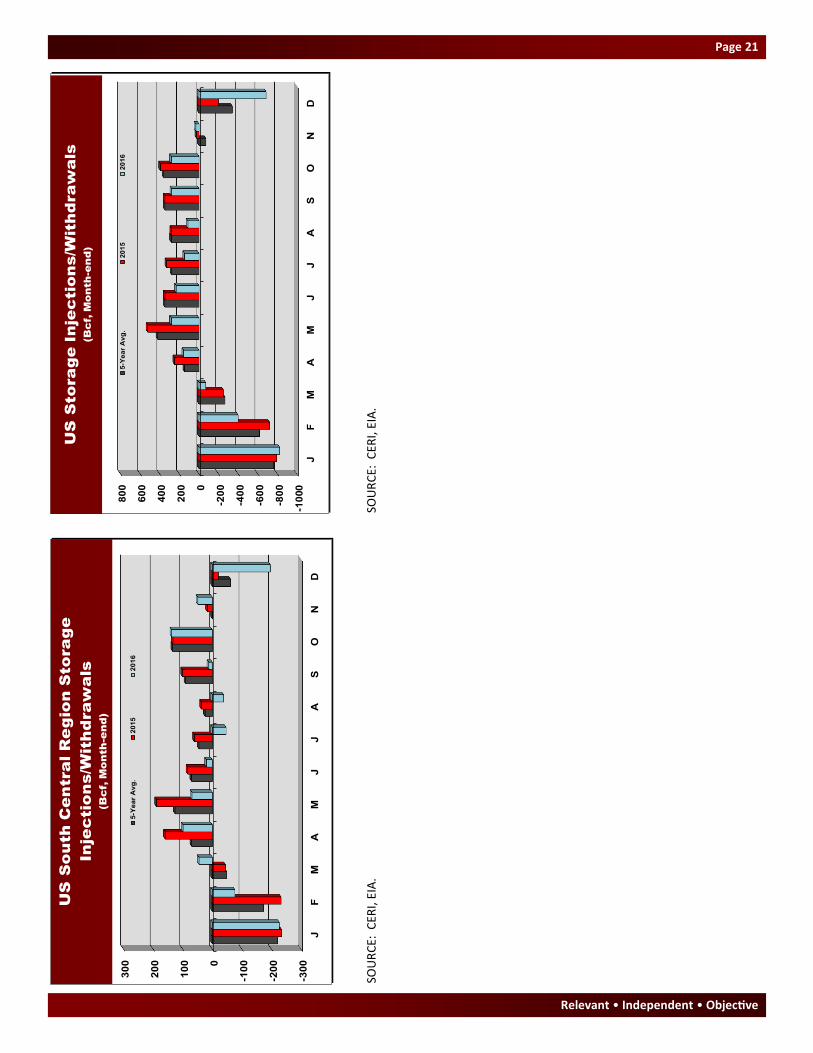
16.8 Bcfpd as of December 2016 – all other major shale plays are experiencing production declines including the Utica Shale, Bakken Shale, Woodford, Barnett Shale, Eagle Ford and the Haynesville Shale.12 For much of 2016 working gas storage levels in the US were at near record levels and certainly higher than storage levels in 2015 and higher than the 5-year average. According to the EIA, US working natural gas totaled about 2,468 Bcf as of week ending March 27, 2016,13 approximately 855 Bcf above the five-year average and 1,007 Bcf above the same time last year.14 However, colder-than-normal weather led to the largest withdrawals since the 2013-14 winter that was characterized by the extreme cold temperatures of the polar vortex.15 As a result, US working natural gas totaled about 3,311 Bcf as of the week ending December 23, 2016,16 approximately 77 Bcf below the five-year average and 445 Bcf below last year’s total for the same period. US Lower-48 working natural gas storage is illustrated in Figure 2. Figure 2: US Lower-48 Working Natural Gas Storage (Bcf, Month-end)
Source: EIA17 & CERI
It is interesting to note a similar trend occurred north of the border. As of end-April 2016, storage levels in Canada were at 583 Bcf, 262 Bcf higher than the 5-year average and 299 Bcf higher than end-April 2015.18 And as of end-September 2016, storage levels in western Canada were at 93 percent capacity while storage capacity in eastern Canada were at 100 percent capacity. However, following withdrawals over the past several months, winter heating demand appears to have started earlier than normal. As of week ending December 23, 2016, storage levels in Canada were at 688 Bcf, only 62
Bcf higher than the 5-year average and 27 Bcf lower than the end of December 2015.19 Figure 3 illustrates Canadian working natural gas. Figure 3: Canadian Working Natural Gas Storage (Bcf, Month-end)
Source: Platt’s Gas Daily & CERI
The second significant trend that characterizes 2016 is the US becoming a net exporter of natural gas in November 2016, marking the first time since 1957. While receiving little fanfare, this monumental shift changes not only the US energy landscape but likely impacts the global LNG landscape as well. Not conceivable even a decade ago, advances in horizontal drilling, 3-D seismic technology and hydraulic fracturing (fracking) have had a profound impact on natural gas production in the Lower-48, opening up shale gas resources thought to be previously determined as non-productive or not feasible to produce. The increase in natural gas supply is changing the flow dynamics within North America, creating the podium for the US emerging as a net exporter, changing the amount the US exports to Canada and Mexico, the volume the US imports from Canada, as well as US LNG imports and exports. While its good news for gas producers and supporting industries in Pennsylvania and nearby states, the flood of Marcellus gas is having a profound impact on western Canadian gas. Lower cost, and abundant Marcellus gas is spilling into the US Northeast and US Midwest, both of which were traditional export markets for western Canadian gas. While the US is importing less gas from Canada, averaging 4.5 Bcfpd in November, and down
Relevant • Independent • Objective
Page 3
from 5.7 Bcfpd in October, it is also exporting more gas to Mexico and Canada, particularly into central Canada.20 The growth of domestically-produced LNG exports is astonishing. February 24, 2016 marked the day when the first US LNG exports hit the waters. The tanker Asia Vision transported approximately 3 Bcf of LNG from Cheniere’s Sabine Pass LNG facility in Louisiana to Brazil, the first-ever domestically-produced LNG export from the Lower-48. It is important to note that the first domestically-produced export from the US occurred in 1969, originating from the 0.2 Bcfpd Kenai LNG export terminal, located in Cook Inlet, Alaska. Currently, the US has twelve regasification facilities and two liquefaction terminals: the 1.4 Bcfpd Sabine Pass LNG and ConocoPhillips Kenai facility. That being said, only three import terminals received LNG shipments in 2016: Everett, MA (GDF SUEZ – DOMAC), Elba Island, GA (El Paso – Southern LNG) and Offshore Boston (Northeast Gateway). And their import numbers are decreasing. Only 69 Bcf of LNG was received in 2016, down from 91.1 Bcf in 2015, up from 59.1 Bcf in 2014 and down from 96.3 Bcf in 2013.21 It is interesting to note that all LNG received in 2016 was from Trinidad. On the other hand, 109.1 Bcf of LNG was exported in 2016, all via the Sabine Pass LNG facility.22 Figure 4 illustrates the US LNG exports by destination between February and December 2016. With the construction of Train 2 in September, Sabine Pass experienced record high LNG exports in November and December, reaching 42.8 Bcf in the latter.23 Figure 4: US LNG Exports by Destination Region, February-December 2016 (Bcf)
Source: EIA24
Throughout the year, the largest number of cargoes were destined for South America including Argentina, Brazil and Chile. In December, however, the majority of cargoes were shipped to Asian markets to meet increased residential heating demand from cold winter temperatures.25 While high, these export numbers will likely increase. Not only is Cheniere planning to build five trains in total, each with a production capacity of approximately 4.5 million tonnes per annum (MMtpa),26 but this does not include the six export facilities that are approved (and under construction) by the US Department of Energy and by the Federal Energy Regulatory Commission (FERC) in the US: Hackberry (Sempra-Cameron LNG), Freeport (Freeport LNG), Cove Point (Dominion-Cove Point LNG), Corpus Christi (Cheniere-Corpus Christi LNG), Sabine Pass (Sabine Pass Liquefaction, a subsidiary of Cheniere Energy Partners – Trains 5 & 6) and Elba Island (Southern LNG Company).27 According to FERC, the combined capacities of these facilities is 10.4 Bcfpd.28 While LNG was attracting attention in the US, Canada was no different. There are 20 LNG export projects proposed along the west coast,29 including 18 export licenses approved by the NEB, and two interesting proposals located in Nova Scotia: the Goldsboro LNG and Bear Head LNG. And with several proposals nearing a Final Investment Decision (FID), one of the intriguing questions in 2016 was whether it would be a facility located on the east or west coast of Canada that would build the country’s first export terminal. LNG Canada and Pacific NorthWest LNG attract much of the LNG spotlight on the west coast. The former is a joint venture including Shell (50 percent), PetroChina (20 percent), Mitsubishi Corporation (15 percent) and KOGAS (15 percent).30 The latter is a partnership between PETRONAS (62 percent), Sinopec (15 percent), Japan Petroleum Exploration Co. Limited (JAPEX) (10 percent), Indian Oil (10 percent) and PetroleumBRUNEI (3 percent).31 Both projects were nearing an FID in 2016 but both were delayed. The first Canadian LNG project to receive an FID however, belongs to Woodfibre LNG. The 0.3 Bcfpd facility is sponsored by Pacific Oil and Gas, which is wholly-owned by Singapore-based Royal Golden Eagle (RGE). The latter authorized the FID on November 4, 2016.32 Located near Squamish, British Columbia, just
Relevant • Independent • Objective
Page 4
north of Vancouver, construction of the project is expected to begin in 2017 and start operations in 2020.33 While small in size, Woodfibre LNG would be the first Canadian LNG export facility to be built. Woodfibre LNG has already secured a 25-year export license from the National Energy Board (NEB) and environmental permits from the BC Environmental Assessment Office (EAO) and the Canadian Environmental Assessment Agency (CEAA). It is interesting to note that Woodfibre LNG is currently trying to secure a 40-year export license that is under review; the application was submitted October 2016.34 Woodfibre LNG, however, still needs permits from British Columbia's Oil and Gas Commission and the District of Squamish. Plummeting crude prices impacted crude-linked contract LNG prices, negatively affecting many of the proposed LNG terminals along the BC coast. In addition, with the competition of several new LNG export facilities in Australia, there is a glut of LNG on the Asian market. These factors certainly impacted investment decisions for Pacific NorthWest LNG and LNG Canada. Pacific NorthWest LNG is looking to make their decision on the Lelu Island-based facility later in 2017. This is despite the fact that Pacific NorthWest LNG was granted a permit to export up to 18 MMtpa,35 as well as receiving approval from the CEAA in September 201636 and issued BC’s Environmental Assessment (EA) certificate in late November 2014. The same is true for Royal Dutch Shell’s LNG Canada proposal. The company announced in July 2016 that its joint venture participants will delay its FID, citing “industry challenges”.37 LNG Canada received a 40-year license from the NEB to export 26 MMtpa of LNG,38 as well as approval from the CEAA and BC Environmental Assessment Office.39 Interestingly, the latter is the first project where an EA Certificate was granted under the substitution process, a unique agreement between the CEA and the BC Environmental Assessment Office.40 Where federal and provincial environmental assessments are necessary, the substitution process allows a single provincial review process to determine two decisions – federal and provincial.41 For more information, please refer to CERI Study No. 161, Risk Analysis of British Columbia Natural Gas Projects: Environmental and Indigenous Peoples Issues.
Endnotes 1US Energy Information Administration, Natural Gas, Henry Hub Natural Gas Spot Price, Daily, https://www.eia.gov/dnav/ng/hist/rngwhhdd.htm 2ibid 3InvestmentMine website, Historical Natural Gas Prices and Price Chart, http://www.infomine.com/investment/metal-prices/natural-gas/all/ 4US Energy Information Administration, Natural Gas, Henry Hub Natural Gas Spot Price, Daily, https://www.eia.gov/dnav/ng/hist/rngwhhdd.htm 5US Energy Information Administration, Natural Gas, Henry Hub Natural Gas Spot Price, Monthly, http://www.eia.gov/dnav/ng/hist/rngwhhdM.htm 6ibid 7US Energy Information Administration, Natural Gas, Henry Hub Natural Gas Spot Price, Monthly, http://www.eia.gov/dnav/ng/hist/rngwhhdM.htm 8Platts website, Platts Gas Daily, December 1. 9US Energy Information Administration, Natural Gas Marketed Production, https://www.eia.gov/dnav/ng/NG_PROD_SUM_A_EPG0_VGM_MMCF_M.htm 10ibid 11US Energy Information Administration, Natural Gas, Natural Gas Weekly Update (for the week ending January 18, 2017), http://www.eia.gov/naturalgas/weekly/#tabs-supply-1 12ibid 13US Energy Information Administration, Weekly Natural Gas Storage Report http://ir.eia.gov/ngs/ngs.html 14ibid 15US Energy Information Administration, Natural Gas, Natural Gas Weekly Update (for the week ending January 18, 2016), http://www.eia.gov/naturalgas/weekly/#tabs-supply-1 16US Energy Information Administration, Weekly Natural Gas Storage Report http://ir.eia.gov/ngs/ngs.html 17ibid 18Platt’s website, Platt’s Gas Daily 19ibid 20Platt’s website, US Emerges as Net Exporter of Natural Gas, http://www.platts.com/latest-news/natural-gas/houston/us-emerges-as-net-exporter-of-natural-gas-27710071?utm_campaign=energybulletin_allcommodity_email_111516&utm_medium=email&utm_source=eloqua 21Office of Fossil Energy, LNG Monthly 2016, https://energy.gov/fe/downloads/lng-monthly-2016 22ibid 23US Energy Information Administration, Natural Gas, Natural Gas Weekly Update (for week ending January 18, 2017), http://www.eia.gov/naturalgas/weekly/#tabs-supply-1 24ibid 25ibid 26ibid 27FERC website, North American LNG Import/Export Terminals: Approved as of January 5, 2017, http://www.ferc.gov/industries/gas/indus-act/lng/lng-approved.pdf 28ibid
29Government of BC website, LNG in BC, BC LNG Projects, http://lnginbc.gov.bc.ca/tile/bc-lng-projects/ 30ibid 31Pacific NorthWest LNG Website, Learn About Pacific NorthWest LNG, http://pacificnorthwestlng.com/learn-about-pacific-northwest-lng/ 32Woodfibre LNG website, Parent Company Authorizes Woodfibre LNG to Proceed with Project, http://www.woodfibrelng.ca/parent-company-authorizes-woodfibre-lng-to-proceed-with-project/ 33ibid 34National Energy Board website, https://www.neb-one.gc.ca/pplctnflng/mjrpp/lngxprtlcnc/index-eng.html 35LNG in BC, Pacific NorthWest LNG, https://engage.gov.bc.ca/lnginbc/lng-projects/pacific-northwest-lng/ 36CEAA, Decision Statement Issued under Section 54 of the Canadian Environment Assessment Act, 2012, September 2016.
37LNG Canada website, LNG Canada’s Joint Venture Participants Delay timing of Final Investment Decision, July 11, 2016, http://lngcanada.ca/media-items/lng-canadas-joint-venture-participants-delay-timing-of-final-investment-decision 38NEB Letter Decision, File OF-EI-Gas-GL-L384-2015-01 01, January 7, 2016. 39Government of BC website, LNG in BC, LNG Canada, http://lnginbc.gov.bc.ca/tile/lng-canada/ 40BC EAO website, Fact Sheet: Substitution of Environmental Assessments in British Columbia, 2015. 41CERI Study, Risk Analysis of British Columbia Natural Gas Projects: Environmental and Indigenous Peoples Issues, November 2016.