General rights Copyright and moral rights for the publications made accessible in the public portal are retained by the authors and/or other copyright owners and it is a condition of accessing publications that users recognise and abide by the legal requirements associated with these rights. • Users may download and print one copy of any publication from the public portal for the purpose of private study or research. • You may not further distribute the material or use it for any profit-making activity or commercial gain • You may freely distribute the URL identifying the publication in the public portal If you believe that this document breaches copyright please contact us providing details, and we will remove access to the work immediately and investigate your claim. Downloaded from orbit.dtu.dk on: Jul 14, 2018 NOx Monitoring in Humid Exhaust Gas Using Non-Dispersive Infrared Spectroscopy Stolberg-Rohr, Thomine Kirstine; Clausen, Sønnik; Glarborg, Peter; Skov Hansen, Rene Publication date: 2015 Document Version Publisher's PDF, also known as Version of record Link back to DTU Orbit Citation (APA): Stolberg-Rohr, T. K., Clausen, S., Glarborg, P., & Skov Hansen, R. (2015). NOx Monitoring in Humid Exhaust Gas Using Non-Dispersive Infrared Spectroscopy. Technical University of Denmark, Department of Chemical Engineering.
Transcript
General rights Copyright and moral rights for the publications made accessible in the public portal are retained by the authors and/or other copyright owners and it is a condition of accessing publications that users recognise and abide by the legal requirements associated with these rights.
• Users may download and print one copy of any publication from the public portal for the purpose of private study or research. • You may not further distribute the material or use it for any profit-making activity or commercial gain • You may freely distribute the URL identifying the publication in the public portal
If you believe that this document breaches copyright please contact us providing details, and we will remove access to the work immediately and investigate your claim.
Downloaded from orbit.dtu.dk on: Jul 14, 2018
NOx Monitoring in Humid Exhaust Gas Using Non-Dispersive Infrared Spectroscopy
Document VersionPublisher's PDF, also known as Version of record
Link back to DTU Orbit
Citation (APA):Stolberg-Rohr, T. K., Clausen, S., Glarborg, P., & Skov Hansen, R. (2015). NOx Monitoring in Humid ExhaustGas Using Non-Dispersive Infrared Spectroscopy. Technical University of Denmark, Department of ChemicalEngineering.
NOX Monitoring in Humid Exhaust GasUsing Non-Dispersive Infrared Spectroscopy
Thomine Stolberg-Rohr PhD Thesis
August 2015
Department of Chemical and Biochemical EngineeringTechnical University of DenmarkBuilding 229DK – 2800 Kgs. LyngbyDenmark Phone: +45 4525 2800Web: www.chec.kt.dtu.dk
NO
X Monitoring in H
umid Exhaust G
asUsing N
on-Dispersive Infrared Spectroscopy
Thomine Stolberg-Rohr
2015
NOX Monitoring in Humid Exhaust GasUsing Non-Dispersive Infrared
Spectroscopy
PhD thesis
Thomine Stolberg-Rohr
Academic Supervisors:Senior Scientist Sønnik Clausen, PhDProfessor, Peter Glarborg, PhDDTU Chemical EngineeringTechnical University of Denmark
Industrial Supervisor:Senior Physicist René Skov Hansen, PhDDanfoss IXA A/S
August, 2015
AbstractThis PhD thesis is concerned with the measurement of NOX in moist exhaust gas on-
board ships using non-dispersive infrared (NDIR) spectroscopy. In such a measurement oneof the major challenges is spectral interference from water vapour which is present in highconcentrations in the exhaust. The PhD study investigates a possible solution to this prob-lem, which is to balance out the signal contribution from water vapour by means of carefullydesigned and manufactured optical bandpass filters. The thesis, presents a thorough theoret-ical description of the NDIR sensor concept together with simulations suggesting that it ispossible but challenging to measure NOX in moist exhaust gas using NDIR. The characteris-tics of optical filters tend to change with temperature, and since this compromises the watersignal balancing, much of the work presented in the thesis is devoted to the design of opticalbandpass filters in general, and temperature invariant filters in particular. This work has ledto the derivation of the thermo-optical expansion coefficients of embedded PbTe and ZnSethin films, frequently used in optical bandpass filters for the mid-infrared range. Knowledgeof these coefficients allows accurate prediction of temperature invariant filters, previouslyrealised based on experience and trial and error. Finally, the absorption spectrum of CO2 atelevated temperatures and pressures has been experimentally investigated, and the absorp-tion cross section of CO2 at 1000 K and 100 bar is revealed for the first time. Informationabout CO2 absorption and emission in combustion conditions is highly demanded for accu-rate modelling of heat transfer processes during combustion in large ship engines which inturn is crucial for understanding the formation of emission gasses, in particular NOx.
ResuméDenne ph.d.-afhandling handler om at måle NOX i fugtig udstødningsgas fra skibe ved
brug af ikke-dispersiv infrarød (NDIR) spektroskopi. I en sådan type måling er en af destørste udfordringer spektral interferens fra vanddamp som er til stede i høje koncentra-tioner i gassen. Ph.d.-studiet undersøger en mulig løsning på dette problem nemlig ud-balancering af signalet fra vandamp ved hjælp af omhyggeligt designede og fremstilledeoptiske båndpasfiltre. I afhandlingen gives en grundig beskrivelse af teorien bag NDIR sen-sorkonceptet sammen med simuleringer der viser at NDIR spektroskopi er en mulig, menvanskelig teknik til måling af NOX i fugtig udstødningsgas. En af vanskelighederne beståri at de optiske filtres karakteristik ændres med temperaturen, og derfor er en stor del afarbejdet i denne afhandling viet til design af optiske filtre i almindelighed og temperatur-invariante filtre i særdeleshed. Dette arbejde har ført til udledningen af de termo-optiskeudvidelseskoefficienter for indlejrede tyndfilm af PbTe og ZnSe i optiske filtre til brug idet midt-infrarøde område. Kendskab til disse koefficienter gør det muligt at forudsige ogdesigne temperaturinvariante filtre hvilket tidligere var baseret på erfaring og trial and er-ror. Endelig er absorptionsspektret af CO2 blevet studeret ved høje tryk og temperaturer ogabsorptionstværsnittet af CO2 ved 1000 K og 100 bar målt og præsenteret for første gang.Viden om absorption og emission fra CO2 er stærkt efterspurgt i forbindelse med model-lering af varmeoverførsel i forbrændingsprocesser i store skibsmotorer, hvilket er afgørendefor forståelsen af dannelsen af emissionsgasser, i særdeleshed NOx.
PrefaceThis report finalises an industrial PhD project, carried out at Danfoss IXA and DTU
Chemical Enngineering, which commenced on February 14th 2012. It was started up along-side a project supported by the Danish high technology foundation (HTF) aiming at devel-oping an NDIR NOX emission sensor for continuous on-board exhaust gas measurements onships. One of several critical challenges in this development was the spectral discriminationbetween NOX and water vapour and this is the topic of my PhD study.
However, in May 2013 Danfoss IXA decided for a major technology change and with-drew from the HTF project and stopped all development and activities on the NDIR sensor.This unfortunately implied that my results on in-optics humidity compensation were neverexperimentally verified, but the results from the original PhD project was summarised andpublished in the Proceedings of Advanced Photonics 2014.
At the time Danfoss IXA decided to withdraw from the HTF project, I was in Englandvisiting the Infrared Multilayer Laboratory (IML) at the University of Reading who hadagreed to manufacture the very precise optical filters that I was requiring in order to succeedin discriminating NOX from water vapour. From my discussions with Head of IML GaryHawkins, there turned out to be a huge gap in the published knowledge of the temperaturedependence of thin film optical filters, and at the same time demands for temperature-stableinfrared optical filters were emerging from progress in non-cooled infrared detector tech-nologies. IML was in possession of a comprehensive repository of historical bandpass filterswhich had the potential of delivering the statistical grounds for extraction of thermo-opticalproperties of bandpass filters, and prediction of their temperature behaviour. This becamethe beginning of a very fruitful research collaboration which resulted in several discoveriesreported in two major publications published in Optics Express.
Upon Danfoss IXA’s exit from the HTF project, my PhD study was redirected towardCO2 and H2O measurements in exhaust gas recirculation applications at elevated pressures.At DTU Chemical Engineering, Optical Diagnostic Group, Postdoc Caspar Christiansenhad designed and build a gas cell aimed at high temperature and high pressure CO2 andH2O measurements. He had just undertaken a validation process of the finalised gas cell asthe project finished. I took over the experimental verification process in return for access tothe cell, which added experimental work to the PhD project. The work with the cell resultedin a paper that has been submitted to Journal of Quantitative Spectroscopy and RadiativeTransfer.
The PhD project has been supervised by the university supervisors Senior ResearcherSønnik Clausen and co-supervisor Professor Peter Glarborg. At the beginning of the PhDproject the company supervisors were CTO Jens Møller Jensen and co-supervisor ProductDevelopment Manager Rainer Buchner. After they both left the company during the firsthalf of the PhD study, Senior Physicist René Skov Hansen took over the supervising role.
Thomine Stolberg-RohrVejle, August, 2015.
AcknowledgementFirst of all, I would like to thank my former manager Rainer Buchner and the founder
of Danfoss IXA Jens Møller Jensen; without the two of which, this PhD thesis would neverhave been written. Thanks also to my present manager Allan Skouboe for always being re-spectful about my PhD obligations, even in busy times, and to my company PhD supervisorRené Skov Hansen, who seems to know everything and everybody, for always being on myside. To my colleagues at Danfoss IXA; thanks for your never failing helpfulness and inter-est in my project. I am looking forward become a full member of the sensor developmentteam.
I would like to thank my university supervisors Sønnik Clausen and Peter Glarborg forguiding me through this PhD project, and I would further like to send my regards and thanksto Caspar Christiansen, with whom I spend some intense days and nights in the gas celllaboratory at DTU Risø, as well as to Alexander Fateev and Karsten Lindorff Nielsen, allmembers of the optical Diagnostic groups at DTU Chemical Engineering. I would liketo acknowledge the company of my fellow PhD student in the Optical Diagnostics Group,Helge Grosch who was always three months ahead of me, and with whom I have spend manylong and interesting days at Lund University studying optics and combustion diagnostics.
I would like to express my gratitude to Gary Hawkins, for an intense and productiveperiod at Reading University, for letting me move into his office and for asking me to stay.Thanks also to Richard Sherwood and Karim Djotni for making me feel very welcome. Ihave come across a number of other inspiring people on my way, amongst them the chess-mathematician Guy Haworth.
Thanks to my friend and former chess-club magazine co-editor Martin Reib Petersen, forkindly answering questions about the English language, as well as to my long term friendPeter Bæk.
Finally, a very special thanks goes to my partner Anders for being available with supportand technical discussions, and for making sure that I will have a pleasant memory of the lastvery busy days of this PhD project.
The PhD study was financially supported by Danfoss IXA A/S as well as The DanishAgency for Science, Technology and Innovation (DASTI).
5 High Pressure and High Temperature CO2 Measurements 49
Thesis Conclusion 51
A Paper 1: In Optics Humidity Compensation in NDIR Exhaust Gas Measure-ments of NO2 I
B Paper 2: Spectral design of temperature-invariant narrow bandpass filters forthe mid-infrared V
C Paper 3: Determination of the embedded thermo-optical expansion coefficientsof PbTe and ZnSe thin film infrared multilayers XXIII
D Paper 4: High Temperature and High Pressure Gas Cell for Quantitative Spec-troscopic Measurements XXXII
List of Acronyms XLII
Bibliography XLVI
Thesis Outline
The main topic of the present PhD study is the discrimination between emission gasesand water vapour in non-dispersive infrared (NDIR) spectroscopic measurements in hot andmoist exhaust gas on-board ships with particular focus on nitric oxides (NOX). The PhDproject resulted in one published conference paper, two published journal article, and onesubmitted journal paper. The content of each paper is summarised Publication Summaries.This thesis accounts for the background for the papers and their connection within the PhDproject.
The purpose of the introduction given in Chapter 1 is to give the grounds for the globalinterest in exhaust gas emission monitoring from ships, introduce the main challenges in-volved in this, and discuss the present state of on-board NOX sensing in hot and moistexhaust gas. Having established the rationale for continued research in improvements in ex-haust gas emission monitoring, NDIR is introduced as a measurement principle for exhaustgas measurements as well as it main drawback; the interference with water vapour.
Chapter 2 presents the theoretical physical foundation for infrared gas spectroscopy; theinteraction between light and molecules. It gives an insight into the comprehensive workthat has been carried out over several decades to establish publicly accessible quantitativeinfrared databases, enabling quantitative spectroscopic calculations. The chapter concludeswith the introduction of Beer-Lamberts law which together with the databases provide thebasis of all simulations in the filter optimisations described in Chapter 3 aiming at overcom-ing the water interference hurdle.
Chapter 3 presents the concept of balancing out the water vapour signal by carefullydesigned optical filters to an extend where the remaining water vapour signal can be cor-rected by a simultaneous H2O measurement. Results on filters designed for NO2 measure-ments were presented orally at Advanced Photonics Congress 2014 and published in theconference proceedings (Appendix A). This chapter provides supporting details of the filteroptimisation procedure and elaborates on results and conclusions.
Chapter 4 is devoted to optical filters seen from the perspective of a spectroscopist. Theoptical filters are an essential part of the in-optics humidity compensation. The chapter in-cludes the results of a systematic study of temperature-invariant optical filters that I carriedout in close coopperation with Gary Hawkins at Infrared Mulitilayer Laboratory at the Uni-versity of Reading. This work resulted in two journal papers (Appendix B & C) while athird publication is in preparation.
Chapter 5 covers experimental measurements of CO2 absorption at high pressures andtemperatures. This work has been submitted to Journal of Quantitative Spectroscopy andRadiative Transfer and the paper in its submitted form is found in Appendix D.
Publication Summaries
Paper 1: In Optics Humidity Compensation in NDIR Ex-haust Gas Measurements of NO2
Status Published [1]Type Conference Paper
AuthorsThomine Stolberg-Rohr, Rainer Buchner, Sønnik Clausen, Jens MøllerJensen, Allan Skouboe, Gary Hawkins & René Skov Hansen
Conference Advanced Photonics OSA 2014
This paper presents the concept of balancing out the humidity signal in NDIR measure-ments of NO2 in moist exhaust gas by using carefully designed and manufactured opticalfilters, the major challenge of which, lies in the wavelength tolerances in the filter produc-tion. The paper presents a set of fabricated filters for NO2 measurement, together with theresults of a theoretical evaluation of its performance. A cross sensitivity to water vapourof 3.2 ppm NO2 for a change of 1000 ppm H2O is predicted. The full conference paper isfound in Appendix A.
Paper 2: Spectral design of temperature-invariant narrowbandpass filters for the mid-infrared
Status Published [2]Type Journal PaperAuthors Thomine Stolberg-Rohr & Gary HawkinsJournal Optics Express 2015
The advances in cooling-free detectors for mid-infrared sensing drives the developmentof optical filters that performs without the need for thermo-stabilisation. Temperature af-fects bandpass filters because the material properties of the thin film coatings constitutingthe filter, are subject to thermal expansion and temperature-induced changes in refractiveindex. For the vast majority of thin film materials both of these material properties changespositively with temperature, and hence the bandpass profiles are normally shifting towardslonger wavelengths with increasing temperature. An exception from this rule is PbTe which
4 CONTENTS
exhibits a negative change in refractive index with increasing temperature; an unusual be-haviour which has been utilised to manufacture temperature invariant bandpass filters in thepast. However no systematic study of the multilayer design dependence of the temperature-invariant property had previously been reported. The temperature dependence of a bandpassprofile can easily be calculated, provided that the optical properties are known. However,when it comes to thin films, there is very little information available about temperaturevariations of the optical properties, and it becomes particularly scarce for the mid-infraredregion above room temperature. The material properties of thin films are known to deviatefrom the properties of the material in bulk form, and the paper begins with presenting theresults of a literature survey for published data on the thermal optical properties of thin filmPbTe and ZnSe. The gathered thermo-optical material data for PbTe and ZnSe is shown tobe insufficient to predict the temperature behaviour of real PbTe/ZnSe band pass filters. Thepaper present a systematic study based on a historic repositiory of bandpass filters made ofPbTe and ZnSe, and primarily manufactured for space-flight missions. All filters were char-acterised in the range 0-200 ◦C and from this it was possible to relate temperature invarianceto multilayer design and establish a formula to accurately predict the centre wavelength dis-placement of a bandpass profile with temperature for PbTe/ZnSe filters. This result wasexploited to produce a number of temperature invariant bandpass filters with different centrewavelengths. The paper was well received and was selected for Spotlight on Optics [3]. Thefull paper is available in Appendix B.
Paper 3: Determination of the embedded thermo-opticalexpansion coefficients of PbTe and ZnSe thin film infraredmultilayers
Status Published [4]Type Journal PaperAuthors Gary Hawkins & Thomine Stolberg-RohrJournal Optics Express 23(12), 2015
This paper presents the first reported thermo-optical expansion coefficients of thin filmdielectric coatings of PbTe and ZnSe embedded in multilayer structures. The paper takes itsoffspring in the large set of measurement data presented in Paper 2 where bandpass trans-mission profiles were measured as function of filter temperature. Paper 2 also presented anequation relating the temperature-induced centre wavelength shift of narrow bandpass filtersto the multilayer design and the thermo-optical material properties of the embedded thinfilm materials. The present paper uses these findings to extract the thermo-optical expan-sion coefficients for embedded thin films of PbTe and ZnSe. At three different mid-infraredwavelengths, the study in Paper 2 provides sufficient data for the coefficients to be deter-mined by multivariate linear regression. The extracted thermo-optical expansion coefficientfor embedded thin film ZnSe is close to the bulk ZnSe value, while embedded layers of thinfilm PbTe deviate significantly from bulk values. The coefficient for PbTe lies in-between
CONTENTS 5
bulk values and previously reported values measured on free standing single thin film PbTe.This paper further reports the first manufactured narrow bandpass filter containing lead sul-phide (PbS). PbS is an alternative lead salt material that possesses negative thermo-opticalproperties and the possibility of replacing PbTe with PbS extends the number of potentialtemperature invariant bandpass filters that may be realised. The full paper is available inAppendix C.
Follow-up paper in preparation: Design of temperature-invariant nar-row bandpass filters containing PbS multilayers (3-5 µm)
A further paper is being prepared on the design of temperature invariant PbS/ZnSenarrow bandpass filters. This paper follows the same methodology as was applied forPbTe/ZnSe filters in Paper 2 and Paper 3, and uses it to extract the thermo-optical expansioncoefficient for embedded thin film PbS and predict which bandwiths that may be realisedwith PbS and ZnSe, exhibiting temperature invariant properties. The amount of availabledata is less extensive than for the PbTe/ZnSe study since PbS was only recently used innarrow bandpass filters for the first time, as reported on in Paper 3. However, a numberof filters have been manufactured subsequently, and preliminary results indicate that thethermo-optical expansion coefficient of embedded thin film PbS, deviates significantly frombulk values. As it was the case for embedded thin film PbTe, bulk values of PbS cannot beused to predict temperature invariance of PbS/ZnSe narrow bandpass filters. To improve thedata foundation for the extracted thermo-optical coefficient of embedded PbS thin films, themanufacture of a number of PbS/ZnSe with distinct multilayer structures are in the pipeline.This follow-up paper will contribute with another important step in the direction towardscontrol of temperature invariance.
Paper 4: High Temperature and High Pressure Gas Cell forQuantitative Spectroscopic Measurements
Status SubmittedType Journal Paper
AuthorsCaspar Christiansen, Thomine Stolberg-Rohr, Alexander Fateev & SønnikClausen
Journal Journal of Quantitative Spectroscopy and Radiative Transfer
In the efforts of reducing emissions and fuel consumption in large ship engines, betterunderstanding of thermal transfer processes during combustion is required. Particular forlarge diesel ship engines, the thermal radiation of CO2 is a major contributor to heat transferin the engine, and it is therefore necessary to be able to accurately calculate the radiativeemission from CO2. However, at combustion temperature and pressure, the emission spec-trum of CO2 has never been measured. Although databases exist, and empirical pressurebroadening models have been used to obtain good agreement with existing high temperature
6 CONTENTS
and high pressure experimental data, these models have never been verified experimentallyat combustion conditions which may reach as high as 2400 K at 200 bar. This paper re-ports on the construction of a ceramic cell, designed for measurements at pressures up to200 bar at temperatures up to 1300 K. This is not sufficiently high temperatures for the largeship engines, but it exceeds previously reported measurements which have been limited to~627 K because the gas cells used have been build of metal. However, for this first publi-cation on the ceramic high temperature and high pressure gas cell, it has only been used atcombined temperature and pressure up to 1000 K and 100 bar under which conditions, thefirst measured absorption cross section spectrum of CO2 is presented. It is shown that use ofthe simple Voigt formalism in the calculation of the CO2 spectrum, under these conditionsoverestimates the total emission from the strong band at 2300 cm−1 with 20 % while theweaker band at 3700 cm−1 shows good agreement in band emission between measurementand the Voigt-based simulation. The full paper is available in Appendix D.
CHAPTER 1
Introduction
1.1 Continuous Emission MonitoringOn-board monitoring of air pollutants in exhaust gas from ships is a rapidly growing
business and research area. It is mainly driven by strong political demands to reduce theemission of nitric oxides (NOX) and sulphur dioxide (SO2), both of which are toxic tohumans as well as the environment, and are considered responsible for lethal respiratorydeceases as well as acidification of lakes and streams [5]. According to [6], the social costrelated to human health impacts resulting from emissions from international ship trafficamounted to 58 bn C/year in the year 2000 corresponding to 7% of the total health costsin Europe, and it is expected to increase to 64 bn C/year in 2020 where the number of pre-mature deaths per year in Europe due to international ship traffic emissions are estimatedto exceed 53000. With similar figures in the rest of the world, there exists a global socio-economic interest to enforce regulations on ship emissions.
Figure 1.1: IMO Emission Control Areas [7].
In 1973 The International Convention for the Prevention of Pollution from Ships (MAR-POL) was adopted by the International Maritime Organisation (IMO) and has been signed
8 Introduction
by the worlds largest seafaring nations, representing 99 % of the worlds shipping tonnage[8]. It has been updated several times over the years and in 1997 it was extended to coverair pollution with the amendment of Annex IV Prevention of Air Pollution from Ships whichheralded a number of regulations on the emissions of NOX and SO2, the first of which en-tered into force in 2005 [9]. The regulations are continuously tightened with the strictestrequirements applying to the Emission Control Areas (ECA) indicated in Figure 1.1.
In 1997 there was no approved exhaust gas monitoring system but the gas emissionsystems for landbased powerplants were well established [10]. The adoption of Annex VItherefore intensified the development of emission sensors for marine exhaust gas as well asthe development of after-treatment systems removing NOX and SO2 from the exhaust gas. Inthe endeavour to reduce NOX and SO2, the demand for Ammonia (NH3) and carbon dioxide(CO2) measurements has evolved. Since each compound is different in terms of abundanceand sensitivity to fuel quality and engine parameters, they are treated independently in thefollowing.
NOX
NOX is defined as the sum of all nitric oxides but in regulation contexts it usually refersto the sum of NO and NO2 which are the major nitric oxide compounds in exhaust gas.NOX is produced in diesel engines in concentrations that are highly depending on the com-bustion parameters. It is partly generated from the nitrogen content in the fuel, however, themajor contribution to NOX concentration in marine diesel exhaust is nitrogen in the intakeair which is converted into NOX at a rate depending on the combustion temperature. TheNOX concentration in the exhaust gas from petrol engines is small because the combustiontemperature is low compared to diesel engines. There are two ways to reduce the NOX pro-duction; the combustion temperature dependence of the NOX production implies that NOX
production can be regulated by the the air/fuel ratio. This means that the reduction of NOX
requires a suboptimal air/fuel-ratio which implies that the engine efficiency is lowered andmore CO2 per kWh is let out. However, this is preferred over NOX emission. Another optionis to use after-treatment equipment to convert NOX into N2 and H2O by selective catalyticreduction (SCR) [11].
As a rule of thumb NO2 concentrations in exhaust gas are about ten times less than theNO concentration and therefore sometimes only NO is measured while NO2 is estimated.However, this procedure is not sufficiently accurate to meet the requirements of MARPOL,and thus also NO2 has to be measured independently.
SO2
SO2 is sometimes referred to as SOX because as with NOX it is the total emission ofsulphur oxides that is of interest. However, SO2 constitutes the vast majority of sulphuroxides emitted in diesel engine exhaust gas and is thus the compound subject to regulation,although 2-4% of the fuel sulphur content is emitted as SO3 according to [12]. In contrastto NOX, the SO2 concentration is directly related to the sulphur content in the oil burned,implying that the SO2 concentration in the exhaust gas can be calculated if the fuel compo-sition is known. As for NOX , SO2 may be reduced in two ways; on the input side by using
1.1 Continuous Emission Monitoring 9
low sulphur fuel, or by aftertreatment of the exhaust gas which can effectively be cleanedfrom SOX by rinsing the exhaust gas with water which converts the SOX into sulphuric acid.
NH3
In order to reduce NOX, catalytic after-treatment equipment is used to convert NOX tonitrogen and water by supplying NH3 usually in the form of a water solution of urea whichis sprayed into the exhaust gas where it decomposes into NH3. However, this entails the riskof emitting the corrosive and toxic NH3 in the case of non-ideal catalytic reaction or excesssupply of NH3 in transient stages. This is highly undesired and has led to a request forammonia exhaust gas sensors, although IMO has not yet set any limits for ammonia leakagefrom ships [13].
CO2
CO2 is a major compound when burning fossil fuels and probably the best known envi-ronmental concern. CO2 measurements are also strongly demanded in exhaust gas measure-ments, although not for their environmental influence but as a continuous input for enginecontrol as well as a tracker of the dilution of exhaust gas in SO2 measurements where theratio SO2/CO2 is required by authorities to prove that the sulphur content of the oil is belowlegal limits. Another application that demands fast CO2 sensors is exhaust gas recircula-tion (EGR) which utilises that the production of NOX can be reduced by decreasing theoxygen level in the intake air. In EGR this is achieved by mixing fresh air which has aconstant oxygen content with exhaust gas which have a very low oxygen concentration anduse this mixture as intake air [14]. Since CO2 is more easily measured in marine exhaustgas compared to oxygen, fast CO2 measurements are used to provide continuous feedbackon the EGR ratio, i.e., relative amount of recirculated exhaust gas in the intake air [15]. ForEGR applications the CO2 sensor must operate at pressures up to 6 bar. CO2 absorption athigh pressures is the topic of Chapter 5.
Challenges in Marine Diesel Exhaust Gas MeasurementsExhaust gas from ship engines is hot, humid and chemically aggressive. The exhaust
gas temperature may reach 500 ◦C for low and medium speed engines which are standardin shipping industry. In return the pressure requirements are relaxed as the pressure inthe exhaust pipe is close to ambient, although for EGR applications, CO2 measurementsat pressures up to 6 bar are required. On-board marine exhaust gas measurements differsignificantly from landbased power plant measurements in several aspects, including vibra-tions, fuel type, fuel supply homogeneity, load dynamics, available space, as well as shiftingpersonnel. While a power plant usually acquire fuel from a single source, the fuel supplyon a ship may vary significantly in composition as the fuel is provided by several differentsources across continents. A power plant is run under very stationary conditions while aship has many starts and stops and the acceleration phase is connected with increased pro-duction of harsh components which challenges the durability of an exhaust gas sensor. Inaddition the high sulphur fuel makes the exhaust gas more sticky and corrosive compared
10 Introduction
to automotive exhaust gas [16, 17] inferring that the sensor must be significantly more re-sistant to the chemical environment or must be replaced rapidly. Space availability in theengine room of a ship is of tremendous concern for both after-treatment systems as well asemission monitoring equipment, particularly for the existing ships which are not designedto accommodate this sort of auxiliary apparatus. Landbased emission gas sensors are notsubject to similar dimensional issues and are often very large. A further difference is thatthe environment on the ship is strongly vibrating; a sensor that is mounted on the exhaustpipe must be tested to withstand up to 4 g of vibration [18]. This is a serious problem formany optical systems that rely on optical alignment across the exhaust pipe.
Exhaust Gas Composition
When the fuel content varies, the exhaust gas composition varies accordingly. Withthe fuel mainly consisting of long hydrocarbon (HC) chains, the exhaust gas will containapproximately equal levels of the two major emission gases H2O and CO2 with their actualconcentrations depending on the air-fuel ratio. The sulphur content in the fuel is convertedinto SOX while the emission of NOX, CO, and HC depends on engine parameters. Figure 1.2shows typical marine diesel exhaust gas compositions from MAN two-stroke engines as of2004 [19].
Figure 1.2: Typical exhaust gas composition from marine diesel engines based on typicalfuel content, air-fuel ratio, and lubricant [19]. Note that minor constituents are not included.
Newer engines, however, have reduced NOX emissions in order to comply with IMOregulations. In a project guide from 2013, MAN gives an H2O exhaust gas concentrationrange of 5.9 to 8.6 % volume mixing ratio (VMR) while the NOX concentration is stated tobe in the range 700 to 1000 ppm [20].
For the purpose of the NOX sensor development behind this PhD work, the NOX con-centration range was set to 0-1200 ppm and the upper water vapour content used to evaluate
1.2 NDIR Exhaust Gas Measurements 11
cross sensitivity to humidity was considered to be 8 %VMR. To comply with the Marpolregulations, drift in the measurements must be below 2% of full scale [21], which for thechosen range equals 24 ppm. In this work the NO and NO2 are measured independentlywhich means that each of the measurements should be stable within 12 ppm. The crosssensitivity to water vapour should thus be well below this value.
State-of-The-Art in On-Board NOX Emission MonitoringMethods for NOX detection in exhaust gas include chemiluminescence, electrochemical
cells, Fourier transform infrared (FTIR) spectroscopy, and non-dispersive infrared (NDIR)spectroscopy [22], while ultraviolet (UV) spectroscopy has recently been added [23]. How-ever, for marine exhaust gas applications all of these have serious drawbacks. The chemi-luminescent and electrochemical cell methods are troubled by the requirement of physicalcontact between the sensing element and the harsh exhaust gas. For this reason existing ma-rine exhaust gas sensors extract and condition the gas and this includes drying and coolingbefore measurement. This is not desirable since it adds uncertainties to the measurementas the exhaust gas undergoes chemical transitions in the conditioning process. Further, itimplies additional equipment and maintainance. Nonetheless, extractive dry-based chemi-luminescence is currently the preferred technique for NOX measurements in marine exhaustgas in compliance with the Marpol convention [21]. In automotive exhaust gas sensing, in-expensive in-situ electrochemical Zirconium sensors have become standard equipment butthe adaptation to marine exhaust gas is troubled by premature ageing of the sensor in theharsh exhaust gas [24, 25].
Optical methods have a great advantage in harsh environments since the sensing elementdoes not require physical contact with the target gas. However, optical methods are usuallyextremely sensitive to alignment and FTIR spectroscopy further relies on moving mirrorswhich suffer under strong vibrations. NDIR spectroscopy is robust toward vibrations com-pared to other optical sensors owing to its very simple construction. In return, NDIR haspoor spectral resolution which makes water interference a major problem in moist exhaustgas measurements of NOX, SO2 and NH3. UV spectroscopy is an interesting alternative butfaces strong absorption and scattering by soot and particles, as well as short lifetimes of UVsources [26].
1.2 NDIR Exhaust Gas MeasurementsThis PhD study aims at solving the water interference impediment for the use of NDIR
spectroscopy in on-board exhaust gas measurements of NOX, SO2, and NH3. NDIR is asimple optical measurement technique that has been used extensively for gas sensing overmany years [27]. In contrast to chemical sensors, NDIR shares the important advantagewith other optical methods of being non-intrusive, i.e., the sensing element does not requirephysical contact with the chemically aggressive, hot and humid exhaust gas.
The name non-dispersive refers to the omission of a dispersive element in the sensorsuch as a grating or a prism used in other spectroscopic devices. Instead, the wavelengthselection is provided by one or more optical filters. A simple NDIR setup is sketched in
12 Introduction
Source Gas Filter Detector
Figure 1.3: Basic NDIR setup. The basic components of an NDIR sensor are a broadbandIR source, an optical bandpass filter, and an IR detector.
Figure 1.3. The basic elements of an NDIR sensor are a broadband IR source, an opticalfilter, and an IR detector. The IR source emits infrared radiation which travels trough themeasurement gas in which the molecules absorb radiation of specific wavelengths. Beforereaching the detector where the infrared light is converted to an electric signal, the radiationpasses through an optical filter selecting a wavelength range covering absorption lines of thegas that is to be measured. The electrical signal then reflects the concentration of the targetgas species.
NDIR sensors come in a number of variations. Usually, a reference measurement isrequired to compensate for drifts, e.g. in source intensity, which might be achieved by areference measurement chamber filled with an infrared neutral gas or by an optical filterwhich selects a wavelength region without gas absorption. The main reason for using op-tical filters for the wavelength selection is that the mid-infrared region suffers from noisydetectors and low-efficiency emitters [28] which imply that the signal to noise ratio doesnot allow the intensity to be divided over an array of detectors as is common in the visiblerange were silicon CCDs offer highly sensitive and inexpensive detector arrays. In return,the strong absorption lines in the mid-IR region allow short active pathlengths. In contrast,in the working range of the silicon CCDs, the gas absorption strengths are orders of magni-tudes lower which means that gas sensors in this range usually rely on multiple reflectionsto reach pathlengths of several meters, which is hardly compatible with measurements inharsh exhaust. In the highly vibrating environment NDIR distinguishes itself from other op-tical methods because alignment sensitivity is mitigated by the omission of lasers, multiplereflections, and moving parts. The simple design of NDIR further makes it an inexpensivealternative to other optical gas sensing systems. The drawbacks, on the other hand, are theweak signal to noise ratio and poor discrimination between gases with closely separated oroverlapping absorption lines. In hot exhaust gas measurement, NDIR further faces substan-tial amounts of background radiation emitted from all hot surfaces as well as from the gasitself.
Water Vapour Interference
While NDIR is commonly applied in exhaust gas emission sensing of CO2 and CO, theNDIR measurement of NO, NO2 , SO2 and NH3 are all troubled by water interference. Inparticular, for NDIR NOX measurements in moist exhaust gas, the difficulty in separating
1.2 NDIR Exhaust Gas Measurements 13
the desired emission gases from water vapour because of overlapping absorption lines meansthat NDIR is presently limited to dry gas measurements of NOX [29].
Figure 1.4: Absorption cross sections of NO, NO2 and H2O. The cross section of watervapour has been scaled by a factor of 50 to account for the higher water concentration in theexhaust gas.
Figure 1.4 shows the absorption cross sections of NO, NO2 and SO2 together with H2Owhich for visualisation purposes has been multiplied by a factor of 50 to indicate the largepresence of water vapour, which typically constitutes 5% VMR of the exhaust gas (= 50000ppm). In comparison, the NO, NO2, and SO2 concentrations are usually below 1000 ppm.
State-of-the-art of Water Discrimination in NDIR SpectroscopyThe approach of distinguishing NO from water vapour by careful optical filter design has
been undertaken previously in [30] where two NO lines with minimum H2O interferencewere selected using a very narrow optical filter. The obvious drawback of this approachwhich is also stated in the paper, is that two NO lines gives a very low signal comparedto the typical broadband filters used in NDIR, considering that the NO band (around 1900cm−1) contains several hundreds of major absorption lines. Another interesting approachto compensate for interferences is the concept of negative gas filtering [31] where a gastight cell containing the target gas is inserted in front of a reference channel, which is away to effectively select the wavelengths at which the target gas absorbs. While this istheoretically elegant, it is not a simple mechanical task to construct a small gas tight andtransparent cell and positioning it in front of a reference channel. Furthermore, the conceptdoes not apply well to measurements in hot gas because for the absorption spectra of the gasfilter cell and exhaust gas to match, equal pressure and temperature is required, and this canbe very difficult to obtain under all possible circumstances. If the absorption spectra do notmatch it will lead to a complex dependence on the interfering H2O with varying temperatureand pressure. Thus, both from a mechanical and signal processing perspective, it would bepreferable to avoid a gas filter cell.
14 Introduction
In a predominantly theoretical study from 2011 [32] the authors claims to have elimi-nated the interfering effect of water vapour in an NDIR multigas measurement of CO, NO,NO2 CO2, SO2, and H2O, using a filter wheel with seven bandpass filters together with lin-ear regression. The paper leaves some open questions about the amount of water vapourthat has been used in their verifications measurements. Half a year later, the same authorsreport experimental results with simultaneous NDIR measurements of CO2 CO and NO ina similar setup but in this paper only cross-sensitivities between the three target gases arecorrected while H2O is not mentioned [33].
CHAPTER 2
Quantitative Infrared AbsorptionSpectroscopy
The work in this PhD study stands on the shoulders of decades of computational andexperimental efforts to construct spectral databases containing fundamental infrared ab-sorption lines for various common gas molecules. Without the quantitative spectroscopicknowledge available through the databases, the ambitious optical filter setup optimisation inSection 3.3 would not be meaningful. With these databases at hand, spectroscopic simula-tions can be undertaken without particular knowledge about molecular absorption principles.However, some appreciation of the underlying physical phenomena is appropriate, as well asan understanding of the extensive work required to improve and expand the databases. Thischapter provides a short description of the physical principle behind the infrared absorp-tion spectrum, as well as a brief outline of the complex quantitative quantum mechanicalcalculations involved in the database development.
2.1 Physical Principle of Molecular AbsorptionMolecules are able to absorb electromagnetic radiation and convert it into molecular ro-
tation, molecular vibrations, electronic transitions or a superposition hereof. Only radiationwith photon energy that matches possible energy transitions of the molecules are absorbed.The energy states of a molecule are unique to that molecule and therefore the transition spec-trum can be used to determine which molecules are present in a volume of gas. The atomsin a molecule are being held together by attractive forces. However, if the atoms cometoo close to each other they become subject to strong repulsive forces. These counteract-ing forces constitute a potential energy distribution in the molecule wich reaches a minimumvalue at a certain inter-atomic separation. Figure 2.1 shows an energy diagram for a diatomicmolecule where the potential energy is shown as a function of the distance between the twoatoms constituting the molecule, the lower curve representing the electronic ground stateand the upper curve the first excited electronic state. In each electronic state there is a cer-tain inter nuclei distance which minimises the potential energy and the molecule is vibratingaround this optimum. Heisenberg’s uncertainty principle prevents the molecule from restingat the optimum. There exist a number of different ways for a molecule to vibrate, whichare referred to as vibrational states, each of which requires a certain vibrational or kinetic
16 Quantitative Infrared Absorption Spectroscopy
Dissociationxenergy
Ene
rgy
Internuclearxseparationx(r)
νx=x0
νx=x1νx=x2νx=x3νx=x4
νx=x5
ν'x=x0
ν'x=x1ν'x=x2
ν'x=x3
Groundxstate
Firstxexcitedxelectronicxstate
Vibrationaltransition
Electronictransition
Rotationalxtransitions
Figure 2.1: Energy diagram showing potential energy curves versus internuclear separationfor a diatomic molecule.
energy. The vibrational energy states are indicated in Figure 2.1 along with arows indicatingthat the molecule can make transitions between different vibrational energy states by absorp-tion of a photon with a photon energy corresponding to the energy difference. Absorption ofinfrared radiation is associated with transitions between vibrational energy states. However,these transitions normally involve simultaneous transitions between rotational states, whichleads to fine-structured absorption spectra.
2.2 Spectral DatabasesCalculation of the energy states in a molecule is computationally heavy. First the poten-
tial energy function must be calculated which is already complicated for a diatomic moleculewith drastic increase in complexity for larger molecules [34]. When the potential functionis established, it is used as input to the time independent Schrödinger equation;
EΨ(r) =[−~2
2µ ∇2 + V (r)
]Ψ(r) (2.1)
where V (r) is the potential energy as a function of the inter-nuclei separation, and the op-erator −~
2
2µ ∇2 represents the kinetic energy of the molecule. For more complex molecules
than the diatomic case, the potential energy curve is three dimensional. The solution to theSchrödinger equation gives the energy levels (E) of the molecule as well as the three di-mensional wavefunctions (Ψ(r)), which describe the probability of finding the atoms of themolecule in a given distance from each other. The transition probability between the energy
2.3 The Measured Absorption Spectrum 17
states is proportional to the overlap of the corresponding wavefunctions which determinehow likely the molecule is to absorb a photon with a matching photon energy. This parame-ter is called the integrated line intensity and is stored in the spectroscopic databases togetherwith line broadening information. The absorption lines are broadened by three mechanisms;natural broadening which is a consequence of Heisenbergs uncertainty preventing the en-ergy level of a molecule to be precisely determined, Doppler broadening which is causedby thermal motion of the atoms, and pressure broadening induced by colliding molecules.However, the calculation of line intensities requires empirical input, which is used to adjustthe potential energy curves of the molecule to obtain correspondence between the calculatedtransition spectrum and experimental data.
2.3 The Measured Absorption SpectrumGetting from the databases to the absorption spectrum requires the calculation of the ab-
sorption cross section (σλ) which determines the probability of light absorption as a functionof wavelength (λ) for a given concentration, temperature, and pressure. Calculation of σλfrom the line intensities and broadening information provided by the databases is relativelystraightforward but computationally very heavy and often forces certain simplifications tobe made which may lead to inaccuracies in the resulting calculated absorption spectrum.There exist commercial and non-commercial software that offers the calculations of absorp-tion cross sections. In this PhD-study I have relied on SpectralCalc.com [35] to provide mewith absorption cross sections for the spectral simulations presented in Chapter 3.
When the absorption cross section is determined the transmission (τ ) through a gas caneasily be calculated by Beer-Lambert’s law;
τ(λ) = exp(−σλNL) (2.2)
where L is the optical pathlength, i.e. the length of the path that the light travels through thegas, and N is the number concentration of the gas.
CHAPTER 3
In-Optics Humidity Compensation
Spectral interference between emission gases and water vapour in NDIR exhaust gasmeasurements is the general focus of the present PhD study and the topic of this chapter. Thespectral separation in NDIR relies on optical filters. However, these have certain fabricationtolerances which challenge the desired discriminating abilities. This chapter presents theattempt to find an optical filter setup which enables NDIR NOX measurements in moistexhaust gas.
The chapter begins by introducing the NDIR measurement setup, and discusses each partof the optical system with emphasis on spectral dependencies (Section 3.1). The conceptof in-optics humidity compensation is then described mathematically in Section 3.2. Theprocedure undertaken for determining the best filter setup is explained in Section 3.3. Aset of manufactured filters for NO2 measurements is presented and evaluated in Section 3.4,while the learnings from the development process are summarised and the next generationfilter optimisation procedure laid out by the end of the chapter.
3.1 Sensor SystemChoosing the best optical filter setup is dependent on the total optical system since each
component have spectral characteristics that affect the relative response to the absorbinggases. Every part of the optical system should therefore be spectrally characterised an incor-porated in the filter optimisation procedure. However, since the development of the overallsensor system took place concurrently with the filter optimisation, this could not be fullyaccomplished, and the simulations had to be based on expectations.
The simultaneous development of two interdependent parts of the sensor entailed therisk that the filter optimisation would need to be repeated at a later stage, but in return,it provided the possibility to deliver feedback to the system development along with thegrowing appreciation of the critical and less critical factors within optical bandpass filters.As an example, one open question in the beginning of the project was whether the tightprecision requirements to the optical filters would counter-demand a narrow incident angle.
The NDIR sensor system that forms the basis for the spectroscopic simulations in thischapter, is sketched in Figure 3.1, and in the following the basic components of the systemare discussed with focus on their influence on and interaction with the optical filter optimi-sation.
20 In-Optics Humidity Compensation
Emitter withreflector
Quad detector with filters (side) (front)
Gas inlet
Gas outlet
Microstructuredwindows
Lens
Figure 3.1: NDIR sensor setup comprising an infrared source, a measurement chamber, andan infrared detector. The source and detector are seperated from the harsh exhaust gas bymicrostructured optical windows, and a lens is collecting the radiation from the emitter. Thedetector is a quad channel thermopile detector with an individual optical filter attached uponeach channel.
Measurement Chamber
The measurement chamber contains the hot exhaust gas which is continuously flowingthrough. Prior to entering the measurement chamber, the exhaust gas has been mechanicallyfiltered to remove large particles. However, no additional gas conditioning takes place.The exhaust gas is between 200 ◦C and 500 ◦C and contains 4 % to 8 % volume mixingratio (VMR) of water vapour, while the pressure is close to atmospheric pressure. Thelength of the measurement chamber is important as it influences the filter optimum becausea long pathlength infers that strong absorption lines are saturated, increasing the impact ofweaker absorption lines. A long pathlength is prefered to increase the absorption signaland thereby reduce various cross sensitivities to other optical variations, e.g. changes inthe source temperature. However, within the framework of the HTF project, the longestdimension of the sensor was not to exceed 40 cm. Since this included room for emitterand detector as well as thermal decoupling between these and the measurement chamber,the spectroscopic simulations in this chapter are based on a pathlength of 25 cm. Althoughthe gas is mechanically filtered sub-micron particles are still present and soot is expected tobuild up on surfaces including the windows that are providing optical access to the exhaustgas.
Soot
Soot is a mass of fine carbon particles that are produced in incomplete combustion ofhydrocarbons. A thin soot layer is opaque to visible light but mid-infrared radiation is able topenetrate, which is one of the great advantages in infrared exhaust gas measurements. Figure3.2 shows the result of a transmission measurement that I made on two ZnSe windows thathad been placed inside a burner in relation to an otherwise unrelated project. One of thewindows were completely black as shown in the inset and the soot layer would have killedany spectroscopic measurement in the visible region. However, in the range of interest for
3.1 Sensor System 21
Figure 3.2: Measured transmission of soot layers on ZnSe substrates originating from aburner test in an otherwise unrelated project. The measurements were done in an ambi-ent environment and therefore CO2 and H2O signatures are seen in the spectrum at longwavelengths. The transmission increases drastically with increasing wavelength. The win-dows were kindly made available by Sønnik Clausen, DTU Chemical Engineering, OpticalDiagnostics group.
the mid-infrared NOX measurements, which is indicated by a grey rectangle, the soot layertransmits about 85 % of the light. The noise at long wavelengths are caused by ambientH2O and CO2 present during the measurement, and thus the measurements do not provideinformation about possible narrow spectral features.
In [37], a study of pure carbon soot reported no features between 3.4 µm and 7.9 µm.However, soot is not just soot and in [38], the combustion of heavy fuel oil were found toresult in soot aggregates containing alkali earth metals (V, Ni, Ca, Fe), and another study ondiesel exhaust soot reported characteristic peaks in the 5-7 µm range [36] (Figure 3.3).
The indication of narrow spectral features in the soot aggregate means that soot mightbe a serious issue for the NDIR NOX sensor and that soot on the optical windows should beminimized.
Self-Cleaning Windows
Acknowledging that soot formation on the optical windows is a critical concern in thedevelopment of the NDIR exhaust gas NOX sensor, this subject was an independent and ma-jor part of the HTF project. DTU Nanotech was given the task to develop micro-structuredoptical windows with self-cleaning properties in exhaust gas from ships at temperaturesup to 500 ◦C. Since this work was still in an early phase when the spectral simulations inthis chapter were conducted, and the final transmission of the windows were completelyunknown, they were not included. However, later in the project DTU Nanotech was ableto present a breakthrough [39] and provide me with spectral measurements of promisingwindow candidates, which were included in numerical evaluation of the manufactured NO2filters presented in Section 3.4.
22 In-Optics Humidity Compensation
Figure 3.3: Soot spectrum in diesel exhaust and in a diesel engine showing narrow spectralfeatures. Reprinted from [36].
.
Infrared Source
Modulation of the source intensity is crucial in NDIR spectroscopy at elevated temper-atures in order to eliminate background radiation from hot surfaces as well as from the gasitself as explained mathematically in Section 3.2.
Since any moving parts are strongly undesired in the vibrating environment, electroni-cally modulatable infrared emitters are required. A variety of fast electronically controlledemitters are commercially available. All of them provides significantly less intensity com-pared to a high temperature solid emitter, which cannot be electronically modulated at asufficient rate. The lower intensity is to some extent compensated by the ability to producenear sinusoidal intensity curves, which makes noise reduction in the signal processing moreefficient.
However, it is not straightforward to choose which commercial emitter to employ, eventhough the emitted power is easily calculated from the surface temperature, area, and emis-sivity. Mostly, the accompanying datasheets specify all of these important values but omitinformation about the wavelength dependence of the emissivity. For this reason I carried outa series of experimental spectral characterisations of six different commercial electronicallymodulatable emitters, the result of which is given in Figure 3.4 where the apparent emissiv-ity is shown as a function of wavenumber for each of the six emitters. It was not possible todetermine the precise emissivity value since the temperature of the tiny, fragile emitting sur-faces could not be accurately measured and assumptions of a maximum emissivity of 0.95were used to obtain the apparent emissivities for four of the emitters, while for two emit-ters that had low emissivities, partwise gray-body assumptions were used. Note that a lowemissivity does not necessarily mean that the intensity is low since this depends on surfacetemperature and area as well. However, the apparent emissivities in Figure 3.4 demonstratesignificant spectral dependencies and differences between the various emitters. Over therange of interest for the NDIR NOX sensor only one emitter exhibits a flat high emissiv-
3.1 Sensor System 23
Figure 3.4: Apparent emissivity measured for a number of commercially available emittersamples.
ity. This emitter, the Leister EMIRS200, was therefore selected for the first prototype andassumed in the filter setup simulations.
Infrared Detector
Infrared detectors for the wavelength range 4-7 µm operating at room temperature andabove are very limited in numbers compared to shorter wavelength detectors. However, therehas been rapid progress in the field within the later years [40] also for non-cooled operation,and a recently reported non-cooled InSb detector, sensitive in the range 2-7 µm [41] is likelyto be employed in future NDIR sensors. For the present sensor development a thermopiledetector was selected because of its robustness, reliability, and good cost/performance ratio,and not least because of its flat sensitivity over the wavelength range, in contrast to thehighly wavelength sensitive photodetectors. The thermopile can further be used in a non-temperature-controlled environment up to about 70 ◦C. The thermopile chosen for the firstprototype is a quad-thermopile detector with four absorbers placed on a common referenceplate ensuring high uniformity between the detector channels. An optical filter is placed infront of each detector, two of which are to be used for the target gas measurement and thetwo others are needed for measuring the H2O concentration required for compensation ofthe residual water vapour signal.
The small optical filters are glued on top of the detector channels by the detector manu-facturer. For the chosen detector each filter must be 0.5 mm thin and 2 mm x 2 mm wide.Customised filters are expensive and the small sizes helps keeping the cost down of a singlefilter. In return, it puts high demands on the filter dicing quality.
24 In-Optics Humidity Compensation
Thermal Decoupling and Waveguiding
The detector and emitter need to be thermally decoupled from the up to 500 ◦C hotexhaust gas. Thus, they are placed in some distance from the measurement chamber. Thefurther away they need to be placed, the more intensity is lost. However, on the detectorside this is partly compensated by a decrease in the thermal noise. The atmosphere betweenthe optical windows and the detector and emitter must be infrared inactive in the wavelengthrange of interest. This might be ensured by nitrogen-filled gas-tight compartments whileit is also possible to flush the optically inactive part with dry pressurised air. The thermaldecoupling arrangement takes up space and increases intensity losses, but it has the onebenefit that the extra space can be utilised to insert collimating optics in order to maximisethe intensity throughput. The choice of optics is important for the optical filter setup fortwo reasons; the bandpass profiles of optical filters depend on the angle of incident, and theoptical material inserted in the path may provide long wavelength blocking which relaxesthe requirements to the optical filter. Magnesium flouride, MgF2, is a good choice of lensmaterial since it provides high transmission above 1800 cm−1 and blocks all light below 900cm−1. It is further insensitive to temperature changes. Thus, in the filter optimisation it isassumed that one 5 mm thick MgF2 lens is inserted somewhere between the emitter and thedetector.
Electronics and Signal Processing
The limitations in the detector sensitivity and emitter performance in the mid-infraredregion, imply that high performance electronics and advanced signal processing algorithmsare essential. Work on this side also took place within the HTF project concurrently withthe optical filter optimisation.
3.2 Measurement PrincipleThis section describes the measurement principle behind the NDIR NOX sensor includ-
ing the concept of in-optics humidity compensation. The starting point is Beer-Lambert’slaw which relates the transmission of light through a volume of gas to the number density(N ) of molecules in the gas;
τν = IνI0ν
= exp(−σνLN) (3.1)
I0ν and Iν are the intensities of the ingoing light and the transmitted light, respectively. L
is the length of the path of radiation through the gas, and σν is the absorption cross sectionof the gas. The subscript ν = 1
λis the wavenumber which indicates that the variables with
this subscript are wavelength dependent.If more than one species of gas molecules are present in the gas volume, the transmission
is given by;
τν = IνI0ν
= exp−∑
gasσgasν LN gas
=∏gas
exp(−σgasν LN gas) (3.2)
3.2 Measurement Principle 25
where∑
gas and∏
gas covers all constituents of the gas.The detector used in the sensor, is a so called thermopile detector which in essence works
by measuring the difference in temperature between an absorber and a reference chip. Thetemperature difference is converted into a voltage through a series of thermocouplers and thisis proportional to the difference in incident and outgoing radiation intensity on the detectorchannel, u = s(I in − Iout), where s is the detector sensitivity and the outgoing radiation isthe thermal radiation from the detector itself and thus depending on its own temperature.The detector acts as an integrator over the spectral distribution of intensity;
u =∫ ∞
0dν sν (I in
ν − Ioutν ) (3.3)
The intensity incident on the detector I inν originates either from the controlled IR source
(I0ν ), from radiation from all other surfaces in the optical path (Background radiation), hot
particles in the exhaust gas, or from the gas molecules themselves. Gathering all othercontributions than the one from the IR source in a common background term (IBG
ν ), theincident radiation can be expressed as;
I inν = τ optics
ν τ filterν I source
ν
∏gas
exp(−σgasν LN gas) + IBG
ν (3.4)
where I0ν has been replaced by the product τ optics
ν τ filterν I source
ν to account for the transmissionthrough the optical filters
(τ filterν
)as well as the additional optics
(τ opticsν
).
Inserting equation (3.4) into (3.3) gives;
u =∫ ∞
0dν sντ optics
ν τ filterν I source
ν
∏gas
exp(−σgasν L N gas) + UBG
IR-Filter (3.5)
where IBGν and Iout
ν have been combined in a common background term;
UBGIR-Filter =
∫ ∞0
dν sν(IBGν − Iout
ν )
Assuming the optical filter to be a perfect bandpass filter that allows all frequencieswithin a range ν1 − ν2 to pass, while all other frequencies are blocked, and consideringI sourceν , τ optics
ν , and sν to be constant within in this range, equation (3.5) can be rewritten into:
u = sIR-filter IsourceIR-filter T
opticsIR-filter
∫ ν2
ν1dν∏gas
exp(−σgasν L N gas) + UBG
IR-Filter
which is the voltage measured by one channel on the detector, equipped with a specificbandpass filter. In order to derive the desired gas concentration from the measured voltage,all the other unknowns in the equation has to be handled. The complex background termcan be conveniently eliminated by the well-established method of modulating the sourceintensity, and the optical factors can be determined by calibration. Drifts in source intensityand transmission properties through the optical system over time can be compensated to agreat extent by measuring a reference voltage with a reference channel that is equipped witha properly chosen reference bandpass filter. Finally, a proper choice of optical filters areused to reduce sensitivities to other present gas species than the target gas.
26 In-Optics Humidity Compensation
Source Modulation
Modulation of the source intensity can be expressed mathematically as
I sourceIR-filter(t) = I0
IR-filter [mS sin(ωS t+ φS) + µS] (3.6)
where mS is the modulation depth, µS is the DC-offset or the mean value of the intensity, ωS
is the angular frequency, and φS is the phase.The measured voltage is now time dependent:
u(t) = sIR-filterI0IR-filter [mS sin(ωSt+ φs) + µS] T optics
IR-filter
∫ ν2
ν1dν∏gas
exp(−σgasν L N gas)
+UBGIR-filter
(3.7)
Fourier transforming this time signal results in a peak at the ωS frequency with amplitudeAωs
IR-filter;
AωsIR-filter = sIR-filterI
0IR-filter ms I
sourceIR-filter T
opticsIR-filter
∫ ν2
ν1dν∏gas
exp(−σgasν L N gas) (3.8)
which is independent of the background contribution. In practice a pure sinusoidal sourceintensity is difficult to realise and some overtones will also be present, and the amplitude ofthe peak at ωS is reduced accordingly.
Reference Channel
To compensate for changes in the measured voltage, not related to gas absorption, anadditional detector channel, equipped with a proper optical filter may be used to acquire areference voltage with similar optical dependencies as the suspect channel. Taking the ratiobetween the ωS frequency component of both suspect and reference channel results in;
R = Aωssus
Aωsref
= ssusI0sus T
opticssus
srefI0ref T
opticsref︸ ︷︷ ︸
Calibration parameter,β
∫ νsus2
νsus1
dν∏gas exp(−σgasν L N gas)∫ νref
2νref
1dν∏gas exp(−σgas
ν L N gas)︸ ︷︷ ︸Function of gas concentrations, f(N1,N2,..)
(3.9)
which shows that the ratio of the voltage amplitudes (R) can be described as the product of aterm (β) that contains all setup-related variables, and a function (f ) of the gas composition.Thus, R has the advantage of being immune to any changes that are equally affecting boththe suspect and the reference channel, e.g. a uniform intensity change.
Interfering Gases
It is up to the optical filters to assure that f is sensitive to the gas of interest, in this caseNOX , and insensitive to other gas components. For water vapour which overlaps spectrallywith both NO and NO2 and therefore cannot be cut out by the optical filters, the sensitivity
3.3 Filter Optimisation Routine 27
may instead be minimised by ensuring that the response to water vapour is similar in thesuspect and reference measurement.
To illustrate the concept, the wavelength dependent absorption cross section is approx-imated by an average value over the optical filter range (σgas
filter). This approximation, whichis only valid for weak absorptions, makes the integral in equation (3.9) disappear since∫dν exp(−σgas
filter) = ∆νfilter exp(−σgasfilter), and allows f to be written in a simplified form;
f = ∆νsus
∆νref
exp(−σNO2sus L N
NO2) exp(−σH2Osus L N
H2O)exp(−σNO2
ref L NNO2) exp(−σH2Oref L NH2O)
(3.10)
for the case where NO2 and H2O are the only abundant gases, absorbing in the selectedspectral range. Equation (3.10) provides the logical result that the water vapour signal can-cels out if a filter setup is chosen such that the average H2O absorption in the two filterranges are equal, i.e., σH2O
sus = σH2Oref , while the sensitivity to NO2 is improved by maximising
σNO2sus − σ
NO2ref .
3.3 Filter Optimisation RoutineThe overall purpose of the filter optimisation is to find the bandpass transmission pro-
files that maximises the sensitivity of the target emission gas while minimizing all otherinfluences, in particular that of water vapour absorption.
Equation (3.9) is a nice illustration of the purpose of calculating the ratio of the volt-age amplitudes (R). However, to reach it, a number of assumptions were necessary. Incontrast, numerical calculations posses no need to assume rectangular filters or spectrallyuniform source intensity, window transmission, or detector sensitivity. Any known spectraldependence may be properly calculated inside the integral before the ratio is found;
R =∫∞
0 dν sν ∆I0ν τ
optics(ν) τ filtersus (ν)∏gas exp(−σgas
ν L N gas)∫∞0 dν sν ∆I0
ν τoptics(ν) τ filter
ref (ν)∏gas exp(−σgasν L N gas) (3.11)
where msI0ν has been replaced by ∆I0
ν = I0(T Shot, ν)− I0(T S
cold, ν) to account for the wave-length dependence of the source modulation as the spectral radiation changes with temper-ature.
The only limiting factor in the numerical calculation of R is how well the total system isknown. Accurate simulations require knowledge of the spectral distribution of the IR-sourceintensity and detector absorptivity, as well as spectral transmission through the waveguidingoptics, the microstructured optical windows, soot, particles, and other absorbing gas con-stituents present in the exhaust gas. Moreover, the dependencies of the spectral distributionsas a function of temperature, ageing, or other conditions, are important in order to deter-mine the stability of the measurement. Of these, the spectral radiation of the emitter wasmeasured by my self, and the spectral absorptivity was measured by the supplier. However,a completely accurate spectral characterisation is difficult to realise and some uncertaintieshas to be accepted in the filter optimisation.
Having established the numerical expression for R and inserted all available spectralinformation, the figure to optimise is the sensitivity to the target gas over the sensitivity to
28 In-Optics Humidity Compensation
H2O;
χ =∣∣∣∣∣
∂R∂Ngas
∂R∂NH2O
∣∣∣∣∣ (3.12)
The are several other sensitivities to minimise, including the sensitivity to changes in the gastemperature, source drift, temperature induced transmission changes in the optical windows,and cross sensitivities to other interfering gases in the exhaust gas, such as formaldehyde(H2CO). Further, the absolute absorption of the target gas should be maximised to increasethe signal to noise ratio. However, because water vapour interference is the most criticalparameter, χ is the prime figure to optimise. If there exist more filter setups that yields sat-isfactory χ values, these may subsequently be evaluated with respect to the other concerns.
Modelling the Optical Filters
Essential in the filter setup optimisation is the description of the optical filter and itstolerances. A fully identifying description of a bandpass profile is relatively comprehensiveand requires a number of parameters to be specified. A bandpass filter may be characterisedby the position of the two edges, e.g., the wavenumber position at which the transmissionequals 50 % of the maximum bandpass transmission, the slopes of the edges, the flatness ofthe passband transmission which is often subject to ripples, and the rejection level outsidethe bandpass (out-of-band blocking), as well as the blocking range. The first two parameters,i.e. the edge positions, are simple to implement and vary in a filter optimisation routine.In practise the edge position can be varied continuously and independently of the otherbandpass characteristics. However, they are subject to position tolerances.
Typical specified tolerances on edge positions for customised optical filters are 0.5-1 %of the specified wavenumber, corresponding to 8-16 cm−1 at 1600 cm−1, a spectral intervalwhich is likely to contain several absorption lines. The impact of the edge position tolerancesis visualised in Figure 3.5 where two manufactured optical filters are shown with 0.5 %edge displacements indicated. The filters are shown together with calculated absorptionspectra for NO, NO2, and H2O for a 350 ◦C hot gas at 1 atm and for a pathlength of 25 cm.Figure 3.5 also shows absorption spectra for two other interfering gases; SO2 and H2CO,which are present in exhaust gas. Thus, manufacturing tolerances are of critical importancewhen designing optical filters aiming to spectrally discriminate between closely spaced oroverlapping absorption lines.
The slopes of the edges may be varied independently for wide bandpass filters, or as acommon parameter for narrow bandpass filters, the distinction between which is covered inChapter 4. However, the slopes cannot be varied without consequences for the passbandtransmission. Steep edges requires more thin film layers which causes more ripples in thepassband. Figure 3.5 shows that a filter for NO2 measurement which is required not tooverlap with SO2 will benefit from a steep long wave edge in that the 50 % edge position maybe placed closer to the SO2 band compared to if the edge was less steep. However, when itcomes to humidity balancing and the position tolerances are taken into account, steep edgesare more sensitive to wavenumber displacements compared to more gentle edges. Thus, itmakes sense to include the slopes as parameters in the optimisation and not just aiming forthe steepest. Flatness criteria are commonly specified by a certain percentage of the average
3.3 Filter Optimisation Routine 29
Figure 3.5: Measured transmission profiles of manufactured optical filters (solid blackcurves) with edge-position tolerances of 0.5 % of wavenumber indicated (stipulated blackcurves) shown together with calculated absorption of NO, NO2, SO2, H2CO, and watervapour for possible concentrations in 350 ◦C hot exhaust gas at 1 atm and a pathlength of25 cm. The simulations were performed using SpectralCalc [35] and HITRAN2008 [42].
passband transmission that the transmission over the passband must not deviate from. Thus,it is generally treated as a tolerance and is not included as a parameter in the search for theoptimum filter setup. However, well defined ripples are not in themselves critical; if theyare known they may be included in the filter profile description. This could potentially be away to relax the flatness requirements if causing problems for the filter manufacturer. Out-of-band blocking is typically a requirement that the transmission must not exceed a certainvalue outside the bandpass, typically between 10−3 and 10−4, and within a certain blockingrange defined by the sensor sensitivity and the presence of blocking components in theoptical setup. The blocking level and blocking ranges are not a part of the filter optimisationbut needs to be assessed independently.
To sum up, for the purpose of the following filter optimisation, each filter is describedby two parameters representing the edge positions as well as one or two parameters for theslope of the edges.
Simulation
The aim of the simulation is to determine the best possible two-filter setup, with respectto minimised water vapour sensitivity, determined by calculating χ for every possible filtersetup combination. With three to four parameters per filter, a two-filter setup is describedby six or eight parameters. For each of these, a range and a stepsize must be defined, andthis quickly adds up to a substantial number of possible filter setups. For instance, if in thesearch for a filter setup for NO measurements, the short wave edge frequency (νSW ) of the
30 In-Optics Humidity Compensation
Figure 3.6: Illustration of optimised filter setups for different centre wavenumbers of thesuspect filter. The colours of the absorption cross sections refer to NO (green), H2O (blue),and H2CO (red). Each subfigure shows the optimum filter setup found for a fixed νcsus withthe three other edge parameters parameters varied. The solution with the highest χ value isshown. Note that the suspect filter to a large extend avoids the present formaldehyde and thatthe reference filter stretches over both sides of the suspect filter even though no contraintsof this kind were imposed.
suspect filter is varied between 1820 cm−1 and 1960 and the other edge is varied betweenνSW + 40 cm−1 and 2000 cm−1 in steps of 10 cm−1, roughly corresponding to one positiontolerance (ε), and the reference filter is varied in the same way independently from the firstfilter but with the restriction that the second filter must be broader than the first to avoid cal-culating the same filter setup twice, this exceeds 12000 combinations. If each filter is furtherallowed three different slopes, this increases to over 50000 filter setup combinations. Addi-tionally, for each of the filter combinations, the tolerances has to be considered. In principle,it is the worst χ value within the tolerances of a given filter setup that is of relevance becausea large χ value is only interesting if it is realisable within the manufacturing tolerances. It ishardly possible to evaluate every possible tolerance permutation but assuming that the mostcritical case is a full ε shift for one or more of the filter edges, then the tolerances may beincluded by letting each edge move between -ε, 0, and +ε giving a total of 34 = 81 permuta-tions within each of the already numerous combinations. The passband flatness tolerancesmight be included by a number of randomly rippled passband transmissions. However, it is
3.3 Filter Optimisation Routine 31
probably better to deal with the flatness tolerances during the manufacturing process as itwas done for the NO2 filters presented in Section 3.4.
Figure 3.7: (a) Maximum χ values for fixed values of νcsus. (b) Corresponding change in Rfor a change of 10 ppm NO (green) and for a change of 1000 ppm H2O (blue). The calculatedχ values are based on absorption cross sections at 300 K calculated using SpectralCalc [35]and HITRAN2008 [42].
Figure 3.6 shows six examples of the results of an optimisation process for a set of NOfilters where the centre wavenumber of the suspect has been fixed to a certain value. Thecalculations in this example are based on absorption cross sections at 300 K. However, theexample serves as a nice illustration of the optimisation procedure. The two edge positionshave been replaced by a centre wavenumber (νcsus) and the FWHM of the bandpass filterwhich are the two parameter used to specify the edge positions for narrow bandpass filtersas will be discussed in chapter 4. However, the parameter range and stepsizes are effectivelyequal to the ones suggested above, with the exception that νcsus is varied in steps of 5 cm−1.In each subfigure, the centre wavenumber of the suspect filter is shown while the remainingparameters have been varied and the filter setup that maximises χ at the given νcsus is shown.In this example the slopes were not varied, instead the edge shapes were fixed and takenfrom a previously manufactured bandpass filter.
No restrictions were set about filtering out H2CO and nor any requirement that the refer-ence filter should be distributed over both sides of the suspect band, although this is desirablein order to improve stability toward optical variations such as a drift in source intensity orthe presence of particles. The setups are a direct consequence of the maximisation of χ andthe fact that the water vapour absorption increases effectively monotonously from one sideof the NO band to the other, implying that to achieve a similar average H2O absorption in thetwo optical filters, it is necessary to include wavelengths outside both sides of the suspect
32 In-Optics Humidity Compensation
filter in the reference filter.Figure 3.7 shows the resulting maximum χ values for various fixed values of νcsus. The
overall maximum is found at νcsus = 1900 cm−1, νcsus = 1910 cm−1, FWHMsus = 40 cm−1,and FWHMref = 170 cm−1. It should be noted that the maximum is found at the smallestallowed width and thus, it is very possible that an even more narrow filter would increase theχ value further. Ultimately, deciding the width of the suspect filter might be a trade betweenabsolute absorption signal, determining the signal-to-noise ratio, and the relative absorptionsignal, determining the stability to various sensitivity factors. However, Figure 3.7 alsoshows that the optimum for a fixed νcsus of 1910 cm−1 has a 24 % larger relative response toNO
(δR
δNNO
), while χ is only 6 % weaker corresponding to an NO response to 1000 ppm H2O
of 7.4 ppm instead of 7.0 ppm. The relative response to NO is important because it reducesall other known and unknown sensitivity factors of the systems. Thus, the optimum at νcsus =1910 cm−1 could be a better alternative. However, the solution space might conceal bettercompromises than the one revealed in this one-parameter representation. The optimisationpresented includes four parameters and while it is simple to find global maxima of a specificperformance factor it is a challenge in its own to find the best compromises between moreperformance factors. Figure 3.7(b) shows a sudden dip at νcsus = 1915 cm−1 although the χvalue in Figure 3.7(a) appears to follow a smooth curve over the same value of νcsus. This isa result of a competing maxima in the 5D χ contour, that sacrifices NO sensitivity in returnfor a very good H2O balance, further illustrating that it is dangerous to rely on χ as a soleparameter.
3.4 NO2 Results 33
3.4 NO2 ResultsVery early in the PhD project an opportunity occurred to have an optical filter for NO2
measurement manufactured by IML and embedded in the first NOX prototype in the relatedHTF project. This prototype was build with the focus of testing the signal-to-noise ratioin dry gas and had no formal requirements to the humidity cross sensitivity. However, itprovided an important platform for experimental testing and verification of the theoreticalcalculations, as well as kick-starting the communication with the filter manufacturer andgenerally gaining experience with the complete filter optimisation and fabrication process.There were several reasons that the first filter result would be of preliminary quality; one ofthem being that the optical setup of the sensor was being developed concurrently, implyingthat the complete spectral characteristics of the optical path could not be properly includedin the spectral calculations. Thus it was accepted that there would be another round of filterdevelopment, and this allowed me to cut a few corners in the hastened optimisation proce-dure. I decided to focus on developing a filter set for NO2 measurements. The interferencewith water vapour is slightly worse for NO2 compared to NO. However, the absolute absorp-tion signal is much stronger than for NO. This increased the chances for obtaining results onthe discriminating performance even if the signal-to-noise level requirements were not metwith the first prototype.
Figure 3.8: Measured transmission profiles of manufactured NO2 filters (solid red and blackcurves), and the simulated spectral transmission seen by the two detector channels in thepresence of 5 %VMR (blue) and 300 ppm NO2 (green) at a pathlength of 25 cm.
The optimisation that was carried out was based on absorption cross sections calculatedfor gas temperatures of 500 ◦C and using the HITRAN2008 database [42]. The calculationof the absorption cross sections were done using the commercial software SpectralCalc.com
34 In-Optics Humidity Compensation
Figure 3.9: Simulated voltages of the two detector channels equipped with suspect andreference filters. The voltages are scaled independently for visualisation purposes. Eachvoltage is very sensitive to H2O compared to NO2. However the response to H2O is verysimilar on the two detector channels, implying that it cancels out when calculating the ratiobetween them.
[35]. HITRAN2008 was chosen mainly because of availability since at the time the simula-tions were made, HITRAN2012 and HITEMP2010 were not yet available for cross sectioncalculations with SpectralCalc.com. The ideal databases to use would be HITEMP2010 forH2O and HITRAN2012 for NO and NO2 however, the database updates are not expectedto change the qualitative conclusions made in this chapter, even though the water absorp-tion spectrum has been considerably extended with numerous weak absorptions lines whichmight slightly affect the optimum filter setup.
The optimisation neglected cross sensitivities to all other gases than H2O and SO2, eventhough formaldehyde (H2CO) is absorbing in the same wavelength range, and is a trace gasin combustion of diesel oil. However, the level of its presence in exhaust gas is unclear.H2CO is measured as a tracer for OH in combustion diagnostics [43] but the very toxic gaswas only present in concentrations of few ppm in an old study of the composition of dieselexhaust gas [44]. Thus, cross sensitivity to H2CO may not be a severe issue in exhaust gasmeasurements, however it should be given more attention in the second optimisation round.
The optimisation assumed a 5 mm thick MgF2 lens in the optical setup while the trans-mission of the microstructured windows where not included as they were unknown at thetime.
The optimisation followed the same procedure as described in Section 3.3. However,it was carried out in a number of steps. First, the simulation was done with fixed filter
3.4 NO2 Results 35
slopes which originated from a real filter. Then after the first manufacturing, the edges wereupdated according to that outcome. Since the filters were broad bandpass filters, each edgeof a filter was made in independent deposition runs, as discussed in Chapter 4. This providedthe opportunity to include and fix each edge at a time upon its manufacture and rerun thesimulations to determine an adjusted optimum for the remaining edge position parametersand deliver those back to the filter manufacturer. In this way IML was able to produce a setof filters with a better χ value than in the original simulation.
Figure 3.10: Simulated ratio of voltage amplitudes for various NO2 and H2O concentrations.The ratio shows significantly reduced H2O sensitivity compared to NO2. A change in 1000ppm H2O corresponds to a change of 2.3 ppm NO2.
The realised manufactured filter setup for NO2 is shown in Figure 3.8 together with thetransmission spectrum seen by the two detector channels behind the filters in the presenceof 5 %VMR H2O and 300 ppm NO2 for an exhaust gas temperature of 350 ◦C at 1 bar andover a pathlength of 25 cm. This result was published in a conference paper (Appendix A)and presented orally at Advanced Photonics Meeting Congress 2014.
The simulated voltage amplitudes on each of the two detector channels are shown inFigure 3.9 as a function of the water vapour concentration and the NO2 concentration. Thetwo voltages are each very sensitive to H2O but their H2O dependence is very similar as aresult of the filter optimisation that balances the H2O signal in the two channels. When theratio of the two channels are taken, the result is that most of the water vapour dependencecancel out as shown in Figure 3.10. The χ value calculated based on the manufacturedfilter set is 313, which corresponds to a change of 3.2 ppm NO2 when the H2O changesby 1000 ppm (= 0.1 %VMR). If the water vapour is measured with an accuracy of ± 1600ppm corresponding to ±2 % of 8 %VMR which is the upper range for the H2O content,this transfers to an uncertainty in the NO2 measurement of ± 5.1 ppm. This satisfies therequirement stated in 1.1 that the cross sensitivity to water vapour must be well below 12ppm, although at the same time, it maintains the postcompensation of the water vapour
36 In-Optics Humidity Compensation
signal as a critical issue.
Opening Angle
The filter supplier provided transmission measurements at various incident angle distri-butions which are shown in the inset in Figure 3.11. For each set of transmission profilescorresponding to a certain cone angle of the incident light, χ was calculated and shown as afunction of the cone angle in Figure 3.11. The χ value is almost insensitive to the cone anglewhich means that no special consideration must be shown to the cone angle when designingthe optical filter, since the detector itself has an acceptance angle of 30◦.
Figure 3.11: χ value as a function of the cone angle of the incident light, calculated basedon measured filter transmission profiles, which are shown in the inset.
Temperature Dependence
At the time when the NO2 filters were manufactured, IML did not have equipment forelevated temperature characterisation of the bandpass profiles which had not previously beenrequested. Therefore the temperature dependence of the NO2 filters were only determined ayear after delivery, during my research visit at IML, prior to which heating equipment hadbeen established. The measurements revealed a large temperature dependence of the NO2filters. This, I learned, was a consequence of the high stability toward incident angle, sincethere exist a general trade-off between the sensitivity to temperature and incident angle. Themeasured transmission profiles at different temperatures are shown in Figure 3.12. Notethat the bandpass profiles are not identical to those in Figure 3.8 because the measurements
3.5 Next Generation Filter Setup Optimisation 37
were done on a prototype filter which had a pronounced ripple. However, the measuredtemperature dependence is representative also for the final NO2 filter set, since we showedin [2] that ripples do not affect the wavelength shift with temperature.
The consequence of the temperature behaviour is that a filter temperature change of1 ◦C corresponds to a change in NO2 of 23 ppm. This relatively high sensitivity to filtertemperature may be dealt with by thermostabilisation of the detector or compensated for inthe signal processing, but it would be highly preferable if it could be considerably reducedat the filter level.
Figure 3.12: Normalised transmission profiles of the manufactured optical NO2 filters mea-sured at different filter temperatures. A change in filter temperature of 1 ◦C corresponds toa change in the NO2 of 23 ppm.
While trading off the temperature stability for a high incident angle stability was uninten-tional from my side, the measured temperature dependence of the bandpass profile disclosesan extremely interesting asymmetry in the wavelength shift with temperature. The overalltemperature shift is high, but this covers a very high shift of the short wave edge whilethe long wave edge is practically invariant to temperature changes. With this knowledge, itshould be be possible to produce a set of filters with a high temperature stability by incorpo-rating the temperature variations of the short and long wave edges into the simulations. Inthis way the temperature invariant edge would be placed where the position stability is mostcritical, while the edge that shifts with temperature could be the common edge of the twofilters.
3.5 Next Generation Filter Setup OptimisationIn may 2012, 14 month into my PhD project, Danfoss IXA decided on a change of
technology away from NDIR and officially withdrew from the HTF project. This meantthat my theoretical work was never experimentally verified because this was depending on
38 In-Optics Humidity Compensation
electronic and software development within the project. It further inferred that there were tobe no second round of filter development, despite promising results from the first round. Thissection summarises the learnings from the first optimisation and filter development processand sketches how these might be adopted in a second generation filter setup optimisation.
For bandpass filters there tend to be a trade-off between stability to incident angles andstability to temperature. Thus a request for a low opening angle sensitivity should be madein consideration of the consequence for the temperature dependence. However, this mightnot be trivial; the sensitivity to incident angle is a geometrical problem and can be calcu-lated for a certain multilayer structure before manufacturing, but this is not the case for thetemperature dependence, which depends on the thermo-optical properties of the thin filmmaterials. These properties turn out to be generally unavailable, as will be discussed inChapter 4. Therefore it was a significant result that Gary Hawkins and I managed to extractthermo-optical thin film properties of PbTe and ZnSe from a large repository of historicbandpass filters and apply these properties to accurately predict the temperature behaviourof bandpass filters (Appendix B and C). The negative thermo-optical coefficient of PbTeenables temperature invariant edges in bandpass filters as it was the case for the long waveedge for the fabricated NO2 filters. This should be exploited by determining a set of promis-ing filter edges, in the case of the broad bandpass filters required for NO2, and let these beinput to the filter optimisation together with their dependencies.
For narrow bandpass filters the number of possible bandpass profiles are quantized. Thecentre wavenumber is continuously variable, since this scales linearly with the layer thick-nesses. However, the possible widths and bandpass shapes depend on the available mate-rials, and for the mid-infrared region there are only a limited number of suitable materials.With additional requirements regarding temperature stability only a limited narrow band-pass profiles are available. Thus, in a next generation of filter optimisation for NO, whichrequires narrow bandpass filters, rather than working with continuous parameter for both thecentre frequency and the width, the two characteristic parameters of each filter should be acontinuous centre wavenumber and a set of good bandpass profiles.
Since the NO2 measurement requires a simultaneous humidity measurement for com-pensation of the residual cross sensitivity, a next optimisation might include two additionalfilters for H2O measurement. Four different optical filters provide four independent equa-tions and can provide simultaneous information about a maximum of four variables. At leastone variable is reserved to the intensity factor that varies with e.g., source temperature andsoot level, leaving three variables for gas concentrations, two for NO2 and H2O, while thefourth equation might be used to solve the potential cross sensitivity to formaldehyde.
3.6 DiscussionIn this PhD study the concept of in-optics humidity compensation has been theoretically
investigated and actual filters have been manufactured with promising results. However,without experimental verification, the attempt of balancing the H2O signal with carefullydesigned optical filters remains an idea. This thesis has not discussed the absolute signallevel, although the main reason for Danfoss IXA to abandon NDIR for NOX measurementsin exhaust gas was the low signal-to-noise ratio of the NO measurement which was eventu-
3.7 Conclusion 39
ally considered incompatible with the requirements to accuracy, response time, and budget.However, signal-to-noise ratio depends on many other factors, including optical setup anddetector sensitivity, which may be increased by use of detectors that requires cooling. Fur-ther, there is some elasticity in relaxing the response time or accuracy requirements of thesensor. Most of these factors affecting the signal-to-noise ratio do not interfere with thestudy of cross sensitivities which has been the focus of this work. The presented resultsand conclusions remains valid if the future offers improved technologies in the mid-infraredregion. It should be noted that the NDIR NOX sensor was given up because of the absolutesignal level of NO and not NO2 which offers an order of magnitude stronger absorptioncompared to NO. By other methods such as chemiluminescense and UV spectroscopy, NO2is more difficult to measure compared to NO. Thus, an NDIR exhaust gas sensor measuringNO2 without NO might find its application some day.
3.7 ConclusionBased on precise optical filtering, NO2 measurements in moist exhaust gas has been
analysed through theoretical simulations, and two optical filters were successfully manu-factured within the tight tolerances required. The work presented in this chapter predictsthat NO2 can be measured in the mid-infrared region by a simple two-channel NDIR sensor,although very good control of temperature is required for the realised set of NO2 filters. Theestimated cross sensitivity to H2O is that a change of 1000 ppm H2O corresponds to a changeof 3.2 ppm NO2 at a gas temperature of 350 ◦C. The presented discoveries further suggeststhat there are significant improvements to be made in regard to temperature stability of thefilter setup.
CHAPTER 4
Temperature-Invariant Optical Filters
My interest in optical filter design was originally driven by the need to mathematicallydescribe and incorporate the transmission profile of an optical bandpass filter as well as itsdependences and tolerances into the filter optimisation routine. It soon became clear that thiswas not a straightforward task, and therefore a research visit was planned at Infrared Multi-layer Laboratory (IML) at the University of Reading with the purpose of gaining knowledgeabout fabrication uncertainties, interdependencies, and trade-offs involved in optical filterdesign and manufacturing. Prior to the visit, I commenced building my numerical filter op-timisation routine, and the first set of filters for NO2 measurements were manufactured atIML, a process which involved numerous correspondences, including a visit to IML. Whilethe delivered filters were in many ways successful, they exhibited a large and asymmetrictemperature dependence, which compromised their performance as discussed in Section 3.4.In the correspondences with IML, focus was given to the unfinished optical design for whichreason the filter was designed to be insensitive to incident angle. I did not realise at the timethat this came at the expense of a larger temperature dependence. I believed that temperatureshift toward longer wavelengths with increasing temperature was a fundamental property ofoptical filters, caused by expansion of the optical thickness. However, the NO2 filters did notjust exhibit a large wavelength shift with temperature, the two edges of the filters shifted ina very asymmetric manner, and the bandpass profiles were moving in the wrong direction;toward shorter wavelengths with increasing temperature. This peculiar behaviour is causedby one of the embedded thin film materials, PbTe, which possesses the unusual propertythat its refractive index changes negatively with increasing temperature. Used together witha thin film material exhibiting positive thermo-optical properties, this can lead to a varietyof different temperature behaviours, depending on the multilayer design used to constructthe filter. This includes filters that do not shift with temperature. However, at the time ofmy visit at IML it was not possible to predict how a certain multilayer bandpass filter wouldbehave with temperature because the available thermo-optical properties of PbTe and ZnSe,which constituted the second thin film material in the NO2 filters, were not representativefor the thin film filters and resulted in highly unreliable temperature predictions. Since,Head of IML Gary Hawkins was very eager to understand how the multilayer design af-fected the temperature behaviour of a filter and ultimately to be able to design temperatureinvariant filters, and he further had the idea that his extensive production of PbTe/ZnSe op-tical bandbass filters over the years could provide some of the answers, this opened up for a
42 Temperature-Invariant Optical Filters
common research study within design of temperature invariant optical filters and extractionof thermo-optical properties of embedded thin films in multilayer structures. I shall return toand elaborate on this work and associated results in Section 4.3, but first a brief introductionto thin film optical filters is given from the perspective of a spectroscopist.
4.1 Principles of Thin Film Optical Filters
Thin film optical filters are also called interference filters because the working principleis interference between electromagnetic waves. When an electromagnetic wave is incidentto a boundary between two transparent materials with refractive indices n0 and n1 then thewave is partly transmitted and partly reflected. In the following the simplified case of non-absorbing materials is considered. Figure 4.1 sketches an electromagnetic wave incident ona thin film of thickness d1, and refractive index n1 on top of a substrate of refractive indexn2.
θ0
θ0
θ1n1
n2
d1
n0a
b
Figure 4.1: Sketch of the working principle of thin film optical filters. In this examplethe reflected beams are interfering destructively with each other which results in a hightransmission.
At the first interface, the reflected beam is subject to a phase shift of π if n1 > n0 whileno phase shift occurs if n1 < n0. When the transmitted beam reaches the second interface,the beam is again split into a reflected and a transmitted part. If the reflected beams from thefirst and the second interfaces are out of phase by π, they interfere destructively, and if theyare further similar in magnitude, the reflections cancel each other out, causing a very higheffective transmission; a phenomenon which is widely exploited in antireflective coatings.For the thin film in Figure 4.1 the magnitude constraint is satisfied when n1 = √n0n2, whichcan be shown from the Fresnel equations [45], and this implies identical phase shifts of thetwo reflected waves. Hence, they interfere destructively when the distance travelled in thethin film of index n1 provides a phase shift of π. This happens when the optical thicknessof the film (dn1 cos θ2) equals one quarter of the wavelength in vacuum. Thus, a single thin
4.1 Principles of Thin Film Optical Filters 43
film of one quarter wavelength thickness may be used as antireflective coating, althoughonly within a narrow wavelength range.
In fact, a stack of thin films of quarter wavelength thicknesses, a so called quarter-wavestack, constitutes a building block within thin film optics. In the quarter-wave stack, how-ever, the refractive indices of the thin films are alternately high and low, which causes phaseshift of π only at every second boundary, resulting in high reflective properties. However,over a range of wavelengths, this structure generates a series of high-reflection zones sepa-rated by high-rejection zones, and the quarter wave stack may therefore be utilised to con-struct both antireflective coatings, high-reflection coatings, bandpass filters, as well as edgefilters, i.e. long pass or low pass filters.
For any given stack of thin films, also referred to as a multilayer, the transmission prop-erties can be straightforwardly calculated. Even before computers were available, this waspossible since every layer can be represented by a (2x2) matrix, relating the incident and thetransmitted electromagnetic field [46]. For the layer sketched in Figure 4.1 the matrix is;[
Ea
Ha
]=[
cos δ1 i sin δ1/η1iη1 sin δ1 cos δ1
] [Eb
Hb
](4.1)
where δ1 = d1n1 cos θ12π/λ is the optical distance through the layer, with d1 and n1 be-ing the physical thickness and the refractive index of the layer, respectively, while 2π/λ isinserted to express the optical thickness in unit of the wavelength. η1 is the optical admit-tance which is a material property of the thin film layer. E and H represent the electric andmagnetic fields at the thin film boundaries a and b, indicated in Figure 4.1.
For an assembly of thin films this can be written in a normalised version as;[BC
]={ q∏
m=1
[cos δm i sin δm/ηm
iηm sin δm cos δm
]} [1ηs
](4.2)
where C = Ea
Eq+1, B = Ha
Eq+1, and ηs is the optical admittance of the substrate while q is the
number of thin films in the assembly.From C and B reflectance (R), transmittance (T ), and absorptance (A), of the filter
assembly may be calculated by the following relations according to [46] in which a thoroughderivation can be found.
R =(η0B − Cη0B + C
)(η0B − Cη0B + C
)∗(4.3)
T = 4η0Re(ηs)(η0B + C)(η0B + C)∗ (4.4)
A = 4η0Re(BC∗ − ηs)(η0B + C)(η0B + C)∗ (4.5)
With these relatively simple equations at hand, and with todays computer power avail-able, the calculation of the resulting transmission profile of any given multilayer is easy,provided the material properties are known. However, typically it is the reverse problem that
44 Temperature-Invariant Optical Filters
is of interest, i.e. to find the multilayer design that generates a desired transmission profile.This task is significantly more complicated, and is undertaken by a combination of designrules and brute force simulations where small changes are applied to the multilayer one at atime, while the resulting changes in transmission profile is evaluated. This together with agreat deal of experience into thin film material properties and manufacturability enables thefilter manufacturer to design and produce optical filters according to specified requirements.
4.2 Wide Bandpass Filters and Narrow Bandpass FiltersOne thing a spectroscopist is likely to encounter when ordering bandpass filters is that
the filter manufacturer distinguishes between wide bandpass (WBP) filters and narrow band-pass (NBP) filters. I personally found this awkward and a bit disturbing in the beginning,particular since there is no clear boundary between the two types of filters and apparently nosignificant differences to the characteristics of the transmission profile which are subject tosimilar tolerances. A WBP filter is identified by its cut-on and cut-off edges, while a NBPfilter is identified by the centre wavenumber and the filter width (FWHM). However, it isvery easy to translate between the two ways of specifying a bandpass profile, so why shouldthe spectroscopist bother with this distinction?
However, although they might look similar to the costumer, the two types of bandpassfilters are completely different seen from the design and manufacturing perspective, and italso turns out that the two types of filters do have some different properties that are worth-while noticing for the spectroscopist.
The broad bandpass filters are also referred to as edge filters because they consist of twoindependent high-pass and low-pass edge filters placed in series to add up to a bandpassfilter. The two edge filters are often deposited on either side of the substrate which implythat they are deposited in separate runs. This means that two different filters may have acommon edge that is manufactured in the same deposition run, and this common edge willbe close to identical for the two filters both in terms of wavenumber position as well astemperature sensitivity.
For narrow bandpass filters, the combination of low-pass and high-pass filters is not verysuccessful because it is difficult to produce steep edges at high position accuracy. Insteadother multilayer structures are used where the rejection band and the passband are producedin a single assembly. The simplest multilayer structures that provide this are denoted FabryPérot narrow band pass filters because they work as Fabry-Pérot interferometers utilisingconstructive interference between two reflective surfaces to obtain a narrow peak of hightransmission. The filter is constructed by a half wave thick film embedded in a quarter-wavestack, resulting in a narrow peak of high transmission inside a region of high reflectivity. Thehalf-wave thick layer has the same effect as a cavity and is therefore referred to as spaceror cavity. The resulting narrow bandpass filters become more rectangular if the quarter-wave stack is repeated one or two times as shown in Figure 4.2. More than three filters arenormally avoided [47].
Figure 4.3 shows an enlarged photo of a cross section of a narrow bandpass filter withthree spacer layers embedded in quarter-wave stacks. Upon these, two other quarter-wavestacks with reference to other wavelengths are providing long wave blocking. Short wave
4.3 Temperature Dependence of Thin Film Optical Filters 45
Figure 4.2: Narrow bandpass filters embedding two and three spacer layers. The bandpassprofile becomes more rectangular with increasing number of spacers. The figure is providedby Gary Hawkins.
blocking, in contrast, is provided by the semiconductor absorption edge in the Germaniumsubstrate material. It should be noted that Germanium is not a good substrate material forfilters used at elevated temperatures since it looses transmission with increasing temperatureabove 50 ◦C. Instead, ZnSe is a good substrate.
The thickness of the spacer layers may be increased to higher integer multiples of halfwaves which results in narrower bandpass profiles, and each spacer may be of differentmultiple half-wave thickness to reach other desired bandwidths. Further, more than twodifferent thin film materials may be combined to extend the number of possible bandpassshapes. However generally, the number of realisable narrow bandpass profiles are quantized.
4.3 Temperature Dependence of Thin Film Optical FiltersThe bandpass profile of a thin film optical filter shifts with temperature because the opti-
cal thickness of the thin film layers change with temperature. If all layers are expanded by acertain percentage, the entire bandpass profile shifts in wavelength by the same proportion.Two material properties are responsible for the change in optical thickness with temperature;the thermal expansion and the refractive index temperature coefficient. The former refers tothe change in physical thickness of the thin film layer, and the latter determines the changein refractive index with temperature. For most thin film materials both of these changes arepositive with increasing temperature.
From a theoretical point of view, the temperature dependence of an optical filter isstraightforwardly calculated, provided the thermo-optical properties of the filter materialsare known. However, thermo-optical properties of thin films are scarcely found in the lit-
46 Temperature-Invariant Optical Filters
Figure 4.3: Enlarged photo of a 3-cavity PbTe/ZnSe optical bandpass filter deposited onGermanium. The picture was produced by IML, University of Reading.
erature, especially for mid-infrared thin film materials at elevated temperatures (> 25 ◦C).Moreover, thermo-optical data of embedded thin films in multilayer structures appears to becompletely absent, although they are recognised to exhibit different thermo-optical proper-ties compared to the same materials in bulk form [48].
The particular shortage of thermo-optical data for mid-infrared materials above roomtemperature are presumably related to the fact that infrared optical filters are historicallyused at cryogenic temperatures which have been required because infrared detectors weretroubled by thermal noise [49]. However, the field of mid-infrared sensing is changing [50]and optical filters are increasingly employed in non-cooled optical systems [51], and fromthis, the demand for temperature-invariant mid-infrared optical filters is arising.
At IML they have specialised in handling a rather unique thin film material; Lead Tel-luride (PbTe). It is a material with several interesting qualities from a filter designers pointof view. Amongst these is the high refractive index value of 5.5 at 300 K which is one of thehighest known for infrared thin film materials, and means that high index contrast betweenthe layers can be achieved which is helpful as it reduces the number of layers needed in anoptical filter [47]. Another celebrated feature is the high wavelength position of the shortwave semiconductor absorption edge at 3.5 µm at 300 K which assures effective blockingof radiation below this wavelength, hence removes the obligation for this to be providedby interference effects. Although it does, at the same time, restrict the wavelength range to> 3.5 µm for use above 300 K, the absorption edge of PbTe delivers a welcome simplificationfor optical bandpass filters for mid-infrared NOX measurements.
However, PbTe possesses yet another unique feature, in that it has a negative change inrefractive index with increasing temperature. As this temperature coefficient exceeds thepositive thermal expansion of the material, the optical thickness of the PbTe films actu-ally contracts with increasing temperature. The negative thermo-optical expansion may beutilised to compensate for the positive thermo-optical expansion of the alternate material inthe multilayer, and this enables the construction of temperature-invariant optical bandpassfilters. This was first reported a long time ago by IML in 1976 [52] and picked up by oth-ers [53]. Over the last couple of decades IML has made frequent use of this material for
4.3 Temperature Dependence of Thin Film Optical Filters 47
mid-infrared bandpass filters, and is therefore in possession of a large historic repository ofPbTe-containing bandpass filters, with ZnSe as a preferred alternate thin film material.
However, by the time of my visit, no one had performed a systematic study to unveil thedesign-dependence of the desired temperature-invariant property. Altogether, the arising de-mand for temperature invariant optical filters, the lack of systematic studies in the literature,as well as the available amount of manufactured bandpass filters of various filter designs,impelled us to undertake a systematic study of the temperature dependence of mid-infraredoptical bandpass filters containing PbTe and ZnSe. This evolved into a fruitful cooperationbetween myself and Gary Hawkins and resulted in two journal papers (Paper 2 and Paper3) while a third paper is in preparation. The papers have been summarised in the beginningof the thesis and are attached in full lengths in Appendix B and C. In Paper 2, we managedto relate the temperature behaviour of the bandpass filters to their multilayer design andobtained good agreement between a developed empirical model and the measured centrewavelength shifts with temperature, which ultimately enabled us to produce a set of tem-perature invariant bandpass filters across a wide wavelength range (4-10 µm). Paper 3 usedthe model and the data from Paper 2 to extract the thermo-optical expansion coefficients ofembedded thin film PbTe and ZnSe for three different wavelengths in the temperature range20-160 ◦C. These two papers are considered to contribute with a major step toward the con-trol of temperature invariance. The two papers are to be followed up by an extension of the
Figure 4.4: Example of two bandpass filters with good centre wavelength stability. Thewidths of the filters increase with increasing temperature because the ratio of refractiveindices increases, an issue which is most pronounced at short wavelengths (a) compared tolonger wavelengths (b). The limits of the wavenumber ranges of the two plots are chosensuch that they extend over the same relative frequency range (ν/νc) with νc being the centrewavenumber.
study to include the thin film material PbS which, as PbTe, has a negative thermo-opticalexpansion coefficient. Establishing the thermo-optical properties of PbS opens up for de-
48 Temperature-Invariant Optical Filters
signing and realising temperature invariant bandpass filters with other bandpass widths thanthose obtainable with PbTe/ZnSe.
In the published papers, temperature invariance has been almost exclusively used to referto the centre wavelength of the filter. However for a spectroscopist trying to separate closelyseparated absorption lines, it is really the filter edges that are of importance. Since the widthof a filter is determined by the ratio of the refractive indices of the thin film materials thenwith one refractive index increasing and the other decreasing, the width of the filter is boundto change. For this reason, a centre wavelength that is invariant to temperature does notnecessarily imply that the filter profile is completely stable. For the realised filters withstable centre frequencies over a broad infrared wavelength range, this was mainly an issuefor the shortest centre wavelengths. The issue is illustrated in Figure 4.4 showing two narrowbandpass filters claimed in Paper 2 to exhibit good centre wavelength stability. However,with the derived thermo-optical material coefficients at hand, it is equally possible to tailorone of the filter edges to be invariant to temperature, rather than the centre wavenumber.The papers are further restricted to the study of narrow bandpass filters but the determinedthermo-optical properties are expected to be valid for edge filters as well, although this hasyet to be demonstrated. In fact, edge filters might be used to construct bandpass profileswhich are truly invariant also at short wavelengths, since the width of such filters are notdetermined by the ratio of the refractive indices.
4.4 DiscussionThis chapter has discussed optical interference filters. However, thin film optics is a
vast research field and many important subjects have been omitted here such as fabricationmethods. I have made an attempt to gather from what I have learned about thin film filtersover the course of this PhD project, the information that would have been good to knowwhen I began building the filter optimisation routine.
4.5 ConclusionThis chapter has presented an introduction to thin film interference filters from the per-
spective of a spectroscopist. It has given a brief introduction to the underlying physicalprinciple and explained why bandpass filters are divided into broad and narrow bandpass fil-ters. The properties specific to each of the two types of filters have been discussed which isuseful knowledge when searching for an optimum filter setup through spectral simulations.Finally, the critical issue of wavelength shift with temperature of bandpass filters has beenthoroughly investigated and this has led to the derivation of the thermo-optical expansioncoefficient of embedded thin films of PbTe and ZnSe.
CHAPTER 5
High Pressure and High TemperatureCO2 Measurements
Following Danfoss IXA’s withdrawal from the HTF project and change of measurementtechnique for exhaust gas measurement of NOX away from NDIR, my PhD project wasredirected to focus on CO2 and H2O measurements in high pressure applications. DanfossIXA was undertaking the development of a CO2 and H2O sensor for exhaust gas measure-ments on-board ships, with exhaust gas recirculation (EGR) as a particular application. InEGR which was introduced in Chapter 1, NOX is reduced by mixing exhaust gas into theintake air with the purpose of reducing the oxygen level. This effectively lowers the com-bustion temperature which determines the rate in which NOX is produced. However, thecombustion temperature further depends on the humidity level in the intake air and thusboth CO2 and H2O are requested for EGR measurements in pressures up to 6 bar. In returnthe temperatures are low (25-80◦C). CO2 and H2O distinguish themselves from other emis-sion gases by their high abundance and their strong absorption of infrared radiation. The twogases represent the best investigated molecules within infrared spectroscopy, particularly atatmospheric conditions while they have also been subject to intensive studies at higher tem-peratures to which a specific database [54] is devoted. However, elevated pressure studiesare less numerous. In connection with this development, I carried out a concept study intopotential technologies for simultaneous measurement of CO2 and H2O at elevated pressureswithin some contraints set by Danfoss IXA regarding physical design as well as budget.However, since the investigations are of sensitive character to Danfoss IXA, the details arenot included in this thesis.
Around the same time at Risø, Postdoc Caspar Christiansen was constructing a gas cellfor high temperature and high pressure investigations targeted for spectroscopic CO2 mea-surements. This formed part of a larger research project named Radiade [55] concerned withthe modelling of radiative transfer in combustion processes in diesel engines on ships. Theinfrared emission from CO2 is an important contributor to radiative transfer in combustionbecause of its strong absorption lines and high abundance. Its contribution grows with tem-perature and becomes increasingly important for larger diesel engines, in particular largeship engines. However the combustion takes place at very high pressures under conditionswhere the emission spectrum of CO2 has never been measured.
Caspar Christiansen was just starting the validation process of the high temperature and
50 High Pressure and High Temperature CO2 Measurements
high pressure gas cell as the project finished. As I had given up the originally planned exper-imental verification of the NDIR NO2 measurements, the gas cell provided an opportunityfor me to gain experimental spectroscopic experience within the PhD-project, as well asgaining access to measure absorption spectra for CO2 at EGR pressures. I therefore tookover the work with the cell. This was a work that entailed many surprises and several ad-justments to the measurement setup as well as measurement procedure. One thing that weencountered was that when the pressure in the cell was increased, this caused the tempera-ture in the cell to drop. The three temperature set points along the length of the cell thereforehad to be adjusted, and this by very different amounts. The increase from 1 to 100 bar withnitrogen in the cell, resulted in a need for adjusting the set points with +20 K on averageat 1000 K. The effect on temperature meant that temperature stability and uniformity overthe cell had to be reestablished at the target temperature, and this made every measurementat high pressure very time consuming, particularly since there appeared to be no clear pat-tern in the way the set points had to be adjusted at various temperatures and pressures. Incontrast, it did not seem to affect the set points whether the cell was filled with nitrogen ora 5 % CO2 calibration gas. Eventually, we were able to validate the cell against previouslyreported high temperature and high pressure measurements, and to report the first measuredabsorption cross section of CO2 at 1000 K and 100 bar. The results of the gas cell workwas presented in a paper which has been submitted to Journal of Quantitative Spectroscopyand Radiative Transfer. The paper is summarised in the beginning of the thesis and the fullpaper is available in Appendix D.
Thesis Conclusion
This PhD study originated in the attempt of measuring NOX with NDIR spectroscopy inmoist exhaust gas. This is scientifically interesting but perhaps to ambitious to be suited foran industrial PhD project which ultimately has to obey commercial interests of the company.However, despite some turbulence created in connection with Danfoss IXA’s justified deci-sion to abandon NDIR as a technology for their NOX exhaust gas sensor about 14 monthsinto the PhD project, I managed to achieve a good partial result within NDIR exhaust gasmeasurements of NO2. A set of optical bandpass filters were realised within narrow toler-ances, predicting good humidity compensating properties.
The project had a change of direction toward research in the temperature behaviour ofoptical bandpass filters. A major result of this work was the extraction of the thermo-opticalexpansion coefficients of embedded PbTe and ZnSe thin films, an accomplishment which isconsidered an important step in future production of temperature invariant optical filters forthe mid-infrared region. This work was presented in two journal papers which I consider tobe the main scientific outcome of this PhD project.
The very theoretical focus of this PhD study, was supplemented by experimental workon high pressure and high temperature gas cell measurements of CO2 absorption. This workconcluded in a paper presenting the first measured CO2 absorption cross section spectrum at1000 K and 100 bar, and the results will hopefully contribute to an enhanced understandingof combustion processes in large ship engines, including the formation of NOX .
APPENDIX A
Paper 1: In Optics HumidityCompensation in NDIR Exhaust GasMeasurements of NO2
Abstract: NDIR is proposed for monitoring of air pollutants emitted by ship engines.Careful optical filtering overcomes the challenge of optical detection of NO2 in humid exhaustgas, despite spectroscopic overlap with the water vapour band.
OCIS codes: 300.0300 , 300.6340.
1. MotivationExhaust gas emission from ships is a major contributor to global air pollution and subject to increasing internationalattention [1]. There is a demand for continuous monitoring of the contents of the pollutants NO, NO2, and SO2 directlyin the exhaust pipe from the ship engine. All of these gases are infrared active but suffer from spectral overlap withwater vapour. Exhaust gas contains a vast amount of water vapour from the burning of hydrocarbons, in addition tobeing hot and chemically aggressive. This makes optical sensing advantageous as it allows decoupling of the detectorelement from the harsh exhaust gas. Non dispersive infrared (NDIR) spectroscopy is attractive for exhaust gas sensingbecause it is an optical method without moving parts and further an affordable alternative to more complex spectro-scopic devices. Yet, NDIR, in general, does not posses the ability to discriminate NO and NO2 from water vapour [2].The present paper presents an analysis of a special filter arrangement that targets this issue for NO2 by balancing outthe water vapour signal in two simultaneous measurements with two accurately designed and manufactured opticalfilters.
2. Measurement Principle
Fig. 1. Sketch of typical NDIR set-up. Spectral selection takes place through optical filters. Colli-mating optics not shown.
Fig. 1 shows a basic set-up of a typical NDIR measurement, comprising a modulatable IR emitter, a number ofdetectors with optical filters for spectral selection. Light travels from the emitter to the detector through a gas chamberwhere the gas molecules absorb light at different wavelengths, which reveals the concentrations of the abundant gases,if properly detected. The transmission through the gas ensemble is described by Beer-Lambert’s law,
T = ∏gas
exp(−σgasν L Ngas) , (1)
where L is the pathlength, σgasν is the absorption cross section and Ngas is the number concentration. The superscript,
”‘gas”’, indicates that the transmission through the gas ensemble is the product of the transmission through all indi-vidual gas species. The following analysis is based on thermopile detectors, which measure the total incident light
integrated over all wavelengths and return a voltage given by
u =∫
∞
0dν sν T Optics
ν T Filterν ISource
ν ∏gas
exp(−σgasν L Ngas)+UBG, (2)
where ν is the wavenumber ( 1λ
), sν is the wavelength dependent detector sensitivity. T opticsν is the transmission through
the collimating optics, T Filterν is the transmission through the optical filter in front of the particular detector. The
background therm UBG covers both the self-radiation of the thermopile detector and the background radiation fromthe hot gas, particles and surfaces in the optical path. The background contributions can be effectively eliminatedby modulating the source intensity, ISource
ν , with modulation amplitude, m, at frequency ω . The voltage amplitudemeasured on the thermopile, Aω
Filter becomes
AωFilter = m s ISource T Optics
∫ν2
ν1
dν ∏gas
exp(−σgasν L Ngas) , (3)
where, in order to obtain analytical results, the approximation has been made that s, ISource, and T optics can be consid-ered constant over the wavelength range defined by the filter. The filter is included as having a rectangular bandpassshape with cut-on frequency ν1 and cut off ν2. The ratio between the voltage amplitudes of two detector channelsequipped with two different optical filters which we shall denote suspect (sus) and reference (ref),
R =Aω
sus
Aωref
=ssusISource
sus T Opticssus
srefISourceref T Optics
ref︸ ︷︷ ︸Calibration parameter,β
∫ νsus2
νsus1
dν ∏gas exp(−σgasν L Ngas)∫ ν ref
2ν ref
1dν ∏gas exp(−σ
gasν L Ngas)︸ ︷︷ ︸
Function of gas concentrations, f (N1,N2,..)
, (4)
can be divided into a product of a calibration constant, β , and a function of the gas concentrations which we wishto measure. The ratio of voltage amplitudes, R, has the advantage of being immune to any changes that are equallyaffecting both the suspect and the reference channel, e.g. a uniform intensity change. For weak absorptions the integra-tion over the absorption cross section can further be approximated to an average absorption cross section in the rangedefined by the filter, σ
gasfilter,
R = βexp(−σNO2
sus L NNO2)exp(−σH2Osus L NH2O)
exp(−σNO2ref L NNO2)exp(−σ
H2Oref L NH2O)
= β exp(−(σNO2
sus − σNO2ref )L NNO2 − (σH2O
sus − σH2Oref )L NH2O
)(5)
for the case where NO2 and H2O are the only abundant gases absorbing in the selected spectral range. From (5) we getthe logical result that the humidity contribution cancels out if a filter setup is chosen such that the average humidityabsorption in the two ranges are equal, i.e., σH2O
sus = σH2Oref , while σNO2
sus − σNO2ref should be maximized.
3. Results
The approximations performed to arrive at (5) are useful for the analytical analysis. Using a full numerical analysisand a high resolution spectral database [3], we can deal with detailed spectral features, saturation, and non-rectangularbandpass filters and search for a filter pair that maximizes the relation
χ =
∂R∂NNO2
∂R∂NH2O
. (6)
However, the main challenge lies not in finding the solution that maximizes χ , but to find one that is stable withinthe manufacturing tolerances of the optical filters. More precisely, to define and incorporate tolerances of the filtersinto the optimization of χ . In fact, filter-manufacturing capabilities become the decisive factor in the realisation ofan NDIR NO2 sensor. Optical filter manufacturers are reluctant to promise edge position tolerances below 0.5 % andalso the bandpass shape is difficult to predict exactly. Bandpass filters are often optimized with focus on a rectangularappearance but in the given context a predictable bandpass shape supersedes rectangularity in importance, and thedevelopment of the optical filters and the numerical optimization of χ are greatly interdependent. Optical filters weredesigned and manufactured at Reading University, Infrared Multilayer Laboratory, and the transmission curves areshown in Fig. 2 together with transmission spectrum of 10 %VMR H2O and 300 ppm NO2. The common long wave
Fig. 2. Transmission curves of manufactured suspect and reference filters together with gas trans-mission spectra showing 300 ppm of NO2 (green) hidden in 10 %VMR H2O (blue) at 350 ◦C, 1 barand L = 40 cm.
cut-off has clear manufacturing advantages, enabling filters with identical edges and thereby reducing the number ofuncertainties that affect the water outbalancing performance. The resulting thermopile voltage amplitudes are shownin Figure 3 for a fixed optical setup (MEMS emitter with max temperature 750 ◦C, thermopile detector, L = 40 cm andtwo MgF2 lenses constituting the collimating optics). The filter setup has greatly reduced the cross sensitivity to H2O
Fig. 3. Resulting voltage amplitudes of the two filters shown in Fig. 2 for varying H2O and NO2concentrations. The split between suspect and reference voltage indicate the effective NO2 (greenshaded area ∝ σNO2
sus − σNO2ref ) and H2O (blue shaded area ∝ σH2O
sus − σH2Oref ) signal.
to a degree where it can be compensated through a simultaneous H2O measurement. A change of 0.1%VMR H2Ocorresponds to a change of up to 3.2 ppm NO2. Other cross sensitivities exist, amongst these are source temperaturedrift, which is a general concern in NDIR [4]. For the given setup we have a cross sensitivity to NO2 of 1.5 ppm /◦C. The filter setup has been limited to the short wavelength side to avoid cross sensitivity to formaldehyde whichmight be present in exhaust gas from ships. In conclusion, an optical filter pair has been successfully manufactured toa precision that allows optical balancing of the water vapour signal in an NO2 measurement in wet exhaust gas.
References
1. International Maritime Organization. NOx Technical Code (2008), RESOLUTION MEPC.177(58).2. A. J. de Castro, J. Meneses, S. Briz, F. Lpez Nondispersive infrared monitoring of NO emissions in exhaust
gases of vehicles, Rev. Sci. Instrum. 70, 3156 (1999).3. L. S. Rothman, et. al. The HITRAN 2008 molecular spectroscopic database , “J. Quant. Spectrosc. Radiat.
Transfer” 110 (2009) 533-572.4. J. Y. Wong, R. L. Anderson, Non-Dispersive Infrared Gas Measurement (Ifsa Publishing, 2012).
APPENDIX B
Paper 2: Spectral design oftemperature-invariant narrow bandpassfilters for the mid-infrared
Spectral design of temperature-invariant narrow bandpass filters for the mid-infrared
Thomine Stolberg-Rohr2 Gary J. Hawkins1,* 1The University of Reading, Infrared Multilayer Laboratory, School of Systems Engineering,Whiteknights, Reading,
Berkshire, RG6 6AY, England, UK 2Technical University of Denmark (DTU), DTU Chemical Engineering, Søltofts Plads 229, 2800 Kgs. Lyngby,
Abstract: The ability of narrow bandpass filters to discriminate wavelengths between closely-separated gas absorption lines is crucial in many areas of infrared spectroscopy. As improvements to the sensitivity of infrared detectors enables operation in uncontrolled high-temperature environments, this imposes demands on the explicit bandpass design to provide temperature-invariant behavior. The unique negative temperature coefficient (dn/dT<0) of Lead-based (Pb) salts, in combination with dielectric materials enable bandpass filters with exclusive immunity to shifts in wavelength with temperature. This paper presents the results of an investigation into the interdependence between multilayer bandpass design and optical materials together with a review on invariance at elevated temperatures.
1. G. J. Hawkins, R. Hunneman, R. Sherwood, and B. M. Barrett, “Infrared filters and coatings for the High Resolution Dynamics Limb Sounder (6-18 microm),” Appl. Opt. 39(28), 5221–5230 (2000).
2. T. Katsumata, R. Nishimura, K. Yamaoka, E. G. Camargo, T. Morishita, K. Ueno, S. Tokuo, H. Goto, and N. Kuze, “Uncooled InGaSb photovoltaic infrared detectors for gas sensing,” J. Cryst. Growth 378, 611–613(2013).
3. A. G. U. Perera, P. V. V. Jayaweera, G. Ariyawansa, S. G. Matsik, K. Tennakone, M. Buchanan, H. C. Liu, X. H. Su, and P. Bhattacharya, “Room temperature nano- and microstructured photon detectors,” Microelectron. J.40(3), 507–511 (2009).
4. P. V. V. Jayaweera, S. G. Matsik, A. G. U. Perera, H. C. Liu, M. Buchanan, and Z. R. Wasilewski, “Uncooledinfrared detectors for 3-5 um and beyond,” Appl. Phys. Lett. 93(2), 021105 (2008).
5. T. Stolberg-Rohr, R. Buchner, S. Clausen, J. M. Jensen, A. Skouboe, G. Hawkins, and R. S. Hansen, “In optics humidity compensation in NDIR exhaust gas measurements of NO2,” in Advanced Photonics Conference, OSATechnical Digest (online) (Optical Society of America, 2014), paper SeTh1C.3.
6. R. Mark, D. Morand, and S. Waldstein, “Temperature control of the bandpass of an interference filter,” Appl. Opt. 9(10), 2305–2310 (1970).
7. C. S. Evans, R. Hunneman, and J. S. Seeley, “Optical thickness changes in freshly deposited layers of lead telluride,” J. Phys. D. 9(2), 321–328 (1976).
8. J. S. Seeley, R. Hunneman, and A. Whatley, “Temperature-invariant and other narrow band IR filters containing PbTe, 4-20 um,” Proc. SPIE 246, 83–96 (1980).
9. C. R. Pidgeon and S. D. Smith, “Resolving power of multilayer filters in nonparallel light,” J. Opt. Soc. Am. 54(12), 1459–1466 (1964).
10. J. S. Seeley, G. J. Hawkins, and R. Hunneman, “Performance model for cooled IR filters,” J. Phys. D 21(10S),S71–S74 (1988).
11. B. Li, S. Y. Zhang, J. C. Jiang, D. Q. Liu, and F. S. Zhang, “Recent progress in improving low-temperaturestability of infrared thin-film interference filters,” Opt. Express 13(17), 6376–6380 (2005).
12. J. P. Borgogno, F. Flory, P. Roche, B. Schmitt, G. Albrand, E. Pelletier, and H. A. Macleod, “Refractive index and inhomogeneity of thin films,” Appl. Opt. 23(20), 3567–3570 (1984).
13. H. Rafla-Yuan, B. P. Hichwa, and T. H. Allen, “Noncontact method for measuring coefficient of linear thermal expansion of thin films,” J. Vac. Sci. Technol. A 16(5), 3119–3122 (1998).
14. K. Zhang, J. Seeley, R. Hunneman, and G. Hawkins, “Optical and semiconductor properties of lead telluride coatings,” Proc. SPIE 1125, 45–52 (1989).
15. C. Jacobs, “Dielectric square bandpass design,” Appl. Opt. 20(6), 1039–1042 (1981). 16. H. A. Macleod, Thin-Film Optical Filters, Fourth Edition (CRC Press, 2010). 17. H. Takashashi, “Temperature stability of thin-film narrow-bandpass filters produced by ion-assisted deposition,”
Appl. Opt. 34(4), 667–675 (1995). 18. P. Baumeister, “Methods of altering the characteristics of a multilayer stack,” J. Opt. Soc. Am. 52(10), 1149–
1152 (1962). 19. P. Klocek, Handbook of Infrared Materials (Marcel Dekker, Inc., 1991). 20. C.-H. Su, S. Feth, and S. L. Lehoczky, “Thermal expansion coefficient of ZnSe crystal between 17 and 1080°C
by interferometry,” Mater. Lett. 63(17), 1475–1477 (2009). 21. Yu. I. Ravich, B. A. Efimova, and I. A. Smirnov, Semiconducting Lead Chalcogenides (Plenum Press, 1970). 22. Y.-H. Yen, L.-X. Zhu, W.-D. Zhang, F.-S. Zhang, and S.-Y. Wang, “Study of PbTe optical coatings,” Appl. Opt.
23(20), 3597–3601 (1984). 23. R. Dalven, “A review of the semiconductor properties of PbTe, PbSe, PbS and PbO,” Infrared Phys. 9(4), 141–
184 (1969). 24. E. Palik, Handbook of Optical Constants of Solids (Acedemic Press, 1985). 25. R. A. Feldman, D. Horowitz, and R. M. Waxler, “Refractive properties of infrared window materials” in
Proceedings of Laser induced damage in optical materials, (SPIE, 1977). 26. R. J. Harris, G. T. Johnston, G. A. Kepple, P. C. Krok, and H. Mukai, “Infrared thermooptic coefficient
measurement of polycrystalline ZnSe, ZnS, CdTe, CaF(2), and BaF(2), single crystal KCI, and TI-20 glass,” Appl. Opt. 16(2), 436–438 (1977).
27. H. W. Icenogle, B. C. Platt, and W. L. Wolfe, “Refractive indexes and temperature coefficients of germanium and silicon,” Appl. Opt. 15(10), 2348–2351 (1976).
28. B. J. Frey, D. B. Leviton, and T. J. Madison, “Temperature-dependent refractive index of silicon and germanium,” Proc. SPIE 6273, 62732J (2006).
29. J. Thornton, “Absorption characteristics of low-resistivity germanium,” Proc. SPIE 1112, 94–98 (1989). 30. S.-H. Kim and C. K. Hwangbo, “Derivation of the center-wavelength shift of narrow-bandpass filters under
temperature change,” Opt. Express 12(23), 5634–5639 (2004). 31. H. Takashashi, “Temperature stability of thin-film narrow-bandpass filters produced by ion-assisted deposition,”
Appl. Opt. 34(4), 667–675 (1995). 32. G. J. Hawkins, R. E. Sherwood, B. M. Barrett, M. Wallace, H. J. B. Orr, K. Matthews, and S. Bisht, “High-
performance infrared narrow-bandpass filters for the Indian National Satellite System meteorological instrument (INSAT-3D),” Appl. Opt. 47(13), 2346–2356 (2008).
33. J. E. Murphy-Morris and S. W. Hinkal, “GOES Sounder Overview,” Proc. SPIE 2812, 174–181 (1996). 34. G. J. Hawkins, R. E. Sherwood, K. Djotni, P. M. Coppo, H. Höhnemann, and F. Belli, “Cooled infrared filters
and dichroics for the Sea and Land Surface Temperature Radiometer,” Appl. Opt. 52(10), 2125–2135 (2013). 35. E. Ritter, “Properties of optical film materials,” Appl. Opt. 20(1), 21–25 (1981). 36. H. A. Macleod, “Microstructure of optical thin films,” Proc. SPIE 325, 21–28 (1982).
1. Introduction
It is a fundamental behavior of thin film narrow bandpass filters to exhibit large displacements of center wavelength with temperature. This attribute can be utilized for selective wavelength tuning of optical filters by controlling the temperature. However, it is generally a cause of concern to spectroscopists employing bandpass filters to discriminate between different molecular species with spectrally overlapping absorption signatures. Historically, infrared optical filters have been integrated in cooled and temperature stabilized detecting systems with working temperatures far-below the filter manufacturing conditions [1]. Therefore the filter designer has always needed to take wavelength shifts with temperature into consideration. However, current infrared technology is advancing toward the use of uncooled detectors [2–4] in which optical filters are increasingly embedded in infrared devices required to operate at room temperature and above in uncontrolled temperature environments [5]. In the absence of active temperature control, temperature-invariant optical bandpass filters are of increasing demand.
The inherent temperature shift in center wavelength of the narrow bandpass filter is governed by the temperature-dependency between paired optical properties of the multilayers, viz. the refractive index, index contrast and the physical thicknesses. These properties determine the integrated optical thickness of the bandpass coating, which defines the center wavelength. For most materials, the temperature coefficients of these paired materials are
positive, leading to optically thicker coating layers with increasing temperature, and subsequent displacement of center wavelength toward longer wavelength [6].
Lead Telluride (PbTe) is an exceptional semiconductor material that has been investigated extensively for mid-infrared optical filters for many years [7]. It is an extraordinary material for the following reasons [8]; the high refractive index when used with an appropriate low-index dielectric results in one of the highest practical known index contrasts (nH/nL) to achieve a prescribed spectral filtering function with the minimum number of layers and maximize throughput. The refractive index is one of the highest known of usable infrared layer materials with values of n ~5.5 at 300K rising to ~6.0 at 80K, (i.e. refractive index decreasing with increasing temperature), this contrast provides a high effective index (n*), broadening the multilayer stop-band width and reducing spectral shift caused by inclined illumination [9]. Additionally for mid-infrared wavelengths PbTe provides continuous short-wavelength blocking by photo-absorption to ~3.2μm, further than all other commonly used evaporation materials due to the long-wave position of its semiconductor edge. Upon cooling the semiconductor absorption edge shifts to longer wavelengths (and hence shorter-wavelengths on heating) as a function of the anomalous increase in bandgap (PbTe ≅ + 4.2x10⁻⁴ eV K-1), common with all Pb-salts (PbTe, PbSe, PbS). For intrinsic PbTe at temperatures between 100K and 450K, the bandgap increases from ≅ 0.25 eV to ≅ 0.4 eV. This change produces a short-wavelength shift proportional to the inverse of the temperature moving from ~5.0 to 3.2 µm [10]. The optical dispersion properties of PbTe layer material are further strongly defined by the electronic carrier concentration, and departure from stoichiometry.
In this paper we pay specific attention to the negative dn/dT of PbTe as it presents unique possibilities to achieve temperature-invariant bandpass filter behavior. Figure 1 illustrates the principle of minimizing the net wavelength displacement with temperature using paired materials of PbTe and ZnSe. The blue and green curves show simulated bandpass displacements with wavelength due to the changes in thermal coefficient with increasing temperature applied singularly to each material. The red curves show the resultant net bandpass wavelength displacement across the 20-160 ᵒC temperature range.
Fig. 1. Opposing optical layer properties resulting in wavelength immunity of PbTe/ZnSe narrow bandpass filter with temperature.
The application of temperature-invariant properties to infrared narrow bandpass filter design has been known for a number of decades, particularly with PbTe and ZnS paired materials discussed and demonstrated formerly for Fabry-Perot (FP) single-cavity and two-cavity Double Half-Wave (DHW) designs [8,11]. However, a systematic investigation of the design dependence of contemporary temperature-invariant three-cavity Triple Half-Wave (THW) filters has never been presented, and the rationale of temperature-invariant properties has remained undisclosed.
From a theoretical perspective, predicting the temperature and spectral response for a given thin film multilayer is straightforward, providing the material temperature coefficients of expansion and dispersion are well-known. However, this is generally not the case for thin films embedded in a multilayer operating in an environment above room temperature. Thin films generally possess different optical, thermal and mechanical properties compared to the isotropic bulk form [12,13]. Often bulk properties are insufficient to accurately predict the resulting thermal behavior of the thin film multilayer. Despite efforts in establishing these thin film opto-mechanical properties over many years [13,14], the knowledge of particular thermal expansion coefficients with temperature for any embedded thin film is still exceedingly sparse, if not unattainable. In Section 5 we review the available data for thermal expansion coefficients as well as the thermal dispersion coefficients of the two important layer materials for mid-infrared wavelengths, PbTe and ZnSe. Focusing solely on the optical and mechanical properties of these two materials reduces the complexity of this study as it limits the number of available design permutations, simplifying the characterization of the interdependence between multilayer design and temperature invariance. We are further directing this work towards elevated temperatures across the range 20-160 °C. Within this temperature range we expect temperature invariance to become of particular importance in future infrared detection. However, the design methods described in this paper are not constrained by these two materials or wavelength ranges, but applicable to other Pb salts (PbSe, PbS) in combination with other II-VI dielectric materials and temperatures.
2. Modelling procedure
The work reported here was divided into the following procedure; firstly to establish a knowledge database by conducting a literature survey to gather published knowledge of the
refractive index temperature coefficient 1 dn
n dT
(referred to as temperature dispersion
coefficient, nβ ), and the linear thermal expansion coefficient ( )Lα for PbTe and ZnSe, in
both thin film and bulk form. Secondly, to calculate the center wavelength temperature
dependence 1 d
dT
λλ
for various multilayer design arrangements of narrow bandpass filters
based on published material properties. This is followed by predictions of temperature-dependence tested against measurements of thermal behavior from a repository of manufactured optical filters. This approach discloses whether the reported material properties can correctly predict the temperature response of manufactured filters, particularly, where some properties are in disagreement. Finally, to categorize multilayer designs with temperature-invariant behavior based on design bandwidth, cavity thickness order, and number of inter-cavity reflector layers. Here we present a simple model that successfully predicts the temperature response of manufactured bandpass filters.
3. Bandpass filter design
The narrow bandpass filters designed and manufactured for this investigation have comprised well-established triple half-wave (3-cavity) resonant multilayer designs using the high index contrast from the IV-VI lead telluride (PbTe, n ≈5.5) semiconductor alternately paired with II-VI zinc selenide (ZnSe, n ≈2.4) dielectric. This generic bandpass design approach has been fully described historically by Jacobs [15] with the advantage of deploying integral quarter-wave (λ/4) inter-cavity reflector stacks, use of multiple half-wave (λ/2, λ, 3λ/2 etc.) cavity thicknesses, and inclusion of antireflection matching periods between the equivalent bandpass core index and surrounding media. The nomenclature described in this paper assigns cavity thickness to either integral full-wave (λ) designation, comprising 2:2:2 to represent the half-wave order of the three cavities (i.e. 4:4:4 represents 3 cavities, each of λ thickness).
These generic bandpass filter designs have been deployed extensively throughout many former spaceflight filter missions, as described in Section 8, with advantages and compromise between spectral discrimination and manufacturability. As the energy grasp due to squareness of the bandpass shape improves with the number of cavities, the total number of index-matched paired layers and thickness of the multilayer also increases. In addition to this, the narrower the filter bandwidth is required to be, higher order thickness cavities are needed and larger number of inter-cavity layers necessary to match internal reflectivity from the cavities. As the bandwidth further reduces with increasing thickness, transmission losses due to absorption and multiple beaming rise sharply, which together with an increased sensitivity of bandpass shape to layer thickness errors, the perceived spectral advantage of improved bandpass shape diminishes with increased number of cavities. For mid-infrared wavelengths all of these factors mitigate against increasing designs beyond 3-cavities, often the result of limiting accuracy from in situ optical thickness monitoring during deposition.
4. Temperature-dependence theory
The center wavelength 0( )λ positioning of a bandpass filter is determined by the optical
thicknesses of the coating layers. The optical thickness (δ) of a thin film layer is proportional to the product of the material properties; refractive index n, and physical thickness l, (2 cos ) /nlπ θ λ . Since both of these properties change with temperature, 0λ becomes
temperature-dependent. However, the thin film materials comprising the multilayer stack will not change optical thickness equally or in the same direction, i.e. alternate layers become optically thinner with temperature, whilst the remaining layers optically thicken. Based on performance simulations through the multilayer characteristic matrix algorithm [10,16] (programmed through FTG FilmStar® proprietary thin film design software), we have determined that the contribution to the wavelength shift can be evaluated incrementally as discrete layers throughout the multilayer, with a design specific weighting factor assigning a sensitivity to individual layers opposing each other The center wavelength shift can thus be described by the following equation.
0
1
d d1
d d
qm
mm m
sT T
λ δλ δ=
=
where m is the layer number, q is the total number of layers, and ms is a design specific layer
sensitivity factor For a dual material filter this simplifies to;
0 d dd 1 1
d d dL H
L HL H
s sT T T
λ δ δλ δ δ
= + (1)
where L and H are low and high refractive index materials respectively. The material weighting factors ( )LS and ( )HS are determined by the multilayer design. The temperature
coefficient of the optical thickness relates to the temperature coefficients Lα and nβ ;
1 d 1 d 1 d d 1 d 1 d
d d d d d d n L
n l n lnl l n
T n l T nl T T n T l T
δ β αδ
= = + = + = +
where we have recognized 1 d
d
l
l T as the linear thermal expansion coefficient, Lα , and
1 d
d
n
n T
as the linear temperature dispersion coefficient nβ . Furthermore, we can now define the linear
For most conventional dielectric thin film materials, both nβ and Lα are positive values and
thus 0λ shifts toward longer wavelengths with increasing temperature. From Eq. (2) we see
that in order to produce a filter with low temperature dependence, there are two different ways to proceed. One approach is to choose specific materials with minimal values of nβ and Lα .
This approach is undertaken by Takashashi [17] where attention is directed to achieving bulk-like crystal properties of the thin film structure by ion-assisted deposition. A very different approach is to look for a special material having at least one negative temperature coefficient such that Eq. (2) by choice of multilayer design adds up to zero. This is the approach pursued by Seeley [8] and Li [11], as well as in this work. The enabling material is PbTe because of its negative change in refractive index (dn/dT<0) with increasing temperature. Li et al takes control of the negative coefficient by doping PbTe with Ge. Their focus is to target temperature-invariance to a specific temperature range. In this work we are not controlling temperature invariance, we are explaining and predicting how the multilayer design determines the temperature behavior of the bandpass filter. It is, however, our intention that the work presented here will contribute to gaining control over temperature invariance of optical filters in the future.
Equation (2) shows how the temperature response of the bandpass is determined by the temperature coefficients nβ and Lα of the constituent materials. The dependence on the
multilayer design has been concealed in the sensitivity weighting factors, LS and HS which
can be conveniently calculated by the help of multilayer design software. Mathematically demonstrated by Baumeister [18], the impact of a change in optical thickness of a single layer depends on the position inside the multilayer stack. The method was applied by Seeley [8] to determine; i) the cavity layer in a Fabry-Perot bandpass filter is significantly more sensitive to thickness changes than the surrounding layers, ii) a double half-wave cavity is twice as sensitive to thickness changes as a single half-wave cavity, and iii) the reflector layers adjacent to the cavity are three times more sensitive than the successive inter-cavity layers. According to these findings, the order of the filter should have major influence on the temperature response of the bandpass, as confirmed and demonstrated by the spectral measurement data presented in Section 8.
5. Optical material properties
The optical properties of thin films are well-known to deviate from the isotropic bulk material properties, often due to crystal morphology structure or film porosity resulting from reduced packing density (ρ), yet measurements of optical properties of thin films are usually made on exposed single layer films deposited on a substrate. Embedded thin films within a multilayer are likely to further possess optical properties between bulk and single film values, yet they are not easily measured and only derived by assumptions.
5.1 Linear thermal expansion coefficient (αL)
The linear thermal expansion coefficient ( )Lα is well-established for most bulk materials and
can be found in reference literature handbook sources such as Klocek [19]. However, recently
Lα for bulk ZnSe was measured using Fabry-Perot interferometry designed for elevated
temperatures (17-1080 °C) from which values of Lα were reported by Su et al [20] to be 35%
below handbook values at room temperature. The authors do not comment on this deviation. Rafla-Yuan et al [14] measured ZnSe Lα for 1.7 µm thick single thin film by ellipsometry
from which values significantly larger than bulk properties were reported, as illustrated in Fig. 2. The authors explain the large discrepancy from bulk as a result of film packing density, stress, and thermal expansion mismatch between film and substrate. As their reported values are measured on single exposed thin films, they cannot be expected to apply for the embedded thin film in an interference multilayer. In fact, the thin film values from Rafla-Yuan vary so radically with temperature that they can be instantly excluded from our study due to the corresponding center wavelength displacement being considerably larger than observed in measurements. Further, the increase with temperature would mean that the displacement rate,
0Δλ /°C should increase with temperature, which is also not observed. This maintains the
continued use of existing bulk ZnSe literature data.
Fig. 2. Comparison of reported thermal expansion of thin film and bulk values of ZnSe
Linear thermal expansion data for thin film PbTe is not reported in the literature, but is available for bulk PbTe. Ravich et al [21] reports the thermal expansion coefficient across a 25-320 K temperature range, with a stable plateau value above 200 K of 2.0 x10⁻⁵ K−1 with increasing temperature. Figure 3 shows the bulk Lα values in the multilayer simulations for
both ZnSe and PbTe.
Fig. 3. Thermal expansion coefficients of bulk material for PbTe and ZnSe. (Dashed lines indicate the values deployed in the simulations).
5.2 Optical dispersion temperature coefficient (βn)
The exact refractive index of PbTe is known to depend on the properties of evaporable material composition [22]. Zhang et al [14] characterized the refractive index of tellurium-enriched PbTe thin films with a dispersive shape showing similar generic properties to PbTe bulk material. The refractive index was determined for incremental temperatures between 45K and 463K across the complete inter-band transparent spectral range, (i.e. between electronic and multiphonon lattice absorption edges). The refractive index derived from spectral measurement is slightly lower than handbook bulk values [23,24] at corresponding temperatures as shown in Fig. 4.
Fig. 4. Overlay of dispersion curves for bulk and thin film PbTe material (17-163K).
The temperature derivative (i.e. the temperature dispersion coefficient, 1 d
dn
n
n Tβ = ),
however shows a significant difference between thin film coating and bulk index as shown in Fig. 5. The bulk values were calculated by interpolation between the two fitted dispersion curves at 300 K and 373 K in Fig. 4. Interpolation between two values reveals no information about a possible temperature-dependence of PbTe
nβ . Thus a constant value is assumed and
used in the simulation across the 20-160 °C temperature range. For the thin film PbTe material there are four different temperatures in our range of interest. However, the thin film data in Fig. 4 shows a very non-linear temperature behavior which is not in agreement with our measurements on manufactured filters as these generally exhibit smooth wavelength displacements with temperature. The stated uncertainty of the thin film data is 0.01 to 0.05 which may contribute significantly to the apparent nonlinear behavior. Instead we have chosen to use only the data sets at 290 K and 436 K which are separated by values greater than the uncertainty. As in the bulk case, two points per wavelength remain from which we derive a temperature independent value for thin film PbTe
nβ . This value is significantly smaller
than the corresponding bulk value and leads to a very different prediction of the center wavelength shift. Figure 5 further shows a mean value between bulk and thin film as this turns out to be in best agreement with the measured spectral data, which we shall discuss in Section 8.
Fig. 5. Dispersion temperature coefficient ( nβ ) and linear thermal expansion coefficient ( Lα )
of PbTe and ZnSe.
For ZnSe material we were unable to find any published data on thin film properties so also here it was necessary to use bulk properties. Feldman et al [25] measured dn/dT for a number of bulk infrared materials, including ZnSe, for a range of temperatures and a few different wavelengths. The values found for ZnSe in this work are 15% larger than corresponding measurements reported by Harris et al [26] earlier in the same year. This deviation made the authors repeat the measurement using a different method from which they obtained comparable results to their first measurements. Furthermore, Feldman et al generally found good agreement with other studies for their measurements of other materials. Based on this we choose to use the Feldman results from [25] for ZnSe
nβ , from which it is noted that the
wavelength-dependence of the ZnSe temperature dispersion coefficient is very small compared with PbTe.
The results in Fig. 5 summarizes our review of the optical properties for PbTe and ZnSe, from which constants are presented in Table 1. For ZnSe
Lα , PbTeLα , and ZnSe
nβ we have not
located any useful reference data in thin film form, thus have applied bulk properties to the model. Conversely, for PbTe
nβ we have acquired both thin film and bulk data. From the results
illustrated in Fig. 5 together with interpretation of Eq. (2), it is evident that owing to the magnitude of PbTe
nβ , this temperature coefficient contributes the largest impact on center
wavelength displacement.
Table 1. Results of review of mid-infrared optical properties of ZnSe and PbTe (20 - 160 °C)
Coefficient Bulk Thin film Data Origin ZnSeLα + 0.77 x 10⁻⁵ K−1 - [20]
Using the derived temperature coefficients described above, calculations to simulate the influence of elevated temperature on various bandpass designs, wavelengths, and cavity thicknesses were performed through conventional multilayer calculation theory. Example of simulation results for a generic multilayer design with different cavity thicknesses are shown in Fig. 6. This common multilayer bandpass design located at 4 and 10 µm comprises
incremental half-wave thickness for the three cavities. The simulations shown are performed using bulk properties for ZnSe
Lα , ZnSenβ & PbTe
Lα and with a mean coefficient between bulk and
thin film properties for PbTenβ .
Fig. 6. Simulated temperature response of four different thickness-order L-cavity ZnSe/PbTe bandpass filters at 4 and 10 µm. Each color covers the range 20-160°C in steps of 20°C
The bandpass simulations in Fig. 6 reveal an asymmetry of edge positions with temperature wavelength shift. This asymmetric displacement is the result of bandwidth broadening that occurs simultaneously with opposing index coefficients. As the bandwidth is determined by the index contrast between the paired layer materials (nH/nL), the opposing temperature coefficients maintain wavelength stability, however the reduced index contrast broadens the bandwidth (∆λ/λ0). As a result, the opposing edges are displaced differently. For the purpose of discriminating between absorption lines, the edges are actually of greater interest than the center wavelength displacement. From the perspective of center wavelength displacement the 3λ/2 cavity thickness is very good, but in mid-infrared spectroscopy the 2λ or even λ-cavity filters might be preferred because of the stable edges on the short-wave and long-wave side, respectively. However, for the purpose of this paper we will continue to discuss center wavelength displacement to comply with existing literature on temperature invariance. Yet, since edge-wavelength shift is of equal importance, this information together with center wavelength shifts obtained from the repository of manufactured bandpass filters is included in the summarized results in Table 3. For each design wavelength and cavity order, the center wavelength shift with temperature is determined. The resulting values are illustrated as circles in Fig. 7 along with the calculations from Eq. (2) using the weighting factors given in Table 2. Evidently, using Eq. (2), the optical properties, and the design dependent weighting factors, temperature-invariance can be predicted without need of performing any multilayer calculations.
Fig. 7. Overlay of simulated center wavelength displacement (circles), and displacement predicted from Eq. (2).
Results from Fig. 7 indicate that achievement of wavelength invariance at elevated temperature across the 6-13 µm range using ZnSe and PbTe materials, is best performed with a cavity thickness of λ. This however subsequently infers compromise between optimal temperature-invariance and desired bandwidth. At wavelengths below 6 µm higher orders are necessary to achieve wavelength-invariance.
7. Substrate temperature influence
Thin film dielectric multilayers deposited on germanium are perhaps the most extensively used material combination in the context of cooled mid-infrared filtering applications. It exhibits low absorption across the 2-12 µm wavelength range with a bandgap of ~0.67 eV at ambient temperature. At elevated temperatures however, standard optical grade material is known to be subject to substantial absorption losses throughout the infrared waveband due to the increased number of thermally generated free carrier holes. Germanium is hence generally not suited as a substrate for high temperature applications. The temperature-dependent refractive index of germanium has been reported by Icenogle et al [27] and Frey et al [28] for operation in cooled temperature environments. Spectral measurements of many infrared substrate materials at elevated temperatures are however sparse. Thornton [29] measured Ge transmission in increments up to 150 °C for two differing resistivity samples across the 7-15 µm range. The II-VI dielectrics, however, remain transparent for temperatures up to at least 200 °C. Figure 8 shows temperature measurements of uncoated optical windows of ZnSe, ZnS and Ge for temperatures between 20 – 200 °C.
Fig. 8. Measured transmission of 4 mm thick ZnS, ZnSe and Ge uncoated substrate materials at temperatures from 20 °C to 200 °C at 20 °C increments.
A substantial number of the spectral measurements presented in this paper are deposited on germanium, particularly as the filters were designed for cryogenic operation. This, however, does not compromise the validity of the elevated temperature-invariance comparison. We have compared filters of similar multilayer design deposited on different substrates, as shown in Fig. 9, from which the substrate material is observed to influence wavelength shift to a lesser degree than the variations stemming from uncertainties in
manufacture. The two filters at 4 μm were further fabricated within the same deposition, which meant that one of the filters had to suffer from poor optical matching, distorting the bandpass shape, but showing no influence to the temperature behavior. From this we conclude that both substrate material as well as optical matching is inconsequential to the temperature variations of the bandpass filter. This is in agreement with theoretical findings in [30].Whilst we consider this a significant and important conclusion, it might not be transferable to other material arrangements and wavelengths, since in [31] thermal expansion of the substrate is found to have great influence on the center wavelength temperature stability of TiO2/SiO2 bandpass filters. In Section 9 we further investigate the influence of layer thickness errors which show that this also is without significant impact on the temperature-dependence.
Fig. 9. Center wavelength shift for several filters of similar bandpass design deposited on differing substrate materials at wavelengths of 4 μm and 12 μm.
8. Comparison with manufactured filters
In order to validate the accuracy of predicted results from the temperature-invariance model presented in Fig. 7, spectral measurements at incremental temperature were performed on a historic repository of narrow bandpass filters originating from Earth observing spaceflight radiometer instruments. This library of filters represents a wide cross-section of generic multilayer bandpass design types and wavelengths, comprising both L- and H-spaced integral thickness cavities, differing cavity thickness orders, operating temperature requirements and center wavelength positioning.
Narrow bandpass filters from two missions; the NASA Aura mission High Resolution Dynamics Limb Sounder (HIRDLS) [1] and Indian Space Research Organization (ISRO) INSAT-3D [32] atmospheric sounder instruments comprised a wide range of differing bandpass designs containing 3-cavity triple half-wave (THW) low-index (L) cavity layers with differing thickness orders using alternate ZnSe and PbTe layers deposited on Germanium (Ge) optical substrates. The HIRDLS instrument bandpass filters were deployed in the focal plane detector array of this limb-viewing infrared radiometer which was designed for high resolution monitoring of global stratospheric and mesospheric temperatures and chemical species in the atmosphere at wavelengths between 6 and 18 µm. These filters were designed for high precision of spectral placement (typically, ∆λ0 = ± 1 cm−1), and located at an intermediate focus of the instrument, thermostatically controlled at 301K to provide the waveband definition through a low converging (f/5.5-f/7) conical illumination.
Bandpass filters manufactured for the INSAT-3D sounder instrument were developed for high resolution monitoring of temperature and trace species in the atmospheric region between the troposphere and stratosphere over the Bay of Bengal and Arabian Sea. These filters comprised precision L-cavity narrow bandpass designs between 1% and 6% full width half max (FWHM) to isolate wavelengths over the long-wave (LWIR 12-15 µm) and mid-
wave (MWIR 6.5-11 µm) spectral regions. These filters were designed to operate at a temperature of 210K in a collimated f/10 parallel beam. Similar wavebands of the INSAT-3D sounder are also deployed on the NOAA GOES geostationary satellite [33].
A third mission, comprising the Sea and Land Surface Temperature Radiometer (SLSTR) [34] is an instrument designed to provide climate data of global sea and land temperatures within the framework of the ESA Copernicus programme for the European polar orbiting Sentinel-3 satellite mission. The design of mid-IR narrow bandpass filters at 10.85 and 12.0 µm in this case employed high-index (H) cavity layer material to minimize wavelength shifts due to conical illumination (f/1.46) at the focal plane of the instrument. As one of the highest known refractive index materials, the use of PbTe cavity material provides a high effective index (n*) to reduce sensitivity to non-parallel illumination (dλ/dθ), however PbTe also possesses a large temperature coefficient (dλ/dT) when deployed in cavities, negating any temperature-invariant properties. This filter set provides a suitable cross-reference of an alternative generic bandpass design type to validate the wavelength displacement properties of the presented invariance model.
Further L-cavity narrow bandpass filters with temperature-invariant properties were manufactured at wavelengths of 4.3, 7.7, 10.3 and 12.1 µm deposited on CVD Zinc Sulphide (Multispectral ZnS, Cleartran®), Zinc Selenide (ZnSe) and Germanium (Ge) optical substrate materials. These items were manufactured with center wavelengths and spectral properties for industrial gas monitoring.
Table 3. Analysis of mean temperature shift from a repository of manufactured bandpass filters (20–120 °C) (Deposited on Ge, ZnSe and ZnS optical substrates).
Generic 3-Cavity Design
Bandpass Center at
20 °C (λ0, µm)
Bandwidth (FWHM,%) SW Edge
Thermal Shift (10-3% K−1)
Center λ0 Thermal Shift
(10-3% K−1)
σ* for Center λ0 Thermal
Shift (10-3% K−1)
LW Edge Thermal Shift
(10-3% K−1) H - 2:2:2 10.47 10.49 −10.51 −8.87 - −7.04 H - 2:2:2 11.77 8.42 −9.55 −8.35 - −7.05 L - 2:2:2 4.3 3.8 −4.6 −3.2 0.5 −1.7 L - 2:2:2 11.4 4.5 −3.0 −1.9 - −0.6 L - 2:2:2 12.1 4.4 −2.3 −1.6 0.2 −0.9 L - 2:2:2 15.8 4.3 −2.7 −1.8 0.0 −0.8 L - 2:2:2 17.5 3.9 −2.5 −1.7 - −0.8 L - 2:4:2 7.3 3.2 −1.4 −0.4 0.6 0.7 L - 4:2:2 6.9 3.9 −2.2 −1.3 0.2 −0.3 L - 4:4:4 4.3 2.6 −1.8 −0.9 0.2 0.1 L - 4:4:4 7.6 2.8 −0.8 −0.1 0.2 0.5 L - 4:4:4 10.3 2.6 −0.5 −0.0 0.1 0.5 L - 4:4:4 12.1 2.8 −0.8 −0.5 0.6 −0.1 L - 4:4:4 16.4 2.9 −0.3 0.3 - 0.8 L - 4:6:4 13.6 2.3 0.4 0.8 0.1 1.2 L - 4:6:6 14.7 2.2 0.5 1.0 - 1.4 L - 6:4:6 9.7 2.4 0.0 0.6 - 1.2 L – 6:6:6 4.2 1.9 −0.6 0.1 0.1 0.8 L – 6:6:6 12.0 2.0 0.5 0.9 0.0 1.3 L – 6:6:6 14.2 2.0 0.8 1.1 0.3 1.5 L - 6:8:8 8.3 1.7 1.1 1.5 - 2.0
*Sample Standard deviation. Range of sample quantities are between 2 and 5 filter elements.
A total of 45 manufactured narrow bandpass 3-cavity filters with ZnSe and PbTe layer materials were systematically measured across a range of elevated temperatures between 20 and 200 °C at 20 °C intervals. Figure 10 shows a representative center wavelength displacement with temperature at 4 and 12 µm. The shift is observed to deviate from linearity
with a tendency to reduce at the higher temperatures. The effects of non-linear wavelength shift at the higher temperatures has implied an irregular material property from which our data analysis was constrained to a 100 °C range between 20 °C and 120 °C. By comparison, simulations predict a linear shift with temperature as there is no temperature-dependence in the coefficients. Based on this truncated measurement data, we determined the center wavelength and 50% FWHM edge shifts for all the filters measured. The obtained shift values are given in Table 3 and shown in Fig. 10 as a function of cavity order, viz. the one property with the most significant effect on temperature invariance. Spectral measurements and visual inspection from the elevated temperature excursions showed no evidence of either residual thermal hysteresis or mechanical damage, with exception of a single filter which experienced environmental deterioration at 200 °C. All filters showed a linear or slowly declining displacement with temperature up to 120 °C.
The influence of deposition temperature has not been specifically evaluated in this work, but is further known to affect both the sticking coefficient [35] and environmental properties due to the influence on packing density and microstructural morphology of the condensed films [36].
Fig. 10. Center wavelength shift of manufactured filters with cavity thickness and temperature (20-120 °C).
In Fig. 10 there is a clear relationship between cavity order and center wavelength displacement. The positive wavelength shift of high L-cavity orders represents a deficiency of PbTe material. Reducing the order, and associated increasing filter bandwidth, reduces the relative amount of ZnSe in the multilayer and the positive wavelength shift is decreased accordingly, continuing until the balance is opposed from which the filters begin to shift to shorter wavelengths with increasing temperature. For an H-cavity filter, the excess of PbTe leads to a negative center wavelength displacement worse than the typical positive center wavelength displacement of 0.005 [% K−1] described in reference literature sources [16]. With the appropriate material balance several infrared filters with center wavelength displacements below 0.00015 [% K−1] were realized over a wide wavelength range. Some examples of these are shown in Fig. 11, where the measured transmission profiles are illustrated for filter temperatures between 20 and 200 °C in steps of 20 °C.
Fig. 11. Example normalized transmission measurements of 3-cavity bandpass filters at 4.2 µm, 7.6 and 10.3 µm showing temperature invariance in the range 20 - 200 °C.
In Fig. 12 the measured bandpass center shifts for all 45 filters are shown as a function of wavelength, together with the theoretically predicted temperature response based on bulk values of αL and nβ for ZnSe, and for PbTe using bulk values of αL and an average
between bulk and thin film values for nβ . Whilst the true value for the embedded films are
expected to be somewhere between the values of single thin film and bulk, there is no reason to assume that the value is exactly the average. However, the simple average leads to a remarkably good correspondence with experimental data. Using either thin film data or bulk data for PbTe ( nβ ) demonstrated, on the contrary, very poor agreement with the measured
shifts (not shown). Figure 12 shows that within the confines of paired PbTe/ZnSe 3-cavity narrow bandpass filter materials, an optimal temperature-invariance can be achieved, but is restricted to a specific bandwidth. To gain more degrees of freedom and enabling temperature-invariant bandpass behavior at intermediate bandwidths, a third material might be included.
Fig. 12. Predicted center wavelength shift (lines) compared with measured wavelength shifts (symbols).
Thickness errors of thin film layers are of key concern to the bandpass manufacture, particularly for matched accuracy of the cavities, as they compromise perfection of band shape, bandwidth and wavelength positioning. The fabricated filters to which we compare our simulations, inevitably all contain some degree of thickness error. We have investigated the degree to which such errors affect the wavelength displacement with temperature. Figure 13 shows simulated temperature variations of the bandpass transmission profile of a PbTe/ZnSe bandpass filter without thickness error, together with the same multilayer design but containing thickness errors introduced to the center cavity, particularly as this is known to be a dominating layer which is most sensitive to deviations [8]. No consequence was found of thickness errors on the wavelength displacement with temperature, even for gross thickness errors added to the most sensitive cavity layers. It should be noted, that introducing errors to adjacent cavities or inter-cavity reflector layers lead to the same conclusion. This analysis verifies that our simulations may be compared with fabricated filters without concerns regarding the influence of thickness errors. In fact, the results further allow us to make the general conclusion that thickness perfection plays no role in influencing temperature-invariance.
Fig. 13. Temperature variations of a multilayer design without thickness errors, and with gross thickness error applied to the center cavity of ± 2%.
10. Conclusions
A systematic investigation into the interdependence between multilayer bandpass design, optical materials, and wavelength properties of narrow bandpass filters has been presented. It has been shown that the temperature coefficients of bulk material are insufficient in predicting temperature wavelength dependence of narrow PbTe/ZnSe based bandpass filters. A set of material temperature properties that are able to describe the temperature wavelength behavior of PbTe/ZnSe narrow bandpass filters in good agreement with a historic repository of narrow bandpass filters were given for the temperature range 20-120 °C and the wavelength range 4-15 µm. It was shown experimentally that the cavity order determines the temperature wavelength behavior, implying that temperature invariance for a two-material filter is restricted to certain bandwidths. Mixed cavity orders can be used to tune the wavelength displacement to a desired value. Temperature measurements of different substrate temperature behavior at elevated temperature has been presented and it was shown that substrate material had insignificant influence on temperature invariance of these specific narrow band filters, even with increasing substrate absorption and optically mismatched thin film design. Finally,
it was shown that layer thickness errors neither contribute nor compromise the temperature-invariance sensitivity of the narrow bandpass filter design.
Acknowledgments
The authors thank colleagues at Schlumberger Cambridge Research for discussions and grateful support under contract reference QU-RDU-01274-C, together with the loan of a spectrometer accessory for high-temperature measurements. Thomine Stolberg-Rohr is a visiting industrial PhD student from Danfoss IXA A/S and her work is supported by the Danish Agency of Science, Technology and Innovation (DASTI). Thanks also to Richard Sherwood and Karim Djotni at the University of Reading for their assistance with spectral measurements and thin film depositions, which is gratefully acknowledged.
Paper 3: Determination of the embeddedthermo-optical expansion coefficients ofPbTe and ZnSe thin film infraredmultilayers
Determination of the embedded thermo-optical expansion coefficients of PbTe and ZnSe thin
film infrared multilayers
Gary J. Hawkins1,* and Thomine Stolberg-Rohr2 1The University of Reading, Infrared Multilayer Laboratory, School of System Engineering, Whiteknights, Reading,
Berkshire, RG6 6AY England, UK 2Technical University of Denmark (DTU), DTU Chemical Engineering, Søltofts Plads 229, 2800 Kgs. Lyngby,
Abstract: This paper reports the first derived thermo-optical properties for vacuum deposited infrared thin films embedded in multilayers. These properties were extracted from the temperature-dependence of manufactured narrow bandpass filters across the 4-17 µm mid-infrared wavelength region. Using a repository of spaceflight multi-cavity bandpass filters, the thermo-optical expansion coefficients of PbTe and ZnSe were determined across an elevated temperature range 20-160 °C. Embedded ZnSe films showed thermo-optical properties similar to reported bulk values, whilst the embedded PbTe films of lower optical density, deviate from reference literature sources. Detailed knowledge of derived coefficients is essential to the multilayer design of temperature-invariant narrow bandpass filters for use in non-cooled infrared detection systems. We further present manufacture of the first reported temperature-invariant multi-cavity narrow bandpass filter utilizing PbS chalcogenide layer material.
1. J. S. Seeley, R. Hunneman, and A. Whatley, “Far infrared filters for the Galileo-Jupiter and other missions,” Appl. Opt. 20(1), 31–39 (1981).
2. J. S. Seeley, R. Hunneman, and A. Whatley, “Temperature-invariant and other narrow band IR filters containing PbTe, 4-20 um,” Proc. SPIE 246, 83–94 (1980).
3. G. J. Hawkins, J. S. Seeley, and R. Hunneman, “Spectral characterization of cooled filters for remote sensing,” Proc. SPIE 915, 71–78 (1988).
4. B. Li, S. Zhang, J. Jiang, D. Q. Liu, and F. Zhang, “Recent progress in improving low-temperature stability of infrared thin-film interference filters,” Opt. Express 13(17), 6376–6380 (2005).
5. T. Stolberg-Rohr and G. J. Hawkins, “Spectral design of temperature-invariant narrow bandpass filters for the mid-infrared,” Opt. Express 23(1), 580–596 (2015).
6. T. Stolberg-Rohr, R. Buchner, S. Clausen, J. M. Jensen, A. Skouboe, G. Hawkins, and R. S. Hansen, “In optics humidity compensation in NDIR exhaust gas measurements of NO2,” in Advanced Photonics Conference, OSA Technical Digest (online) (Optical Society of America, 2014), paper SeTh1C.3.
7. M. N. Polyanskiy, “Refractive index database,” http://refractiveindex.info (accessed Feb. 29 2015) 8. E. Palik, Handbook of Optical Constants of Solids (Academic Press, Inc. 1985). 9. K. Zhang, J. Seeley, R. Hunneman, and G. Hawkins, “Optical and semiconductor properties of lead telluride
coatings,” Proc. SPIE 1125, 45–52 (1989). 10. J. N. Zemel, J. D. Jensen, and R. B. Schoolar, “Electrical and optical properties of epitaxial films of PbS, PbSe,
PbTe, and SnTe,” Phys. Rev. 140(1A), A330–A342 (1965). 11. Yu. I. Ravich, B. A. Efimova, and I. A. Smirnov, Semiconducting Lead Chalcogenides (Plenum Press, 1970). 12. R. A. Feldman, D. Horowitz, and R. M. Waxler, “Refractive properties of infrared window materials” in
Proceedings of Laser induced damage in optical materials, (SPIE, 1977).
#240040 - $15.00 USD Received 29 Apr 2015; revised 5 Jun 2015; accepted 8 Jun 2015; published 11 Jun 2015 (C) 2015 OSA 15 Jun 2015 | Vol. 23, No. 12 | DOI:10.1364/OE.23.016348 | OPTICS EXPRESS 16348
13. C.-H. Su, S. Feth, and S. L. Lehoczky, “Thermal expansioncoefficient of ZnSe crystal between 17 and 1080 °C by interferometry,” Mater. Lett. 63(17), 1475–1477 (2009).
14. G. J. Hawkins, R. Hunneman, R. Sherwood, and B. M. Barrett, “Infrared filters and coatings for the High Resolution Dynamics Limb Sounder (6-18 µm),” Appl. Opt. 39(28), 5221–5230 (2000).
15. G. J. Hawkins, R. E. Sherwood, B. M. Barrett, M. Wallace, H. J. B. Orr, K. Matthews, and S. Bisht, “High-performance infrared narrow-bandpass filters for the Indian National Satellite System meteorological instrument (INSAT-3D),” Appl. Opt. 47(13), 2346–2356 (2008).
16. G. Hawkins, R. Sherwood, K. Djotni, P. Coppo, H. Höhnemann, and F. Belli, “Cooled infrared filters and dichroics for the Sea and Land Surface Temperature Radiometer,” Appl. Opt. 52(10), 2125–2135 (2013).
17. C. S. Evans, R. Hunneman, and J. S. Seeley, “Optical thickness changes in freshly deposited layers of lead telluride,” J. Phys. D Appl. Phys. 9(2), 321–328 (1976).
18. P. Klocek, Handbook of Infrared Materials (Marcel Dekker, inc., 1991). 19. J. G. N. Braithwaite, “Infra-red filters using evaporated layers of lead sulphide, lead selenide and lead telluride,”
J. Sci. Instrum. 32(1), 10–11 (1955). 20. R. Dalvern, “A review of the semiconductor properties of PbTe, PbSe, PbS and PbO,” Infrared Phys. 9, 1740–
1744 (1996). 21. H. Takashashi, “Temperature stability of thin-film narrow-bandpass filters produced by ion-assisted deposition,”
Appl. Opt. 34(4), 667–675 (1995).
1. Introduction
The optical and semiconductor properties of group IV-VI Lead chalcogenide compounds has been a subject of thin film research for several decades [1]. Lead Telluride (PbTe) has been deployed in multilayers extensively over this period as a mid-infrared interference material, being particularly valuable in the coating design due to its high refractive index (n≈5.5) and long-wave spectral location of its electronic absorption edge. It is also distinctive amongst other transparent infrared materials because of its negative refractive index temperature coefficient which enables the unique construction of temperature-invariant narrow bandpass filters [2–4] across both cooled and elevated operating temperatures.
We previously conducted a systematic investigation into the design of temperature-invariant narrow bandpass filters, from which we demonstrated the thermo-optical properties of PbTe films accessible from literature sources were insufficient to accurately predict the temperature-induced wavelength shift of PbTe/ZnSe multi-cavity narrow bandpass filters across an elevated temperature range 20-200 °C [5]. Thus, an improved and refined understanding of thin film thermo-optical properties is essential to simulate, and gain control of the behavior of bandpass temperature-invariance demanded by non-cooled infrared optical systems [6]. We further introduced a thermo-optical expansion coefficient term ( ),γ which
denotes the expansion in optical thickness ( )δ with increasing temperature. The optical
thickness, being the product of the physical thickness (l) and the refractive index (n) 2 /nlδ π λ= , whilst the temperature derivative of δ is the sum of the temperature
derivatives of l and n;
1 1 1d dl dn
dT d dl T T
δγδ δ
= = +
The thermo-optical expansion coefficient ( γ ) is a crucial term, as it is primarily this
material property that is responsible for the wavelength shift with temperature exhibited by any optical thin film multilayer. In a binary material narrow bandpass filter, we showed in [5] that the center wavelength shift with temperature obeys the linear relation in Eq. (1).
1
L HL
C
CH
ds s
dT
λ γ γλ
= + (1)
Where Lγ and Hγ are the thermo-optical expansion coefficients of the low and high
index layers respectively, and SL and SH are sensitivity factors describing the proportional weighting of the two materials (SL + SH = 1) which are determined as a function of the multilayer design. However, wavelength-dependence is not a direct function of material
#240040 - $15.00 USD Received 29 Apr 2015; revised 5 Jun 2015; accepted 8 Jun 2015; published 11 Jun 2015 (C) 2015 OSA 15 Jun 2015 | Vol. 23, No. 12 | DOI:10.1364/OE.23.016348 | OPTICS EXPRESS 16349
quantity; cavity layers dominate sensitivity, whilst the influence of reflector layer count reduces sensitivity in proportion with distance between cavities, as described by [2]. Equation (1) shows that temperature-invariance naturally requires one of the materials to exhibit negative optical expansion ( 0)γ < . This property is however known only to exist in thin film
materials with a lead (Pb) based composition, i.e., PbTe and other lead chalcogenides, which strongly motivates improved understanding for these thermo-optical properties.
In this paper we utilize the elevated temperature measurements from a comprehensive repository of historic spaceflight bandpass filters, previously described in [5] to derive a new, realistic and practical data set of thermal-optical properties ( )γ for embedded polycrystalline
thin films of PbTe and ZnSe within a multilayer. We further consider the application of other alternative Pb-salts (PbSe, PbS) to broaden the range of temperature-invariance towards shorter wavelengths, and present the first reported thin film SWIR bandpass filter at 3.0 µm exhibiting temperature-invariance and utilizing the negative thermo-optical expansion of lead sulphide (PbS).
2. Thermo-optical source data
In [5] we conducted a literature survey to determine the existing sources of thermo-optical properties for PbTe and ZnSe in both bulk and thin film form with a particular focus on elevated temperatures across the 20-200 °C range. Our investigation concluded that the optical data available for these materials is exceptionally scarce. Where temperature measurements currently exist, this data is very coarse, or unsuitable for the desired wavelength regions. Valuable reference databases exist [7], which aim to create easy access to reported refractive index properties of various optical materials, however its temperature-dependence (dn/dT) property is rarely specified. A further challenge of incorporating thermo-optical properties in thin film simulations remains the non-specific physical condition from reported measurements which will differ to layers embedded within a multilayer assembly. Many reported thin film measurements are performed on single films exposed to ambient environments [8, 9] which are likely to deviate in their stress condition from embedded films in the multilayer structure. Other thin films are epitaxial single-crystalline films, which in [10] were found to resemble bulk properties, whilst the thin films deposited by physical vapor deposition are typically of a polycrystalline columnar structure, as is the case for our selection of manufactured bandpass filters. In addition to this, variations in deposition conditions affect stoichiometry, crystal morphology, and packing density all of which influence the opto-mechanical properties of the deposited films.
For evaporated PbTe layer material, refractive index temperature measurements were reported for exposed polycrystalline [9] and single-crystalline films [10], and, as anticipated, omission of any data for embedded polycrystalline films. Data on thermal expansion was expectedly only found in bulk form [11]. For ZnSe we found no reported thin film measurements of the refractive index temperature coefficient, however bulk refractive index coefficient data is available from Feldman [12]. The thermal expansion coefficient was measured for exposed thin films in [13] however the experimental coefficients were of such high magnitude that they were dismissed as unrealistic in proportion to embedded thin film properties and behavior.
3. Experimental data and simulation method
To acquire the embedded thermo-optical data properties for thin film simulations, we characterized and correlated the thermal behavior from a historic repository [14–16] of PbTe/ZnSe narrow bandpass filters, manufactured over a course of two decades, and covering a wide range of wavelengths, bandwidths, and multilayer design types. These filters were manufactured by thermal evaporation using a modified Balzers BA510 deposition chamber. This deposition system is especially fitted with a tooling arrangement of rotating evaporation
#240040 - $15.00 USD Received 29 Apr 2015; revised 5 Jun 2015; accepted 8 Jun 2015; published 11 Jun 2015 (C) 2015 OSA 15 Jun 2015 | Vol. 23, No. 12 | DOI:10.1364/OE.23.016348 | OPTICS EXPRESS 16350
sources and stationary substrates. This static substrate arrangement is particularly important for the deposition of precision thin-film multilayers, as the need for accurate elevated temperature control is essential to maintain good opto-mechanical properties of the materials, particularly as the stoichiometry and sticking coefficient of chalcogenides are highly temperature dependent. The selection of bandpass filters used in this study were deposited with substrate temperatures between 185 and 210 °C. Further deposition details are discussed in the papers where the filters were first published [14–16]. The filters were all newly characterized by extraction from high temperature FTIR spectral measurements across the range of 20-200 °C, where the observed wavelength displacements were correlated with multilayer design properties in [5]. The wavelength shift with temperature was accurately modelled using Eq. (1).
In order to determine the thermo-optical expansion coefficient for the embedded thin films of both PbTe and ZnSe layer materials, only a minimum of two filters is required with common center wavelength, but of significantly different multilayer design. This establishes two or more simultaneous equations to solve with respect to the two unknown optical properties. This requirement was achieved at three different wavelengths; 4.3 µm, 10.4 µm, and 12.1 µm. The sensitivity factors were determined from the multilayer properties, and presented in [5] for the relevant designs. In Fig. 1, the measured center wavelength shift with temperature is shown for three center wavelengths as a function of the low-index sensitivity weighting factor LS . Equation (1) contains only one independent variable, since the high- and
low-index sensitivity weighting factors adds up to unity ( 1L HS S+ = ). Thus, the equation can
be written and solved as a linear function of either variable, e.g., ( )1 L H HcL
c
dS
dT
λ γ γ γλ
= − + .
Hence in Fig. 1, the intersection with the y-axis ( 0)LS = shows Hγ , whilst the slope gives L Hγ γ− . As we have more than two filters at each of the three wavelengths, comprising; 11
filters at 4.3 µm, 4 filters at 10.4 µm, and 10 filters at 12.0 µm, we performed a multivariate least squares fit to obtain the desired material properties of PbTeγ and ZnSeγ at the selected
wavelengths. The shift in center wavelength on the y-axis is the mean shift across the 20-160 °C temperature range. The upper limit was chosen to avoid non-linear behavior which was exhibited by some filters at temperatures greater than 160 °C. Filters in the 4 µm region showed a temperature displacement with a tendency to reduce when approaching the higher temperatures, even within this range. This was primarily due to the reduced influence of electronic absorption in the PbTe material, shifting to shorter wavelengths on heating. The value fitted at the 4.3 µm wavelength is thus an average value over the temperature range, and will be slightly higher at room temperature.
#240040 - $15.00 USD Received 29 Apr 2015; revised 5 Jun 2015; accepted 8 Jun 2015; published 11 Jun 2015 (C) 2015 OSA 15 Jun 2015 | Vol. 23, No. 12 | DOI:10.1364/OE.23.016348 | OPTICS EXPRESS 16351
Fig. 1. Measured center wavelength shift with temperature as a function of multilayer design specified by the low index sensitivity factor (dots) shown together with the results of multivariate least square fits (lines).
4. Results
Applying the measured wavelength shift properties with temperature, a thermo-optical expansion coefficient for the embedded thin films was derived for both PbTe and ZnSe at three different mid-infrared wavelengths. The resulting coefficients are given in Table 1, and shown in Fig. 2 together with corresponding literature data.
Table 1. Thermo-optical expansion coefficients derived for embedded PbTe and ZnSe films.
To each extracted coefficient we have given a variance which was generated by fixing one coefficient in Eq. (1) at a time and calculating the resulting sample standard deviation for the temperature coefficient of the alternate material. The stated variances in Table 1 represent twice the sample standard deviation ( ± 2σ) and is further included in Fig. 2 as vertical error bars. Whilst these variations may appear large in value, they are small compared to the discrepancies within the currently existing knowledge of thin film PbTe properties.
#240040 - $15.00 USD Received 29 Apr 2015; revised 5 Jun 2015; accepted 8 Jun 2015; published 11 Jun 2015 (C) 2015 OSA 15 Jun 2015 | Vol. 23, No. 12 | DOI:10.1364/OE.23.016348 | OPTICS EXPRESS 16352
Fig. 2. Thermo-optical expansion coefficients of embedded PbTe and ZnSe determined by multivariate least square fit to Eq. (1) shown together with literature data, the origin of which
are listed in Table 2. Additionally, a value for PbTeγ was extracted from each bandpass filters
based on a fixed ZnSeγ value.
Reference literature values for ZnSe offers a near wavelength-independent value of γ
based on bulk samples; ZnSe 5 13.4 10 Kγ − −= ⋅ . This value is in very good agreement with our
findings of 5 13.25 10 K− −⋅ in the long wavelength region. At 4.3 µm, we extract a slightly
lower value of 5 12.9 10 K− −⋅ . Although still within the experimental variation, we consider that the low value is a consequence of the electronic absorption edge influence of PbTe receding from the bandpass filter as the temperature increases and skewing the measurement of /d dTλ . In total, it appears that embedded polycrystalline thin films of ZnSe exhibit optical properties similar to those of bulk ZnSe, whilst in contrast for PbTe, we obtain values that are significantly different from the literature data. This can be understood in terms of a lower optical density of deposited PbTe film [17], compared to single-crystal material which is the origin of the PbTe
*γ data [10]. In contrast, the polycrystalline PbTeγ + data was obtained
from exposed PbTe film [9], which is not subject to the similar mechanical stresses experienced by the embedded films. It is therefore reasonable to conclude the embedded thin film values lies between these two extrema.
Table 2. Origin of reference α and β literature data
γ = α + β 1 dl
l dTα =
1 dn
n dTβ =
PbTe*γ
−21·10−5 K−1 bulk [11] 2.0 ·10−5 K−1
Single-crystal, exposed film [10] −23·10−5 K−1 (at 10 µm)
PbTeγ +
−7.9·10−5 K−1
Polycrystalline, exposed film [9] −9.9·10−5 K−1 (at 10 µm)
ZnSeγ
3.4·10−5 K−1
bulk [18] 0.77·10−5 K−1
Bulk [12] 2.6 ·10−5 K−1
At wavelengths where bandpass filters with two distinct multilayer designs were not available to permit a multivariate fit, we applied the method of fixing ZnSeγ to literature
values. This is justified by the good agreement obtained with literature ZnSeγ established
#240040 - $15.00 USD Received 29 Apr 2015; revised 5 Jun 2015; accepted 8 Jun 2015; published 11 Jun 2015 (C) 2015 OSA 15 Jun 2015 | Vol. 23, No. 12 | DOI:10.1364/OE.23.016348 | OPTICS EXPRESS 16353
using the multivariate fits. In this manner we obtained a value for PbTeγ for each bandpass
filter by the solution of Eq. (1);
1
H LL
c
cH
ds s
dT
λγ γλ
−= (2)
The resulting extracted coefficients are shown in Fig. 2 along with the multivariate fit results, which offer an indication of the experimental variations together with additional information about wavelength-dependence.
Whilst the concept of temperature-invariance has been governed by the opposing negative temperature coefficients of PbTe and complementary dielectric layer pair, extending the application of invariant narrow bandpass filters towards the shorter infrared wavelength region (SWIR) requires the use of a lighter molecular mass lead chalcogenide salt. The deployment of Galena, lead (II) sulphide (PbS) multilayer was first suggested as a material by Braithwaite [19] in 1954, from which attempts to manufacture interference layers were unsuccessful at that time due to unexpectedly high absorption, induced by poor stoichiometry decomposition during deposition. PbS has subsequently remained an unutilized layer material that has been extensively reported for its semiconductor properties in opto-electronic quantum dot infrared photodetectors and photovoltaic devices, but as a transparent infrared layer material has been scarcely reported in literature sources for over 60 years. Here we present the manufacture of the first fully-transparent temperature-invariant narrow bandpass filter comprising a PbS/ZnSe 3-cavity multilayer of 8% FWHM bandwidth at 3.0 µm. The PbS/ZnSe bandpass is deposited on a Sapphire substrate and similarly exhibits invariant wavelength behavior throughout the 20-200 °C temperature range (Fig. 3).
Manufacture of the filter was performed by conventional thermal deposition using the same experimental conditions as PbTe, however avoiding the differential stoichiometric loss and free carrier absorption were compensated by the introduction of a partial pressure of oxygen into the chamber during PbS layer deposition. This was best performed at a pressure of 4x10⁻⁵ Torr, from which transparency becomes fully restored. The lower absorption properties of PbS in comparison with PbTe subsequently offers transparency across the SWIR wavelength region down as far as 2.3 μm (α<1x104 cm−1) [20]. Simulations of refractive index matching, based on the bandpass FWHM and bandwidth broadening with temperature (0.1 nm K−1), suggests a deposited PbS thin film refractive index of 4.0 at 20 °C decreasing to 3.82 at 200 °C. The center wavelength stability is better than 0.02 nm K−1. The thermo-optical expansion coefficient for bulk PbS is close to PbTe at long wavelengths ~2.3 K−1 (8-10 μm) with a rapid decrease towards the absorption edge at 2.3 μm [10,11]. The experimental data available for PbS is still too scarce to extract a reliable experimental value, but preliminary results indicate that thin film temperature coefficient (as for PbTe) is significantly less negative than the bulk value. Further determination of γPbS is of ongoing research.
Environmental durability of this deposited PbS/ZnSe multilayer was assessed by subjecting 1-inch diameter witness samples to the general provisions of military specification MIL-F-48616. This testing included a visual surface quality assessment, adhesion testing, moderate abrasion, humidity testing at 50 °C for 24 hours in >95% relative humidity, together with additional cryogenic to high temperature thermal cycling (20–473 K) and liquid nitrogen thermal shock testing. Further extreme testing included dicing by diamond saw in deionized water lubricant, all of which passed with satisfactory compliance.
#240040 - $15.00 USD Received 29 Apr 2015; revised 5 Jun 2015; accepted 8 Jun 2015; published 11 Jun 2015 (C) 2015 OSA 15 Jun 2015 | Vol. 23, No. 12 | DOI:10.1364/OE.23.016348 | OPTICS EXPRESS 16354
Fig. 3. Temperature-invariant PbS/ZnSe 8% FWHM narrow bandpass filter at 3.0 µm on Sapphire (Single-side coating inclusive of rear surface reflection losses)
6. Discussion
The narrow bandpass filter set from which the presented data was extracted, are all double-side coated complete manufactured optical filters, that contain continuous out-of-band wavelength blocking and antireflection matching layers. The passband ripples of these subsidiary blocking stacks may exert some influence to modulate the final shape and center wavelength positioning of the bandpass profile. However, in [5] we showed that random layer thickness errors have negligible influence on the temperature-invariance transmission profile, as this is dominated by the design and materials interdependence. The substrate has previously been reported to influence temperature dependence of narrow bandpass filters [21] but in [5] the choice of substrate, or substrate thickness did not appear to affect the temperature behavior of the bandpass filter profile. Further, although all of the filters studied were of triple half-wave (3-cavity) multilayers, we can consider the extracted thermo-optical values to be representative also for embedded thin films in other multilayer structures, particularly as variations in cavity order and number of inter-cavity layers did not appear to affect the thermo-optical behavior. However, the precise deposition conditions may conceal further opto-mechanical stress dependence of the extracted thermo-optical properties.
7. Conclusions
In this investigation we have derived the thermo-optical expansion coefficients for embedded thin films of polycrystalline PbTe and ZnSe. Embedded thin film ZnSe was found to exhibit bulk thermo-optical properties, whilst embedded thin film PbTe deviated significantly from reported literature values. This was attributed to the lower density of deposited PbTe film compared to single-crystal material. A thin film bandpass filter based on thermally deposited PbS material was demonstrated, extending the range of temperature-invariant behavior to shorter wavelengths and a wider range of bandwidths.
Acknowledgments
The authors thank colleagues at Schlumberger Cambridge Research for discussions and grateful support under contract reference QU-RDU-01274-C, Thomine is an industrial PhD student at Danfoss IXA A/S and her work is supported by the Danish Agency of Science, Technology and Innovation (DASTI). Thanks also to Richard Sherwood and Karim Djotni at the University of Reading for their assistance with spectral measurements and thin film depositions, which is gratefully acknowledged.
#240040 - $15.00 USD Received 29 Apr 2015; revised 5 Jun 2015; accepted 8 Jun 2015; published 11 Jun 2015 (C) 2015 OSA 15 Jun 2015 | Vol. 23, No. 12 | DOI:10.1364/OE.23.016348 | OPTICS EXPRESS 16355
APPENDIX D
Paper 4: High Temperature and HighPressure Gas Cell for QuantitativeSpectroscopic Measurements
High temperature and high pressure gas cell for quantitativespectroscopic measurements
Caspar Christiansen a, Thomine Stolberg-Rohr a,b,n, Alexander Fateev a,Sønnik Clausen a
a Department of Chemical Engineering, Technical University of Denmark, Frederiksborgvej 399, Building 313, DK-4000 Roskilde, Denmarkb Danfoss IXA A/S, Ulvehavevej 61, DK-7100 Vejle, Denmark
a r t i c l e i n f o
Article history:Received 10 June 2015Received in revised form12 October 2015Accepted 13 October 2015Available online 20 October 2015
Keywords:CO2
Gas cellInfraredTemperaturePressureCombustion
a b s t r a c t
A high temperature and high pressure gas cell (HTPGC) has been manufactured forquantitative spectroscopic measurements in the pressure range 1–200 bar and tempera-ture range 300–1300 K. In the present work the cell was employed at up to 100 bar and1000 K, and measured absorption coefficients of a CO2–N2 mixture at 100 bar and 1000 Kare revealed for the first time, exceeding the high temperature and pressure combinationspreviously reported. This paper discusses the design considerations involved in the con-struction of the cell and presents validation measurements compared against simulatedspectra, as well as published experimental data.
& 2015 Elsevier Ltd. All rights reserved.
1. Introduction
The interest in high temperature and high pressure CO2
data emerges from two very different fields of research;the scientific study of the atmosphere of Mars and Venus[1] and the industrially motivated research in combustionengines for which high temperature and pressureabsorption spectra are required for proper modeling of theheat transfer processes [2]. This work is motivated by thelatter, and has formed part of a larger project namedRadiade [3], which focusses on the improvement of radiantheat transfer models at high pressure and temperature formodeling of combustion, fluid flow, and radiation heattransfer phenomena as well as their mutual interactions[4]. However, the experimental results presented in thispaper are expected be of equal interest to the first men-tioned research area as the most recent release notes of
the HITRAN (2012) database states; “High-quality referencespectroscopic data for the carbon dioxide molecule remainsone of the top priorities for the HITRAN database, due in partto its importance for the environmental satellite missions,including OCO-2 and GOSAT and its importance to the studiesof the atmospheres of Mars and Venus” [5].
A number of gas cells have already been constructedand utilized to acquire spectroscopic measurements of CO2
at elevated temperatures and pressures [6–8]. Common tothe gas cells is that they are built of metal, a materialwhich is easy to machine and exhibits good thermal con-ductivity, assuring uniform temperature distribution.However, metal loses its strength at high temperature. Inrecent work by Stefani et al. [8] a commercial gas cell wasemployed which was designed for temperatures up to650 K and pressures up to 200 bar. In terms of pressurethis is sufficient to cover the peak pressures inside two-stroke ship engines, however, combustion temperaturesare much higher. Thus for combustion heat transfermodeling, experimental data at even higher temperaturesis required. The present gas cell cover the pressure levels
Contents lists available at ScienceDirect
journal homepage: www.elsevier.com/locate/jqsrt
Journal of Quantitative Spectroscopy &Radiative Transfer
http://dx.doi.org/10.1016/j.jqsrt.2015.10.0060022-4073/& 2015 Elsevier Ltd. All rights reserved.
n Corresponding author. Tel.: þ45 74888570; fax: þ45 7488 8708.E-mail address: [email protected] (T. Stolberg-Rohr).
Journal of Quantitative Spectroscopy & Radiative Transfer 169 (2016) 96–103
typical for combustion engines, and raises the temperatureto as high as 1300 K. Whilst this offers a great step intounexplored territory, it remains a demand for future gascells to reach temperatures above 2400 K at high pressuresto cover all engine conditions.
The present paper discusses the design of HTPGCincluding the choices and trade-offs involved. The cell isvalidated against previously published experiments aswell simulations based on the HITRAN2012 database [5].Finally, a recently recorded spectrum of 5% CO2 in N2 at101 bar and 1000 K is presented, well outside the para-metric space of previous experimental gas cell studies ofinfrared CO2 absorption.
2. Design of the high temperature and high pressuregas cell
The design of a high temperature and high pressure gascell involves a number of choices and trade-offs, includingcell material, window material, sealing method, dimen-sioning and safety. A sketch of HTPGC is shown in Fig. 1. A3-D drawing of the cell is shown at the top and a cross-section including dimensions is shown at the bottom ofthe figure. The outer and inner tubes of the cell are madeof a high grade ceramic (aluminum oxide, 99.5%) thatexhibits great strength even at high temperatures wheremetal capitulates. Ceramics are fragile and difficult tomachine but, in return, exhibit low thermal expansion andare less troubled by undesired surface reactions. Theceramic tubes are concentrically aligned as shown in thefigure and fixed by two water cooled brass flanges in theends. The brass flanges are bonded to the ceramic bymeans of a high temperature epoxy (J–B Weld). Holeslocated at the center of each flange allow for a straight lineof sight through the inner tubes.
Slightly tilted 3.0 mm thick ½″ sapphire windows areglass bonded to each end of the inner tubes in order toobtain a gas tight high temperature seal. The use of sapphirewindows restricts the wavelength range that can be studied
with this gas cell since sapphire blocks radiation above�6 mm, depending on window thickness and temperature.On the other hand, sapphire is extremely robust and has athermal expansion that is well matched to the ceramics inthe target temperature range. The latter is crucial in order toreduce thermal stresses. The volume confined by the twosapphire windows and the outer tube is the optically acces-sible measurement volume with a path length of30.3 mm70.1 mm. The choice of a relatively short pathlength is advantageous at high gas densities. The low thermalexpansion coefficient implies that the temperature depen-dence of the path length is very small, e.g. at 1000 K apathlength increase of 0.02 mm is estimated compared toroom temperature. Three separate heating coils protected byceramic beads are wound around the outer ceramic tube (notshown in the figure). One heating coil is covering the centralzone around the measurement volume and the two otherheating coils are placed symmetrically at each side next tothe central zone. At each zone a thermocouple is placed andtemperature control is applied to each zone independently,assuring high temperature uniformity over the measurementpath and compensation for additional heat loss at the win-dows. In addition to the three thermocouples used for con-trolling the heat zones, a total of six very thin ceramic tubesare running parallel with the center axis in the cavitybetween the outer and inner ceramic tubes. These tiny tubesare exactly thick enough for a 0.5 mm type N thermocoupleto be inserted from the outside, and under steady tempera-ture conditions, the thermocouple reflects the gas tempera-ture. A calibrated thermocouple can be cautiously slidedinside the ceramic tube to map the internal temperature fieldover the measurement path. Although the thermocouple iscalibrated to a specified accuracy of 0.4 K at 300 K and 0.8 Kat 1000 K, the uncertainty of the measured gas temperatureis larger because it is dominated by temperature distribu-tions, which is discussed in Section 3.1.
The heating zones are thermally insulated in order toreduce energy losses. A picture of the insulated gas cell isshown in Fig. 2. One of the end flanges can be seen to theleft along with a small piece of the outer ceramic tube.
Fig. 1. Top: 3-D drawing of HTPGC. Bottom: cross-section sketch of HPTGC including dimensions in mm. The ends of the inner ceramic tubes at the flangesare open.
C. Christiansen et al. / Journal of Quantitative Spectroscopy & Radiative Transfer 169 (2016) 96–103 97
Coiled tubes (gas inlets and outlets), water cooling inletand outlet, heat coil terminals, and thermocouple wirescan also be seen in the picture.
Two gas inlets or outlet tubes are located at each flangeand are connected to a flow control gas mixing systemspecified for pressures up to 200 bar. The gas enters the cellin the vacancy between the two ceramic tubes which servesto preheat the gas, which is important if the cell is to beoperated in flow mode. In this work, however, the gas cell isused in static mode. The pressure is measured at the outlettube by a Kistler pizoresistive pressure sensor, which for thepresented measurements was calibrated in the 0–100 barwith an accuracy of 70.25 bar. For measurements at atmo-spheric pressure, the pressure was instead measured by anexternal Rosemount pressure sensor with accuracy70.005 bar. HTPGC is designed to handle pressures up to200 bar and temperatures up to 1300 K but in the mea-surements presented for this paper measurements werelimited to 100 bar and 1000 K which is in itself well outsidepreviously studied conditions, intending to gather as muchuseful knowledge as possible about gas absorption beforestepping further into the unexplored territory with thepotential risk of permanently damaging the cell.
3. Validation of the high temperature and high pres-sure gas cell
To validate the strength and the tightness of the gas celland particularly the epoxy sealing, a dummy cell in the samedesign was filled with nitrogen at a pressure of 200 bar.Subsequently, without water cooling of the end flanges, thecell was slowly heated until the sealing collapsed. This hap-pened at 90 °C which agrees with the epoxy specification.During measurements at elevated temperatures, the endflanges were water cooled and maintained below 30 °C and
thus the cell stays tight when heated. However, to avoidaccidents during measurements a steel shield was builtaround the cell. The pressure level in the static cell revealswhether the cell including supply tubes is tight duringmeasurements. At room temperature and 80 bar the cellleaks 25 mln/min but at higher temperatures the leakage isstrongly reduced. At both 627 K and 1000 K the leakage is5 mln/min at 100 bar. The leakage implies a need to addtarget gas continuously to maintain the pressure. This doesnot compromise the measurement results if the target gasdoes not leak into the inactive optical path. In this work,however, a post-examination of the setup eventuallyrevealed that the gas did in fact leak into the inactive path.Since this causes potential errors, the gas cell design is cur-rently being improved. However, the inactive path is con-tinuously flushed with nitrogen which removes and highspectral resolution measurements, which are able to identifygas at low pressures, have shown that the effect on thepresented measurements is small.
3.1. Temperature uniformity
Fig. 3 shows measurements of the temperature uni-formity obtained at different temperatures. The tempera-ture uniformity over the length of the measurement pathranges from 72 K at 445 K (70.5%) to 71 K at 1000 K(70.1%) which means that the contribution to the overallmeasurement uncertainty is low.
4. Experimental setup for spectroscopic measurements
In order to obtain spectroscopic measurement withHTPGC an experimental setup was build and sketched inFig. 4. The source is a temperature-controlled water cooledblackbody cavity source at 800 °C. For background mea-surement it has an electronically activated mirror flip redir-ecting the field of view into a room temperature beam dumpcavity. On the spectrometer side a Nicolet 5700 FTIR spec-trometer was used, with highest nominal spectral resolution0.125 cm�1 and equipped with a liquid nitrogen-cooled InSbdetector. All optical path, apart from the measurementvolume, was continuously purged with dry, CO2-free air froma purge air generator. A gas mixing system in stainless steelhandling both inlet and outlet pressures up to 200 bar allowsa continuous range of gas concentrations to be studied.However, in this paper, all measurements were carried outwith high grade pure or premixed gases to eliminate anyuncertainties from the gas mixing. A vacuum pump was usedto flush the measurement chamber as well as gas lines andother dead volumes.
5. Measurement and calculation procedure
The procedure for exchanging the gas cell volume isfirst to empty the gas cell by a vacuum pump for a fewseconds, until the pressure is below 0.2 bar, and refillingthe cell with the new sample gas. The pumping is done5 times resulting in a purity of the new gas of 499.9%.
Fig. 2. HTPGC with insulation box. One of the brass flanges is visible tothe left along with a small part of the outer ceramic tube. The coiledstainless steel tubes are the gas inlets and outlets, whilst the smallstainless steel pipes forms part of the water cooling system. Threeterminals, one for each heat zone, are seen at the front of the box. Thepink wires at the back are the three thermocouples used by the tem-perature controller. (For interpretation of the references to color in thisfigure, the reader is referred to the web version of this article.)
C. Christiansen et al. / Journal of Quantitative Spectroscopy & Radiative Transfer 169 (2016) 96–10398
The desired physical quantity to be determined is thetransmission through the gas which is governed by Beer–Lamberts law; τgasðλÞ ¼ exp �σλNLð Þ; where σλ is the gasspecific absorption cross-section, N is the number con-centration and L is the pathlength.
Since the source intensity is not modulated in the setupused, the background radiation must be recorded inseparate measurements and subtracted from the sampleand reference spectra. Thus a total of 4 spectra arerequired to determine the transmission;
S:The sample spectrum; the gas cell is filled with thetarget gas.
ISBG: Background radiation spectrum; measured imme-diately after S whilst blocking the source radiation.
R:Reference spectrum; the gas cell is filled with theinfrared inactive gas N2. The source temperature and theoptical setup must be stable between the recording of Sand R.
IRBG: Background radiation spectrum corresponding tothe reference spectrum; recorded immediately after Rwiththe source blocked.
The first spectrum, S, gives us a source spectrum mul-tiplied by the gas transmission added with the backgroundradiation, ISBG λð Þ emitted from all surfaces, including theoptical windows in the gas cell. The complete spectrumbeing convoluted by the instrument function of the FTIR,
ΓðλÞ;
S¼Z
dλ0 Γ λ�λ0� �I0 λð ÞτgasðλÞ
� �þ ISBG λð Þ
I0 is the source intensity which includes all lossesthrough the optical system not related to gas absorption inthe measurement volume.
In the presented measurements I0and ISBG are approxi-mately constant over the width of the instrument functionand S simplifies to
S¼ I0 λð ÞZ
dλ0Γðλ�λ0Þ exp �σλNLð Þð Þþ ISBG λð Þ
A reference measurement is essential to determine thesource intensity as well losses through the optical system.This is recorded under identical conditions but with thetarget gas exchanged by the infrared inactive gas N2. Withsimilar assumptions, R can be described as
R¼ I0 λð Þþ IRBGðλÞ
ISBG λð Þ and IRBGðλÞ are measured immediately after S andR, respectively by blocking the source with a mirrowpointing towards a cold beam dump to minimize a con-tribution to the background radiation from this surface.
With these 4 spectra acquired, the apparent transmis-sion, τ�ðλÞ, can be calculated, which is the physical gastransmission convoluted with the instrument response
Fig. 4. Measurement setup. The experimental setup comprises gas bottles, gas mixing, flow controllers, HTPGC, a black body source with build-in flipmirror, and a spectrometer. Dimensions are in mm.
Fig. 3. Temperature distribution over the length of HTPGC at 446 K, 566 K, 627 K, and 1000 K.
C. Christiansen et al. / Journal of Quantitative Spectroscopy & Radiative Transfer 169 (2016) 96–103 99
function;
τ� λð Þ ¼ S� ISBGR� IRBG
¼Z
dλ0Γðλ�λ0Þ exp �σλNLð Þð Þ ð1Þ
At atmospheric pressures, gas absorption lines arespectrally narrow and cannot be properly resolved by thehigh resolution spectrometer of 0.125 cm�1. However, asthe pressure increases, the absorption lines are subject topressure broadening. This is illustrated in Fig. 5 showing aCO spectrum measured at 26 °C with spectrometer reso-lution 0.125 cm�1 at 1 bar, 14.5 bar, and 40.5 bar. At40.5 bar the high resolution is clearly unnecessary and canbe significantly reduced in return for a better signal tonoise ratio. Simulated transmission spectra are shown for14.5 bar and 40.5 bar and illustrates how the discrepancybetween the Voigt-based simulation and the measurementgrows with increasing pressure. The simulated spectra areobtained using the HITRAN2012 database and the line-by-
line calculation software spectralcalc.com [9], whichemploys the LinePak algorithms [10].
As the spectral broadening of σλ surpasses the width ofthe instrument function by a factor of 5 [11], Γ, the cal-culated transmission T� approaches the actual gas trans-mission, T ¼ exp �σλNLð Þ;
τ� λð Þ ¼ S� ISBGR� IRBG
¼ exp �σλNLð Þ ð2Þ
And the absorption coefficient k can be directlyextracted.
k¼Nσλ ¼ � ln τ� λð Þð Þ=LIn conditions where the physical broadening is nar-
rower than 5 times the instrument function, the measuredtransmission is denoted apparent transmission. Theinstrument function distributes the intensity over aninterval but does not affect the integrated band absorption,which can therefore be compared against databases orother measurements recorded with similar kL.
All measurements presented in the remaining of thispaper were recorded with a resolution of 2 cm�1 andusing Blackmann–Harris as apodization function, which isalso the choice in [8] to which HTPGC measurements arecompared.
6. Validation of spectroscopic measurementperformance
In this section the HTPGC measurements are validated.First, CO2 measurements at ambient temperature andpressure are compared with simulations based on thedatabase HITRAN2012 [5] and performed by SpectralCalc.com [9]. Secondly, the performance of HTPGC at hightemperature and pressure is compared with previouslyreported high temperature and high pressure measure-ments. The ambient conditions (22 °C and 1.0 bar) serve tovalidate the basic setup under well-defined conditions. In
Fig. 5. Transmission of 1% CO in N2 at increasing pressure measured with0.125 cm�1 resolution. Simulated (Voigt line shape) transmission spectraare shown for 14.5 and 40.5 bar and 299 K (black curves).
Fig. 6. Apparent transmission of 5% CO2 in N2 measured at ambient conditions (blue) and calculations based on the HITRAN2012 database (red).P¼1.017 bar and T¼299.2 K. (For interpretation of the references to color in this figure, the reader is referred to the web version of this article.)
C. Christiansen et al. / Journal of Quantitative Spectroscopy & Radiative Transfer 169 (2016) 96–103100
Fig. 6, the measured two major CO2 absorption bands,located around 2300 cm�1 and 3700 cm�1 are comparedwith simulations for 5% CO2 in N2. Both measurements aswell as simulations use a resolution of 2 cm�1. Differencesin instrument function and the theoretical broadeningmay cause differences in band shape, particularly in thestrong band. However, the integrated band absorption at agiven value of NL is unaffected by resolution and can becompared.
The strong band shows good correspondence betweenmeasured and simulated integrated band absorption overthe range 2200–2450 cm�1, although in the simulationthe absorption is slightly distributed towards the bandtails. The measured integrated band absorption is65.3 cm�1 which is 0.8% below the simulated result. Forthe weaker and less saturated band integrated over therange 3525–3775 cm�1, the integrated band absorption ismeasured to 9.09 cm�1 which is 2.6% above the simulatedband absorption. The estimated measurement uncertaintyis dominated by the uncertainty of the premixed gaswhich is certified to 72% of target concentration. Addingthe uncertainties of the temperature and pressure mea-surement, pathlength, as well as base line stability (nobaseline correction was made to the presented data), atotal uncertainty of 2.5% for the 3525–3775 range is esti-mated. With the database itself also being subject touncertainties, this deviation is considered acceptable.Nevertheless, attempts of reducing the deviation wereundertaken, including careful verification of the accuracyof the pressure and temperature measurement, whilst asimplified model version of the gas cell was built to verifythe pathlength. The investigations did not change themeasured band absorption value or the accuracy estimate.Instead, it is noted that the deviation is not uniformlydistributed over the absorption band. The integratedabsorption over the CO2 sub-branch at 3655–3775 cm�1
deviates from simulations by 3.4% with a peak deviation ashigh as 4.8% whilst for the sub-branch at 3525–3655 cm�1, the discrepancy is just 1.4% between mea-surement and simulations. It is further noted that themaximum deviation is coinciding with the double fre-quency of the sapphire cutoff position. It thus appears thatour measurements uncertainty at this position is affectedby a double modulation in the interferometer. In principle,the sapphire edge should not be visible after subtractingthe background radiation spectrum. However, if there is atemperature difference of the sapphire windows betweenthe background measurement and the actual measure-ment, which could be a result of the source heating up thenearest window, then the sapphire absorption edge shiftsin wavelength between the two recorded spectra. Nooptical filters were inserted to avoid the double modula-tion because a wide spectral range was desired; howeverfor future work with the cell this will be considered. Theerror contribution from this measurement artifact dimin-ishes with increasing absorption, as in the case of elevatedpressure.
In order to validate the gas cell at elevated temperatureand pressure, measurements from two previous works[6,8] were repeated. 26 years ago, in 1989, Hartmann andPerrin presented measurements of the far wing ν3 band
head (above 2400 cm�1) of CO2 at elevated temperatureand pressure utilizing a grating spectrometer with 2 cm�1
resolution [6]. Fig. 7 shows the transmission reported in[6] for 100% CO2 at 627 K and 31.9 bar over a pathlength of4.4 cm together with the transmission measured withHTPGC filled with 100% CO2 at 627 K and 31.9 bar. For thepurpose of comparison the HTPGC measurement has beenconverted to a path length of 4.40 cm by raising themeasured transmission to the power of (4.40/3.03). This isvalid since the spectral line broadening is well resolved bythe spectrometer, and the measured transmission isdescribed by Eq. (2).
The agreement with the far wing ν3 band head isimpressive, and this band edge is the specific focus ofHartmann and Perrin. The other band edge shows a lessperfect match, which is possibly related to the tempera-ture dependence of the cut-off edge of sapphire windowsemployed both in HTPGC as well as in [6], which dete-riorates the baseline performance below 2200 cm�1.
Recent work on high temperature and pressure CO2
absorption by Stefani et al. [8] was attributed to the studyof the atmosphere of Venus. In their work, four weakabsorption bands of CO2 were studied, two of which lieoutside the sensitivity range of our detector, whilst two arein the vicinity of our measurement region (2000–5200 cm�1). We have repeated their measurement of100% CO2 at 19.3 bar and 566 K and the resulting absorp-tion coefficients k¼ � ln τð Þ=L¼ σλN, are compared inFigs. 8 and 9. Also shown is a Voigt-based simulatedtransmission spectrum using the HITRAN2012 database.
In accordance with Stefani et al., we measure sig-nificantly stronger band absorption compared to thesimulated spectrum. However, the absorption measuredwith the HTPGC is significantly weaker than measured byStefani et al. The estimated uncertainty of the HTPGCmeasurements is 2.0% at the peak values, which is domi-nated by the pressure measurement uncertainty as well asthe baseline drift which is affected by the spectral locationnear the edges of our measurement range. In comparison,the difference to the simulated peak values is around 10%for both bands. The large deviation from [8] can possibly
Fig. 7. Transmission of 100% CO2 at 31.9 bar, 627 K, and L¼4.40 cmmeasured by Hartmann and Perrin and with HTPGC. The HTPGC trans-mission has been raised to the power of 4.40/3.03 to account for thepathlength difference.
C. Christiansen et al. / Journal of Quantitative Spectroscopy & Radiative Transfer 169 (2016) 96–103 101
be ascribed to a baseline drift in their transmissionmeasurements.
7. Results
The gas cell was filled with 5% CO2 in nitrogen to apressure of 101 bar at 1000 K. The resulting absorptioncoefficient is shown in Fig. 10 and 11. Under this highpressure the ν3 band in Fig. 10 is strongly saturated, but thetail is very important for accurate modeling of the gasemissivity and radiative transfer in combustion processes.The red curve shows a simulation based on HITEMP2010[12] and Voigt line shapes. The result is a significantdeviation from the measurement with an overestimationof the integrated band absorption of 20% at 101 bar,1000 K, and L¼3.03 cm. The measured integrated bandabsorption is 226 cm�1 evaluated in the range 2050–2550 cm�1.
The weaker combination band around 3700 cm�1 isnot saturated although strongly absorbing, and thus it ispossible to extract the absorption coefficient for thecomplete band, see Fig. 11.
For this band a similar tendency is observed; the mea-surement reveals slightly sharper features than the Voigtsimulation which overestimates the band tail. However, inthis case the simulated integrated band absorption is inagreement within 2.5% of the measurement, because theoverestimation of the tail is counterbalanced by the weakerpeak absorption. The measured integrated band absorption is201 cm�1 in the range 3300–3800 cm�1 with an uncertaintyestimated to 3.0%.
Although extensively used, the Voigt line shape is wellknown to be inadequate to model CO2 absorption at ele-vated pressures and empirical corrections have beenimplemented [13–17] up to 60 bar. However, the inte-grated band comparison with the Voigt simulation isinteresting as it may be sufficiently accurate for purpose ofmodeling radiative transfer, or at least give an impression
Fig. 8. Absorption coefficient for 100% CO2 in N2 at 19.3 bar and 566 Kreported by Stefani et al. and measured with HTPGC. A simulated spec-trum based on the HITRAN2012 database and Voigt line shapes isalso shown.
Fig. 9. Absorption coefficient for 100% CO2 in N2 at 19.3 bar and 566 Kreported by Stefani et al. and measured with HTPGC. A simulated spec-trum is shown based on the HITRAN2012 database and Voigt line shapes.The stippled part of the blue line indicates that the HTPGC measurementis affected by the appearance of the first harmonics of the strong ν3-band.(For interpretation of the references to color in this figure, the reader isreferred to the web version of this article.)
Fig. 10. Measurement with HTPGC of 5% CO2 in nitrogen at 101 bar and1000 K. Shown together with a simulation based on HITEMP2010 and theVoigt formalism. (For interpretation of the references to color in thisfigure legend, the reader is referred to the web version of this article.)
Fig. 11. Measurement with HTPGC of 5% CO2 in nitrogen at 101 bar and1000 K. Shown together with a simulation based on HITEMP2010 and theVoigt formalism. The instrument resolution was 2 cm�1.
C. Christiansen et al. / Journal of Quantitative Spectroscopy & Radiative Transfer 169 (2016) 96–103102
of the consequences of employing the simple Voigt form-alism in such modeling.
In contrast to the comparison of integrated bandabsorption, the derived absorption coefficient is in lessquantitative correspondence with the simulation with thethree larger peaks between 13% and 18% stronger in themeasurement compared to simulation. As discussed inSection 6, this band is affected by a measurement artifactwhich is estimated to be able to account for up to 5% of thestrongest peak. The background radiation in the mea-surement contributed with about half the measuredintensity around 2300 cm�1 in the absence of CO2 andabout 10% of the intensity at 3700 cm�1.
The present work provides spectral data that can be usedfor experimental verification of these models beyond pre-viously reported temperature and pressure combinations.
8. Discussion
In this paper a peak deviation of up to 5% was assignedto a measurement artifact related to a double modulationsignal appearing around 3750 cm�1. The feature appearsto be replicating the raw spectrum at the double fre-quency; however, attempts of determining and correctingfor the contribution of this artifact were unsuccessful.Instead, the measurement result was given without cor-rection but with an estimate of the additional uncertaintyaround this wavelength. Obtaining more accurate resultsat this wavelength might require the use of a differentwindow material but this must be weighed against theadvantages of sapphire. The 1000 K measurement, whichis found in supplementary materials, reveals small levelsof methane inside the cell. This is attributed to the glueand increases with the time the gas spends in the cell.Therefore the setup is being reworked to reduce this timeprior to measurements at higher temperatures.
9. Conclusion
A high temperature and pressure gas cell for quantitativespectroscopic measurements designed for higher tempera-ture and pressure combinations than previously reported hasbeen realized and presented. Measurements have beencompared with simulations based on HITEMP2010 using theVoigt line shape. A significant deviation from the measure-ment with an overestimation of the integrated ν3-bandabsorption of 20% at 101 bar and 1000 K, whereas only aminor deviation of 2.5% is seen for the weaker CO2 bandlocated around 3700 cm�1. Thus, a simple HITEMP2010simulation might be used as a tool to estimate gas absorptionat engine conditions if errors are acceptable. In future workthe gas cell will be utilized for systematic investigations ofthe absorption of CO2 and H2O at temperatures up to 1273 Kand 200 bar pressure.
Acknowledgment
The present work was funded by the project RADIADEunder contract no. 10-093974 financed by The DanishCouncil for Strategic Research. Thomine is an industrialPhD student at Danfoss IXA A/S and her work is supportedby the Danish Agency of Science, Technology and Innova-tion (DASTI) (Project number 11-117567).
References
[1] Baines Kevin H, Atreya Sushil, Carlson Robert W, Crisp David,Drossart Pierre, Formisano Vittorio, Limaye Sanjay S, MarkiewiczWojciech J, Piccioni Giuseppe. To the depths of Venus: exploring thedeep atmosphere and surface of our sister world with VenusExpress. Planet Space Sci 2006;54:1263–78.
[2] Rivière Philippe, Soufiani Anouar. Updated band model parametersfor H2O, CO2, CH4 and CO radiation at high temperature. Int J HeatMass Transf 2012;55:3349–58.
[3] Schramm J. Technical University of Denmark, ⟨http://www.radiade.mek.dtu.dk/⟩; 2014 [Accessed April 2015].
[5] Rothman LS, Gordon IE, Babikov Y, Barbe A, Chris Benner D, BernathPF, et al. The HITRAN 2012 molecular spectroscopic database. JQuant Spectrosc Radiat Transf 2013;130:4–50.
[6] Perrin Marie-Yvonne, Hartmann Jean-Michel. Measurements of pureCO2 absorption beyond the v3 bandhead at high temperature. ApplOpt 1989;28(13):2550–3.
[7] Farroq A, Jeffries JB, Hanson RK. Measurements of CO2 concentrationand temperature at high pressures using 1f-normalised wavelengthmodulation spectroscopy with second order harmonic detectionnear 2.7 um. Appl Opt. 2009;48(35):6740–53.
[8] Stefani Stefania, Piccioni Guiseppe, Snels Marcel, Grassi Davide.Experimental CO2 absorption coefficients at high pressure and hightemperature. J Quant Spectrosc Radiat Transf 2013;117:21–8.
[10] Gordley Larry L, Marshall Benjamin T, Chu D Allen. LINEPAK: algo-rithms for modeling spectral transmittance and radiance. J QuantSpectrosc Radiat Transf 1994;52(5):563–80.
[11] Mellqvist Johan, Rosén Arne. DOAS for flue gas monitoring-II.Deviations from the Beer–Lambert law for the U.V./visible absorp-tion spectra of NO, NO, SO2 and NH3. J Quant Spectrosc Radiat Transf1996;56:209–24.
[12] Rothman LS, Gordon IE, Barber RJ, Dothe H, Gamache RR, GoldmanA, et al. HITEMP, the high-temperature molecular spectroscopicdatabase. J Quant Spectrosc Radiat Transf 2010;111:2139–50.
[13] Filippov Nikolai N, Asfin RE, Sinyakova TN, Grigoriev IM, Petrova TM,Solodov AM, et al. Experimental and theoretical studies of CO2
spectra for planetary atmosphere modelling: region 600–9650 cm�1
and pressures up to 60 atm. Phys Chem Chem Phys 2013;15:13826.[14] Perrin MY, Hartmann JM. Temperature-dependent measuremnets
and modeling of absorption by CO2–N2 mixtures in the far line-wings of the 4.3 mm CO2 band. J Quant Spectrosc Radiat Transf1989;42:311–7.
[15] Tran H, Boulet C, Stefani S, Snels M, Piccioni G. Modeling of highpressure pure CO2 spectra from 750 to 8500 cm�1. I-central andwing regions of the allowed vibrational bands. J Quant SpectroscRadiat Transf 2011;112:925–36.
[16] Alberti Michael, Weber Roman, Mancini Marco. Re-creating Hottel’semissivity charts for carbon dioxide and extending them to 40 barpressure using HITEMP-2010 data base. Combust Flame 2014;162:597–612.
[17] Lamouroux J, Régalia L, Thomas X, Vander Auwera J, Gamache RR,Hartmann J-M. CO2 line-mixing database and software update andits tests in the 2.1 μm and 4.3 μm regions. J Quant Spectrosc RadiatTransf 2015;151:89–96.
C. Christiansen et al. / Journal of Quantitative Spectroscopy & Radiative Transfer 169 (2016) 96–103 103
List of Acronyms
ECA Emission Control Areas
EGR exhaust gas recirculation
FTIR Fourier transform infrared
FWHM full width at half maximum
HC hydrocarbon
HTF Danish high technology foundation
IML Infrared Multilayer Laboratory
IMO International Maritime Organisation
NBP narrow bandpass
NDIR non-dispersive infrared
SCR selective catalytic reduction
VMR volume mixing ratio
WBP wide bandpass
Bibliography
[1] Thomine Stolberg-Rohr et al. In optics humidity compensation in NDIR exhaust gasmeasurements of NO2. Proceedings of Advanced Photonics Congress, Sensors, 2015.
[2] Thomine Stolberg-Rohr and Gary J. Hawkins. Spectral design of temperature-invariantnarrow bandpass filters for the mid-infrared. Optics Express, 23(1):580–596, 2015.
[3] Daniel Poitras. Spotlight on optics. https://www.osapublishing.org/spotlight/sum-mary.cfm?id=307633, March 2015.
[4] Gary J. Hawkins and Thomine Stolberg-Rohr. Determination of the embedded thermo-optical expansion coefficients of PbTe and ZnSe thin film infrared multilayers. OpticsExpress, 23(12):16348–16355, 2015.
[5] Kåre Press-Kristensen and Christian Ege. Renere skibsfart. Det Økologiske Råd, 1sted. edition, 2011.
[6] Jørgen Brandt et al. Assessment of health-cost externalities of air pollution at thenational level using the EVA model system. Technical report, Aarhus University,National Environmental Research Institute, Department of Atmospheric Environment,March 2011.
[7] Maritime Cyprus International News Blog. 10 reasons why ship operators should benervous about the 2015 ECA regulations. In Maritime Regulations and Conventions,November 19 2014.
[8] International Maritime Organization. Pollution prevention.http://www.imo.org/en/OurWork/Environment/PollutionPrevention/Pages/Default.aspx,2015.
[9] International Maritime Organization. Revised MARPOL Annex VI. Resolutionmepc.176(58) edition, 2008.
[10] C. S. Brookman. Exhaust gas monitoring. IMAS 96 - Shipping and the environment:is compromise inevitable? PT I, 108(5):31–36, 1996.
[11] S. Brynolf, M. Magnusson, E. Fridell, and K. Andersson. Compliance possibilities forthe future ECA regulations through the use of abatement technologies or change offuels. Transportation Research Part D: Transport and Environment, 28:6 – 18, 2014.
XLIV BIBLIOGRAPHY
[12] W. Addy Majewsky and Magdi K. Khair. Diesel Emissions and Their Control. SAEInternational, 2006.
[13] Kati Lehtoranta, Hannu Vesala, Paivi Koponen, and Satu Korhonen. Selective catalyticreduction operation with heavy fuel oil: NOx NH3, and particle emissions. Environ-mental Science and Technology, 49(7):4735–4741, 2015.
[14] Jakob Mahler Hansen. Exhaust gas recirculation control for diesel engines. PhDthesis, 2013.
[15] Gwang-jung Kim, Byungchul Choi, and Inchul Choi. Real-time co2 sensor for theoptimal control of electronic EGR system. volume 9044, pages 90440C–90440C–7,2013.
[16] Jussi Lyyränen, Jorma Jokiniemi, Esko I. Kauppinen, and Jorma Joutsensaari. Aerosolcharacterisation in medium-speed diesel engines operating with heavy fuel oils. Jour-nal of Aerosol Science, 30(6):771 – 784, 1999.
[17] HFO Handbook. Notes on heavy fuel oil. American Bureau of Shipping, ABS, publi-cation, 31, 1984.
[18] Germanisher Lloyd SE, editor. Rules for Clasification and Construction, chapter VIAdditional Rules and Guidelines. Germanisher Lloyd SE, Hamburg, 2012.
[19] MAN B&W Diesel A/S. Emission control MAN B&W two-stroke diesel engines.Copenhagen, Denmark, 2004.
[20] MAN B&W Diesel A/S. L32/40 project guide - marine four-stroke genset compliantwith imo tier ii, November 2013.
[22] J. O. W. Norris. Appendix 1 Technologies available for measuring NOx. In An In-Service Emissions Test for Spark Ignition (SI) Petrol Engines. EMStec Ltd, December2002.
[23] Bo Svensson. Direct emissions measurement. Diesel & Gas Turbine Worldwide,November 2014.
[24] John E. Orban et al. Long-term aging of NOx sensors in heavy-duty engine exhaust.Sae Technical Papers, Sae Techni. Paper, 2005.
[25] M. Ioannou, G. Papalambrou, N. P. Kyrtatos, H. Dumele, and M. Diessner. Evalu-ation of emission sensors for four-stroke marine diesel engines. Journal of marineengineering and technology, 12(3):20–29, 2013.
[26] J.-Y. Zhang and I. W. Boyd. Lifetime investigation of excimer uv sources. AppliedSurface Science, 168(1-4):296–299, 2000.
BIBLIOGRAPHY XLV
[27] Jacob Y. Wong and Roy L. Anderson. Non-dispersive Infrared Gas Measurement.International Frequency Sensor Associaton Publishing, 2012.
[28] Ross Stanley. Plasmonics in the mid-infrared. Nature Photonics, 6(7):409–411, 2012.
[29] T. Wijaya, T. Tjahjowidodo, and P Thepsithar. Real time ship exhaust gas monitoringfor compliance to SOx and NOx regulation and CO2 footprint. Sun Above the Horizon:Meteoric Rise of the Solar Industry, 5:201, 2014.
[30] A. J. de Castro, J. Meneses, S. Briz, and F. López. Nondispersive infrared monitor-ing of NO emissions in exhaust gases of vehicles. Review of Scientific Instruments,70(7):3156–3159, 1999.
[31] Louise Helen Crawley. Application of non-dispersive infrared (NDIR) spectroscopy tothe measurement of atmospheric trace gases. Master’s thesis, University of Canterbury,Christchurch, New Zealand, 2008.
[32] You-Wen et al. Sun. Water vapor interference correction in a non dispersive infraredmulti-gas analyzer. Chinese Physics Letters, 28(7):073302, 2011.
[33] You-Wen et al. Sun. Cross-interference correction and simultaneous multi-gas analysisbased on infrared absorption. Chinese physics B, 21(9), 2012.
[34] M. Diem. Introduction to Modern Vibrational Spectroscopy. Wiley, 1993.
[36] A. D. H. Clague, J. B. Donnet, T. K. Wang, and J. C. M. Peng. A comparison of dieselengine soot with carbon black. Carbon, 37(10):1553–1565, 1999.
[37] Y. Kimura, T. Sato, and C. Kaito. Production and structural characterization of carbonsoot with narrow UV absorption feature. Carbon, 42(1):33–38, 2004.
[38] JanaMoldanova et al. Characterisation of particulate matter and gaseous emissionsfrom a large ship diesel engine. Atmospheric Environment, 43(16):2632–2641, 2009.
[39] René Bergmann, Aliaksandra Ivinskaya, J Kafka, Fridolin Okkels, and Mogens HJakobsen. From modeling to fabrication of double side microstructured silicon win-dows for infrared gas sensing in harsh environments. In Advanced ElectromagneticMaterials in Microwaves and Optics (Metamaterials), pages 58–60. IEEE, 2014.
[40] Chandler Downs and Thomas E. Vandervelde. Progress in infrared photodetectorssince 2000. Sensors, 13(4):5054–5098, 2013.
[41] Koichiro Ueno, Edson Gomes Camargo, Takashi Katsumata, Hiromasa Goto, NaohiroKuze, Yoshihiro Kangawa, and Koichi Kakimoto. InSb mid-infrared photon detectorfor room-temperature operation. Japanese Journal of Applied Physics, 52(9), 2013.
[42] L.S. Rothman et al. The HITRAN 2008 molecular spectroscopic database. Journal ofQuantitative Spectroscopy and Radiative Transfer, 110:533–572, 2009.
XLVI BIBLIOGRAPHY
[43] Johan Sjoholm et al. Simultaneous visualization of OH, CH, CH2O and toluene PLIFin a methane jet flame with varying degrees of turbulence. Proceedings of The Com-bustion Institute, 34(1):1475–1482, 2013.
[44] Fred G. Rounds Martin A. Elliott, Gerge J. Nebel. The composition of exhaust gasesfrom diesel, gasoline and propane powered motor coaches. Journal of the Air PollutionControl Association, 5(2):103–108, 1955.
[45] Frank L. Pedrotti, Leno Matthew. Pedrotti, and Leno S. Pedrotti. Introduction to optics.Pearson Prentice Hall, 2007.
[46] H. A. Macleod. Thin-film optical filters. CRC Press, 2010.
[47] G. J. Hawkins. Spectral characterisation of infrared optical materials and filters. PhDthesis, The University of Reading, 1998. #R7935.
[48] O. S. Heavens. Optical properties of thin films. Reports on progress in physics, 23:2–65, 1960.
[49] Jeppe Seidelin Dam, Peter Tidemand-Lichtenberg, and Christian Pedersen. Room tem-perature mid-ir single photon spectral imaging. Nature Photonics, 6:788–793, 2012.
[52] C. S. Evans, R. Hunneman, J. S. Seeley, and A. Whatley. Filters for ν2 band of CO2:monitoring and control of layer deposition [atmospheric temperature sounding appli-cations]. Applied Optics, 15(11):2736–2745, 1976.
[53] B. Li, S. Y. Zhang, J. C. Jiang, D. Q. Liu, and F. S. Zhang. Recent progress in improv-ing low-temperature stability of infrared thin-film interference filters. Optics Express,13(17):6376–6380, 2005.
[54] L. S. Rothman et al. Hitemp, the high-temperature molecular spectroscopic database.Journal of Quantitative Spectroscopy and Radiative Transfer, 111(15):2139–2150,2010.
[55] Det Strategiske Forskningsråd. RADIADE - Modellering og verificering afstråling i marine dieselmotorer. http://www.strategiskforskning.dk/projects/radiade-modellering-og-verificering-af-straaling-i-marine-dieselmotorer, 2011-2015.
NOX Monitoring in Humid Exhaust GasUsing Non-Dispersive Infrared Spectroscopy
Thomine Stolberg-Rohr PhD Thesis
August 2015
Department of Chemical and Biochemical EngineeringTechnical University of DenmarkBuilding 229DK – 2800 Kgs. LyngbyDenmark Phone: +45 4525 2800Web: www.chec.kt.dtu.dk


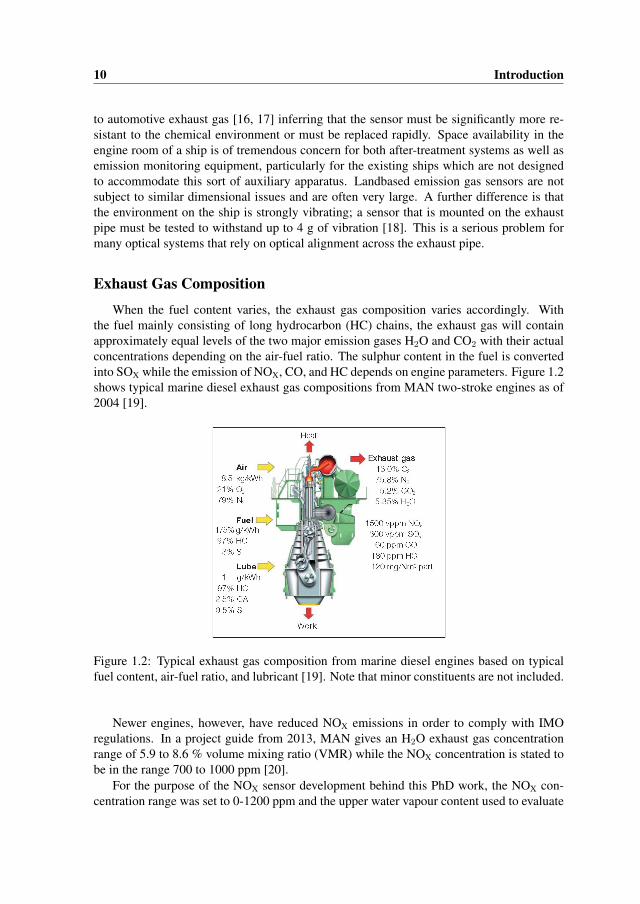


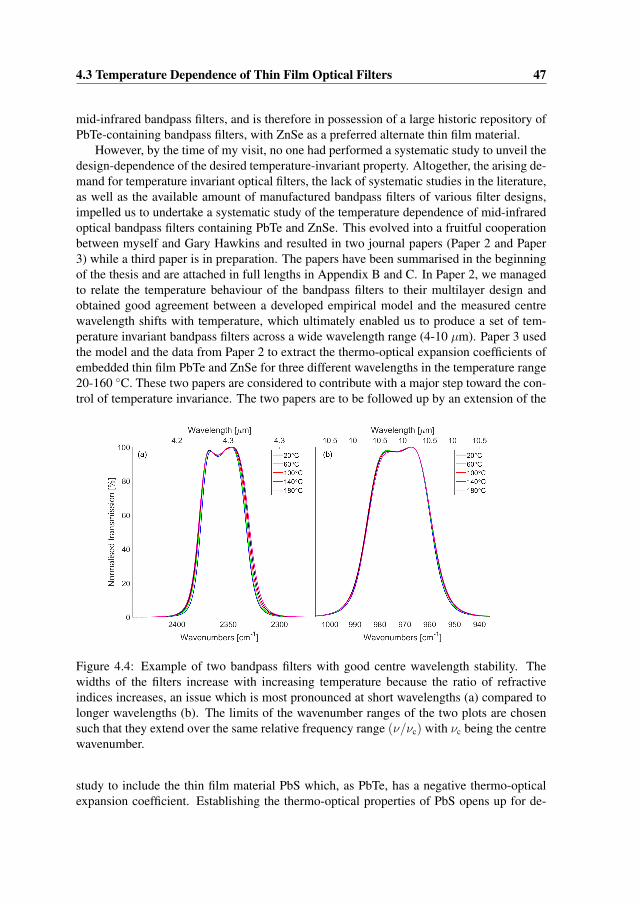


![Thermophysicalpropertiesofdryandhumidair ... · range of temperature and pressure. Data on gW of compressed humid air [7], humid nitrogen, humid argon, and humid carbon dioxide [9]](https://static.documents.pub/doc/80x56/5e626081cfea87225a37645c/thermophysicalpropertiesofdryandhumidair-range-of-temperature-and-pressure.jpg)


