31
NPB International Trade Update Becca Hendricks, VP International Marketing
| Date post: | 28-Dec-2015 |
| Category: |
Documents |
| Upload: | harvey-little |
| View: | 214 times |
| Download: | 0 times |

NPB International Trade Update
Becca Hendricks, VP International Marketing

US Pork in a Big World• 96% of the world population lives outside of the US …and
pork is the world’s most consumed animal protein• 2050: 9 billion people, 60-70% more food• Over the next decade, increases in meat consumption:
– 2.4% in developing countries– 0.9% in developed countries
• US pork must (and can) remain a key global competitor

2015 Areas of Investment
• Marketing and promotion• Market research• Market intelligence• New product development
• Marketing and promotion• Market research• Market intelligence• New product development

Export GoalBy 2020, increase pork exports through access to new markets and expansion of existing markets, and achieve an increase of 2.7 billion pounds and $3.1 billion, or 9% average annual increase in value and quantity compared to 2014 year-end data.

Our Export Roadmap
• Implement an integrated plan for access & promotion• Define aggressive market access actions• Identify new market development opportunities • Clarify strategies and tactics, and develop loyalty in existing
markets• Provide the products desired by customers

Year-to-Date 2014 Exports• $4.003 B, ↑16%, 2.909 B lbs, ↑7%
• The first year that value has exceeded $4B before August
• In July:• Volume ↓3% (first month in 2014)
• Value ↑14%
• Value at $64.45/head, 28% of production
• Record pace despite prices and intense global competition
• High prices for domestic pork in many countries
• Market closures, changing trade flows…

Russia Situation• Feb 2013: Russia suspended imports
of US beef and pork, due to beta-agonist policy
• Feb 2014: Began allowing US pork produced under USDA AMS Never-Fed Beta Agonists program, approved 2 plants
• June 2014: Exports reached 9,371 MT (98,830 MT in 2012)
• Putin decree of a “ban or restriction” on ag imports from countries that have imposed sanctions, including US, EU, Canada, Norway, Australia
What this means:•Russian reductions in supplies
Beef: -8% Pork and Poultry: -12%
•Displaces 16% of Canada’s exports or 68% of their production •Brazil/South America and China(!) will likely be able to supply portion of banned poultry losses…pork?•China and Russia bans WILL shift global pork flows

Top US Export Markets: Jan-July 2014
Mexico 855.7 M, ↑12%Japan 644.3, ↑16%China/HK 473.8, ↓10%Canada 262.4, ↓10%Korea 183.3, ↑31%C/S Am 149.9, ↑8%ASEAN 94.5, ↑13%Oceania 90.5, ↑8%
Japan $1.208 B, ↑9%Mexico $887.1 M, ↑38%China/HK $474.4, ↓ 7%Canada $509.4, ↑ 5%Korea $257.5, ↑49%C/S Am $187.6,↑20%Oceania $141.9, ↑18%ASEAN $113.4, ↑24%
Volume (Million Pounds) Value (Million $)
Source: USDA statistics compiled by USMEF, compared to 2013
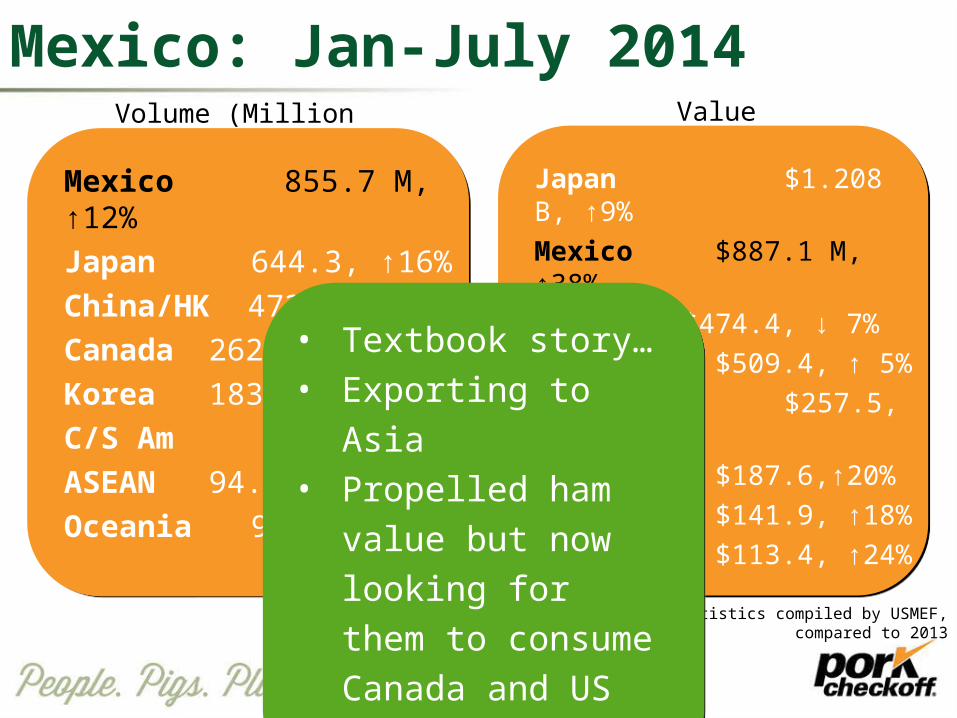
Mexico: Jan-July 2014Volume (Million Pounds) Value (Million $)
Source: USDA statistics compiled by USMEF, compared to 2013
Mexico 855.7 M, ↑12%Japan 644.3, ↑16%China/HK 473.8, ↓10%Canada 262.4, ↓10%Korea 183.3, ↑31%C/S Am 149.9, ↑8%ASEAN 94.5, ↑13%Oceania 90.5, ↑8%
Japan $1.208 B, ↑9%Mexico $887.1 M, ↑38%China/HK $474.4, ↓ 7%Canada $509.4, ↑ 5%Korea $257.5, ↑49%C/S Am $187.6,↑20%Oceania $141.9, ↑18%ASEAN $113.4, ↑24%
• Textbook story…• Exporting to Asia• Propelled ham value
but now looking for them to consume Canada and US hams
• Textbook story…• Exporting to Asia• Propelled ham value
but now looking for them to consume Canada and US hams

Japan: Jan-July 2014Volume (Million Pounds) Value (Million $)
Source: USDA statistics compiled by USMEF, compared to 2013
Mexico 855.7 M, ↑12%Japan 644.3, ↑16%China/HK 473.8, ↓10%Canada 262.4, ↓10%Korea 183.3, ↑31%C/S Am 149.9, ↑8%ASEAN 94.5, ↑13%Oceania 90.5, ↑8%
Japan $1.208 B, ↑9%Mexico $887.1 M, ↑38%China/HK $474.4, ↓ 7%Canada $509.4, ↑ 5%Korea $257.5, ↑49%C/S Am $187.6,↑20%Oceania $141.9, ↑18%ASEAN $113.4, ↑24%
• 5% production decrease• Stagnant demand• FTA’s with Aust, Mex, Chile
• 5% production decrease• Stagnant demand• FTA’s with Aust, Mex, Chile

China: Jan-July 2014Volume (Million Pounds) Value (Million $)
Source: USDA statistics compiled by USMEF, compared to 2013
Mexico 855.7 M, ↑12%Japan 644.3, ↑16%China/HK 473.8, ↓10%Canada 262.4, ↓10%Korea 183.3, ↑31%C/S Am 149.9, ↑8%ASEAN 94.5, ↑13%Oceania 90.5, ↑8%
Japan $1.208 B, ↑9%Mexico $887.1 M, ↑38%China/HK $474.4, ↓ 7%Canada $509.4, ↑ 5%Korea $257.5, ↑49%C/S Am $187.6,↑20%Oceania $141.9, ↑18%ASEAN $113.4, ↑24%
• Racto testing gives EU advantage• Recent delistings• Reduced variety meat exports• Surge in muscle meat exports• Took first chilled imports in March
• Racto testing gives EU advantage• Recent delistings• Reduced variety meat exports• Surge in muscle meat exports• Took first chilled imports in March

Canada: Jan-July 2014Volume (Million Pounds) Value (Million $)
Source: USDA statistics compiled by USMEF, compared to 2013
Mexico 855.7 M, ↑12%Japan 644.3, ↑16%China/HK 473.8, ↓10%Canada 262.4, ↓10%Korea 183.3, ↑31%C/S Am 149.9, ↑8%ASEAN 94.5, ↑13%Oceania 90.5, ↑8%
Japan $1.208 B, ↑9%Mexico $887.1 M, ↑38%China/HK $474.4, ↓ 7%Canada $509.4, ↑ 5%Korea $257.5, ↑49%C/S Am $187.6,↑20%Oceania $141.9, ↑18%ASEAN $113.4, ↑24%
• PEDv challenges• US has 30% share of domestic consumption• Russia closure = 16% of exports and 68% of production• Global shift of markets
• PEDv challenges• US has 30% share of domestic consumption• Russia closure = 16% of exports and 68% of production• Global shift of markets

South Korea: Jan-July 2014Volume (Million Pounds) Value (Million $)
Source: USDA statistics compiled by USMEF, compared to 2013
Mexico 855.7 M, ↑12%Japan 644.3, ↑16%China/HK 473.8, ↓10%Canada 262.4, ↓10%Korea 183.3, ↑31%C/S Am 149.9, ↑8%ASEAN 94.5, ↑13%Oceania 90.5, ↑8%
Japan $1.208 B, ↑9%Mexico $887.1 M, ↑38%China/HK $474.4, ↓ 7%Canada $509.4, ↑ 5%Korea $257.5, ↑49%C/S Am $187.6,↑20%Oceania $141.9, ↑18%ASEAN $113.4, ↑24%
• Imports recovering, US has dominant share• PEDv challenges, now FMD• Highest production costs• Greater access in 2016
• Imports recovering, US has dominant share• PEDv challenges, now FMD• Highest production costs• Greater access in 2016

C/S America: Jan-July 2014Volume (Million Pounds) Value (Million $)
Source: USDA statistics compiled by USMEF, compared to 2013
Mexico 855.7 M, ↑12%Japan 644.3, ↑16%China/HK 473.8, ↓10%Canada 262.4, ↓10%Korea 183.3, ↑31%C/S Am 149.9, ↑8%ASEAN 94.5, ↑13%Oceania 90.5, ↑8%
Japan $1.208 B, ↑9%Mexico $887.1 M, ↑38%China/HK $474.4, ↓ 7%Canada $509.4, ↑ 5%Korea $257.5, ↑49%C/S Am $187.6,↑20%Oceania $141.9, ↑18%ASEAN $113.4, ↑24%
• Increasing GDP’s, populations• Colombia eliminated trichinae
restrictions, up 72%, no #7• Increasing chilled exports to
Colombia, Peru, CAFTA/DR
• Increasing GDP’s, populations• Colombia eliminated trichinae
restrictions, up 72%, no #7• Increasing chilled exports to
Colombia, Peru, CAFTA/DR

ASEAN: Jan-July 2014Volume (Million Pounds) Value (Million $)
Source: USDA statistics compiled by USMEF, compared to 2013
Mexico 855.7 M, ↑12%Japan 644.3, ↑16%China/HK 473.8, ↓10%Canada 262.4, ↓10%Korea 183.3, ↑31%C/S Am 149.9, ↑8%ASEAN 94.5, ↑13%Oceania 90.5, ↑8%
Japan $1.208 B, ↑9%Mexico $887.1 M, ↑38%China/HK $474.4, ↓ 7%Canada $509.4, ↑ 5%Korea $257.5, ↑49%C/S Am $187.6,↑20%Oceania $141.9, ↑18%ASEAN $113.4, ↑24%
• Philippines and Singapore #9 and 10• Singapore ↑182!...gray trade with China• Philippines down, outlet for EU product• White offal access to Vietnam
• Philippines and Singapore #9 and 10• Singapore ↑182!...gray trade with China• Philippines down, outlet for EU product• White offal access to Vietnam

Oceania: Jan-July 2014Volume (Million Pounds) Value (Million $)
Source: USDA statistics compiled by USMEF, compared to 2013
Mexico 855.7 M, ↑12%Japan 644.3, ↑16%China/HK 473.8, ↓10%Canada 262.4, ↓10%Korea 183.3, ↑31%C/S Am 149.9, ↑8%ASEAN 94.5, ↑13%Oceania 90.5, ↑8%
Japan $1.208 B, ↑9%Mexico $887.1 M, ↑38%China/HK $474.4, ↓ 7%Canada $509.4, ↑ 5%Korea $257.5, ↑49%C/S Am $187.6,↑20%Oceania $141.9, ↑18%ASEAN $113.4, ↑24%
• New access for chilled pork in NZ, less than 3 kg
• PR issues in both countries
• New access for chilled pork in NZ, less than 3 kg
• PR issues in both countries

Opportunities• Trans-Pacific Partnership of 12 Nations
– Sticking point: Japan access/elimination of gate price– Other nation support for US position– Next round: October
• Transatlantic Trade Investment Partnership with EU – EU willing to eliminate tariffs on nearly all goods– Unwilling to eliminate them on beef, poultry and pork– Huge SPS and social issues– Precautionary Principle
• Both have HUGE potential• NPB research on barriers,
cost of restrictions

Forecast• Forecast up 1.5-2% in 2014?– Prices dropping– Rising demand from Japan, Korea, Mexico– EU gaining share in competitive markets– WATCH: Global product flow shifts

International Marketing Research

Marketing Structure Study• Is our current structure working?• Are we targeting the right
markets?• Are our tactics the right ones?• What are the best
opportunities?• How do we get there? • How do we achieve our goal?
• Identify data gaps• Conduct interviews• Prioritize markets• Develop scorecards• Clear definition of optimal
structure• Clear identification of
constraints• Recommendations for
structure• Pathways
“By-Product” Research

Exported Muscle Cuts
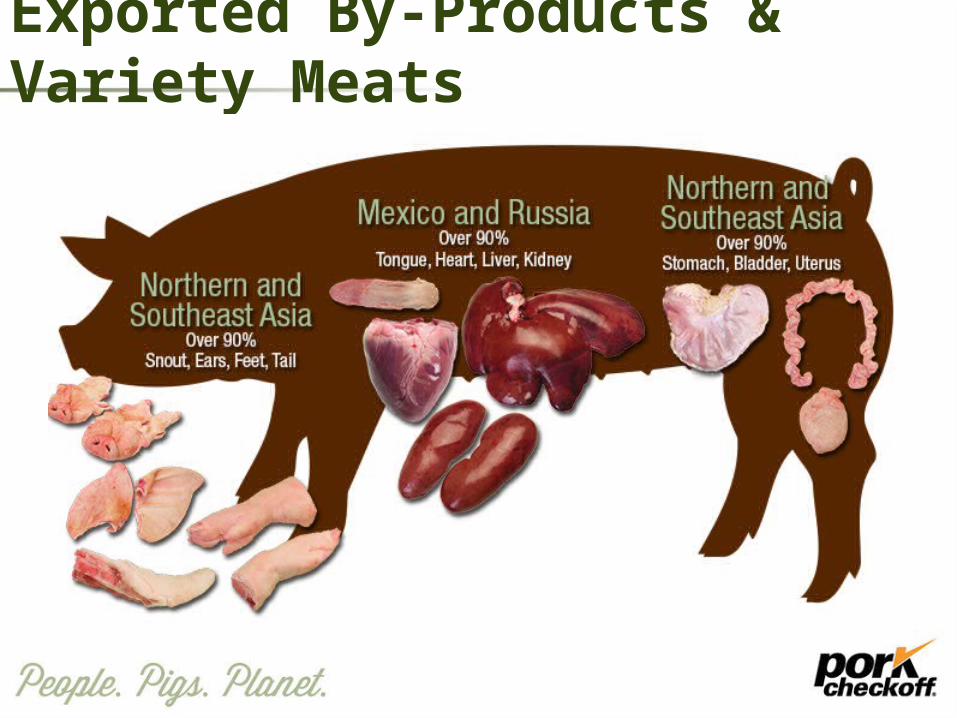
Exported By-Products & Variety Meats

Variety Meat Research Projects
An evaluation of the suitability of porcine lung tissue for human consumption
CSU
Aseptically packaged pork products preserved by Advanced Thermal Processing - feasibility study
NCSU
Extending the shelf life of livers, lungs, kidneys, and hearts
ISU
Enhanced safety and shelf life of US pork organ meats destined for international trade
WPF

International Resources

US Pork Videoswww.pork.org/ExporterInsights
•Nutrition•Processing and Fabrication•Animal Care•Sustainability and Environment

By-Product Recipe Book

By-Product Recipe Book
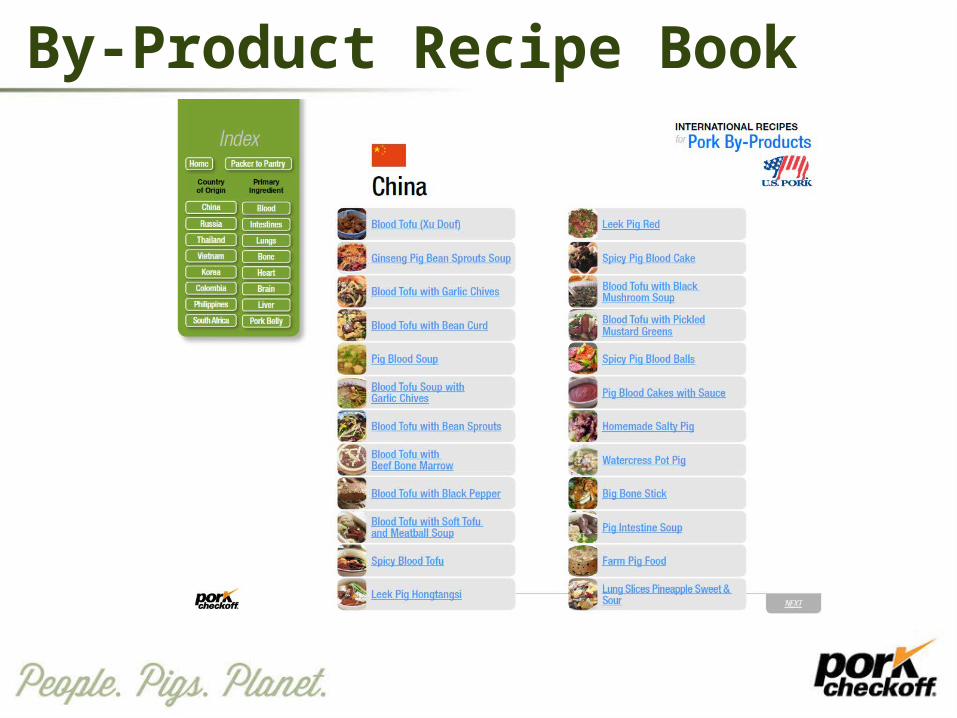
By-Product Recipe Book

Thank You!

MCOOL• WTO ruled against US…waiting on next outcome• Fix after November elections?• If lose the appeal, Canada and Mexico can estimate/calculate
"damages" and impose punitive duties • Likely in 2015


