Asia-Pacific J. Atmos. Sci., 46(1), 29-40, 2010 DOI:10.1007/s13143-010-0004-5 1. Introduction The nowcasting and forecasting of fog have been one of the greatest concerns because fog affects navigation and travel due to the reduced visibility and water circulation (Gultepe, 2007; Gultepe et al., 2007). While the traffic accidents caused by severe weather decreased, the number of casualties in fog-related accidents kept steady (Goodwin, 2002). Satellite-observed fog detection is economical compared to ground-based observation because the satellite observation is more widely available over the mountainous and oceanic areas. Furthermore, the first Korean geostationary-orbit satellite of the Communication, Ocean, and Meteorological Satellite (COMS) is supposed to be launched during the first half of the year 2010, and thus accurate fog algorithm is required for the COMS Meteorological Data Processing System (CMDPS). The fog-sensing method utilizing the brightness temperature difference between 3.7 ㎛ and 11 ㎛ (BTD or T3.7-11) has been extensively used from the polar-orbit and geostationary-orbit satellites (Eyre et al., 1984; Ellrod, 1995). The near-infrared radiance around 3.75 ㎛ results from both earth and solar radiation during daytime and shows 0.8-0.9 emissivity for opaque water droplets (Kudoh and Noguchi, 1991; Anthis and Cracknell, 1999). Hence, the threshold values of fog detection can be derived from the optical characteristics that the value of BTD during fog compared to that during clear sky is relatively high at daytime and low at nighttime (MSG, 2003). The visible reflectivity around 0.68 ㎛ can be used for daytime fog detection as well as the BTD (Bendix et al., 2004; Underwood et al., 2004; Cermark and Bendix, 2005). Also, Schreiner et al. (2007) reported that the condition of the brightness temperature at 11 ㎛, T 11 > 260 K, was useful in distinguishing the snow-covered or vegetated areas from the twilight fog over the North America. Meanwhile, Yoo et al. (2006) revealed that the higher clouds above fog layer caused an error in the fog detection by the BTD method. Gultepe et al. (2007) improved the accuracy of fog detection by reducing the cloud effect, based on vertical temperature profile of the Global Environmental Multi-scale (GEM) model and the Geostationary Operational Environmental Satellite (GOES)-12 satellite observation. This is because when higher clouds develop over the fog layer, the satellite senses the temperature of cloud-top, not that of the fog layer. This effect has an impact particularly on nighttime fog detection because the threshold value that discriminates between fog and clear sky is more sensitive to the variability of satellite observations under Improved Fog Detection from Satellite in the Presence of Clouds Jung-Moon Yoo 1 , Myeong-Jae Jeong 2,3 , Young Min Hur 1 and Dong-Bin Shin 4 1 Dept. of Science Education, Ewha Womans University, Seoul 120-750, Korea 2 Goddard Earth Science and Technology Center, UMBC, Maryland 21228, USA 3 NASA/GSFC, Greenbelt, Maryland 20771, USA 4 Dept. of Atmospheric Sciences, Yonsei University, Seoul 120-749, Korea (Manuscript received 13 August 2009; revised 25 November 2009; accepted 30 November 2009) ⓒ The Korean Meteorological Society and Springer 2010 Abstract: This study analyzes radiative effect of the higher clouds over the fog layer and presents the improvement of fog detection over the Korean peninsula, utilizing satellite data of the Multi-functional Transport SATellite (MTSAT)-1R and the MODerate resolution Imaging Spectroradiometer (MODIS) and the Look-Up Table (LUT) based on Radiative Transfer Model (RTM) simulations. Fog detection utilizing the satellite data from visible (0.68 ㎛) and infrared (3.75 ㎛ and 10.8 ㎛) channels has been evaluated in comparison with ground- based observations over 52 meteorological stations in the Korean Peninsula from March 2006 to February 2007. The threshold values for fog sensing have been derived from the difference (i.e., T3.7-11) in brightness temperature between 3.75 ㎛ (T3.7) and 10.8 ㎛ (T11) during day and night, and also from the reflectivity at 0.68 ㎛ (R0.68) in the daytime. In the twilight, however, the difference between the temperature values at 10.8 ㎛ and their maximum within previous 15 days (i.e., T11max-11) are used instead, because the 3.75 ㎛ channel is inaccurate for the fog detection at dawn/dusk. The sensitivity of the T3.7-11 values with respect to the clouds is investigated based on the cloud variables such as its height, optical thickness, and amount. The values of T3.7-11 are the most sensitive to cloud height, followed by cloud optical thickness and effective radius, while R0.68 is insensitive to cloud height. The sensitivity is examined with various conditions of cloud phases and day/night. Sixteen cases among eighteen fog occurrences, which have been unable to be sensed by using only the conventional threshold values, are successfully detected with the additional LUT corrections, indicating a significant improvement. The method of fog detection in this study can be useful to the Communication, Ocean, and Meteorological Satellite (COMS) Meteorological Data Processing System (CMDPS) by reducing the cloud effect on fog sensing. Key words: Fog, detection, satellite, MTSAT-1R, cloud, Radiative Transfer Model, Look-Up Table Corresponding Author: Jung-Moon Yoo, Department of Science Education, Ewha Womans University, Seoul 120-750, Korea. E-mail: [email protected]
Transcript
Asia-Pacific J. Atmos. Sci., 46(1), 29-40, 2010 DOI:10.1007/s13143-010-0004-5
1. Introduction
The nowcasting and forecasting of fog have been one of the greatest concerns because fog affects navigation and travel due to the reduced visibility and water circulation (Gultepe, 2007; Gultepe et al., 2007). While the traffic accidents caused by severe weather decreased, the number of casualties in fog-related
accidents kept steady (Goodwin, 2002). Satellite-observed fog detection is economical compared to ground-based observation because the satellite observation is more widely available over the mountainous and oceanic areas. Furthermore, the first Korean geostationary-orbit satellite of the Communication, Ocean, and Meteorological Satellite (COMS) is supposed to be launched during the first half of the year 2010, and thus accurate fog algorithm is required for the COMS Meteorological Data Processing System (CMDPS).
The fog-sensing method utilizing the brightness temperature difference between 3.7 ㎛ and 11 ㎛ (BTD or T3.7-11) has been extensively used from the polar-orbit and geostationary-orbit satellites (Eyre et al., 1984; Ellrod, 1995). The near-infrared radiance around 3.75 ㎛ results from both earth and solar radiation during daytime and shows 0.8-0.9 emissivity for opaque water droplets (Kudoh and Noguchi, 1991; Anthis and Cracknell, 1999). Hence, the threshold values of fog detection can be derived from the optical characteristics that the value of BTD during fog compared to that during clear sky is relatively high at daytime and low at nighttime (MSG, 2003). The visible reflectivity around 0.68 ㎛ can be used for daytime fog detection as well as the BTD (Bendix et al., 2004; Underwood et al., 2004; Cermark and Bendix, 2005). Also, Schreiner et al. (2007) reported that the condition of the brightness temperature at 11 ㎛, T11 > 260 K, was useful in distinguishing the snow-covered or vegetated areas from the twilight fog over the North America.
Meanwhile, Yoo et al. (2006) revealed that the higher clouds above fog layer caused an error in the fog detection by the BTD method. Gultepe et al. (2007) improved the accuracy of fog detection by reducing the cloud effect, based on vertical temperature profile of the Global Environmental Multi-scale (GEM) model and the Geostationary Operational Environmental Satellite (GOES)-12 satellite observation. This is because when higher clouds develop over the fog layer, the satellite senses the temperature of cloud-top, not that of the fog layer. This effect has an impact particularly on nighttime fog detection because the threshold value that discriminates between fog and clear sky is more sensitive to the variability of satellite observations under
Improved Fog Detection from Satellite in the Presence of Clouds
Jung-Moon Yoo1, Myeong-Jae Jeong
2,3, Young Min Hur
1 and Dong-Bin Shin
4
1Dept. of Science Education, Ewha Womans University, Seoul 120-750, Korea 2Goddard Earth Science and Technology Center, UMBC, Maryland 21228, USA3NASA/GSFC, Greenbelt, Maryland 20771, USA 4Dept. of Atmospheric Sciences, Yonsei University, Seoul 120-749, Korea
(Manuscript received 13 August 2009; revised 25 November 2009; accepted 30 November 2009)
ⓒ The Korean Meteorological Society and Springer 2010
Abstract: This study analyzes radiative effect of the higher clouds over the fog layer and presents the improvement of fog detection over the Korean peninsula, utilizing satellite data of the Multi-functional Transport SATellite (MTSAT)-1R and the MODerate resolution Imaging Spectroradiometer (MODIS) and the Look-Up Table (LUT) based on Radiative Transfer Model (RTM) simulations. Fog detection utilizing the satellite data from visible (0.68 ㎛) and infrared (3.75 ㎛and 10.8 ㎛) channels has been evaluated in comparison with ground- based observations over 52 meteorological stations in the Korean Peninsula from March 2006 to February 2007. The threshold values for fog sensing have been derived from the difference (i.e., T3.7-11) in brightness temperature between 3.75 ㎛ (T3.7) and 10.8 ㎛ (T11) during day and night, and also from the reflectivity at 0.68 ㎛ (R0.68) in the daytime. In the twilight, however, the difference between the temperaturevalues at 10.8 ㎛ and their maximum within previous 15 days (i.e., T11max-11) are used instead, because the 3.75 ㎛ channel is inaccurate for the fog detection at dawn/dusk. The sensitivity of the T3.7-11 values with respect to the clouds is investigated based on the cloud variables such as its height, optical thickness, and amount. The values of T3.7-11
are the most sensitive to cloud height, followed by cloud optical thickness and effective radius, while R0.68 is insensitive to cloud height. The sensitivity is examined with various conditions of cloud phases and day/night. Sixteen cases among eighteen fog occurrences, which have been unable to be sensed by using only the conventional threshold values, are successfully detected with the additional LUT corrections, indicating a significant improvement. The method of fog detection in this study can be useful to the Communication, Ocean, and Meteorological Satellite (COMS) Meteorological Data Processing System (CMDPS) by reducing the cloud effect on fog sensing.
Corresponding Author: Jung-Moon Yoo, Department of ScienceEducation, Ewha Womans University, Seoul 120-750, Korea.E-mail: [email protected]
30 ASIA-PACIFIC JOURNAL OF ATMOSPHERIC SCIENCES
the condition of stable atmosphere (Yoo et al., 2005). This study addresses the method that the satellite-observed value during nighttime fog with the higher clouds is able to be corrected to the one without them by utilizing the LUT, induced from a model of the Santa Barbara Discrete Ordinate Radiative Transfer (SBDART; Ricchiazzi et al., 1998). However, this method is available only if their information is provided. In other words, we can detect fog even under presence of upper clouds by correcting the satellite-observed value with them from the LUT, calculated in advance by the RTM. It is because the threshold value for fog detection has been derived from satellite observations, assuming the cloud absence.
Bendix et al. (2006) developed the fog detection from the reflectivity threshold values at various wavelengths, obtained
from the observation of the the MODerate resolution Imaging Spectroradiometer (MODIS) onboard the Terra and Aqua polar-orbit satellites and the RTM under the diverse atmospheric conditions in fog. The concept of this study is similar to theirs in that the database (i.e., LUT) of the BTD and reflectivity has
been set up from the RTM in advance in order to correct the effect of the higher clouds. The purpose of this study is to enhance the accuracy of satellite-observed nighttime fog detection by analyzing and correcting the effect of the clouds over the fog layer with the help of the LUT, computed by the RTM. Since, additionally to the LUT, limited conditions of the Global Data Assimilation and Prediction System (GDAPS) temperature at Korean Meteorological Administration (KMA) and the brightness temperature at 11 ㎛ are helpful to partially filter out the higher clouds, they can be integrated in the fog algorithm (not shown in this study).
2. Data and Method
The ground-based and satellite observations in this study have been used to determine the threshold values of fog detection and improve it with the LUT, induced from the SBDART. The ground observations of fog, cloud amount, and surface temperature are utilized from 52 meteorological stations in the Korean Peninsula
Table 1. The names of meteorological stations over the Korean peninsula used for the fog analysis over the land and sea, respectively.The smaller number of stations, the more fog occurrences. Here the station height (H) above the sea level is also given.
Land Freq H(m) Island or CoastStation Freq H(m) Station Freq H(m)
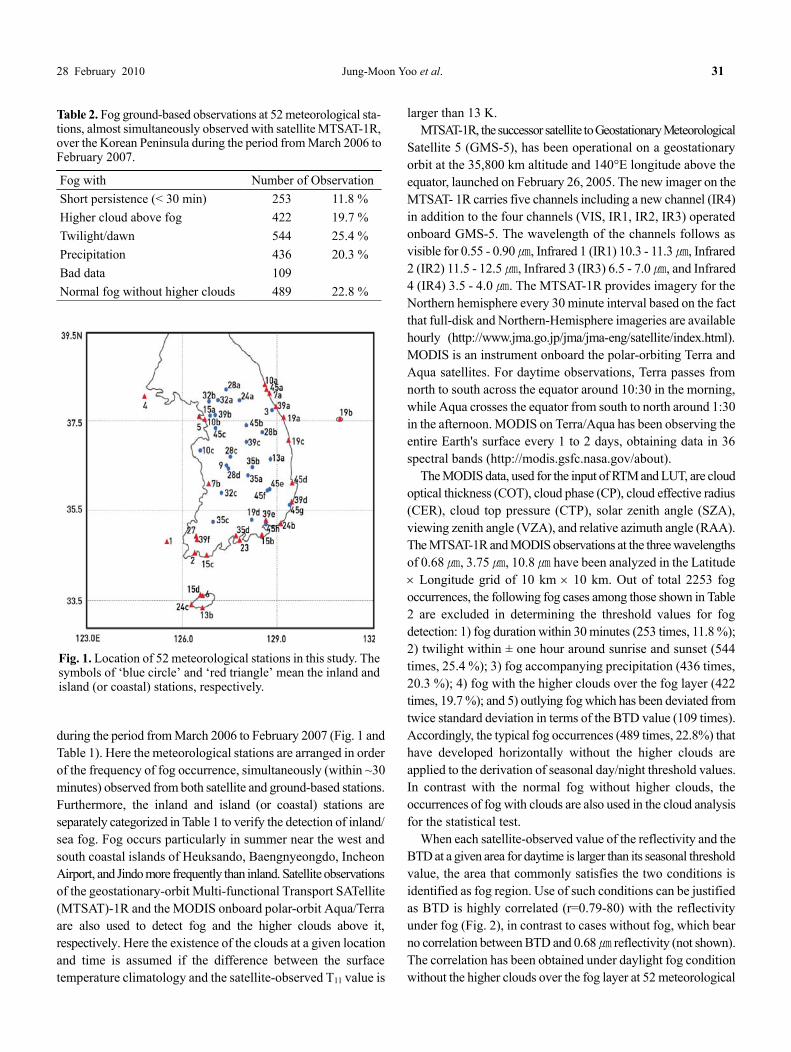
during the period from March 2006 to February 2007 (Fig. 1 and Table 1). Here the meteorological stations are arranged in order of the frequency of fog occurrence, simultaneously (within ~30 minutes) observed from both satellite and ground-based stations. Furthermore, the inland and island (or coastal) stations are separately categorized in Table 1 to verify the detection of inland/ sea fog. Fog occurs particularly in summer near the west and south coastal islands of Heuksando, Baengnyeongdo, Incheon Airport, and Jindo more frequently than inland. Satellite observations of the geostationary-orbit Multi-functional Transport SATellite (MTSAT)-1R and the MODIS onboard polar-orbit Aqua/Terra are also used to detect fog and the higher clouds above it, respectively. Here the existence of the clouds at a given location and time is assumed if the difference between the surface temperature climatology and the satellite-observed T11 value is
larger than 13 K. MTSAT-1R, the successor satellite to Geostationary Meteorological
Satellite 5 (GMS-5), has been operational on a geostationary orbit at the 35,800 km altitude and 140°E longitude above the equator, launched on February 26, 2005. The new imager on the MTSAT- 1R carries five channels including a new channel (IR4) in addition to the four channels (VIS, IR1, IR2, IR3) operated onboard GMS-5. The wavelength of the channels follows as visible for 0.55 - 0.90 ㎛, Infrared 1 (IR1) 10.3 - 11.3 ㎛, Infrared 2 (IR2) 11.5 - 12.5 ㎛, Infrared 3 (IR3) 6.5 - 7.0 ㎛, and Infrared 4 (IR4) 3.5 - 4.0 ㎛. The MTSAT-1R provides imagery for the Northern hemisphere every 30 minute interval based on the fact that full-disk and Northern-Hemisphere imageries are available hourly (http://www.jma.go.jp/jma/jma-eng/satellite/index.html). MODIS is an instrument onboard the polar-orbiting Terra and Aqua satellites. For daytime observations, Terra passes from north to south across the equator around 10:30 in the morning, while Aqua crosses the equator from south to north around 1:30 in the afternoon. MODIS on Terra/Aqua has been observing the entire Earth's surface every 1 to 2 days, obtaining data in 36 spectral bands (http://modis.gsfc.nasa.gov/about).
The MODIS data, used for the input of RTM and LUT, are cloud optical thickness (COT), cloud phase (CP), cloud effective radius (CER), cloud top pressure (CTP), solar zenith angle (SZA), viewing zenith angle (VZA), and relative azimuth angle (RAA). The MTSAT-1R and MODIS observations at the three wavelengths of 0.68 ㎛, 3.75 ㎛, 10.8 ㎛ have been analyzed in the Latitude × Longitude grid of 10 km × 10 km. Out of total 2253 fog occurrences, the following fog cases among those shown in Table 2 are excluded in determining the threshold values for fog detection: 1) fog duration within 30 minutes (253 times, 11.8 %); 2) twilight within ± one hour around sunrise and sunset (544 times, 25.4 %); 3) fog accompanying precipitation (436 times, 20.3 %); 4) fog with the higher clouds over the fog layer (422 times, 19.7 %); and 5) outlying fog which has been deviated from twice standard deviation in terms of the BTD value (109 times). Accordingly, the typical fog occurrences (489 times, 22.8%) that have developed horizontally without the higher clouds are applied to the derivation of seasonal day/night threshold values. In contrast with the normal fog without higher clouds, the occurrences of fog with clouds are also used in the cloud analysis for the statistical test.
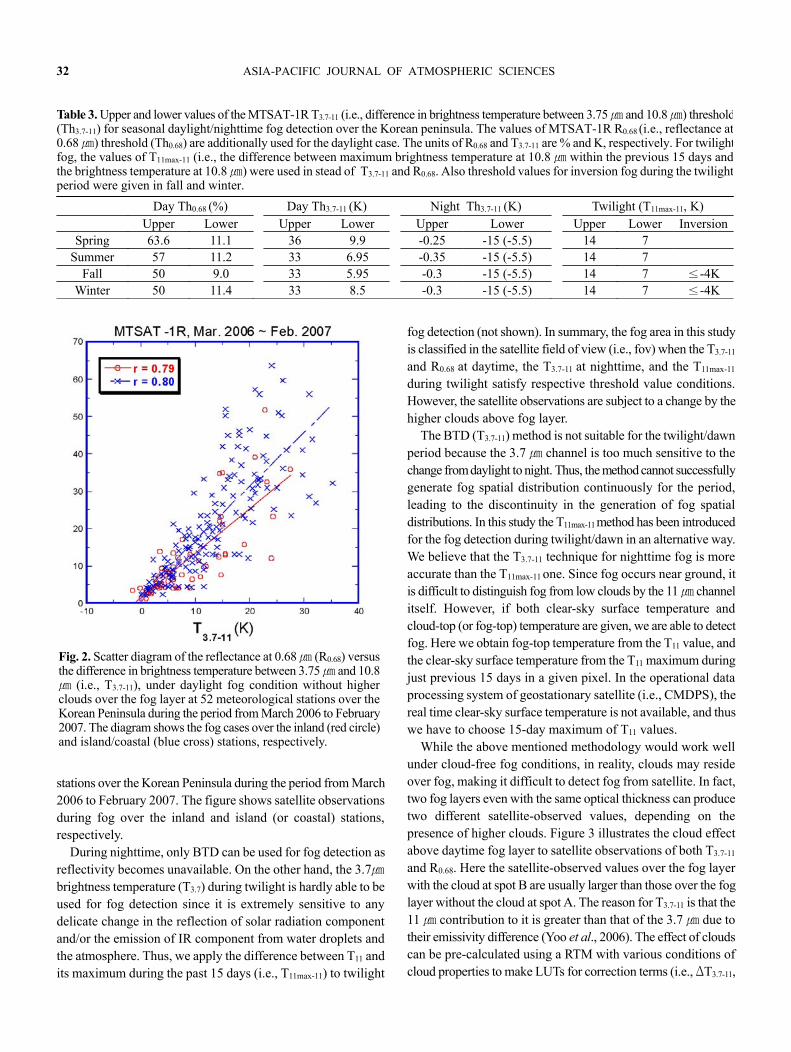
When each satellite-observed value of the reflectivity and the BTD at a given area for daytime is larger than its seasonal threshold value, the area that commonly satisfies the two conditions is identified as fog region. Use of such conditions can be justified as BTD is highly correlated (r=0.79-80) with the reflectivity under fog (Fig. 2), in contrast to cases without fog, which bear no correlation between BTD and 0.68 ㎛ reflectivity (not shown). The correlation has been obtained under daylight fog condition without the higher clouds over the fog layer at 52 meteorological
Fig. 1. Location of 52 meteorological stations in this study. The symbols of ‘blue circle’ and ‘red triangle’ mean the inland and island (or coastal) stations, respectively.
Table 2. Fog ground-based observations at 52 meteorological sta-tions, almost simultaneously observed with satellite MTSAT-1R,over the Korean Peninsula during the period from March 2006 toFebruary 2007.
Fog with Number of Observation
Short persistence (< 30 min) 253 11.8 %
Higher cloud above fog 422 19.7 %
Twilight/dawn 544 25.4 %
Precipitation 436 20.3 %
Bad data 109
Normal fog without higher clouds 489 22.8 %
32 ASIA-PACIFIC JOURNAL OF ATMOSPHERIC SCIENCES
stations over the Korean Peninsula during the period from March 2006 to February 2007. The figure shows satellite observations during fog over the inland and island (or coastal) stations, respectively.
During nighttime, only BTD can be used for fog detection as reflectivity becomes unavailable. On the other hand, the 3.7㎛ brightness temperature (T3.7) during twilight is hardly able to be used for fog detection since it is extremely sensitive to any delicate change in the reflection of solar radiation component and/or the emission of IR component from water droplets and the atmosphere. Thus, we apply the difference between T11 and its maximum during the past 15 days (i.e., T11max-11) to twilight
fog detection (not shown). In summary, the fog area in this study is classified in the satellite field of view (i.e., fov) when the T3.7-11
and R0.68 at daytime, the T3.7-11 at nighttime, and the T11max-11
during twilight satisfy respective threshold value conditions. However, the satellite observations are subject to a change by the higher clouds above fog layer.
The BTD (T3.7-11) method is not suitable for the twilight/dawn period because the 3.7 ㎛ channel is too much sensitive to the change from daylight to night. Thus, the method cannot successfully generate fog spatial distribution continuously for the period, leading to the discontinuity in the generation of fog spatial distributions. In this study the T11max-11 method has been introduced for the fog detection during twilight/dawn in an alternative way. We believe that the T3.7-11 technique for nighttime fog is more accurate than the T11max-11 one. Since fog occurs near ground, it is difficult to distinguish fog from low clouds by the 11 ㎛ channel itself. However, if both clear-sky surface temperature and cloud-top (or fog-top) temperature are given, we are able to detect fog. Here we obtain fog-top temperature from the T11 value, and the clear-sky surface temperature from the T11 maximum during just previous 15 days in a given pixel. In the operational data processing system of geostationary satellite (i.e., CMDPS), the real time clear-sky surface temperature is not available, and thus we have to choose 15-day maximum of T11 values.
While the above mentioned methodology would work well under cloud-free fog conditions, in reality, clouds may reside over fog, making it difficult to detect fog from satellite. In fact, two fog layers even with the same optical thickness can produce two different satellite-observed values, depending on the presence of higher clouds. Figure 3 illustrates the cloud effect above daytime fog layer to satellite observations of both T3.7-11
and R0.68. Here the satellite-observed values over the fog layer with the cloud at spot B are usually larger than those over the fog layer without the cloud at spot A. The reason for T3.7-11 is that the 11 ㎛ contribution to it is greater than that of the 3.7 ㎛ due to their emissivity difference (Yoo et al., 2006). The effect of clouds can be pre-calculated using a RTM with various conditions of cloud properties to make LUTs for correction terms (i.e., ΔT3.7-11,
Fig. 2. Scatter diagram of the reflectance at 0.68 ㎛ (R0.68) versusthe difference in brightness temperature between 3.75 ㎛ and 10.8㎛ (i.e., T3.7-11), under daylight fog condition without higher clouds over the fog layer at 52 meteorological stations over the Korean Peninsula during the period from March 2006 to February2007. The diagram shows the fog cases over the inland (red circle)and island/coastal (blue cross) stations, respectively.
Table 3. Upper and lower values of the MTSAT-1R T3.7-11 (i.e., difference in brightness temperature between 3.75 ㎛ and 10.8 ㎛) threshold(Th3.7-11) for seasonal daylight/nighttime fog detection over the Korean peninsula. The values of MTSAT-1R R0.68 (i.e., reflectance at0.68 ㎛) threshold (Th0.68) are additionally used for the daylight case. The units of R0.68 and T3.7-11 are % and K, respectively. For twilightfog, the values of T11max-11 (i.e., the difference between maximum brightness temperature at 10.8 ㎛ within the previous 15 days andthe brightness temperature at 10.8 ㎛) were used in stead of T3.7-11 and R0.68. Also threshold values for inversion fog during the twilightperiod were given in fall and winter.
Day Th0.68 (%) Day Th3.7-11 (K) Night Th3.7-11 (K) Twilight (T11max-11, K)Upper Lower Upper Lower Upper Lower Upper Lower Inversion
ΔR0.68). Then, the cloud effect can be corrected by subtracting the values from satellite observations (T3.7-11, R0.68).
As mentioned earlier, the season and day/night dependent threshold values for fog detection are induced in the absence of the higher clouds (Table 3). Hence, if the higher clouds exist, we can detect fog by comparing the corrected satellite observation that would have been obtained without the higher clouds with the threshold values derived from cloud-free fog cases. Their accuracy is analyzed with the LUT by accounting for the higher clouds over the fog layer. The threshold values have been derived from the ground-based observations together with the data from MTSAT-1R. The specification of MTSAT-1R is similar to that of the COMS, which is scheduled to be launched during the first half of the year 2010. In this study, the satellite-based fog detection (i.e., threshold value) is validated using the collocated and coincident ground-based observations. The threshold values, derived from T11max-11, are also included for twilight fog and additionally for its inversion-layer fog in fall and winter.
3. The threshold value and LUT for fog detection
The accuracy of threshold values (R0.68, T3.7-11) derived from MTSAT-1R is examined by comparing the fog detection with ground-based observations (Fig. 1) during fog and clear sky, respectively. The statistical validation (e.g., Cermak and Bendix, 2007) is performed under two types of atmospheric conditions; one in the presence of higher clouds above fog layer and the other in their absence (Tables 4-5). The T3.7-11 and R0.68 values increase in the fog layer with the clouds, compared to the condition without them, leading to different accuracy values (Fig. 3). The accuracy of day/night fog detection in the cloud absence is 42~54% in terms of Critical Success Index (CSI) and 64-76% in terms of Hit Rate (HR) (Table 4).
While the accuracy (CSI = 54-67%) of daytime fog detection increases somewhat in the cloud presence, it is remarkably low (CSI = 8.6%) in the nighttime case (Table 5). The HR value for fog verification tends to be similar to the CSI in that it is clearly higher in the cloud absence (HR = 72.5%) than in the cloud presence (HR = 49.5%). Considering that total number of samples in the cloud presence and absence are not much different, the cloud problem that causes erroneous fog detection is more serious during nighttime than during daytime. Yoo et al (2006) pointed out that the nighttime fog detection is more susceptible to the higher clouds over the fog layer than daytime because the satellite-observed T3.7-11 values respond more sensitively to the optical properties of clouds during nighttime. In other words, whether the fog that horizontally develops exists, the range of satellite observation values is relatively narrow at nighttime due to the relatively stable atmosphere, compared to when it is at daytime. Accordingly, the variation in satellite observation due to the clouds gives more impact on the fog sensing based on the threshold values at nighttime than at daytime.
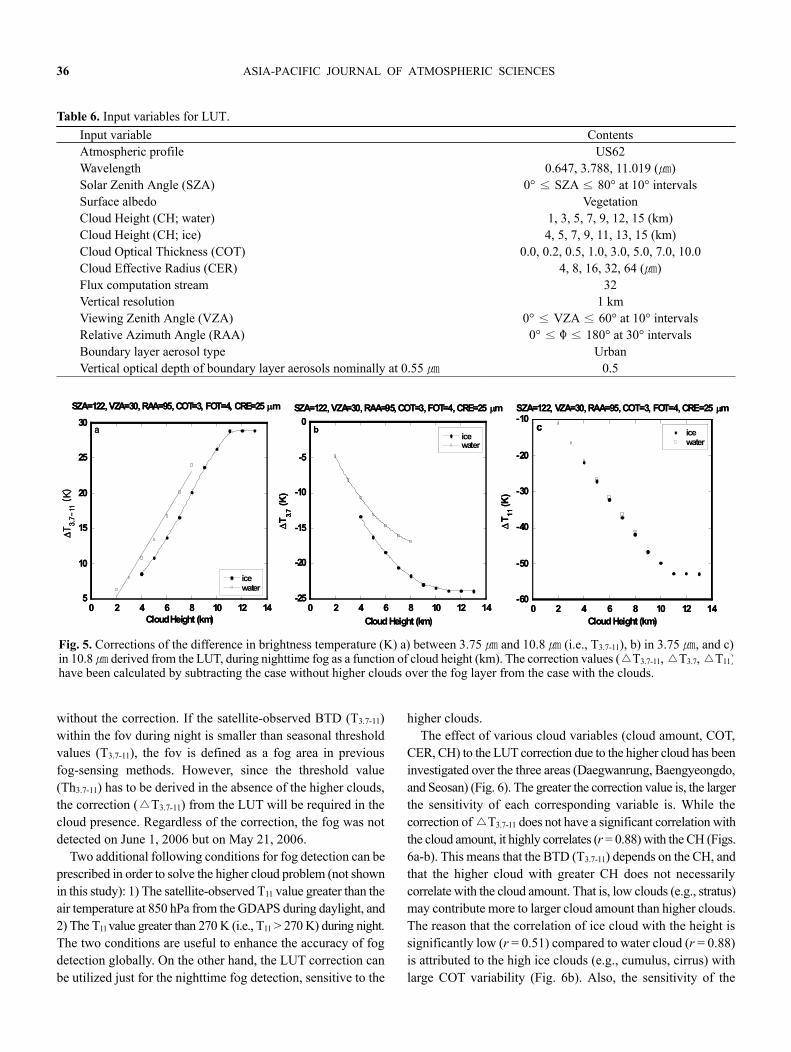
In the presence of higher clouds the satellite-observed values for the BTD (T3.7-11), T11 and the reflectivity (R0.68) are adjusted to the values that would have been without the clouds, by referring to the LUT constructed from numerous RTM simulations under various atmospheric conditions with and without clouds and/or fog. The LUT is available at 10° interval for SZA of 0°-80°, at 10° interval for satellite VZA of 0°-60°, and at 30° interval for RAA of 0°-180° (Table 6). The above and some other variables that belong to those angles between the reference angles are interpolated or extrapolated to derive the correction values of the BTD and reflectivity from the LUT. The main input variables for the SBDART have been shown in the table. Here the MODIS cloud information for the LUT is SZA, VZA, RAA, COT, CER, CH, and CP. The CH is converted from the CTP using the US Standard Atmosphere. The COT and CER data, produced only at daytime, are utilized for the nighttime LUT input of the same day. The satellite-observed data of MTSAT-1R and MODIS, nearly simultaneously observed with 52 ground-based stations, are used for the LUT input.
4. Higher cloud effect in fog detection; Sensitivity
As shown in Fig. 4, the main cloud variables in the numerical experiment for the cloud correction of the LUT are cloud phase (water/ice), cloud effective radius (r or CER), cloud optical thickness (Ct or COT), and cloud height (water Hw, ice Hi; CH). The conditions of fog optical thickness (FOT; Ft = 5), SZA (daytime = 72°, nighttime = 120°), RAA = 95°, and VZA = 30° are also specified in the experiment. The corrected values of the BTD at day and night become less dependent on wavelength when the effective radii of cloud particles are large (r > 5) (Figs. 4 a1 and b1). It is because the ΔT3.7-11 values decrease as the radii
SFCA B
Higher Cloud
Daytime
T3.7-11(A) < T3.7-11(B)
R0.65 (A) < R0.65(B)
Fog LayerA B
SFCA B
Higher Cloud
Daytime
T3.7-11(A) < T3.7-11(B)
R0.65 (A) < R0.65(B)
Fog LayerA B
Fig. 3. Schematic diagram showing the effect of higher clouds above daytime fog-layer to satellite observations of the differencein brightness temperature between 3.75 ㎛ and 10.8 ㎛ (T3.7-11) and of the reflectance at 0.68 ㎛ (R0.68). The observations of R0.68,and T3.7-11 over the fog layer with the higher cloud at B spot are usually larger than those over the fog layer without the higher cloud at A spot.
34 ASIA-PACIFIC JOURNAL OF ATMOSPHERIC SCIENCES
increase. The reflectivity correction of ΔR0.68 negatively correlates with the cloud effective radii (Fig. 4 c1). This means that the smaller cloud particles in a given COT are more reflective than the larger ones.
The BTD corrections at day and night are almost linearly proportional to the COT for COT < 4 (Figs. 4 a2 and b2). However, they become inaccurate when COT >4 as they reach the maxima at COT = 4 and begin to decrease with increasing COT. This indicates that the brightness temperatures for infrared (IR) or near-IR values have been saturated with the greater COT. Meanwhile, the corrected values for reflectivity positively correlate with the wide range of COT values (Fig. 4 c2). The corrected values of BTD are generally proportional to the cloud
height while those for reflectivity is rather insensitive to cloud height (Figs. 4 a3-c3).
Figure 5 shows the corrections (ΔT3.7-11, ΔT3.7, ΔT11) of the BTD, the near-IR at 3.75㎛ and the IR at 10.8㎛ during nighttime fog, using the input data similar to typical MODIS observations (SZA, VZA, RAA, COT, and CER). The ΔT3.7-11 values with cloud height are presented as a function of the cloud height with 1 km interval. Here the water and ice clouds are set up in the altitudes of 2-8 km and 4-13 km, respectively. The ΔT3.7-11 values are more sensitive to water clouds than to ice ones as brightness temperature for water clouds shows higher wavelength dependency, compared to the ice clouds (Fig. 5a). The LUT correction for ΔT3.7-11 is effective when the cloud height is less than 11 km. The
Table 4. Contingency tables of three kinds of MTSAT-1R data (Daytime R0.65, Daytime T3.7-11, Nighttime T3.7-11) for fog detection underthe condition without higher clouds over the fog layer over 52 meteorological stations of the Korean Peninsula during the period fromMarch 2006 to February 2007, and verification scores for the detection. Here the ‘SYNOP’ in table means the observation at ground-basedstations, and in this study is considered as a ground truth. In addition, FAR is False Alarm Ratio, POD Probability of Detection, CSICritical Success Index, HR Hit Rate, and ERR Percentage Error.
Sum Annual
DayMTSAT-1R
R0.65
SYNOP Verification Score (%)Fog No Fog FAR 42.5
Fog 130 96 POD 60.5No Fog 85 195 CSI 41.8
Sum 215 291 HR 64.2ERR 35.8
DayMTSAT-1R
T3.7-11
SYNOP Verification ScoresFog No Fog FAR 23.8
Fog 138 43 POD 64.2No Fog 77 248 CSI 53.5
Sum 215 291 HR 76.3ERR 23.7
NightMTSAT-1R
T3.7-11
SYNOP Verification ScoresFog No Fog FAR 28.4
Fog 184 73 POD 67.2No Fog 90 245 CSI 53.0
Sum 274 318 HR 72.5ERR 27.5
Table 5. Same as in Table 4 except for the condition with higher clouds over the fog layer.
Sum Annual
DayMTSAT-1R
R0.65
SYNOP Verification Score (%)Fog No Fog FAR 38.1
Fog 156 96 POD 80.8No Fog 37 195 CSI 54.0
Sum 193 291 HR 72.5ERR 27.5
DayMTSAT-1R
T3.7-11
SYNOP Verification ScoresFog No Fog FAR 21.3
Fog 159 43 POD 82.4No Fog 34 248 CSI 67.4
Sum 193 291 HR 84.1ERR 15.9
NightMTSAT-1R
T3.7-11
SYNOP Verification ScoresFog No Fog FAR 73.7
Fog 26 73 POD 11.4No Fog 203 245 CSI 8.6
Sum 229 318 HR 49.5ERR 51.5
28 February 2010 Jung-Moon Yoo et al. 35
correction with cloud phase is more affected by the ΔT3.7 than the ΔT11 (Figs. 5b-c).
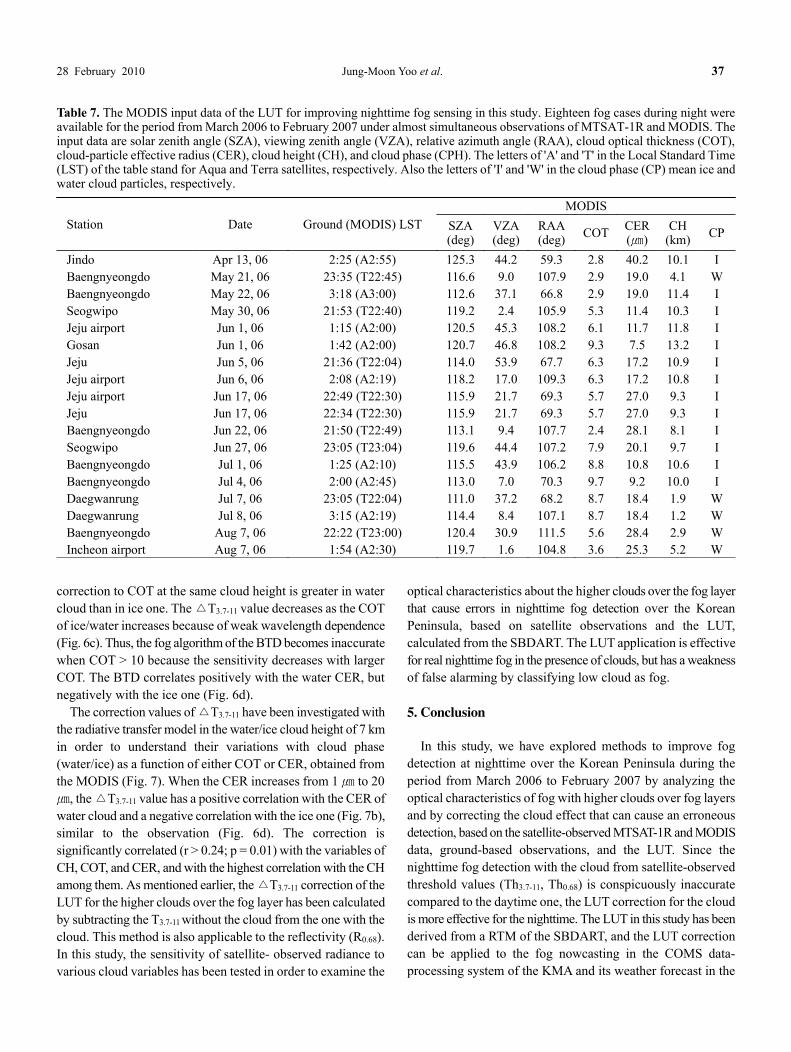
The effect of the higher clouds on the nighttime fog detection has been analyzed with the LUT, utilizing the MTSAT-1R and ground-based observation near the Korean peninsula during the period of April-October, 2006 (Table 7). Here the main cloud input data are also shown. The MODIS cloud information, inputted for the SBDART, is used to generate the database (i.e., LUT) similar to the real atmospheric situation.
Improved fog detection in this study has been shown by comparing the value (T3.7-11-△T3.7-11) that subtracts the higher-
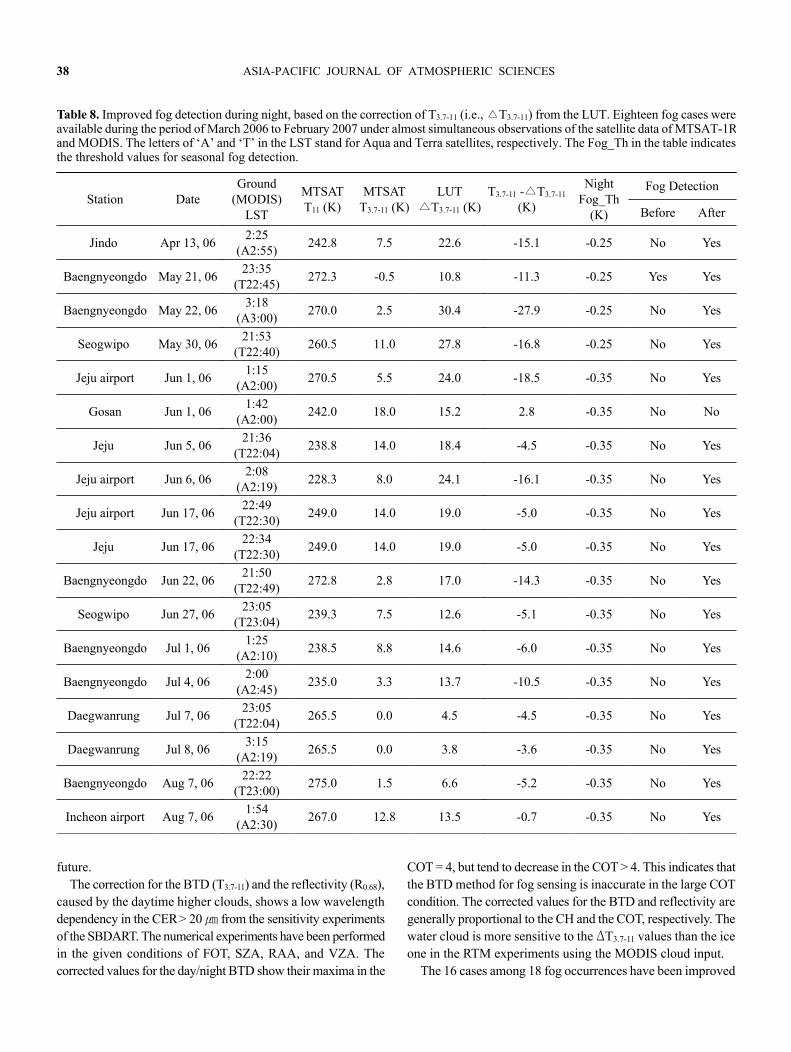
cloud correction (△T3.7-11) from the BTD (T3.7-11) with the threshold value (Th3.7-11) (Table 8). The corrected value for the BTD is obtained from the LUT. There are 18 fog occurrences, almost simultaneously (within an hour) observed from both satellites (MTSAT-1R and MODIS) and ground-based observations over eight stations (Daegwanrung, Baengnyeongdo, Incheon airport, Jindo, Jeju airport, Jeju, Gosan, and Seogwipo) in the Korean Peninsula. The 16 cases among 18 fog occurrences are substantially improved when the corrected BTD values are compared with the threshold values (Th3.7-11). Moreover, the 16 cases would have not been identified as fog by the T3.7-11 values
Fig. 4. Correction of the difference in brightness temperature (K) between 3.7 ㎛ and 11 ㎛ ( i.e., T3.7-11) and reflectance at 0.66 ㎛ inthe ordinate versus cloud effective radius (r), cloud optical thickness, and cloud height (km) in the abscissa, simulated from a radiativetransfer model of the SBDART during a) daytime and c) daytime and b) nighttime. The symbols of filled circle (•) and cross (+) indicatesimulated values for the water and ice clouds, respectively. Either COT or Ct stands for cloud optical thickness, Hw for cloud heightof water cloud, Hi for height of ice cloud, and Ft for fog optical thickness. With the input of relative azimuth angle (RAA = 95°) andviewing zenith angle (VZA = 30°) for the SBDART, the solar zenith angle (SZA) values of 72° and 120° have been used for daylightand night, respectively.
36 ASIA-PACIFIC JOURNAL OF ATMOSPHERIC SCIENCES
without the correction. If the satellite-observed BTD (T3.7-11) within the fov during night is smaller than seasonal threshold values (T3.7-11), the fov is defined as a fog area in previous fog-sensing methods. However, since the threshold value (Th3.7-11) has to be derived in the absence of the higher clouds, the correction (△T3.7-11) from the LUT will be required in the cloud presence. Regardless of the correction, the fog was not detected on June 1, 2006 but on May 21, 2006.
Two additional following conditions for fog detection can be prescribed in order to solve the higher cloud problem (not shown in this study): 1) The satellite-observed T11 value greater than the air temperature at 850 hPa from the GDAPS during daylight, and 2) The T11 value greater than 270 K (i.e., T11 > 270 K) during night. The two conditions are useful to enhance the accuracy of fog detection globally. On the other hand, the LUT correction can be utilized just for the nighttime fog detection, sensitive to the
higher clouds.The effect of various cloud variables (cloud amount, COT,
CER, CH) to the LUT correction due to the higher cloud has been investigated over the three areas (Daegwanrung, Baengyeongdo, and Seosan) (Fig. 6). The greater the correction value is, the larger the sensitivity of each corresponding variable is. While the correction of △T3.7-11 does not have a significant correlation with the cloud amount, it highly correlates (r = 0.88) with the CH (Figs. 6a-b). This means that the BTD (T3.7-11) depends on the CH, and that the higher cloud with greater CH does not necessarily correlate with the cloud amount. That is, low clouds (e.g., stratus) may contribute more to larger cloud amount than higher clouds. The reason that the correlation of ice cloud with the height is significantly low (r = 0.51) compared to water cloud (r = 0.88) is attributed to the high ice clouds (e.g., cumulus, cirrus) with large COT variability (Fig. 6b). Also, the sensitivity of the
Fig. 5. Corrections of the difference in brightness temperature (K) a) between 3.75 ㎛ and 10.8 ㎛ (i.e., T3.7-11), b) in 3.75 ㎛, and c)in 10.8 ㎛ derived from the LUT, during nighttime fog as a function of cloud height (km). The correction values (△T3.7-11, △T3.7, △T11)have been calculated by subtracting the case without higher clouds over the fog layer from the case with the clouds.
28 February 2010 Jung-Moon Yoo et al. 37
correction to COT at the same cloud height is greater in water cloud than in ice one. The △T3.7-11 value decreases as the COT of ice/water increases because of weak wavelength dependence (Fig. 6c). Thus, the fog algorithm of the BTD becomes inaccurate when COT > 10 because the sensitivity decreases with larger COT. The BTD correlates positively with the water CER, but negatively with the ice one (Fig. 6d).
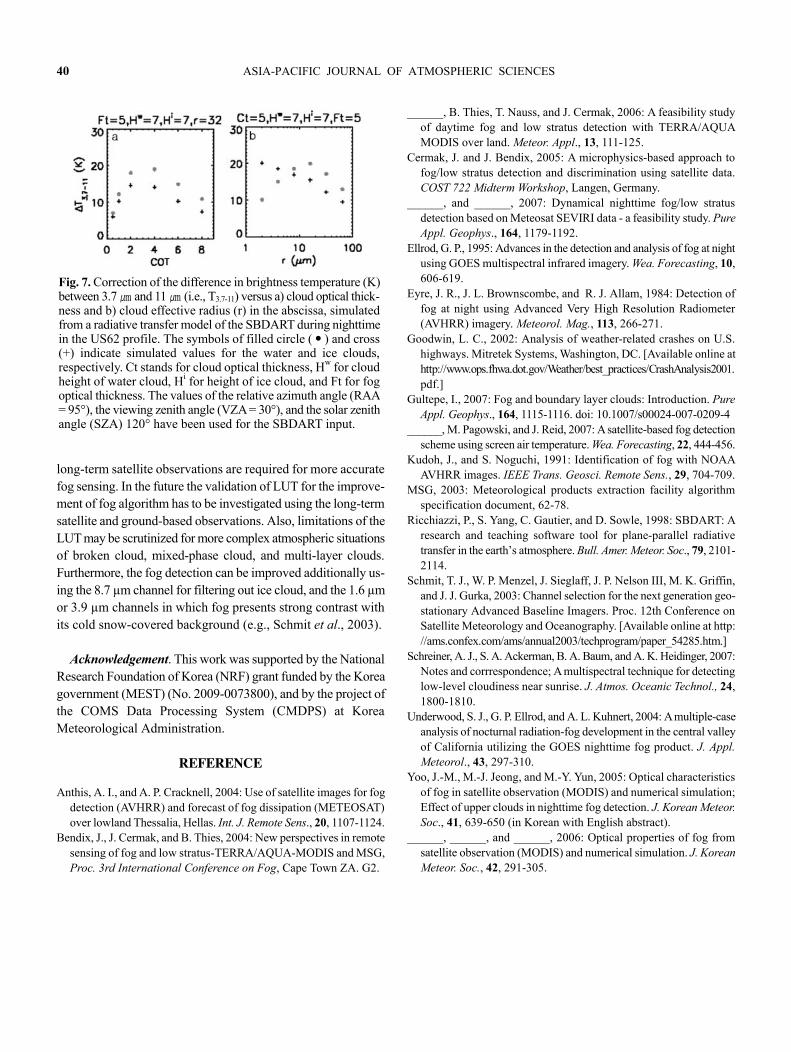
The correction values of △T3.7-11 have been investigated with the radiative transfer model in the water/ice cloud height of 7 km in order to understand their variations with cloud phase (water/ice) as a function of either COT or CER, obtained from the MODIS (Fig. 7). When the CER increases from 1 ㎛ to 20 ㎛, the △T3.7-11 value has a positive correlation with the CER of water cloud and a negative correlation with the ice one (Fig. 7b), similar to the observation (Fig. 6d). The correction is significantly correlated (r > 0.24; p = 0.01) with the variables of CH, COT, and CER, and with the highest correlation with the CH among them. As mentioned earlier, the △T3.7-11 correction of the LUT for the higher clouds over the fog layer has been calculated by subtracting the T3.7-11 without the cloud from the one with the cloud. This method is also applicable to the reflectivity (R0.68). In this study, the sensitivity of satellite- observed radiance to various cloud variables has been tested in order to examine the
optical characteristics about the higher clouds over the fog layer that cause errors in nighttime fog detection over the Korean Peninsula, based on satellite observations and the LUT, calculated from the SBDART. The LUT application is effective for real nighttime fog in the presence of clouds, but has a weakness of false alarming by classifying low cloud as fog.
5. Conclusion
In this study, we have explored methods to improve fog detection at nighttime over the Korean Peninsula during the period from March 2006 to February 2007 by analyzing the optical characteristics of fog with higher clouds over fog layers and by correcting the cloud effect that can cause an erroneous detection, based on the satellite-observed MTSAT-1R and MODIS data, ground-based observations, and the LUT. Since the nighttime fog detection with the cloud from satellite-observed threshold values (Th3.7-11, Th0.68) is conspicuously inaccurate compared to the daytime one, the LUT correction for the cloud is more effective for the nighttime. The LUT in this study has been derived from a RTM of the SBDART, and the LUT correction can be applied to the fog nowcasting in the COMS data- processing system of the KMA and its weather forecast in the
Table 7. The MODIS input data of the LUT for improving nighttime fog sensing in this study. Eighteen fog cases during night wereavailable for the period from March 2006 to February 2007 under almost simultaneous observations of MTSAT-1R and MODIS. Theinput data are solar zenith angle (SZA), viewing zenith angle (VZA), relative azimuth angle (RAA), cloud optical thickness (COT), cloud-particle effective radius (CER), cloud height (CH), and cloud phase (CPH). The letters of 'A' and 'T' in the Local Standard Time (LST) of the table stand for Aqua and Terra satellites, respectively. Also the letters of 'I' and 'W' in the cloud phase (CP) mean ice andwater cloud particles, respectively.
future. The correction for the BTD (T3.7-11) and the reflectivity (R0.68),
caused by the daytime higher clouds, shows a low wavelength dependency in the CER > 20 ㎛ from the sensitivity experiments of the SBDART. The numerical experiments have been performed in the given conditions of FOT, SZA, RAA, and VZA. The corrected values for the day/night BTD show their maxima in the
COT = 4, but tend to decrease in the COT > 4. This indicates that the BTD method for fog sensing is inaccurate in the large COT condition. The corrected values for the BTD and reflectivity are generally proportional to the CH and the COT, respectively. The water cloud is more sensitive to the ΔT3.7-11 values than the ice one in the RTM experiments using the MODIS cloud input.
The 16 cases among 18 fog occurrences have been improved
Table 8. Improved fog detection during night, based on the correction of T3.7-11 (i.e., △T3.7-11) from the LUT. Eighteen fog cases wereavailable during the period of March 2006 to February 2007 under almost simultaneous observations of the satellite data of MTSAT-1Rand MODIS. The letters of ‘A’ and ‘T’ in the LST stand for Aqua and Terra satellites, respectively. The Fog_Th in the table indicatesthe threshold values for seasonal fog detection.
Station DateGround
(MODIS) LST
MTSATT11 (K)
MTSATT3.7-11 (K)
LUT△T3.7-11 (K)
T3.7-11 -△T3.7-11 (K)
Night Fog_Th
(K)
Fog Detection
Before After
Jindo Apr 13, 062:25
(A2:55)242.8 7.5 22.6 -15.1 -0.25 No Yes
Baengnyeongdo May 21, 0623:35
(T22:45)272.3 -0.5 10.8 -11.3 -0.25 Yes Yes
Baengnyeongdo May 22, 063:18
(A3:00)270.0 2.5 30.4 -27.9 -0.25 No Yes
Seogwipo May 30, 0621:53
(T22:40)260.5 11.0 27.8 -16.8 -0.25 No Yes
Jeju airport Jun 1, 061:15
(A2:00)270.5 5.5 24.0 -18.5 -0.35 No Yes
Gosan Jun 1, 061:42
(A2:00)242.0 18.0 15.2 2.8 -0.35 No No
Jeju Jun 5, 0621:36
(T22:04)238.8 14.0 18.4 -4.5 -0.35 No Yes
Jeju airport Jun 6, 062:08
(A2:19)228.3 8.0 24.1 -16.1 -0.35 No Yes
Jeju airport Jun 17, 0622:49
(T22:30)249.0 14.0 19.0 -5.0 -0.35 No Yes
Jeju Jun 17, 0622:34
(T22:30)249.0 14.0 19.0 -5.0 -0.35 No Yes
Baengnyeongdo Jun 22, 0621:50
(T22:49)272.8 2.8 17.0 -14.3 -0.35 No Yes
Seogwipo Jun 27, 0623:05
(T23:04)239.3 7.5 12.6 -5.1 -0.35 No Yes
Baengnyeongdo Jul 1, 061:25
(A2:10)238.5 8.8 14.6 -6.0 -0.35 No Yes
Baengnyeongdo Jul 4, 062:00
(A2:45)235.0 3.3 13.7 -10.5 -0.35 No Yes
Daegwanrung Jul 7, 0623:05
(T22:04)265.5 0.0 4.5 -4.5 -0.35 No Yes
Daegwanrung Jul 8, 063:15
(A2:19)265.5 0.0 3.8 -3.6 -0.35 No Yes
Baengnyeongdo Aug 7, 0622:22
(T23:00)275.0 1.5 6.6 -5.2 -0.35 No Yes
Incheon airport Aug 7, 061:54
(A2:30)267.0 12.8 13.5 -0.7 -0.35 No Yes
28 February 2010 Jung-Moon Yoo et al. 39
by correcting ΔT3.7-11 to the satellite-observed T3.7-11 value based on the LUT. Both the LUT calculated from the RTM and its input information (e.g., COT, CER, CH, and CP) for the higher clouds have to be also precise in order to ensure an accuracy of the LUT correction. Particularly, it should be noted that in the current fog algorithm the COT and CER values from the nearest daytime observations were used as substitute inputs to correct the BTD for nighttime fog detection, which can cause an error due to the temporal difference. In addition, the inclusion of LUT in the fog algorithm of the CMDPS may result in the problem of consuming the computer time.
We have applied the lookup table (LUT) method to the two
cases of 'Higher cloud above fog (19.7%)' and 'Normal fog without higher clouds (22.8%)’. In this study we did not include other three situations of 'Short persistence of fog (11.8%)', 'Twilight/dawn (25.4%)', and 'fog with precipitation (20.3%)'. Although the method is currently not suitable for the three other cases due to the RTM limitations and the nature complexity, further investigations on those cases are warranted in the future. In particular, the fog detection for the twilight/dawn period has to be challenging and improved because of more frequent fog occurrences.
Since one-year of MTSAT-1R data provide rather small size of samples to derive statistically robust threshold values,
0
10
20
30
40
2 4 6 8 10
Ice r = 0.06 (r = 0.04)Wat r = 0.29 (r = 0.22)
∆T3.
7-11
(K)
Cloud Amount
a
0
10
20
30
40
0 4 8 12 16
Ice r = 0.51 (r = 0.46)Wat r = 0.88 (r = 0.88)
Cloud Height (km)
b
0
10
20
30
40
0 2 4 6 8 10
Ice r = 0.60 (r = 0.55)Wat r = 0.40 (r = 0.46)
∆T 3.
7-11
(K)
Cloud Optical Thickness
c
0
10
20
30
40
0 10 20 30 40 50 60
Ice r = 0.42 (r = 0.32)Wat r = 0.47 (r = 0.45)
Cloud Effective Radius (µm)
d
0
10
20
30
40
2 4 6 8 10
Ice r = 0.06 (r = 0.04)Wat r = 0.29 (r = 0.22)
∆T3.
7-11
(K)
Cloud Amount
a
0
10
20
30
40
0 4 8 12 16
Ice r = 0.51 (r = 0.46)Wat r = 0.88 (r = 0.88)
Cloud Height (km)
b
0
10
20
30
40
0 2 4 6 8 10
Ice r = 0.60 (r = 0.55)Wat r = 0.40 (r = 0.46)
∆T 3.
7-11
(K)
Cloud Optical Thickness
c
0
10
20
30
40
0 10 20 30 40 50 60
Ice r = 0.42 (r = 0.32)Wat r = 0.47 (r = 0.45)
Cloud Effective Radius (µm)
d
Fig. 6. Correction(△T3.7-11) of the difference in brightness temperature (K) between 3.7 ㎛ and 11 ㎛ (i.e., T3.7-11) simulated from a radiativetransfer model of the SBDART versus (a) cloud amount, (b) cloud height, (c) cloud optical thickness, and (d) cloud effective radiusover the Korean peninsula during night from April to October 2006. Input variables for Look-Up Table (LUT) are given by the MODIScloud information. The symbol 'r' in the panel stands for correlation coefficient. The symbols of red-colored circle and triangle in the panel have been shown for the water and ice clouds, examined in detail in Tables 7-8.
40 ASIA-PACIFIC JOURNAL OF ATMOSPHERIC SCIENCES
long-term satellite observations are required for more accurate fog sensing. In the future the validation of LUT for the improve-ment of fog algorithm has to be investigated using the long-term satellite and ground-based observations. Also, limitations of the LUT may be scrutinized for more complex atmospheric situations of broken cloud, mixed-phase cloud, and multi-layer clouds. Furthermore, the fog detection can be improved additionally us-ing the 8.7 µm channel for filtering out ice cloud, and the 1.6 µm or 3.9 µm channels in which fog presents strong contrast with its cold snow-covered background (e.g., Schmit et al., 2003).
Acknowledgement. This work was supported by the National Research Foundation of Korea (NRF) grant funded by the Korea government (MEST) (No. 2009-0073800), and by the project of the COMS Data Processing System (CMDPS) at Korea Meteorological Administration.
REFERENCE
Anthis, A. I., and A. P. Cracknell, 2004: Use of satellite images for fog detection (AVHRR) and forecast of fog dissipation (METEOSAT) over lowland Thessalia, Hellas. Int. J. Remote Sens., 20, 1107-1124.
Bendix, J., J. Cermak, and B. Thies, 2004: New perspectives in remote sensing of fog and low stratus-TERRA/AQUA-MODIS and MSG, Proc. 3rd International Conference on Fog, Cape Town ZA. G2.
______, B. Thies, T. Nauss, and J. Cermak, 2006: A feasibility study of daytime fog and low stratus detection with TERRA/AQUA MODIS over land. Meteor. Appl., 13, 111-125.
Cermak, J. and J. Bendix, 2005: A microphysics-based approach to fog/low stratus detection and discrimination using satellite data. COST 722 Midterm Workshop, Langen, Germany.
______, and ______, 2007: Dynamical nighttime fog/low stratus detection based on Meteosat SEVIRI data - a feasibility study. Pure Appl. Geophys., 164, 1179-1192.
Ellrod, G. P., 1995: Advances in the detection and analysis of fog at night using GOES multispectral infrared imagery. Wea. Forecasting, 10, 606-619.
Eyre, J. R., J. L. Brownscombe, and R. J. Allam, 1984: Detection of fog at night using Advanced Very High Resolution Radiometer (AVHRR) imagery. Meteorol. Mag., 113, 266-271.
Goodwin, L. C., 2002: Analysis of weather-related crashes on U.S. highways. Mitretek Systems, Washington, DC. [Available online at http://www.ops.fhwa.dot.gov/Weather/best_practices/CrashAnalysis2001. pdf.]
Gultepe, I., 2007: Fog and boundary layer clouds: Introduction. Pure Appl. Geophys., 164, 1115-1116. doi: 10.1007/s00024-007-0209-4
______, M. Pagowski, and J. Reid, 2007: A satellite-based fog detection scheme using screen air temperature. Wea. Forecasting, 22, 444-456.
Kudoh, J., and S. Noguchi, 1991: Identification of fog with NOAA AVHRR images. IEEE Trans. Geosci. Remote Sens., 29, 704-709.
Ricchiazzi, P., S. Yang, C. Gautier, and D. Sowle, 1998: SBDART: A research and teaching software tool for plane-parallel radiative transfer in the earth’s atmosphere. Bull. Amer. Meteor. Soc., 79, 2101- 2114.
Schmit, T. J., W. P. Menzel, J. Sieglaff, J. P. Nelson III, M. K. Griffin, and J. J. Gurka, 2003: Channel selection for the next generation geo-stationary Advanced Baseline Imagers. Proc. 12th Conference on Satellite Meteorology and Oceanography. [Available online at http: //ams.confex.com/ams/annual2003/techprogram/paper_54285.htm.]
Schreiner, A. J., S. A. Ackerman, B. A. Baum, and A. K. Heidinger, 2007: Notes and corrrespondence; A multispectral technique for detecting low-level cloudiness near sunrise. J. Atmos. Oceanic Technol., 24, 1800-1810.
Underwood, S. J., G. P. Ellrod, and A. L. Kuhnert, 2004: A multiple-case analysis of nocturnal radiation-fog development in the central valley of California utilizing the GOES nighttime fog product. J. Appl. Meteorol., 43, 297-310.
Yoo, J.-M., M.-J. Jeong, and M.-Y. Yun, 2005: Optical characteristics of fog in satellite observation (MODIS) and numerical simulation; Effect of upper clouds in nighttime fog detection. J. Korean Meteor. Soc., 41, 639-650 (in Korean with English abstract).
______, ______, and ______, 2006: Optical properties of fog from satellite observation (MODIS) and numerical simulation. J. Korean Meteor. Soc., 42, 291-305.
Fig. 7. Correction of the difference in brightness temperature (K)between 3.7 ㎛ and 11 ㎛ (i.e., T3.7-11) versus a) cloud optical thick-ness and b) cloud effective radius (r) in the abscissa, simulatedfrom a radiative transfer model of the SBDART during nighttimein the US62 profile. The symbols of filled circle ( • ) and cross (+) indicate simulated values for the water and ice clouds, respectively. Ct stands for cloud optical thickness, Hw for cloud height of water cloud, Hi for height of ice cloud, and Ft for fog optical thickness. The values of the relative azimuth angle (RAA = 95°), the viewing zenith angle (VZA = 30°), and the solar zenithangle (SZA) 120° have been used for the SBDART input.