WISSENSCHAFTLICHE ARBEITEN DER FACHRICHTUNG GEODÄSIE UND GEOINFORMATIK DER LEIBNIZ UNIVERSITÄT HANNOVER ISSN 0174-1454 Nr. 288 Towards Standardizing International Boundary Determination and Quality Control Consequences on Surveying and Mapping Von der Fakultät für Bauingenieurwesen und Geodäsie der Gottfried Wilhelm Leibniz Universität Hannover zur Erlangung des Grades DOKTOR-INGENIEUR (Dr.-Ing.) genehmigte Dissertation von M. Eng. Mohammed Y. Alsayel Geboren in Aseer, Saudi Arabia HANNOVER 2010
Transcript
WISSENSCHAFTLICHE ARBEITEN DER FACHRICHTUNG GEODÄSIE UND GEOINFORMATIK DER LEIBNIZ UNIVERSITÄT HANNOVER
ISSN 0174-1454
Nr. 288 Towards Standardizing International Boundary Determination and
Quality Control Consequences on Surveying and Mapping
Von der Fakultät für Bauingenieurwesen und Geodäsie
der Gottfried Wilhelm Leibniz Universität Hannover
zur Erlangung des Grades
DOKTOR-INGENIEUR (Dr.-Ing.)
genehmigte Dissertation
von
M. Eng. Mohammed Y. Alsayel
Geboren in Aseer, Saudi Arabia
HANNOVER 2010
Referent: Univ.-Prof. Dr.-Ing. habil. C. Heipke
Korreferent: Prof. R. Goossens, University of Ghent
Korreferent: Univ.-Prof. Dr.-Ing. W. Voß
Korreferent: Hon.-Prof. Dr.-Ing. Ralf Schroth
Tag der mündlichen Prüfung: 07.06.2010
3
Kurzfassung
Die Festlegung von internationalen Staatsgrenzen beginnt mit dem Willen von zwei oder mehr Staaten, ihre Grenzen zu bestimmen und/oder zu markieren. Sie werden geleitet von der jeweiligen Absicht wie Tren-nung, Entwicklung oder Zusammenführung der beteiligten Staaten. Dies beginnt üblicherweise mit einem Staatsvertrag oder einer zwischenstaatlichen Vereinbarung. Solch eine Bestimmung von internationalen Grenzen bezogen auf natürliche oder geometrisch künstliche Grenzen kann auf folgende drei Arten ausge-führt und dokumentiert werden:
die betreffenden Staaten führen die Grenzziehung selbst durch und beschreiben die Anforderungen und Spezifikationen in einem auszuhandelnden Staatsvertrag
die betreffenden Staaten rufen den Generalsekretär der Vereinten Nationen an und bitten um Vorbe-reitung einer Grenzziehung
die betreffenden Staaten besitzen die finanziellen Möglichkeiten, einen privaten Auftragnehmer mit der Dokumentation (Vermessung und Kartierung) ihrer Staatsgrenze zu beauftragen
Vermessung und Kartierung spielen meist eine sehr wichtige Rolle bei der Festlegung internationaler Staats-grenzen. Obwohl international vereinbarte Staatsgrenzen ein sehr wichtiges Instrument und unentbehrlich für die Sta-bilisierung von zwischenstaatlichen Beziehungen sind, existiert heute weder ein international anerkanntes Modell für die Bestimmung von Staatsgrenzen noch der Versuch, die vier Phasen (Abgrenzung, Demarkati-on, Darstellung und zukünftige Verwendung (Instandhaltung)) eines solchen Prozesses umfassend zu be-schreiben. Diese Arbeit versucht, diese Lücke zu schließen und untersucht als einen ersten Schritt dazu die drei oben beschriebenen Wege anhand der Durchführung sowie der Ergebnisse von Grenzziehungen zwi-schen Indonesien und Timor, zwischen Nigeria und Kamerun sowie zwischen dem Königreich Saudi-Arabien und der Republik Jemen. Die Ergebnisse dieser Grenzziehungen erfolgen i.d.R. als statische Dokumentation (in Form von Kartierun-gen und Reports) im Anhang an die Verträge und für die Registrierung bei den Vereinten Nationen (UN), um die Informationen über die Grenzziehung sicher zu stellen. Darüber hinaus kann eine dynamische Dokumen-tation in Form eines GIS die zukünftige Nutzung sichern. Diese Arbeit vergleicht die Dokumentationsanforderungen sowie die Ergebnisse und berücksichtigt dabei die wesentliche Funktion der jeweiligen Staatsgrenze sowie die technischen Möglichkeiten der beteiligten Par-teien. Eine der wichtigsten Fragestellungen bei internationalen Grenzziehungen ist eine Harmonisierung des verfügbaren Daten- und Informationsmaterials aus unterschiedlichsten Quellen, um Konsistenz dieser Daten sicher zu stellen und eine einheitliche Darstellung der jeweiligen Grenzziehung zu erzielen. Dies gilt insbe-sondere auch für eine abgestimmte Darstellung der Grenzziehungen in den kartografischen Dokumentationen der beteiligten Staaten. Design und Dokumentation der Strategien zur Grenzziehung sollten so ausgelegt sein, dass Staaten die Ver-messung und Kartierung einer Staatsgrenze auf Basis international vereinbarter Spezifikationen und Ab-kommen durchführen können. Eine Standardisierung von Grenzziehungen kann am besten auf Basis interna-tionaler Standards – z.B. durch geeignete ISO-Normen - erzielt werden, da diese von der internationalen Gemeinschaft anerkannt werden. Dies sollte unter Einbeziehung detaillierter Konzepte für die Beschreibung der geografischen Informationen einer Staatsgrenze sowie einer Technologie für die zukünftige Nutzung dieser Informationen erfolgen. Wie in dieser Arbeit dargelegt führten das Konzept sowie die Qualitätssicherung zur Grenzziehung und Do-kumentation der Staatsgrenze zwischen Saudi Arabien und Jemen zu qualitativ hochwertigen und verlässli-chen Ergebnissen. Daher wird das vorliegende Beispiel in dieser Arbeit zum Ausgangspunkt für ein Modell zur Beschreibung einer Bestimmung von internationalen Staatsgrenzen heran gezogen. Die wichtigsten Pro-zessschritte eines solchen Modells sind die folgenden Vier: Vertragliche Abstimmung, Vermessung und Vermarkung, Darstellung und Instandhaltung (zukünftige Nutzung). Alle vier Prozessschritte stehen im Zu-sammenhang mit anerkannten Qualitätsstandards und –prozessen. Dieses Modell führt zu ausreichend technisch-methodischer Unterstützung für Verantwortliche der beteilig-ten Regierungsstellen hinsichtlich der notwendigen Vereinbarungen zur Grenzziehung. Daher können die Informationen aus diesem Modell als Richtlinie für diejenigen dienen, die nicht über entsprechende Vor-kenntnisse und Fertigkeiten in Vermessung und Kartierung verfügen und so spätere Probleme im Grenzzie-hungsprozess wirksam verhindern.
International boundary determination starts with the intention of two or more countries of boundary delimita-tion and /or demarcation. These terms are ruled by their function like separating developing or connecting the different countries. The initial intention is usually identified by a treaty or agreement. International boundary determination with regard to natural, or geometric artificial boundaries can be accomplished and documented in three ways:
States of concern implement their boundaries themselves by setting the requirements and specifica-tions in a treaty negotiated between them; and they control the output (boundary documents and maps) and its later use.
States call upon the Secretary General of the United Nations to make arrangements to demarcate the boundaries between them.
States have the financial ability to contract out to the private sector to do the documentation (survey-ing and mapping) for their boundaries.
Surveying and mapping often play an important role in international boundary determination.
In spite of the fact that international boundaries are a very important tool, maybe the most essential one for the stabilization of the relations between nations, an up-to-date, internationally agreed model of boundary determination does not exist, nor does a comprehensive attempt to extend the four phase (Delimitation, De-marcation, Delineation, and future use (maintenance)) description of the process of boundary determination. This thesis tries to fill the described gap and as a first step examines the three ways as being realized by the executions, and the output of the boundaries determination between Indonesia and Timor, Nigeria and Cam-eroon, and the Kingdom of Saudi Arabia and Republic of Yemen. The outputs of these boundary determi-nations are based on static documentation (mapping and reports) for securing knowledge or information about the boundaries to be attached to the treaties or agreements at the UN, and dynamic documentation (GIS) for their future use. The thesis compares their documentation requirements, and output, taking into consideration the functions of the boundary, and the financial and technical abilities of the involved parties. Furthermore one of the important issues in international boundaries is harmonization of the data provided by different sources to ensure consistency, and edge-matching at the boundaries to agree on common represen-tation of the boundary.
The design and documentation of the boundary determination strategies should be such that states can carry out the surveying and mapping according to agreed international specifications and agreements. Standardiza-tion of boundary determination can be served best by a set of international standards that integrate a detailed description of the concepts of the boundary geographic information and technology for future use such as those from ISO, since it is recognized by the international community.
As can be seen from the work of this thesis the concept which was used for the demarcation and delineation of the Saudi-Yemeni boundary and the quality control procedures used in the execution of the boundary pro-ject have resulted in good quality and reliable boundary determination practice. Thus, in the remainder of the thesis this example is used as a base for designing a model describing the process of international boundary determination. The major process stages of the model are four: Delimitation, Demarcation, Delineation, and future use (maintenance). All four stages are linked to common quality standards, and procedures.
This model leads to sufficient technical support for statesmen with regard to the delimitation of the boundary and the practical arrangements associated with it. The information provided within the boundary determina-tion model can thus be used as a consultation guide to people who may not have the proper knowledge and technical skills in surveying and mapping and in this way may prevent problems at a later stage of the boundary determination process.
1.4 ORGANISATION OF THE THESIS ......................................................................................................................... 9
2 STATE OF THE ART ..............................................................................................................................11 2.1 TREATY AND INTERNATIONAL AGREEMENT OF A BOUNDARY ............................................................................ 11
2.1.1 The Registration Requirements for a Treaty...............................................................................11 2.1.2 Publication..................................................................................................................................12 2.1.3 The Database Outcome of Registration......................................................................................12 2.1.4 Certification of Registration .......................................................................................................13
2.2 BOUNDARY DETERMINATION IN PRACTICE...................................................................................................... 13
2.2.1 Boundary between Indonesia and Timor ....................................................................................14 2.2.2 Boundary between Nigeria and Cameroon.................................................................................15 2.2.3 Euro Boundaries .........................................................................................................................16 2.2.4 Summary of the cases..................................................................................................................17
2.3.1 The quality Management Standards (organizational) ................................................................19 2.3.2 Quality Related Cost ...................................................................................................................20 2.3.3 The ISO 19100 family of standards (technical specifications) ...................................................21
2.3.3.1 Quality Principles............................................................................................................................ 21 2.3.3.2 Quality Evaluation Procedures........................................................................................................ 22 2.3.3.3 Meta Data........................................................................................................................................ 23 2.3.3.4 Data Product Specification.............................................................................................................. 24 2.3.3.5 Data Quality Measures.................................................................................................................... 24
3 INTERNATIONAL BOUNDARY DETERMINATION BETWEEN KINGDOM OF SAUDI ARABIA AND REPUBLIC OF YEMEN ...............................................................................................27 3.1 BACKGROUND ............................................................................................................................................... 27
3.2 THE OBJECTIVES AND OUTLINE OF SCOPE OF WORK ...................................................................................... 29
3.3 DEMARCATING THE BOUNDARY (FIELD WORKS)............................................................................................. 29
3.3.3.1 Establishment of GPS Control Networks (Base Survey) ................................................................ 33 3.3.3.2 Network Densification .................................................................................................................... 34 3.3.3.3 GPS Processing of boundary Network............................................................................................ 35 3.3.3.4 The survey of Boundary Markers.................................................................................................... 36 3.3.3.5 Geodetic Links into the national geodetic networks of the participating countries......................... 36 3.3.3.6 Photo Control Points ....................................................................................................................... 38
3.3.4 Constructions of Boundary Markers...........................................................................................38 3.3.5 Quality Control Sequences in Surveying of Boundary determination ........................................41 3.3.6 Summary of Accuracies Surveying Work....................................................................................43
3.4.1 Planning and taking aerial photography of the Boundary Corridor..........................................43 3.4.2 Principles of GPS/INS in Photogrammetry for photo control ....................................................44
6
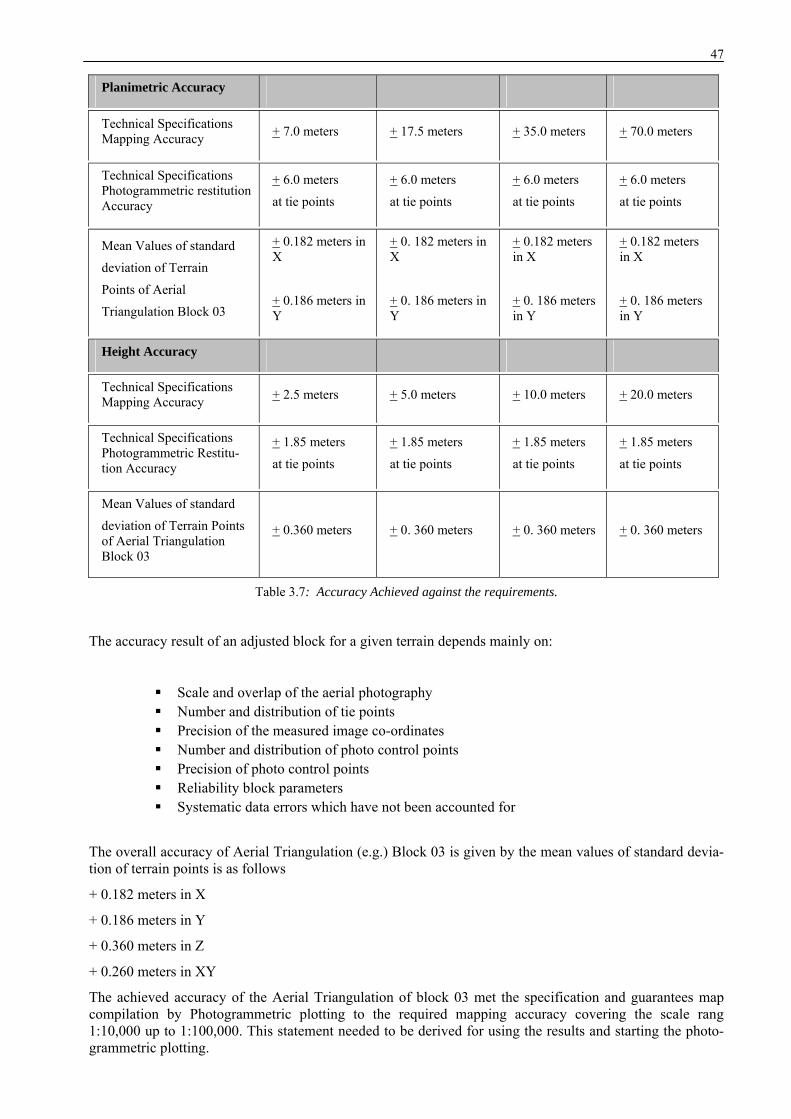
3.4.3 Aerial Triangulation for Georeferencing Aerial Photography of the Boundary ....................... 44 3.4.3.1 Aerial Triangulation Process in the Boundary Project.....................................................................45
3.4.4 Photogrammetric Data Capture ................................................................................................ 48 3.4.4.1 The Set-up of the Basic Data Model................................................................................................48 3.4.4.2 The orthophoto production process .................................................................................................52
3.4.5 Field Verification and Names collection ................................................................................... 54 3.4.6 Quality Control Sequences in the Photogrammetric Process.................................................... 55
3.5 DIGITAL CARTOGRAPHIC PROCESSING............................................................................................................58
3.5.1 The cartographic Data Structure............................................................................................... 58 3.5.2 Digital Data for use in GIS........................................................................................................ 60 3.5.3 Quality Control Sequences in the Cartographic Process .......................................................... 61 3.5.4 The products of the Saudi Yemeni Boundary Determination Project ........................................ 64
3.6 SUMMARY AND DISCUSSION ............................................................................................................................65
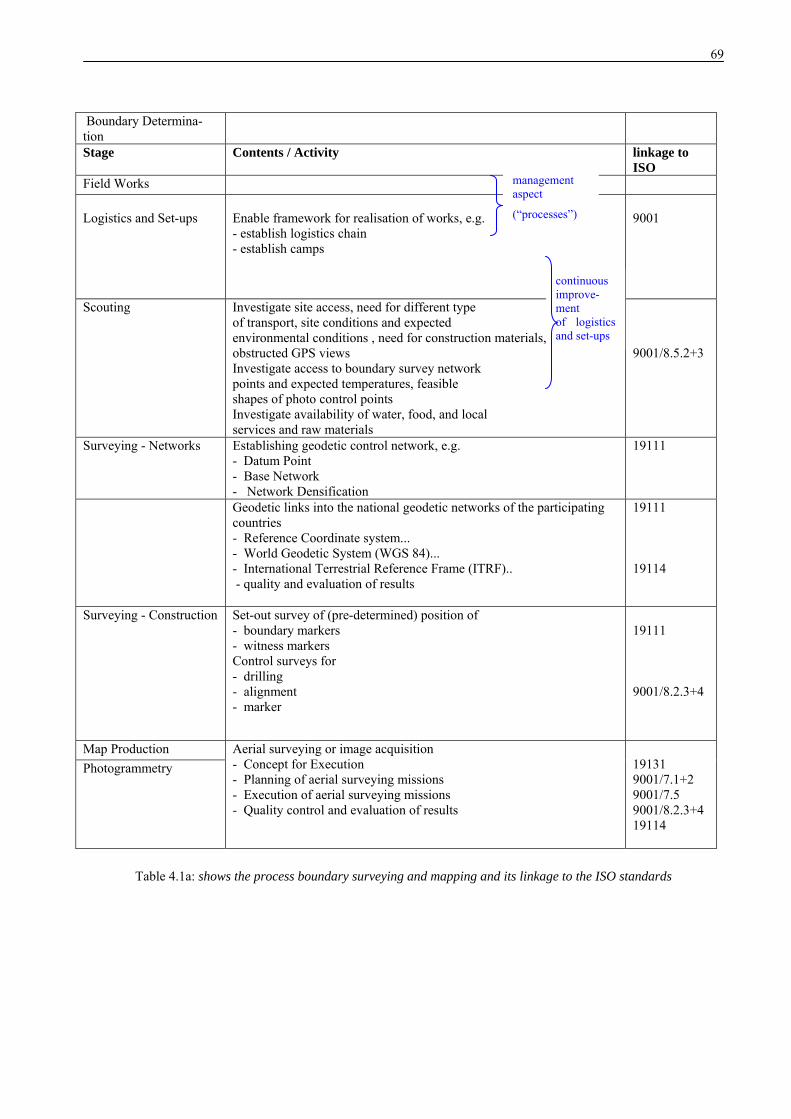
4 MODEL FOR BOUNDARY DETERMINATION ACCORDING TO INTERNATIONAL STANDARDS .......................................................................................................................................... 67
4.1 THE USE OF QUALITY STANDARDS FOR THE BOUNDARY DETERMINATION PROCESS .........................................67
4.2 QUALITY CONTROL MODEL ............................................................................................................................68
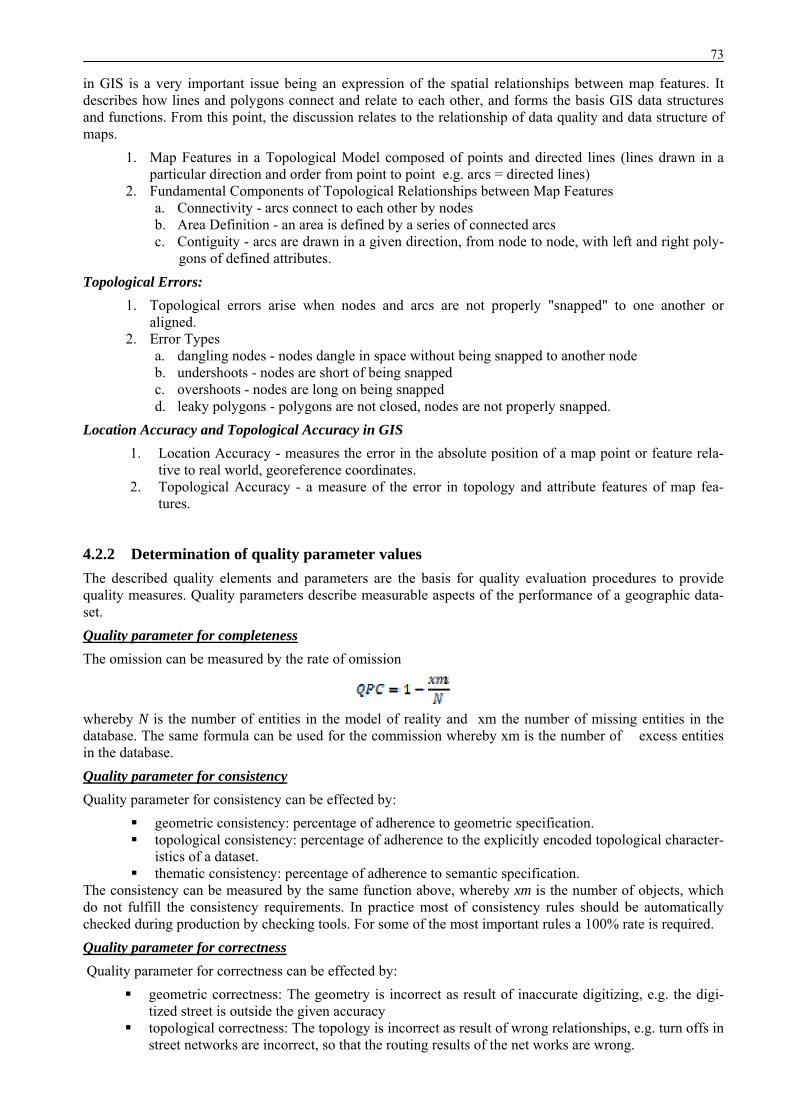
4.2.1 Errors and quality measures...................................................................................................... 72 4.2.2 Determination of quality parameter values ............................................................................... 73
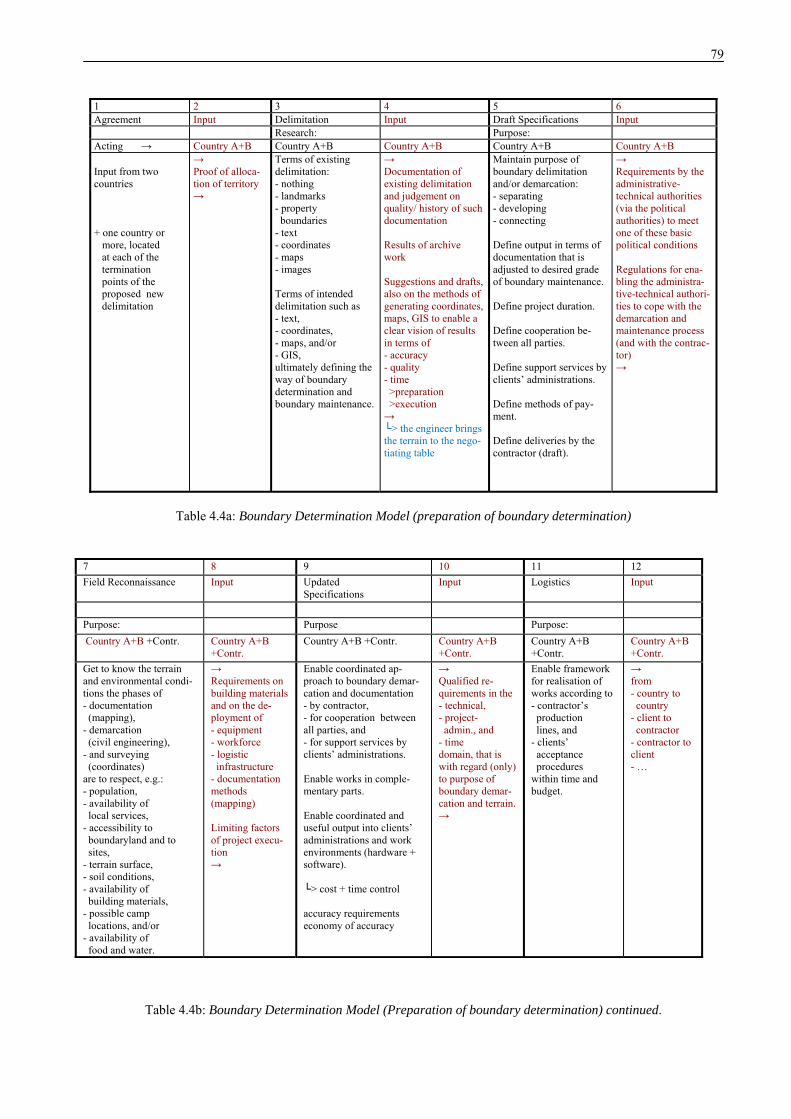
4.3 BOUNDARY DETERMINATION MODEL ...............................................................................................................74
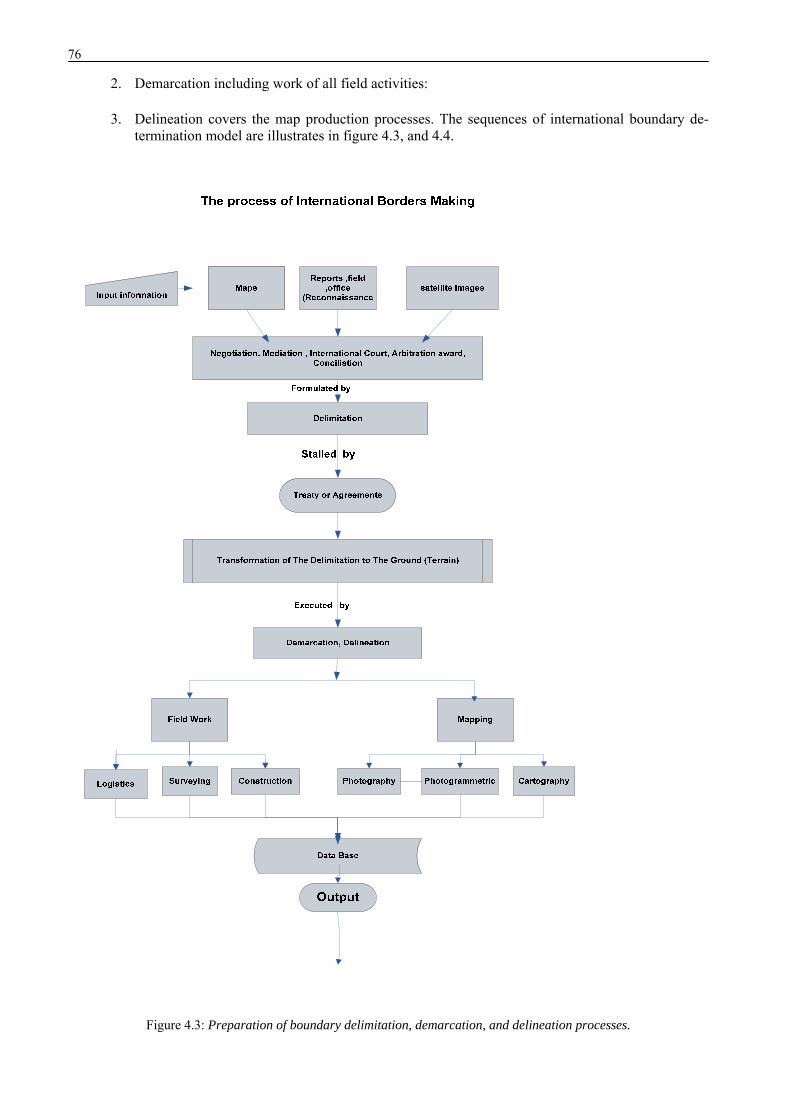
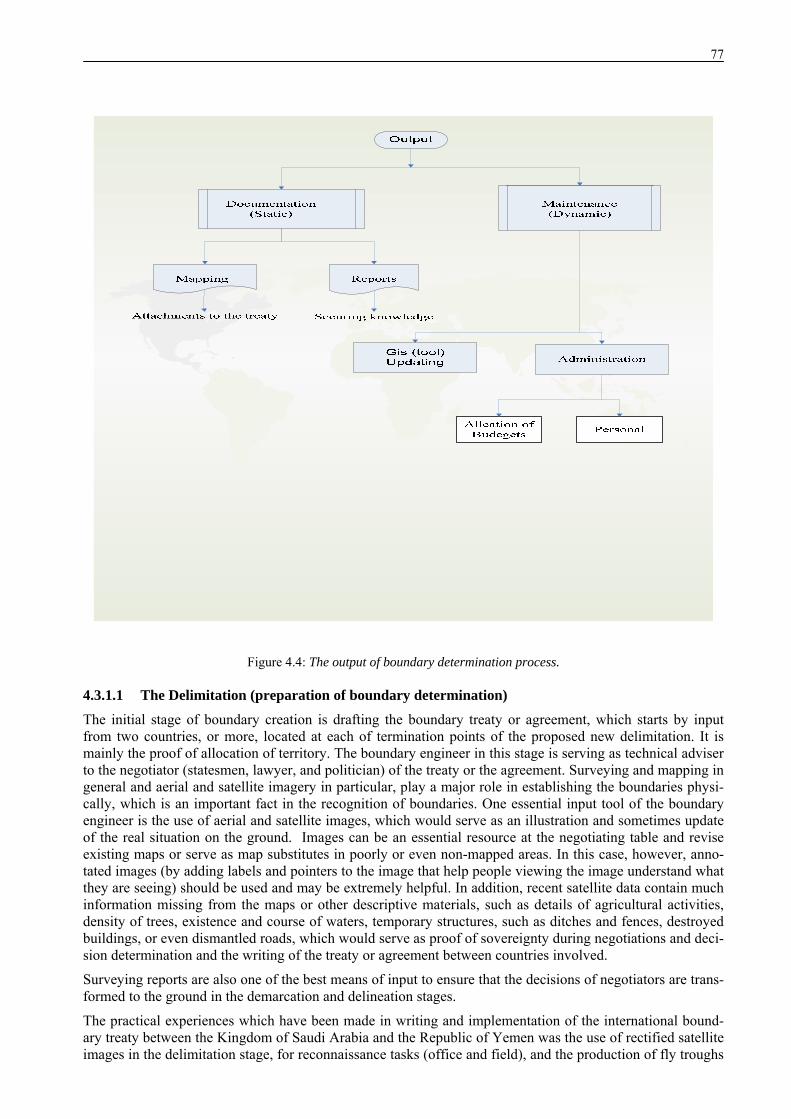
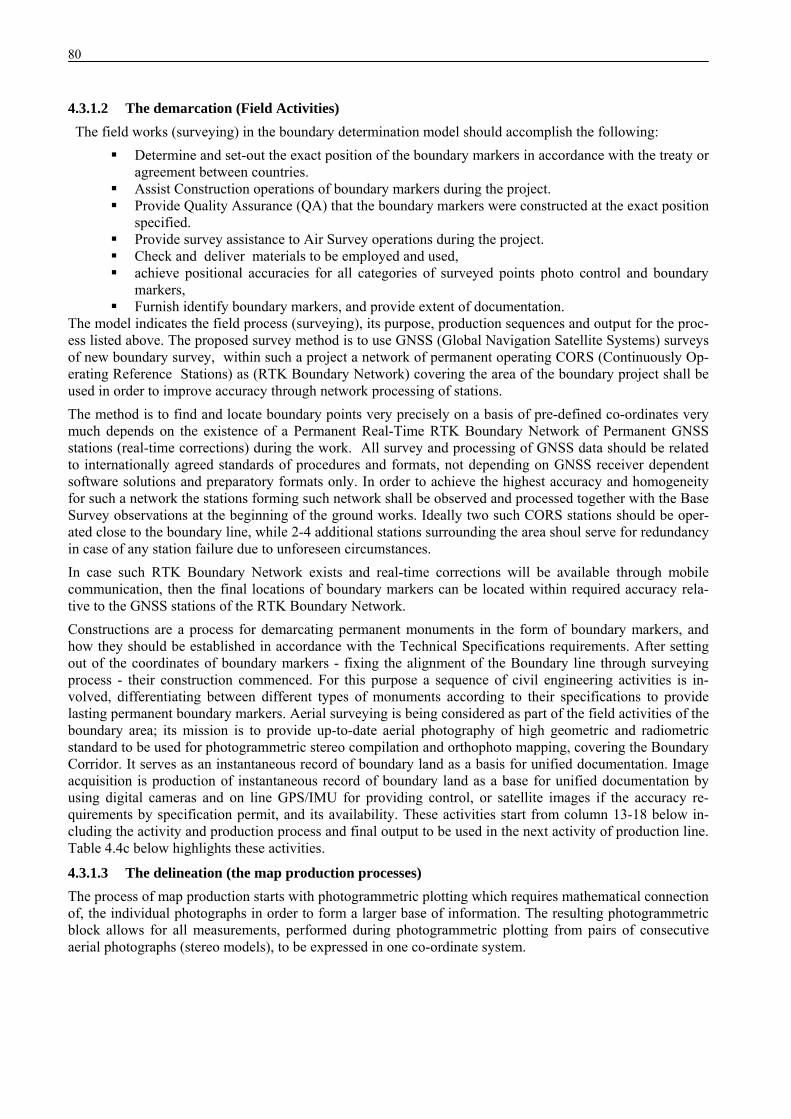
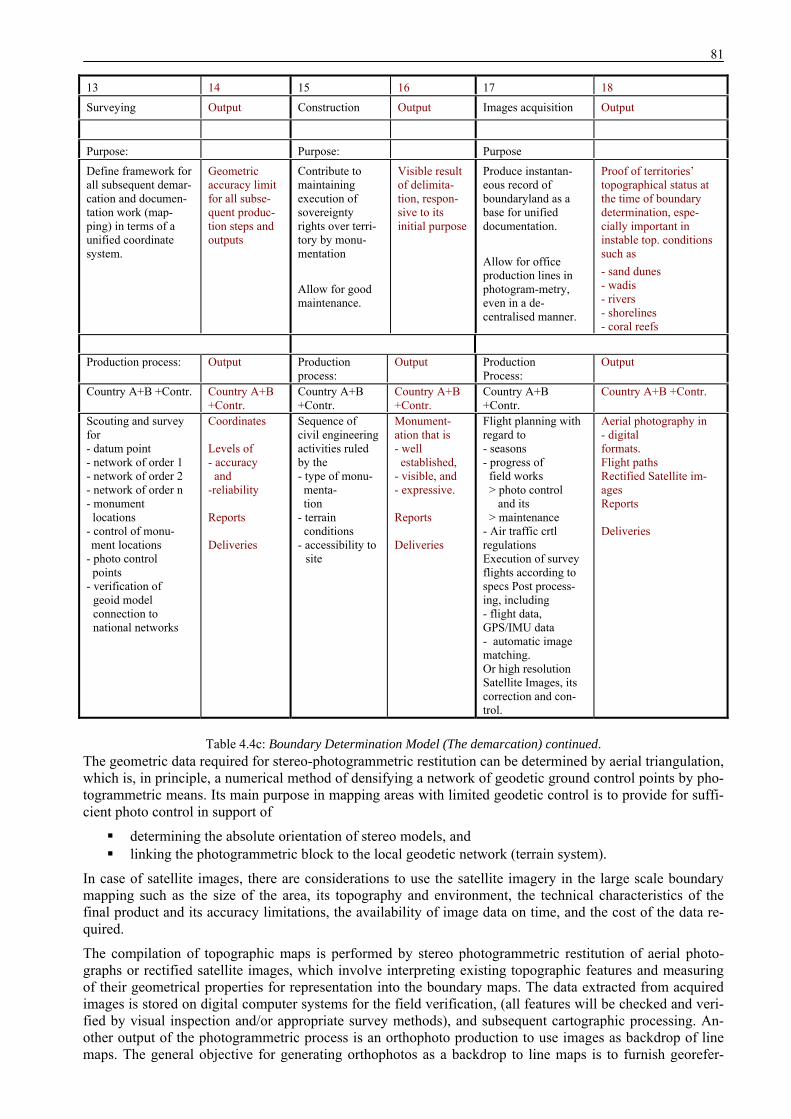
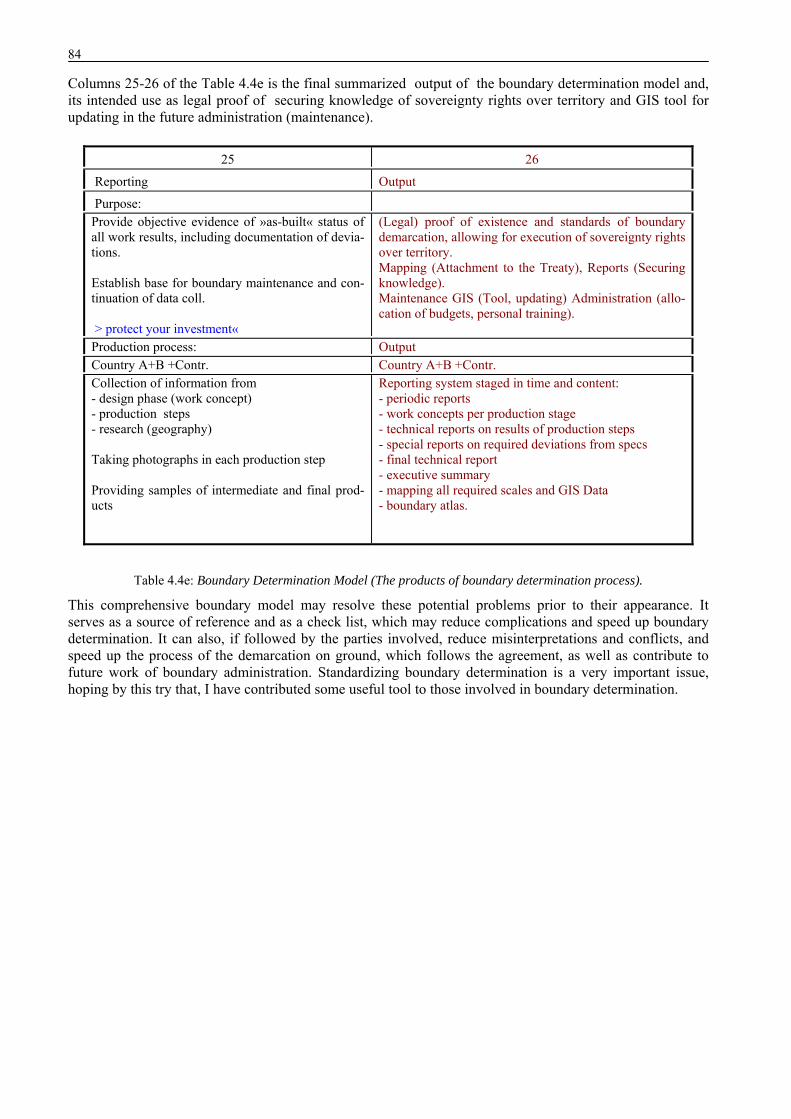
4.3.1.1 The Delimitation (preparation of boundary determination).............................................................77 4.3.1.2 The demarcation (Field Activities) ..................................................................................................80 4.3.1.3 The delineation (the map production processes) .............................................................................80 4.3.1.4 The products of the Boundary Determination Process (output).......................................................82
5 THE CONCLUSION AND OUTLOOK ................................................................................................ 85
1.1 Boundary determination Obviously, stable and mutually agreed boundaries are a major pre-requisite for a peaceful cooperation be-tween countries. Surveying and mapping in general and aerial and satellite imagery in particular, play a ma-jor role in demarcation of the boundaries physically which is an important fact in the recognition of bounda-ries. Before discussing boundary determination, several terms which are commonly used in this area are shortly reviewed such as treaty, delimitation, demarcation, and delineation. They appear in many stages of establishing international boundaries, and their definitions are found e. g. in [Alec Mc Ewen, 2002], [Ron Adler, 2002] and [Treaty Handbook,UN].
The meaning of treaty and international agreement under Article 102 of the charter of the United Nations is defined as: “Treaty is a generic term embracing all instruments binding under international law, regardless of their formal designation, concluded between two or more international juridical persons”. The Vienna Con-vention (1969) defines a treaty as “an international agreement concluded between States in written form and governed by international law, whether embodied in a single instrument or in two or more related instru-ments and whatever its particular designation”[ Eduardo Vakencia-Ospina, 2002].
Treaties between two or more countries are political- juridical instruments enforcing delimitation and demar-cation by an executor, taking into consideration the customary international law represented by the United Nations (UN) for accepting, binding and maintaining sovereignty rights over the territory of the concerned countries. Boundary delimitation requires to have external specifications which define the scope of work, technical specifications for each part of work in terms of description, physical properties, time covering the cycle of boundary determination (surveying, construction, mapping), allowing the internal specifications to define the true needs of boundary administration for operation.
Delimitation is the legal process by which two sovereign nations establish and describe in writing the loca-tion of their common boundary, mainly as the output of the decision making on the negotiation table.
Demarcation is a field operation. Its purpose is to mark the position of the boundary on the ground so it is visible to all, and this normally starts by surveying which is the initial stage of demarcation. The objective of demarcation is to place or adopt physical marks that accurately represent the location of a delimited bound-ary. Wherever possible, demarcation by artificial boundary marks should consist of monuments placed di-rectly on the boundary line. A joint commission, composed of an equal number of members from each coun-try, normally undertakes the physical demarcation.
Boundary demarcation is based on requirements with either static documentation (paper mapping and re-ports) as an output, which for securing knowledge or information about their boundaries, are to be attached to the treaties archived in the UN; or they are based on dynamic output (like data for Geographic Information Systems, GIS) to be used by future boundary administrations.
Delineation is the graphical or mathematical representation of the boundary. Frequently, a joint commission undertakes both demarcation and delineation. The commission’s published results consist of reports, photo-graphs and other illustrations, maps, and tables showing geographic positions of boundary monuments and survey control stations used for the entire period of field work. In this way delineation is the comprehensive description of the entire demarcation and mapping activities that is able to document the boundary for future reference. There are two types of boundaries: natural and geometric or artificial boundaries.
Natural boundaries are hydrological boundaries, or watercourses, dry boundaries (wadis), mountain ranges and other natural landmarks. Artificial boundaries are boundaries marked by monuments.
Boundaries which are based upon natural characteristics quickly come to mind, e. g. the boundary between Spain and France or the one between France and Germany. But it is obvious that many boundaries in today’s world do not depend on natural characteristics. Generally, flat areas are appropriate for boundary crossings and it is not easy to see such a boundary unless it is clearly defined. There are several boundary definitions generally referring to physical and/or ethnic characteristics. However, there are also boundaries which nei-ther depend on physical nor ethnic characteristics. These types of boundaries can be classified as artificial boundaries. Unfortunately, this type of boundary causes many disputes.
Boundary determination can be accomplished in three ways.
8
The countries of concern set requirements, specifications and implementation rules and share the output and its future use by their boundary administration.
Countries call upon the UN Secretary General to make arrangements to demarcate their common boundary. In this case the requirements and specifications are often different, because the cost of boundary determination plays a major role and may affect the output. This type sometimes tends not to be fully state-of-the-art.
Countries have the financial ability to contract out to the private sector to do their boundaries. Boundary determination can be influenced also by a wide range of historical, geographical, political, eco-nomic and cultural factors. As a consequence, “there is no single model of good practice in boundary demar-cation and maintenance, but sharing experience from around the world can help generate new ideas” [Con-clusion 4.6, Thailand 7-9 Nov 2006. Published by the International Boundary Research Unit (IBRU), Uni-versity of Durham, UK].
The thesis will discuss the three ways, share the experience of the more comprehensive way of boundary determination as being realized in the boundary determination between The Kingdom of Saudi Arabia and The Republic of Yemen, and provide a boundary determination model.
1.2 Objectives and focus The main objective of the work described in this thesis is to improve the procedures used for international boundary determination and to develop the important connection of common international standards (ISO) into the boundary determination. These procedures can help states come to a boundary agreement by ena-bling the stages of boundary determination (e.g.: boundary demarcation, delineation, documentation and boundary maintenance) to be more reliable and sustainable. Thus, it will contribute to the stability and re-spectability of the boundary.
Boundary determination is an issue which deals with legal, political and technical aspects such as interna-tional treaties in its formulation which are normally stalled by means of negotiation, mediation, consolation or by international court. The focus of this thesis is the realization of such a treaty on the ground (terrain). The technical input aspect of the boundary determination is executed by demarcation and delineation going through the activities of surveying, monumentation and mapping.
The aim is of the thesis is to set up a model for the boundary determination process based on international specifications, agreements and good practices, these can be measured with existing procedures for quality control standards, by linking the boundary determination activities with (ISO) standards for quality. The treaty must meet the requirements for registration set by the UN, so that the treaty can be enforced by law. Every country has its own needs and practices but to follow international standards and agreements to guar-antee stability, avoid disputes and degeneration of the boundary and its data.
1.3 Relevance Boundary determination and its management in the twenty first century are a complex and challenging task. It is widely agreed that in globalizing world boundaries should be as open as possible. World governments are understandably more anxious than ever to ensure that their frontiers are secured against external threats. They are facing increasingly complex challenges in the exercise of territorial sovereignty. That is why they are spending much more than what is required by the United Nations for registration and authentication of the boundaries and the compilation of boundary maps and documents. This thesis is reflects more than 15 years of experience in boundary issues starting from negotiation of technical requirements as input, to the treaty creation and the output of the boundary determination process, up to the administration of the bound-ary which is a continues task even after the installation of the boundary. It is the technical aspects of bound-ary which brings the terrain onto the negotiation table.
Quality control is of major concern in any production line. It links all work processes. The concepts which were used for demarcation and delineation of the Saudi-Yemeni boundary and the quality control procedures used in the execution of the boundary project have resulted in a good level of permanence and quality, there-fore it provides a base for an international boundary determination model. The information provided in this model can guide people to better understand of the consequences of the Surveying and Mapping process on boundary determination.
9
1.4 Organisation of the thesis The next chapter consists of three main sections. The first describes the international treaty, and the require-ments to register a treaty according to UN regulation, the data base outcome of the registration including certification as legal document. The second shows some examples which have been realized in boundary determination between Indonesia and Timor, Cameron and Nigeria, and the Euro Boundary map set up and the importance for unified data specifications, and discussing the examples. The third introduces quality management standards of the ISO 9000 family (organizational), and the necessity for certification of these standards to the producer of the boundary determination process. The ISO 19100 family standards (Techni-cal specification or guidelines) for the quality products deals with quality principles, evaluation procedures for Meta Data, and the product specification and its quality measures. Chapter 3 states the boundary determi-nation between Kingdom of Saudi Arabia and Republic of Yemen as an example of comprehensive interna-tional boundary determination. Chapter 4 shows the use of quality standards for the boundary documenta-tion process, linking to ISO standards and the flow of a quality control model. The boundary determination model is starting from the preparation of the delimitation, demarcation, delineation, and leads to the required output of boundary determination. Finally the fifth chapter states conclusion and gives an outlook.
10
11
2 State of the Art
2.1 Treaty and International Agreement of a Boundary A treaty is the starting point in the execution of international boundary determination. Thus, it must be gov-erned by international law, and is normally in written form. Although the Vienna Convention (1969) does not apply to non-written agreements, its definition of a treaty states that the absence of writing does not af-fect the legal force of international agreements. Thus, treaties may be concluded between:
a) States; b) International organizations with treaty-determination capacity and states, or international organiza-
tions with treaty-determination capacity. The application of the term treaty, in the generic sense, signifies that the parties intend to create rights and obligations enforceable under international law [UN Treaty Handbook].
Treaties for establishing a boundary are, consequently, governed by the Law of Treaties codified in the 1969 Vienna Convention ,to which most states have become parties and many of whose provisions have been found by International Court of Justice (ICJ) to be “declaratory of customary international law “ . The term boundary customarily denotes the limit of the land territory of a state, but it could be taken more broadly to designate the various lines which fix the special limits of the exercise of different powers customs, the limits of the territorial sea, the continental shelf. The exclusive economic zone and armistice line could be consid-ered as boundaries [Eduardo Valenica-Ospina 2005].
The treaties could be a multilateral treaty between three or more parties, or a bilateral treaty between two parties. In some situations, several States or organizations may join together to form one party. There is no standard form for a bilateral treaty.
An essential element of a bilateral treaty is that both parties have reached agreement on its content.
2.1.1 The Registration Requirements for a Treaty A treaty submitted for registration at the UN must meet the following general requirements summarized from the UN Treaty Handbook:
1. Treaty or international agreement within the meaning of Article 102 as mentioned in section 1.1, the Secretariat of the UN reviews each document submitted for registration to ensure that it falls within the meaning of a treaty or international agreement under Article 102.
2. Certifying statement: Article 5 of the Regulations requires that a party or specialized agency register-ing a treaty or international agreement certifies that “the text is a true and complete copy thereof and includes all reservations made by parties thereto”. The certified copy must include:
a. The title of the agreement; b. The place and date of conclusion; c. The date and method of entry into force for each party; and d. The authentic languages in which the agreement was drawn up.
When reviewing the certifying statement, the Secretariat requires that all enclosures such as proto-cols, exchanges of notes, authentic texts, annexes, etc., mentioned in the text of the treaty or interna-tional agreement as forming a part thereof, are appended to the copy transmitted for registration. The Secretariat brings the omission of any such enclosures to the attention of the registering party and defers action on the treaty or international agreement until the material is complete.
3. Copy of treaty or international agreement: Parties must submit one certified true and complete copy in the right format of all authentic text(s), and two additional copies or one electronic copy to the Se-cretariat for registration purposes. The hard copy version(s) should be capable of being reproduced in the United Nations Treaty Series. Member States and international organizations should provide English and/or French translations of treaties submitted for registration with the United Nations Se-cretariat where feasible. Courtesy translations in English and French, or any of the other official lan-guages of the United Nations greatly assists in the timely and cost-effective publication of the United Nations Treaty Series.
4. Date of entry into force: The documentation submitted must specify the date of entry into force of the treaty or the international agreement. A treaty or international agreement will only be registered after it has entered into force.
12
5. Method of entry into force: The documentation submitted must specify the method of entry into force of the treaty or the international agreement. This is normally provided in the text of the treaty or international agreement.
6. Place and date of conclusion: The documentation submitted must specify the place and date of con-clusion of the treaty or the international agreement. This is generally inserted on the last page imme-diately above the signature. The names of the signatories should be specified unless they are in typed form as part of the signature block.
2.1.2 Publication According to Article 12 of the Regulations of publication of a treaty, the Secretariat shall publish as soon as possible, in a single series every treaty or international agreement that is registered, or filed and recorded. Treaties are published in the United Nations Treaty Series in their authentic languages, followed by transla-tions in English and French, as required. Subsequent actions are published in the same manner. The Secre-tariat requires clear copies of treaties and international agreements for publication purposes [United Nations Treaty Series].
Where the Secretariat exercises the limited publication option in relation to treaties or international agree-ments registered or filed and recorded, their publication is limited to the following information in accordance with article 12(5) of the Regulations:
a. Registration number or filing and recording number; b. Title of the instrument; c. Names of the parties between whom it was concluded; d. Date and place of conclusion; e. Date and method of entry into force; f. Duration of the treaty or international agreement (where appropriate); g. Languages in which it was concluded; h. Name of the party or specialized agency registering the instrument or submitting it for filing
and recording; i. Date of registration or filing and recording; and j. Where appropriate, reference to publications in which the complete text of the treaty or in-
ternational agreement is reproduced.
2.1.3 The Database Outcome of Registration The database of the treaty registered filed and recorded are kept in English and French. The database and recording contain the following information, with respect of each treaty or international agreement:
a. Date of receipt of the treaty by the Secretariat of the United Nations; b. Registration number or filing and recording number; c. Title of the treaty; d. Names of the parties; e. Date and place of conclusion; f. Date of entry into force; g. Existence of any attachments, including reservations and declarations; h. Languages in which it was drawn up; i. Name of the party or specialized agency registering the instrument or submitting it for filing
and recording; and j. Date of registration or filing and recording.
In accordance with article 1 of the Regulations, registration is effected by a party and not by the Secretariat. The Secretariat makes every effort to complete registration on the date of submission.
Registering parties have an important obligation to ensure that documents submitted for registration are complete and accurate in order to avoid delays in the registration and publication processes. In cases where submissions are incomplete or defective, the date of registration of the treaty or international agreement is deemed to be the date of receipt of all of the required documentation and information and not the date of the original submission.
13
2.1.4 Certification of Registration
Once a treaty or international agreement is registered, the Secretariat issues to the registering party a certifi-cate of registration signed by the Secretary-General or a representative of the Secretary General. Upon re-quest, the Secretariat will provide such a certificate to all signatories and parties to the treaty or international agreement.
2.2 Boundary Determination in Practice The process of creation (determination) of international boundaries between countries is one of the most important elements in the development of peace between countries [Sobar Sutisna, 2006]. The boundary determination process starts by defining the limits of sovereignty of states. Unclear definition of boundaries is among the primary reasons for territorial conflicts which frequently lead to armed confrontations between nations. However, most of the work is done behind the scenes by professionals, boundary experts from a range of disciplines –including surveying and mapping. Their professional responsibility extends beyond the technical support of boundary negotiations and also includes involvement in delimiting boundaries, and re-sponsibility for boundary demarcation, delineation (documentation), and future maintenance. Their failure in performance may lead to boundary conflicts.
There are two types of boundaries: Natural and geometric or artificial. Many boundary determination terms were discussed in section 1.1. The physical artificial boundary will be the main discussion on the three case studies, where we have monuments placed directly on the boundary line (see figure 2.1) for everyone to see.
Figure 2.1: Markers as a tool for boundary demarcation.
The cost of executing boundary determination depends on many variables such as the state’s financial condi-tion. Some states are unable to support boundary determination.This reflects into the documentation re-quirements as well. In this case the requirement will be different because the rather limited (financial) re-sources affect the output of boundary determination. Such an approach would be directed at executing a mere treaty registered with the UN without observing the concepts of boundary maintenance and management. The physical output of boundary determination, however, sometimes tends not to stand the test of time (see figure 2.2).
Figure 2.2: Boundaries markers were damaged due to the test of time
14
Boundary determination is influenced by a wide range of historical, geographical, political, economic and cultural factors. As mentioned before, there are three implementation ways of boundary determination:-
1. States make their own boundaries. 2. States call up the UN for support to help them make their boundaries. 3. States have the financial ability to contract out to the private sector to implement their bounda-
ries. The boundary study cases below will be based on the two ways of boundary determination as stated in 1 and 2 above. This thesis examines these ways as being realized for the boundaries between Indonesia and Timor, and between Nigeria and Cameroon. It compares their documentation requirements and outputs, taking into account the functions of the boundary such as separating, developing or connecting the different countries, and their financial abilities. The third way will be discussed in details in chapter 3 (The boundary between Kingdom of Saudi Arabia and Republic of Yemen).
2.2.1 Boundary between Indonesia and Timor With reference to[Sobar Sutisna, 2006], the report issued by the Center for Boundary Mapping of the Na-tional Agency for Surveys and Mapping of Indonesia and to other publications, the activities for boundary determination are summarized as follows:
In 2003 the Republic of Indonesia (RI) and the Democratic Republic of Timor-Leste (DRTL) have agreed to delimit their boundary according to the 1914 treaty. They conducted the joint delineation and demarcation surveys of the land boundary between them, as follows:
First, to produce coordinates along the boundary line based on an agreed geodetic reference system, second to establish a common boundary geodetic datum reference frame (CBDRF), and to prepare and produce a series of boundary maps along the boundary line for presentation of the land boundary.
The common Boundary Datum Reference Frame for the establishment of the international terrestrial bound-ary between the RI and the RDTL is formed by a set of geodetic control points used as reference for the sub-sequent delineation and demarcation surveys of the boundary.
ITRF2000 (International Terrestrial Reference System, solution 2000) has been selected to map the CBDRF into a known international reference frame. After independent processing by the Indonesian and the East-Timorese partners, the work is jointly analyzed and corrected. The agreed final coordinates of the CBDRF network were a guarantee of the accurate delineation of the boundary line. In total there are 69 stations of the CBDRF network, consisting of:
4 Zero-Order stations (1 in Timor-Leste and 3 in Indonesia) 16 first-Order stations (9 in Timor-Leste and 7 in Indonesia) 49 Second-Order stations (10 in Timor-leste and 39 in Indonesia) [Sobar Sutisna and Sri Handoyo
2006].
Fernandes concluded that the results of the processing showed that the stations of the CBDRF, in particular, the Zero- and First-Order stations, have very robust solutions with respect to ITRF2000 [Fernandes et al., 2005]. In this way, the accurate connection of the points of the boundary line between Timor-Leste and In-donesia is possible with respect to a global reference frame. Furthermore, the derived solutions can be used in the future for other types of projects (e.g., geodynamic studies or definition of national geodetic net-works).
The joint demarcation surveys is a joint activity to accurately survey and build the boundary markers along the boundary line especially in accordance with the list of the boundary point coordinates as agreed between the two countries.
The boundary line was delineated according to the following agreed upon criteria as described in the Agreed Technical Specifications and the Standard Operation Procedures:
by natural boundaries ; by coordinates of the boundary points; by defining the boundary as a north-south or east-west line of certain longitude or latitude; by delineating the boundary on a map; by describing the boundary geographical location verbally (non-natural boundaries).
15
The delineation processes were implemented on both the agreed maps and imageries as well as through the joint field surveys. Boundary line delineation on maps and imageries was done independently by each coun-try as a preliminary step meeting the accuracy standards and specified technical specifications.
Field verification was done with respect to terrain features by a joint field team. As mentioned above, the boundary line delineation on maps/imageries was done independently by each team where they should meet the accuracy standards and specified technical specifications. The output of this boundary determination is:
a list of point coordinates
one sheet of General Map at 1:125,000 scale, 17 sheets of Boundary Maps at 1:25,000 scale, and 26 sheets of Image Maps at 1:10,000 scale.
In this example there were no clear requirements about the further use of the data, e.g. just for static use as boundary line documentation only or whether they should be used in the future for boundary administration. The boundary marker design was not mentioned since this boundary line is designed to divide the two coun-tries. Therefore a boundary sign has to be in place for everyone to see.
The quality and reliability of the boundary determination is unknown, except some metrics of data quality. The only indication was the map scales and the surveying works, both have met the technical specifications.
2.2.2 Boundary between Nigeria and Cameroon Representatives of Nigeria and Cameroon met in Abuja to discuss the demarcation of their boundary, as dic-tated by the 2002 ruling of the International Court of Justice (ICJ). Demarcating the distance of 1600-kilometer land boundary from Lake Chad to the Bakassi peninsula is part of the agreement reached by lead-ers of Cameroon and Nigeria in order to resolve their boundary dispute in accordance with the ruling of the International Court of Justice. The two countries have made substantial progress in implementing the court ruling under the direction of the U.N. Mixed Commission. The International Court of Justice ruled that sov-ereignty rights over certain areas should go to Cameroon, while other areas should go to Nigeria.
This agreement includes the demarcation of land boundary. The process of demarcating has started with the mixed commission establishing a sub commission and a joint technical team including experts (mainly sur-veyors) from the UN, from Cameroon and Nigeria responsible for processing the physical demarcation of the land boundary. These commissions agreed on several activities many of which had been contracted out to the private sector:
Preliminary mapping (using SPOT5 satellite imagery). Field assessment of boundary pillar site. Ground Control for mapping. Establishment of geodetic network. Quality control for survey work. Boundary pillar construction. Boundary pillar survey. Final Mapping.
The preliminary map sheets at the scale of 1:50,000 were prepared using SPOT5 satellite imagery, which was tasked to the UN cartography section in New York. The corridor covers 30 km on either side of the boundary. These images were ortho-rectified, the digital elevation model (DEM) was derived from STRM (shuttle radar topographic mission) with 90m resolution. The accuracy of these maps was satisfactory for the field reconnaissance. At a later stage the maps will be augmented from the measurements of ground control points leading to the production of the final mapping. The boundary line based upon the delimitation defined by the ICJ judgment is shown on the maps. This line acts as a guide to the field teams enabling them to pro-ceed in the correct general direction as an aid to the demarcation of the boundary.
The goal of field assessment of the land boundary is to accurately identify the locations of the boundary pil-lars which will be constructed. The site and the coordinates are recorded and signed by all delegations. Coor-dinates were recorded in (UTM) projection using GPS to sub-meter accuracy. One of the requirements to complete the demarcation process is to establish a geodetic network along the boundary for the final survey of the boundary pillars. International boundaries should be referenced to an internationally recognized sys-tem. Therefore, the WGS84 ellipsoid was chosen. The contract for the geodetic network consists of the con-struction and survey of 10 primary markers equally spaced along the boundary in either country along with 30 secondary markers located closer to the boundary. The accuracy of the network is 0.010m+1.0PPM (max error 0.0100m) for primary markers and 0.020m+10.0ppm (max error 0.20m )[Ian Allen 2008 ]. The bound-
16
ary pillars are separated in two types: primary pillars which stand at some 2m in height. They will be placed at 5km intervals and smaller secondary pillars will be constructed in between at 500m and 100m intervals through towns and villages. After construction of the pillars they will be surveyed using GPS at an accuracy of 0.020m+10ppm (max 0.200m). A separate quality assurance contract for GPS computations for the geo-detic network and final survey is to provide assurance for the quality of work. The end of the boundary determination chain is the final mapping, whereby all the information from the final survey will be transferred to the fully rectified 1:50,000 mapping. The archiving of the data by the UN will be done along with the transfer of the information from the two countries. This project is still in progress, and recently the Mixed Commission have approved the following: The report of the Sub-Commission on Demarcation on the field assessment missions of October-November 2008 and April-May 2009. The list of pillar types, sites and their coordinates adopted by the Sub-Commission on Demarcation is con-sidered to be the basis for boundary pillar placement. The Mixed Commission requested the United Nations to provide the United Nations Office for Project Services (UNOPS) with adequate information, in a manner that identifies each pillar location in UTM coordinates as well as with respect to the pillar type (primary or secondary. It further approved the establishment of a technical training programme to be funded through the Trust Fund which is administered by the United Nations.
2.2.3 Euro Boundaries “Euro Boundaries” is a project with the goal to compile a multipurpose Euro Boundaries data set. The Euro Boundaries project was initiated in 2005 by EuroGeographic’s members. The aim is to provide legally agreed data upon national boundaries at the highest available accuracy. It involves also standardizing the legal procedure, the collection and preparation of these boundaries for the entire Europe. This work will take quite a long time until its full achievement. The discussion of Euro Boundaries will be based on mapping of the geographical representations and not as legal issues. An important objective of the project is to enable GI integration and interoperability by implementing a set of standards such as the Infrastructure for Spatial In-formation in the European Community (INSPIRE). The culture of the personnel involved in such an objec-tive is especially oriented towards GIS. The Euro Boundaries data set is planned to contain:
1. One common representation based on the legally agreed national boundaries at high accuracy for some parts of the boundaries.
2. Two different national representations of some other parts if requested. 3. One provisional (line) in case the two others types are not available on the basis of best possible
information as temporary limited representation. The EuroRegionalMap(ERM) is a topographic pan-European database at the scale 1: 250,000. The adminis-trative theme contains agreed representations of national boundaries; however, the agreement is not a legal one but just an agreement between National Mapping and Cadastral Agencies (NMCAs). Boundary and to-pographic objects included in ERM (roads, rivers,) are ensured. EuroGlobalMap (EGM) is a topographic pan-European database at scale 1:1,000,000; it includes 39 coun-tries (incl. all countries in the European Community). As for ERM, the administrative theme contains agreed representations of national boundaries; however, the agreement is not a legal one but just an agreement be-tween NMCAs , Consistency between national boundary and topographic objects (roads, rivers, …) in-cluded in EGM is ensured [INSPIRE D2.6_v2.0_final.doc]. EuroBoundary Map is at scale 1:100,000 covering Europe. EuroBoundaryMap is an administrative reference database. It includes 39 countries (incl. all countries of the European Community). The representations of national boundaries contained in EuroBoundaryMap are not all legally agreed . Its seamless and harmonized data are continuously maintained by the NMCAs. The source data of EuroBoundaryMap is the best avail-able resolution and semantic quality. The quality of the product has been checked according to ISO 19113 standard to meet the required product specification. The data product specification is harmonized with other EuroGeographics products. The metadata of EuroBoundaryMap and all national contributions is based on the ISO 19115 standard [EuroGeographics, projects accessed Nov 2009-11-03 ]. Boundaries in dispute for geopolitical reasons can be maintained separately. Boundaries in dispute owing to technical or administrative reasons cannot be considered as such and should be resolved first.
17
In case there is not yet an agreed boundary, at the required Level of Detail [LoD] between two neighboring countries, the criteria for a suitable fixed boundary according to INSPIRE are the following:
The first criterion to resolve a boundary is to agree on the geometric resolution accuracy and a degree of generalization suitable for the different scales or LoDs involved.The degree of gener-alization focuses on the density of vertices. Geometric data resolution in the density of vertices on an edge should be as low as possible keeping a realistic size and shape of the spatial object. When two boundaries are presented having similar resolution, the preference should be given to a given boundary with the best positional accuracy and degree of generalization.
The second criterion is to keep the full consistency of the national boundary with the topography or at least the relative topological relation of the national boundary with the topographic objects, even to the determent of its absolute positional accuracy. For medium and small scale data this means that the relative position of the boundary with the topographic situation should prevail on its absolute position.
When the national boundary is determined by real-world topographical objects (like a mountain range or a river), the geometry of the boundary should exactly fit the geometry of the topographi-cal object. When practicable, neighboring countries should agree on common representation of those topographical objects coincident or coterminous with the national boundary line. Consis-tency of the national boundary with the water network has the highest priority.
The referring coordinate system of the agreed geometrical location of the boundary vertices should be the European reference system (ETRS 89).
All decisions concerning the representation of national boundaries should be based on traceable arguments (like boundary treaties and supporting documents as orthoimages, maps).
Furthermore, the Euro Boundaries project may offer the contact person responsible for the country’s national boundary. As soon as fixed, those agreed international boundaries should be stored and structured in a common data schema. This international boundaries data set would serve as reference data for sustainable maintenance at national level and could be stored at European level.
2.2.4 Summary of the cases The boundary of Indonesia and East Timor has been defined, and the Government of East Timor has control of their country, they run their economy, and now sought to negotiate a definite boundary with Australia at the halfway line between the countries, in accordance with the United Nations Convention on the Law of the Sea. Thus solving boundaries disputes will be the way of peace and prosperity. The implementation of the ruling The International Court of Justice with regards to the boundary of Cameron and Nigeria is progressing, and could be figured out from the concluding statement made by the chairman of the Mixed Commission and special representative of the secretary-general of the United Nations, in the meeting at Yaoundé, 9 October 2008 “The firm decision to resolve their boundary dispute through legal means, which shielded their peoples from the sufferings and throes of conflict and by pursuing with determi-nation the implementation of both the Court’s ruling and the Greentree Agreement, Cameroon and Nigeria are undoubtedly writing a beautiful chapter of our Continent’s troubled history. It is our duty to tell the story of this reunion between two countries and peoples united by a common destiny, so that it inspires men and women of goodwill on the continent and strengthens our belief that conflicts are not the fate of our conti-nent.” [U.N office for West Africa report, UNOWA]. Furthermore with respect to the technical documentations (Surveying and Mapping), the two cases above, both of them are based on static documentation (mapping and reports) as an output for their boundary deter-mination which for securing knowledge or information’s about their boundaries to be attached to the treaties or agreements in the UN. The financial situation of those countries played an important role in the cost of boundary demarcation and outputs. They make the understanding of these products that they are only for documentation at the UN. There was no mention, whether that information will be used in the future, for maintenance, search for re-sources or to manage the boundary. The objective in this discussion is to explain the approach used in the demarcation and documentations the boundaries, where the cost is at the minimum requirements. The comprehensive way of boundary determination should be reflected by products output whether it is static output (maps and reports) for archiving of the data in the UN or dynamic output (GIS) for future use of the data .Table 2.1 below indicates the summery and comparison of these two cases.
18
Country Name Product of boundary determination
Boundaryline length
Cost / Time Future Use Of the Data (static or dynamic output)
The Republic of Indonesia (RI) and the Democratic Republic of Timor-Leste (DRTL )
69 geodetic stn (CBDRF),boundary coords 17 sheets line map 25 k 26 sheets image map 10k 1 sheet of general map 125k
Around 200 km
Each country has done their side of bound-ary project, the time is not clear
Not clear about the future of the data, it seems to be for archiving purposes only. Static output.
Contributions from countries under the direc-tion of UN. Time spent not clear
Archiving of the Data in the UN , and transfer to the two countries Static output
Table 2.1: comparison of boundary determination
A comparison indicates the products of the boundary determinations, and possible future use. The process of these boundary determinations had effected the documentation requirements of the boundary; they might be compromised with regard to national interests, and leaves no room for the technicalities details. The future use of the boundary data should be considered during the execution of any boundary project, these must be taken care of by professional staff like lawyers and engineers.
With regards to the Euro boundaries, the most important issues are harmonization of the data provided by different sources to ensure consistency, and edge-matching (thematic and geometric data matching algo-rithms) at national boundaries to agree on common representation of the boundary. These issues required a big effort on the part of all Euro countries to standardized data specification.
The conclusion of all the above cases including the Euro boundaries indicates the importance of a common set of standards to be used by any country involved in the determination of boundaries with neighboring countries.
The comprehensive way of boundary determination should be reflected by products output whether it is static output (maps and reports) for archiving of the data in the UN or dynamic output (GIS) for future use of the data. This background will serve as base for studying the use of ISO standards for data quality by link-age these standards to the appropriate process of boundary determination in later stage of this thesis.
2.3 Quality Standards The need to exchange geospatial information was the motive behind standardization in the field of Geo-graphic Information (GI). The first standards for exchange emanated from the military standard for exchange of geographic data the Digital Geographic Exchange Standard (DIGEST) and were established by the Digital Geographic. These standards are generally taken up by the International Organizational for Standardiza-tion/Technical Committee (ISO/TC 211) to be published as standards or technical specifications. The devel-opment of GI standards does not exclude other standards from consideration such as The Open Geospatial Consortium (OGC), especially those relating to data quality and metadata.
The ISO/TC 211 standards relating to the quality and metadata ISO 19100 series are therefore used as com-plement to the implementation standards in the domain of geographic information, as well as of the general standards the ISO 9000 series.
Issues of standardization are relevant only during interactions between different actors. By relying on the ISO quality management, and metadata quality standards, actors in the domain of geographic information can share credible concepts and principles of those standards [Devillers and Jeansoulin, 2006].
Standardization of boundary determination can be served best by a set of international standards such as those from ISO that integrates a detailed description of the concepts of boundary determination information
19
and procedures recognized by international bodies such as the United Nations for future use. There are two types of ISO quality standards, organizational (ISO 9000 family) and technical (ISO 19100 family). Those two sets of standards are very important in any organization dealing with production of boundary data for improving the methods used for international boundary determination and to develop the important connec-tion of these common international standards (ISO) into boundary determination. On the bases above and since the rules or regulations governing and assisting boundary determination are good practice by imple-menting known technical standards guideline, a summary of the ISO quality standards used in this thesis are followed in Table 2.2.
International Standards used.
ISO 9000:2005, Quality management systems -- Fundamentals and vocabulary ISO 9001:2008, Quality management systems -- Requirements ISO 9004:2000, Quality management systems -- Guideline for performance improvements ISO 19111:2007, Geographic information — Spatial referencing by coordinates ISO 19113:2002, Geographic information -- Quality principles ISO 19114:2003, Geographic information -- Quality evaluation procedures ISO 19114:2003/Cor. 1:2005, Geographic information -- Quality evaluation procedures –Corrigendum 1 ISO 19115:2005, Geographic information -- Metadata ISO 19115: /Cor. 1:2005, Geographic information -- Metadata - Corrigendum 1 ISO 19118:2005 Geographic information- Encoding ISO 19131:2007, Geographic information – Product specification ISO 19135:2005, Geographic information – Procedures for item registration. ISO 19138:2006, Geographic information – Data quality measures
Table 2.2: ISO standards used.
2.3.1 The quality Management Standards (organizational) Quality is defined as the totality of characteristics of a product that bear on its ability to satisfy stated and implied needs [ISO 8402, 1994]. In ISO 9000:2000 standard (2000) the definition of quality is: “Ability of a set of inherent characteristics of a product, system or process to fulfill requirements of customers and other interested parties.” This indicates that data quality and quality management are very closely related [Antti Jakobsson 2002]. Data quality is considered as major part of the organization’s total quality management. ISO 9000 standards distinguish between requirements for quality management systems and requirements for products. Requirements for quality management systems are specified in ISO 9001, to be generic and appli-cable to organizations in any industry, where requirements for products can be specified by clients or by organizations in anticipation of client needs or by the regulation in the contained processes such as technical specifications, product standards, contractual agreements and regulatory requirements. Quality management is a repetitive cycle of measuring quality, updating processes until the desired quality is achieved. Implementing quality management is to ensure that the project will satisfy the needs of the beneficiaries and to deliver the project outputs at their expectations, and conform to the project design and specifications. Quality control within quality management involves operational techniques and activities aimed at monitor-ing a process focusing on fulfilling requirements. The goal of quality control is to improve quality, and in-volves monitoring the project outputs to determine if they meet the quality standards or definitions based on the project client’s expectations. Quality control also includes how the project performs in its efforts to man-age scope, budget and schedule acceptance, rework and adjustments of the project outputs. The qualification of the production line procedures and set up for documenting an international event such as boundary determination should have a measure of recognition of standard good practice. Certification as ISO is considered a well-known measure. An organization should apply for a certification showing that its qual-ity management system meets the requirements of the ISO 9000 family, thus providing the confidence to the client in that particular organization. Since ISO has some basic requirements or criteria which must be ful-filled, it becomes a tool for measuring achievement which is rewarded by Certification. Quality generally and certification for quality in particular includes establishment of the quality policy and quality objectives, quality planning, quality control, quality assurance and quality improvement .These items
20
according to ISO 9000 family should be considered in any organization dealing with a production process and their mission as follows:
Quality policy: This requirement has to ensure that Top Management establishes its policy for qual-ity and give particular attention to make a commitment for meeting the requirements and to continual improvement by providing a framework for establishing and reviewing quality objectives.
Quality objectives are established at relevant functions and levels within the organization, which should be measurable and consistent with the quality, including the commitment to continual im-provement.
Quality planning is focused on setting quality objectives and specifying necessary operational proc-esses and related resources to fulfill the quality objectives
Quality control is focused on checking quality requirements deviations. Quality assurance is focused on providing confidence that quality requirements will be fulfilled (cer-
tification). Quality improvement is focused on increasing the ability of organizations to fulfill the quality re-
quirements evolved from the need to control the quality of production to produce products meeting the ISO standards and required specifications.
Recent developments in the ISO standards series have moved towards process management control. An im-portant mindset of quality management process is the so-called PDCA-cycle. This cycle including the four components (Plan, Do, Check and Act (PDCA), was adopted by [W. Edward Deming 1982]. The model provides in general a framework for the improvement of a process or system and is an iterative four-step quality strategy. These steps are commonly abbreviated as PDCA.
Plan: Establish objectives and processes required to deliver the desired results. Do: Implement the process developed. Check: Monitor and evaluate the implemented process by testing the results against the predeter-
mined objectives Act: Apply actions necessary for improvement if the results require changes.
The PDCA is an effective method for monitoring quality, because it analyzes existing conditions and meth-ods used for providing the product or service to beneficiaries. The goal is to ensure that excellence is inher-ent in every component of the process. The process also helps determine whether the steps used to provide the product or service is appropriate for the time and conditions. In addition, if the PDCA cycle is repeated throughout the lifetime of the project, it will help to continuously improve internal efficiency. Quality is not something that is done at the end of a phase or at the end of the project, it is a continuous proc-ess to ensure quality is performed in all aspects of the project. The goal is to a continuous improvement based on the lessons learned and new insights provided by the project. To be effective it should happen dur-ing all activities of the project. To implement continuous improvements, it is necessary to have a culture of reflection allowing the project team to learn from mistakes, and to apply the lesson on the next phase or cycle. Otherwise, the team will fear reporting any problems with quality, and it will be too late to do anything once the beneficiaries find out [pm4dev, 2008].
2.3.2 Quality Related Cost The cost of quality is the sum of costs a project will spend to prevent poor quality and any other costs in-curred as a result from outputs of poor quality. Poor quality is the waste, errors, or failure to meet stake-holder needs and project requirements. The cost of quality can be considered in two ways:
1. The cost of conformance, which is the cost of meeting the requirements in the most economical way. 2. The cost of non-conformance, which is the cost, incurred when there is variability in performance.
This type of cost can be divided into two categories: Visible costs such as rework, legal cost on disputed work, interest on withheld invoices and profes-
sional claims. Hidden costs, these are costs which cannot be readily identified or measured and they are often sig-
nificantly higher than visible costs. Examples are low success rate in proposal application, poor per-ception in the market place and low repeat business [Crellin and Sipple, 1991].
The two ways mentioned above were more elaborated in (ISO 9000-2000), and divided into operating qual-ity costs and, external assurance quality costs.The operating costs cover:
21
The preventing cost which is the effort to prevent failure, and appraised cost of testing, inspection, and examination to assess whether specified quality requirements are being maintained.
Failure costs include internal failure, which costs are resulting from a product service failing to meet quality requirements prior to delivery. External failure cost resulting from a product or services fail-ing to meet the quality requirements (assurance) after delivery (e.g., liability costs, product warran-ties, allowances, and act).
2.3.3 The ISO 19100 family of standards (technical specifications) This family was set up to define, describe and manage geographic information. The focus of these standards is to define the basic semantics and the structure of geographic information for data management and data interchange purposes, and to define geographic information service components and their behavior for data processing purposes. Standardization efforts also facilitate interoperability of geographic information sys-tems including interoperability in distributed computing environments. Interoperability is the ability of a system or system components to provide information sharing and inter-application co-operative process con-trol [ISO/TC211].
2.3.3.1 Quality Principles The quality principles of a dataset shall describe how well the actual dataset represents the situation in the real world. It is required to build a model. The model is driven by user requirements, and is formulated as a product specification. The product specification gives the reference of the content and the structure of the dataset, which is called the universe of discourse. The actual data has to get as close as possible to this uni-verse of discourse. Any difference can be considered as error [Gerhard JOOS 2006]. ISO 19113 provides the principles for describing the quality of geographic data and specifies components for reporting quality information. They are categorized into different elements and sub elements. This classifica-tion scheme is the most important content of this international standard. Elements and sub elements in data quality aspects in ISO 19113 are: Data quality elements: Completeness: presence and absence of features, their attributes and relationships; Logical consistency: degree of adherence to logical rules of data structure, attribution and relationships. (data structure can be conceptual, logical or physical); Positional accuracy: accuracy of the position of features; Temporal accuracy: accuracy of the temporal attributes and temporal relationships of features; Thematic accuracy: accuracy of quantitative attributes and the correctness of nonquantitative attributes and of the classifications of features and their relationships; Data quality sub elements: Completeness:
Commission – excess data present in a dataset Omission – data absent from a dataset
Logical consistency: Conceptual consistency – adherence to rules of the conceptual schema Domain consistency – adherence of values to the value domains Format consistency – degree to which data is stored in accordance with the physical structure
of the dataset Topological consistency – correctness of the explicitly encoded topological characteristics of
a dataset Positional accuracy:
Absolute or external accuracy – closeness of reported coordinate values to values accepted as or being true
Relative or internal accuracy – closeness of the relative positions of features in a dataset to their respective relative positions accepted as or being true
Gridded data position accuracy – closeness of gridded data position values to values ac-cepted as or being true.
Temporal accuracy:
22
Accuracy of a time measurement – correctness of the temporal references of an item (report-ing of error in time measurement),
Temporal consistency – correctness of ordered events or sequences, if reported, Temporal validity – validity of data with respect to time,
Thematic accuracy: Data quality elements are recognized as quantitative component of quality information which allows for the measurements of how well a dataset meets the criteria set in its specification, where non-quantitative deals with the data quality overview, element purpose and usages .
Classification correctness – comparison of the classes assigned to features or their attributes to a universe of discourse (e.g. ground truth or reference dataset),
Non-quantitative attribute correctness – correctness of non-quantitative attributes, Quantitative attribute accuracy – accuracy of quantitative attributes.
2.3.3.2 Quality Evaluation Procedures The process for evaluating data quality is a sequence of steps to produce and report on data quality results. A quality evaluation process consists of the application of quality evaluation procedures to specific dataset related operations performed by the dataset producer and the dataset user. Processes for evaluating data quality are applicable to static datasets and to dynamic datasets. Dynamic datasets are datasets, which receive updates so frequently that for all practical purposes they are continuously updated. The process flow for evaluating and reporting data quality has been illustrated in Figure 2.3.
Figure 2.3 : Quality Evaluation Process from (ISO 19114).
23
Methodology for quality evaluation:
An evaluation methodology is required for determination of quality parameter values.
Quality evaluation methods are classified according to ISO 19114 into indirect, internal direct and external direct summarized as:
An indirect evaluation method is based on external knowledge that may include but is not limited to, data quality overview elements and other quality reports on the dataset or data used to produce the dataset.
The internal direct evaluation method uses only data from the dataset itself (e.g. consistency checks).
The external direct evaluation method uses external reference data (e.g. positional accuracy test requires reference data sets or new survey).
For determination of quality parameter values, it is recommended to choose the indirect or the internal direct method as far as possible thus avoiding big efforts. If it is unavoidable to use the external direct method, it is recommended to carry out a sampling procedure with a statistically reliable sampling size.
Techniques for direct evaluation are full inspection or sampling as that inspection may form a necessary part for the client and producer confomity with specification and standards in critical activities in production line (as aerial triangulation). The standard suggests using general sampling standards such as ISO 2859 and ISO 3951. The informative annex of the standard provides information on how to select an appropriate sampling strategy. The standard specifies the fields to be filled in when reporting on assessment as a quality evaluation report (Annex I in the ISO 19114 standards). Such a report should include, but is not be limited to the fol-lowing:
Identification of reporting document ; Measure used (formula, resulting values, result unit, reliability, reliability unit) ; Confidence in conformance test (confidence value, confidence unit, documents explaining the
method) ; Type of quality evaluation method used (direct external etc., inspection strategy applied) ; Description of quality method used (basic assumptions, processing algorithms,definition of parame-
ters, parameter values for the specific test, parameter units ; Possible aggregation of results (unit for aggregated values, resulting values, statistics used for aggre-
gation, computation date, pointer to aggregation report); Other descriptions as deemed necessary.
2.3.3.3 Meta Data
Metadata is structured information that describes, explains, locates, or retrieves, uses, or manages an infor-mation resource. Metadata is often called data about data or information about information. There are three main types of metadata:
Descriptive metadata describes a resource for purposes such as discovery and identification. It can include elements such as title, abstract, creator, and keywords.
Structural metadata indicates how compound objects are put together, for example, geospatial data are ordered to form a map.
Administrative metadata provides information to help manage a resource, such as when and how it was created, file type and other technical information, and who can access it. [NISO, 2004].
The minimum set of metadata is required to serve the full range of metadata applications (data discovery, determining data fitness for use, data access, data transfer, and use of digital data), and to allow for a more extensive standard description of geographic data, if required to fit specialized needs.
The ISO defines general-purpose of metadata for digital geographic data and provides a structure for de-scribing all metadata given in the ISO 19100 standards.
Achieving acceptable metadata quality was outlined in the Metadata Guideline for Geospatial Datasets in the UK standards Part 3 Metadata Quality as follows :-
specify or describe the components of the quality that is required; set quality levels that are achievable and maintainable by the metadata creator whilst meeting the
perceived needs of the users of the metadata service;
24
develop working practices, which will support the achievement, maintenance and, ultimately, the improvement of quality levels;
measure the quality that has actually been achieved; control and manage metadata that does not meet the required quality levels.
The intention in the management of metadata for geographic data is the ability to access the metadata and the related spatial data it describes. This requires software implementations using common encoding methods that can be found in [ISO 19118] to achieve operational use of the metadata for geographic data and the ex-change of metadata. In this regard, metadata is data about the contents, quality, condition and other charac-teristics of the data. It describes the lineage, process and accuracy of the data set in general, and it covers how the other quality standards links and used within the data set, see section 4.1. Obviously documentation in boundary determination is a key issue, so using common guideline is important, therefore according to International Standard ISO 19115 Metadata defines the scheme required for describ-ing geographic information and services. It provides information on the identification, the extent, the quality, the spatial and temporal schema, spatial reference, and distribution of digital geographic data. Furthermore, it defines mandatory and conditional metadata sections, metadata entities, and metadata elements.
2.3.3.4 Data Product Specification A data product specification (ISO 19131) is a precise technical description which characterizes a geospatial data product. It includes general information for data identification as well as information for data content and structure, reference system, data quality aspects, data capture, maintenance, delivery and metadata. Product specifications also are reference documents that state what kinds of geographical phenomena are intended to be covered by the dataset, and how these phenomena are represented (input e.g. legend informa-tion). It requires covering the data quality elements and sub-elements defined in ISO 19113. There are major sections of a product specification like:
Overview of the product (informal description of the product, extent, purpose, data sources and pro-duction and maintenance processes ...)
Specification scopes (explaining to what spatial or hierarchical or functional subpart of a more gen-eral product the present specifications apply)
Data product identification (name of product, abstract, category, geographic description, purpose, type of spatial representation, scale or resolution ...)
Data content and structure (application schema and feature catalogue for vector data, description of how “coverage” works for raster, image, and terrain models etc.)
Reference systems (temporal and spatial – e.g. a coordinate reference system or a system using geo-graphic identifiers)
Data Quality (what is assessed: in conformance with ISO 19113; how it is assessed and what the re-sults are: in conformance with ISO 19114)
Data capture (indication of sources, quality controls...) Data maintenance (indication of how data are maintained, frequency of integration of changes and
additions...) Portrayal (indication on how the data are best visually displayed...) Data product delivery (delivery format, delivery medium), Additional information Metadata (the core metadata elements of ISO19115).
Using standardized specifications are, therefore, a necessary step of the data harmonization process, and to look at the user requirements, to ensure that the resulting schema captures the concepts appropriately, and the required information can be provided by an acceptable way.
2.3.3.5 Data Quality Measures The ISO 19138 (data quality measures) is the technical specification which defines a set of measures for the data quality sub-elements identified in ISO 19113 Geographic information - Quality principles. A registry of data quality measures will be established, to include for each measure, a name, possibly alternative names, the referring data quality sub element, an identifier, a definition and a description, and if required parameters. The measures will be applicable when evaluating the quality of geographic datasets and assessing their fit-ness for their intended purpose. Multiple measures will be defined for each data quality sub-element, and the choice of which to use will depend on the type of the data and its intended purpose [ISO/TC 211].
25
The idea of ISO 19138 is to build a register standardized quality measures. Providing measures which does not limit users from defining their own quality measures and should include but not be limited to the follow-ing:-
Data quality basic measure (Name of data quality basic measure, technical specification lists a set of data quality basic measures that can be used). Users can define their own data quality basic meas-ure. It is typically based on counting of erroneous items, dealing with uncertainty or general statisti-cal measures.
Description (Description of the data quality measure including method of calculation with all for-mulae and/or illustrations needed to establish the result of applying the measure);
Parameter (Auxiliary variables used by the data quality measure including name, definition and de-scription). There can be one or many parameters.
Data quality value type (Value type for reporting a data quality result). Examples include Boolean, real, integer, ratio, percentage or measure(s) (values+ units);
Data quality value structure (Structure for reporting a complex data quality result, Set, Sequence, Table, Matrix, Coverage);
Source reference (Citation of the source of the data quality measure. If an external source exists); Identifier (Integer number, uniquely identifying a data quality measure).
The objective of the abstracted technical specification as presented in section 2.3.3.4 is to guide: the producer in choosing the right data quality measures for data quality reporting, and the user in the evaluation of the usefulness of a dataset
by standardizing the components and structures of data quality measures and by defining commonly used data quality measures. As such, it defines a set of data quality measures that can be used when reporting data quality. To conclude, the multiple use of the boundary product outputs made it necessary to use the ISO standards in connection to the boundary determination model. This work reflects the importance of having common in-ternationally known standards to be added to the practice of future boundary determination; this is will be discussed in chapter 4. Chapter 3 next indicates a practice of international boundary determination with the available known specifications and standards.
26
27
3 International Boundary Determination between Kingdom of Saudi Arabia and Republic of Yemen
3.1 Background On June, 12th, 2000, the Kingdom of Saudi Arabia and Republic of Yemen, signed the International Bound-ary Treaty that was the culmination of negotiations which began in the 1930s. The preparation of the interna-tional treaty from the engineering point of view went through some technical input information processes such as maps, reports, satellite images, office and field reconnaissance. At the negotiation of the treaty it was agreed to start with a common line map at scale of 1:1,000,000 which was prepared using satellite images (LANDSAT) for the desert and open area in the Empty Quarter. For inhabited and mountainous areas French SPOT images and Russian satellite images (KVR 1000, TDK 350) were used. The delimitation line was defined through political negotiations. This line acted as a guide line to the field team to enable them to proceed in the general direction and aid to define the boundary during the field re-connaissance of the land boundary aiming to identify the locations for all boundary markers for constructions during the demarcation stage of the treaty. The satellite images were used also for production of "fly through” for selected areas within the boundary. They proved as very useful during negotiation to support the formulations in the writing of the treaty. The annotated satellite images were also used in the writing of some clauses on the treaty for the modification of the boundary line when it passes through villages. More than fifty villages were affected by the boundary line and problems were solved during the demarcation stage. The process of boundary determination (demarcation and delineation) between Kingdom of Saudi Arabia and the Republic of Yemen started by establishing a Joint Technical Committee (JTC) which includes tech-nical experts mainly in surveying, monumentation, and mapping. They are responsible for executing the treaty in its framework and setup the technical specifications. The Saudi-Yemeni international boundary treaty extended in geodetic lines connecting boundary points (main boundary points), identified by coordi-nates in the World Geodetic System 1984 (WGS 84) with a total length of the land boundary of 1326.6 KM and 667 boundary markers. The maritime boundary extends from the land terminus into the Red Sea along latitude and geodetic lines connecting two further points defined by the coordinates, from the last point the line continues parallel to the latitude until the end of the boundary between the two countries. The final products of the demarcation and delineation were printed line maps with orthophoto background see table 3.1. A corridor is shown in figure 3.1, which according to the technical specifications had to be mapped by photogrammetric services. For the non-photogrammetric mapping scales satellite images were used as background showing topography and height features in the areas of non-photogrammetric mapping (outside the corridor), see figure 3.2.
Figure 3.1: The indicated corridor of Saudi Yemeni boundary project
As the most suitable satellite sensor for providing images for the production and background of the medium to small scale boundary maps ranging from 1:200,000 to 1:1000, 000, the LANDSAT 7 Enhanced Thematic Mapper Plus [ETM+] was chosen. The raw image data were available in digital format. The band suitable for image mapping of the small scale boundary maps was the panchromatic band, providing good detail defi-nition at 15m ground sampling distance. The following criteria were considered for the selection of satellite scenes:
full coverage of the area to be mapped
same season for acquired images
cloud-free coverage
recent coverage
acquisition of each image data set at similar sun elevation angles.
As a result, 36 Landsat 7 ETM+ panchromatic scenes were chosen. The maps for the chosen area were pro-duced according to the technical specifications in the treaty.
Quite a number of factors affect the considerations to use the satellite imagery in the large scale boundary mapping such as the size of the area, its topography and environment, the technical characteristics of the final product and its accuracy limitations, the availability of image data on time, and last not least the cost of the data required.
29
These products were required as attachment to the treaty. In addition to the printed paper maps, digital data sets were prepared to be used in Geographical Information Systems (GIS) for the future use of the boundary administration. This chapter will highlight the concepts which were used in the production process of the demarcation and delineation of Saudi Yemeni International boundary treaty and the procedures used in the execution of the boundary determination project.
3.2 The objectives and Outline of Scope of Work The objectives of the project were stated in the governing treaty as follows: The purpose of the Boundary Demarcation Project was to survey, demarcate, and prepare detailed maps of the Boundary between the Kingdom of Saudi Arabia and the Republic of Yemen in accordance with the In-ternational Boundary Treaty signed by the two Countries on 12/06/2000G. This Treaty stipulates
the determination of positions of Boundary Markers pursuant to the geographic coordinates provided in Annex No. (1), and Annex No. (2), of the treaty,
the establishment of permanent monuments in these positions, the preparation of detailed maps of the Land Boundary and the Maritime Boundary at different
scales, these maps - after having been signed by representatives of the Kingdom of Saudi Arabia and of the Republic of Yemen - being recognized as official maps documenting the Boundary between the two Countries and becoming an integral part of this Treaty, and the preparation of other neces-sary documentation.
In general terms the Scope of Work had been done by itemising the consequential works for Boundary de-marcation and documentation, and breaking these down into stages, results in a project implementation plan as listed in Tabel 3.2.
3.3 Demarcating the Boundary (Field Works) The planning and preparation for the field works of the boundary project had been carried out, including the following:
Reconnaissance of all mapping and locations of Boundary Markers and Witness Marks. Analysis of the Technical Specifications. Collation of concepts and technical procedures. Personnel, software, and hardware training. Equipment preparation and dispatch.
Although all equipment was new prior to use on the project, all survey equipment used (both GPS and con-ventional) on the project was tested and calibrated prior to being dispatched to and then used in the project area. As well as the laboratory calibration tests carried out by the equipment manufacturer (essentially a component test) prior to delivery of equipment, further tests and calibrations included the following:
Absolute GPS Antenna Type Calibration. This was an absolute calibration to test and derive the phase centre variation (PCV) for the antenna type and was carried out by the company Geo++ using a robotic system. The International GNSS Service Central Bureau (IGSCB) has accredited Geo++ as a recognised, independent laboratory to carry out calibrations of this type.
Electronic Total Station (ETS) Calibration. This included the testing and derivation of horizontal and vertical collimation, as well as the testing and calibration of the Electronic Distance Measurement (EDM). Testing and calibration of the EDM included frequency modulation tests as well as distance observations on a calibration bay (known baseline) in accordance with industry guidelines.
Further equipment checks were also carried out in the project area after delivery, and thereafter on a monthly basis. These included the following:
30
Table 3.2: The consequential works for Boundary project demarcation and documentation.
GPS Zero Baseline Test. This test was carried out to test the precision of receiver measurements, h b i i li t ‘ b li ’ d t ’ t t d t 2 i GPS
Purpose
Delimitation Demarcation Documentation
Treaty Contract Contract / Bill of Quantity Instrument
Scope of Work
Field Works
Logistics and Set-ups Surveying Construction Boundary Markers
Aerial Surveying Aerial Triangulation Photogrammetric Plotting Orthophoto Production Field Data Collection Field Verification [FV] Names Collection [NC] Digital Cartography Map Compilation from aerial photography from exist. maps+charts Map Composition Map Review and Approval Printing of Maps
Surveying Mission Documen-tations AT Reports FV-plots FV-plots / digital data Overlays / Reset lists Overlays / NC forms Proof Plots Photogr. reproduction mate-rials Map Margin / Compilation Diagram Proof Prints Overlays / Remark lists Final Prints
Reporting continuous
technical
Monthly Progress Reports Survey Report Construction Report Final Technical Report
31
3.3.1 Logistics and Set-ups The processes in demarcating the Boundary necessitates the establishment of a logistics chain to enable a framework for realization of works, e.g. site selection, allowing for relocation as the surveying and construc-tion progresses along the line. The selection of staff, materials, construction tools, equipment and working procedures must take into ac-count the extreme environmental conditions under which these resources are to be deployed Table 3.3 sum-marized factors critical to the execution of field work and its impact. The formation of logistics and set-ups for execution of all field works refer but are not limited to:
1. Access roads for mobilization and demobilization, possible camp locations and feasible camp moves, existing water source and local services and supplies.
2. Driving conditions on site and providing for suitable vehicles and transportation/cargo routes and need for helicopter transport on site.
3. Possible environmental stresses on staff and equipment. 4. Providing for catering services and supply of appropriate foodstuff and measures for maintaining
health, safety, and security on site. 5. Designing an infrastructure adequate for execution of field works where environment is a major is-
sue, generally seasons could be clearly distinguished in all Boundary Sections (Sandy Area, Moun-tainous Area), separated by very short transitional periods. The extremes always constituted factors critical to the execution of field works, as listed in Table 3.3.
3.3.2 Scouting The initial scope of scouting is the investigation of the technical requirements in the specification and its implementations to meet the accuracy required, and to identify situations where either the boundary marks fall within, or the boundary traverses through inhabited dwellings or villages. This was extended to situations where difficult terrain either prevents from vehicle access or from the intended long-lasting monumentation. Consequently, a scouting team was drawn up, entitled to make definitive decisions in the field on the suit-ability of Boundary Marker placement, and on placement of required survey points. It was also responsible for planning site preparation work prior to the arrival of survey and construction crews. The scouting team comprised of the following specialized personnel:
An experienced surveyor, maintaining consistency in the decision determination process A survey assistant, later acting as a survey foreman to support in site preparation Technical Fieldwork Team [TFT] representatives from both Countries joining in the site visits to fa-
cilitate a quick decision determination process A civil engineer, experienced in excavation and access preparation, for planning of access tracks and
construction of platforms; he is also to give advice on monument construction and stability issues. At the completion of a scouting mission a report on each issue was prepared which included a brief descrip-tion of the situation, and an update of the technical specifications, and an estimate of the cost.
equipment overheating of engine-driven equipment surveying instruments out of temperature range
reduced performance andshorter maintenance intervals postponing of surveying op-erations
working materials fast drying and curing of concrete reduced progress in monu-mentation
sand storms and blowing sand
personnel limited visibility and freedom of move-ment
reduced performance
equipment increased wear and vulnerability to rust on all mechanics and moving parts
shorter maintenance intervals
Mountainous Area
occasional frost in winter time
personnel limited physical well-being danger of injuring on slippery ground
reduced performance
equipment limited freedom of movement for vehicle-mounted equipment on slippery ground and on all unpaved traffic lines
work progress on selective sites only
working materials insufficient curing properties of concrete postponing of monument concreting
rain and/or high winds
personnel limited freedom of movement and high crash risk on site
work progress on selective sites only
equipment unfavourable helicopter flying and naviga-tion conditions very high risk of rotor and body contact with ground in hovering-mode at steep slopes (loading/unloading)
work progress on selective sites only
working materials difficult handling of working materials, that is slippery when wet and uncontrolla-ble movement of all hanging loads at high winds
reduced performance
Table 3.3: Critical environmental factors and their effects on the progress of works
33
3.3.3 Surveying The initial stage and overall technical basis for demarcating the International Boundary was constituted by surveying. In order to fulfill the requirements outlined in the Technical Specifications and in the supplemen-tary work concept for the Demarcation of the International Boundary, the survey works had to be carried out in phases:
Establishment of GPS Control Networks Establishment of Network Densification Point [NDP] Survey of boundary markers Geodetic Links to the country’s geodetics networks Photo Control Point Survey
The resulting networks, in their entirety, were to make up the Boundary Geodetic Network, geodetically embed in the International Boundary, and connecting it to the international system. The survey activities and phases, in their entirety, aimed at determining the exact position of the Boundary Points in accordance with the International Boundary Treaty, and providing survey assistance to all phases of construction operations, providing quality assurance to the criteria that the Boundary Points were constructed at the exact positions specified in the Technical Specifications, and also was aimed to provide survey assis-tance in execution of aerial surveying missions for the mapping of the boundary area. The accuracy of position of boundary markers was to be surveyed in (WGS 84) by observing the Main boundary Points(MBP) at the geographical coordinates provided in the International Boundary Treaty [Ap-pendices No. 1 and 2] at an accuracy averaging ± ( 0.5cm + 1ppm). The position of the Subsidiary Boundary Points (SBP) and Boundary Markers was to be observed to an accu-racy of ± (0.5cm + 2ppm) along the boundary. Observing the position of each boundary point/marker was in reference to a datum point, the position of which shall be determined by agreement, and on which was affixed a continuous observation receiver. The datum point was to be determined at absolute accuracy not exceeding ± 1) meter according to (WGS 84). The technical criteria for the project have been abstracted from the Technical Specifications and the Concept (the procedures for execution of the updated Technical Specification) for the Demarcation of the Interna-tional Boundary between the Republic of Yemen and the Kingdom of Saudi Arabia. A comprehensive calculation and assessment of the allowable and achieved accuracy for each type of point was conducted in order to ascertain whether the Project Aim outlined above had been met. This consisted of applying the accuracy criteria outlined in Table 3.4, whereby if the accuracy criteria was not stated in the Technical Specifications then the work concept criteria was applied. As a target for the different phases of survey works the following technical criteria had been abstracted from the Technical Specifications and the Work Concepts.
3.3.3.1 Establishment of GPS Control Networks (Base Survey)
In order to establish a precise GPS control network as a geodetic base for the demarcation, monumentation and mapping of the Boundary, the International Terrestrial Reference System [ITRS] was chosen to fix the geodetic datum of the selected base survey markers along the vicinity of the boundary. Although coordinates may be expressed in a common WGS84-related system, as the coordinates can change substantially over time (due to movement of the tectonic plates in relation to one another), the WGS84 definition is conse-quently referenced to the International Terrestrial Reference Frame [ITRF], constituting the realization of the ITRS. With regard to initializing the Boundary Demarcation the latest release of the ITRF should be applied. As the WGS84 ellipsoid is a geocentric spheroid, it is consequently referenced to the ITRF, representing the realization of the International Terrestrial Reference System [ITRS] whose origin is at the centre of mass of the earth. Through a network of permanent worldwide GPS tracking stations (IGS stations), the International Earth Rotation Service [IERS] is in charge of producing ITRF station coordinates/velocities and earth rota-tion parameters in cooperation with the International Global Navigation Satellite System Service [IGS]. When conducting GPS surveys within the boundary area an overall framework of geodetic survey control stations should be linked to a common geodetic datum. The location of the Datum Point(DP) had to be se-lected by agreement between the two Countries, and monumented approximately half way with in the boundary land area for practicality in the future survey and its logistics supports, the accuracy normally is better than -/ + 1 m in WGS 84 coordinates system.
34
Table 3.4: Technical criteria for survey works
With regard to the Datum Point, for the Demarcation of the International Boundary between the Kingdom of Saudi Arabia and the Republic of Yemen the Technical Specifications state the following requirement:
“Observing the position of each Boundary Marker shall be in reference to a Datum Point. The Datum Point should be determined at absolute accuracy not exceeding ± 1 meter according to (W.G.S. 84)”. To meet this requirement, the survey at the Datum Point and at up to 8 points are constituting the control network at al-ready pre-fixed locations of boundary markers and Temporary GPS stations in the vicinity of the Boundary was carried out simultaneously, while at least the Datum Point and two additional locations at both ends of the Boundary (one of them being the existing and common Boundary Marker of the boundary between the Kingdom of Saudi Arabia and the Republic of Yemen, and the Republic of Yemen and the Sultanate of Oman) shall be observed for a minimum period of 3 x 24 hours and called the Base survey network. The remaining Base Survey stations can be observed at the same time, tying them in several 24-hour GPS ses-sions to the above mentioned network with equivalent accuracy. The position of one Datum Point was occu-pied over a period of 3 x 24hours, continuously observed by means of GPS methods, and computed relative
Technical Specifications Work Concept
Category of Point Accuracy [plan] relative to Accuracy
[plan] Accuracy [height] relative to
Datum Point ± 1.0m IGS/ITRF ± 1.0m N/A IGS/ITRF
Base Survey Point ± (1ppm) Datum Point N/A N/A Datum Point
Network Densifica-tion Point
± (1ppm) N/A ± (0.005m+1ppm) ± (0.008m+2ppm)
Base Survey Point (BSM)
Main Boundary Markers [MBM]
± (0.005m+1ppm) Datum Point ± (0.005m+1ppm) ± (0.008m+2ppm)
ceed 70km. In case of good ionosphere conditions this limit was judged for achieving the relative accuracy of Boundary Markers as stated in the Technical Specifications. For maintaining the survey accuracy and progress of survey works, as well as for minimizing the time period that the construction crew had to wait for the survey crew to finish, the NDP Network was densified with Secondary Densification Points [SDP]. These SDPs were located in a way as to maintain the geometrical integrity of the network in accordance with good survey practice. Furthermore, selection of point locations was done such that obscurity was minimal. The NDPs were located 20km - 30km from each other close to the intended alignment of the Boundary and chosen to enable ease of access, marking, and surveying. The location of these points was only to be within 5km of the planned position, allowing for variations due to terrain constraints or logistics. The NDP and SDP Survey was carried out by static GPS methods and determined in separate GPS sessions. According to the technical requirements the accuracy standard required that for these points at least two GPS stations of the already existing Base Network had to be observed together with each new NDP. The period for a GPS session to tie one or more NDPs into the existing network not had to be less than 6 hours of simultaneous observation of at least four satellites. The NDP and SDP Survey provided the project with the following:
NDPs between BSMs (sub-networks) along the boundary (project area). These NDPs provided a framework of control stations from which Temporary GPS Stations (TGPS Points) were observed as the final control station from which the Boundary Points were set out and surveyed.
Where the densification of NDPs was insufficient, further control stations were observed relative to the NDPs and to the same observation criteria as the NDP Surveys and called Secondary Densifica-tion Points (SDPs).
The largest standard deviation during the NDP and SDP Survey was ± 0.004m in plane, which was well within the allowable accuracy criteria of ± 0.018m. As the accuracy criteria were related to the parts per mil-lion formula, the accuracy was wholly dependent upon the distance from the NDP/ SDP to the next BSM and is reflected in the accuracy results. These NDPs and SDPs provided a densified framework of Control Stations from which the Temporary GPS (TGPS) points could be observed as sub-networks at the phase of boundary marker survey and constructions. The achieved accuracy was calculated by applying the standard errors at each NDP/SDP (relative to the Base Survey Network) and the distance of the NDP/SDP to the nearest control station from the Base Network, to the allowable positional accuracy criteria of ± (0.005m + 1ppm). A summary of the accuracies attained dur-ing the NDP and SDP Surveys can be seen in Table 3.4
3.3.3.3 GPS Processing of boundary Network The Network Densification GPS observations were processed using a recording interval of 15-seconds and a cut off angle of 15-degrees. As per the Base Survey, in order to improve the results for long baseline obser-vations, the precise ephemeris (or orbits) published by the International GNSS Service (IGS) and downloaded via the Internet, were also used within the processing. For the estimation of the tropospheric effects upon the GPS observations; the Saastamoinen model (a soft-ware by Jet Propulsion Laboratory, Pasadena, California) was used which attempts to model and quantify those effects inherent within the troposphere, see section 7.4 in ,Satellite Geoesy [Seeber, 2003]. This model was used for computations during the Base Survey and flow survey activities. As was tested during the initial phase of the boundary survey, the Lc-fixed (ambiguity-fixed) baseline solu-tions from GeoGenius®2000 (satellite data processing software that enables users to process both GPS and GLONASS data and supports static, short time static, kinematic, and psuedostatic satellite positioning meth-ods) were preferred for the adjustment of the NDPs and indeed for baselines under 15km the ambiguity-fixed baseline solution should be obtained during static GPS surveys, however for longer baselines during static GPS surveys, the Lc-float solution was in some cases the best solution obtainable. As the chances of success-ful ambiguity resolution are essentially a function of baseline length, the number of satellites tracked and the length of the observation session, if there were doubts concerning the quality of the Lc-fixed solution (or the Lc-fixed solution was not obtained) the Lc-float solution was accepted in its place. For more details about these see GPS Satellite Surveying by [Leick, A. 2004]. As GPS survey networks are normally designed in such a way that more observations than are geometrically necessary are observed, the resultant redundant observations form the basis of a network adjustment and can be used to improve the results as well as for investigating the reliability of the observations or baseline vec-tors.
36
The observations from each single GPS network were adjusted using the GeoGenius®2000 software suite which uses the method of least squares adjustment and were performed using a confidence level set at 2 sigma which corresponds to a probability of 95% and a significance level of 5%.
At the end of the adjustment process, a statistical Tau Test was calculated and baselines that did not fit into the minimum error definition of (±5.0mm + 0.5ppm) were marked and any baseline solutions were then dis-abled only after a thorough investigation for any bad satellite data. Some Lc-fixed solutions were disabled within the adjustment and in some cases the Lc-float solution was used in order for the adjustment to pass the Tau Test and to confirm the quality of the adjustment. The Tau Test identified all outlier observations that lay outside the chosen parameters, with the significance level being set to 1% to have a 99% probability that the results of the Tau Test were true.
In order to verify the measurement and computation of each NDP section, a minimally constrained network adjustment was performed using initially one of the control points as fixed control. The difference between the adjusted (calculated) coordinate of the second control point and the known (fiducial) coordinate showed the misclosure of the computation and thus verified the quality of the coordinates of each NDP in the section.
All GPS data processing and adjustment for the Base Survey was carried out using the Bernese GPS Soft-ware Version 4.2. This software tool is designed to process all principal observables recorded by high-accuracy geodetic GPS receivers. It is one of the seven software suites used within the IGS global GPS track-ing network to generate the official products such as satellite orbits, earth rotation parameters, satellite clock-corrections and weekly IGS coordinates for the global network stations. This software has been developed by the University of Berne, Switzerland [Rothacher et al., 2001].
3.3.3.4 The survey of Boundary Markers
Before the survey of the boundary markers scouting and reconnaissance of the proposed locations of all boundary markers was conducted. Two temporary (TGPS) Points were therefore established in the vicinity of the proposed location of each Boundary Marker and tied to two existing geodetic survey control stations of the GPS Control Network by GPS observations and the locations of points to be used as TGPS Points marked and documented to meet the accuracy requirements as stated in the Technical Specifications for the Boundary Markers the following procedural route was adhered to:
Within the vicinity of each Boundary Marker, two locations were selected and marked as TGPS Points, see figure 3.3. The location of each pair of TGPS Points was chosen such that intervisibility between these and the corresponding Boundary Marker location was guaranteed. In view of the specified accuracy requirements and propagation of errors arising from combined GPS and terrestrial observations, the TGPS Points were generally located only up to 100m - 250m apart so as to form a best-fit equilateral triangle with the corre-sponding boundary Marker. This approach ensured that any future terrestrial observations would be carried out with the highest statistical probability of achieving the required accuracies. All Boundary Markers having specified coordinates were set out by double bearing and distance through conventional (terrestrial) surveys, with the TGPS Points serving as fixed control. This method applied the set-out elements of bearing and dis-tance from one TGPS Point to the intended Boundary Marker position. The bearing and distance from the second TGPS Point not only provided a check observation but also a best-fit mean solution out of observa-tions from both TGPS Points.
3.3.3.5 Geodetic Links into the national geodetic networks of the participating countries
As part of the Boundary Demarcation Project, there is a requirement to produce coordinate values for the Boundary Markers with respect to the geodetic network systems of both countries.
This requirement is outlined in the Technical Specifications for the Demarcation of the International Bound-ary between the Kingdom of Saudi Arabia and the Republic of Yemen in which it is stated:
"The horizontal and vertical positions of Boundary Markers shall be determined according to (WGS 84). The computation of geographic and UTM coordinates and heights shall be in reference to the geodetic networks of the Kingdom of Saudi Arabia and the Republic of Yemen. Each of the two Countries shall specify three (3) geodetic points from its geodetic network for the purpose of linking the boundary network. These points shall be observed at the same accuracy as that required for the Boundary Markers".
37
SETOUT OF THE BORDER POINTS
Borderline
Control of TGPS Positions
Main Border Point, Survey Mark
Phase 3: CONSTRUCTION CONTROL AND FINAL SETOUT
Set Out Lines
Drilling Points/Pipes
Kingdom of Saudi Arabia
Republic of Yemen
Borderline
(sketch not to scale)
Temporary GPS Point (TGPS)
Figure 3.3: set out of boundary point
Deriving transformation parameters to compute a datum transformation required to use control stations in the Boundary Geodetic System as fixed control and then to carry out geodetic observations by means of GPS methods, linking these control stations to the ones in geodetic network systems of the Kingdom of Saudi Arabia and the Republic of Yemen. The transformation parameters could then be derived by computing a datum shift from one system to the other, applying the computed coordinates in the Boundary Geodetic Sys-tem and the supplied coordinates in the relevant geodetic network system of each Country. To enable derivation of these datum transformation parameters within GPS surveying, a model needed to be defined on which to base all observations and results. A reference coordinate system is therefore required for which to provide the following:
1. A reference system definition (This defines the way a coordinate system is made up, namely the ori-gin and orientation of the planes (or axes) of the system).
2. A reference frame definition (This is the practical makeup or realisation of the reference system through observations).
Boundary Geodetic System The Boundary Geodetic Network definition is as follows:
- Reference Ellipsoid: WGS84/GRS80 - Datum/Reference Frame: International Terrestrial Reference Frame [ITRF] - Datum Definition: ITRF2000 - Observation Epoch: 2001.6 (July 2001G) - Datum Reference Point: DP00
Kingdom of Saudi Arabia Geodetic System As supplied by the JTC, the Kingdom of Saudi Arabia Geodetic Network definition is as follows:
- Reference Ellipsoid: WGS84 - Datum/Reference Frame: International Terrestrial Reference Frame [ITRF] - Datum Definition: ITRF2000 - Observation Epoch: 2003.1998y
Republic of Yemen Geodetic System As supplied by the JTC, the Republic of Yemen Geodetic Network definition was as follows:
- Reference Ellipsoid: WGS84 - Datum/Reference Frame: International Terrestrial Reference Frame [ITRF] - Datum Definition: ITRF1991
38
- Observation Epoch: 1992.5 (June 1992G). The derivation of transformation values between the Boundary Geodetic System and the geodetic network system of the Kingdom of Saudi Arabia was derived by inputting a total of 6 sets of coordinates which in-cluded 3 sets from the GPS observational adjustment as well as 3 sets of identical/coincident control stations previously observed as part of the Base Network. The derivation of transformation values between the Boundary Geodetic System and the geodetic network system of the Republic of Yemen was derived by inputting a total of 6 sets of coordinates (all 6 sets from the GPS observational adjustment) in the Boundary Geodetic System and the Republic of Yemen Geodetic Sys-tem. The derivation of transformation values was computed using the datum transformation program Alltrans (Version 2.32). In summary, a total of 6 sets of coordinates were used to derive transformation parameters for the Kingdom of Saudi Arabia and a total of 6 sets of coordinates were used to derive transformation parameters for the Republic of Yemen. For the Kingdom of Saudi Arabia, the 7-parameter transformation values were used in transformation of the Boundary Marker coordinates from the Boundary Geodetic System to the Kingdom of Saudi Arabia Geodetic System. For the Republic of Yemen, the 7-parameter transformation values were used in transformation of the Boundary Marker and coordinates from the Boundary Geodetic System to the Republic of Yemen Geodetic System. These transformation parameters served to compute Boundary Marker coordinates in terms of the relevant geodetic network system of each country. Mean Sea Level heights [MSL heights] were derived us-ing the EGM96 Geoid model.
3.3.3.6 Photo Control Points In order to achieve the specified mapping accuracies required for the production of maps at various scales, a sufficient number of photo control points had to be signalized and surveyed prior to commencement of the aerial surveying missions. Ground control is generally needed for mapping projects in order to establish a geometric link between aerial photographs and a geodetic network. Photo control points are thus to be marked on the ground, surveyed and signalized before any aerial surveying mission and aerial triangulation can commence. Generally, the signals comprised of a regular three leg configuration with a circular centre piece, each of appropriate dimension and a strong contrast to the natural colors of the surrounding ground see figure 3.4. Signalization of photo control points aimed at enabling their identification and measurement in the aerial photographs during photogrammetric plotting. The coordinates of all photo control points shall be determined by means of suitable GPS methods. In response to the requirement of adapting the aerial triangu-lation to the governing mapping accuracy for the 1:10,000 boundary map scale this is to aim at photo control point accuracies in the order of ± 0,50m for the position as well as for the elevation, both with regard to the nearest Base Survey Marks and/or Network Densification Points. Photo control points for each block of aerial triangulation were established in order to ensure that the accu-racy required by the Technical Specifications for the production of maps at various scales could be met. Also, additional photo control points including signalisation were established along the Boundary at Main Boundary Marker [MBP] locations and at Subsidiary Boundary Marker [SBM] locations in accordance with the specifications, and were used also, as quality control check.
3.3.4 Constructions of Boundary Markers In demarcating the Land Boundary, permanent monuments in the form of Boundary Markers were to be es-tablished in accordance with the Technical Specifications. These are permanent concrete monuments or stainless steel pipes, the position of which fixed on the ground according to the geographic coordinates pro-vided for in the International Boundary Treaty and Appendices thereto. These markers are classified as fol-lows after setting out of coordinates of the Boundary Markers, fixing the alignment of the Boundary. Monu-mentation in stainless steel was initiated for Boundary Markers. Prior to concreting of monuments or erect-ing of Boundary Markers, stainless steel pipes securing the position of each intended Boundary Marker were installed see figure 3.5, using specially developed drilling equipment and advanced drilling techniques. The design of monuments as given by the Technical Specifications was chosen in accordance with the functional classification of Boundary Markers. As outlined below.
39
Figure 3.4: Signalized Boundary point and photo control point
Figure 3.5: Erecting of Boundary Markers
40
Main Boundary Markers [MBM] (according to the Appendices No. 1 and 2 of the International Boundary Treaty) and Subsidiary Boundary Markers [SBM] (any boundary marker established along the boundary between the Main Boundary Markers) see figure 3.6, both types had the same specifications, and had to be constructed as a 1.5m high frustum of a rectangular pyramid in reinforced concrete, resting on a reinforced concrete base level with the ground.
Figure 3.6: Boundary Markers
The corner pipe has been extended to a height of 4.5m above ground level for the installation of two stainless steel sign sheets and two direction vanes. The direction vanes are oriented towards the preceding and suc-ceeding Boundary Marker. The pair of sign sheets is oriented in geographic north-south direction. Boundary Marker (BLM) is stainless steel pipe which the JTC decides to establish permanently and exactly on the Boundary between successive SBPs or between a MBM and a SBM, see figure 3.7. In the Mountain-ous Area the placing of BLMs, if required, is to be foreseen in consideration of terrain conditions and the pre-assigned positions of MBPs. In the Sandy Area the position of a BLM shall, as far as possible, not differ by more than ± 0.5km from half the distance between successive Boundary Markers of higher category. The BLMs shall be established as stainless steel pipes, extending to 4.5m above ground level, incorporating two direction vanes and two sign sheets, the orientations adapting to the ones fixed at MBMs and SBMs. The securing extension of such a pipe into the ground and its diameter depend on the type of sub-surface material at each location to natural ground level the securing pipe is to be filled with concrete. This pipe also served as boundary line marker also, to keep intervisiblity between markers and situated along the boundary between Main and Subsidiary Boundary Points, also between two Subsidiary Boundary Points at certain distance (2.5 km). For each Boundary Marker (MBM and SBM), a GPS re-survey was carried out in order to provide a quality assurance check and to confirm the Final Set-out Survey. It comprised of occupying the Boundary Marker and its two corresponding TGPS Points for two 30-minute sessions. The results of the GPS observations were then compared to the Boundary Marker coordinates published in the Technical Specifications, Treaty Annexes’.
41
Figure 3.7: Boundary Marker
3.3.5 Quality Control Sequences in Surveying of Boundary determination Quality and accuracy control of surveying works are considered the most critical part of the boundary deter-mination. It is the supporting measures that maintain the reliability of the whole work, and ensure that the requirements of boundary products have met the technical specifications required by the boundary admini-stration. Figure 3.8 shows the quality control sequences in the surveying and data processing and its links to the elements of quality. Appendix A indicates field quality control procedures used in Saudi Yemeni bound-ary project.
42
Quality control sequences in Surveying
Figure 3.8: Quality control sequences in the surveying and data processing and its links to the elements of quality, A
refers to Figure 3.12 (photogrammetric process).
43
3.3.6 Summary of Accuracies Surveying Work The accuracy criteria are outlined in the ‘Technical Specifications’. A comprehensive calculation and as-sessment of the accuracy attained for all surveying type of points, i.e. Boundary Point-both Main Boundary Markers (MBM) and Subsidiary Markers (SBM) and Photo Control (CP) was conducted in order to ascertain whether they had been met. These accuracies as required and achieved have been analysed in order to iden-tify the largest error, all required accuracies had been met as can be seen in the following Table 3.5.
Table 3.5: Summary of Accuracy Results of all Surveying works in Saudi Yemen Boundary project.
3.4 Delineation (Map Productions Process)
3.4.1 Planning and taking aerial photography of the Boundary Corridor The aim of aerial surveying of the boundary area was to provide up-to-date aerial photography of a high geometric and radiometric standard to be used for photogrammetric stereo compilation and orthophoto map-ping, covering the Boundary Corridor. It is an instantaneous record of the boundary land as a base for unified documentation. Aerial photography at scale 1:30,000 was acquired in four separate aerial surveying missions. These were carried out in thorough consideration of climatic conditions and corresponding flying seasons, at the same time following the field teams’ progress in signalization and ground surveying of photo control points. The aerial photography comprises of the following:
Flight planning with regard to- Seasons Type of aerial sensor (digital or analogue) Enable Control information (GPS, INS) systems Progress of field works > photo control and its > maintenance Air traffic control regulations Execution of survey flights according to specifications Post processing, including- flight data- film development, materials, film clearance- film scanning-
reproductions, managing and processing data if digital aerial sensor in use. Digital Data management (allowing for good documentation). Quality control which includes the following aspects was considered: photo scale, end lap and side
lap, crab, readability of auxiliary data, appearance of fiducial marks, absence of depicted clouds or shadows, sharpness, fog, density, contrast, possible damages such as scratches(film) and striations.
Type of Point
Accuracy (Specs) (m)
Allowable Accuracy (m) Achieved Accuracy (m) Station Relative to
Plan Height Plan Height Plan Height Datum Point ±1.0 ±1.0 ±0.10 ±0.10 DP00 IGS/ITRF
3.4.2 Principles of GPS/INS in Photogrammetry for photo control Sensor systems combining GPS with inertial navigation systems [INS] was used in the boundary project as second source of photo control in case of misidentification of photo control point in the photogrammetric process, and to increase the reliability of georeferencing of aerial photography. The combined systems were capable of generating all necessary orientation parameters for highly accurate camera positioning, under certain circumstances allowing for subsequent georeferencing of aerial photographs without any ground control.
1. The GPS component is made up of geodetic GPS receivers, one onboard the aircraft and synchro-nized with the shutter of the aerial camera, the other on the ground positioned at a reference station with well known geodetic coordinates. For accurate determination of the position of the camera pro-jection centres the data of the airborne receiver are combined with data recorded on the ground ref-erence station. In an offline procedure the exact coordinates are computed by means of special soft-ware maintaining the required ambiguity solution for the GPS raw data.
2. The inertial measurement unit [IMU] as sensing component in an INS is made up of a threeaxis gyro system and of three corresponding accelerometers. It is mounted rigidly to the camera system.
Using the principle of integrating time versus acceleration the position of the aircraft/camera system is com-puted in relation to a given starting point. The gyro system is continuously measuring the camera attitude in terms of the three angles roll, pitch, and yaw. The combination of GPS (good long-term stability) and INS (very accurate over short periods of time) in an integrated system tries to join the advantages of both systems. This offers the potential for camera posi-tion/orientation accuracies and reliabilities being improved significantly as compared to the stand-alone solu-tions, constituting the base for georeferencing without ground control. GPS/INS integration is realised in a Kalman filtering approach. The approach of a Kalman Filter is that of continuous prediction and update: the estimated state vector of the GPS/INS is corrected after receiving the next measurement value – without the need for re-computing the entire navigation solution. Since the INS provides positions with much higher frequencies, possible interpo-lation errors within the GPS can be reduced. More important, the GPS observations are used as external updates to account for the systematic errors pos-sibly inherent in the INS position and attitude parameters. In practical applications the physically parallel mounting of the IMU to the image coordinate system of the camera can only be approximated since both, the defining of fiducial marks and the camera projection centre are not directly accessible. The determination of the remaining incremental angles is generally referred to as alignment. Provided the orientation angles of the camera system were known, the differences to values re-corded by the IMU would serve as correction to the orientation of all aerial photographs within a mission, thus computationally establishing the desired alignment. For initially knowing the orientation angles of the entire sensor system, a calibration flight over a an area featuring a suitable array of ground control points has to be executed prior to a planned aerial surveying mis-sion – with the area located close to the actual target area. The necessary ground control may be derived from control points as result of an existing aerial triangulation or by direct layout of a calibration field. De-termining alignment corrections within post-flight processing could thus start with the classical method of bundle block adjustment, resulting in camera orientations over the calibration field. These are then to be computed against the orientations recorded by the IMU over the calibration field. To increase the reliability of direct georeferencing of aerial photographs and to allow for datum transforma-tion from WGS84 to local geodetic networks, a limited number of photo control points were established where possible, thus limiting an aerial triangulation to calibration purposes.
3.4.3 Aerial Triangulation for Georeferencing Aerial Photography of the Boundary In the Boundary Demarcation Project between the Kingdom of Saudi Arabia and the Republic of Yemen an aerial triangulation adjustment commercially available PATB-GPS program was used. The necessary activi-ties to practically execute GPS-supported bundle block triangulation were organized into five steps, namely:
Determination of photo control points (in the field) Determination of camera positions (from airborne kinematic DGPS data) Selection and marking of tie points
45
Measurement of photo co-ordinates (marked tie points and identified photo control points) Aerial triangulation adjustment (bundle block adjustment)
The accuracy to be accomplished by aerial triangulation was stated in the Technical Specification as follows: The residuals at tie points in their adjusted position when plotted on the maps shall not exceed 0.3 mm in the horizontal position and 0.4‰ multiplied by the flying height in the vertical position. Table 4.4 gives an over-view of accuracies achievable by aerial triangulation in terms of dimensions on the ground and compares them with expected accuracies of GPS-supported bundle block triangulation. With regard to covering the boundary map series 1:10,000 up to 1:100,000, aerial triangulation had been designed to meet the accuracy requirements for the largest scale (1:10,000). According to the Technical Specifications all steps were per-formed so as to achieve aerial triangulation accuracies of customary and internationally accepted standards. However, the minimum accuracy standards for aerial triangulation in the Boundary Demarcation Project are governed by the mapping accuracies to be achieved in the compilation of maps by means of photogrammet-ric plotting. Table 3.6 lists these mapping accuracies in terms of dimensions on the ground. With regard to covering the boundary map scale range 1:10,000 up to 1:100,000 at one and the same photo scale 1:30,000, aerial triangulation must be designed to meet the accuracy requirements for the largest map scale 1:10,000.
Map Scale 1:10,000 1:25,000 1:50,000 1:100,000
Photo Scale 1:30,000 1:30,000 1:30,000 1:30,000
Aircraft flying height 4,600 m 4,600 m 4,600 m 4,600 m
Planimetric Accuracy
Technical Specifications
3.0 m 7.5 m 15.0 m 30.0 m
GPS-supported bundle block triangulation
0.5 m 0.5 m 0.5 m 0.5 m
Height Accuracy
Technical Specifications
1.8 m 1.8 m 1.8 m 1.8 m
GPS-supported bundle block triangulation
0.7 m 0.7 m 0.7 m 0.7 m
Table 3.6: Comparison of required and expected accuracy in aerial triangulation
3.4.3.1 Aerial Triangulation Process in the Boundary Project 1. Integrated approach by GPS methods:
applying airborne kinematic DGPS positioning of the camera, _ introducing photo control points at a bridging distance of eight to ten base lengths
introducing pairs of photo control points in the corners of each AT-Block, and executing GPS-supported bundle block triangulation, a highly redundant amount of control
was available that enabled to form stable block formations during the aerial triangulation ad-justment. In addition, all photo control points were determined using GPS methods. This re-sulted in sets consisting entirely of full control points.
2. Design of photo control point accuracy According to the »Work Concept Aerial Triangulation«, the overall accuracy of photo control points was designed to be in the order of ± 0.5m for the photo scale 1:30,000. As a base for aerial triangula-tion adjustment, these values provided for an accuracy potential of subsequent photogrammetric plot-ting exceeding the requirements of the Technical Specifications (refer to table 3.6 maximum compo-
46
nents of mean values of standard deviation of terrain points in the context of mapping accuracy and photogrammetric restitution accuracy). The poorest achieved accuracy in the Photo Control Point Survey for the boundary project was ±0.175m in plan at one of photo points relative to the GPS Boundary Control Network; this was substantially better than the allowable accuracy of ±0.5. 3. Design of photo control point signals The layout and dimension of photo control point signals figure 3.9 had been properly fit to the photo scale 1:30,000 for ensuring positive identification in the aerial photographs. The signalisation was carried out in accordance with guidelines specified on the Technical Specifications. In some parts of the Mountainous Area the photo control point survey and signalisation relied on using helicopters and this shape in cannot be used due some topographical location (steep areas), thus anther shape was used such as a T shape.
Figure 3.9: Shape and dimension of laid-out photo control point signals.
In case a control point could not be measured due to low contrast, the effects on aerial triangulation adjustment and on photogrammetric plotting could be compensated by the provisions stated in item (1) 4. Redundancy in tie points At the stage of aerial triangulation measurements, at least ten tie points were introduced instead of the minimum of six that are required for setting up the relative orientation of consecutive aerial pho-tographs. The double amount provided for a reliable and accurate solution, even if a tie point was re-jected after aerial triangulation adjustment for reasons of poor definition on the photographs. An ex-ample of Aerial Triangulation accuracy obtained for (Block 03) in Table 3.7 and compared with the Technical Specifications requirements for Mapping & Photogrammetric restitution.
Table 3.7: Accuracy Achieved against the requirements.
The accuracy result of an adjusted block for a given terrain depends mainly on:
Scale and overlap of the aerial photography Number and distribution of tie points Precision of the measured image co-ordinates Number and distribution of photo control points Precision of photo control points Reliability block parameters Systematic data errors which have not been accounted for
The overall accuracy of Aerial Triangulation (e.g.) Block 03 is given by the mean values of standard devia-tion of terrain points is as follows
+ 0.182 meters in X
+ 0.186 meters in Y
+ 0.360 meters in Z
+ 0.260 meters in XY
The achieved accuracy of the Aerial Triangulation of block 03 met the specification and guarantees map compilation by Photogrammetric plotting to the required mapping accuracy covering the scale rang 1:10,000 up to 1:100,000. This statement needed to be derived for using the results and starting the photo-grammetric plotting.
48
3.4.4 Photogrammetric Data Capture The application of photogrammetry for the compilation of topographic maps is based on measurements and information obtained from aerial photographs. After completion of preparation work such as photo control point surveying, aerial surveying and aerial triangulation, all basic information is available for photogram-metric plotting.
3.4.4.1 The Set-up of the Basic Data Model The basic data model [BDM] was realized by a database set up in MicroStation, describing for each map feature several properties such as its level, symbology, element type, appearance at different map scales, etc. Table 3.8 shows an extract of the corresponding data structure table, including the individual feature key option employed under MircroStation V8. With regard to map production the basic data model was primarily designed to fit the needs of the digital cartographic compilation and map composition processes. Apart from definitions for photogrammetric data capture it contained some elements necessary for quality control, cartographic compilation and generaliza-tion, pre-press processing, and other steps in the photogrammetric-cartographic workflow. The basic data model along with its representation in the form of a table thus had several objectives as shown in the follow-ing paragraphs: Photogrammetry (Basic data structure for photogrammetric restitution) During photogrammetric plotting a subset of the basic data structure was used. This ensured a continuous flow of data into the cartographic process along with the possibility to integrate a complex quality manage-ment at an early stage: already at the moment of data capturing the requirements for the cartographic process and the delivery of digital data for boundary maps could be considered. Controlling quality checking of photogrammetric data
Data captured by photogrammetric plotting are normally transferred in a semi-processed state (without car-tographic editing). Thus they had to be checked, amended, and in some cases converted. The rules for this checking process were incorporated into the data model.
Cartography (Derivation of user-interfaces for cartographic editing)
The basic data model [BDM] forms the base in generating user-interfaces for subsequent cartographic edit-ing. Software was used to control the process and generate applications to support the cartographic operators in the interactive editing of the map data. In addition, this process ensured all editing was compliant to the basic data model [BDM]. Definition of feature symbolization for each feature occurring in one or more boundary maps the basic data model is the central location for storing information on text styles and line styles, patterns, cell names, priorities, sizes for texts and line widths, rules for placing of spot height values, etc. By deriving of pentables for plot generation within the cartographic process several intermediate prod-ucts are generated in the form of hardcopies. At the initial stage this comprises of control plots of the photo-grammetric raw data, followed by the plots for field verification and collection of geographic names. Further different types of plots are needed for checking the map compilation process and for performing the map reviews in co-operation with the JTC. The essential information of how different features will appear in dif-ferent plot and/or map layouts is stored in the basic data model [BDM]. A special software has been written to read out this information and use it to generate the appropriate pentable for each type of plot.
in combination defining a map object under MicroStation V7
ext. MicroStation V8
Type LV LC WT CO FT Key TX1 TX2 S1 S2 Pat Description Fnum J Fkey
49
10 25 10 25
linear features *
4 6 0 2 4 x x x Main paved road 150 100150
4,12 8 5 1 18 x x x track 170 100170
4 21 0 1 12 x x x fence 300 100300
4 22 0 2 11 x x x wall 310 100310
area definitions *
17 60 0 0 1 1 wa 15.0 37.5 x x x wadi - (ctr.) 600 LB 100600
17 60 0 0 5 1 sa 15.0 37.5 x x x sabkah - ctr. 605 LB 100605
17 60 0 0 0 1 cu 15.0 37.5 x x x cultivated areas - ctr. 615 LB 100615
point features *
17 35 0 0 20 80 " 20.0 50 x x x water tower - sym. 690 LB 100690
17 35 0 0 6 80 9 13.0 32.5 x x x tube well - sym. 700 LB 100700
point symbols *
17 36 0 0 21 80 w 15.0 37.5 x x x bushes - sym. 810 LB 100810
17 36 0 0 2 80 b 28.0 70.0 x x x trees - symb. 830 LB 100830
Table 3.8: Extract of the data structure table indicating the systematic of the basic data model.
Type element type [point, line, complex, text]
LV level
LC line code [solid, dashed, dotted, dot and dash, …]
WT weight (in terms of line width)
CO colour
FT font type for texts
Key key for intended symbolisation
TX1 font size of texts appearing for indicated map scale
TX2 font size of (same) texts appearing at (enclosing) map scale
S1 selection of texts appearing for indicated map scale
S2 selection of texts appearing for (enclosing) map scale
Pat selection of map object pattern
Fnum serial number of feature to be mapped
J justification (in terms of element insertion point; default = Left Bottom)
Fkey MicroStation-enabled number of feature to be mapped
Data delivery for several CAD- and GIS data formats
The Technical Specifications require delivery of digital data in several CAD- and GIS data formats. To sup-port easy data conversion at a later stage, the basic data model [BDM] already considers several aspects in
50
the delivery of GIS-enabled data, such as connectivity of line features, topology of area features, and attribu-tion of features.
Controlling rasterisation for input to lithographic processing of colour separate production all relevant fea-tures have to be extracted from the data sets symbolised and converted to a raster format. The information to run and control this process is stored in the basic data model [BDM].
The position and classification of the remaining map features, the majority of which being point features, was determined during field verification refer to section 3.3.5, and subsequently incorporated into the digital data sets. As a result of this process all natural and man-made features represented in the final maps became interpretable. Table 3.9 indicates features proposed to be shown in the new boundary map series.
The map feature table was transferred into a system-dependent level and symbology code list, satisfying the requirements of the basic data model [BDM] for the digital photogrammetric cartographic workflow. This allowed for user-defined separation or grouping of features per mapping scale in accordance with the Micro-Station level and attributing philosophy.
Point features were represented by conventional symbols. As a prerequisite, these symbols had to be de-signed and digitized in advance using samples supplied by the JTC and/or enlarged patterns as a template. Subsequently, the complete set of symbols was stored in a resource file for easy access during data capture by the photogrammetric operators. Using resource files prevented repetitive drawing of frequently used fea-ture symbols, thus contributing to a certain level of consistency in initial data capture.
All input was available for initialising the data compilation by means of photogrammetric plotting. Based on the aerial photography at scale 1:30,000 photogrammetric plotting for the large to medium scale boundary map series at 1:10,000; 1:25,000; 1:50,000 and 1:100,000 were performed from one and the same photo scale. All relevant details (this is performed by stereo photogrammetric restitution of aerial photographs, which involves interpreting existing topographic features and measuring of their geometrical properties for representation in the boundary maps) were interpreted and digitized and transferred to a custom-made topog-raphic-cartographic database for data storage and further processing. This resulted in one data set for each intended boundary map sheet at large to medium scale, enabling an output in the form of a manuscript maps.
Those manuscript maps (see figure 3.10) covering the Boundary Corridor or portions thereof served as a base for field verification and completion of all topographic detail. Photogrammetric data capture was subject to regular consistency checks by weighing completed data sets against reference data sets of representative areas compiled in a previous stage.
Figure 3.10: Resulting manuscript map for field verification.
Buildings and settlements
(1) City
Coastal features
(1) Coastline
51
(2) Village (3) Building (4) Nomad settlement (5) Fort (6) Mosque (7) Ruins; historical site (8) Hospital or clinic (9) Police station (10) School
Transportation network
(1) Main paved road (2) Secondary paved road (3) Main unpaved road (4) Track (5) Paved airstrip (6) Unpaved airstrip
Water wells and towers
(1) Pumping station: water (2) Tube well (3) Wells: perennial (4) Wells: intermittent (5) Springs: perennial (6) Springs: intermittent (7) Water tower (8) Water tank
Utilities
(1) Power station (2) Power line (3) Oil or gas pipeline (4) Oil tank (5) Oil well (6) Pumping station: oil
Water features
(1) Intermittent lake or pond (2) Sabkhah (3) Perennial stream (4) Seasonal stream (5) Dam
(1) Cultivated areas (2) Trees (3) Palms (4) Bushes
Relief
(1) Contours: index intermediate
supplementary
(2) Depression (3) Slope or cliff (4) Spot height (height in metres)
Other topographic features
(1) Fence (2) Wall (3) Survey point (4) Cemetery
Boundary and Monuments
(1) International Boundary (2) Main Boundary Point (3) Subsidiary Boundary Point (4) Boundary Marker (5) Witness Mark
Underlined items: information or features to be determined duringfield verification or from other sources.
Table 3.9: Features proposed to be shown in the new boundary map series.
Completeness checks of the photogrammetric data capture were in first instance carried out by the operator, who displayed the captured data on a colour screen. This allowed for online control of the digitising process and easy application of eventual data corrections. Moreover, the operator could view previously compiled data by attaching the desired reference design files to the active design file. This permitted correct edge
52
matching with adjoining sub-blocks and/or models by continuing existing measurements from previously compiled data.
3.4.4.2 The orthophoto production process
Another output of the photogrammetric process is an orthophoto production to use aerial photographs as backdrop of line maps, the photographic images of the terrain must be transformed from their inherent cen-tral projection into an orthogonal projection of a map.
The generation of orthophotos as a backdrop to cartographic line information requires image enhancement of the scanned photographs by digital image processing techniques, and generation of digital terrain models [DTM] for the rectification, utilising the digital height information from photogrammetrically captured data. The digital terrain models [DTM] to be produced as input to ortho-rectification were generated in steps.
The first step in DTM generation marked the input of height data which had been captured during stereo photogrammetric restitution. The height data comprised of all support points for contour lines, spot heights and break lines, all of which were captured and stored in MicroStation design file format (dgn-files). Where possible, the input was organized in units of entire 1:100,000 scale boundary map coverages with some over-lap into the coverage of the intended adjoining sheets allowed for possible data merging.
The corresponding height values collected during photogrammetric data capture were then extracted from the dgn-files and imported into ImageStation Terrain Analyst ( a software by Intergraph for DTM generation and disply). Whenever necessary, additional information such as hydrographic features were also input, that is, for areas where the local density of terrain points was not sufficient to directly compute reliable relief mod-els.
The second step involved creating triangulated irregular networks [TIN] in an automated process. This data structure facilitated processing, searching and interpolation procedures during the subsequent generation of the DTMs. The processing goal was to form a list of triangles in which each triangle is defined by the point-ers to the storage location of corresponding elevation points.
In order to enable efficient processing and best possible representation of the terrain relief, the triangles were created by fulfilling a sequence of geometrical conditions.
Height interpolation from TIN-structures constituted the core process in the subsequent digital differential rectification. An interpolation in a TIN-structure may be described by placing a surface in space through the three corners of a TIN-triangle and then finding, by means of interpolation, the intersection of the surface and the vertical erected at location x, y. The rectification of digital images was preformed using ISBR (Image Station Base Rectifier software) summarized as follows:-
The input data comprised of the digitally enhanced image data including their support files with the orienta-tion data, the DTM in the form of a TIN, the pre-defined ground sampling distance, and, as a selectable op-tion, the perimeter of the desired area coverage. During the ortho-rectification process, the effects of terrain elevation and camera tilt upon the image perspective were removed to produce a georeferenced data set with an even pixel distribution in map space, and relocate the pixels of the raster image to their proper positions within the specified map projection. Then, from the DTM, it interpolated elevations for each intended ortho-photo pixel of known latitude and longitude to locally correct the effects of relief displacement, and per-formed a spectral interpolation that determined the grey level to be assigned to each pixel of the intended orthophoto. The available interpolation methods computed this value from the neighbouring pixels in the digitized aerial photograph by resampling, applying a bilinear interpolation scheme and the defined ground sampling distance. In the initial stage of geometric resampling each orthophoto was transformed to maintain 1m ground sampling distance, producing uniform coverage over the entire area that had been photogrammet-rically mapped resulting in digital orthophotos.
In order to produce the orthophoto backdrop for an intended boundary map sheet, several images had to be ortho-rectified at specified scale, radiometrically matched, mosaicked and trimmed according to the sheet line systems defined for the large to medium scale boundary map series 1:10,000 through 1:100,000. Within this process the mosaics to be generated for the photogrammetric mapping scales other than 1:10,000 were resampled to their appropriate ground resolution, resulting from the pre-defined setting of 0.1mm at mapping scale. For digital image mosaicking the INPHO OrthoVista 4.0 software product was used. After this procedure, the digital orthophoto mosaics were ready for support in subsequent cartographic proc-essing and for generating film plots in preparation of boundary map printing for quality and accuracy control
53
(check for presence of any smudge, appearance of seam lines, and gross DTM errors, or random DTM errors. Any detected inconsistency was marked for further checking of the data and possible re-processing). The general objective for generating orthophotos as a backdrop to line maps is to furnish georeferenced im-age information to the georeferenced line work see figure 3.11. Provided that an accurate Digital Terrain Model (DTM) as well as the elements of the absolute orientation have been used, orthophotos reveal a terrain representation with a geometric accuracy brought to that of conventional line maps, but with a potentially higher visual information content.
Figure 3.11: Orthophotos as a backdrop to line maps.
Continuously verifying photogrammetric data capture in larger context completion of the corresponding orthophoto background allowed for visualization and verification of the photogrammetric data capture against the radiometrically enhanced mosaics and. Viewing and possibly required editing in the larger con-text of an intended map sheet compensated for inconsistencies that may have arisen from producing line work of a very limited model section on stereo plotters at multiple magnification vision. For providing image background to the medium to small scale boundary maps ranging from 1:200,000 to 1:1,000,000 satellite images were used. The purpose of processing satellite image data was to geometrically transform the raw data into the chosen map projection and adapt the original grey values to a common radiometric system. In addition, the individual satellite scenes had to be mosaicked into one single image, followed by image enhancement in order to achieve an optimum visual presentation in the final map sheet. Image data processing was performed in the following stages, using the ERDAS IMAGINE 8.5 software suite:
Control points were read in for geometrical image processing. DTM data originating from the GTOPO30 (Global Topographic 30-arc-second Elevation data set)
were read in for geometrical image processing. The geometric rectification was performed by an indirect method, that is, pixel-by-pixel recursive
projection. As a result, the satellite scenes geometrically displayed the characteristics of a map. By means of this indirect method the satellite image data were converted to UTM with reference to WGS84, and the original grey values were adapted to a common radiometric system.
The geometrically processed image data were resampled, adapting the pixel size (ground resolution) to the output scale. As reference for resampling served the minimum resolvableness of human vi-sion, which is at 6 to 10 pixels/mm:
- 1:1,000,000 (125.00m ground resolution) Radiometric image processing was performed within the process of mosaicking. Balancing differences in contrast and light intensity, within a scene and between adjoining scenes,
was achieved by adjusting the grey values of pixels with specific filter procedures. The geometric transformation resulted in 16 image mosaics corresponding to the sheet line systems
of the small scale boundary map series.
3.4.5 Field Verification and Names collection To ensure accuracy, consistency, and quality of the boundary maps, supplementary information was required to complement the results of photogrammetric plotting. In response to this, all photogrammetrically captured detail, undefined objects, and man-made features were verified in the field. Aspects such as these were clari-fied during several field verification trips with the participation of Technical Fieldwork Team members, or-ganised with respect to groups of manuscript maps. The field verification teams also classified the road net-work and updated features newly constructed or completed after aerial photography had been carried out. In addition to line work and orthophoto background, geographical names form an important part of the contents of topographical maps. A presentation of selected names indicates the documenting character of the different boundary map series and allows for more reliable orientation of map users in the field. Thus the procedure of names collection was introduced as a key issue to the production process. The field verification comprised of a physical inspection of the area covered by each machine plot. All features were checked and verified by visual inspection and/or appropriate survey methods. Features were added or corrected by methods that en-sure horizontal and/or vertical positioning within the prescribed limits of the mapping accuracy criteria. GPS was used and co-ordinates were stored and used for automatic placement and addition of surveyed features to the relevant photogrammetric data sets in subsequent production steps. In addition to the verification and completion of topographic features in the field, a collection of geographical names was undertaken. These names were collected by field crews working in close co-operation with authorities and local guides. Accord-ing the Saudi Yemeni boundary Technical Specifications all map series must be bilingual, that is, the original Arabic name of a feature as well as its Romanized transliteration were to be shown on the map face figure 3.11.
Figure 3.11: Portion of field names collection.
The collection and processing of geographical names will be carried out in stages as listed below:
Collection of names Verification of names Transliteration of names Name manuscripts Typesetting, calligraphy and positioning of names.
During the subsequent office-procedure of field editing, erroneous details were corrected and features not present on the photogrammetric manuscripts were added to the existing topographic-cartographic database to
55
transform it into a foundation for cartographic products. Systematic identification of non-interpretable fea-tures, during the field verification trips, all features that remained non-interpretable in photogrammetric plot-ting were classified and marked for subsequent incorporation into the updating of the photogrammetric data base to be transferred to cartographic processing.
3.4.6 Quality Control Sequences in the Photogrammetric Process Quality and accuracy control are supporting measures to maintain the reliability of photogrammetric plotting, extended across the complete production process and beyond. At the interface of photogrammetric process-ing and cartographic processing the entirety of implemented measures is presented for comprehensive evaluation. The following paragraphs have been laid out in a flow diagram sequences referring to Figure 3.6 with the measures activated in the photogrammetric part of mapping. Depending on the type of topography in the area under survey, either all, or a combination of the following measures for every activity were applied 1) Continuous set-up checks of stereo models Prior to the compilation two check points had to be measured in their x-, y-, z-components and registered for verifying the orientation adapted from aerial triangulation. At least every three hours a height check had to be carried out. Upon finishing the compilation the selected check points had to be re-measured and the coor-dinates to be compared to the initially registered values. In case of differences, the compilation of the entire model or sub-block had to be checked for possibly required recompilation. 2) Continuous checks for consistency To maintain consistency of all photogrammetric data capture, newly compiled data sets were validated against reference data sets of representative areas compiled at the initial stage. 3) Continuous online checks for completeness A check for completeness and consistency of the plotted features was done by the operator himself, directly during stereo compilation, on a color screen attached to the plotter. This allowed for online control of the digitizing process, as well as for possibly required data corrections via the available interfaces. 4) Continuous data file checks After completion of a model or sub-block the compilation was stored as a backup and the compilation soft-ware (e.g. Micro Station) re-started. By recalling the model or sub-block, possible gross file errors could be detected. Further to successful recalling, a systematic check of the compilation took place, considering
Evaluation of the feature interpretation, Completeness, Consistency, Coverage, Density of spot heights and symbols, Logic definition of areas, and Map target scale.
These checks were supported by selecting the relevant (MicroStation) levels only or by temporarily switch-ing on/off certain levels in order to enhance the viewing on screen. 5) Continuous data checking Continuous data checking against basic data model is done, prior to data merging, the data sets of individual models for correct assignment of each feature to its corresponding level. 6) Accounting for edge matching Accounting for edge matching across model or sub-block boundaries Data merging was followed by a check for complete representation of those area features and depressions that were initially separated by model or sub-block boundaries. In support of visual verification of the results by means of plots all relevant informa-tion had to be symbolized already at this stage. Possibly required corrections were applied directly to the data sets and in consultation of the operators involved in the compilation of the previously independent data sets. 7) Protection of data files by reset to read-only status
56
After data merging and corrections, the formerly independent data sets at the photogrammetric plotting in-struments were disabled and the merged data provided as reference files for the ongoing compilation in ad-joining coverage, limited to read-only status. 8) Accounting for non-interpretable features The entirety of collected data served as a base for preparing plots at suitable scale that were taken to the field for field verification and collection of geographic names. The photogrammetric operators were to digitally assign pointers to be detected but non-interpretable features. These pointers along with a systematic number-ing system appearing on the field verification plots provided pin-point guidance to all field teams involved in completion of the topographic data base. The Figure 3.12 shows the photogrammetric process mentioned above and its links to quality control elements. Field Verification QC is a systematic identification of non-interpretable features during the field verification trips; all features that remained non-interpretable in photo-grammetric plotting were classified and marked for subsequent incorporation into the updating of photo-grammetric data base to be transferred to cartographic processing.
57
Figure 3.12: The photogrammetric process mentioned above and its links to quality control elements, A refers to figure 3.8 B, C, and D refer to figure 3.14. (Cartographic and GIS process).
58
3.5 Digital Cartographic Processing In continuation of digitally recording all photogrammetrically captured data in the topographic-cartographic database, map compilation and map composition was maintained by digital cartographic methods. In fact, the data structure inherent in the database was designed to model the final printed maps. The aim of cartographic compilation is to assemble the final contents of each map sheet, giving all map details their final size and location. The contents of each map sheet was compiled according to project specifications and accepted cartographic standards. After map compilation, the cartographic map production process took place as a further step, comprising of final composition of features to cartographic printing quality. The aim of cartographic map production is to generate for each map sheet a set of high quality lithographic colour separates to derive the required films for printing. At the production stage subsequent to the photogrammetric plotting and after the data structure had been defined the following production steps were executed:
Preparation of vector data for the cartographic process Editing of field verification results Cartographic compilation Compilation of geographic names Generalisation of map content Feature symbolisation Vector to raster conversion Digital lithographic process Map review and approval.
The cartographic task in the Boundary Project execution was to solve these dependent relationships for com-piling maps in accordance with the Technical Specifications, making full use of the available information and resources, and overcoming any technical difficulties. Applying the theories and principles of cartogra-phy, the following sources were used to obtain consistent map products which possess international carto-graphic standards:
Field-verified photogrammetric map manuscripts at scales 1:10,000 through 1:50,000 Names overlay for each map sheet at scale 1:10,000 through 1:50,000 List of bilingual geographic names in their final spelling and transcription Orthophoto mosaics Existing maps and charts for completing the coverage of medium to small scale boundary maps
1:200,000 through 1:1,000,000 outside the area of the Boundary Corridor Satellite imagery for establishing the backdrop to line work in the medium to small scale boundary
maps 1:200,000 through 1:1,000,000. The fundamental aspects of cartographic compilation are
the definition of final sheet line systems, the design of a standard map frame, the definition of legend elements and their layout, the arrangement of map marginal information, the selection of text styles, and the selection of map colours.
3.5.1 The cartographic Data Structure As the core of processing the digital (vector-) data served the basic data model developed at the beginning of the photogrammetric plotting stage (refer to Section 3.3.4). Further to the photogrammetric data capture the compliance with this data model was maintained in each of the map compilation and map composition proc-esses. In addition to a quality control of the photogrammetrically captured data against the data structure a number of topological processes were carried out for checking the data. For instance checking connections of digi-tally separated line strings and correct closure of polygons was performed. After field verification, the edited field verification plots were subject to an initial checking procedure. On the basis of the orthophoto mosaic produced for each map sheet at scales 1:10,000 to 1:100,000, all the en-
59
tered corrections and additions were revised for consistency and for possibility of correct cartographic repre-sentation. Following this quality control operation, the annotated field verification plots were processed by carto-graphic operators in order to integrate all corrections and additions into the data sets. Tasks for performing the completion of data sets comprised of the deletion or addition of tracks and wells, and of the expansion or reduction of sabkhah boundaries. Representations of buildings, wells, and so forth, which had been com-pleted in the field and for which geographic co-ordinates had been provided by the field verification team, were included in the data sets according to their respective co-ordinate values. For transferring the data of the enclosed boundary map(s) to the target scale the process of generalization had to be applied. This comprised of selective omission of smaller tributaries, simplification / smoothing in the representation of hydrographic features,
accentuating the direction of flow at representation of wadi confluences, adjusting wadi representations to the minimum width allowable for the target scale (singleline and/or
double-line wadi representations), edge matching of surrounding coverage with enclosed coverage, and edge matching with adjoining
sheets. the process of generalization had to be applied for height representation as well. This comprised of simplification / smoothing of contour lines, adjustment of contour interval by omitting every other contour line, comparing results of contour line smoothing in enclosed coverage to appearance of contour lines in
surrounding coverage, comparing results of contour line smoothing to appearance of contour lines in adjoining sheets, checking and re-adjusting the coding for representation of depressions, checking and re-adjusting the bends of contour lines to wadi representations, checking and re-
adjusting contour lines to (new) road and track representations, re-formatting the symbolisation of depression representations, checking re-positioning of spot height values, re-modelling and digitising of slope and cliff representations, edge matching of surrounding coverage with enclosed coverage, and edge matching with adjoining
sheets. The most common case of cartographic generalisation is the transition from a larger scale source (map) to a smaller scale. This involves re-shaping the contents of a given map in terms of geometric position, amount of map features, and representation style for preparing another (derived) map. It is normally true that the smaller the scale of the derived map, the greater will be the degree of generalisation. As scale is decreased, so is the total space available for the map symbols, but these cannot be reduced in proportion, as this would lead to illegibility. Legibility itself depends on symbol size, form and colour - which in turn affect contrast, and perception by the map user. Generalisation thus aims at maintaining
clarity in illustration and statement, plainness and good legibility, informative value of all geometry, accuracy appropriate to map scale and/or purpose, presentation of constituent features, and good characterisation of constituent features and shapes.
After completion of cartographic editing, the categorized data sets were merged into one file per sheet and the cumulative effect of all map features judged for consistency and completeness of representation (refer to Figure 3.13).
60
Figure 3.13: Cumulative effect of all map features and names viewed on screen after merging of data sets.
3.5.2 Digital Data for use in GIS In addition to preparing and submitting conventional topographic maps on paper, the digital data sets for the content (map face) of the corresponding boundary map sheets had to be prepared. Based on the initial data originating from the digital photogrammetric-cartographic process this comprised of determination available digital data sets enabled for Geographic Information Systems [GIS]. In accordance with the JTC require-ments the digital data for the map content had to be delivered in terms of two different target systems:
MicroStation V8 representing the digital photogrammetric-cartographic process ArcGIS 9.1 GIS-enabled.
Cartographic editing was performed using Bentley’s MicroStation software package. The adequate basic data model [BDM] has been primarily designed to fit the needs of the digital photogrammetric-cartographic com-pilation process. GIS has been known as tools that capture, store, manage, manipulate, analyze, model and display informa-tion with respect to geographic space. Systems are to be found in application areas in which the handling and analysis of spatially referenced data as part of a decision-determination process is a major concern. As such, a GIS comprises of the components software, hardware, data, and the intended application. Thus to be suc-cessful, a GIS needs to serve a useful purpose. It must be integrated with the operational strategy of a con-cerned organization or authority to provide the information needed. ArcGIS, developed by the company En-vironmental Systems Research Institute (ESRI), USA, is an information system for geographic data. Like all information systems ArcGIS has a well-defined model for working with data. This generic model, called the geodatabase (short for geographic database), defines all the types of data that can be used in ArcGIS - for example, features, rasters, addresses, survey measurements - and how they are represented, accessed, stored, managed, and processed. The geodatabase is a common framework shared by all ArcGIS products and appli-cations. In this context the data sets for boundary maps aimed at supporting the geodatabase aspect of GIS. For conversion of the data into ArcGIS format, the basic data model was revised in some aspects, enabling more convenient transformation and use of the data for GIS users. This covered the different categories of data as follows:
The vector data (planimetric situation and height information) were prepared for data conversion by assigning feature groups, named by the description of the feature group.
61
For cartographic compilation text features and symbols were handled using Unicode True Type Fonts to avoid incorporating or supplying proprietary text formats. This allowed for dealing with dif-ferent languages (here: Arabic and transcription to English) in one document.
The representation of the Boundary was maintained in the form of a separate file, only showing that part of the line covered by the extent of the concerned boundary map sheet.
The orthophoto background for each boundary map sheet was stored separately as a georeferenced raster file.
ArcGIS data structure comes with the following properties and abilities:
1. Metadata is provided according to the requirements of the technical specification of the boundary project; they can be viewed via ArcCatalog. 2. Symbolization is stored in lyr-files, coming up with nearly the same appearance as in the printed maps. 3. All area features (e.g. cultivated areas, wadis, wooded areas, sabkhahs, built-up areas) are con-verted to polygon features. 4. All point features (e.g. wells, police stations) are converted to point features with the feature type being stored in the attribute table. 5. Spot heights are converted to point features with their height being stored in the attribute table (z-value). 6. Contour lines are converted to linear features with their height information being stored in the at-tribute table; the contour annotation is placed as a label within ArcGIS. On screen it is set according to the size of the viewing window. 7. Lines that were symbolized in MicroStation (e.g. fences, power lines) are converted to simple lines with the symbolization being stored in a lyr-file. 8. Dots placed for wadi symbolizations are converted to point features with the dot size being stored in the attribute table. 9. Most of the data has been grouped to maintain a more convenient data management as follow:
a) all barriers are grouped (linear features), the feature types being stored in the attribute table; b) all landmark features are grouped (point features), the feature types being stored in the at-
tribute table; c) all roads and traffic lines are grouped, the classification being stored in the attribute table; d) all vegetation features are grouped (areas, point features), the feature types being stored in
the attribute table; e) all water bodies are grouped (areas, linear features, point features), the feature types being
stored in the attribute table; f) all contours are grouped (linear features), the feature types and height values being stored in
the attribute table.
3.5.3 Quality Control Sequences in the Cartographic Process Quality control checks aimed at maintaining consistency and completeness in cartographic representation and complying with the relevant Technical Specifications and complements including but not limited to the following :
a) Initial check of map face: Verification of relief representation (contour lines, slope and cliff symbols). Verification of hydrography representation. Verification of the remaining planimetric situation (representation of roads, tracks, settlements,
symbolized features).
b) Checks along edges of map face (verification of edge processing and edge matching in relief repre-sentation contour lines, slope and cliff symbols of hydrography and remaining planimetric situation).
c) Check of map content against names collection overlay (verification of match in representation of hydrographic features with collected and requested geographic names and remaining planimetric situation with collected and requested geographic names, villages and number of buildings, ruins, wells, tube wells).
62
d) Check of map face against field verification overlay (verification of match in cartographic realization and orthophoto background with requirements from field verification of destination and distance in-formation along road and track representations extending into adjoining sheets.
e) Positioning and checking of geographic names in map using the approved text styles for boundary maps as a base this comprised of filling in sheet names labeling of Boundary representation with the names of both countries and of boundary Marker representations positioning of destinations, dis-tances and names according to cartographic rules for hydrographic features, remaining planimetric situation, and for named areas.
f) Positioning and checking of contour line annotation (orientation, spacing, homogeneity in distribu-tion of contour line annotations n entire map face, comparison to contour line annotation in com-pleted adjacent sheets at same scale).
g) Positioning and checking of vegetation features (verification of appropriate allocation of vegetation features in relation to the morphologic differences identifiable within the map face and the ortho-photo background, need for completion or reduction of bush and/or tree representations, and com-parison to vegetation representation in completed adjacent sheets at same scale
h) Check with adjoining sheets for consistency in cartographic realization, and verification of appropri-ate continuation of linear map features into adjacent sheets at all scales and into enclosed sheets.
i) Check for execution of corrections resulting from first check j) Check of all map features for integrity and their size, colour, assignment, adjustment to the k) orthophoto background l) Check of the map frame and integrity of all map marginal information. m) Check of spelling and appearance of all names in Arabic and transcribed versions n) Judging the overall impression of sheets.
In cartographic compilation each topographic feature had been enhanced under cartographic aspects, manu-ally and in context of its depicted surrounding, establishing an overall review of captured data for consis-tency that was sheet-invariant and scale-invariant.
Systematic cartographic proofing is done by visual inspection for completeness, consistency and accuracy for each map sheet. The final authority in adding, deleting, or changing map features was exercised for each individual sheet during a regularly scheduled two-stage cartographic proofing process as part of the Joint Technical committee (JTC) Meetings with the contractor.
For delivery of the data in any particular format as specified by the requirements, the basic data model should be revised in some aspects, enabling more convenient transformation and use of the data for GIS us-ers, e.g. ArcGIS. Like all information systems, ArcGIS has a well-defined model for working with data. This generic model (geodata base), defines all the types of data that can be used in ArcGIS - for example, features, raster data (images), addresses, and survey measurements - and how they are represented, accessed, stored, managed, and processed. Figure 3.14 illustrates a quality control sequences for cartographic and GIS processes.
After completing the cartographic process and quality control for a sheet it can be introduced to the proce-dure of checking approval and delivery procedure set-up which was done between the JTC and the contrac-tor.
63
Figure 3.14: A quality control sequences for cartographic and GIS processes, B, C, and D refer to figure 3.12 (photo-grammetric processing).
64
3.5.4 The products of the Saudi Yemeni Boundary Determination Project The field final Technical Reports were prepared for the purpose of the Boundary Demarcation Project; they cover all the activities which were done in the field works for the purpose of documentation (securing the knowledge) of boundary information’s, and all the processes of map production in their entire activities.
The final mapping products for the Saudi Yemeni international boundary were conventional printed maps on paper, and digital data sets for the content (map face) of the corresponding boundary map sheets.
Cartographic process was performed using Bentley’s MicroStation software package. This resulted in eight-colour printed line maps of sophisticated layout with orthophoto/satellite image background, distributed to eight different map series (scales); refeer to table 3.10.
Table 3.10: Boundary maps as part of the International Boundary Treaty.
Each boundary map series constitutes a set of maps that conform to the same specifications and cover the Boundary in a systematic pattern. The maps within a series have the same format, quadrangle size, and sys-tem of symbolization. Adjacent maps of a series can be combined to form a single large coverage; the fea-tures will match across the joined edges because the symbols and the treatment are the same. Each boundary map series is designated by its publication scale.
These maps - after having been signed by representatives of the Kingdom of Saudi Arabia and of the Repub-lic of Yemen – became an integral part of the International Boundary Treaty and are therefore recognised as official maps documenting the Boundary between the two Countries.
The supplied digital data for boundary maps along with the transformation to data sets enabled for use in Geographic Information Systems [GIS] provide an interface to a wide range of further applications. For de-livery of the data, the basic data model was revised in some aspects, enabling more convenient transforma-tion and use of the data for GIS users under ArcGIS.
A summary of all the Boundary products follows:-
2 Volumes of technical reports (Survey Phase Reports, Constructions, Map productions). Aerial surveying missions with dual camera operation 14,000 Aerial photographs 70,000 km² Photogrammetric plotting 1,029,600 km² Satellite image mapping 25,000 Geographical Names (Arab. /transcript) Placed in mapping 192 New maps at 8 scales (1:10K to 1:1000K) 192,000 Offset-printed sheets (8 solid colours)
All the above products were delivered in digital form with the right exchange formats.
Scale Background Maps Coverage
1: 10,000 79 Main Boundary Points
1: 25,000 22 Mountainous Area
1: 50,000 46 Land Boundary
1: 50,000 5 Maritime Boundary
1: 100,000
orthophoto background
24 Land Boundary
1: 200,000 1 Maritime Boundary
1: 250,000 10 Land Boundary
1: 500,000 4 Land Boundary
1:1,000,000
satellite image background
1 entire Boundary
Total 192
65
3.6 Summary and discussion The purpose of the Boundary Demarcation Project between the Kingdom of Saudi Arabia and the Republic of Yemen was to survey, demarcate, and prepare detailed maps of the Boundary between the Kingdom of Saudi Arabia and the Republic of Yemen in accordance with the International Boundary Treaty signed by the two Countries on 12/06/2000G. The Boundary Corridor with its adjacent lands (boundary area) extends over an area with extremely varying terrain (Subtropical waters, Coastal plain, Mountains, Desert), climate, and density of population. With re-gard to the significantly varying terrain, the remoteness, the distribution of populated places and the climatic conditions prevailing in the boundary area, it was decided to separate the scope of work into two separate field work operations. For each operation, the selection of staff, materials, construction tools, equipment and working procedures was considered individually, taking into account the specific environmental conditions under which these resources were to be deployed. It was also found that maintaining continuous production processes in demarcating the Boundary necessitates the establishment of camps on site, allowing for relocation as the surveying and construction progresses along the line. Out of these camps, all field works had to be prepared and executed. In a further step to site investigation, the findings during site inspection needed to be verified or stated more precisely by a continuous on-the-job scouting exercise prior to any surveying and construction activity. The initial scope of scouting was to identify situations where either the MBP falls within, or the Boundary trav-erses through inhabited dwellings or villages. This was later extended to situations where difficult terrain either prevents from vehicle access or from the intended long-lasting monumentation. In response to such requirement a scouting team was drawn up, entitled to make definitive decisions in the field on the suitability of Boundary Marker placement, on the requirement of placing Witness Marks [WM], and on placement of required survey points. It was also responsible for planning site preparation work prior to the arrival of survey and construction crews. The final product of this boundary demarcation project were boundary markers and maps, functioning – in their entirety, and selected map series – as
attachment to the International Boundary Treaty, and graphic documentary evidence to be deposited at the United Nations archives. boundary markers defining the international boundary on the ground to be visible to all.
Consequently, on the highest process level, the entire scope of work had to be viewed from the mapping and cartography perspective, with many of the previous processes bound for delivering input into the mapping and cartography process. One of the main tasks in the project was thus, constituted by establishing and main-taining a continuous data flow into this map determination process. The challenges constantly endangering the boundary determination were manifold and – in the end – could be classified into three categories:
political-diplomatic administrative technical
Concentrating on the technical challenges, these may be broken down into the following key problems: a. coping with exceptional climatic and topographic factors
b. establishing boundary survey network and ties to National Geodetic Network (NGN) of two coun-tries
c. adjusting survey flights to flying seasons and to progress of field works (pre-marking)
d. handling names collection along the boundary and its results (different names for same feature, different versions for same feature – dialect)
e. interests of the boundary administration was not only focussed on actual boundary determination but also aiming at other issues, (e.g. field verification and some parts of mapping scale-free collection, but scaled application in mapping).
Adjusted to the series above, the solutions to these key problems may be summarized as follows: a. graded approach to site investigation by site inspection visit (prior)
and scouting (on-the-job) resulted in updating of the technical specifications.
66
b. separate datum point survey (for boundary network), followed by research work and separate sur-veying campaign applying GPS-techniques
c. separating photographic coverage into aerial surveying missions due to climate situation
d. double checking of each name in first and second cartographic proofing
e. two cartographic proofing stages, contribution to scaling by working on lists.
Furthermore, as lessons learned there are some improvements which should be taken into consideration in the future:
Improving QC by installing a ‘QC team’ (client + contractor, 4-eye principle which means that im-portant decisions are not to be made by an individual person nor be allowed),
to ensure that all work produced will be QC’d before the official release to the client (i.e. survey logs, BP-pics, …),
provide independent check computations of (all or selected measurements, and GPS observations, e.g. for Base Survey, NDP survey, and AT….), to reduce the risk from errors and abuse. QC-team is control, preparing working instructions, helping manager to push through the production line.
Maintaining a central database is a critical subject for maintaining and producing client documentation such as reports, updating immediately ‘Operating Procedures’/’Works Practices’ from field experiences. Since different surveyors and map makers come from different background (country, education), they tend to have varying standard. Finally governments should make more public relation campaigns about the process of boundary determination, so that ‘everybody’ knows about the project in advance prior to the starting.
To conclude; the concept and procedures were used for the demarcation and delineation of the Saudi-Yemeni boundary and the quality control procedures used in the execution of the boundary project have resulted in highest levels of permanence and quality and reflects a very good boundary practice and outputs. The multi-ple uses of the boundary products have made the use of the ISO standards in connection to the boundary determination process necessary. This work reflects the importance of having common internationally known standards to be added to the practice of future boundary determination. The experience and the practice in some of its conceptual and process on the execution (demarcation and delineation) of the Saudi-Yemeni boundary determination will be the base of boundary determination model which will be discussed in the next chapter.
67
4 Model for Boundary Determination According to International Standards
4.1 The Use of Quality Standards for the Boundary Determination Process The design and documentation of the boundary establishment strategies should be such that countries can carry out the surveying and mapping according to international specifications and agreements. Standardiza-tion of boundary determination can be served best by a set of international standards that integrates a detailed description of the concepts of the boundary geographic information and technology for legal documentation and future use such as those from ISO, since it is recognized by the international community, keeping in mind matching of the data for the future use between countries will be common, and the functions of bound-ary determination, namely separating, developing and connecting. As mentioned in chapter 2, there are two types of ISO quality standards: organizational (ISO 9000 family) and technical (ISO 19100 family). In our case, these standards are applied in a connected system in the pro-duction line of boundary determination. Figure 4.1 shows this connection with boundary administration acting as client. Taking into account, the focus for implementing them in the boundary documentation and mapping production is to standardize the boundary output, and identify needs and uses by boundary admini-stration.
Figure 4.1: The connection between ISO 9000 organizational and ISO 19100 technical specifications.
An important application of these standards is how to use them in connection with the boundary determina-tion production sequences as indicated in section 3.1. This connection of quality standards will be related to surveying and mapping data quality: spatial referencing by coordinates (ISO 19111), quality principles (ISO 19113), quality evaluation (ISO 19114), Meta data (ISO 19115), data product specification (ISO 19131), and data quality measures (ISO 19138). There are also other ISO standards for the purpose of printing maps such as ISO 12647 (Graphic technology - Process control for the production of half-tone color separations, proof and production prints) and ISO 15930-1:2001 Graphic technology prepress digital data exchange Part 1: Complete exchange using CMYK data (PDF/X-1 and PDF/X-1a) contain these standards have the require-ments and set up for offset printing. Table 4.1 indicates the steps of boundary determination in the sequential process of surveying and mapping and its linkage to the ISO standards. The use of ISO 9001 for example specifies requirements for quality management systems where an organization needs to demonstrate its ability to provide products that meet customer requirements and applicable regulatory requirements, aiming at enhancing the customer’s satisfac-tion. Logistics and set-up of boundary project enable the framework for realization of work, e.g. establishing logistics chain and camp, it is a quality management system aspect. All mentioned activities in section 4.2.1.2 are continuous improvement of logistics and set-ups, as part of quality system management. Rather than being absolute, “Quality” is a relative phenomenon to be judged against requirements that have been knowingly set up prior to judging or against requirements that can generally be expected by the user (so-called "state-of-the-art" or "internationally accepted" standards). The technical requirements of boundary determination are, basically, a question of the function of a boundary (separating, joining, and boundary area development). The geography of a boundary and its remoteness (including the issue of populated places), the degree of maintenance required or admitted (including the issue of degree of detail in documentation and the skill of
68
the maintenance personnel) are integral parts in the design of the quality management system for the bound-ary determination. Surveying is a process in the production chain of the boundary determination. It starts with establishing geo-detic control network, within the ISO standards set up. ISO 19111 is the standard for geodetic referencing for geospatial data. All data inquired by surveying has to be checked by quality evaluation methodology through the procedure which has been detailed in ISO 19114 to ensure the implementation of the ISO 19100 family in the quality aspect (such as quality measures according to ISO 19138 required by product specification, see ISO 19131) refer to section 2.3for details. The map production processes go through many steps, namely photogrammetry (aerial surveying or image acquisition, aerial triangulation, photogrammetric plotting and field data collection) the standards required for these activities are both ISOs 9000 family and 19100 families as discussed above. Within Table 4.1 be-low each activity within the map production, has its linkage to a particular standard, in production sequence, and should be in line with those particular standards. As such this ensures that the quality of the data required by the user of the boundary has been met and confirming the exchange of harmonized data for future admini-stration use between countries. The investment in quality will safeguard, the creator and the end user of geo-spatial data from future disputes, it is on public interest and requirements.
4.2 Quality Control Model The quality model normally is based on ISO19113, from the point of data producer (e.g. national mapping agencies). It specifies a uniform and objective description of quality of all data and data types within the entire information chain. The model can be used for drafting or updating specification in the light of quality requirements. It can be seen as a framework for the forthcoming parts of quality requirements. This ab-stracted model can be used also during identifying and reporting quality information, evaluating the quality of a dataset, and user requirements. The quality model has two purposes. It should follow the quality related standards and describe how an or-ganization applies quality elements, quality sub-elements and quality measures for a certain dataset. Then, it should set the quality requirements for that dataset. Figure 4.2 shows a process model for quality control linking the quality standards with client (user) requirements and the producer process. The model starts by taking the quality standards as a guideline. It illustrates the use of quality principles from ISO 19113, the ISO 19131 data product specification, the conformance of the data to the ISO 19114 quality evaluation, and Meta data according to ISO 19115. As such table 4.3 defines a set of data quality measures by using ISO 19138 quality measures, and general inspection or sampling standards as ISO 2859 that can be used when reporting data quality, to ensure its acceptance and reliability. The data quality requirements are formulated by a quality parameter value (measurable aspects of the per-formance of a geographic dataset) which was determined by an evaluation methodology described in Section 2.3.3.2. Having specify to the quality parameters that are achievable and maintainable by the metadata pro-ducer and meet the user requirements, is proving that the quality is not something that is done at the end of a phase or at the end of the project. It is a continuous process to ensure quality is performed in all aspects of any project such as the production of boundary determination output. The quality model includes the qualitative and quantitative data sets where, a qualitative data provides general information about the quality of interest, the purpose of a dataset. It describes the rationale for crea-tion and contains information about its use. A dataset’s intended use is not necessarily the same as its actual use. Actual use is described using the data quality overview element usage, and describes the capability for fulfilling the user requirements. A quantitative data quality can describe how well a dataset meets the criteria set forth in its product specifi-cation and provides quantitative information on quality.
69
Table 4.1a: shows the process boundary surveying and mapping and its linkage to the ISO standards
Boundary Determina-tion
Stage Contents / Activity linkage to ISO
Field Works Logistics and Set-ups
Enable framework for realisation of works, e.g. - establish logistics chain - establish camps
9001
Scouting Investigate site access, need for different type of transport, site conditions and expected environmental conditions , need for construction materials, obstructed GPS views Investigate access to boundary survey network points and expected temperatures, feasible shapes of photo control points Investigate availability of water, food, and local services and raw materials
9001/8.5.2+3
Surveying - Networks Establishing geodetic control network, e.g. - Datum Point - Base Network - Network Densification
19111
Geodetic links into the national geodetic networks of the participating countries - Reference Coordinate system... - World Geodetic System (WGS 84)... - International Terrestrial Reference Frame (ITRF).. - quality and evaluation of results
19111 19114
Surveying - Construction
Set-out survey of (pre-determined) position of - boundary markers - witness markers Control surveys for - drilling - alignment - marker
19111 9001/8.2.3+4
Map Production Photogrammetry
Aerial surveying or image acquisition - Concept for Execution - Planning of aerial surveying missions - Execution of aerial surveying missions - Quality control and evaluation of results
19131 9001/7.1+2 9001/7.5 9001/8.2.3+4 19114
management aspect
(“processes”)
continuous improve-ment of logistics and set-ups
70
Table 4.1b: shows the process boundary surveying and mapping and its linkage to the ISO standards.
Stage Contents / Activity linkage to ISO
Aerial Triangulation
Photogrammetric block formation and georeferencing - AT standards and concept for execution - AT processes - Quality control and evaluation of results
19131 9001/7.5 9001/8.2.3+4 19114
Photogrammetric Plotting
Photogrammetric data capture over the entire boundary corridor - Concept for execution - Data model and data management - Data capture - Quality control and evaluation of results
19131 9001/7.1+2 9001/7.5 9001/8.2.3+4 19114
Field Data Collection - Field Verification [FV] - Names Collection [NC]
Completion of photogrammetric data sets - Concept for execution - Planning of field trips - FV procedures and return of results - NC procedures and return of results - Quality control and evaluation of results
Providing aerial photography as backdrop to line maps - Concept for execution - Approach to orthophoto production - Generation of DTMs - Digital image rectification and mosaicking - Quality control and evaluation of results
Consistent map products possessing int. cartographic standards - Concept for execution - Production planning - Compilation of map content - Map composition - Quality control and evaluation of results
Printing of Maps Duplication of originals to a large quantity of copies - Concept for execution - Production planning, logistics and deliveries - Map printing - Quality control and evaluation of results
19131 9001/7.1+2 15930 9001/7.5 12647,9001/8.2.3+4, 19114 Linkage to ISO
Reporting
Documentation of boundary determination for protection of investment - Reporting concept - Report types (time, technical, release, incidents, detailing, …) - Report generation - Quality control and evaluation of results
19131,19114 9001/7.1+2 9001/7.5 9001/8.2.3+4
71
Figure 4.2: shows a process model for quality control linking the quality standards with client (user requirements) and the producer process.
Accuracy evaluation plays a major rule in spatial data, which is the core of boundary spatial information, so the accuracy has been given a big part in the Quality Control Model. Accuracy is conformity with a standard or correctness in measurement. Accuracy relates to the quality of a result and is distinguished from precision which relates to the quality of the operation by which the result is obtained.
72
4.2.1 Errors and quality measures According to The National Standard for Spatial Data Accuracy (NSSDA), all spatial data activities should develop a classification scheme following the standard given below. The standard for reporting positional accuracy is defined for horizontal and/or vertical coordinates, depending on the characteristics of the data sets. Horizontal: The reporting standard in the horizontal component is the radius of a circle of uncertainty, such that the true or theoretical location of the point falls within that circle 95-percent of the time. Vertical: The reporting standard in the vertical component is a linear uncertainty value, such that the true or theoretical location of the point falls within +/- of that linear uncertainty value 95-percent of the time. The method used to evaluate accuracy should be described. Examples include: statistical testing, least squares adjustment results, comparison with values of higher accuracy, repeat measurements, estimation, etc. The accuracy standard for point data in each part of the document will identify the type of application and if applicable, the accuracy level recommended for that application. Coordinate values should be based on National datum’s. Horizontal coordinate values should preferably be referenced to a datum such as WGS-84. Vertical coordinate values should preferably be referenced to a ver-tical Datum of such as EGM or any local national MSL, see section 3.2.3.5. However, it is recognized that many older maps and geospatial data are referenced to older national datum. If coordinate values are not referenced to the National datum but their relationship to the national datum is known, identification of the datum and its relationship to a National datum is necessary. If the relationship between the local datum and the National datum is not specified, identification of the datum and a statement that its relationship to a National datum is unspecified, is needed. Accuracy information also, enables users to evaluate how the data fit their applications requirements. This information may include descriptions of the source material from which the data were compiled, accuracy of ground surveys associated with compilation, digitizing procedures, equipment, and quality control proce-dures used in production. If available the independent source of higher accuracy shall be acquired separately, e.g. from data used in the aerotriangulation solution or other production procedures. The independent source of higher accuracy shall be of the highest accuracy feasible and practicable to evaluate the accuracy of the dataset. Other possible sources for higher accuracy information are Global Positioning System (GPS) ground sur-veys, photogrammetric methods, and data bases of high accuracy point coordinates e.g. in the Saudi Yemeni Boundary Project, many points on the ground have been selected and observed using GPS for an independent check for AT solution. Due to the diversity of user requirements for digital geospatial data and maps, data and/or map producers must determine check point locations in the data set for quality checks. Check points may be distributed more densely in the vicinity of important features and more sparsely in areas that are of little or no interest. When data exist for only a portion of the dataset, test points should be confined to that area. When the distribution of error is likely to be nonrandom, it may be desirable to locate check points corresponding to the error distribution. For a dataset covering a rectangular area that is believed to have uniform positional accuracy, check points may be distributed so that points are spaced at intervals of at least 10 percent of the diagonal distance across the dataset and at least 20 percent of the points are located in each quadrant of the dataset. Table 4.2 indicates an example of topographic mapping accuracy requirements in NATO, the NATO STANAG 2215 Edition 5 accuracy rating for The National Topographic System (NTS) map sheet.
Horizontal Accuracy Vertical Accuracy
Rating 1/50 000 Scale
1/250 000Scale
Distance atMap Scale
Rating 1/50 000 Scale
1/250 000 Scale
A 25m 125m 0.5mm 0 5m 25m B 50m 250m 1.0mm 1 10m 50m
Table 4.2.: indicates example of topographic mapping accuracy requirements in NATO.
Beside point coordinates, boundary maps contain other data elements. A data structure is a group of data elements grouped together, e.g. mapping data elements. Furthermore with regards to geospatial data topology
73
in GIS is a very important issue being an expression of the spatial relationships between map features. It describes how lines and polygons connect and relate to each other, and forms the basis GIS data structures and functions. From this point, the discussion relates to the relationship of data quality and data structure of maps.
1. Map Features in a Topological Model composed of points and directed lines (lines drawn in a particular direction and order from point to point e.g. arcs = directed lines)
2. Fundamental Components of Topological Relationships between Map Features a. Connectivity - arcs connect to each other by nodes b. Area Definition - an area is defined by a series of connected arcs c. Contiguity - arcs are drawn in a given direction, from node to node, with left and right poly-
gons of defined attributes. Topological Errors:
1. Topological errors arise when nodes and arcs are not properly "snapped" to one another or aligned.
2. Error Types a. dangling nodes - nodes dangle in space without being snapped to another node b. undershoots - nodes are short of being snapped c. overshoots - nodes are long on being snapped d. leaky polygons - polygons are not closed, nodes are not properly snapped.
Location Accuracy and Topological Accuracy in GIS 1. Location Accuracy - measures the error in the absolute position of a map point or feature rela-
tive to real world, georeference coordinates. 2. Topological Accuracy - a measure of the error in topology and attribute features of map fea-
tures.
4.2.2 Determination of quality parameter values The described quality elements and parameters are the basis for quality evaluation procedures to provide quality measures. Quality parameters describe measurable aspects of the performance of a geographic data-set. Quality parameter for completeness The omission can be measured by the rate of omission
whereby N is the number of entities in the model of reality and xm the number of missing entities in the database. The same formula can be used for the commission whereby xm is the number of excess entities in the database. Quality parameter for consistency Quality parameter for consistency can be effected by:
geometric consistency: percentage of adherence to geometric specification. topological consistency: percentage of adherence to the explicitly encoded topological character-
istics of a dataset. thematic consistency: percentage of adherence to semantic specification.
The consistency can be measured by the same function above, whereby xm is the number of objects, which do not fulfill the consistency requirements. In practice most of consistency rules should be automatically checked during production by checking tools. For some of the most important rules a 100% rate is required. Quality parameter for correctness Quality parameter for correctness can be effected by:
geometric correctness: The geometry is incorrect as result of inaccurate digitizing, e.g. the digi-tized street is outside the given accuracy
topological correctness: The topology is incorrect as result of wrong relationships, e.g. turn offs in street networks are incorrect, so that the routing results of the net works are wrong.
74
thematic correctness The thematic is incorrect as result of wrong attribute classification, e.g. an attribute was assigned to a wrong attribute class.
The correctness can be measured by the same function also, whereby xm is the number of incorrect entities and N is the number of entities in the database.
Quality parameter for Currentness
Quality parameter for Currentness is by comparison between rate of update and rate of change.
Quality parameter for accuracy
The concretization of the quality characteristic “accuracy” can be effected by different quality parameters. It is distinguished between quality parameters for geometric, temporal and thematic data. Therefore the distinc-tion of accuracy happens at the level of the quality parameter.
Accuracy means the relationship between the measured value of the geoinformation and the real value. The accuracy of temporal, thematic and geometric data can be included. The accuracy depends on the required value. A random error will be considered. In case of a gross or a systematic error, it is incorrect. But in prac-tice it is not always possible to know whether an error is systematic or random. Examples for accuracy are:
temporal: absolute accuracy of temporal values, time measurement, temporal validity thematic: absolute accuracy of quantitative attributes (e.g. road width) geometric: positional accuracy absolute accuracy of geometry: closeness of reported coordinate
values to values accepted as or being true (e.g. the allowable accuracy for the Saudi Yemeni The datum point shall be determined at absolute accuracy not exceeding (±1) meter according to (WGS 84)) relative accuracy of geometry: closeness of the relative positions of features in a data-set to their respective positions accepted as or being true
Accuracy can be measured by standard deviation or variance [Wiltschko, Kaufman, 2004].
Within the quality measures table 4.3 indicates the quality elements, and the quality methods to be used to determine the metrics for data quality summerized from world spatial metadata standards [Harold Moellering et. al 2006 ]. This is to be used for judging the quality elements.
4.3 Boundary determination model The focus of this section is on setting up a model for the boundary determination process based on interna-tional specifications, agreements and good practice taking into account the existing approaches for quality control standards, and linking the boundary determination activities with (ISO) standards for quality, refer to table 4.1. Consequently interoperability of geographic information systems in distributed computing envi-ronments is facilitated. This model highlights the requirements for registration set by the UN which were agreed and recognized by international communities, in order for the treaty contents to be enforced by law (see chapter 2).
The major stages of the boundary determination model are four basic stages: Delimitation, Demarcation, Delineation, and Future use (maintenance). This model leads to sufficient technical support for statesmen with regard to the delimitation of the boundary and the practical arrangements associated with it. Statesmen on both sides of the boundary usually have to come to an agreement in a tense atmosphere, sometimes after wars or during tough conflicts. They act under public and sometimes even international pressure. The proc-ess of negotiation, which includes usually the requirement to be compromised with regard to national inter-ests, leaves them no room for the technicalities; these must be taken care of by professional staff like lawyers and engineers. The information provided within the boundary determination model could be used as guide (consultation) to people who may not have the proper knowledge and technical skills in Surveying and Map-ping , and may cause troubles later on during the boundary determination process the model may be the an-swer of many unveiled issues .
75
Table 4.3: Identification of Quality Elements of Geospatial Data (mapping and relate information).
The model covers all stages of the boundary determination process, the components and activities to be included in the process, the recommended input and output, and their technical means. The model is based on practical cases, reflecting the use of the existing methodology and international practice, as well as the researcher’s practice in boundary affairs during the past 15 years, such as the boundary determination process of the international boundary between Saudi Arabia and Yemen, which here serves as a case study. The model gives significant attention by grouping the stages of boundary determination, especially between the terms delimitation, demarcation, and delineation. Delimitation represents the preparatory work and the definition of the boundary in the treaty either by words or on maps, or coordinates, while demarcation represents the laying down of the boundary on ground after the treaty has been signed. Delineation represents the graphical aspect of the boundary determination refers to section, 1.1 for details about the definitions of these terms. This model covers also the documentation (product output) required for boundary administration in securing the knowledge of boundary information and their future use.
4.3.1 Boundary determination model process
Quality Elements Quality Methods Metrics for Data Qual-ity((normative).
Completeness
Field checks Repeated measurements Independent measurements Subjective evaluations
a) Error of omission b) Error of commission
Positional Accuracy
Standard error in adjustments Independent measurements Repeated measurements Subjective evaluations
Standard error Maximum error Error correlation Confidence level (e.g., 90%, 95 %,…) Others
Attribute Accuracy
standard error Error classification matrix Independent measurements Subjective evaluation
Standard error b) Maximum error c) Error frequency d ) Error correlation e) Confidence level (e.g., 90%, 95 %,…)
Temporal Accuracy
Independent measurements Subjective evaluation
As (a,b,c,d,e) in 2 above.
Currentness
Date of source materials Repeated measurements Independent measurements Subjective evaluation
Date Maximum age Temporal extent Other
Logical consistency
Verification results of consistency checks Repeated processing Comparison with independent source Subjective evaluation
Free text field
Lineage
Checking results of processing steps Subjective evaluation
List of processing steps List of value of processing parame-ters List of printouts of statistics , ect. Source materials, and other
76
2. Demarcation including work of all field activities:
3. Delineation covers the map production processes. The sequences of international boundary de-termination model are illustrates in figure 4.3, and 4.4.
Figure 4.3: Preparation of boundary delimitation, demarcation, and delineation processes.
77
Figure 4.4: The output of boundary determination process.
4.3.1.1 The Delimitation (preparation of boundary determination)
The initial stage of boundary creation is drafting the boundary treaty or agreement, which starts by input from two countries, or more, located at each of termination points of the proposed new delimitation. It is mainly the proof of allocation of territory. The boundary engineer in this stage is serving as technical adviser to the negotiator (statesmen, lawyer, and politician) of the treaty or the agreement. Surveying and mapping in general and aerial and satellite imagery in particular, play a major role in establishing the boundaries physi-cally, which is an important fact in the recognition of boundaries. One essential input tool of the boundary engineer is the use of aerial and satellite images, which would serve as an illustration and sometimes update of the real situation on the ground. Images can be an essential resource at the negotiating table and revise existing maps or serve as map substitutes in poorly or even non-mapped areas. In this case, however, anno-tated images (by adding labels and pointers to the image that help people viewing the image understand what they are seeing) should be used and may be extremely helpful. In addition, recent satellite data contain much information missing from the maps or other descriptive materials, such as details of agricultural activities, density of trees, existence and course of waters, temporary structures, such as ditches and fences, destroyed buildings, or even dismantled roads, which would serve as proof of sovereignty during negotiations and deci-sion determination and the writing of the treaty or agreement between countries involved.
Surveying reports are also one of the best means of input to ensure that the decisions of negotiators are trans-formed to the ground in the demarcation and delineation stages.
The practical experiences which have been made in writing and implementation of the international bound-ary treaty between the Kingdom of Saudi Arabia and the Republic of Yemen was the use of rectified satellite images in the delimitation stage, for reconnaissance tasks (office and field), and the production of fly troughs
78
for the boundary area. Further essential applications of satellite data concentrated in survey demarcation and delineation tasks, photo control planning and map production of the unmapped area of the treaty. The model starts with the preparation of boundary determination (delimitation) output, the treaty or the agreement. This normally covers the proof of the allocation of territory and terms and conditions of boundary determination. It also defines the technical requirements such as specifications input in terms of documenta-tion that is adjusted to desired grade of boundary maintenance. The model should define project duration, cooperation between all parties, methods of payment, deliveries by the contractor, and regulations for ena-bling the administrative-technical authorities to cope with the demarcation and maintenance process, and output terms of documentations (maps, reports and other data structures). The technical aspects of the total scope of boundary determination are to be coordinated and supervised by the Joint Technical Committee [JTC] from both countries (A+B). This committee acts as the central super-vising body within the boundary determination. It is also responsible for all approvals requested by the pro-ducer (contactor) exercising Quality Control for boundary determination. The JTC’s obligations include
ensuring that the position of the Boundary Markers conforms to the specified coordinates, handing over of sites, (prior to commencement of works) to the boundary determination producer.
This inspection is served to familiarise with the nature of the boundary area and the local condi-tions under which the field works and aerial photography were to be executed, allowing for all necessary actions and precautions to be taken into consideration.
overseeing, observing and supervising of all boundary determination processes (works), examining and testing of any materials utilized, and methods to be applied in execution of
boundary works, and authorizing representatives to act according to authorities and powers. The day-to-day duties of onsite supervision are to be allocated to a Joint Technical Fieldwork Team [TFT]. The producer is to closely coordinate with the representatives of this team especially during the field work phase in execution of the boundary line demarcation stage. The technical requirements serve the desired grade of boundary documentation, which will be given as the draft technical specifications to the producer, defining the parameters against which the results will be checked. This will be tested through the production process in the field and the production facilities, to en-able the producer to coordinate the approaches to boundary demarcation and documentation, also defining the cooperation between all parties for support services by countries (A+B) administration. The update of technical specifications should be done according to the work environments, and offers the chance of select-ing hardware and software to be used in the boundary determination process to meet the desired documenta-tions. The preparation is summarized in the Tables 4.4a and Table 4.4b in sequence from column 1-12. Each col-umn indicates its process input or output, the purpose and acting parties such countries A+B (client), and /or producer (contractor). Each block marked in solid line provide an activity and its action purpose process whether it is input for decision making, or output of production of boundary determination process.
79
1 2 3 4 5 6 Agreement Input Delimitation Input Draft Specifications Input Research: Purpose: Acting → Country A+B Country A+B Country A+B Country A+B Country A+B Input from two countries + one country or more, located at each of the termination points of the proposed new delimitation
→ Proof of alloca-tion of territory →
Terms of existing delimitation: - nothing - landmarks - property boundaries - text - coordinates - maps - images Terms of intended delimitation such as - text, - coordinates, - maps, and/or - GIS, ultimately defining the way of boundary determination and boundary maintenance.
→ Documentation of existing delimitation and judgement on quality/ history of such documentation Results of archive work Suggestions and drafts, also on the methods of generating coordinates, maps, GIS to enable a clear vision of results in terms of - accuracy - quality - time >preparation >execution → └> the engineer brings the terrain to the nego-tiating table
Maintain purpose of boundary delimitation and/or demarcation: - separating - developing - connecting Define output in terms of documentation that is adjusted to desired grade of boundary maintenance. Define project duration. Define cooperation be-tween all parties. Define support services by clients’ administrations. Define methods of pay-ment. Define deliveries by the contractor (draft).
→ Requirements by the administrative-technical authorities (via the political authorities) to meet one of these basic political conditions Regulations for ena-bling the administra-tive-technical authori-ties to cope with the demarcation and maintenance process (and with the contrac-tor) →
Table 4.4a: Boundary Determination Model (preparation of boundary determination)
Table 4.4b: Boundary Determination Model (Preparation of boundary determination) continued.
7 8 9 10 11 12 Field Reconnaissance Input Updated
Specifications Input Logistics Input
Purpose: Purpose Purpose: Country A+B +Contr. Country A+B
+Contr. Country A+B +Contr. Country A+B
+Contr. Country A+B +Contr.
Country A+B +Contr.
Get to know the terrain and environmental condi-tions the phases of - documentation (mapping), - demarcation (civil engineering), - and surveying (coordinates) are to respect, e.g.: - population, - availability of local services, - accessibility to boundaryland and to sites, - terrain surface, - soil conditions, - availability of building materials, - possible camp locations, and/or - availability of food and water.
→ Requirements on building materials and on the de-ployment of - equipment - workforce - logistic infrastructure - documentation methods (mapping) Limiting factors of project execu-tion →
Enable coordinated ap-proach to boundary demar-cation and documentation - by contractor, - for cooperation between all parties, and - for support services by clients’ administrations. Enable works in comple-mentary parts. Enable coordinated and useful output into clients’ administrations and work environments (hardware + software). └> cost + time control accuracy requirements economy of accuracy
→ Qualified re-quirements in the - technical, - project- admin., and - time domain, that is with regard (only) to purpose of boundary demar-cation and terrain. →
Enable framework for realisation of works according to - contractor’s production lines, and - clients’ acceptance procedures within time and budget.
→ from - country to country - client to contractor - contractor to client - …
80
4.3.1.2 The demarcation (Field Activities) The field works (surveying) in the boundary determination model should accomplish the following:
Determine and set-out the exact position of the boundary markers in accordance with the treaty or agreement between countries.
Assist Construction operations of boundary markers during the project. Provide Quality Assurance (QA) that the boundary markers were constructed at the exact position
specified. Provide survey assistance to Air Survey operations during the project. Check and deliver materials to be employed and used, achieve positional accuracies for all categories of surveyed points photo control and boundary
markers, Furnish identify boundary markers, and provide extent of documentation.
The model indicates the field process (surveying), its purpose, production sequences and output for the proc-ess listed above. The proposed survey method is to use GNSS (Global Navigation Satellite Systems) surveys of new boundary survey, within such a project a network of permanent operating CORS (Continuously Op-erating Reference Stations) as (RTK Boundary Network) covering the area of the boundary project shall be used in order to improve accuracy through network processing of stations. The method is to find and locate boundary points very precisely on a basis of pre-defined co-ordinates very much depends on the existence of a Permanent Real-Time RTK Boundary Network of Permanent GNSS stations (real-time corrections) during the work. All survey and processing of GNSS data should be related to internationally agreed standards of procedures and formats, not depending on GNSS receiver dependent software solutions and preparatory formats only. In order to achieve the highest accuracy and homogeneity for such a network the stations forming such network shall be observed and processed together with the Base Survey observations at the beginning of the ground works. Ideally two such CORS stations should be oper-ated close to the boundary line, while 2-4 additional stations surrounding the area shoul serve for redundancy in case of any station failure due to unforeseen circumstances. In case such RTK Boundary Network exists and real-time corrections will be available through mobile communication, then the final locations of boundary markers can be located within required accuracy rela-tive to the GNSS stations of the RTK Boundary Network. Constructions are a process for demarcating permanent monuments in the form of boundary markers, and how they should be established in accordance with the Technical Specifications requirements. After setting out of the coordinates of boundary markers - fixing the alignment of the Boundary line through surveying process - their construction commenced. For this purpose a sequence of civil engineering activities is in-volved, differentiating between different types of monuments according to their specifications to provide lasting permanent boundary markers. Aerial surveying is being considered as part of the field activities of the boundary area; its mission is to provide up-to-date aerial photography of high geometric and radiometric standard to be used for photogrammetric stereo compilation and orthophoto mapping, covering the Boundary Corridor. It serves as an instantaneous record of boundary land as a basis for unified documentation. Image acquisition is production of instantaneous record of boundary land as a base for unified documentation by using digital cameras and on line GPS/IMU for providing control, or satellite images if the accuracy re-quirements by specification permit, and its availability. These activities start from column 13-18 below in-cluding the activity and production process and final output to be used in the next activity of production line. Table 4.4c below highlights these activities.
4.3.1.3 The delineation (the map production processes) The process of map production starts with photogrammetric plotting which requires mathematical connection of, the individual photographs in order to form a larger base of information. The resulting photogrammetric block allows for all measurements, performed during photogrammetric plotting from pairs of consecutive aerial photographs (stereo models), to be expressed in one co-ordinate system.
81
13 14 15 16 17 18
Surveying Output Construction Output Images acquisition Output
Purpose: Purpose: Purpose
Define framework for all subsequent demar-cation and documen-tation work (map-ping) in terms of a unified coordinate system.
Geometric accuracy limit for all subse-quent produc-tion steps and outputs
Contribute to maintaining execution of sovereignty rights over terri-tory by monu-mentation Allow for good maintenance.
Visible result of delimita-tion, respon-sive to its initial purpose
Produce instantan-eous record of boundaryland as a base for unified documentation. Allow for office production lines in photogram-metry, even in a de-centralised manner.
Proof of territories’ topographical status at the time of boundary determination, espe-cially important in instable top. conditions such as - sand dunes - wadis - rivers - shorelines - coral reefs
Production process: Output Production
process: Output Production
Process: Output
Country A+B +Contr. Country A+B +Contr.
Country A+B +Contr.
Country A+B +Contr.
Country A+B +Contr.
Country A+B +Contr.
Scouting and survey for - datum point - network of order 1 - network of order 2 - network of order n - monument locations - control of monu-ment locations
- photo control points - verification of
geoid model connection to national networks
Coordinates Levels of - accuracy and -reliability Reports Deliveries
Sequence of civil engineering activities ruled by the - type of monu-menta- tion
- terrain conditions - accessibility to
site
Monument-ation that is - well established, - visible, and - expressive. Reports Deliveries
Flight planning with regard to - seasons - progress of field works > photo control and its > maintenance - Air traffic crtl regulations Execution of survey flights according to specs Post process-ing, including - flight data, GPS/IMU data - automatic image matching. Or high resolution Satellite Images, its correction and con-trol.
Aerial photography in - digital formats. Flight paths Rectified Satellite im-ages Reports Deliveries
Table 4.4c: Boundary Determination Model (The demarcation) continued.
The geometric data required for stereo-photogrammetric restitution can be determined by aerial triangulation, which is, in principle, a numerical method of densifying a network of geodetic ground control points by pho-togrammetric means. Its main purpose in mapping areas with limited geodetic control is to provide for suffi-cient photo control in support of
determining the absolute orientation of stereo models, and linking the photogrammetric block to the local geodetic network (terrain system).
In case of satellite images, there are considerations to use the satellite imagery in the large scale boundary mapping such as the size of the area, its topography and environment, the technical characteristics of the final product and its accuracy limitations, the availability of image data on time, and the cost of the data re-quired.
The compilation of topographic maps is performed by stereo photogrammetric restitution of aerial photo-graphs or rectified satellite images, which involve interpreting existing topographic features and measuring of their geometrical properties for representation into the boundary maps. The data extracted from acquired images is stored on digital computer systems for the field verification, (all features will be checked and veri-fied by visual inspection and/or appropriate survey methods), and subsequent cartographic processing. An-other output of the photogrammetric process is an orthophoto production to use images as backdrop of line maps. The general objective for generating orthophotos as a backdrop to line maps is to furnish georefer-
82
enced image information to the georeferenced line work. Provided that an accurate Digital Terrain Model (DTM) as well as the elements of the absolute orientation have been used, orthophotos reveal a terrain repre-sentation with a geometric accuracy brought to that of conventional line maps, but with a higher visual in-formation content. Field Data Collection improves reliability of a photogrammetric data base. It is comple-ment photogrammetric data base to make its contents compatible with geometric accuracy of intended map-ping. In continuation of digitally recording all photogrammetrically captured data in the topographic-cartographic database, map compilation and map composition was maintained by digital cartographic meth-ods. The aim of cartographic compilation is to assemble the final contents of each map sheet, giving all map de-tails in their final size and location. The contents of each map sheet should be compiled according to the specifications required and the accepted cartographic standards keeping in mind that the data structure within the model should be applicable for future use in GIS format. Columns 19-24 in table 4.4d below illustrate the documentation of the boundary mapping production process discussed above in sequence.
4.3.1.4 The products of the Boundary Determination Process (output) The output of the boundary determination process and primary use of the data for:
Static output mapping and reports for documentation purposes securing knowledge and archiving as attachments to the treaty.
Dynamic output for future use in the boundary administration and GIS updating and maintenance (protection of investment).
For delivery of the data, the basic data model should, in some aspects enable more convenient transformation and use of the data for GIS (dynamic output) users. Modern GIS requirements are summarized by (C. Heipke 2004) as:
The system should provide a topologic data structure, and it should be possible to model 3D geo-objects as objects following the object-oriented paradigm, which can change over time and scale with multiple representations per object.
A modern GIS needs to be able to cope with imagery and contain modules for acquisition, update, and processing of 3D geo-objects from imagery, traditionally considered as part of a digital photo-grammetric workstation.
The adequate data model has to be designed primarily to fit the needs of the digital photogrammetric cart-graphic compilation process, keeping each mapped feature on a separate storage level. For example, features, raster data (images), survey measurements, texts, coordinates, maps, and/or GIS, ultimately defining the way of boundary-determination and boundary maintenance and how they are represented, accessed, stored, man-aged, and processed. A final Technical Report should be prepared covering all the activities done in the field works above for the purpose of documentation (securing the knowledge) of boundary information. Boundary demarcation is based on requirements with either static documentation (paper mapping and reports) as an output to be at-tached to the treaties archived in the UN; or they are based on dynamic output (data for Geographic Informa-tion Systems, GIS) to be used by future boundary administrations.
Purpose: Purpose: Purpose: Prepare the base for useful docu-mentation (map-ping) with regard to - maintenance and - international acceptance
Topographic model of boundaryland to be used inde-pen-dently of space and time > “first ap-proximation”
Improve reliabi-lity of photo-grammetric data base. Complement photogrammetric data base to make its con-tents compatible with geometric accuracy of intended map-ping.
Improved to-pographic model of boundaryland >“second ap-proximation”
Establish pur-pose-built documentation compatible to clients’ adminis-trations. Derive/produce purpose-oriented GIS data in defined system(s) to allow for - regular up-dates and - dynamic growth
Cartographic model of boundaryland to be used independ-ently of space and time, that is - interpreted and - readable for non-technical observers
Densified photo control Vectorised to-pography of model Rasterised to-pography of model Reports Deliveries
Field verificat-ion and complet-ion of vectorised topography and - post processing - incorporation into existing model Field collection of place names and post pro-cessing for in-corporation into cartographic model
Records of - corrections, - additions, and - deletions. Approved lists of place names Definition of text styles for boundary maps Reports Deliveries
Production planning Compilation of map content Map composi-tion Map review and approval Printing of maps GIS-enabling of data
Approved map series covering the boundary in a sys-tematic pattern: - defined sheet line
system per map series
- each series con-forms to its indi-vidual specs
- the maps within a series can be com-bined to form a single large cover-age
GIS data fit to cli-ents admin.
Deliveries
Table 4.4d: Boundary Determination Model (The delineation, the map production processes) continued. The final mapping products (delineation) for the international boundary area normally are conventional printed maps on paper, and a digital data set for the content (map face) of the corresponding boundary map sheets. Based on the initial data originating from the digital photogrammetric-cartographic process this com-prised of determination available digital data sets to be enabled for Geographical Information Systems [GIS]. Effective boundary management requires technical skills relating to positioning and mapping as well as the ability to exchange spatial data, and to have inspections within regular intervals to avoid disputes and degen-eration of the boundary and its data, in order to protect the demarcation investment and build confidence between government authorities.
84
Columns 25-26 of the Table 4.4e is the final summarized output of the boundary determination model and, its intended use as legal proof of securing knowledge of sovereignty rights over territory and GIS tool for updating in the future administration (maintenance).
25 26
Reporting Output
Purpose: Provide objective evidence of »as-built« status of all work results, including documentation of devia-tions. Establish base for boundary maintenance and con-tinuation of data coll. > protect your investment«
(Legal) proof of existence and standards of boundary demarcation, allowing for execution of sovereignty rights over territory. Mapping (Attachment to the Treaty), Reports (Securing knowledge). Maintenance GIS (Tool, updating) Administration (allo-cation of budgets, personal training).
Production process: Output Country A+B +Contr. Country A+B +Contr. Collection of information from - design phase (work concept) - production steps - research (geography) Taking photographs in each production step Providing samples of intermediate and final prod-ucts
Reporting system staged in time and content: - periodic reports - work concepts per production stage - technical reports on results of production steps - special reports on required deviations from specs - final technical report - executive summary - mapping all required scales and GIS Data - boundary atlas.
Table 4.4e: Boundary Determination Model (The products of boundary determination process).
This comprehensive boundary model may resolve these potential problems prior to their appearance. It serves as a source of reference and as a check list, which may reduce complications and speed up boundary determination. It can also, if followed by the parties involved, reduce misinterpretations and conflicts, and speed up the process of the demarcation on ground, which follows the agreement, as well as contribute to future work of boundary administration. Standardizing boundary determination is a very important issue, hoping by this try that, I have contributed some useful tool to those involved in boundary determination.
85
5 The conclusion and outlook
This thesis describes the process used for international boundary determination and develop a better under-standing of these processes of boundary determination with common practice and procedures recognized by international bodies such as the United Nations, since the rules or regulations governing and assisting bound-ary determination are good practice by implementing known technical standards and guidelines. The thesis tries to give a highlight to the requirements for registration set by UN which were agreed and rec-ognized by international communities, in order for the treaty contents to be enforced by law. Most countries have registered their treaty, and international boundaries are, consequently, governed by the Law of Treaties codified in the 1969 Vienna Convention, to which most states have become parties. The international boundaries are generally defined in bilateral treaties between the neighbouring countries, but it does not mean that an agreed geographical representation of the boundary is available. So, it is impor-tant that boundary administration should agree on common level of details for representation of boundary geographic information. Unclear definition of the boundary in the allocation and requirements may result in problems during delimi-tation and subsequently delays in the agreement execution. If the definition of the delimitation and the guid-ance to the demarcation requirements are not sufficient, a conflict may arise before or during the demarca-tion. If the demarcation is not well documented and mutually and formally agreed, it may cause conflicts and even wars in the future. This thesis examines the three ways of boundary determinations as being realized by the executions, and the output of the boundaries determination between Indonesia and Timor, Nigeria and Cameroon, and the Kingdom of Saudi Arabia and Republic of Yemen. The outputs of these boundary determinations are based on static documentation (mapping and reports) for securing knowledge or information about the boundaries to be attached to the treaties or agreements at the UN, and dynamic documentation (GIS) for their future use. It discussed also, the importance of international boundaries harmonization of the data by different sources to ensure consistency, and edge-matching at the boundaries to agree on standardizing the representation of the boundary. The design and documentation of the boundary determination strategies should be such that countries can carry out jointly the surveying and mapping according to international specifications and agreements. Stan-dardization of boundary determination can be served best by a set of international standards that integrates a detailed description of the concepts of the boundary geographic information and technology for future use such as those from ISO, since it is recognized by the international community, in the future use between countries will be common, keeping in mind the functions of boundary determination, namely separating, developing and connecting. Thus following international standards and agreements gives stability, and avoids disputes and degeneration of the boundary. The focus on the thesis had been on setting up a model for boundary determination process; however this model was based on international specification, agreements and good practice while taking into account to the existing approaches for quality control standards, and linking the boundary determination activities with (ISO) standards for quality, consequently facilitating interoperability of geographic information systems in distributed computing environments. The incorporation of this comprehensive boundary model may resolve these potential problems prior to their appearance. It should serve as a source of reference and as a check list, which may reduce complications and speed up boundary determination. It can also, if followed by the parties involved, reduce misinterpretations and conflicts, and speed up the process of the demarcation on ground and contribute to future work of boundary administration.
Outlook The incorporation of further improvements onto boundaries determination data (Surveying and mapping) issues are:
Improvements to the Survey of Boundary Demarcations are very important with regards to time and cost. The Proposed Survey Method to achieve such efficiency is to use a GNSS (Global Navigation Satellite Systems) network of permanently or temporarily operating CORS stations (Continuously Operating Reference Stations) as an RTK Border Network covering the area of the boundary for the survey of all new border points. This is to improve accuracy and availability as well as integrity of GNSS signals through continuous network processing of all stations involved, including stations of the IGS network available for real-time access of data.
86
Since almost 10 years permanent Real-Time GNSS Networks are operated in European countries and especially in Germany showing high precision and reliability in continuous operation. Such net-works allow for a continuous operation of dual-frequency GNSS rover equipment within a homoge-neous network of permanent by operating CORS stations both in real time and for post processing applications. This may improve both accuracy and efficiency in areas where mobile communications through GSM (Global System for Mobile Communications), General packet radio service (GPRS), or Universal Mobile Telecommunications System (UMTS) is available and post processing can be improved through long term availability of GNSS data from well established reference stations in the project area.
The progress in the developments of photogrammetry / remote sensing topographic mapping relying on the following promising alternatives:
1. With reference to 3.3.2 of this thesis, the developments of direct sensor orientation based on GPS/INS for photo control could be an alternative for AT or at least supporting AT by re-ducing the number of required control points. Sensor systems combining GPS with inertial navigation systems [INS] are capable of generating all necessary orientation parameters for highly accurate camera orientation, under certain circumstances allowing for subsequent georeferencing of aerial photographs without any ground control.
2. Quite a number of factors affecting the considerations to use satellite imagery in the large scale boundary mapping such as the size of area, its topography and environment, the tech-nical characteristics of the final product and its accuracy limitations, the availability of im-age data and the cost of the data required. The principal advantage of satellite images in in-ternational boundary application tasks is their availability on a commercial basis without the well-known problem of getting authorization in over- flying certain territories or cen-sorship of any kind.
Now a days high resolution space images can be used for the generation of large scale topographic maps which is normally a major part of the documentation of boundary determination. The geomet-ric accuracy is not the limiting factor for the map scale; the images are limited by the information contents required for object identification. For instance, in relation to a topographic map 1: 5000 not all objects can be mapped. This confirms that a GSD of at least 0.1mm in the map scale is required, thus IKONOS and OrbView-3 images can be used for the topographic map scale 1 : 10 000. With the 0.6m GSD of QuickBird images more details can be seen like with 1m GSD. QuickBird as well as GeoEye-1 and WorldView-1and -2 images can be used up to the map scale 1: 5000 see figure .5.1. [Jacobsen, Büyüksalih 2008]. Furthermore not only the GSD plays a big role; also the imaging conditions are important. The sun elevation plays a major role because mapping in the shadow may be quite difficult. A larger inci-dence angle may cause non- acceptable occlusion in city areas and steep mountains. On the other hand a larger incidence angle gives an oblique view used for object interpretation which is very im-portant for boundary mapping.
87
Figure 5.1: required GSD for generation of topographic maps from (K. Jacobsen, G. Büyüksalih 2008).
Data management is an important issue in boundary determination which still requires further studies to be completed. However the harmonization of the data provided by different sources is a critical is-sue in the international boundary mapping to ensure consistency, and edge-matching (thematic and geometric data matching) at boundaries. They should agree on common representation of the bound-ary since the data captured in these days tend to turn to scale free data collection. These issue require common specifications on the development of Multi-Resolution Databases for the generation of boundary maps at required scale and visualization of multi-resolution data.
Appendix
Table A: Table indicates the overview of the planning, execution, and approval of the entire surveying process of the boundary Saudi-Yemeni project.
90
91
92
References
Adler, R. (2002): “Surveyors Role in Delineation and Demarcation of International Land Boundaries. FIG XXII International Congress, Washington D.C. U.S.A., April 19-26. http://www.fig.net /pub/fig_2002/Js20/JS20_adler.pdf (accessed May-12, 2009).
Allen, I. (2008): Demarcating the boundary between Cameroon and Nigeria, History in the making, Journal of the Institution of Civil Engineering Surveyors, Dec/Jan2008, selected articles from 1999 to 2008. http://www.civilengineeringsurveyor.com. (Accessed May-12, 2009).
Al Sayel, M., Lohmann, P. (2008): The use of satellite images in preparation for the establishment of inter-national boundaries: EARSeL Workshop 'Remote Sensing for Developing Countries in Conjunction with GISDECO 08'. Istanbul, 8 S., CD. Proceeding. www.ipi.uni-hannover.de.
Al Sayel, M., Lohmann, P., Heipke, C. (2009): International Boundary Making - Three Cases Studies: IntArchPhRS (38), Part 1-4-7/WS, Hannover, 6 S., CD. Proceeding, www.ipi.uni-hannover.de.
Brewer, CA, Buttenfield, BP (2006): Mastering Map Scale: Formalizing Guidelines for Multi-Scale Map-Design. Proceedings of AutoCarto, www.cartogis.org.
Chan, K. (1999). DIGEST: A Primer for the International GIS Standards. Lewis Publishers, U.S.A.
Chirstopher, J. (1997): Geographical Information Systems and Computer Cartography. Pearson Prentice Hall, Singapore.
Conclusion 4.6 of the First International Symposium of Land and River Boundaries Demarcations, Mainte-nance in support of Borderland Development, Bangkok, Thailand 7-9 Nov 2006. Published by the In-ternational Border Research Unit (IBRU), University of Durham, UK. http://www.dur.ac.uk./resources/ibru/conferences/thailand/conclusions.pdf (Accessed May-12, 2009).
Danko, DM (2006): Interoperability, Standards, and Metadata Shaping the Change, XXIII FIG Congress, Munich, Germany, October 8-13.
Devillers, R., Jeansoulin, R. (2006): Fundamentals of Spatial Data Quality. London, ISTE. ISBN: 1905209568.
Biljecki, Z. (2007): Concept and implementation of Croatian Topographic Information System, A thesis submitted in partial fulfillment of the requirements of the degree of Doctor of Technical Sci-ences.Submitted at the Vienna University of Technology, Faculty of Mathematics and Geoinforma-tion.
Eduardo V.-O. (2002): International Boundary Delimitation and Law of Treaties, presented at workshop held at IBRU University of Durham, UK, 8-10 July, unpublished.
EuroBoundaryMap (2010): User Guide. v1.1, EuroGeographics. http://www.eurogeographics.org./eng/03_EuroBoundaries_overview.asp (accessed Jan 2010).
Fernandes, R.M.S., D. Fahrurrazi, J. Matos, S. Handoyo (2005): The Common Border Datum Reference Frame (CBDRF) between Indonesia and Timor-Leste: Implementation and Processing, Cartografia e Geodesia; Actas da IV.
Goodchild, M. F. (2007): Beyond Metadata: Towards User-Centric Description of Data Quality, Interna-tional Symposium on spatial data quality, Enschede, Netherlands.
Goodchild, M. F., (1991): Issues of quality and uncertainty. In: Advances in Cartography, J. C. Muller (Ed), vol. 6, pp. 113-139.
Heipke, C. (2004): Some Requirements for Geographic Information Systems: A Photogrammetric Point of View. In: Photogrammetric Engineering & Remote Sensing Vol. 70, No. 2, February, pp. 185–195.
Hofmann, P., Lohmann, P. (2007): A strategy for Quality Assurance of land-cover/land-use interpretation results with faulty or obsolete reference data. www.ipi.uni-hannover.de.
Höhle, J., Potuckova, H., Potuckova, M. (2003): Automated Quality Control for Orthoimages and DEMs, (the Laboratory for GeoInformatics, Department of Development and Planning, Aalborg University, 11 Fibigerstraede, DK-9220 Aalborg, Denmark [email protected]; [email protected]. (accessed Mar-2010).
93
INSIPIRE "Data Specifications" – D 2.6: Methodology for the development of data specifications, EUROPEAN COMMISSION.
ISO 19111 (2007): Geographic information — Spatial referencing by coordinates. International Organiza-tion for standardization.
ISO 19113 (2002): Geographic information -- Quality principles. ISO 19114 (2003): Geographic information -- Quality evaluation procedures. ISO 19114 (2003, Cor. 1:2005), Geographic information -- Quality evaluation procedures – Corrigendum 1. ISO 19115 (2005): Geographic information – Metadata. ISO 19115/Cor. 1 (2005): Geographic information -- Metadata - Corrigendum 1. ISO 19118 ( 2005): Geographic information- Encoding ISO 19131 (2007): Geographic information – Product specification. ISO 19135 (2005): Geographic information -- Procedures for item registration. ISO 19138 (2006): Geographic information – Data quality measures. ISO 9000 (2005): Quality management systems -- Fundamentals and vocabulary. ISO 9001 (2008): Quality management systems – Requirements. ISO 9004 (2000): Quality management systems -- Guidelines for performance improvements. ISO/TC211 web site for ISO 19100 Geographic Information/Geomatics, www.iso.org. (accessed May
2009). Jakobsson, A. (2002): Data Quality and Quality Management –Examples of Quality Evaluation Procedures
and Quality Management in European National Mapping Agencies, In: Spatial Data Quality, Wen-zhong Shi, P. F. Fisher, and M. F. Goodchild (Eds.), London, Taylor & Francis, 313 p., pp. 216-229.
Jakobsson, A. (2005): European Reference Datasets for European Spatial Data Infrastructure. State of the Art and Development of Common Specifications, from Proceedings of the 22nd International Carto-graphic Conference (ICC), A Coruna, Spain.
Jacobsen, K. (2009): Very high resolution satellite images - competition to aerial images, Map World Forum Hyderabad.
Jacobsen, K., Büyüksalih, G. (2008): Topographic mapping from space, EARSeL Workshop “Developing Countries”, Istanbul.
Jacobsen, K., Büyüksalih, G. (2006): Mapping from Space - a Cooperation of Zonguldak Karaelmas Univer-sity and University of Hannover, 5th Turkish-German Geodetic Days, Berlin 2006, http://www.ipi.uni-hannover.de. (accessed 2/2010).
Joos, G. (2003): Standardization of Data quality measures. In: Proceedings of the second International Sym-posium on Spatial Data Quality, Wenzhong Shi, M. F. Goodchild, and P. F. Fisher (Eds.), The Hong Kong Polytechnic University. pp. 205-209.
Joos, G. (2006): Data Quality Standards. Shaping the Change XXIII FIG Congress, Munich, Germany, Oc-tober 8-13.
Ingberg, K. (2006): Geographic Information Quality Management and Standardization in Finnish Defence Forces. Shaping the Change XXIII FIG Congress Munich, Germany, October 8-13.
07030 USA. Mc Ewen, A. (2002): The demarcation and maintenance of international boundaries, presented at a work-
shop held at the International Border Research Unit (IBRU) University of Durham, UK, 8-10 July 2002. http://www.ucalgary.ca/amcewen/IBCdem.pdf. (accessed May, 2009).
Metadata Guidelines for Geospatial Datasets in the UK Part 3Metadata Quality Version 1.0, June 2006 De-partment for Communities and Local Government. http://www.gigateway.org.uk (accessed Dec, 2009).
Metadata Guidelines for Geospatial Datasets in the UK.Part 3, Metadata Quality Version 1.0, June 2006.
94
Moellering,H.Aalders,H. Crane, A (2006): World Spatial Meta- data Standards. Elsevier Ltd. Neudeck, S. (2001): Zur Gestaltung topographischer Karten für die Bildschirmvisualisierung. Universität
der Bundeswehr. Studiengang Geodäsie und Geoinformation,München. NISO (2010): Understanding Metadata. National Information Standards Organization,
www.niso.org/standards/resources/UnderstandingMetadata. Van der Poorten, P. M., Zhou, S., Jones, C. B. (2002): Topologically-Consistent Map Generalisation Proce-
dures and Multi-scale Spatial Databases. GIScience: Geographic Information Science, Second Inter-national Conference, Boulder, CO, USA, Lecture Notes in Computer Science 2478, Springer, 209-227.
Pratt, M., Donaldson, J. (2006): Boundary-Making Challenges & Opportunities, First International Sympo-sium of Land and River Boundaries Demarcations, Maintenance in support of Borderland Develop-ment, Bangkok, Thailand 7-9 Nov 2006. Published by the International Border Research Unit (IBRU), University of Durham, UK. http://www.dur.ac.uk/resources/ibru/conferences/thailand. (accessed May, 2009).
Project Management for Development Organizations, eBook PM4DDEV 2008, www.pm4dev.com. (ac-cessed Nov, 2009).
Robinson, A. H., Morrison, J. L., Muehrcke. P. C., Kimerling, A. J., Guptill , S. C. (1995): Elements of Car-tography. John Wiley & Sons, Inc.
Rothacher, M., Mervart, L. (2001): Bernese GPS Software Version 4.2. User Manual, Astonomical Institute University of Berne.
Sato, S. S., Silva,I. da (2005): Brazilian Quality Control Systems for digital photogrammetry: Mapping pro-duction. The International Archives of the Photogrammetry, Remote Sensing, and Spatial Information Sciences, Vol. 34, Part XXX.
Seeber,G. (2003): Satellite Geodesy. de Gruyter, Berlin. Shenk, T. (1999): Digital Photogrammetry, Terra Science, Laurelville, OH. Sutisna, S. (2006): Delineation and Demarcation Surveys of the land border in Timor, Indonesian Perspec-
tive”, Presented at International Symposium on Land and River Boundaries, Demarcation and Mainte-nance of Border Development, Bangkok 6-11 Nov 2006. International Border Research Unit (IBRU) University of Durham UK, unpublished.
South Africa Quality Handbook (SDI) (2001): Spatial Knowledge Engineering Inc, www.skeinc.com. (ac-cessed Jan 2010).
The International Symposium on Boundaries 17-19 December 2008 proceedings, Maputo, Mozabique http://www.dur.ac.uk/ resources/ibru/conferences/ Mozabique. (accessed Nov , 2009).
Topan, H., Büyüksalih, G.,Jacobsen, K. (2004): Comparison of Information Contents of High Resolution Space Images, ISPRS Congress, Istanbul, IntArchPhRS. Vol XXXV, B4. pp 583-588.
Treaty Handbook (Prepared by the Treaty Section of the Office of Legal Affairs) U.N, http://untreaty.un.org/english/treatyhandbook/hbframeset.htm. (accessed May-12, 2009).
United Nation Office for West African status report on Cameroon Nigeria boundary, www.un.org/unowa. (accessed Jan 2010).
Shi, W. (2007): Four Advances in Handling Uncertainties in Spatial Data and Analysis, International Sym-posium on spatial data quality, Enschede, Netherlands, June.
Wiltschko, T. (2004): Quality management. www.euroroads.org. Thomas Wiltschko, Thilo Kaufmann. Re-port on quality frame for information. 12 October 2004. www.euroroads.org. (accessed Jan 2010).
Zhou, X., Prasher, S.,Sun, S., Xu, K. (2004): Multiresolution Spatial Databases: Making Web-based Spatial Applications Faster, School of Information Technology and Electrical Engineering University of Queensland, Australia.
95
Acknowledgement
I extend my thanks and gratitude to His Royal Highness Prince Sultan bin Abdulaziz, Crown Prince and Minister of Defense and Aviation, and Inspector General, who granted me the op-portunity to continue my education at Leibniz University of Hannover. His wisdom and vision promote the scientific level of the people of the Kingdom of Saudi Arabia.
I would like to express the deepest appreciation to His Excellency the President of the General Survey Authority in the Kingdom of Saudi Arabia, General Murayya Al Shahrani. Without his guidance and persistent help this dissertation would not have been possible. I also, offer my re-gards and blessings to all of those who supported me in any aspect during the completion of the thesis.
My thanks also go to my thesis supervisor and examiner, Univ.-Prof. Dr.-Ing. habil. C. Heipke, whose encouragement, guidance and support from the initial to the final stage enabled me to develop an understanding of research environments. I also thank the exam committee members Prof. R. Goossens, University of Ghent in Belgium, Univ.-Prof. Dr.-Ing. W. Voß, and Hon.-Prof. Dr.-Ing. Ralf Schroth for their constructive comments, Dr.-Ing. Peter Lohmann who al-ways showed an attitude of guidance and help throughout my thesis, and all my colleagues at IPI for their concern and help. In addition, thanks are due to Dipl.-Ing. J.Petring from Hansa Luftbild whose enthusiasm and help are highly appreciated.
Last but not least, I am heartily thankful to my family for their engagement, patience, and sup-port.