48
NRC Protective Measures Team Fukushima Challenges; RASCAL 4.2 Update National Radiological Emergency Preparedness Conference Lou Brandon April 24, 2012

NRC Protective Measures Team Fukushima Challenges;
RASCAL 4.2 Update
National Radiological Emergency Preparedness Conference
Lou Brandon April 24, 2012

EPA Protective Action Guidelines
• US Protective Action Decisions occur during Early Phase (0-96 hrs), Intermediate Phase (96 hrs- few months), and Late Phase (beyond few months).
• Evacuation and sheltering, relocation, and ingestion pathway modeling considerations are explored.
• Reflecting on the Fukushima incident can provide valuable insight into the challenges we might face in this country.
2
NRC Response Teams
• Executive Team • Reactor Safety Team • Protective Measures Team Does Independent assessment of Licensee
Protective Action Recommendations. • Liaison Team • Safeguards Team • Support Teams
3

Quake & Tsunami All times in this presentation are Japan Time
• 3/11, 14:46 Quake 18:00 Fukushima Unit 1, cooling issues Japan Times 5/16
19:30 Fuel rod damage • 3/12 6:50 Unit 1 core significantly damaged
(quake +16 hours) Core melt sequence still being analyzed 15:36 Explosion (quake + 25 hours) TEPCO Press release 3/13
19:00 Injecting Seawater Unit 1 NYT June 12
4

Initial NRC Assessments • Informed water level 50 cm below fuel top • Rough starting point - model 10% core melt • 3/12, 14:53, Unit 1 Explodes • RASCAL: using Generic Fukushima location Total fuel melt, 100%/hr release EPA PAGs exceeded beyond 50 miles • Winds and forecast primarily from the SW • 21:00 1st RASCAL run,10% core melt,
unfiltered, roughly models ground data
5
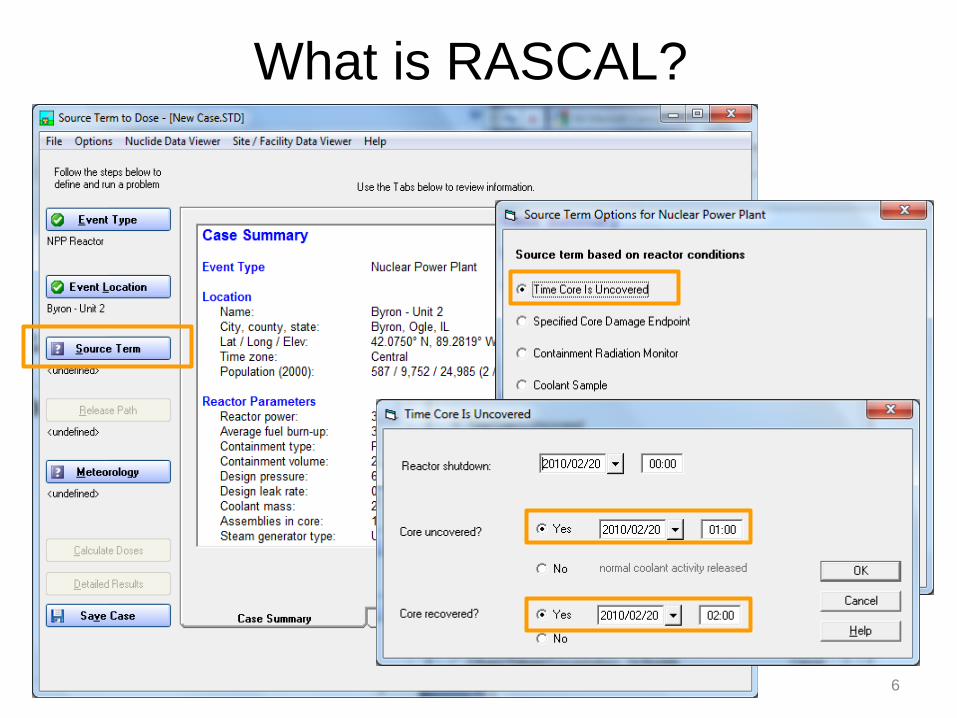
What is RASCAL?
6
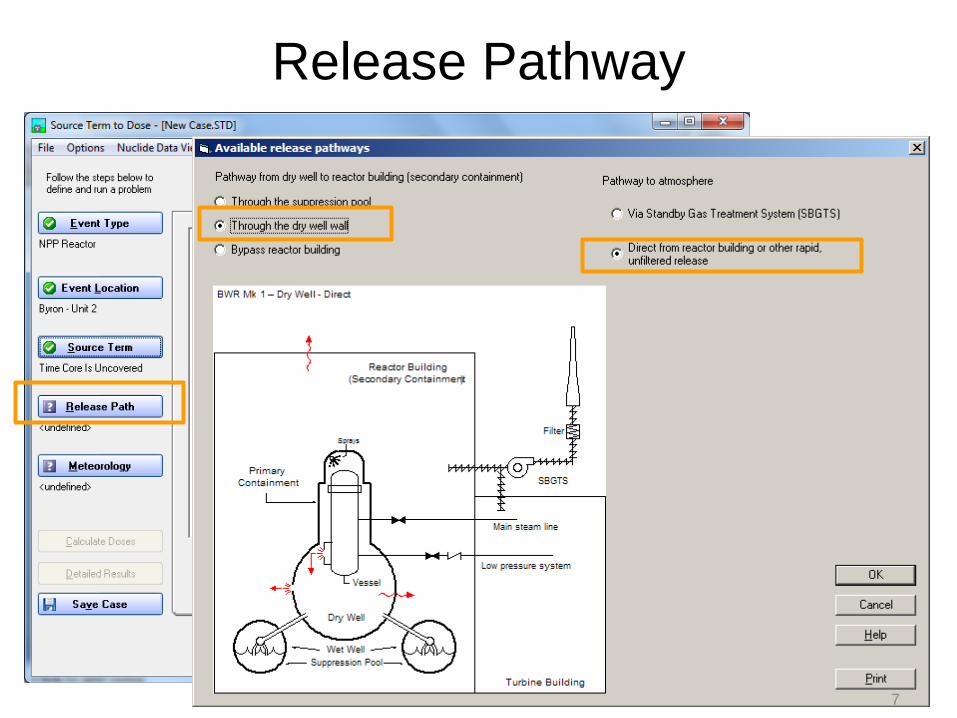
Release Pathway
7
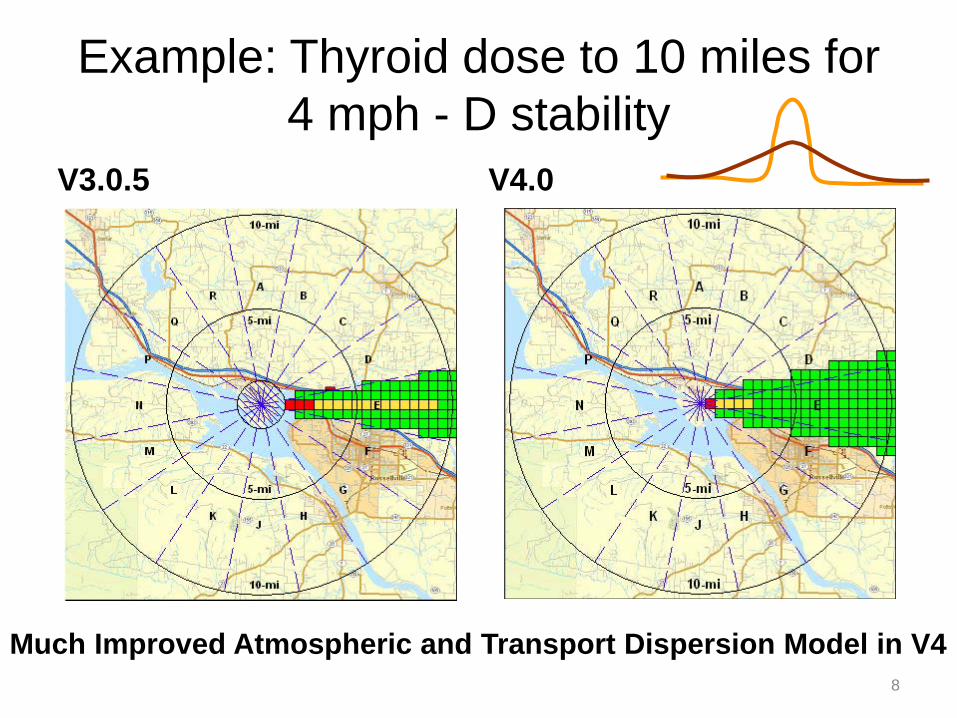
Example: Thyroid dose to 10 miles for 4 mph - D stability
V3.0.5 V4.0
8
Much Improved Atmospheric and Transport Dispersion Model in V4
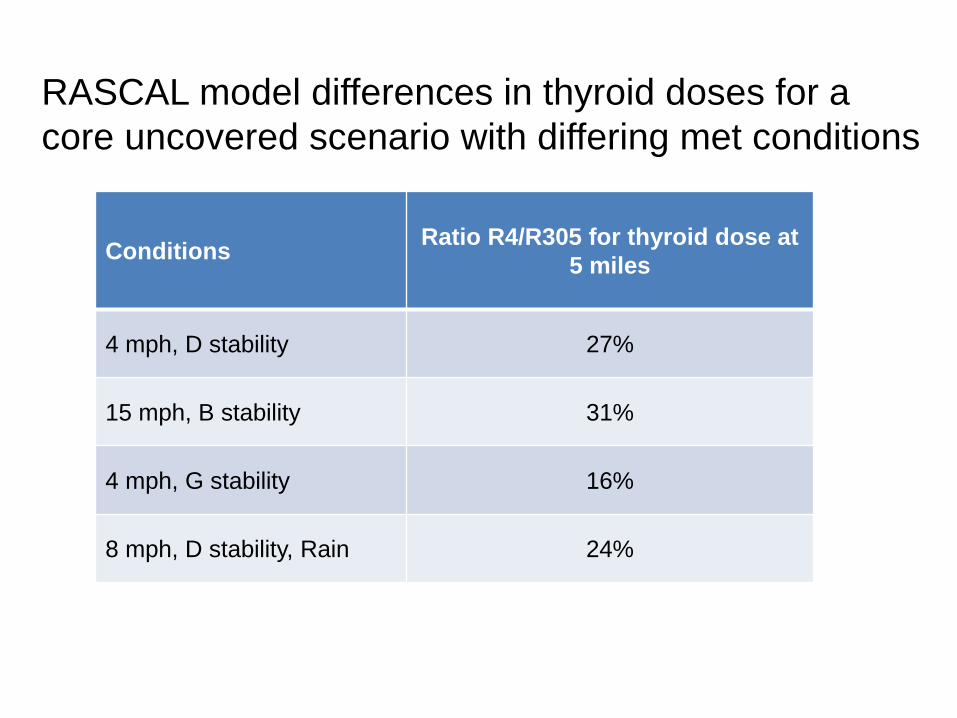
Conditions Ratio R4/R305 for thyroid dose at 5 miles
4 mph, D stability 27%
15 mph, B stability 31%
4 mph, G stability 16%
8 mph, D stability, Rain 24%
RASCAL model differences in thyroid doses for a core uncovered scenario with differing met conditions

Public Health & Safety – 1st Priority
• Radiological details of degrading situation were sparse and inconsistent
• 3/14 – Unit 3 Explodes (11:01, winds at times to the SSW toward Tokyo) INPO 11-005 Report
• 3/15 – Unit 2 loud noise & Unit 4 explode
(06:00) Note - (JAEA – International Workshop, 2/22-23/2012) estimated release from Unit 2,
1E+17 Bq/h, 13:00-17:00, on March 15, toward NW, or about 10.8E+6 Ci total.
10
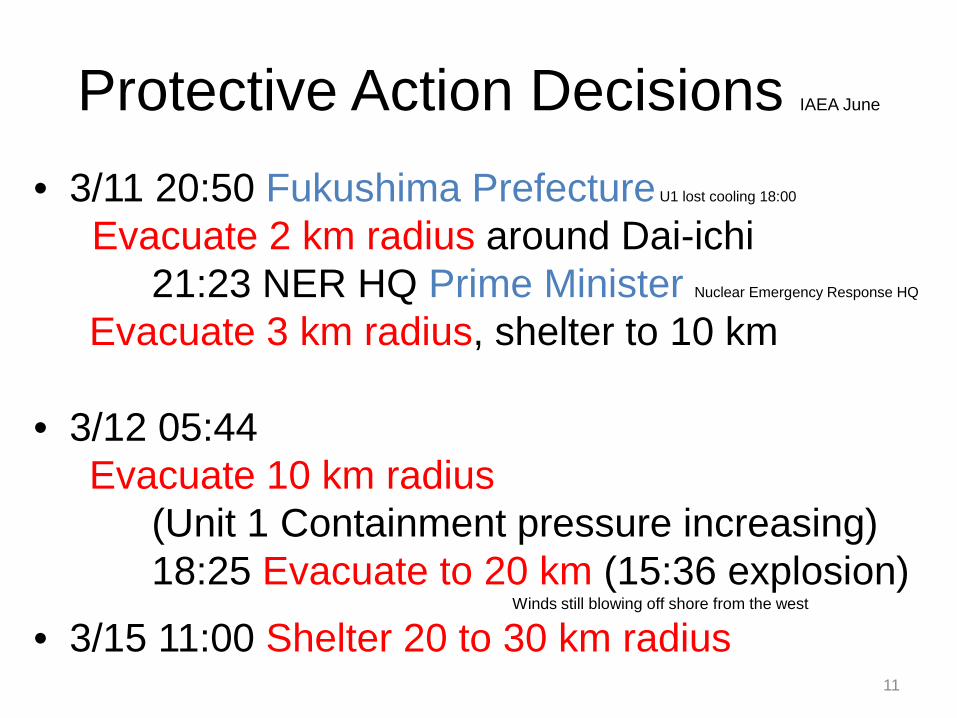
Protective Action Decisions IAEA June
• 3/11 20:50 Fukushima Prefecture U1 lost cooling 18:00
Evacuate 2 km radius around Dai-ichi 21:23 NER HQ Prime Minister Nuclear Emergency Response HQ
Evacuate 3 km radius, shelter to 10 km • 3/12 05:44 Evacuate 10 km radius (Unit 1 Containment pressure increasing) 18:25 Evacuate to 20 km (15:36 explosion) Winds still blowing off shore from the west
• 3/15 11:00 Shelter 20 to 30 km radius 11
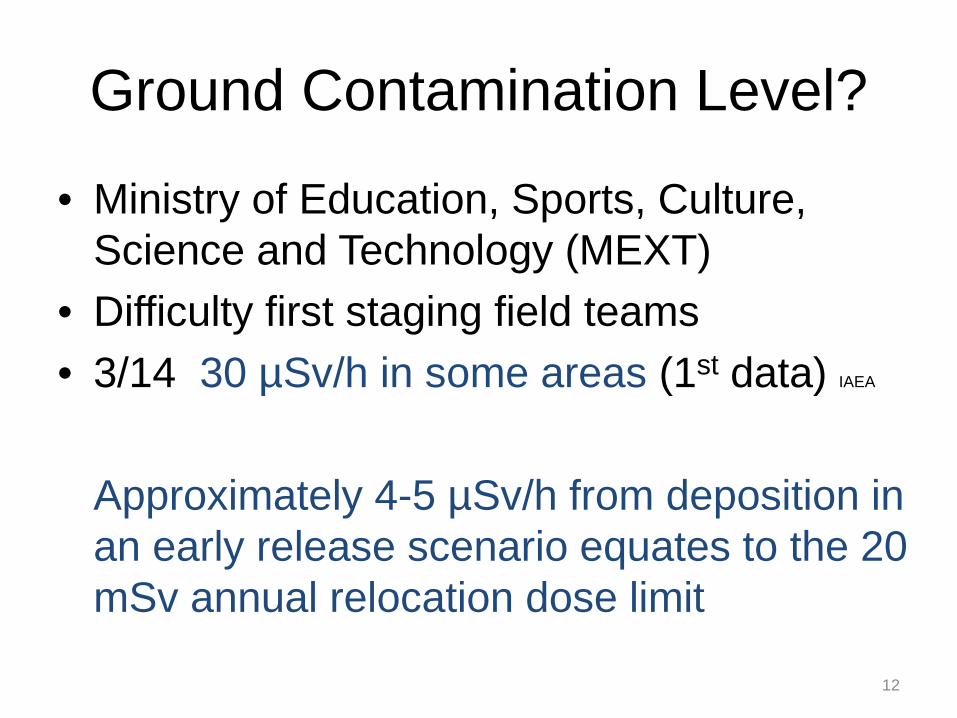
Ground Contamination Level?
• Ministry of Education, Sports, Culture, Science and Technology (MEXT)
• Difficulty first staging field teams • 3/14 30 µSv/h in some areas (1st data) IAEA
Approximately 4-5 µSv/h from deposition in
an early release scenario equates to the 20 mSv annual relocation dose limit
12
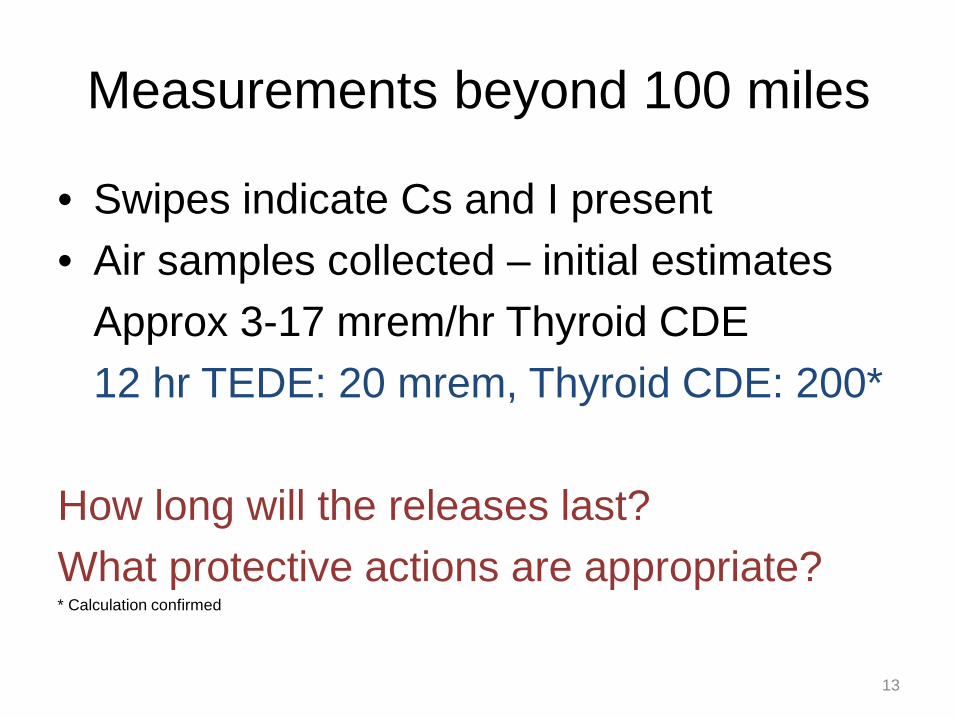
Measurements beyond 100 miles
• Swipes indicate Cs and I present • Air samples collected – initial estimates Approx 3-17 mrem/hr Thyroid CDE 12 hr TEDE: 20 mrem, Thyroid CDE: 200* How long will the releases last? What protective actions are appropriate? * Calculation confirmed
13
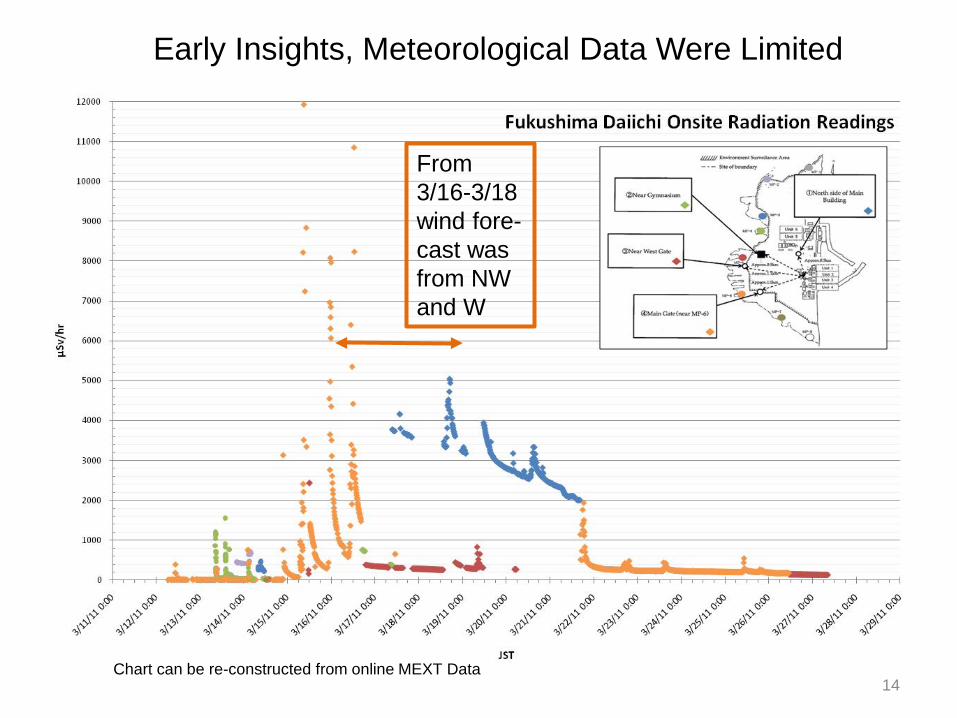
From 3/16-3/18 wind fore- cast was from NW and W
Chart can be re-constructed from online MEXT Data 14
Early Insights, Meteorological Data Were Limited
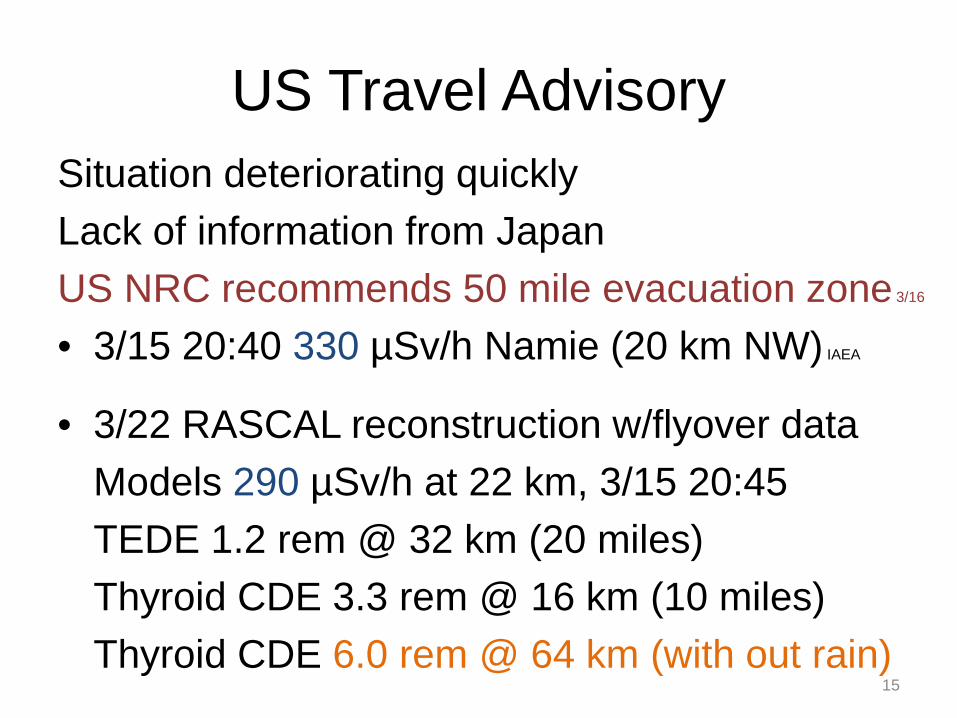
US Travel Advisory Situation deteriorating quickly Lack of information from Japan US NRC recommends 50 mile evacuation zone 3/16
• 3/15 20:40 330 µSv/h Namie (20 km NW) IAEA
• 3/22 RASCAL reconstruction w/flyover data Models 290 µSv/h at 22 km, 3/15 20:45 TEDE 1.2 rem @ 32 km (20 miles) Thyroid CDE 3.3 rem @ 16 km (10 miles) Thyroid CDE 6.0 rem @ 64 km (with out rain)
15
Coordination
• DOE\NARAC NRC sent parts of source terms to NARAC • Office of Science and Technology Policy • Naval Reactors • US Embassy in Japan • Other Federal Agencies • Canada\France\UK & others • 3/15 23:00 Japan officially accepts US help • DOE AMS deploys
16
RASCAL Modeling Limitations • Limited to assess 1 unit at a time • Limited: ad hoc approach to % fuel melt • Limited: 48 hour calculation (release) time Can’t view deposition/GR values beyond 48 h • Limited: 48 hour holdup time before release Containment Source term held up 24 h -> ~ 3% • Limited: only 1 fresh batch in SFP • No original saved case preservation • Saved cases did not identify creator
17
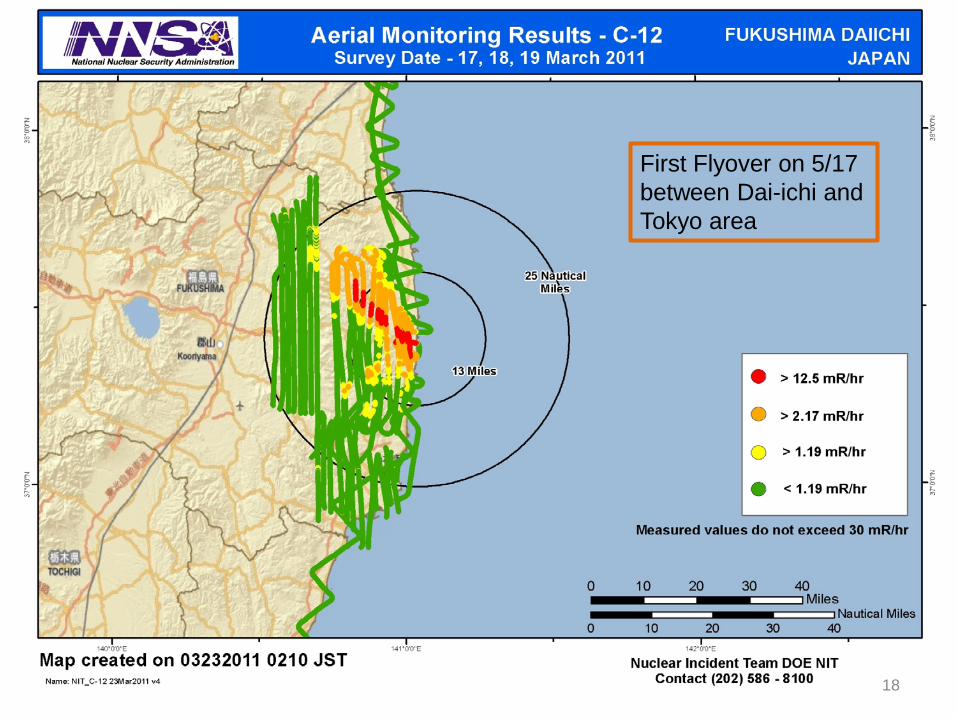
First Flyover on 5/17 between Dai-ichi and Tokyo area
18

U2 33% Core Damage/Melt based on Flyover Data Wind forecast was 12-14 mph toward NW for about 12 hrs during 3/15 PM
Light rain over 12 hours reduced long range impacts
RASCAL re-construction
19
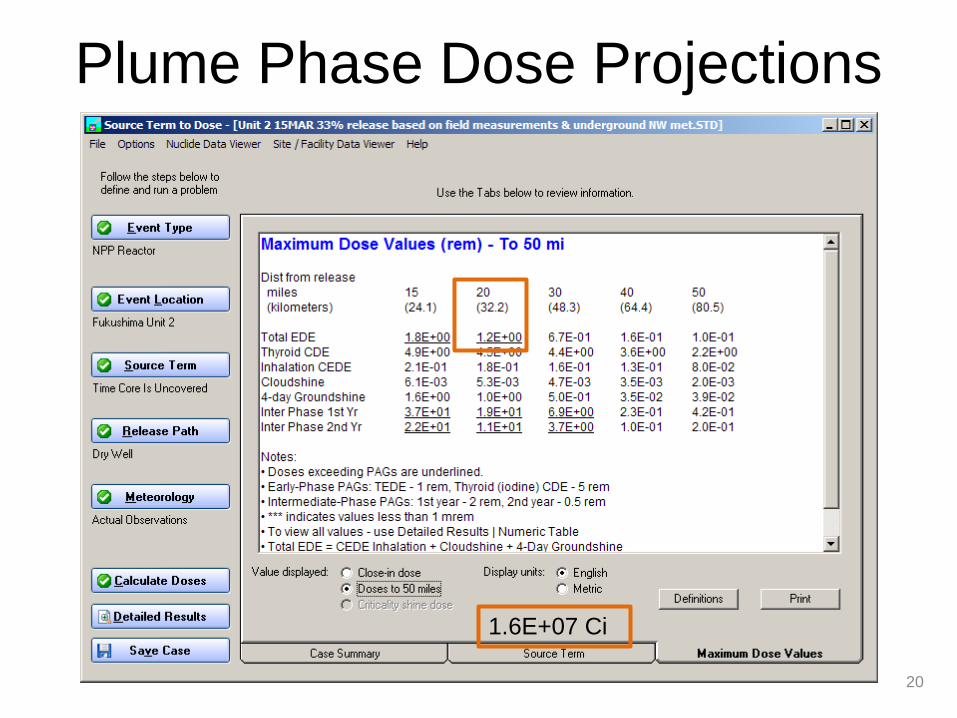
Plume Phase Dose Projections
20
1.6E+07 Ci
US Travel Advisory
• 3/16 DOS authorizes voluntary departure from US Embassy, Yokohama, other areas • 4/14 lifted voluntary departure allowing US
dependants to return • “We continue to recommend that U.S.
citizens avoid travel within the 50-mile radius of the Fukushima Daiichi Nuclear Plant. U.S. citizens who are still within this radius should evacuate or shelter in place.” 3/16/2011 NRC press release
21

Deliberate Evacuation
Area 4/22 30 days to move out
Evacuation
Prepared Areas By 3/22 Hospital and Nursing Homes relocated
voluntary evacuation requested of others (lifted September 30)
Evacuation Area
4/22 Restricted with Penalties
22
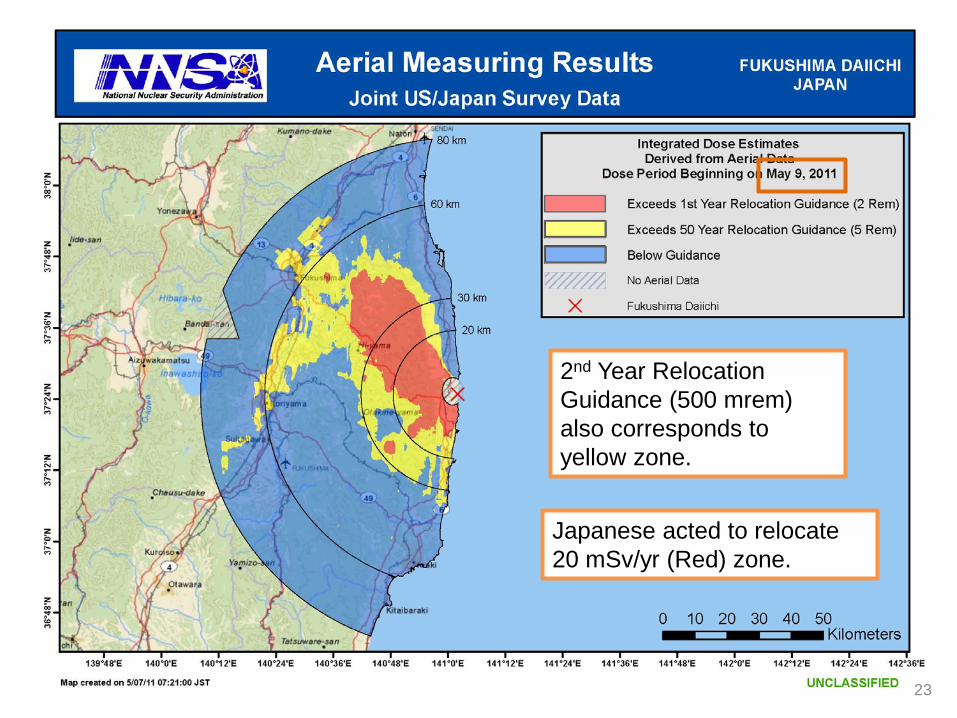
2nd Year Relocation Guidance (500 mrem) also corresponds to yellow zone.
Japanese acted to relocate 20 mSv/yr (Red) zone.
23
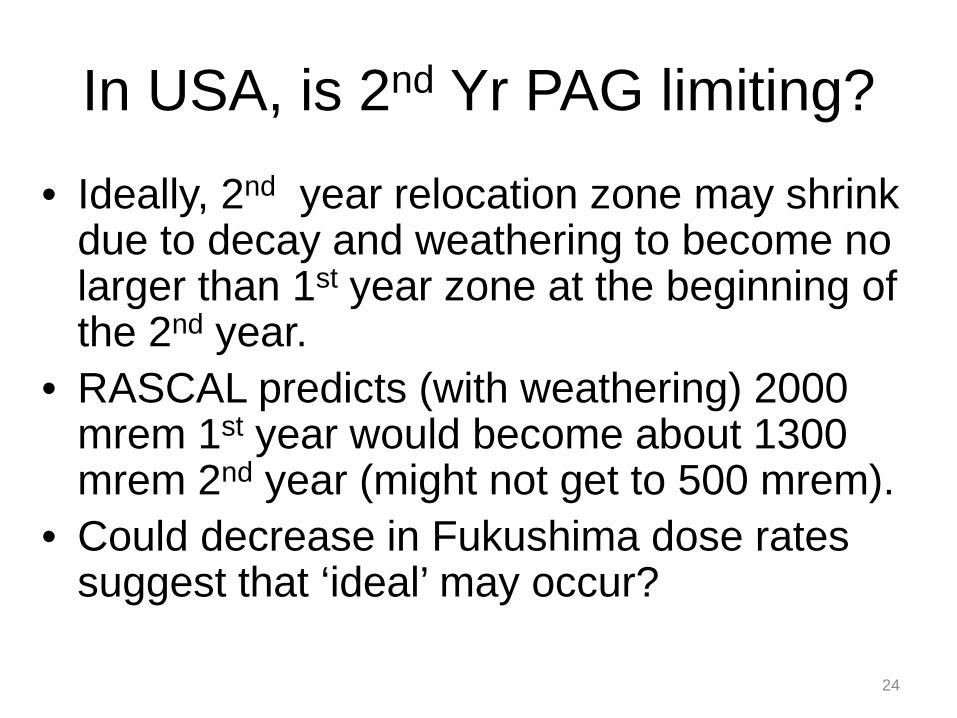
In USA, is 2nd Yr PAG limiting?
• Ideally, 2nd year relocation zone may shrink due to decay and weathering to become no larger than 1st year zone at the beginning of the 2nd year.
• RASCAL predicts (with weathering) 2000 mrem 1st year would become about 1300 mrem 2nd year (might not get to 500 mrem).
• Could decrease in Fukushima dose rates suggest that ‘ideal’ may occur?
24

Soil Sample (5/1, released 5/31) Sample Data Sample ID: Oaza 7 km W Sample desc: Soil Sample type: Ground concentrations Nuclide Ground Conc ( Bq/m²) I-131 1.73E+06 Cs-137* 1.20E+06 Cs-134 1.20E+06 Cs-136 2.09E+04 Sr-89 3.12E+03 Sr-90 6.00E+02 Te-129m 1.75E+06
Intermediate Phase Doses ( rem) 1st Yr Exposure 1st Year 2nd Year 50 Years with Delay Groundshine 5.35E+00 3.58E+00 3.55E+01 4.76E+00 Inhalation 5.88E-04 2.99E-05 8.74E-04 8.27E-05 Total 5.35E+00 3.58E+00 3.55E+01 4.76E+00 Notes Reentry delay was 90 days 1st year PAG = 2 rem, 2nd year objective = 0.5 rem, 50 year objective = 5 rem
Soil samples were taken by MEXT, 5 cm diameter, 15 cm deep. Lab results were converted to surface deposition and modeled with RASCAL
25
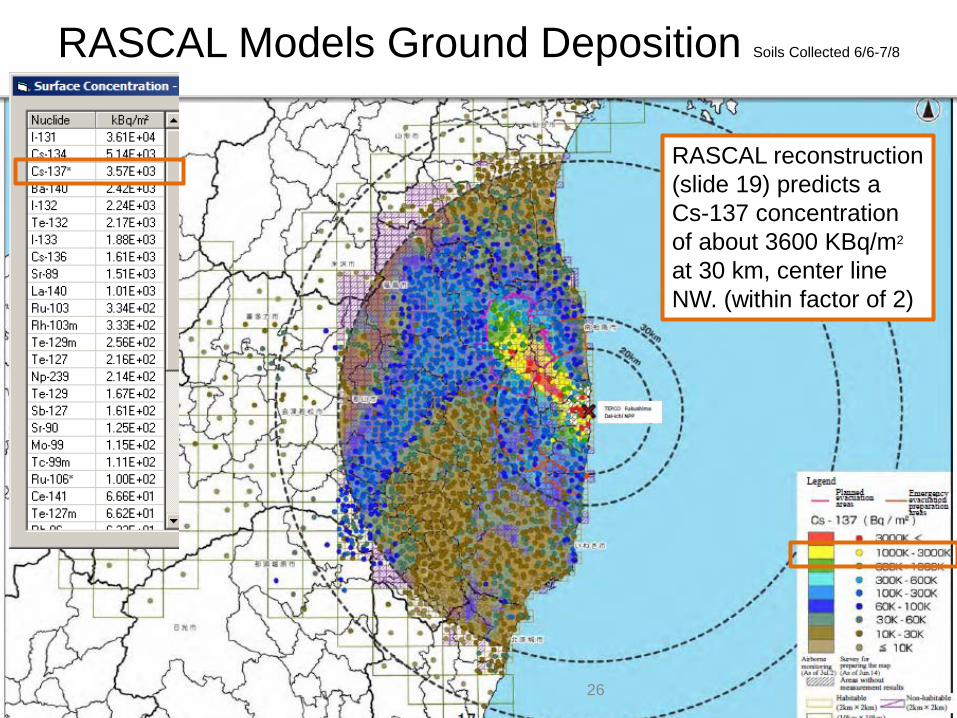
RASCAL Models Ground Deposition Soils Collected 6/6-7/8
RASCAL reconstruction (slide 19) predicts a Cs-137 concentration of about 3600 KBq/m2 at 30 km, center line NW. (within factor of 2)
26
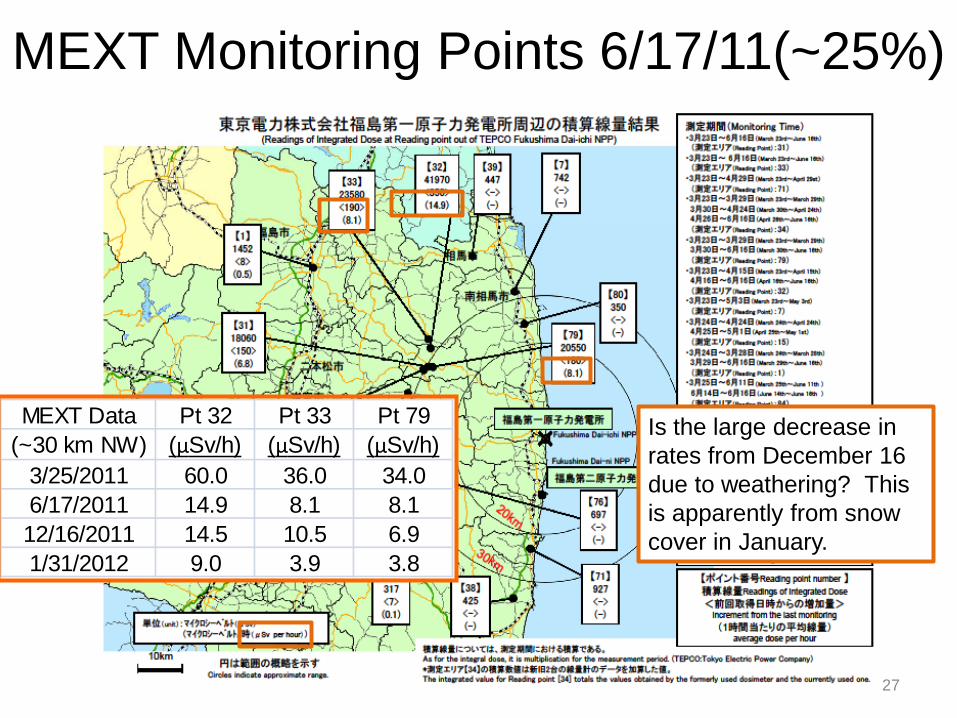
MEXT Monitoring Points 6/17/11(~25%)
27
MEXT Data Pt 32 Pt 33 Pt 79(~30 km NW) (µSv/h) (µSv/h) (µSv/h)
3/25/2011 60.0 36.0 34.06/17/2011 14.9 8.1 8.112/16/2011 14.5 10.5 6.91/31/2012 9.0 3.9 3.8
Is the large decrease in rates from December 16 due to weathering? This is apparently from snow cover in January.
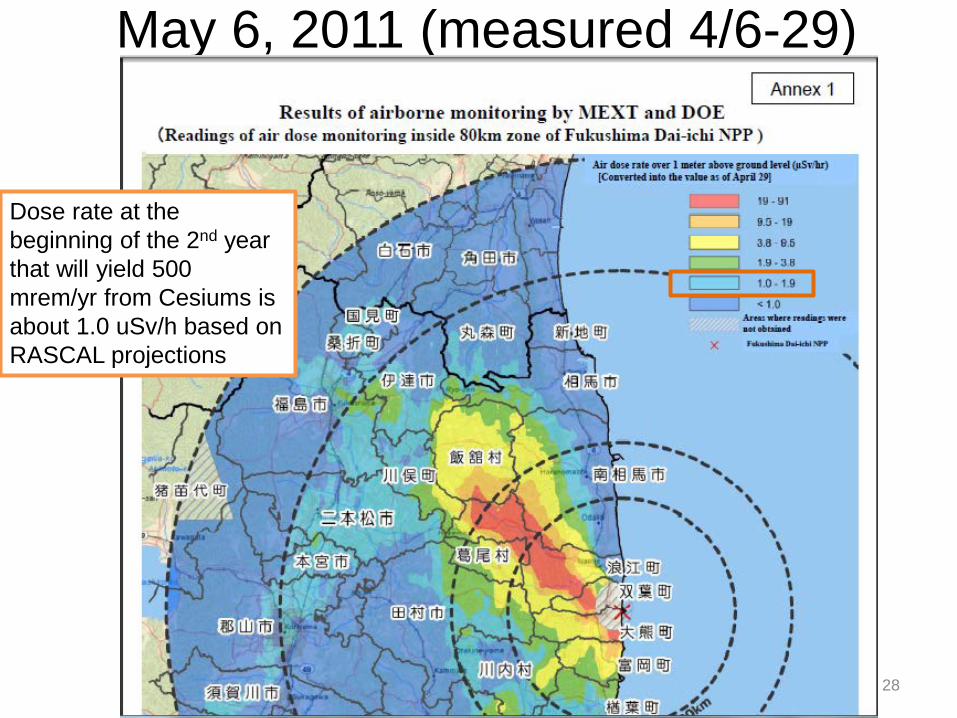
May 6, 2011 (measured 4/6-29)
Dose rate at the beginning of the 2nd year that will yield 500 mrem/yr from Cesiums is about 1.0 uSv/h based on RASCAL projections
28
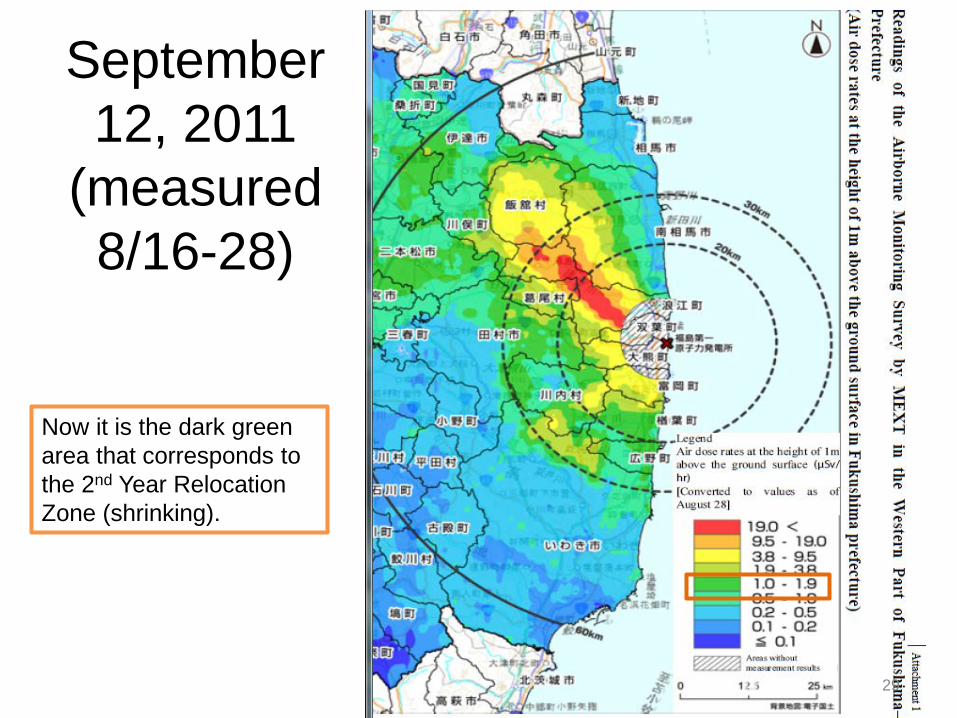
September 12, 2011
(measured 8/16-28)
Now it is the dark green area that corresponds to the 2nd Year Relocation Zone (shrinking).
29
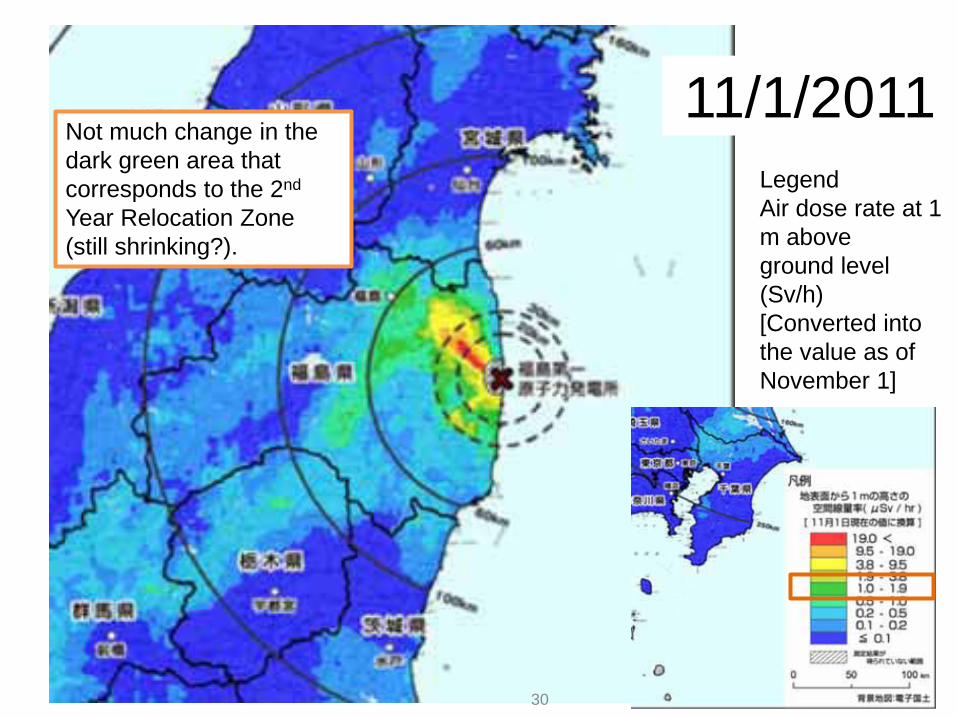
11/1/2011 Legend Air dose rate at 1 m above ground level (Sv/h) [Converted into the value as of November 1]
Not much change in the dark green area that corresponds to the 2nd Year Relocation Zone (still shrinking?).
30

Factoring in weathering and a 40% sheltering credit for time indoors, additional 2nd year relocation concerns are minor.
31
Figure 6: Areas corresponding guidance for relocation in the first year and any year after the first year where it has been assumed that there is some reduction in dose because of time spent indoors. It is assumed that the dose
integration time for the first year would span from 15 November 2011 through 14 November 2012.
Relocation Decision Practice
• Relocate 1st year zone based on 2 rem/yr • Can predict where 2nd year may be exceeded • But may underestimate all reduction effects • May be premature to relocate 2nd year zone
at the beginning of the 1st year. • Helpful government and public remediation
efforts may occur. • Higher dose levels may be acceptable for the
circumstances 32
50 Mile Zone – Relaxation • 5/16 US Updates Travel Advisory Highway and Train, Tokyo to Sendai, Open • 6/6, Coast Guard announced vessels should avoid
transiting waters within 20 km (relaxed 50 mile - water) • 7/19 Sendai airport cleared for US citizen use • US DOS, Oct 7, 2011: “Based on current data from
Japan, we recommend that U.S. citizens avoid all unnecessary travel to areas within 20 kilometers of the Fukushima Daiichi Nuclear Plant. In addition, U.S. citizens should avoid all unnecessary travel to the area northwest of the plant that the Government of Japan has designated as the “Deliberate Evacuation Area.”
33
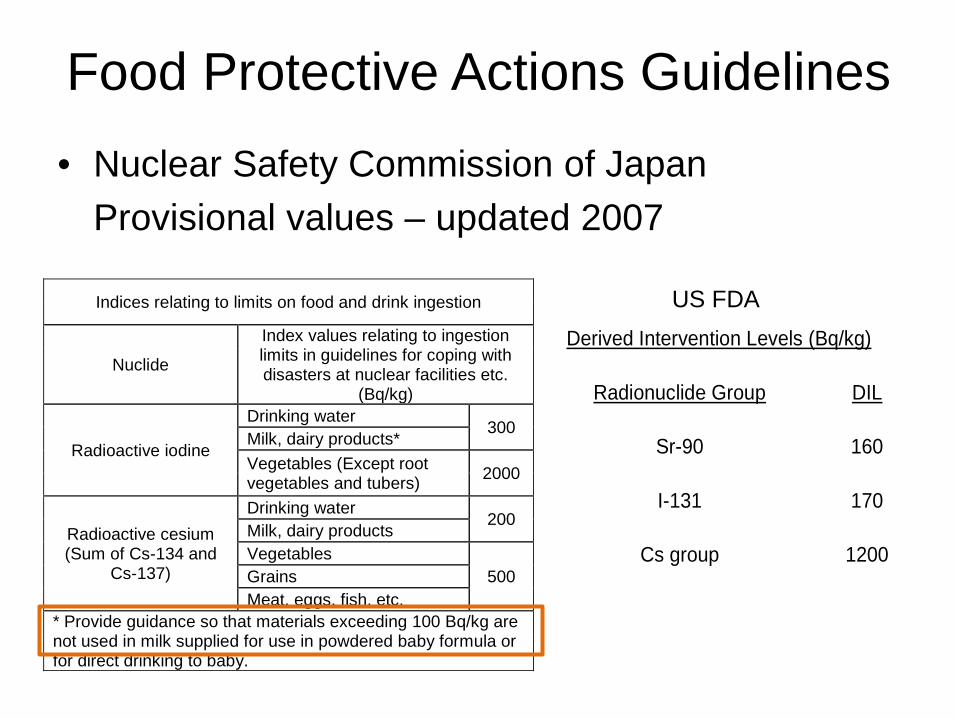
Food Protective Actions Guidelines • Nuclear Safety Commission of Japan Provisional values – updated 2007
Indices relating to limits on food and drink ingestion
Nuclide
Index values relating to ingestion limits in guidelines for coping with disasters at nuclear facilities etc.
(Bq/kg)
Radioactive iodine
Drinking water 300
Milk, dairy products* Vegetables (Except root vegetables and tubers) 2000
Radioactive cesium (Sum of Cs-134 and
Cs-137)
Drinking water 200
Milk, dairy products Vegetables
500 Grains Meat, eggs, fish, etc.
* Provide guidance so that materials exceeding 100 Bq/kg are not used in milk supplied for use in powdered baby formula or for direct drinking to baby.
Derived Intervention Levels (Bq/kg)
Radionuclide Group DIL
Sr-90 160
I-131 170
Cs group 1200
US FDA

Samples – Water • 3/23 Press Release ○Water supply exceeding the level of the
“Index values for infants (radioactive iodine)” (Reference 3): Kawamata-machi (town) Water Supply Utility: 1 point, 174 Bq/kg (on March 21 – 59 km NW), Minamisoma-shi (city) Water Supply Utility: 1 point, 137 Bq/kg (March 21 – 29 km N), and Iwaki-shi (city) Water Supply Utility: 1 point, 103 Bq/kg (March 21 – 52 km S)
• Water supply exceeding the “Index values for infants (radioactive iodine)” (Reference 3): Kanamachi Treatment Plant (1 point, 210 Bq/kg (March 22 – 238 km SW))
• After receiving the survey results, the Ministry of Health, Labour, and Welfare (MHLW)
requested that Iwaki-shi (city) and Tokyo Metropolitan Government inform their residents using water supply in the relevant areas in Iwaki-shi (city) and Tokyo to refrain from having infants intake tap water (including giving infants formula milk dissolved by tap water, etc.) today.
City Distance Water (km) (Bq/kg) Kawanata-machi 59 NW 174 Minamisoma-shi 29 N 137 Iwaki-shi 52 S 103 Kanamachi 238 SW 210?
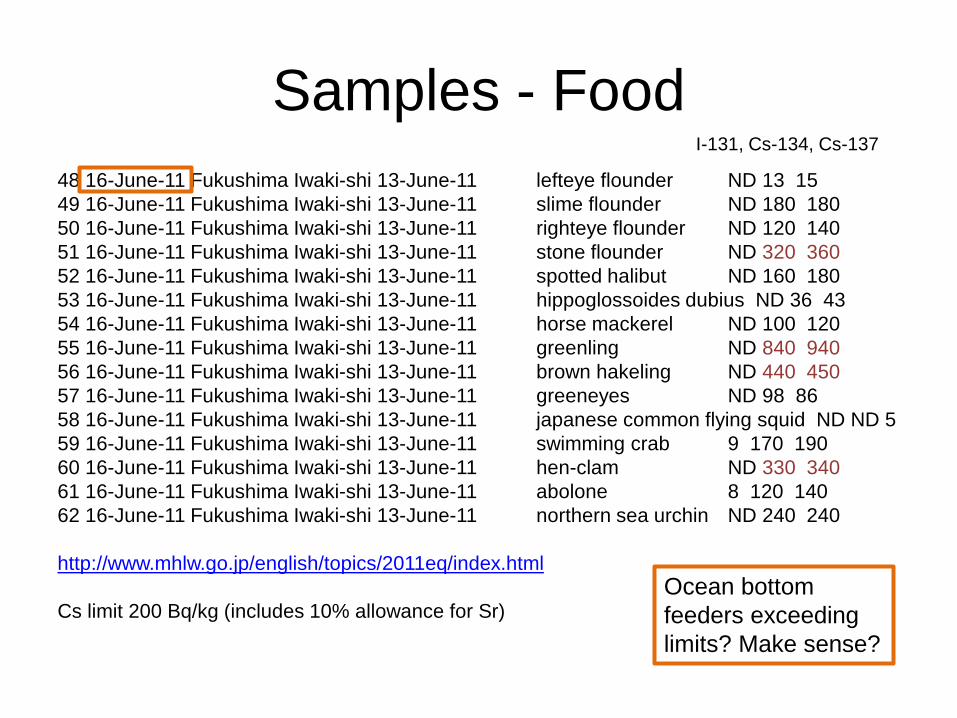
Samples - Food 48 16-June-11 Fukushima Iwaki-shi 13-June-11 lefteye flounder ND 13 15 49 16-June-11 Fukushima Iwaki-shi 13-June-11 slime flounder ND 180 180 50 16-June-11 Fukushima Iwaki-shi 13-June-11 righteye flounder ND 120 140 51 16-June-11 Fukushima Iwaki-shi 13-June-11 stone flounder ND 320 360 52 16-June-11 Fukushima Iwaki-shi 13-June-11 spotted halibut ND 160 180 53 16-June-11 Fukushima Iwaki-shi 13-June-11 hippoglossoides dubius ND 36 43 54 16-June-11 Fukushima Iwaki-shi 13-June-11 horse mackerel ND 100 120 55 16-June-11 Fukushima Iwaki-shi 13-June-11 greenling ND 840 940 56 16-June-11 Fukushima Iwaki-shi 13-June-11 brown hakeling ND 440 450 57 16-June-11 Fukushima Iwaki-shi 13-June-11 greeneyes ND 98 86 58 16-June-11 Fukushima Iwaki-shi 13-June-11 japanese common flying squid ND ND 5 59 16-June-11 Fukushima Iwaki-shi 13-June-11 swimming crab 9 170 190 60 16-June-11 Fukushima Iwaki-shi 13-June-11 hen-clam ND 330 340 61 16-June-11 Fukushima Iwaki-shi 13-June-11 abolone 8 120 140 62 16-June-11 Fukushima Iwaki-shi 13-June-11 northern sea urchin ND 240 240 http://www.mhlw.go.jp/english/topics/2011eq/index.html Cs limit 200 Bq/kg (includes 10% allowance for Sr)
I-131, Cs-134, Cs-137
Ocean bottom feeders exceeding limits? Make sense?
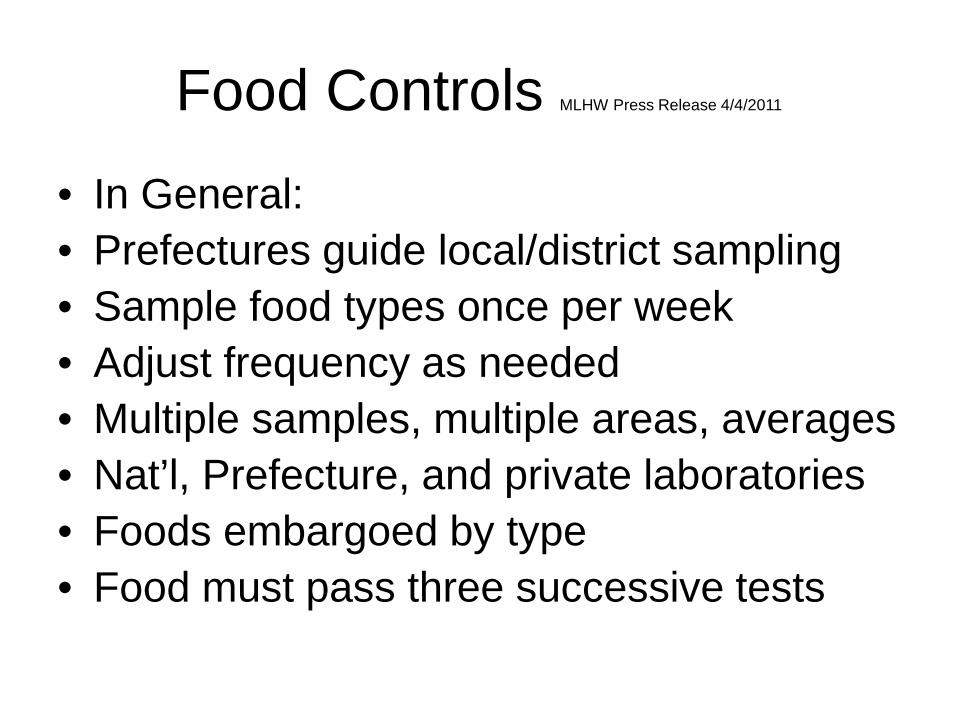
Food Controls MLHW Press Release 4/4/2011
• In General: • Prefectures guide local/district sampling • Sample food types once per week • Adjust frequency as needed • Multiple samples, multiple areas, averages • Nat’l, Prefecture, and private laboratories • Foods embargoed by type • Food must pass three successive tests

Fukushima City – Asian Leaders Japan Times 5/22
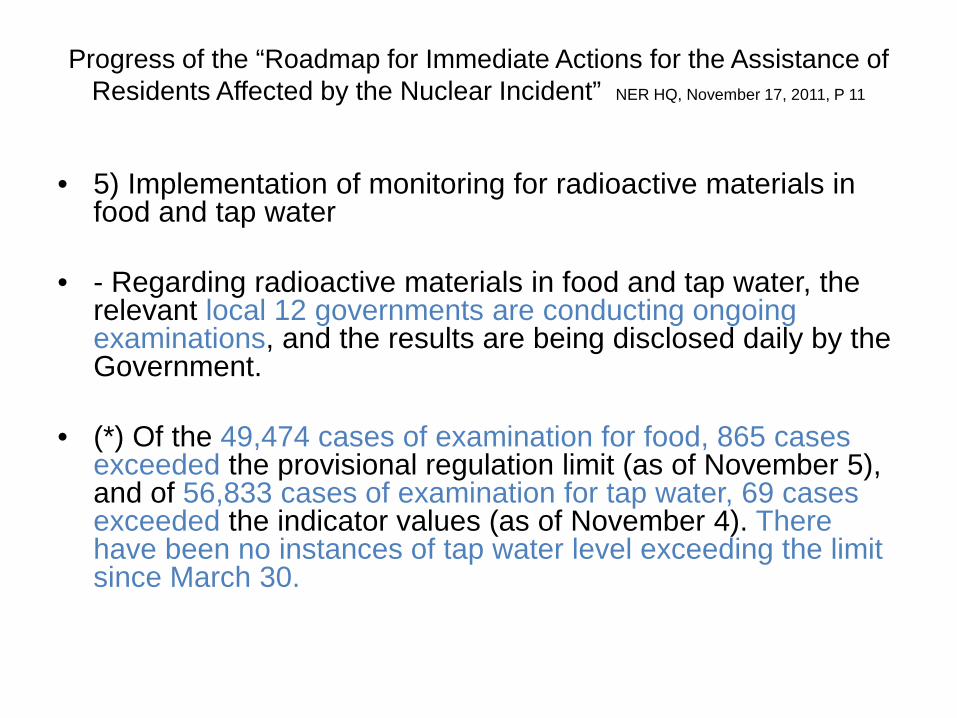
Progress of the “Roadmap for Immediate Actions for the Assistance of Residents Affected by the Nuclear Incident” NER HQ, November 17, 2011, P 11
• 5) Implementation of monitoring for radioactive materials in food and tap water
• - Regarding radioactive materials in food and tap water, the
relevant local 12 governments are conducting ongoing examinations, and the results are being disclosed daily by the Government.
• (*) Of the 49,474 cases of examination for food, 865 cases
exceeded the provisional regulation limit (as of November 5), and of 56,833 cases of examination for tap water, 69 cases exceeded the indicator values (as of November 4). There have been no instances of tap water level exceeding the limit since March 30.
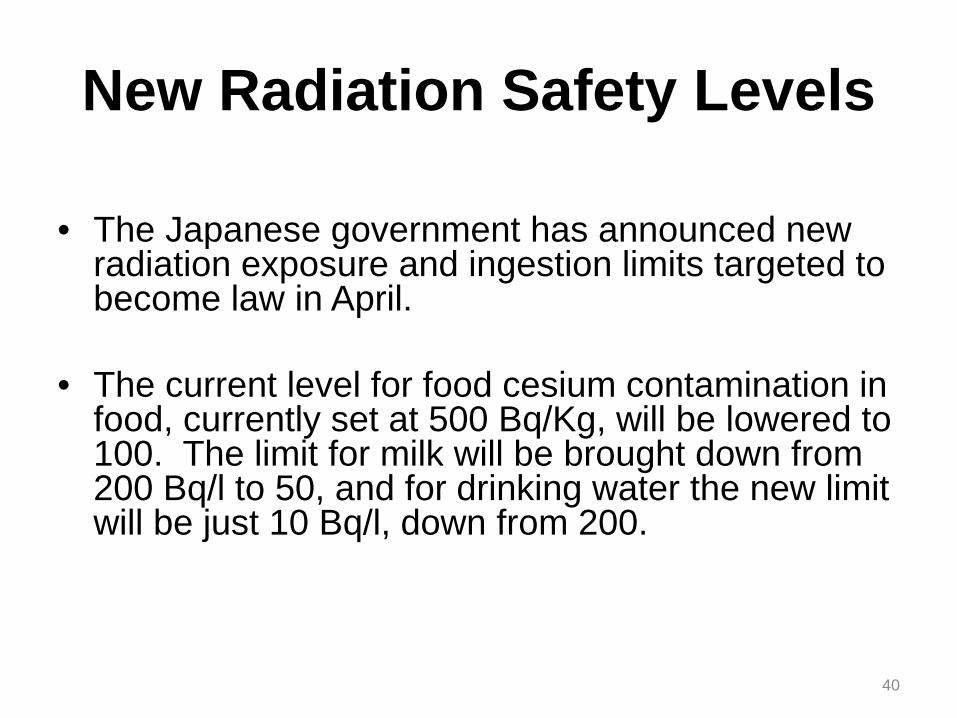
New Radiation Safety Levels • The Japanese government has announced new
radiation exposure and ingestion limits targeted to become law in April.
• The current level for food cesium contamination in food, currently set at 500 Bq/Kg, will be lowered to 100. The limit for milk will be brought down from 200 Bq/l to 50, and for drinking water the new limit will be just 10 Bq/l, down from 200.
40
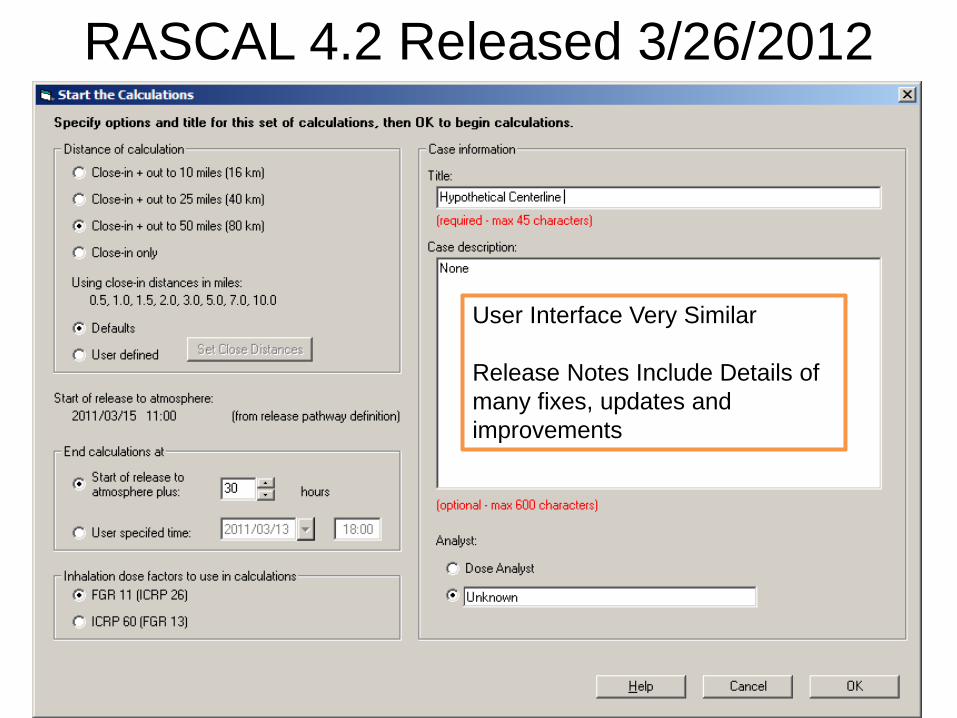
RASCAL 4.2 Released 3/26/2012
41
User Interface Very Similar Release Notes Include Details of many fixes, updates and improvements

• Intermediate Phase Doses (rem)
• Pathway 1st Year 2nd Year 50 Years • Groundshine (FGR-12) 1.58E+00 1.08E+00 1.08E+01 • Submersion (FGR-12) 4.41E-05 2.70E-07 4.55E-05 • Effective Inhalation (FGR-11) 2.48E-03 1.63E-05 2.59E-03
Total 1.59E+00 1.08E+00 1.08E+01
• Delay TEDE Remainder (rem) • Before 168 h/wk in area with 0% in bldg • Return 1st Year 2nd Year 50 Year • 0 d 1.59E+00 1.08E+00 1.08E+01 • 1 d 1.58E+00 1.08E+00 1.08E+01 • 2 d 1.58E+00 1.08E+00 1.07E+01 • 4 d 1.56E+00 1.08E+00 1.07E+01 • 7 d 1.55E+00 1.08E+00 1.07E+01 • 10 d 1.53E+00 1.08E+00 1.07E+01 • 14 d 1.51E+00 1.08E+00 1.07E+01 • 30 d 1.43E+00 1.08E+00 1.06E+01 • 60 d 1.28E+00 1.08E+00 1.05E+01 • 90 d 1.13E+00 1.08E+00 1.03E+01 • 180 d 7.21E-01 1.08E+00 9.89E+00 • 270 d 3.52E-01 1.08E+00 9.52E+00 • 1. y 0.00E+00 1.08E+00 9.17E+00 • 1.25 y 7.76E-01 8.86E+00 • 1.5 y 4.96E-01 8.58E+00 • 1.75 y 2.36E-01 8.32E+00 • 2. y 0.00E+00 8.09E+00 • 3. y 7.30E+00 • 4. y 6.70E+00 • 5. y 6.21E+00 • 10. y 4.62E+00 • 20. y 2.73E+00 • 30. y 1.47E+00 • 40. y 6.00E-01
42
FM Dose screen Example 10 µCi/m2 Cs-137* and 10 µCi/m2 Cs-134 Return after 10 years would yield less than 5 rem in next 40 years.

RASCAL TurboFRMAC Consistency
43

Different Iodine DCFs
• The iodine DCFs are different because the RASCAL Iodine
DCFs are a weighted average of the 1 micron particle DCFs (25%) and the vapor DCFs (75%) whereas the TF 2011 DCFs are the 1 micron particle DCFs.
• The weighting of the vapor and particle DCFs in RASCAL is
based on the RASCAL assumption related to the forms of iodine in the environment [25% particle, 35% reactive gas (e.g. I2) , 40% non-reactive gas (CH3I)].
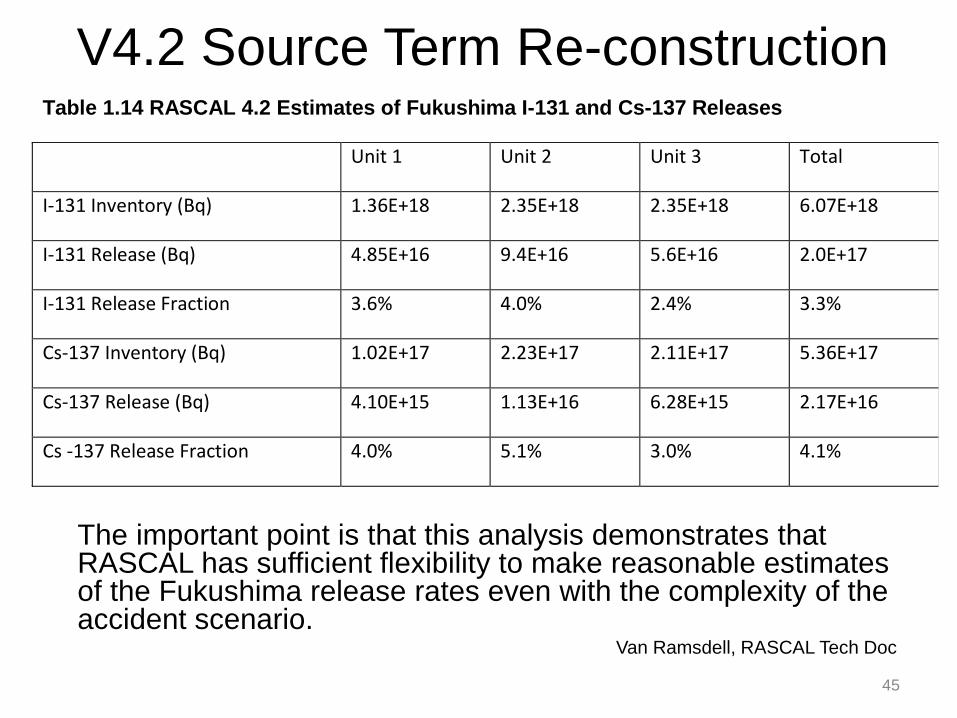
V4.2 Source Term Re-construction
The important point is that this analysis demonstrates that RASCAL has sufficient flexibility to make reasonable estimates of the Fukushima release rates even with the complexity of the accident scenario.
Van Ramsdell, RASCAL Tech Doc
45
Table 1.14 RASCAL 4.2 Estimates of Fukushima I-131 and Cs-137 Releases
Unit 1 Unit 2 Unit 3 Total
I-131 Inventory (Bq) 1.36E+18 2.35E+18 2.35E+18 6.07E+18
I-131 Release (Bq) 4.85E+16 9.4E+16 5.6E+16 2.0E+17
I-131 Release Fraction 3.6% 4.0% 2.4% 3.3%
Cs-137 Inventory (Bq) 1.02E+17 2.23E+17 2.11E+17 5.36E+17
Cs-137 Release (Bq) 4.10E+15 1.13E+16 6.28E+15 2.17E+16
Cs -137 Release Fraction 4.0% 5.1% 3.0% 4.1%
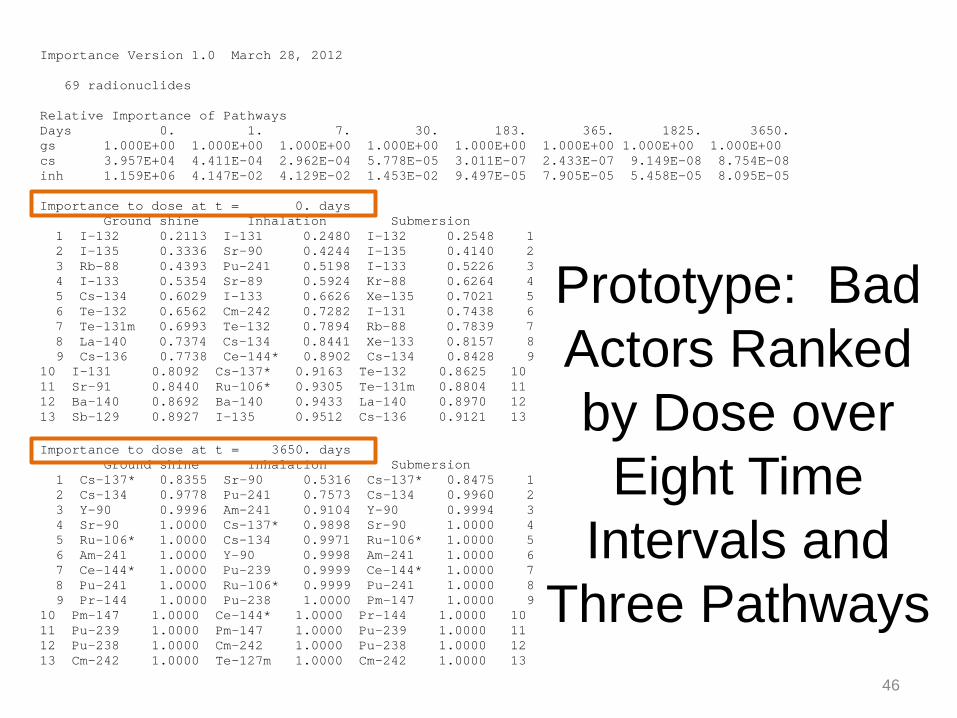
Prototype: Bad Actors Ranked by Dose over
Eight Time Intervals and
Three Pathways 46
Importance Version 1.0 March 28, 2012 69 radionuclides Relative Importance of Pathways Days 0. 1. 7. 30. 183. 365. 1825. 3650. gs 1.000E+00 1.000E+00 1.000E+00 1.000E+00 1.000E+00 1.000E+00 1.000E+00 1.000E+00 cs 3.957E+04 4.411E-04 2.962E-04 5.778E-05 3.011E-07 2.433E-07 9.149E-08 8.754E-08 inh 1.159E+06 4.147E-02 4.129E-02 1.453E-02 9.497E-05 7.905E-05 5.458E-05 8.095E-05 Importance to dose at t = 0. days Ground shine Inhalation Submersion 1 I-132 0.2113 I-131 0.2480 I-132 0.2548 1 2 I-135 0.3336 Sr-90 0.4244 I-135 0.4140 2 3 Rb-88 0.4393 Pu-241 0.5198 I-133 0.5226 3 4 I-133 0.5354 Sr-89 0.5924 Kr-88 0.6264 4 5 Cs-134 0.6029 I-133 0.6626 Xe-135 0.7021 5 6 Te-132 0.6562 Cm-242 0.7282 I-131 0.7438 6 7 Te-131m 0.6993 Te-132 0.7894 Rb-88 0.7839 7 8 La-140 0.7374 Cs-134 0.8441 Xe-133 0.8157 8 9 Cs-136 0.7738 Ce-144* 0.8902 Cs-134 0.8428 9 10 I-131 0.8092 Cs-137* 0.9163 Te-132 0.8625 10 11 Sr-91 0.8440 Ru-106* 0.9305 Te-131m 0.8804 11 12 Ba-140 0.8692 Ba-140 0.9433 La-140 0.8970 12 13 Sb-129 0.8927 I-135 0.9512 Cs-136 0.9121 13 Importance to dose at t = 3650. days Ground shine Inhalation Submersion 1 Cs-137* 0.8355 Sr-90 0.5316 Cs-137* 0.8475 1 2 Cs-134 0.9778 Pu-241 0.7573 Cs-134 0.9960 2 3 Y-90 0.9996 Am-241 0.9104 Y-90 0.9994 3 4 Sr-90 1.0000 Cs-137* 0.9898 Sr-90 1.0000 4 5 Ru-106* 1.0000 Cs-134 0.9971 Ru-106* 1.0000 5 6 Am-241 1.0000 Y-90 0.9998 Am-241 1.0000 6 7 Ce-144* 1.0000 Pu-239 0.9999 Ce-144* 1.0000 7 8 Pu-241 1.0000 Ru-106* 0.9999 Pu-241 1.0000 8 9 Pr-144 1.0000 Pu-238 1.0000 Pm-147 1.0000 9 10 Pm-147 1.0000 Ce-144* 1.0000 Pr-144 1.0000 10 11 Pu-239 1.0000 Pm-147 1.0000 Pu-239 1.0000 11 12 Pu-238 1.0000 Cm-242 1.0000 Pu-238 1.0000 12 13 Cm-242 1.0000 Te-127m 1.0000 Cm-242 1.0000 13

On the Horizon
• Standard Interface for importing or exporting of source terms.
• Prototype for processing multiple units • Restructure RASCAL to run for longer time
frames • Include State of the Art Reactor Consequence
Analysis (SOARCA) source terms • Improved alliance with NARAC and others
47
Questions
Lou Brandon 301-415-8013
Athey Consulting (304) 725-8834
48


