about the CounCil on energy, environment anD Water
The Council on Energy, Environment and Water (CEEW) is an independent nonprofit policy research institution that works to promote dialogue and common understanding on energy, environment, and water issues in India and elsewhere through high-quality research, partnerships with public and private institutions, and engagement with and outreach to the wider public. (http://ceew.in).
about the natural resourCes Defense CounCil
The Natural Resources Defense Council (NRDC) is an international non-profit environmental organization with more than 1.4 million members and online activists. Since 1970, our lawyers, scientists, and other environmental specialists have worked to protect the world’s natural resources, public health, and the environment. NRDC’s India Initiative on Climate Change and Clean Energy, launched in 2009, works with partners in India to help build a low-carbon, sustainable economy. For more information, visit www.nrdc.org.
We thank government officials from India’s Ministry of New and Renewable Energy (MNRE) and other Government of India agencies including former MNRE Secretary Dr. Satish Balram Agnihotri; Joint Secretary, Dr. Alok Srivastava and; Advisor (Energy), Planning Commission, Mr. Anil Jain. We would also like to thank the following peer reviewers: Tobias Engelmeier, Mohit Anand, Ritesh Pothan, Dan Adler, Gireesh Shrimali, Doug Sims and Pierre Bull. We sincerely appreciate the valuable contributions by the following students and NRDC fellows and staff: Nikhil Balasubramanian, Duke University (Stanback Fellow), Gaurav Bansal, Ariel Cooper, Mia Diawara, Stanford University (Summer MAP Fellow), and Lauren Sanchez, Yale University (Moran Fellow). We thank Dexter Consultancy for their assistance in data collection for the jobs survey. We also thank the following stakeholders for contributing to this report with their inputs: Belectric Photovoltaic India, Bridge To India, Gensol Consultants, Hero Future Energies, Juwi India Renewable Energies, Kiran Energy, L&T Construction, Ministry of New and Renewable Energy, Planning Commission of India, Reliance Power, Sharp Business Systems India, Solaire Direct, Solar Energy Corporation of India, Sterling & Wilson and The Energy and Resources Institute.
We would especially like to thank Shakti Sustainable Energy Foundation and our other funders for their generous support. This report is supported, in part, by Shakti Sustainable Energy Foundation. The views expressed and analysis in this document do not necessarily reflect views of the Foundation. The Foundation does not guarantee the accuracy of any data included in this publication nor does it accept any responsibility for the consequences of its use.
NRDC’s policy publications aim to inform and influence solutions to the world’s most pressing environmental and public health issues. For additional policy content, visit our online policy portal at www.nrdc.org/policy.
NRDC Director of Communications: Lisa BenensonNRDC Deputy Director of Communications: Lisa GoffrediNRDC Policy Publications Director: Alex KennaughCEEW Project Administration: Aarti KatyalCEEW Communications: Prachi GuptaDesign and Production: www.suerossi.com
i. eXeCutive summary .....................................................................................................................................................4
ii. the inDian solar market: an overvieW .................................................................................................................5
iii. initial estimates of solar Job Creation potential ............................................................................................6
international solar energy Jobs ......................................................................................................................................6
initial solar employment analysis in india .....................................................................................................................8
iv. solar employment Creation potential: primary researCh analysis ..........................................................9
analysis: interpretation of survey results ...................................................................................................................10
key findings and Discussion ........................................................................................................................................15
v. inDian solar poliCies anD impaCt on solar employment ..............................................................................16
vi. reCommenDations ....................................................................................................................................................17
table 2: key players in the indian solar market ................................... 5
table 3: berkeley report: Job-years per gWh for various energy sources in the u.s. ................................................. 6
table 4: reported number of international solar pv Jobs (2013) ...... 7
table 5: initial studies that estimate solar pv employment generated ................................................................... 8
table 6: employment generated During business Development ......11
table 7: employment generated During Design and pre-construction .............................................................................12
table 8: employment generated During Construction and Commissioning ........................................................................12
table 9: per-year employment generated During o&m .....................12
table 10: estimated fte of employment generated During business Development ......................................................13
table 11: estimated fte of employment generated During Design and pre-construction .............................................13
table 12: estimated fte of employment generated During Construction and Commissioning .....................................13
table 13: estimated fte of employment generated per year During operations and maintenance .............................14
table 14: estimated mW-scale solar pv employment ........................14
table 15: yearly solar installations, 2011–14 ....................................14
table 16: annual Jobs generated, 2011–14 ......................................14
figuresfigure 1: solar pv manufacturing value Chain ..................................... 6
figure 2: solar mW-scale project execution process ........................... 7
figure 3: study methodology .................................................................. 9
figure 4: percentage share of respondents by industry role ..............................................................................10
figure 5: percentage share of respondents by role Combination ......................................................................10
figure 6: percentage share of responses as per DiversificationofBusinessOutsideSolarinIndiaorAbroad ......10
figure 7: firm size based on number of employees ..........................11
figure 8: trend of project sizes in the market .....................................11
figure 9: person-days per mW generated During each phase .........................................................................15
tables anD figures
NRDC iNteRNatioNal: iNDia SolaR PoweR JobSpage 4
solar energy projects create green jobs and provide a boost to india’s developing economy. in a country where keeping up with the growing population’s increasing energy demands is daunting, harnessing this clean and renewable energy source can help meet energy needs in a sustainable way while providing new economic opportunities.1 solar photovoltaic (pv) is recognized as creating more jobs per unit of energy produced than any other energy source; thus it potentially represents a much needed solution to unemployment in the face of india’s burgeoning population and labor force.2
Currently a dearth of data exists on jobs created by the solar energy market in India. Unlike international counterparts, Indian solar companies do not report job creation numbers in press releases. An analysis of solar job creation thus far shows that this information gap needs to be addressed to reveal the full range of benefits of a successful solar PV market in India. Employment generation numbers can encourage broad political and public support for stronger solar financing and policies.
India experienced early success with the launch of its National Solar Mission (NSM or Mission), with solar PV power’s installed capacity increasing from 17.8 megawatts (MW) in early 2010 to approximately 2,650 MW in March 2014.3 As India ramps up its solar installations at a rapid rate during the second phase of its Mission, an opportunity exists to increase public support for this potentially transformative energy resource. One easy way to demonstrate the local benefits of clean energy is to publicize job creation numbers.
This report examines available data about employment generation in the Indian solar sector and analyzes the results of an industry employment survey distributed to solar companies. This report also examines existing solar policies and draws connections to employment to make specific recommendations on how best to shape policies to leverage the employment opportunity presented by the solar PV market in India.
key FindingS1. Solar energy creates employment opportunities
in India. Based on our initial primary research, we estimated that the solar market generated 23,884 cumulative jobs in the solar industry from 2011 to 2014 (solely from commissioned projects currently producing electricity). The construction and commissioning phase generates the most employment for a PV project.
2. India’s policy framework has led to increased solar deployment, creating jobs and increasing energy access. Smaller projects up to 5 MW in size may provide the most employment opportunities per MW. Targeted policies and clearer objectives may be more effective to accomplish diverse goals—solar deployment, job creation domestic solar manufacturing & human resource development.
3. Companies need to support the solar market by providing their projects’ job creation numbers. By tracking and reporting solar energy jobs numbers, business and policy makers can formulate better policies and programs and demonstrate the importance of renewable energy to the local economy.
Our research and analysis confirm that solar energy projects create many local jobs in India—both one-time jobs during the pre-commissioning construction phase and permanent operations and maintenance positions over the multi-decade life of the solar plant. Supporting the growth of the solar industry and the reporting of jobs numbers by local businesses can continue this promising trend. A robust solar market is instrumental in creating jobs in India’s developing economy in addition to providing renewable energy and increasing energy access.
i. eXeCutive summary
NRDC iNteRNatioNal: iNDia page 5Solar Power JobS
in 2010, the indian central government launched the Jawaharlal nehru national solar mission (nsm) to strive to make india a global leader in the solar energy market. the mission had multiple aims, including addressing india’s energy security challenges by creating a robust solar power market, and establishing india as a leader in the solar pv manufacturing industry.4
Policymakers and implementing agencies such as: n ministry of new and renewable energy (mnre)n indian renewable energy Development agency (ireDa)n state renewable Development agencies n Central electricity regulatory Commission (CerC)n state electricity regulatory Commission (serC)n national thermal power Corporation vidyut vyapar nigam (nvvn)n ministry of power (mop)n solar energy Corporation of india (seCi)
implementation
developers, manufacturers and installers such as: n manufacturers (cells, modules, balance of systems): moser baer, tata power solar, emmveen project Developers: azure power, green infra, mahindra, Welspunn engineering, procurement and Construction (epC) contractors: lanco infratech, mahindra epC, tata power solar
support n financiers: axis bank, iCiCi, us export import (eXim) bank, overseas private investment Corporation (opiC) n industry associations: solar energy society of india (sesi), indian solar manufacturers association (isma)n research & Development: solar energy Centre (seC), national Centre for photovoltaic research and education (nCpre)
Source: nrDC-CeeW research, June 2014.
Despite significantly growing installed solar capacity in 2013 to a total of more than 2.6 gigawatts (GW), India’s solar market is slowing.5 Delays in both NSM’s Phase 2 and state solar allocations have chilled the market. International trade disputes and anti-dumping duties on U.S. and Chinese solar imports are also contributing to the slump.6
Even with the delays, enthusiasm for the solar market remains high. Prospective project developers submitted projects worth more than 700 MW for the 250 MW allocation for the Phase 2, Batch 1 auction in late 2013. In July 2014, the Ministry of New and Renewable Energy (MNRE) announced a second Phase II, batch 2 auction for solar PV power.7
Ambitious plans have also been announced for four mega solar plants totalling 15,000 MW, though state government concerns may stall these plans.8 The solar ecosystem created during the NSM’s inaugural phase is continuing to incubate industry growth. Following the renewed momentum created by Phase 2’s strong launch, now is the time for strong leadership to reenergize the domestic solar market and recognize the spectrum of benefits that could result from a robust solar market ecosystem—included much needed employment opportunities in India.
international Solar energy JobSAccording to international market reports, solar PV creates a significant number of jobs. In fact, some studies indicate that the industry creates more jobs per unit of energy produced than any other energy source, particularly during the construction and installation of solar PV power plants.9 For example, a Berkeley report estimates that solar PV creates an average of 0.87 job-years per gigawatt-hour (GWh) in the U.S.10 By comparison, landfill gas energy creates an average of 0.72 job-year per GWh, wind energy an average of 0.17, nuclear 0.14, and natural gas and coal both 0.11.11 This analysis does not include jobs created through potentially huge sources such as global rooftop PV markets or other applications of power from solar energy, which could add significantly to the employment potential of solar.
iii. eXisting estimates of solar Job Creation potential
table 3: U.S. Job-years per gwh for various energy sources12
solar pv 0.87
LandfillGas 0.72
small hydro 0.27
geothermal 0.25
solar thermal 0.23
Wind 0.17
nuclear 0.14
Coal 0.11
natural gas 0.11
Source: max Wei, shana patadia, and Daniel kammen, Putting Renewables and Energy Efficiency to Work: How Many Jobs Can the Clean Energy Industry Generate in the U.S.? November2009,http://rael.berkeley.edu/sites/default/files/WeiPatadiaKammen_CleanEnergyJobs_EPolicy2010.pdf.
installationsolar panel
solar modulessolar CellsWafers
Figure 1: Solar PV manufacturing Value Chain16
material
ingot
manufacturing end-use
raw material(polysilicone)
Within the PV market, direct jobs are those created by firms that are directly focused on PV project execution: solar developers, EPC firms, and PV component manufacturers.13 In contrast, indirect jobs are created by businesses that provide more generic services to the PV industry, such as suppliers of raw materials for manufacturing, electricity suppliers, and public officers who deal with administration and finance.14
The PV manufacturing value chain consists of obtaining raw materials and producing system components for PV projects. Manufacturing firms obtain raw materials to manufacture into ingots, wafers, solar cells, and PV modules. Employment created includes operational jobs for engineers, warehouse employees, fabricators, administrators, financial analysts/accountants, lawyers, and sales executives.15
The Indian NSM’s domestic content requirement (DCR) for crystalline modules has not been conductive for growth of a domestic manufacturing base and has distorted the market towards the use of thin-film technology, jobs for which, have not been created domestically given the limited domestic capacity for manufacturing thin-film PV cells. For the purpose of this report, we have limited our analysis to the solar PV power plant implementation and operation and the jobs created exclusively as part of that process. We recognize that there are other jobs created in solar—such as manufacturing—and further research needs to be done to account for employment created from manufacturing and other solar sectors in India.
NRDC iNteRNatioNal: iNDia page 7Solar Power JobS
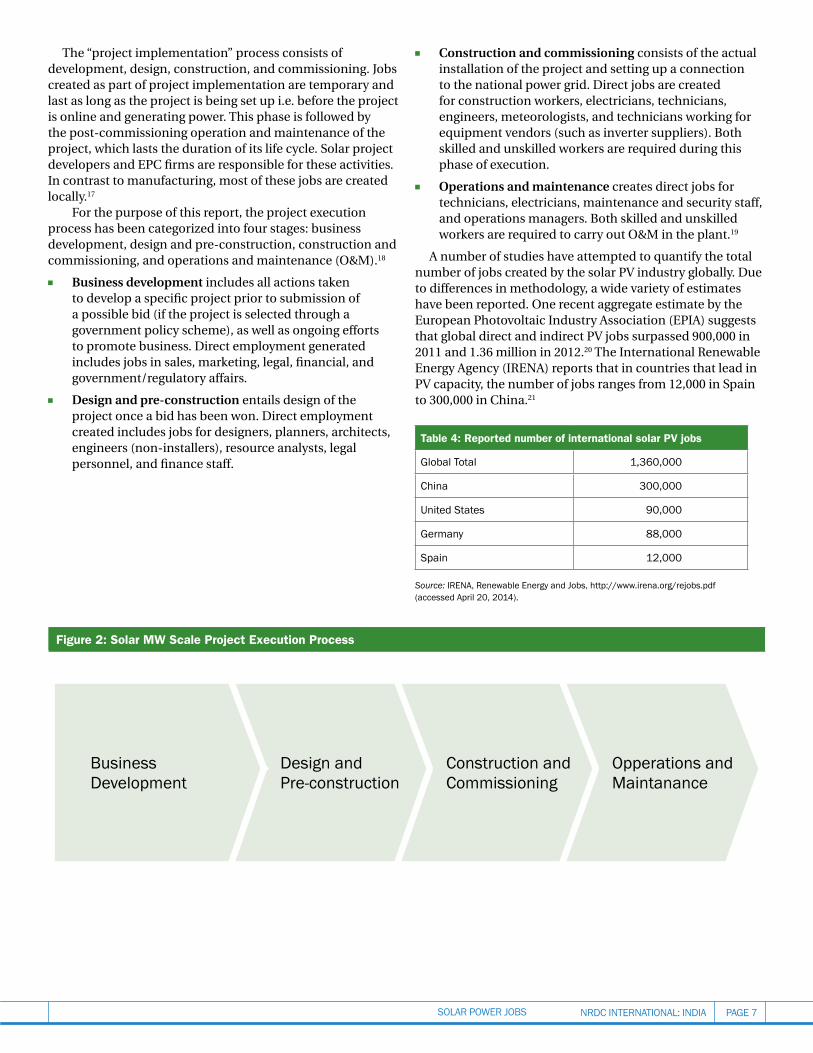
The “project implementation” process consists of development, design, construction, and commissioning. Jobs created as part of project implementation are temporary and last as long as the project is being set up i.e. before the project is online and generating power. This phase is followed by the post-commissioning operation and maintenance of the project, which lasts the duration of its life cycle. Solar project developers and EPC firms are responsible for these activities. In contrast to manufacturing, most of these jobs are created locally.17 For the purpose of this report, the project execution process has been categorized into four stages: business development, design and pre-construction, construction and commissioning, and operations and maintenance (O&M).18
n Business development includes all actions taken to develop a specific project prior to submission of a possible bid (if the project is selected through a government policy scheme), as well as ongoing efforts to promote business. Direct employment generated includes jobs in sales, marketing, legal, financial, and government/regulatory affairs.
n Design and pre-construction entails design of the project once a bid has been won. Direct employment created includes jobs for designers, planners, architects, engineers (non-installers), resource analysts, legal personnel, and finance staff.
n Construction and commissioning consists of the actual installation of the project and setting up a connection to the national power grid. Direct jobs are created for construction workers, electricians, technicians, engineers, meteorologists, and technicians working for equipment vendors (such as inverter suppliers). Both skilled and unskilled workers are required during this phase of execution.
n Operations and maintenance creates direct jobs for technicians, electricians, maintenance and security staff, and operations managers. Both skilled and unskilled workers are required to carry out O&M in the plant.19
A number of studies have attempted to quantify the total number of jobs created by the solar PV industry globally. Due to differences in methodology, a wide variety of estimates have been reported. One recent aggregate estimate by the European Photovoltaic Industry Association (EPIA) suggests that global direct and indirect PV jobs surpassed 900,000 in 2011 and 1.36 million in 2012.20 The International Renewable Energy Agency (IRENA) reports that in countries that lead in PV capacity, the number of jobs ranges from 12,000 in Spain to 300,000 in China.21
table 4: reported number of international solar PV jobs
global total 1,360,000
China 300,000
united states 90,000
germany 88,000
spain 12,000
Source: irena, renewable energy and Jobs, http://www.irena.org/rejobs.pdf (accessed april 20, 2014).
Figure 2: Solar mw Scale Project execution Process
initial Solar emPloyment analySiS in indiaGlobal estimates show that the solar PV market can create employment opportunities in India. The central government has cited employment generation as part of its rationale in launching the NSM, recognizing the “vast potential” for employment generation in the Indian renewable energy market. The NSM mission document, drafted in 2010, estimates that the solar industry will employ a minimum of 100,000 people (including engineers, managers, and researchers) by the end of 2022.22 The 2010 MNRE–Confederation of Indian Industry (CII) report estimates that the PV grid-connected sector will employ 152,000 people by 2020, assuming the NSM meets all targets.23 The report is enthusiastic about this prediction, noting that solar will “meet the social objective of creating new job opportunities.”24
Interestingly, there is a conspicuous lack of published analyses that estimate the employment generated by the Indian solar PV market thus far. The central government does not mandate the reporting of job-creation numbers, and unlike developers in many other countries, those in India do not report these numbers voluntarily. Conversely, in countries like the United States, jobs data is robustly reported voluntarily by companies—often becoming the top line message in press releases accompanying newly announced clean energy projects. Decisionmakers are more likely to strongly support future renewable energy policies because they can point to the increased employment opportunities as a strong reason for endorsement.
international best Practices: e2’s “Clean energy works for Us” initiative
as our review of currently available project information in india uncovered, solar project press releases and announcements in india hardly ever mention the resulting estimated job creation numbers. in several other countries, business and governments regularly track and report job creation numbers. for example, temporary and permanent jobs created by renewable energy projects are reported in press releases and other media outlets in the united states. nrDC’s partner organization, environmental entreprenuers (e2), tracks job announcements from companies, federal, state and local programs, the media and other sources through its initiative “Clean energy Works for us.”25 e2 can then take this information and provide in-depth analysis about how renewable energy is driving economic growth and creating clean jobs locally, even on a state-by-state basis.26
table 5: initial Studies that estimate Solar PV employment generated
Study year Jobs estimate
mnre—Cii “Human Resource Development Strategies of Indian Renewable Energy Sector”27
201076,000 direct & indirect jobs (as of 2010) 25,000 in manufacturing
lanco infratech ltd., SPV Power Technology in India28 2012
15 direct and indirect jobs per mW≈37,005jobs29
Jain & patwardhan “employment outcomes of renewable energy technologies: implications of policies in india,” Economic and Political Weekly30
20137.7 to 13 jobs per mW ≈19,000jobsto32,071jobs31
ministry of new and renewable energy estimate32 2013 50,000 direct jobs created
from 2010–2013
NRDC iNteRNatioNal: iNDia page 9Solar Power JobS
methodologyTo determine actual solar job market numbers, NRDC and CEEW developed a questionnaire aimed at capturing the current scenario of solar PV employment in India and used it to survey PV companies in India. The questionnaire was focused specifically on PV power plants and did not include jobs created as part of manufacturing and other solar sectors/applications in India.
First, the survey was conducted through an online tool and telephonic interviews, with limited results. To enhance the results, Dexter market research was retained to seek additional responses via telephone. Through a set of 16 questions, the survey solicited project- and policy-specific information to assess how many jobs have been created under national and state solar policies in India. Project-specific questions were categorized according to the stage of project execution (see Figure 2: Solar MW-Scale Project Execution Process). The questionnaire sought the following specific information from all respondents:
n Company overview: Business role within the solar industry (solar project developer, components manufacturer, or engineering/procurement/ construction (EPC))
n Energy generation/equipment manufacturing capacity of the company (in MW)
n Details about ongoing/recently completed solar projects and the policies under which they were commissioned
n Number of employees for the company as a whole, as well as project-specific distribution of skilled and unskilled employees across the stages of project execution
n Duration of the major phases of project execution (business development, design and pre-construction, construction and commissioning, and O&M)
n Details on special training or certification (if any) that was provided to skilled and unskilled employees
iv. solar employment Creation potential: primary researCh analysis
Figure 3: methodology followed for the study
iDentifiCation of stuDy obJeCtives
finalizing assumptions
Design of Questionnaire
ColleCtion of Data
analysis of Data reCeiveD through Questionnaires
one-to-one meetings With stakeholDers
reports anD reCommenDations
NRDC iNteRNatioNal: iNDia SolaR PoweR JobSpage 10
analySiS: interPretation oF SUrVey reSUltSThe survey was conducted electronically via email as well as by telephone. The questionnaire was distributed to 116 organizations operating in the solar industry in India—a mix of project developers, component and module manufacturers, and EPC companies. The survey yielded 25 usable responses, and these have been incorporated in the following analysis.
1. overlap of business roles anD serviCes offereD in the market
Of the 25 respondents, eleven respondents (44 percent) are multifunctional, carrying out more than one role in the industry. Nine respondents (36 percent) are pure project developers and do not manufacture or install solar PV plants. Two respondents (8 percent) perform only EPC activities, and three (12 percent) are solely manufacturers.
Additionally, 24 percent of all respondents are end-to-end turnkey solution providers or independent power producers (IPPs) that perform all three roles in the solar market—project development, component manufacturing, and EPC. And 16 percent of respondents represent companies providing a combination of project development and EPC services.
2. DiversifiCation of business
Interestingly, only 9 out of the 25 respondents (36 percent) operate strictly in the solar business. The other 16 respondents (64 percent) operate across various industries in India, and the major portion of their revenue does not come from their activities in the solar power market.
Of the respondents, 56 percent are organizations invested in large industries outside the power sector, including textiles, agriculture, manufacturing, and information technology. 48 percent perform more than one role even within the solar market. This means that they are part of a larger conglomerate or groups or companies and also may be a project developer and an EPC within the solar market. This complexity makes it difficult to clearly assess the number of jobs dedicated to solar power generation in India.
To address this challenge, this analysis estimates the number of full-time equivalent (FTE) jobs per MW created by MW-scale (>1,000 kW capacity) solar projects commissioned in India.
3. employee size of firms in the inDian solar market
Most surveyed companies were unable to provide precise numbers of employees dedicated to solar and offered estimates instead. While these numbers may be somewhat realistic, they are far from precise.
For the purposes of the analysis, we divided the responses on employee numbers into categories ranging from less than 50 to more than 300. Of the respondents, 39 percent have less than 50 employees. 9 companies out of 23 revealed an employee strength of less than 50. Out of these 9, 7 companies are project developers. The analysis shows that
Source: nrDC-CeeW analysis, June 2014
Source: nrDC-CeeW analysis, June 2014
Source: nrDC-CeeW analysis, June 2014
Figure 4: Percentage Share of respondents, by industry role
Figure 5: Percentage Share of respondents, by role Contribution
Figure 6: Percentage Share of responses as per diversification of business outside Solar in india or abroad
■ Multifunctional
■ Developers
■ Manufacturers
■ EPC
■ Invest only in solar
■ Invest only in power
■ Invest only in multiple industries
■ Developers
■ End-to end Service Providers/IPPs
■ Developers/EPC
■ Manufacturers
■ EPC
■ EPC/Manufacturers
44%
36%
12%
8%
4%8%
12%
16%
24%
36%
36%
8%
56%
■ Multifunctional
■ Developers
■ Manufacturers
■ EPC
■ Invest only in solar
■ Invest only in power
■ Invest only in multiple industries
■ Developers
■ End-to end Service Providers/IPPs
■ Developers/EPC
■ Manufacturers
■ EPC
■ EPC/Manufacturers
44%
36%
12%
8%
4%8%
12%
16%
24%
36%
36%
8%
56%
■ Multifunctional
■ Developers
■ Manufacturers
■ EPC
■ Invest only in solar
■ Invest only in power
■ Invest only in multiple industries
■ Developers
■ End-to end Service Providers/IPPs
■ Developers/EPC
■ Manufacturers
■ EPC
■ EPC/Manufacturers
44%
36%
12%
8%
4%8%
12%
16%
24%
36%
36%
8%
56%
NRDC iNteRNatioNal: iNDia page 11Solar Power JobS
the Indian solar market is mostly populated with project developers with employee strength of less than 50. As the market matures and opportunity expands, we foresee the possibility of such firms expanding their employee strength dedicated to solar projects.
4. proJeCt sizes trenD in the inDian market
The questionnaire sought specific employment-related information for actual projects that the organizations have commissioned. We plotted project capacities across the solar industry to see if any patterns would emerge. The results show that almost 60 percent of the respondents have projects of less than 10 MW capacity, and that out of these, most are developers with project capacities of 1 to 5 MW. The NSM places a cap on project capacities allocated to various developers. Clearly, that policy has driven the industry in the direction where most developers have projects of 5 MW or less.
5. employment generateD in eaCh phase of proJeCt implementation anD proJeCt operation
The responses we received included information on employment numbers specific to each phase of project execution (see Figure 2). As a first step to estimating job creation, we plotted the project capacities against the number of employees assigned or employed for each phase, and the duration of employment.
business developmentOrganizations employ three to five people for business development across various project capacities. Interestingly, our results show that the greatest number of employees per project in the business development phase are employed by companies that undertake projects of 1–5 MW capacity. The lower number of business development employees needed for larger projects can be explained by economies of scale—larger capacity projects are undertaken by larger firms with more financial backing and the capacity to employ more skilled teams of business development employees. These employees are permanent and make up part of the marketing department, with the inclusion of some senior managers in the organization’s hierarchy.
table 6: employment generated during business development
Project Capacity (mw) median number of Skilled employees per Project
median duration of employment per employee for Specific Project
1–5 5 75 days
5–10 3 135 days
10–25 3 105 days
> 25 3 150 days
Source: nrDC–CeeW survey, June 2014.
Source: nrDC-CeeW analysis, June 2014
Source: nrDC-CeeW analysis, June 2014
Figure 7: Firm size based on number of employees
Figure 8: trend of Projected Sizes in the market
■ <50
■ 50–100
■ 150–300
■ >300
39%
13%
31%
17%
■ 1 MW–5 MW
■ 5 MW–10 MW
■ 10 MW–25 MW
■ >25
36%
23%
27%
14%
■ <50
■ 50–100
■ 150–300
■ >300
39%
13%
31%
17%
■ 1 MW–5 MW
■ 5 MW–10 MW
■ 10 MW–25 MW
■ >25
36%
23%
27%
14%
NRDC iNteRNatioNal: iNDia SolaR PoweR JobSpage 12
design and Pre-constructionOrganizations employ between 7 and 12 employees for the design and pre-construction phase, depending on project capacity. These employees are mostly engineers and are part of the company’s permanent staff. Our results indicate
table 7: employment generated during design and Pre-construction
Project Capacity (mw) median number of Skilled employees per Project
median duration of employment per employee for Specific Project
< 5 7 90 days
5–10 12 90 days
10–25 7.5 60 days
> 25 7 120 days
Source: nrDC–CeeW survey, June 2014.
Construction and CommissioningDuring this phase, the duration of construction increases with an increase in capacity, as does the number of employees needed. The number of skilled, permanent employees involved in the construction and commissioning phase range from 12 to 30, depending on project capacity.
that most employment is generated by smaller projects with capacities of 10 MW and less. Larger projects employee fewer people, possibly explained by economies of scale.
Number of skilled employees needed rises slightly with increasing project capacity. This phase also requires unskilled employees that are hired just to complete this phase. The median number of unskilled employees ranges from 50 to 450 and increases from smaller to larger projects.
table 8: employment generated during Construction and Commissioning
Skilled Unskilled
Project Capacity (mw) median number of employees per Project
median duration of employment for Specific Project
median number of employees per Project
median duration of employment for Specific Project
1–5 20 120 days 50 100 days
5–10 12 105 days 105 150 days
10–25 25 90 days 70 65 days
> 25 30 150 days 450 210 days
Source: nrDC–CeeW survey, June 2014.
operations and maintenanceThe O&M for a project lasts from the time the project is commissioned until the end of the project’s life, typically 25 years. For this phase, numbers of employees are estimated on a per-year basis. The number of skilled, permanent employees involved in the O&M of a project ranges from 3 to 12 per year, depending on project capacity. The number of unskilled workers hired for O&M ranges from 7 to 30 per year, and most are hired permanently. According to our survey results, the number of employees engaged in O&M per year increases with an increase in project capacity.
table 9: employment generated during o&m
Project Capacity (mw)
median number of Skilled employees per
Project per year
median number of Unskilled employees per Project per year
1–5 3 7
5–10 6.5 21
10–25 4 10
> 25 12 30
Source: nrDC–CeeW survey, June 2014.
NRDC iNteRNatioNal: iNDia page 13Solar Power JobS
6. short term full time employment (fte) per mW generateD During eaCh phase of proJeCt implementation
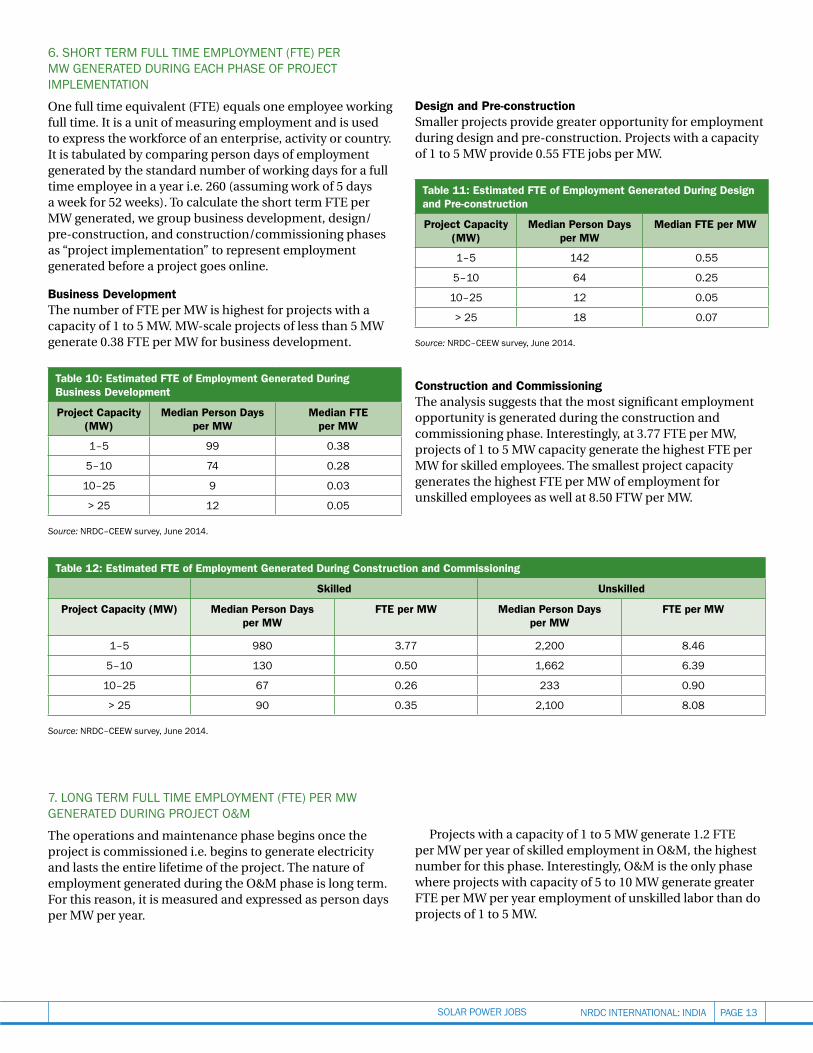
One full time equivalent (FTE) equals one employee working full time. It is a unit of measuring employment and is used to express the workforce of an enterprise, activity or country. It is tabulated by comparing person days of employment generated by the standard number of working days for a full time employee in a year i.e. 260 (assuming work of 5 days a week for 52 weeks). To calculate the short term FTE per MW generated, we group business development, design/pre-construction, and construction/commissioning phases as “project implementation” to represent employment generated before a project goes online.
business development The number of FTE per MW is highest for projects with a capacity of 1 to 5 MW. MW-scale projects of less than 5 MW generate 0.38 FTE per MW for business development.
table 10: estimated Fte of employment generated during business development
Project Capacity (mw)
median Person days per mw
median Fte per mw
1–5 99 0.38
5–10 74 0.28
10–25 9 0.03
> 25 12 0.05
Source: nrDC–CeeW survey, June 2014.
design and Pre-constructionSmaller projects provide greater opportunity for employment during design and pre-construction. Projects with a capacity of 1 to 5 MW provide 0.55 FTE jobs per MW.
table 11: estimated Fte of employment generated during design and Pre-construction
Project Capacity (mw)
median Person days per mw
median Fte per mw
1–5 142 0.55
5–10 64 0.25
10–25 12 0.05
> 25 18 0.07
Source: nrDC–CeeW survey, June 2014.
Construction and Commissioning The analysis suggests that the most significant employment opportunity is generated during the construction and commissioning phase. Interestingly, at 3.77 FTE per MW, projects of 1 to 5 MW capacity generate the highest FTE per MW for skilled employees. The smallest project capacity generates the highest FTE per MW of employment for unskilled employees as well at 8.50 FTW per MW.
table 12: estimated Fte of employment generated during Construction and Commissioning
Skilled Unskilled
Project Capacity (mw) median Person days per mw
Fte per mw median Person days per mw
Fte per mw
1–5 980 3.77 2,200 8.46
5–10 130 0.50 1,662 6.39
10–25 67 0.26 233 0.90
> 25 90 0.35 2,100 8.08
Source: nrDC–CeeW survey, June 2014.
7. long term full time employment (fte) per mW generateD During proJeCt o&m
The operations and maintenance phase begins once the project is commissioned i.e. begins to generate electricity and lasts the entire lifetime of the project. The nature of employment generated during the O&M phase is long term. For this reason, it is measured and expressed as person days per MW per year.
Projects with a capacity of 1 to 5 MW generate 1.2 FTE per MW per year of skilled employment in O&M, the highest number for this phase. Interestingly, O&M is the only phase where projects with capacity of 5 to 10 MW generate greater FTE per MW per year employment of unskilled labor than do projects of 1 to 5 MW.
NRDC iNteRNatioNal: iNDia SolaR PoweR JobSpage 14
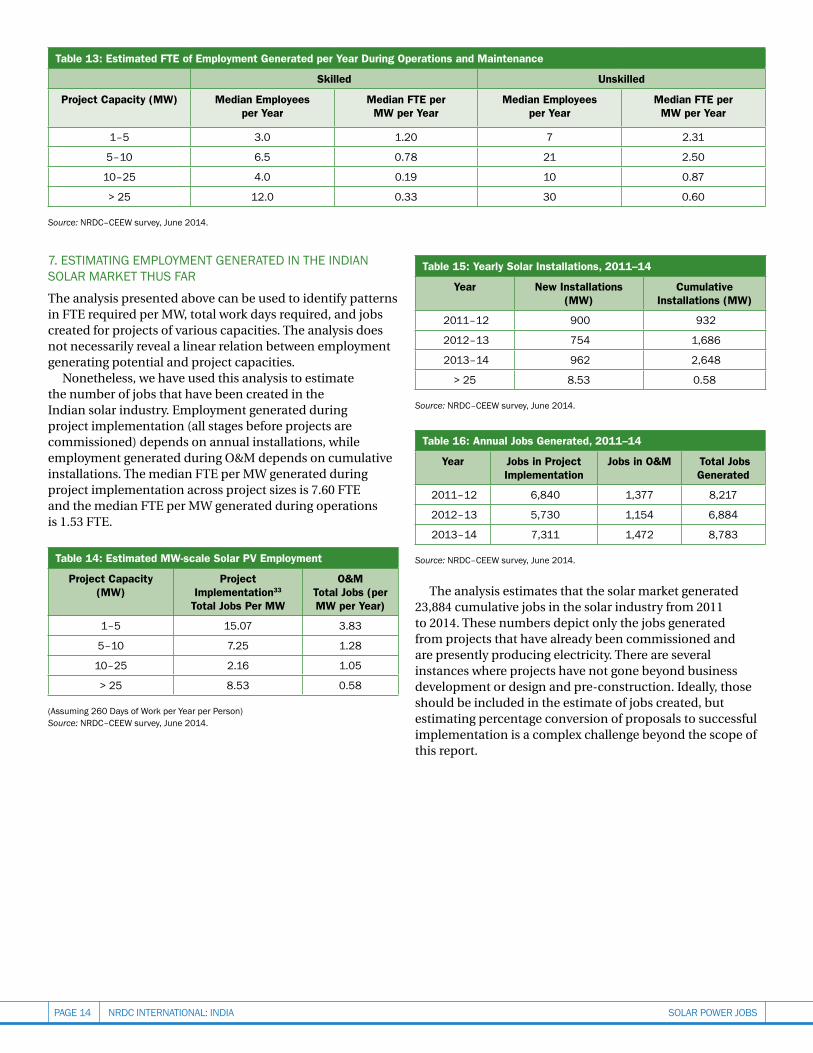
7. estimating employment generateD in the inDian solar market thus far
The analysis presented above can be used to identify patterns in FTE required per MW, total work days required, and jobs created for projects of various capacities. The analysis does not necessarily reveal a linear relation between employment generating potential and project capacities.
Nonetheless, we have used this analysis to estimate the number of jobs that have been created in the Indian solar industry. Employment generated during project implementation (all stages before projects are commissioned) depends on annual installations, while employment generated during O&M depends on cumulative installations. The median FTE per MW generated during project implementation across project sizes is 7.60 FTE and the median FTE per MW generated during operations is 1.53 FTE.
table 14: estimated mw-scale Solar PV employment
Project Capacity (mw)
Project implementation33
total Jobs Per mw
o&mtotal Jobs (per mw per year)
1–5 15.07 3.83
5–10 7.25 1.28
10–25 2.16 1.05
> 25 8.53 0.58
(assuming 260 Days of Work per year per person) Source: nrDC–CeeW survey, June 2014.
table 15: yearly Solar installations, 2011–14
year new installations (mw)
Cumulative installations (mw)
2011–12 900 932
2012–13 754 1,686
2013–14 962 2,648
> 25 8.53 0.58
Source: nrDC–CeeW survey, June 2014.
table 16: annual Jobs generated, 2011–14
year Jobs in Project implementation
Jobs in o&m total Jobs generated
2011–12 6,840 1,377 8,217
2012–13 5,730 1,154 6,884
2013–14 7,311 1,472 8,783
Source: nrDC–CeeW survey, June 2014.
The analysis estimates that the solar market generated 23,884 cumulative jobs in the solar industry from 2011 to 2014. These numbers depict only the jobs generated from projects that have already been commissioned and are presently producing electricity. There are several instances where projects have not gone beyond business development or design and pre-construction. Ideally, those should be included in the estimate of jobs created, but estimating percentage conversion of proposals to successful implementation is a complex challenge beyond the scope of this report.
table 13: estimated Fte of employment generated per year during operations and maintenance
Skilled Unskilled
Project Capacity (mw) median employees per year
median Fte per mw per year
median employees per year
median Fte per mw per year
1–5 3.0 1.20 7 2.31
5–10 6.5 0.78 21 2.50
10–25 4.0 0.19 10 0.87
> 25 12.0 0.33 30 0.60
Source: nrDC–CeeW survey, June 2014.
NRDC iNteRNatioNal: iNDia page 15Solar Power JobS
key FindingS and diSCUSSion
1. Solar deployment creates employment opportunities in india.
New solar projects must be designed, constructed, connected to the grid, and maintained, and the majority of these tasks must be undertaken locally. The analysis shows that increasing the installed capacity base of solar PV power generation in the country creates long term employment in the country. Continuous and sustained addition to existing installed capacity increases short term employment as well.
2. Projects of 1 to 5 mw capacity have the greatest employment generating potential.
Our analysis shows that the highest number of FTE jobs per MW is generated by projects with a capacity of 1 to 5 MW. Increases in project size reduce the human resources required per MW to execute a project. To continue higher potential job creation rates, national policy on solar should continue to focus on smaller-size projects, as it has in the past phases of the NSM.
The flip side to this argument concerns the economies of scale that a developer may experience by investing in a project with relatively larger capacities. Viability, and hence the cost of financing a project, depend significantly on the per-unit cost of power produced, which may be optimized at greater scale. There is a need, therefore, to find the optimum average capacity for projects to maximize employment generation potential while being mindful of project feasibility and benefits that could accrue from economies of scale.
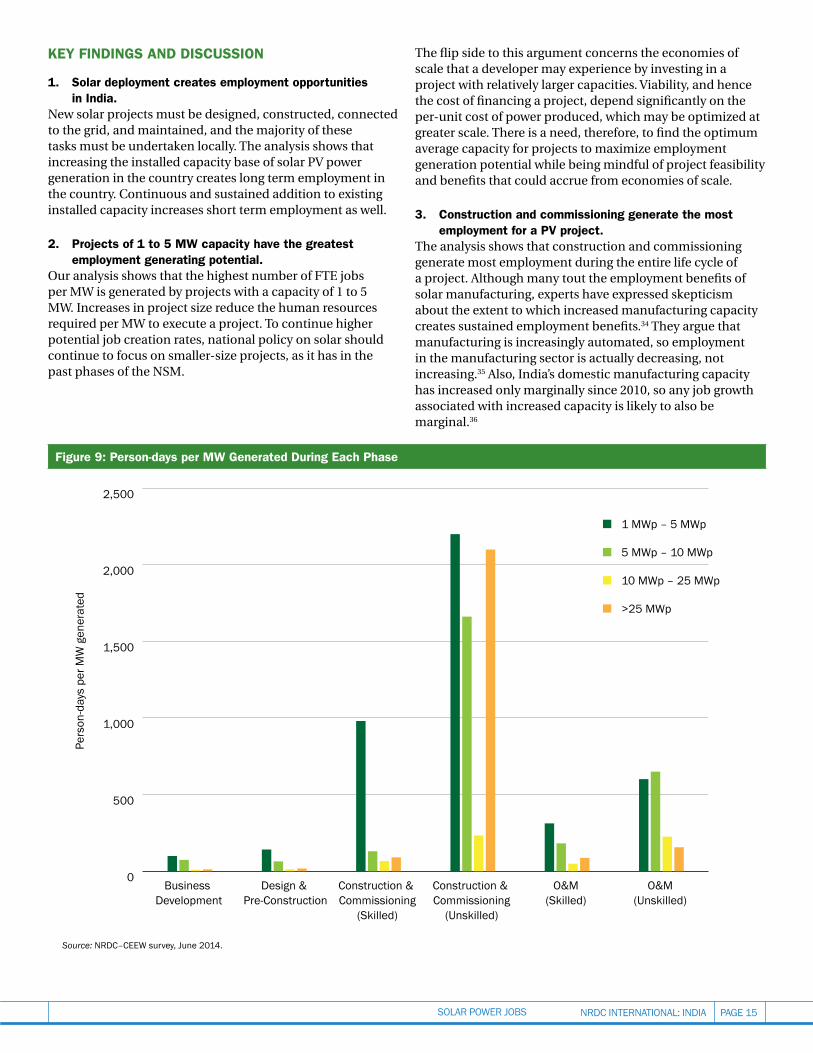
3. Construction and commissioning generate the most employment for a PV project.
The analysis shows that construction and commissioning generate most employment during the entire life cycle of a project. Although many tout the employment benefits of solar manufacturing, experts have expressed skepticism about the extent to which increased manufacturing capacity creates sustained employment benefits.34 They argue that manufacturing is increasingly automated, so employment in the manufacturing sector is actually decreasing, not increasing.35 Also, India’s domestic manufacturing capacity has increased only marginally since 2010, so any job growth associated with increased capacity is likely to also be marginal.36
Figure 9: Person-days per mw generated during each Phase
■ 1 MWp – 5 MWp
■ 5 MWp – 10 MWp
■ 10 MWp – 25 MWp
■ >25 MWp
Business Development
Pers
on-d
ays
per M
W g
ener
ated
Design & Pre-Construction
Construction & Commissioning
(Skilled)
Construction & Commissioning
(Unskilled)
O&M(Skilled)
O&M(Unskilled)
0
500
1,000
1,500
2,000
2,500
Source: nrDC–CeeW survey, June 2014.
NRDC iNteRNatioNal: iNDia SolaR PoweR JobSpage 16
although there is no dedicated policy in india focused exclusively on generating mW-scale solar pv employment, the central government has established a number of policies geared toward the growth of the solar market. state governments have their own policies to promote the solar market as well. Drawing from the analysis above, the Indianpolicyframeworkhasledtoincreasedsolardeployment,whichhascreatedasignificantnumberofjobs,particularly in construction and installation. india’s policies have not led to a notable increase in manufacturing employment. human resource development policies, although limited, have provided relevant training in solar photovoltaics to skilled professionals, but more remains to be done.
dePloyment PoliCyThe first phase of India’s flagship National Solar Mission was effective in encouraging deployment of solar PV and providing support for 30 PV projects with grid-competitive tariffs.37 Although this policy is directly focused on reaching the central government’s production targets for solar power in India, it has also been extremely effective in creating employment opportunities. As the previous sections have noted, the majority of jobs lie in construction, commissioning, operations, and maintenance, which are a result of increased PV installed capacity.
The scope for employment generation through advancement of solar energy in India is not limited to PV power projects, however. Although the scope of this analysis is limited to MW scale PV power plants, a much larger market exists, demonstrating the significant potential to generate long term employment in the country. While PV manufacturing will most certainly create more technical, skilled jobs, there is a large untapped potential in the rooftop, micro-grids, and smaller solar applications market as well.
manUFaCtUring PoliCyIn addition to promoting deployment of solar PV in India, a major goal of the NSM is to increase India’s domestic manufacturing capacity.38 Three policy tools have been employed to promote solar manufacturing: the domestic content requirement (DCR) in the NSM, direct subsidies in the 2007 Semiconductor Policy, and tax incentives and grants in the 2011 National Manufacturing Policy.
The DCR requirement under the first phase of the NSM mandated developers to use cells and modules manufactured in India, in order to receive financial support from the MNRE.39 However, thin-film technology was exempt from
this requirement. As a result, most developers switched to using relatively cheaper imported thin-film modules while still qualifying for support from the central government.40 The guidelines for the second phase of the NSM have modified the parameters of the DCR: Only a portion of Phase 2 projects are subject to a technology-neutral version of this requirement; the rest may use cells and modules manufactured abroad.41
In addition to solar-specific manufacturing policies, there are a number of industrial policies that have affected the solar manufacturing industry, including the 2007 Semiconductor Policy, which subsidizes investments of $550 million (~ Rs 3,300 crore) for semiconductor or solar manufacturing, and the National Manufacturing Policy of 2011.42 These policies have had limited success in promoting manufacturing capacity.43
hUman reSoUrCe deVeloPment PoliCyMNRE has launched a number of initiatives to enhance skills in the solar sector, but these programs are geared primarily toward scientists and engineers despite the majority of the jobs created being in construction, installation, and maintenance. These initiatives include a fellowship program that trains engineers and scientists in solar energy; a Solar Finance Capacity Building Initiative that educates financial officers about solar in order to encourage investment; the Solar Energy Centre (now an autonomous body called the National Institute of Solar Energy), which offers a training program geared toward the Indian industry; and the National Centre for Photovoltaic Research and Education (NCPRE), which focuses on technical research and training in PV.44 There are few, if any, training programs dedicated to skill development for installation and construction.
vi. inDian solar poliCies anD impaCt on solar employment
NRDC iNteRNatioNal: iNDia page 17Solar Power JobS
key FindingS
1. Solar energy creates employment opportunities in india. based on our initial primary research, we estimated that the solar market generated 23,884 cumulative jobs in the solar industry from 2011 to 2014 (solely from commissioned projects currently producing electricity). the construction and commissioning phase generates the most employment for a pv project.
2. india’s policy framework has led to increased solar deployment, creating jobs and increasing energy access. smaller projects up to 5 mW in size may provide the most employment opportunities per mW. targeted policies and clearer objectives may be more effective to accomplish diverse goals—solar deployment, job creation domestic solar manufacturing & human resource development.
3. Companies need to support the solar market by providing their projects’ job creation numbers. by tracking and reporting solar energy jobs numbers, business and policy makers can formulate better policies and programs and demonstrate the importance of renewable energy to the local economy.
vii. reCommenDations
ContinUed SUPPort For Solar energy CreateS Clean JobS and booStS the loCal eConomyFrom 2011 to 2014, the Indian solar industry created an estimated 23,884 cumulative jobs from commissioned projects generating solar power. While the construction and commissining phase generates the most employment for a PV project, increasing the installed capacity base of solar PV power generation in the country also creates long term employment. Continued support for the maturing solar market will not only increase energy access and tap renewable energy sources, but also have an economic impact by creating clean energy jobs for local workers.
the national Solar miSSion’S PoliCieS ShoUld FoCUS on Solar dePloyment with SeParate PoliCieS For manUFaCtUring and training Solar workerSThe Mission has encouraged solar deployment in India and supported the clean jobs accompanying solar project installations indirectly. However, a policy with a primary focus on solar deployment may not always be the most effective way to also spur long-term employment, a local manufacturing base and training new solar workers.
For example, while developing a robust solar manufacturing industry in India has significant economic benefits, long-term employment may not be one of them. Because the DCR arguably raises the price of solar power and therefore impedes the growth of the sector in India, the central government should create separate policy mechanisms to drive local manufacturing that do not conflict with the deployment of solar and the resulting employment generation in the country.
Additionally, the government should assess the types of skills that will be most in demand in order to ensure that training and education are meeting these requirements. Specific human resource development policies should focus on training workers to fill the jobs that will be created in the greatest numbers in the solar industry—those in construction, installation, and maintenance.
Solar deVeloPerS ShoUld be enCoUraged to ProVide ProJeCtS’ Job Creation nUmberS Indian developers should provide an estimate of the number of jobs their projects could create. The central government should encourage this practice, either by making such reporting mandatory or by providing an incentive. Given the importance of employment in the Indian market, revealing the number of jobs created in the solar sector would help build public support for solar energy projects. Such job numbers can also help create political support and provide much-needed confidence to banks and financiers.
Although this report provides a first step, further empirical work should be done to evaluate the connection between specific policy instruments and employment. This information can help support a robust cost-benefit analysis of India’s solar policies. Business and government leaders can then take action to continue to grow renewable energy markets and create clean energy jobs to achieve greater energy independence and sustainable energy access.
NRDC iNteRNatioNal: iNDia SolaR PoweR JobSpage 18
footnotes1 See, e.g., government of india, Jawaharlal nehru national solar mission (hereinafter nsm), Towards Building Solar India, http://www.mnre.gov.in/file-manager/UserFiles/mission_document_JNNSM.pdf.mnre, Human Resource Development Strategies for Indian Renewable Energy Sector,2010,http://mnre.gov.in/file-manager/UserFiles/MNRE_HRD_Report.pdf.NidhiBhardwaj,Renewable Fortunes: Farooq Abdullah on the Journey So Far, greenprospectsasia.com, June 30, 2011, http://issuu.com/greenpurchasingasia/docs/gpa_july_2011.U.N.Sushma,“union minister farooq abdullah inaugurates asia’s largest solar plant in rajasthan,” Times of India,August22,2013,http://timesofindia.indiatimes.com/home/environment/the-good-earth/union-minister-farooq-abdullah-inaugurates-asias-largest-solar-plant-in-rajasthan/articleshow/21975350.cms.
2 World bank, Labor Force, Total, 2009-13, http://data.worldbank.org/indicator/sl.tlf.totl.in/countries?display=default. max Wei, shana patadia, and Daniel m. kammen, “putting renewables and energy EfficiencytoWork,”November2009,http://rael.berkeley.edu/sites/default/files/WeiPatadiaKammen_CleanEnergyJobs_EPolicy2010.pdf.
3 ministry of new and renewable energy (hereinafter mnre), government of india, Physical Progress (Achievements), http://www.mnre.gov.in/mission-and-vision-2/achievements/. natural resources Defense Council and Council on energy, environment and Water, Laying the Foundation for a Bright Future: Assessing Progress Under Phase 1 of India’s National Solar Mission, 2012, http://www.nrdc.org/international/india/national-solar-mission-ph1.asp.
4 nsm, Towards Building Solar India,http://www.mnre.gov.in/file-manager/UserFiles/mission_document_JNNSM.pdf.Specifically,themission targets the deployment of 20,000 mW of solar power by 2022.
5 mnre, Commissioning Status of Grid Connected Solar Power Projects Under JNNSM,2013-2014,http://mnre.gov.in/file-manager/userfiles/grid-connected-solar-power-project-installed-capacity-2013-14.pdf.
6 “h1 2014 india market outlook,” Bloomberg New Energy Finance, January 16, 2014.
7 natalie obiko pearson, “india to award 1 gigawatt solar permits by 2015, boosting plan,” Businessweek, april 2, 2014, http://www.businessweek.com/news/2014-04-02/india-to-award-1-gigawatt-solar-permits-by-2015-boosting-plan.
8 rachna singh, “vasundhara raje’s green Concern a black spot on solar plant,” Times of India,February10,2014,http://timesofindia.indiatimes.com/city/jaipur/vasundhara-rajes-green-concern-a-black-spot-on-solar-plant/articleshow/30134674.cms; sharon alle, “mnre plans to Develop 15gW solar umpps in india,” Renewable Energy Technology, november 15, 2013, http://www.renewable-energy-technology.net/solar-energy-news/mnre-plans-develop-15gw-solar-umpps-india.
9 international renewable energy agency (hereinafter irena), Renewable Energy Jobs: Status, Prospects and Policies—Biofuels and Grid-Connected Electricity Generation, 2011, http://www.irena.org/DocumentDownloads/publications/renewableenergyJobs.pdf; max Wei, shana patadia, and Daniel m. kammen, “putting renewables and energy EfficiencytoWork,”November2009,http://rael.berkeley.edu/sites/default/files/WeiPatadiaKammen_CleanEnergyJobs_EPolicy2010.pdf.
10 max Wei, shana patadia, and Daniel m. kammen, “putting RenewablesandEnergyEfficiencytoWork,”November2009,http://rael.berkeley.edu/sites/default/files/WeiPatadiaKammen_CleanEnergyJobs_EPolicy2010.pdf.Ajob-yearisdefinedasoneyearoffull-timeemploymentfor one person for one year (2,080 hours of employment per year). a gigawatt-hourisdefinedasonebillionwatt-hoursandisusedtomeasurethe electrical output of power stations. mark fulton and red Capalino, Investing in The Clean Trillion: Closing the Clean Energy Investment Gap, Ceres, January 2014, http://www.ceres.org/resources/reports/investing-in-the-clean-trillion-closing-the-clean-energy-investment-gap.
11 max Wei, shana patadia, and Daniel m. kammen, “putting RenewablesandEnergyEfficiencytoWork,”November2009,http://rael.berkeley.edu/sites/default/files/WeiPatadiaKammen_CleanEnergyJobs_epolicy2010.pdf.
12 ibid. notes on this report’s methodology: the authors of this study have used two ways to calculate lifetime average employment created per unitofenergyproduced.Thefirstapproach(usedforthepurposeofTable3) is used to allow for comparison between technologies with different capacity factors by using employment calculated per unit of energy (“job-years per gWh”) or per unit of average-mW power output (‘‘job-years per average mW”). the second approach (used in the quantitative analysis in section 4 of this report) uses “one-time”’ employment factors such as construction and installation (“job-years per peak mW”) and averages them over the plant lifetime to obtain an average employment number (“jobs per peak mW”) that can be directly added to ongoing employment in areas such as operations and maintenance.
13 european photovoltaic industry association (hereinafter epia), Sustainability of Photovoltaic Systems: Job Creation, http://www.epia.org/uploads/tx_epiafactsheets/Fact_Sheet_on_Job_Creation.pdf.
14 blue green alliance, Overview of the Solar Energy Industry and Supply Chain, January 2011, http://www.thecemc.org/body/solar-overview-for-bga-final-Jan-2011.pdf.
15 ibid.
16 ibid.
17 See united nations environment programme (hereinafter unep), Green Jobs: Towards Decent Work in a Sustainable, Low-Carbon World, September2008,http://www.unep.org/PDF/UNEPGreenjobs_report08.pdf.
18 these categories were developed in consultation with the natural resource Defense Council’s india team and rishabh Jain at the indian ngo Council on energy, environment and Water; bridge to india, Project Development Handbook, 2012, http://www.bridgetoindia.com/wp-content/themes/newbridge/pdf/BRIDGE%20TO%20INDIA_Project%20Development%20handbook.pdf.
19 irena, Renewable Energy and Jobs, December 2013, http://www.irena.org/rejobs.pdf.
20 epia, Sustainability of Photovoltaic Systems: Job Creation, September24,2012,http://www.epia.org/uploads/tx_epiafactsheets/Fact_Sheet_on_Job_Creation.pdf.
21 irena, Renewable Energy and Jobs, December 2013, http://www.irena.org/rejobs.pdf.
23 mnre, Human Resource Development Strategies, october 2010, http://mnre.gov.in/file-manager/UserFiles/MNRE_HRD_Report.pdf.
24 ThisemploymentfigureisatinypercentageofIndia’stotalpopulation; however, internationally, similar numbers (see table 1, supra) arealsoconsideredsignificant.SeeIRENA,RenewableEnergyJobs.Thereare several reasons for this: first, these numbers may be considered significantrelativetothejobcreationpergigawatt-hourofconventionalpower. this is the case globally (see max Wei, shana patadia, and Daniel m. kammen, Putting Renewables and Energy Efficiency to Work); however,thereareinsufficientdataintheIndiancontexttomakethisdetermination.Second,thenumbersmaybeconsideredsignificantwhen combined with all renewable power sources and compared with conventionaljobcreationfigures.Again,thereisreasontobelievethisis true in other countries (ibid.; mark muro, Jonathan rothwell, and Devashree saha, Sizing the Clean Economy: A National and Regional Green Jobs Assessment, brookings institution, 2011). however, there is insufficientevidenceintheIndiancontexttomakeacomparison.
NRDC iNteRNatioNal: iNDia page 19Solar Power JobS
25 e2’s “Clean energy Works for us” landing page for jobs information organized state by state: http://cleanenergyworksforus.org/.
26 for example, see e2’s landing page: “publications: Clean energy Jobs,” http://www.e2.org/jsp/controller;jsessionid=664709f1603bbC3ff263f1Da16C1289C?docname=cleanjobsarchives.
27 mnre, Human Resource Development Strategies, october 2010, http://mnre.gov.in/file-manager/UserFiles/MNRE_HRD_Report.pdf.
28 presentation by satyendra kumar, lanco solar, SPV Power Technology in India, asean-india Workshop on Cooperation in new and renewable energy, new Delhi, november 5–6, 2012, https://www.google.co.in/url?sa=t&rct=j&q=&esrc=s&source=web&cd=1&cad=rja&uact=8&ved=0CBsQFjAA&url=http%3A%2F%2Fmnre.gov.in%2Ffile-manager%2fuserfiles%2fasean2012%2fsession%25202%2520-%2520Solar%2FSKumar_ASEAN_Delhi_20121105_Final.pptx&ei=6yeoU5-LLsu7uATP2YCIDg&usg=AFQjCNFwu_Jiwpi8BxVQ8_HrT3maiyrhgw&sig2=yikos2Xhm1Jd1svqvuWesQ.
29 estimated by multiplying number of jobs per mW by grid-connected solar pv capacity (2,467 mW) as published by mnre.
30 manisha Jain and anand patwardhan, “employment outcomes of renewable energy technologies: implications of policies in india,” Econ. and Pol. Wkly. 158 (2013): 84, 86. employment was broken down into four categories: cell manufacturing, which ranged from 1.4 to 6.1 jobs/mW; module manufacturing, which ranged from 4.5 to 5.3 jobs/mW; construction, which created 0.5 job/mW; and operations and maintenance, which created 1.25 jobs/mW. ibid.
31 estimated by multiplying number of jobs per mW by grid-connected solar pv capacity (2,467 mW) as published by mnre.
32 mnre, Over 50,000 Direct Jobs Created in New and Renewable Sector, press release, march 6, 2013, http://pib.nic.in/newsite/printrelease.aspx?relid=93071.
33 project implementation phase includes business development, design and pre-construction, and construction and commissioning.
34 max Wei, shana patadia, and Daniel m. kammen, Putting Renewables and Energy Efficiency to Work. the solar foundation, national solar Jobs Census 2011. october 2011, http://www.thesolarfoundation.org/sites/thesolarfoundation.org/files/TSF_JobsCensus2011_Final_Compressed.pdf.
37 ntpC vidyut vyapar nigam limited, List of Selected Projects, http://www.nvvn.co.in/selected%20projects%20list.pdf.
38 ibid.
39 anshuman sahoo and gireesh shrimali, An Analysis of Industrial Policy Support for the Indian Solar Photovoltaic Manufacturing Sector, 2012, http://www.usaee.org/usaee2012/submissions/OnlineProceedings/USAEE%20Proceedings%20Paper_Sahoo%20and%20shrimali.pdf.
42 anshuman sahoo and gireesh shrimali, An Analysis of Industrial Policy Support for the Indian Solar Photovoltaic Manufacturing Sector, 2012, http://www.usaee.org/usaee2012/submissions/OnlineProceedings/USAEE%20Proceedings%20Paper_Sahoo%20and%20shrimali.pdf. government of india, New Manufacturing Policy to Create 100 Million Jobs in India, press release, December 16, 2011, http://www.pib.nic.in/newsite/erelease.aspx?relid=78807.
43 anshuman sahoo and gireesh shrimali, An Analysis of Industrial Policy Support for the Indian Solar Photovoltaic Manufacturing Sector, 2012, http://www.usaee.org/usaee2012/submissions/OnlineProceedings/USAEE%20Proceedings%20Paper_Sahoo%20and%20shrimali.pdf. sanjay singh, “25% concession on capex for the semiconductor biz on the cards,” Business Today, april 5, 2011, http://businesstoday.intoday.in/story/new-semiconductor-policy-25percent-concession-on-capital-expenditure-for-the-semiconductor-industry/1/14494.html.
44 nsm, Towards Building Solar India.http://www.mnre.gov.in/file-manager/UserFiles/mission_document_JNNSM.pdf.JanetL.Sawin,Mainstreaming Renewable Energy in the 21st Century, may 2004, http://academic.evergreen.edu/curricular/amr/amr0506/worldwatch.pdf. mnre, National Institute of Solar Energy, http://www.mnre.gov.in/centers/about-sec-2/. national Centre for photovoltaic research and Education,http://www.ncpre.iitb.ac.in/#.TheNCPREfocusesonsolarphotovoltaic education and research. in 2011 it conducted a teach 1,000 teachers training programme. in addition to this, nCpre also conducts short-term to long-term courses on solar photovoltaic energy
all rights reserved. no part of this publication may be reproduced, stored in a retrieval system or transmitted, in any form or by any means, electronic, mechanical, photocopying, recording or otherwise, without prior permission.
natural resources defense Council
40 West 20th streetnew york, ny 10011212 727-2700fax 212 727-1773
www.nrdc.org
Council on energy, environment and water
thapar house 124 Janpath new Delhi 110001+91 11 40733300fax: +91 11 40733399


![[PROPOSED] CONSENT DECREE - NRDC](https://static.documents.pub/doc/80x56/620cff0a282b357906659994/proposed-consent-decree-nrdc.jpg)


