NREL is a national laboratory of the U.S. Department of Energy, Office of Energy Efficiency and Renewable Energy, operated by the Alliance for Sustainable Energy, LLC. Katherine Dykes, Andrew Ning, Peter Graf, George Scott, Rick Damiani, Ryan King, Derek Berry, Pat Moriarty, Maureen Hand, and Paul Veers National Renewable Energy Laboratory February 1, 2013 NREL Wind Energy Systems Engineering Program Overview and Introduction to TWISTER
Transcript
NREL is a national laboratory of the U.S. Department of Energy, Office of Energy Efficiency and Renewable Energy, operated by the Alliance for Sustainable Energy, LLC.
Katherine Dykes, Andrew Ning, Peter Graf, George Scott, Rick Damiani, Ryan King, Derek Berry, Pat Moriarty, Maureen Hand, and Paul Veers
National Renewable Energy Laboratory February 1, 2013
NREL Wind Energy Systems Engineering Program Overview and Introduction to TWISTER
2
Agenda: TWISTER Tutorial
• Systems Engineering Program Overview • Model Development • Integrated System Analysis
3
Agenda: TWISTER Tutorial
• Systems Engineering Program Overview • Model Development • Integrated System Analysis
4
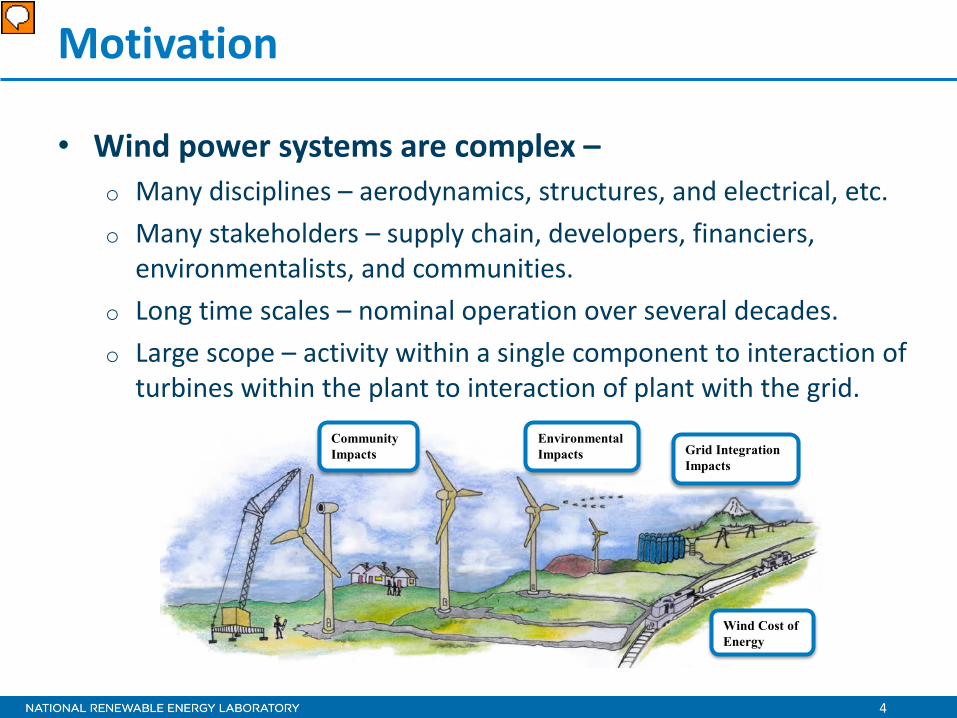
Motivation
• Wind power systems are complex – o Many disciplines – aerodynamics, structures, and electrical, etc. o Many stakeholders – supply chain, developers, financiers,
environmentalists, and communities. o Long time scales – nominal operation over several decades. o Large scope – activity within a single component to interaction of
turbines within the plant to interaction of plant with the grid.
Environmental Impacts Grid Integration
Impacts
Wind Cost of Energy
Community Impacts
Presenter
Presentation Notes
Motivation: the complexity of wind energy technology, the limitations of current segmented analysis tools
5
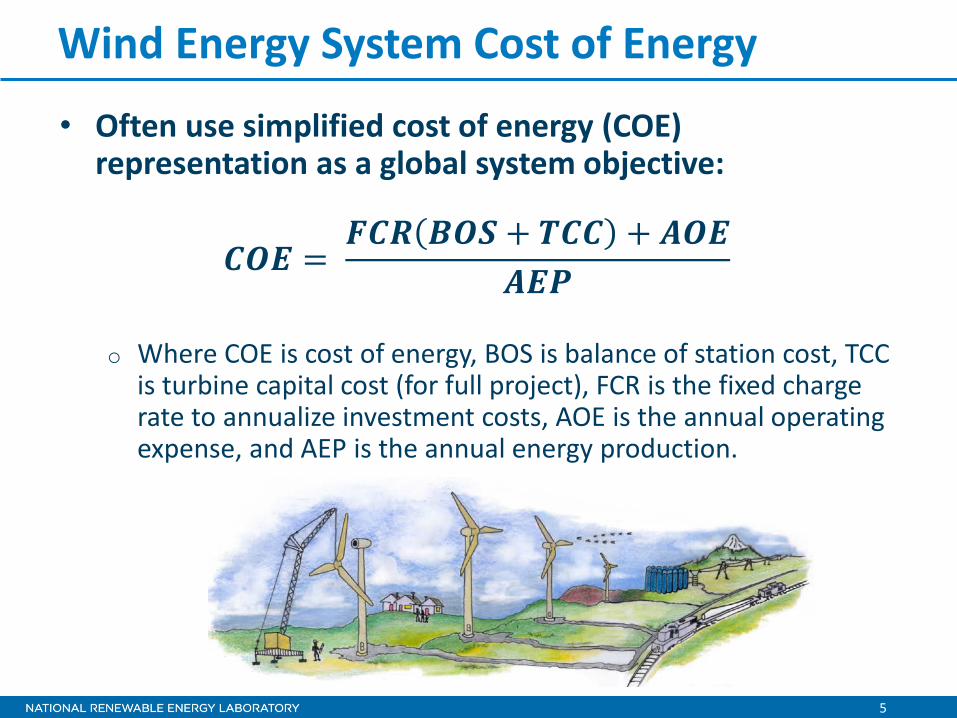
Wind Energy System Cost of Energy
• Often use simplified cost of energy (COE) representation as a global system objective:
𝑪𝑪𝑪 = 𝑭𝑪𝑭 𝑩𝑪𝑩 + 𝑻𝑪𝑪 + 𝑨𝑪𝑪
𝑨𝑪𝑨
o Where COE is cost of energy, BOS is balance of station cost, TCC
is turbine capital cost (for full project), FCR is the fixed charge rate to annualize investment costs, AOE is the annual operating expense, and AEP is the annual energy production.
6
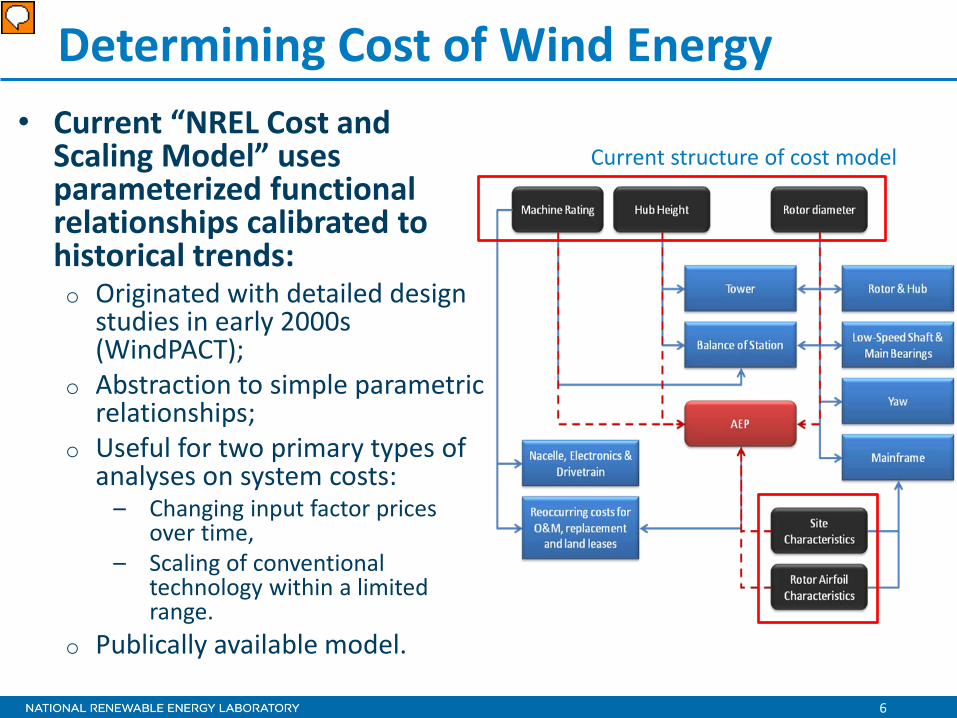
• Current “NREL Cost and Scaling Model” uses parameterized functional relationships calibrated to historical trends: o Originated with detailed design
studies in early 2000s (WindPACT);
o Abstraction to simple parametric relationships;
o Useful for two primary types of analyses on system costs:
– Changing input factor prices over time,
– Scaling of conventional technology within a limited range.
o Publically available model.
Current structure of cost model
Determining Cost of Wind Energy
Presenter
Presentation Notes
Specific limitations of current cost model (presentation focused on cost analysis team) in doing forward looking analysis
7
NREL Wind Energy System Engineering
• NREL Initiative in Systems Engineering for Wind Energy seeks to: o Develop a software platform to integrate
physics-based modeling efforts with cost-modeling efforts;
o In order to: – Support program efforts for characterization of
potential impacts of innovation / system changes on overall wind plant COE,
– Provide a capability that can be flexibly adapted for a variety of analysis needs, and
– Enable easier collaboration among stakeholders (labs, academia, and industry).
8
NREL System Engineering Program Objectives
• Integration of models into framework includes several areas: 1. Turbine component structure and cost models, 2. Structural models with dynamic models of turbine
performance, and 3. Integration of turbine models with physical plant models for
turbine interactions affecting loads and energy production. • At each level, a range of model fidelity is possible/needed
for analysis flexibility (highly modular).
NREL Cost and Scaling
Model (Blade Cost)
Example transition from Cost and Scaling Model to Systems Engineering Framework
Blade Cost and
Sizing Tool
PreComp
Sandia NuMAD
pBEAM
Blade MCM
FAST AWS
Truepower OpenWind
9
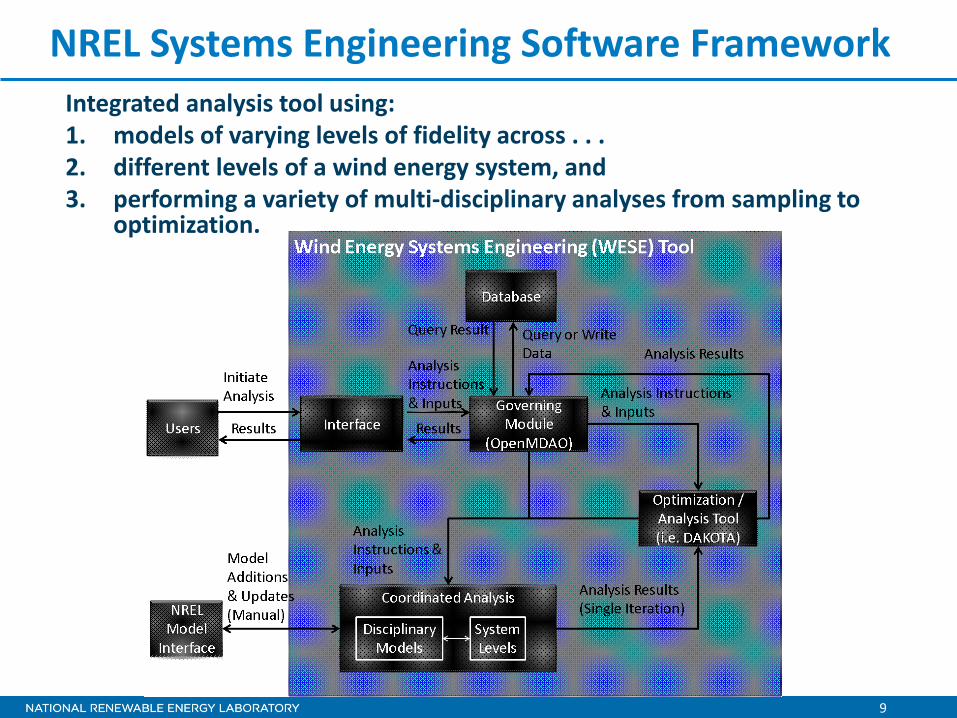
Integrated analysis tool using: 1. models of varying levels of fidelity across . . . 2. different levels of a wind energy system, and 3. performing a variety of multi-disciplinary analyses from sampling to
optimization.
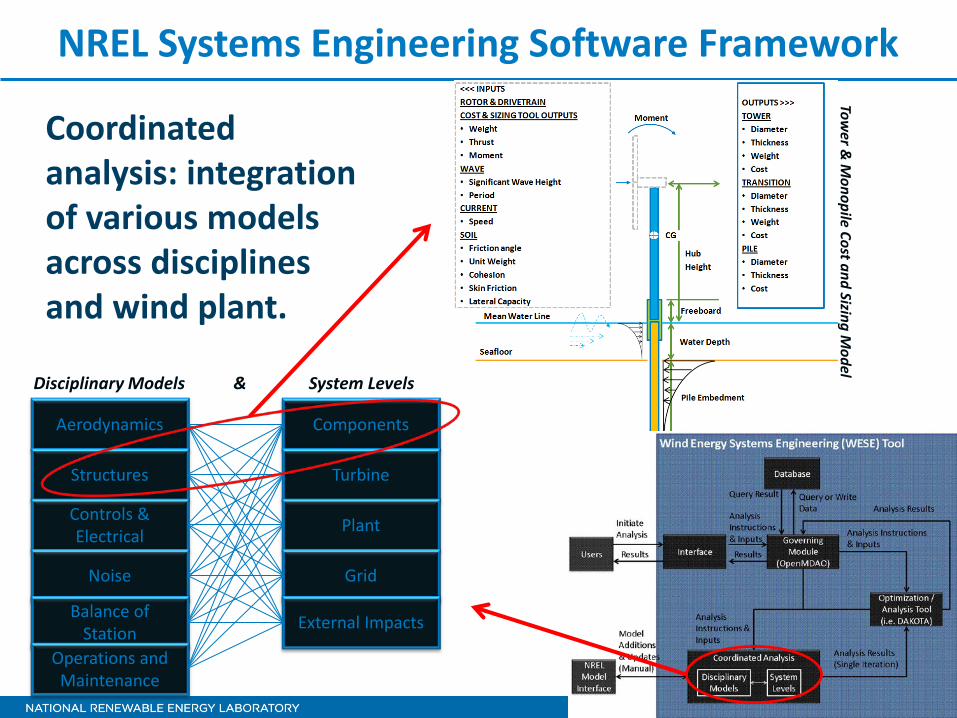
NREL Systems Engineering Software Framework
10
• Governing model: – Work flows integrate
models together in structured ways (use of NASA’s OpenMDAO software), and
– Easily reconfigured (model selection and analysis structure).
• Optimization / Analysis tool – Different algorithms drive
model analysis (internal to OpenMDAO via Sandia’s DAKOTA software).
NREL Systems Engineering Software Framework
11
Components
Turbine
Plant
Grid
External Impacts
Aerodynamics
Structures
Controls & Electrical
Noise
Balance of Station
Operations and Maintenance
Coordinated analysis: integration of various models across disciplines and wind plant.
Tower &
Monopile Cost and Sizing M
odel Disciplinary Models & System Levels
NREL Systems Engineering Software Framework
12
Systems Engineering Software Framework
Governing Software (OpenMDAO)
Analysis Software (i.e. OpenMDAO, DAKOTA)
Plant Layout & Turbine Interaction
User Inputs: Analysis Type, Fixed Inputs, Design Variables, and Constraints
Turbine Structure and Cost
Rotor Structure
Drivetrain Structure
Tower & Substructure
Balance of Plant
BOP Model
O&M
O&M Model
Wind Plant COE
Turbine / Component Model
Wind Plant Analysis Model
Inputs / Outputs
Energy Production
Rotor Aerodynamics
Drivetrain Efficiency
Site AEP Model
Finance Component Finance Model
Component Masses Component Costs Turbine
Capital Costs
AEP BOP Costs O&M Costs
Turbine Dynamics
13
Agenda: TWISTER Tutorial
• Systems Engineering Program Overview • Model Development • Integrated System Analysis
14
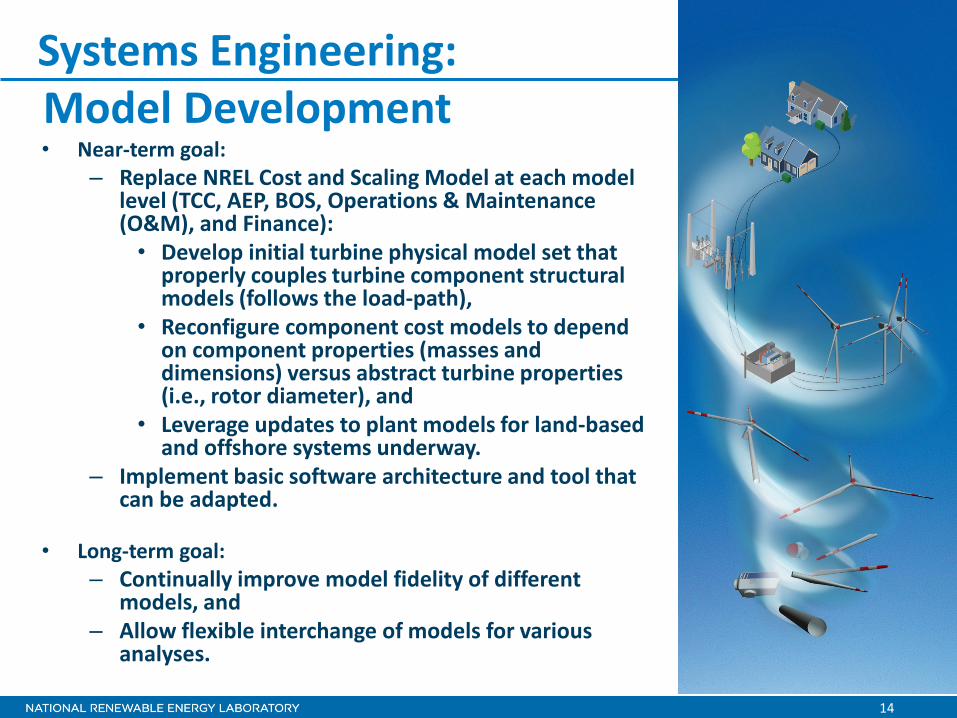
• Near-term goal: – Replace NREL Cost and Scaling Model at each model
level (TCC, AEP, BOS, Operations & Maintenance (O&M), and Finance): • Develop initial turbine physical model set that
properly couples turbine component structural models (follows the load-path),
• Reconfigure component cost models to depend on component properties (masses and dimensions) versus abstract turbine properties (i.e., rotor diameter), and
• Leverage updates to plant models for land-based and offshore systems underway.
– Implement basic software architecture and tool that can be adapted.
• Long-term goal:
– Continually improve model fidelity of different models, and
– Allow flexible interchange of models for various analyses.
Systems Engineering: Model Development
15
Systems Engineering Software Framework
Governing Software (OpenMDAO)
Analysis Software (i.e. OpenMDAO, DAKOTA)
Plant Layout & Turbine Interaction
User Inputs: Analysis Type, Fixed Inputs, Design Variables, Constraints
Turbine Structure and Cost
Rotor Structure
Drivetrain Structure
Tower & Substructure
Balance of Plant
BOP Model
O&M
O&M Model
Wind Plant COE
Turbine / Component Model
Wind Plant Analysis Model
Inputs / Outputs
Energy Production
Rotor Aerodynamics
Drivetrain Efficiency
Site AEP Model
Finance Component Finance Model
Component Masses Component Costs Turbine
Capital Costs
AEP BOP Costs O&M Costs
Turbine Dynamics
16
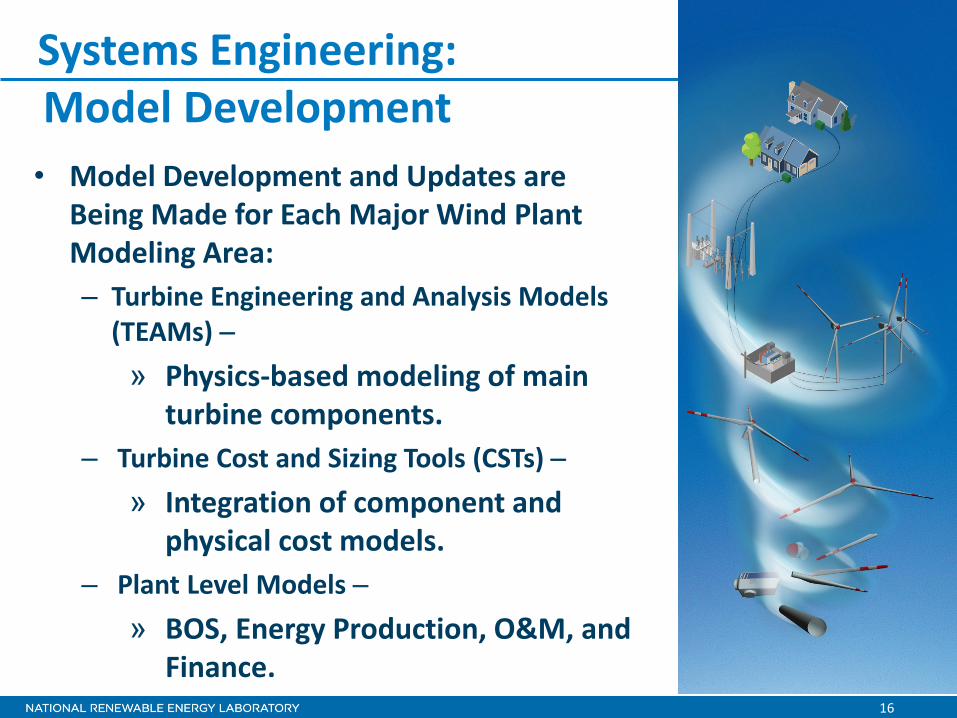
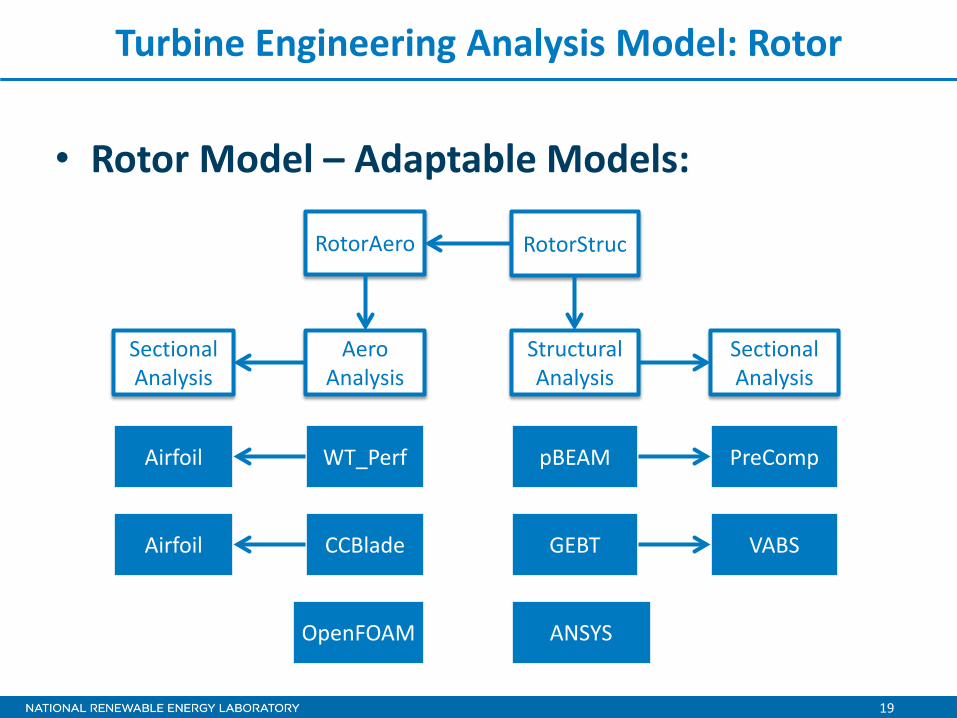
• Model Development and Updates are Being Made for Each Major Wind Plant Modeling Area: – Turbine Engineering and Analysis Models
(TEAMs) − » Physics-based modeling of main
turbine components. – Turbine Cost and Sizing Tools (CSTs) −
» Integration of component and physical cost models.
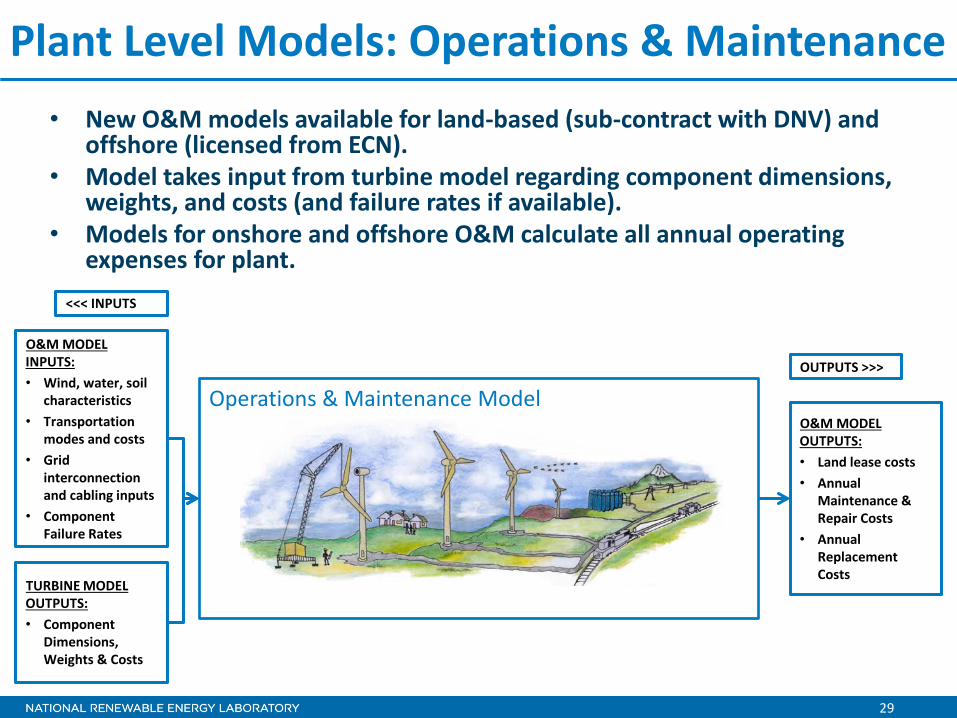
– Plant Level Models − » BOS, Energy Production, O&M, and
Gearbox Configuration • Gear Number • Gear Type(s) • Overall Stage Ratio
Gearbox • Weight • Stage Weights • Stage Ratios
HSS & Coupling • Brake
Weight • HSS
Weight
Generator Rating
Generator • Weight
Bedplate • Length • Area • Weight
Yaw • Weight
ROTOR Outputs • Diameter • Mass • Max Thrust • Speed at Rated • Torque at Rated
<<< INPUTS
OUTPUTS >>>
Drivetrain Configuration
Tower Outputs • Top Diameter
• Semi-empirical model relating input loads directly to component masses & costs, and • NOTE: 3-stage gearbox configuration is shown but direct-drive configuration will also be
implemented.
23
Drivetrain Cost and Sizing Tool
• Drivetrain uses semi-empirical methods to size components based on loads (updated Sunderland Model)
Rotor LSS
Diameter Torque Mass
Gearbox HSS / Brake
Generator Bedplate
Yaw
Torque
Main Bearings
Diameter Speed
Diameter Torque
Rating
Diameter Speed
Diameter Torque Mass Thrust
Diameter Thrust
24
Optimizer
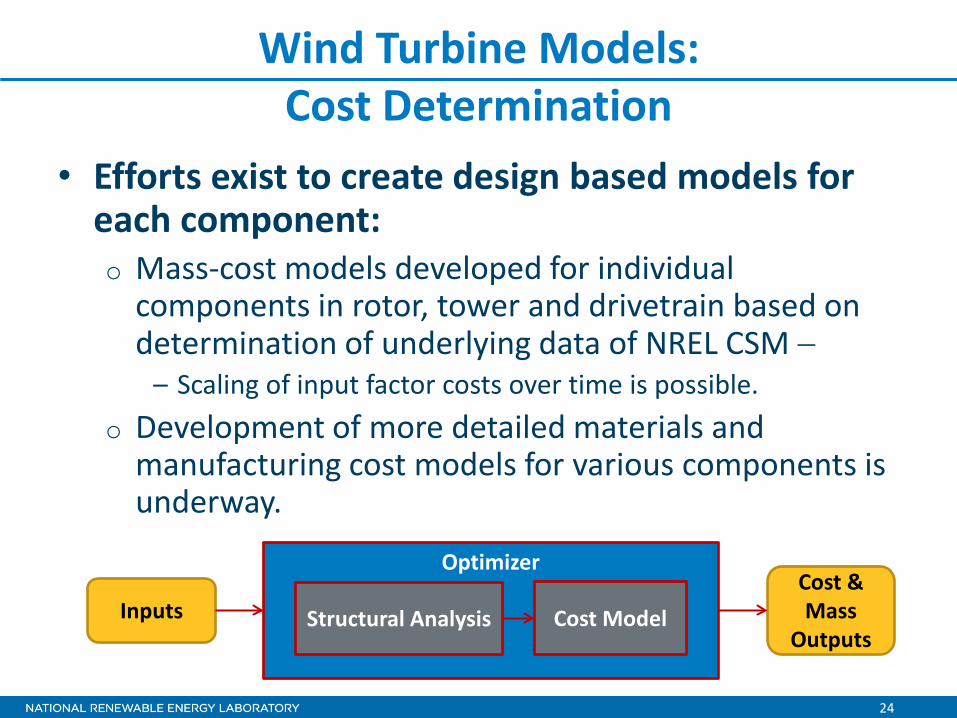
Wind Turbine Models: Cost Determination
• Efforts exist to create design based models for each component: o Mass-cost models developed for individual
components in rotor, tower and drivetrain based on determination of underlying data of NREL CSM −
– Scaling of input factor costs over time is possible. o Development of more detailed materials and
manufacturing cost models for various components is underway.
Structural Analysis Inputs Cost Model Cost & Mass
Outputs
25
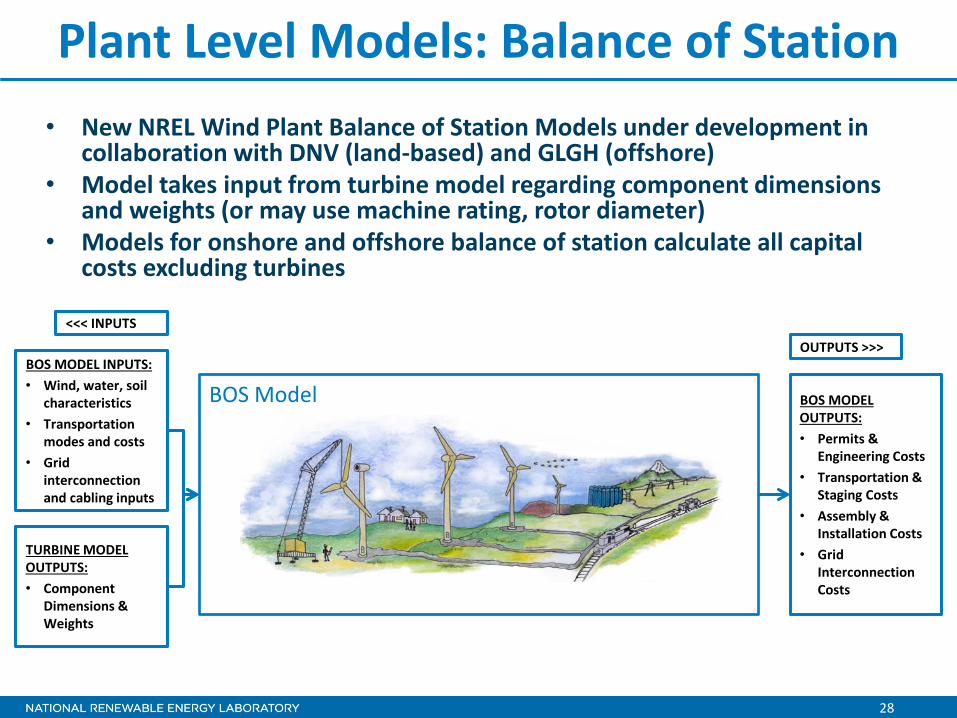
Plant Level Models: TCC, AEP, BOS, O&M, and Finance
• Plant models aggregate all system aspects to find the overall COE: o TCCs, o AEP, o BOS, o O&M, and o Finance.
26
Plant Level Models: Turbine Capital Costs
• Model aggregates component costs and masses together. • Optimization may be done using various Multi-Disciplinary Optimization methods. • Meta-models may be used in place of sub-optimizations for sensitivity analysis.
frequencies• Displacements• Von mises stress• Shell buckling
• Cost
WIND• Speed & Direction• Density & Viscosity
Freeboard
RNA Assembly
27
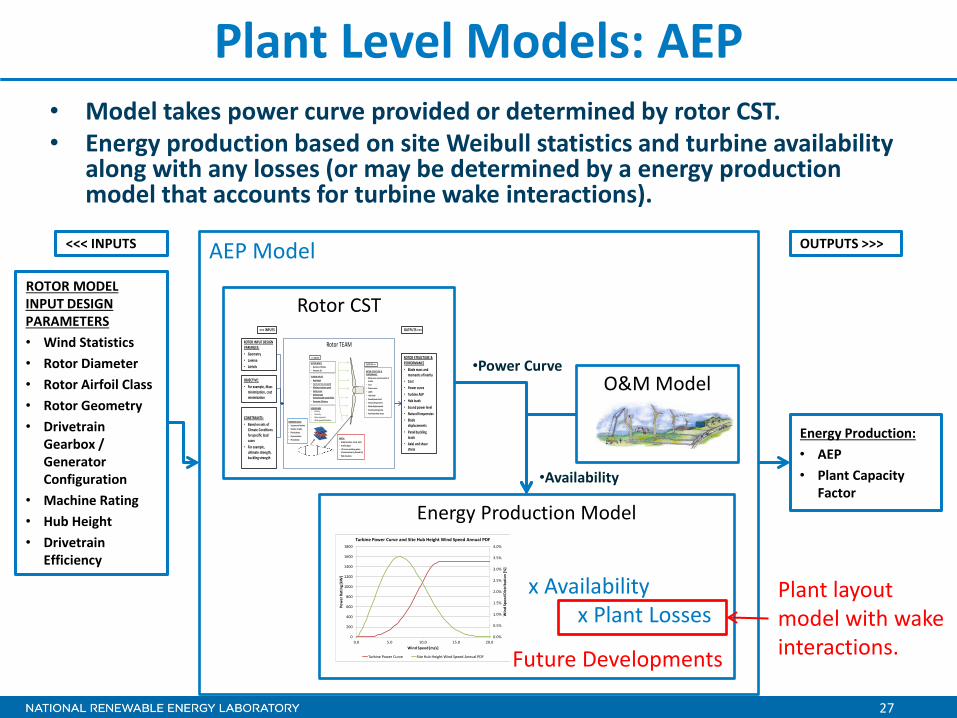
Plant Level Models: AEP • Model takes power curve provided or determined by rotor CST. • Energy production based on site Weibull statistics and turbine availability
along with any losses (or may be determined by a energy production model that accounts for turbine wake interactions).
AEP Model
Energy Production: • AEP • Plant Capacity
Factor
ROTOR MODEL INPUT DESIGN PARAMETERS • Wind Statistics • Rotor Diameter • Rotor Airfoil Class • Rotor Geometry • Drivetrain
Gearbox / Generator Configuration
• Machine Rating • Hub Height • Drivetrain
Efficiency
<<< INPUTS OUTPUTS >>>
Energy Production Model
•Power Curve
0.0%
0.5%
1.0%
1.5%
2.0%
2.5%
3.0%
3.5%
4.0%
0
200
400
600
800
1000
1200
1400
1600
1800
0.0 5.0 10.0 15.0 20.0
Win
d Sp
eed
Dist
ribut
ion
[%]
Pow
er R
atin
g [kW
]
Wind Speed [m/s]
Turbine Power Curve and Site Hub Height Wind Speed Annual PDF
Turbine Power Curve Site Hub Height Wind Speed Annual PDF
• Systems Engineering Program Overview • Model Development • Integrated System Analysis
32
Initial Analysis: Sensitivity Study • Parameter
scans on basic turbine design parameters: rotor diameter, hub height, rated power, and maximum allowable tip speed.
33
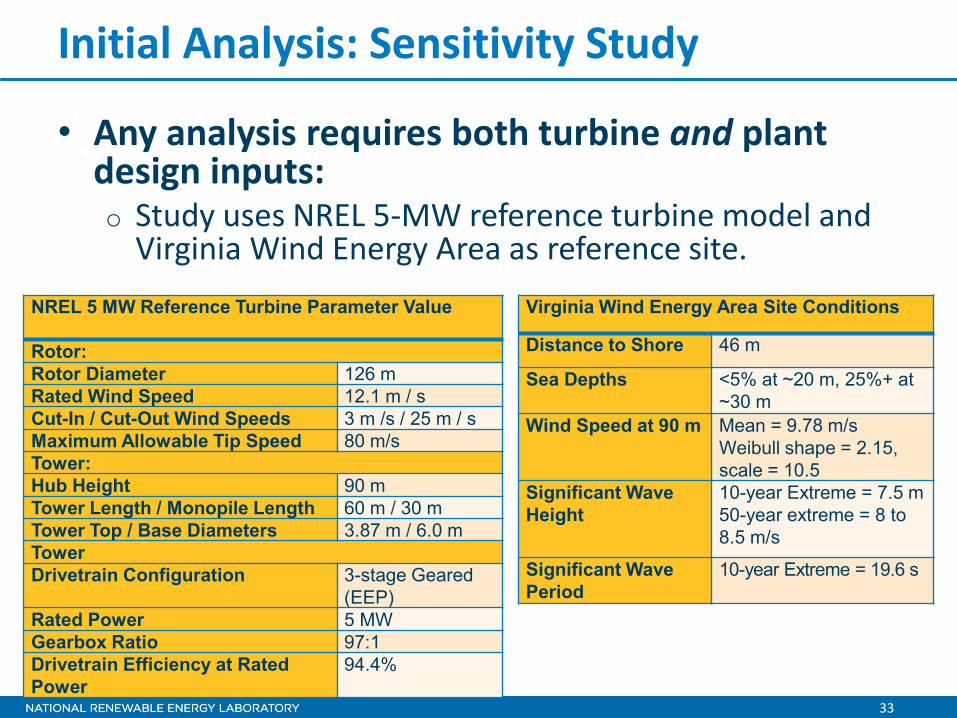
Initial Analysis: Sensitivity Study
• Any analysis requires both turbine and plant design inputs: o Study uses NREL 5-MW reference turbine model and
Virginia Wind Energy Area as reference site. NREL 5 MW Reference Turbine Parameter Value Rotor: Rotor Diameter 126 m Rated Wind Speed 12.1 m / s Cut-In / Cut-Out Wind Speeds 3 m /s / 25 m / s Maximum Allowable Tip Speed 80 m/s Tower: Hub Height 90 m Tower Length / Monopile Length 60 m / 30 m Tower Top / Base Diameters 3.87 m / 6.0 m Tower Drivetrain Configuration 3-stage Geared
(EEP) Rated Power 5 MW Gearbox Ratio 97:1 Drivetrain Efficiency at Rated Power
94.4%
Virginia Wind Energy Area Site Conditions
Distance to Shore 46 m
Sea Depths <5% at ~20 m, 25%+ at ~30 m
Wind Speed at 90 m Mean = 9.78 m/s Weibull shape = 2.15, scale = 10.5
Significant Wave Height
10-year Extreme = 7.5 m 50-year extreme = 8 to 8.5 m/s
Significant Wave Period
10-year Extreme = 19.6 s
34
• Baseline COE analysis CSM versus CSTs – Overall cost of energy higher using new model set:
• Energy production of higher fidelity physics-based model slightly higher than that of NREL CSM.
• Turbine capital costs are similar between two models (slightly higher for the NREL CSM due to the inclusion of a 10% “marine-ization” factor).
• O&M costs roughly consistent from old to new model. • Balance of Station costs of older CSM were known to be low – essentially
doubled in updated model. – COE for new model closer to industry-reported offshore wind costs for
• Sensitivity of system cost to changes in key parameters (rotor diameter, rated power, hub height, and maximum tip speed) performed – change of +/- 10% for each.
• Example analysis: rotor diameter. – Changes in COE was more pronounced using new set of models that
capture more system coupling: • Rotor diameter influences balance of station model in latter case; overall BOS
impact on costs of energy higher for new model set. • Operations & Maintenance model shows less influence since causal
relationship of energy production is removed (surrogate for loads). – Consistent with expectation for “growing the rotor.”
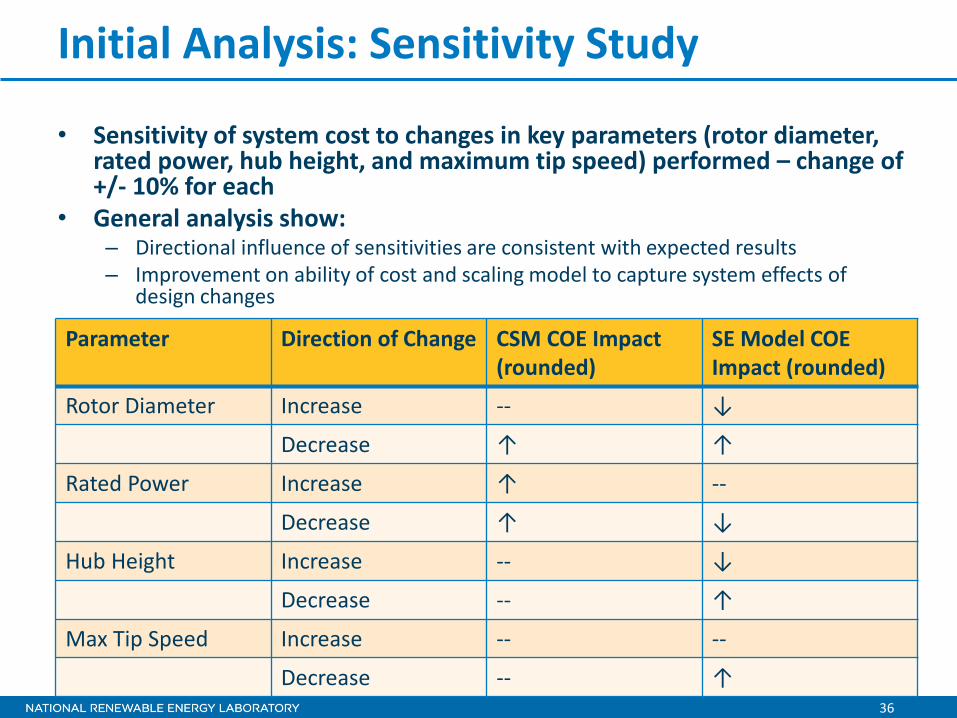
• Sensitivity of system cost to changes in key parameters (rotor diameter, rated power, hub height, and maximum tip speed) performed – change of +/- 10% for each
• General analysis show: – Directional influence of sensitivities are consistent with expected results – Improvement on ability of cost and scaling model to capture system effects of
design changes
Initial Analysis: Sensitivity Study
Parameter Direction of Change CSM COE Impact (rounded)
SE Model COE Impact (rounded)
Rotor Diameter Increase -- ↓ Decrease ↑ ↑
Rated Power Increase ↑ --
Decrease ↑ ↓ Hub Height Increase -- ↓
Decrease -- ↑ Max Tip Speed Increase -- --
Decrease -- ↑
37
1. A systems perspective to wind energy cost and performance analysis is essential – extensive coupling exists between physical assets over long periods of time.
2. NREL has developed initial capability for modeling integrated wind plant systems for performance and cost.
3. Initial work shows improved representation of coupling in analysis results; however, model improvement is needed across all system models.
Conclusions and Summary
38
1. Continued development of individual models to upgrade fidelity of various areas (plant energy production, drivetrain component structural and cost modeling, etc)
2. Application and validation of initial model set in a variety of analyses
3. Increased focus on collaboration through the establishment of a “unified framework” for wind energy system modeling based on OpenMDAO