14
1

1 1

EXECUTIVE SUMMARY
From 2015 to 2017, the amount of solar photovoltaic (PV) electricity generating capacity installed in
Nova Scotia grew about 59% per year. In this rapidly-growing market, the trends in prices and
productivity of PV systems are of interest in the development of policy, programs, and education to
support continued and healthy growth.
In this report we update the estimates of prices and electrical productivity of PV electricity generation in
Nova Scotia, following on a previous report published in 2014 that was based on 2012 data. In general,
prices have decreased since 2012, while PV productivity per unit of installed capacity has remained about
the same, resulting in an overall decrease in the Levelized Cost of Electricity (LCOE) for solar power in
Nova Scotia.
By surveying PV customers and installers, we have estimated the price and productivity of solar electricity
in Nova Scotia as of the end of 2017. The estimates are based on data from 59 PV systems. The results
are summarized in Table 1 below:
Table 1: Summary of Key Results
FACTOR RESULTS 2017 %
CHANGE 2012 to 2017
% CHANGE
2013 to 2017
AVERAGE PRICE (INSTALLED) CAD$ 2.80 ± 0.10 / Watt (DC) 38% DROP* 6.4% DROP*
AVERAGE PRODUCTIVITY 1087 ± 34 kWh/kW per year NO CHANGE NO CHANGE
RANGE OF PRODUCTIVITY 841 TO 1248 kWh/kW per year NO CHANGE NO CHANGE
LEVELIZED COST OF ELECTRICITY (LCOE) – NOT INCLUDING HST
CAD$ 0.230 ± 0.015 / kWh 26% DROP* 5.7% DROP*
*NOTE: Most of the decrease in price and LCOE occurred from 2012 to 2013. The decrease since 2013 has
been modest. See Figure 3 in Section 5.1 for details.
We found that geographic location has very little effect on PV productivity within Nova Scotia. One region
of Nova Scotia in our sample, the region of Annapolis and Digby counties, had about 7% higher productivity
than the provincial average. All other regions in our sample had productivity that was not statistically
different from the average for the whole province.
2
1. INTRODUCTION
Following on an earlier (2014) report1, this is an update of the prices and productivity of solar photovoltaic (PV)
electricity generating systems in Nova Scotia. This
report is based on price and electricity production data
collected from existing PV systems connected to the electricity distribution grid across Nova Scotia that
were installed in the years between 2011 and 2017. This
data was used to estimate the following:
Price of solar PV systems, and the trend in that
price over time.
Annual electricity production of PV systems, and
its geographic variation in Nova Scotia.
Seasonal variation in PV electricity production,
based on monthly data.
Levelized cost of solar electricity in Nova Scotia
(LCOE), and the trend in that cost over time.
This report is intended to inform the public,
government, businesses, and other stakeholders about the value of solar electricity in Nova Scotia, for
consideration in project decision-making, policy
design, and planning in the solar electricity space.
2. PHOTOVOLTAIC TECHNOLOGIES
The PV generating technologies studied here are those most commonly in use in Nova Scotia in the
period from 2014 to 2017. The physical components
that most clearly characterize these systems are the
PV modules (commonly known as PV panels) and the inverter systems. The types of PV modules and
inverters most commonly used in Nova Scotia at this
time are described below.
2.1. PHOTOVOLTAIC MODULES
In our sample, the PV modules installed in Nova Scotia to generate electricity today are typically composed
of monocrystalline or polycrystalline silicon PV cells.
About a half-dozen brands of modules supply the
bulk of the PV projects in the province. Typical rated efficiencies of these modules are consistent with the
global market, between 15% and 18% (electrical
energy output per unit of incoming energy from solar
irradiance). All the data reported here is from systems using modules in this category.
2.2. INVERTER SYSTEMS
Inverters convert the direct current (DC) from the
PV modules to alternating current (AC) at the correct voltage and frequency, and synchronize this AC with
the main electricity supply on the distribution line.
The inverter system is an essential element of all the
PV projects studied here. We have found three types of inverter systems in use for PV projects in Nova
Scotia – string inverters, string inverters with
optimizers, and micro-inverters. These systems are
described below.
STRING INVERTERS: These are PV systems in which one inverter receives DC input from many PV
modules that are connected together in series to form
‘strings’. The voltage of the modules adds together
when connecting in series, so the number of modules in a string depends on the maximum voltage allowed
by the inverter and the electrical code. One common
maximum string voltage is 600 Volts DC (VDC),
although voltages up to 1000 VDC are beginning to
be used in Nova Scotia. Several strings are connected to the inverter, up to the number of strings the
inverter can accept.
3

String inverters on the market today have high
efficiency and are economical to install. However, they encounter issues of significantly decreased
output if one or more of the PV modules on any
string is sometimes shaded, for example with
shadows from trees, buildings, or other nearby objects, or partial snow coverage. Therefore, string
inverters are used most effectively in situations
where there little or no shading will occur during
maximum production hours, which are typically between 10 am and 4 pm.
STRING INVERTERS WITH OPTIMIZERS: These are string inverter systems, as described above, but
with additional equipment to maximize production.
Each PV module (or small group of modules) has an
‘optimizer’, a device mounted behind the module and connected together in series strings. The optimizer
increases the total power output of the array using
Maximum Power Point Tracking (MPPT). MPPT
measures the voltage and current from each module and adjusts the output voltage to maximize power
output. This is advantageous in situations when there
is partial shading of a string of modules. If one module
is shaded, its power output will decrease, but the optimizer will adjust its voltage to allow it to produce
as much power as possible, without decreasing the
voltage on the rest of the string. This helps each string
perform optimally even if some modules in the string experience sub-optimal conditions.
Optimizers also perform an advanced monitoring
function, by measuring and reporting energy output from each module. They also offer a safety feature, by
limiting the DC voltage from each module in the array
to a safe level when the grid power is down or the
system is shut off, for repair or emergency response.
MICRO-INVERTERS: In micro-inverter systems, an inverter is connected behind each PV module (or small
group of modules), or integrated into the module
itself. This converts the DC power to AC right at the module, and includes the MPPT feature, as described
previously. In a micro-inverter system, the power is
carried as grid-quality AC power, at the correct
voltage, frequency, and synchronization, directly from the module to the distribution grid.
Because AC grid power is more familiar to today’s
electricians, inspectors, and electrical equipment
suppliers, there is a relative simplicity to completing the wiring on a PV array with micro-inverters. And like
optimizers, the micro-inverters allow each module to
perform as well as possible independently, even if one
or more modules is shaded. Micro-inverters also provide safety in the case of a power outage or an
emergency, because when the grid is down or the
connection to the system is shut off, all the inverters
de-activate and there is no high DC voltage in the
wires that connect the solar modules.
Most of the PV projects for which we obtained data
in our study are using micro-inverters. There are also
projects in Nova Scotia with optimizers and string inverters. In this study, we have not collected enough
data to measure any possible difference in
performance between these types of inverter systems.
3. GROWTH OF PHOTOVOLTAIC ADOPTIONIN NOVA SCOTIA
The number of PV systems installed in Nova Scotia grew rapidly in the study period. To assess the pattern
and estimate the rate of growth, we used data reported
from the Nova Scotia Power Enhanced Net Metering
program. The PV projects that are connected to the Nova Scotia Power electrical distribution system each
4
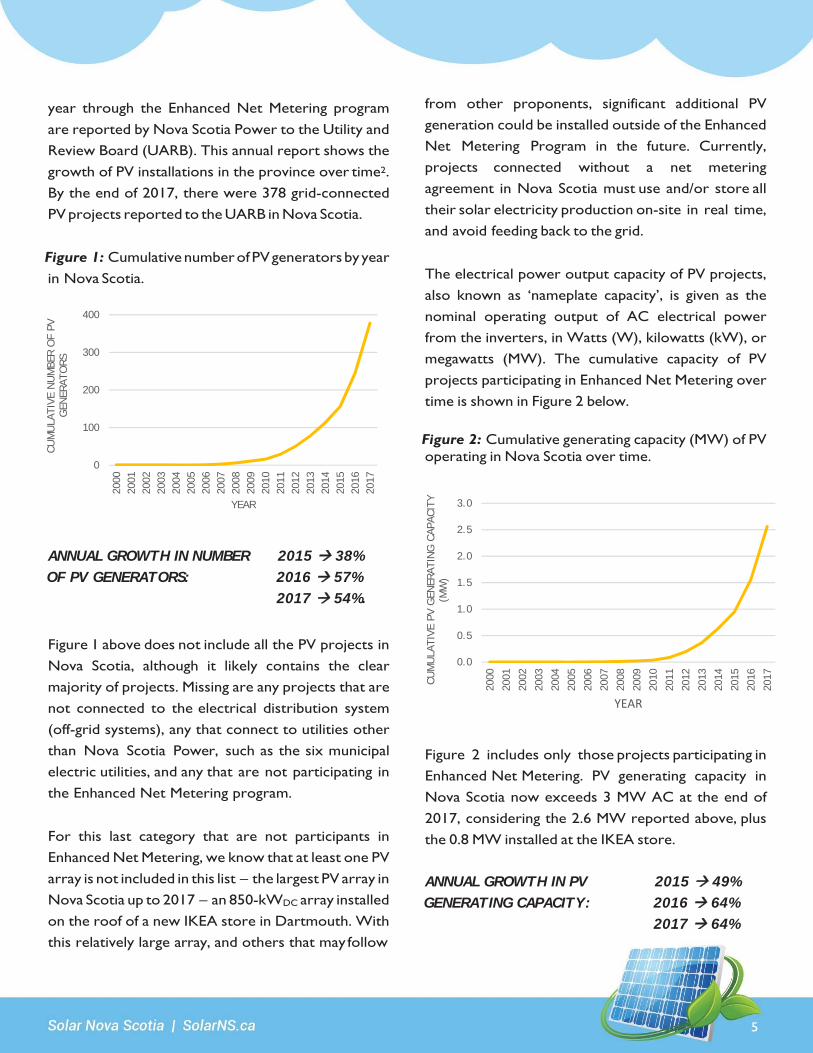
year through the Enhanced Net Metering program
are reported by Nova Scotia Power to the Utility and Review Board (UARB). This annual report shows the
growth of PV installations in the province over time2.
By the end of 2017, there were 378 grid-connected
PV projects reported to the UARB in Nova Scotia.
Figure 1: Cumulative number of PV generators by year
in Nova Scotia.
ANNUAL GROWTH IN NUMBER 2015 38%
OF PV GENERATORS: 2016 57%
2017 54%.
Figure 1 above does not include all the PV projects in
Nova Scotia, although it likely contains the clear majority of projects. Missing are any projects that are
not connected to the electrical distribution system
(off-grid systems), any that connect to utilities other
than Nova Scotia Power, such as the six municipal electric utilities, and any that are not participating in
the Enhanced Net Metering program.
For this last category that are not participants in Enhanced Net Metering, we know that at least one PV
array is not included in this list – the largest PV array in
Nova Scotia up to 2017 – an 850-kWDC array installed
on the roof of a new IKEA store in Dartmouth. With this relatively large array, and others that may follow
from other proponents, significant additional PV
generation could be installed outside of the Enhanced
Net Metering Program in the future. Currently, projects connected without a net metering
agreement in Nova Scotia must use and/or store all
their solar electricity production on-site in real time,
and avoid feeding back to the grid.
The electrical power output capacity of PV projects,
also known as ‘nameplate capacity’, is given as the
nominal operating output of AC electrical power from the inverters, in Watts (W), kilowatts (kW), or
megawatts (MW). The cumulative capacity of PV
projects participating in Enhanced Net Metering over
time is shown in Figure 2 below.
Figure 2: Cumulative generating capacity (MW) of PV operating in Nova Scotia over time.
Figure 2 includes only those projects participating in Enhanced Net Metering. PV generating capacity in
Nova Scotia now exceeds 3 MW AC at the end of
2017, considering the 2.6 MW reported above, plus
the 0.8 MW installed at the IKEA store.
ANNUAL GROWTH IN PV 2015 49%
GENERATING CAPACITY: 2016 64%
2017 64%
5
0
100
200
300
400
2000
2001
2002
2003
2004
2005
2006
2007
2008
2009
2010
2011
2012
2013
2014
2015
2016
2017
CU
MU
LATI
VE
NU
MBE
R O
F PV
G
ENER
ATO
RS
YEAR
0.0
0.5
1.0
1.5
2.0
2.5
3.020
00
2001
2002
2003
2004
2005
2006
2007
2008
2009
2010
2011
2012
2013
2014
2015
2016
2017CU
MU
LATIV
E PV
GEN
ERATIN
G C
APA
CIT
Y (M
W)
YEAR
The development of PV projects in Nova Scotia over
this period consists of many relatively small projects, along with a few larger ones. The average capacity per
project in 2017 was 7.5 kW AC, and in that year, there
was only one net metered project greater than 20 kW
of capacity.
4. DATA COLLECTION
We gathered data for this study by two methods – a
survey of owners of PV systems, and a survey of companies that install PV systems. We eliminated
duplicates between these studies, based on the
location of the project. In total, we received usable
data for 59 PV systems. Our sample represents approximately 15% of the installed systems in Nova
Scotia.
All the PV systems reported in this survey are fixed-
mount arrays, with some mounted to buildings and some mounted on stands on the ground. None of the
arrays reported here have a tracking system to
follow the sun.
4.1. CUSTOMER SURVEY
We invited people who have a PV system at their
property to complete a survey that included questions about the number and size of PV modules installed,
the type and capacity of inverters, the slope and
orientation of the modules, the installed price, and any
challenges they encountered in setting up their PV system.
We received 21 responses. For this report, we
excluded systems that were not connected to
the electrical grid (off-grid systems), and any with
incomplete information. With those systems excluded,
we were able to use customer data from 9 systems
to contribute to the pricing study. Because of this high attrition rate of non-usable survey reports, we
focused our efforts on obtaining survey results from
the companies that install PV systems.
4.2. INSTALLER SURVEY
We distributed a survey to companies that install PV
systems, asking them for information on the prices
of their installations over the past 4 years, and for
measured electricity production data from PV systems at their customers’ sites that have been operating for
at least 12 months. We received price data for 50
systems, and production data for 32 systems from
installers in response to the survey. We were able to use nearly all this data.
5. RESULTS
IMPORTANT NOTE - DC versus AC ratings: Accumulated electricity production from a PV array
over months or years is most closely related to the
nominal (rated) power of the solar modules, known as
the DC rated output of the system.
This is different from the discussion in Section 3
above, where the system sizes were reported by the
AC nameplate output capacity of the inverters, which is the power generating capacity of the power
processing equipment directly connected to the grid.
The DC power rating and AC nameplate capacity for a
PV array are often different, and typically the DC rating
6

is higher. The reason for the difference is that many
PV system designers specify greater DC rated power output (more modules in the array) than the rated
capacity of the inverter, often up to 20% more. This
causes the inverter to operate closer to its maximum
output more of the time, including partly-overcast
days and times when the sun is not at optimal angles, while not exceeding the power limit on the inverter.
The array will produce more energy over the course
of a year, for a given AC nameplate capacity, if there
are more DC modules installed.
This tendency to build in extra solar modules is especially strong when legislation or policy places a
restrictive limit on the AC power capacity of the
system, such as the 100-kW AC limit on net metering
projects in Nova Scotia, and the 50-kW AC limit on
project size in the Nova Scotia Solar Electricity for Community Buildings Program. A project proponent
can produce more electricity on a long-term basis, for
the same AC nameplate capacity, by building a larger
DC array.
5.1. PRICE
The PV systems in our price survey range in size from
0.6 kW to 100 kW (DC rated output), with an average
size of 9.7 kW. The average (mean) installed price of the PV systems in our sample over time is shown in
Figure 3 below. To be consistent, in the price and
productivity results, all system sizes are based on the
DC rated output of the PV modules of the PV array.
Figure 3: Price of photovoltaic systems over time.
NOTES:
-The price is normalized to the size of the system ($/Watt), in terms of
nominal (DC) rated power of the array, which is determined by the
combined rated power of the PV modules.
-Prices do not include Harmonized Sales Tax (HST).
-The error bars represent the uncertainty, calculated as the 90% confidence
interval of the mean.
-For 2011 we have only one data point in our sample, not enough to
determine an uncertainty range.
Table 2: PV system prices in Nova Scotia by year.
YEAR AVERAGE UNCERTAINTY
(±90% CONFIDENCE INTERVAL)
2011 4.42 N/A
2012 4.03 0.49
2013 2.77 0.22
2014 2.93 0.30
2015 2.73 0.13
2016 2.86 0.13
2017 2.56 0.16
7
4.424.03
2.77 2.932.73 2.86
2.56
0.00
1.00
2.00
3.00
4.00
5.00
2010 2011 2012 2013 2014 2015 2016 2017 2018
INST
ALL
ED P
RIC
E ($
/W D
C)
YEAR

The average price of PV systems appears to have dropped dramatically from 2011 to 2013, and then changed relatively little between 2014 and 2017. It is important to recognize that there is very little data in this sample from 2011 and 2012.
To consider the more recent trend, and years for which our sample has more data, Figure 4 shows the best-fit trend line from 2013 to 2017. Figure 4: PV systems price trend – 2013 to 2017.
Our sample does not show a statistically significant trend in the price of a PV installation since 2013. There appears to be a downward trend visually, but the variation within each year exceeds the trend, and the correlation coefficient of the trend is very low (0.3149). The 2017 prices appear to be anomalously low.
The most solid conclusion from this sample is that the price has varied around a fairly steady average of
$2.80 /W (DC), +/- $0.10 between 2013 and 2017.
Nova Scotia average PV price
2013-2017: Between $2.70 and $2.90 per Watt (DC)
2017: Between $2.40 and $2.72 per Watt (DC)
(Not including HST).
5.2. ANNUAL ELECTRICITY PRODUCTION
Our sample of production data from 31 systems around Nova Scotia showed a wide range of annual electricity production values. To compare different sizes of systems, we normalized the annual production per kilowatt (DC) of installed PV modules. The highest annual value in our sample in Nova Scotia was 1248, and the lowest was 841 kWh/kW. Figure 5: Distribution of systems by annual production (kWh/kW).
Average annual PV production in Nova Scotia
1087 ± 34 kWh / kW
The uncertainty is the 90% confidence interval. This average includes all systems in the sample, regardless of location, design, module orientation, potential shading issues, or inverter type. It represents an estimate of the bulk average productivity of real systems installed in Nova Scotia to date, not an idealized productivity. If your site factors are ideal, you may produce more than the average. With ideal conditions and system design, annual production above 1200 kWh/kW is possible. On the other hand, any claims to produce more than 1300 kWh/kW per year in Nova Scotia from a fixed-mount system are unlikely to be true.
8
2.00
2.20
2.40
2.60
2.80
3.00
3.20
3.40
2012 2013 2014 2015 2016 2017 2018
INST
ALL
ED P
RICE
($/W
DC)
YEAR
0
2
4
6
8
10
12
800 to 900 900 to1000
1000 to1100
1100 to1200
1200 to1300
NU
MBE
R O
F SY
STEM
S
ANNUAL ENERGY PRODUCTION (kWH / kW)
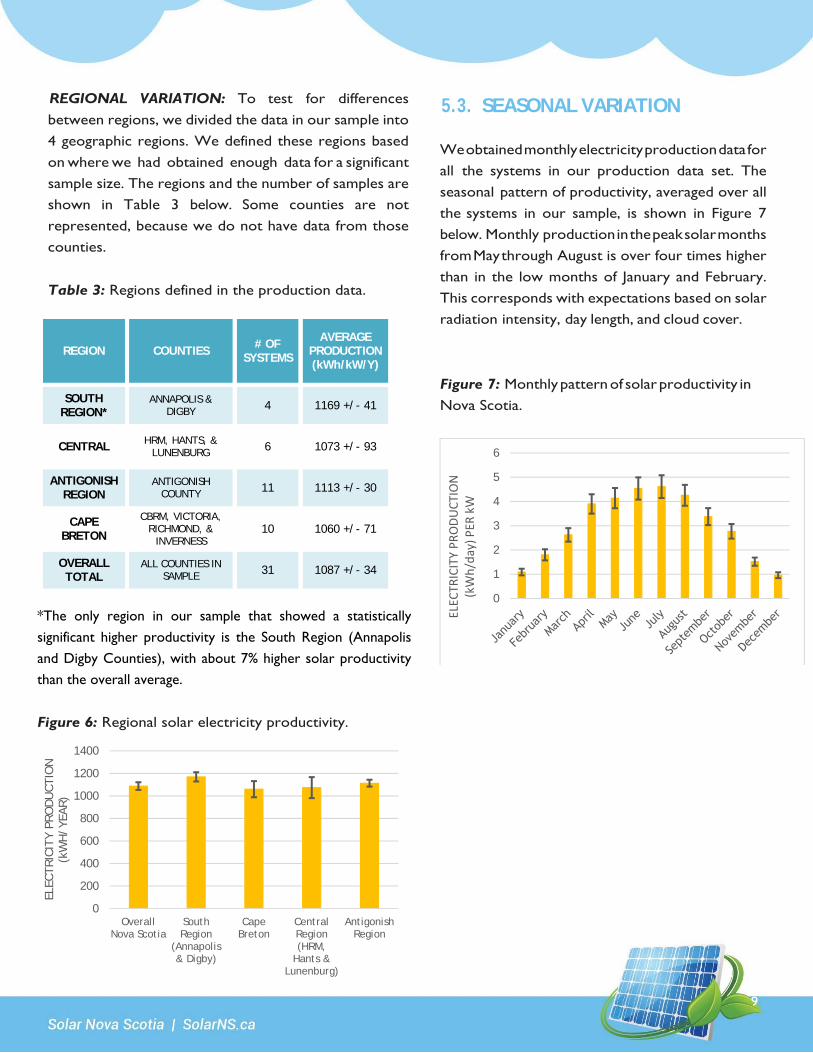
REGIONAL VARIATION: To test for differences
between regions, we divided the data in our sample into
4 geographic regions. We defined these regions based
on where we had obtained enough data for a significant
sample size. The regions and the number of samples are shown in Table 3 below. Some counties are not
represented, because we do not have data from those
counties.
Table 3: Regions defined in the production data.
REGION COUNTIES # OF SYSTEMS
AVERAGE PRODUCTION (kWh/kW/Y)
SOUTH REGION*
ANNAPOLIS & DIGBY 4 1169 +/- 41
CENTRAL HRM, HANTS, & LUNENBURG 6 1073 +/- 93
ANTIGONISH REGION
ANTIGONISH COUNTY 11 1113 +/- 30
CAPE BRETON
CBRM, VICTORIA, RICHMOND, &
INVERNESS 10 1060 +/- 71
OVERALL TOTAL
ALL COUNTIES IN SAMPLE 31 1087 +/- 34
*The only region in our sample that showed a statistically
significant higher productivity is the South Region (Annapolis
and Digby Counties), with about 7% higher solar productivitythan the overall average.
Figure 6: Regional solar electricity productivity.
5.3. SEASONAL VARIATION
We obtained monthly electricity production data for all the systems in our production data set. The
seasonal pattern of productivity, averaged over all
the systems in our sample, is shown in Figure 7 below. Monthly production in the peak solar months
from May through August is over four times higher
than in the low months of January and February.
This corresponds with expectations based on solar radiation intensity, day length, and cloud cover.
Figure 7: Monthly pattern of solar productivity in
Nova Scotia.
9
0
200
400
600
800
1000
1200
1400
OverallNova Scotia
SouthRegion
(Annapolis& Digby)
CapeBreton
CentralRegion(HRM,
Hants &Lunenburg)
AntigonishRegion
ELEC
TRIC
ITY
PRO
DU
CTIO
N
(kW
H/Y
EAR)
0
1
2
3
4
5
6ELEC
TRICITY PRODUCTION
(kWh/day) PER
kW

5.4. LEVELIZED COST OF SOLAR ELECTRICITY
The levelized cost of energy (LCOE) for solar
electricity is an estimate of the amortized cost per
kilowatt-hour (kWh) of producing electricity from
distributed solar electricity generators. LCOE considers the discount rate, also known as the weighted
average cost of capital (WACC). The inputs into the
estimate of LCOE are:
Capital cost of the generator system
Operating cost of the generator system
Anticipated output of the generator in each year
Anticipated operating lifetime of the generator
Assumed discount rate on future benefits
We have followed the method of the International
Renewable Energy Agency to calculate LCOE, as
follows3:
∑
1
∑1
Where:
LCOE = levelized cost of electricity generation;
It = investment expenditures in the year t;
Mt =operations and maintenance expenditures in the year t;
Ft = fuel expenditures in the year t (this is zero for solar);
Et = electricity generation in the year t;
r = discount rate;
n = economic life of the system (years).
We used the price and production data from Sections
4.1 and 4.2, along with the following assumptions, to
calculate the LCOE of solar electricity in Nova Scotia
in 2017. The spreadsheet tool we developed for this calculation is available.
ASSUMPTIONS:
Installed cost: $2.80 +/- $0.10 per W (not including HST) This is the 2013-2017 average price.
Annual electricity production in Year 1: 1087 +/- 34 kWh / kW
Economic life of system: 25 years
Annual decrease in PV energy output: 0.6% per year5
Discount rate: 6% annual
Annual maintenance and operating costs: CAD$25 per kW, with 2% annual inflation
Based on the assumptions above, for the average 2013 to 2017 prices, we estimate the LCOE of solar electricity in Nova Scotia as follows:
LCOE for PV in Nova Scotia in 2017:
$0.230 / kWh
Range: $0.216 to $0.245 / kWh
Adding HST raises LCOE by $0.035 / kWh
If the average installed price of PV systems in our
sample for just 2017 ($2.56 / W DC), is used in the
calculation, the LCOE decreases to $0.213 / kWh (not
including HST).
10
6. DISCUSSION
COST OF SOLAR ELECTRICITY: The estimated average cost of solar electricity in Nova
Scotia for 2017 is lower than in our previous report1
published in 2014, in which the LCOE was estimated to be between $0.29 and $0.36 per kWh. That figure was
based on 2012 price data and included HST. The
comparable value for 2017 in this current report is
between $0.25 and $0.28 / kWh (including HST), an
average drop of $0.06 / kWh. The cost of solar electricity in Nova Scotia has dropped by about 19%
over a 4-year period from 2012 to 2016.
The systems sampled in this study represent the
typical types and sizes of systems installed in Nova
Scotia over the past 4 years, which are relatively small
(mostly less than 10 kW) and distributed across a wide spectrum of sites and buildings. There are no
systems in this sample greater than 100 kW in size.
Therefore, this study represents the price of small-
scale, distributed solar energy, not large utility-scale solar energy in Nova Scotia.
PRODUCTIVITY OF SOLAR ELECTRICITY: We have not seen a significant change in the average electrical productivity of PV systems in Nova Scotia
since our earlier 2014 report, which estimated average
annual productivity at 1100 +/- 100 kWh/kW. The earlier figure was based on a much smaller sample of
6 systems, compared with 31 in this report. An
apparent minor decrease to 1087 +/- 34 kWh/kW is
not statistically significant, as the uncertainty ranges
overlap.
That an increase in electrical productivity per Watt has not been observed, despite that fact that solar
modules on the market have become more efficient,
is likely because we are reporting on the average production of all the installed systems for which we
could obtain data, not idealized cases where the array
orientation and sun exposure are optimized.
Our 2017 productivity estimate represents a realistic
sample of the systems that are operating now. Our
data show that with ideal siting and orientation it is possible to obtain annual output of over 1200
kWh/kW from a fixed-mount PV array in Nova Scotia,
but not more than 1300 kWh/kW.
COMPARISON WITH OTHER PRICE DATA:
Data on the pricing of installed PV systems is also
collected by Halifax Regional Municipality (HRM),
and can be compared with the results we have found. In November 2017, HRM published a municipal staff
report on the previous year of its Solar City program6.
This program offers municipal financing for property
owners to install solar PV, solar water heating, and solar air heating systems. From November 2016 to
October 26, 2017, the first year that PV was offered
in the program, the participants installed a total of 37
PV systems, with an average capacity of 6.0 kW per
installation.
The average installed price of PV systems in HRM
Solar City for 2017 was $2.88/W. HRM staff also
noted a decline in prices within their program, from
$3.10/W in October 2016 to about $2.60/W in October 2017.
The prices reported by HRM for small-scale PV installations are similar to the average price of $2.80
± $0.10/W we have found across Nova Scotia.
11

7. CONCLUSION
Based on the results of our survey, we make the
following primary conclusions:
PRICE: According to our sample, the average price of small-
scale photovoltaic installations in Nova Scotia fell
dramatically in 2013 and has remained close to the level of $2.80 / Watt since then, with some indications
of a slower, and not statistically significant, decline in
the years from 2014 to 2017.
PRODUCTIVITY: The annual electricity production of solar PV
generators in Nova Scotia in this reasonably representative sample has an average of 1087 ± 34
kWh/kW, and a range between 841 and 1248
kWh/kW. We found one region of Nova Scotia in our
sample, the region of Annapolis and Digby counties, with about 7% higher productivity than the provincial
average. All other regions in our sample were not
significantly different from the provincial average.
LEVELIZED COST OF ELECTRICITY (LCOE): The average LCOE for small-scale, distributed solar
electricity in Nova Scotia in 2017 is estimated to be
$0.230 ± 0.015 per kWh (not including HST), or
$0.265 ± 0.015 per kWh (including HST).
12
ENDNOTES
1 Groszko, W. and M. Butler, Solar Photovoltaics in Nova Scotia: Report on Costs and Measured Electrical Productivity, Ecology Action Centre and Province of Nova Scotia, Feb. 2014. Accessed June 12, 2018 at: http://0- nsleg-edeposit.gov.ns.ca.legcat.gov.ns.ca/deposit/b10692939.pdf
2 Nova Scotia Power Inc., Report to the Nova Scotia Utility and Review Board, Regulation 3.6 – 2017 Net Metering Report, January 31, 2018.
3 IRENA (2018), Renewable Power Generation Costs in 2017, International Renewable Energy Agency, Abu Dhabi, page 153. Accessed June 12, 2018 at: http://www.irena.org/publications/2018/Jan/Renewable-power- generation-costs-in-2017
4 Jordan, D. C., Kurtz, S. R., VanSant, K., and Newmiller, J. (2016) Compendium of photovoltaic degradation rates. Prog. Photovolt: Res. Appl., 24: 978–989. doi: 10.1002/pip.2744.
5 US National Renewable Energy Laboratory (NREL), Distributed Generation Renewable Energy Estimate of Costs, updated February 2016, Table 1. Accessed June 12, 2018 at: https://www.nrel.gov/analysis/tech-lcoe-re-cost- est.html
6 Item 11.1, Information Item No. 2, Report to the Environment and Sustainability Standing Committee, Halifax Regional Municipality, November 20, 2017. Accessed March 15, 2018 at https://www.halifax.ca/sites/default/ files/documents/city-hall/standing-committees/180201essc111.pdf
ACKNOWLEDGMENTS
The authors acknowledge the financial support of the Province of Nova Scotia (Department of Energy), and the Atlantic Canada Opportunities Agency (ACOA) for this work. We also express our appreciation to the study’s Advisory Team – Sheena Parris, Peter Craig, Matthew Wood, Blake Mann, Dr. Carolan McClarney, Hamish Malkin, David Brushett, and Gord Wilkie. We are especially grateful to the participants in our study who shared their data.
13

www.solarns.ca


