62
Conducted in Selected WRIA 1 Nooksack River and Independent Drainages. Nooksack Salmon Enhancement Association NSEA Salmon Spawning Grounds Surveys 2013
2013 NSEA Spawning Grounds Survey Report
Conducted in Selected WRIA 1
Nooksack River and Independent
Drainages.
Nooksack Salmon Enhancement
Association
NSEA Salmon Spawning Grounds Surveys 2013

2013 NSEA Spawning Grounds Survey Report
2013 NSEA Spawning Grounds Survey Report
ACKNOWLEDGEMENTS
Nooksack Salmon Enhancement Association Program Manager:
Annitra Ferderer
Nooksack Salmon Enhancement Association Monitoring Coordinator:
Katie Duane
Nooksack Salmon Enhancement Association Intern Surveyors:
Brandon Osterlund, James Berntson, Amy Oppfelt, Sarah Sekijima, Casey Pruitt
Nooksack Salmon Enhancement Association Volunteer Surveyors:
Victor Andreson
Bellingham Technical College Fisheries and Aquaculture students
Data Management/Report Compilation:
Katie Duane, Nooksack Salmon Enhancement Association
Henry Kei, BTC
Brandon Osterlund
James Berntson
Amy Oppfelt
Sarah Sekijima
Casey Pruitt
Thank you to the NSEA volunteers who provided valuable time, support and
knowledge to this project. We would also like to express our gratitude to the many
landowners who show their support of NSEA’s salmon recovery efforts by allowing
us to conduct spawning grounds surveys on their properties.
Training for surveyors was provided by the WDFW River Stock Assessment Fish
Biologist Natasha Geiger, NSEA Monitoring Coordinator Katie Duane, and BTC
Fisheries Program Instructor Ryan Vasak.
Funding for this project was provided by a WDFW Aquatic Lands Enhancement
Account (ALEA) grant. Other funding for this project was provided by an
appropriation from the Nooksack Salmon Enhancement Association and generous
contributions from Whatcom County community members.
2013 NSEA Spawning Grounds Survey Report
1
TABLE OF CONTENTS
Acknowledgements .................................................................................................................................................... 0
List of Figures .............................................................................................................................................................. 3
List of Tables ................................................................................................................................................................ 5
1.0 Introduction .................................................................................................................................................... 6
2.0 Methods ................................................................................................................................................................. 7
2.1 Quantitative Measurements ............................................................................................................................ 7
2.1.1 Live Counts ................................................................................................................................................ 7
2.1.2 Redd Counts .............................................................................................................................................. 8
2.1.3 Carcass Documentation............................................................................................................................ 8
2.2 Qualitative Measurements .............................................................................................................................. 9
2.3 Survey Reaches ................................................................................................................................................. 9
3.0 Results .................................................................................................................................................................. 13
3.1 Survey Conditions and Effort ....................................................................................................................... 13
3.2 Results by Species ........................................................................................................................................... 15
3.2.1 Chinook Salmon (Oncorhynchus tshawytscha) ...................................................................................... 18
3.2.2 Coho Salmon (Oncorhynchus kisutch) .................................................................................................... 18
3.2.3 Chum Salmon (Oncorhynchus keta) ....................................................................................................... 19
3.2.4 Uknown Salmonids ................................................................................................................................ 19
3.3 Reach Results and Habitat Descriptions ..................................................................................................... 20
3.3.1 Upper Anderson Creek .......................................................................................................................... 21
3.3.2 Bertrand Creek ........................................................................................................................................ 22
3.3.3 Lower Deer Creek ................................................................................................................................... 23
3.3.4 Upper Deer Creek ................................................................................................................................... 24
3.3.5 Lower Fishtrap Creek ............................................................................................................................. 25
2013 NSEA Spawning Grounds Survey Report
2
3.3.6 Upper Fishtrap Creek ............................................................................................................................. 26
3.3.7 Landingstrip Creek ................................................................................................................................. 27
3.3.8 Landingstrip Creek Tributary ............................................................................................................... 28
3.3.9 Lower Macaulay Creek .......................................................................................................................... 29
3.3.10 Upper Macaulay Creek ........................................................................................................................ 30
3.3.11 Mitchell Creek ....................................................................................................................................... 31
3.3.12 Padden Creek......................................................................................................................................... 32
3.3.13 Silver Springs Creek ............................................................................................................................. 33
3.3.14 Smith Creek ............................................................................................................................................ 34
3.3.15 Squalicum Creek ................................................................................................................................... 35
3.3.16 Tawes Creek ........................................................................................................................................... 36
3.3.17 Terrell Creek .......................................................................................................................................... 37
3.3.18 Tinling Creek ......................................................................................................................................... 38
3.3.19 Lower Whatcom Creek ......................................................................................................................... 39
3.3.20 Upper Whatcom Creek ......................................................................................................................... 40
4.0 Discussion ............................................................................................................................................................ 41
4.1 Data Limitations and Caveats ....................................................................................................................... 41
4.2 Notable Redd Counts ..................................................................................................................................... 42
4.3 Historical Trends in Redd Counts ................................................................................................................ 44
4.4 Future Work .................................................................................................................................................... 45
5.0 Past Reports ......................................................................................................................................................... 46
Appendix A. Directions to Spawning Grounds Survey Reach Locations ........................................................ 48
Appendix B. Materials and Equipment ................................................................................................................. 52
Appendix C. WDFW Survey Protocol ................................................................................................................... 53
Appendix D. Scale Card Instructions ..................................................................................................................... 54
2013 NSEA Spawning Grounds Survey Report
3
Appendix E. WDFW Scale Card Example ............................................................................................................. 56
Appendix F. Spawner Survey Photos .................................................................................................................... 57
LIST OF FIGURES
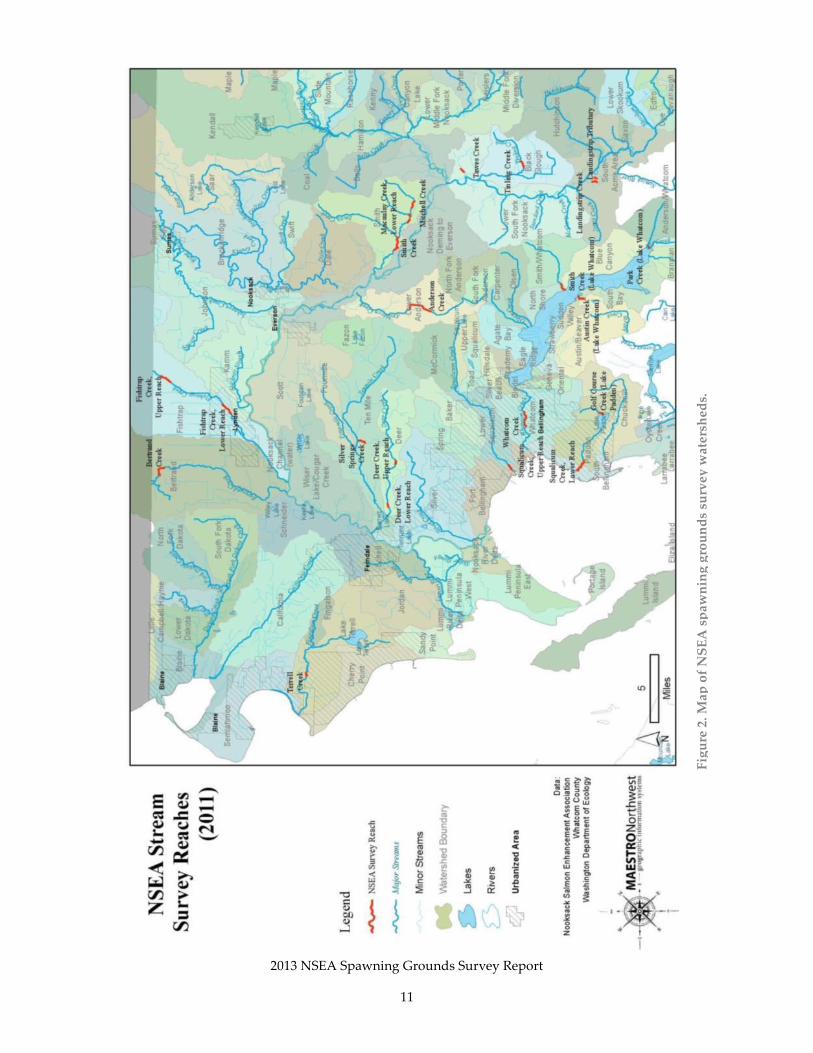
Figure 1. Map of NSEA spawning grounds survey reaches. .............................................................................. 10
Figure 2. Map of NSEA spawning grounds s ....................................................................................................... 10
Figure 3. Nooksack River discharge in cubic feet per second from September 1, 2013, to February 27, 2014.
Data recorded at the Ferndale US Geological Survey Gauging Station and can be obtained at
http://waterdata.usgs.gov/usa/nwis/uv?site_no=12213100. ................................................................................ 14
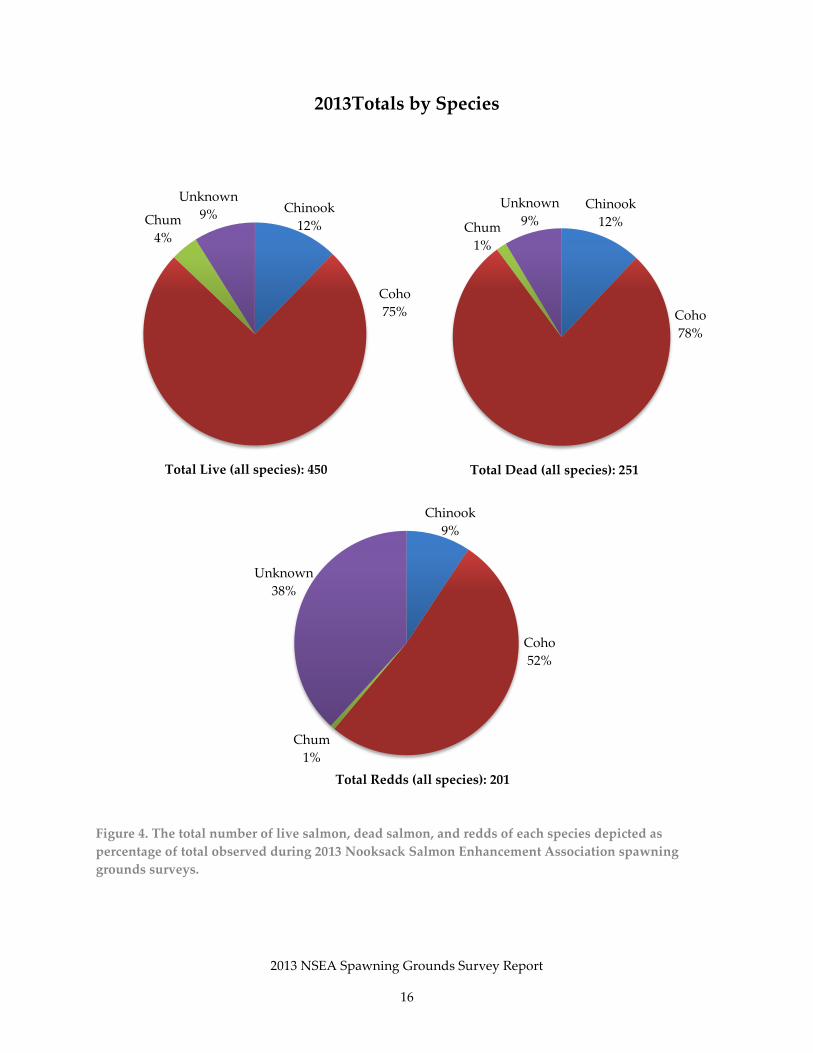
Figure 4. The total number of live salmon, dead salmon, and redds of each species depicted as percentage
of total observed during 2013 Nooksack Salmon Enhancement Association spawning grounds surveys. . 16
Figure 5. Total Chinook redds observed during NSEA spawning surveys from 1999 to 2013...................... 18
Figure 6. Total Coho redds observed during spawning surveys from 1999 to 2013. ...................................... 18
Figure 7. Total Chum redds observed during spawning surveys from 1999 to 2013...................................... 19
Figure 8. Total redd counts by reach and species observed during 2013 NSEA spawning surveys. ............ 20
Figure 9. The number of live fish counted in the upper reach of Anderson Creek throughout 2014 NSEA
spawning surveys (above) and the annual total number of redds by species counted in upper Anderson
Creek during NSEA surveys since 1999 (below). ................................................................................................. 21
Figure 10. The number of live fish counted in Bertrand Creek throughout 2014 NSEA spawning surveys
(above) and the annual total number of redds by species counted in Bertrand Creek during NSEA surveys
since 1999 (below). .................................................................................................................................................... 22
Figure 11. The number of live fish counted in the lower reach of Deer Creek throughout 2014 NSEA
spawning surveys (above) and the annual total number of redds by species counted in lower Deer Creek
during NSEA surveys since 1999 (below). ............................................................................................................ 23
Figure 12. The number of live fish counted in the upper reach of Deer Creek throughout 2014 NSEA
spawning surveys (above) and the annual total number of redds by species counted in upper Deer Creek
during NSEA surveys since 1999 (below). ............................................................................................................ 24
Figure 13. The number of live fish counted in the lower reach of Fishtrap Creek throughout 2014 NSEA
spawning surveys (above) and the annual total number of redds by species counted in lower Fishtrap
Creek during NSEA surveys since 1999 (below). ................................................................................................. 25

2013 NSEA Spawning Grounds Survey Report
4
Figure 14. The number of live fish counted in the upper reach of Fishtrap Creek throughout 2014 NSEA
spawning surveys (above) and the annual total number of redds by species counted in upper Fishtrap
Creek during NSEA surveys since 1999 (below). ................................................................................................. 26
Figure 15. The number of live fish counted in Landingstrip Creek throughout 2014 NSEA spawning
surveys (above) and the annual total number of redds by species counted in Landingstrip Creek during
NSEA surveys since 2005 (below). ......................................................................................................................... 27
Figure 16. The number of live fish counted in Landingstrip Creek tributary throughout 2014 NSEA
spawning surveys (above) and the annual total number of redds by species counted in Landingstrip
Creek tributary during NSEA surveys since 2009 (below). ................................................................................ 28
Figure 17. The number of live fish counted in the lower reach of Macaulay Creek throughout 2014 NSEA
spawning surveys (above) and the annual total number of redds by species counted in lower Macaulay
Creek during NSEA surveys since 2010 (below). ................................................................................................. 29
Figure 18. The number of live fish counted in the upper reach of Macaulay Creek throughout 2014 NSEA
spawning surveys (above) and the annual total number of redds by species counted in upper Macaulay
Creek during NSEA surveys since 1999 (below). ................................................................................................. 30
Figure 19. The number of live fish counted in Mitchell Creek tributary throughout 2014 NSEA spawning
surveys (above) and the annual total number of redds by species counted in Mitchell Creek tributary
during NSEA surveys since 1999 (below). ............................................................................................................ 31
Figure 20. The number of live fish counted in Padden Creek throughout 2014 NSEA spawning surveys
(above) and the annual total number of redds by species counted in Padden Creek during NSEA surveys
since 2009 (below). .................................................................................................................................................... 32
Figure 21. The number of live fish counted in Silver Springs Creek throughout 2014 NSEA spawning
surveys (above) and the annual total number of redds by species counted in Silver Springs Creek during
NSEA surveys since 1999 (below). ......................................................................................................................... 33
Figure 22. The number of live fish counted in Smith Creek throughout 2014 NSEA spawning surveys
(above) and the annual total number of redds by species counted in Smith Creek during NSEA surveys
since 1999 (below). .................................................................................................................................................... 34
Figure 23. The number of live fish by species counted in Squalicum Creek throughout 2014 NSEA
spawning surveys. .................................................................................................................................................... 35
Figure 24. The number of live fish counted in Tawes Creek throughout 2014 NSEA spawning surveys
(above) and the annual total number of redds by species counted in Tawes Creek during NSEA surveys
since 2006 (below). .................................................................................................................................................... 36

2013 NSEA Spawning Grounds Survey Report
5
Figure 25. The number of live fish counted in Terrell Creek throughout 2014 NSEA spawning surveys
(above) and the annual total number of redds by species counted in Terrell Creek during NSEA surveys
since 2003 (below). .................................................................................................................................................... 37
Figure 26. The number of live fish counted in Tinling Creek throughout 2014 NSEA spawning surveys
(above) and the annual total number of redds by species counted in Tinling Creek during NSEA surveys
since 1999 (below). .................................................................................................................................................... 38
Figure 27. The number of live fish counted in the lower reach of Whatcom Creek throughout 2014 NSEA
spawning surveys (above) and the annual total number of redds by species counted in lower Whatcom
Creek during NSEA surveys since 2012 (below). ................................................................................................. 39
Figure 28. The number of live fish counted in the upper reach of Whatcom Creek throughout 2014 NSEA
spawning surveys (above) and the annual total number of redds by species counted in upper Whatcom
Creek during NSEA surveys since 1999 (below). ................................................................................................. 40
Figure 29. The annual total number of coho redds counted in the tributary to Landingstrip Creek during
NSEA surveys since 2009. ........................................................................................................................................ 43
Figure 30. The annual total number of redds by species counted in Upper Fishtrap Creek during NSEA
surveys since 1999. .................................................................................................................................................... 43
Figure 31. The total number of redds observed per species each year during NSEA spawning surveys,
including the 15 year average for each species. Unknown species redds are not shown. .............................. 44
LIST OF TABLES
Table 1. Table containing stream WRIA Number, River Miles Surveyed, Survey Window, Number of
Surveys, and which organization performed the surveys for each of the 21 reaches. “Spot check” surveys
that consisted of going to the reach and confirming it to be either too turbid or unsafe to survey are not
included in the number of surveys count. ............................................................................................................. 12
Table 2. Number of live and dead salmon and redds by species and reach observed on NSEA spawning
grounds surveys in the fall 2013 season. ............................................................................................................... 15
Table 3. The number of salmon carcasses counted during NSEA 2013 spawning surveys with a clipped,
unmarked, and unknown adipose fin status for each species in each survey region of the Nooksack River
basin. ........................................................................................................................................................................... 17
Table 4. The number of live and dead pink salmon and pink redds counted during NSEA 2013 spawning
surveys in Nooksack River tributaries and Whatcom County independent drainages. ................................ 17
2013 NSEA Spawning Grounds Survey Report
6
1.0 INTRODUCTION
The Nooksack Salmon Enhancement Association (NSEA) is a community-based
nonprofit organization dedicated to restoring sustainable wild salmon runs in Whatcom
County. In order to gain more information about the health of local salmon populations
and to monitor the effectiveness of NSEA restoration sites, NSEA staff and volunteers
conduct annual salmon population monitoring.
In the fall of 2013, NSEA conducted spawning grounds surveys for Chinook salmon
(Oncorhynchus tshawytscha), coho salmon (O. kisutch), and chum salmon (O. keta).
Surveyors also counted pink salmon (O. gorbuscha), but because surveys began in
October and the pink runs normally begin in August, the whole run window was not
observed. Pink salmon return every two years, spawning in odd years in the Nooksack
basin. While pink salmon are not a target species of NSEA surveys, they are counted
and recorded if seen during surveys for Chinook, coho, and chum.
Surveys were conducted under the direction of the Department of Fish and Wildlife
(WDFW) in select Nooksack River basin tributaries and independent drainages in
Whatcom County. Information collected supplements salmonid population data that is
collected annually by Nooksack basin fisheries co-managers, including: Lummi Nation,
the Nooksack Indian Tribe, and WDFW. NSEA has conducted spawning grounds
surveys for fifteen years, and this extensive historical data set allows for monitoring
long-term trends at the stream reaches surveyed.
In 2013, NSEA surveyed 20 designated reaches in 15 streams, located in the Water
Resource Inventory Area 1 (WRIA 1). Surveys began in early October and finished mid-
February. Students from Bellingham Technical College’s (BTC) Fisheries and
Aquaculture Sciences program also volunteered with NSEA to conduct surveys in select
reaches. Maps and descriptions of all NSEA survey reaches can be found in Figure 1
and Appendix A. Surveyed streams are located in several regions throughout Whatcom
county, including: the Nooksack River upper main stem, lower main stem, and south
fork, as well as Whatcom County independent drainages (Figure).
2013 NSEA Spawning Grounds Survey Report
7
2.0 METHODS
NSEA spawning grounds survey protocol was developed to meet WDFW reporting
requirements (Appendix C). Surveys were conducted every 7-10 days, depending upon
stream visibility and surveyor availability. Parameters recorded include: temperature,
pH, time in, time out, live count, carcass count, redd count, carcass scale card
information, weather, visibility, and flow. Otolith samples were also recovered from
Chinook carcasses in reaches that NSEA surveyed (BTC surveyors did not collect
otoliths). For a list of which reaches NSEA surveyed, see Table 1. All data, except for
the information on the scale cards, was entered into a NSEA spreadsheet as soon as
possible after the survey. Extreme care was taken to avoid habitat and redd disturbance
by walking around redds or exiting the stream if fish were actively digging redds or if it
was impossible to avoid redds by staying in the stream. If the creek became too deep or
turbid at points, the survey was done from the stream bank. Surveys continued until no
new redds, carcasses, or live fish were seen for two consecutive weeks.
At least two surveyors recorded qualitative and quantitative data on Rite in the Rain®
notebooks during survey, and results were compared at the end to reduce error. Each
member of the survey team was supplied with a complete survey tool kit, so that there
would be backup equipment, in case tools were broken or lost during a survey.
Surveyors wore polarized sunglasses to increase stream visibility and walked upstream
to prevent increased turbidity.
2.1 QUANTITATIVE MEASUREMENTS
Water temperature and pH were measured and recorded at the entry point of each
reach. Temperature was measured with a field thermometer. The pH was measured
using semi-qualitative Hach® water quality pH test strips. Time of entry and exit was
also recorded.
2.1.1 LIVE COUNTS
Live fish were counted and recorded, and the species were identified when possible. A
minimum wait time of 7 days was adhered between surveys to reduce the possibility of
recounting the same live fish. A hand held counting device was used if large quantities
of live fish were found to reduce counting errors. When circumstances did not allow for
accurate identification of a fish, due to the fish swimming into deep pools or hiding
under woody debris, the fish was documented as an “unknown” species.

2013 NSEA Spawning Grounds Survey Report
8
2.1.2 REDD COUNTS
Redd sightings were recorded and identified by fish species. Surveyors tagged each
redd by placing labeled flagging tape on a near-by branch or rock to avoid being
walked on or recounted during future surveys. The flagging tape label included the
following information: redd species, date, organization conducting the survey, and
surveyor’s initials. When circumstances did not allow for accurate identification of the
fish species that constructed the redd, due to no fish on or near the redd, it was
documented as “unknown”. Redds were only counted when both a depression and a
downstream mound of clean, non-compacted substrate were present. Redd sightings
were confirmed by accompanying surveyors to reduce counting errors.
2.1.3 CARCASS DOCUMENTATION
Carcasses were counted and the following information collected: species, sex, fork
length, adipose fin presence or absence, coded wire tag absence or presence, and
spawning state (amount of remaining eggs or milt). Surveyors extracted otoliths from
Chinook salmon carcasses and placed them in a vial with ethanol preservative to be
submitted to the WDFW at the end of the season. Additionally, the carcass count,
species, and otolith vial numbers were recorded in the surveyor’s data notebooks.
Carcass examinations were completed in several steps. First, the scale card information
was completed with the stream name, WRIA number and sub-basin code, date, river
miles, species, sex, adipose fin presence or absence, type of survey (foot), and the
sampler’s initials. Identification of the fish was based on seasonal run times and
defining characteristics of the different salmon species. To confirm the sex, an incision
was made from the vent to the pelvic fins. Evidence of eggs, milt, or the reproductive
organs verified the sex of the fish. If the adipose fin was absent, the carcass was checked
for a coded wire tag (CWT) with a CWT detector wand by placing it near and in the
mouth of the carcass. If the device emitted an audible beep, indicating that a CWT was
present, the head was removed and placed in a plastic bag with a label to be submitted
to the WDFW. Next, three scales from each side of the fish were extracted and placed
onto the scale card. Scales were collected using tweezers and taken ideally from above
the lateral line and posterior of the dorsal fin, depending upon the state of carcass
decay. Care was taken to not flip the scales upside down when transferring to the scale
card to ensure proper reading in the lab. Information on gill and eye conditions was
also recorded to be used as a time of death estimate. Gill condition was noted as red,
pink, grey or unknown (if absent). Eye condition was noted as clear, cloudy, or
unknown. After the data was collected and recorded, the caudal fin (the tail) was cut off
2013 NSEA Spawning Grounds Survey Report
9
to avoid re-counting and re-sampling of the same fish. If a carcass was too decomposed
to sample, it was recorded in the data notebook but not sampled. If a carcass was too
decayed to identify, it was recorded as an “unknown” species. After the caudal fin was
removed, the carcass was returned to the location it was found.
2.2 QUALITATIVE MEASUREMENTS
At the start of each survey the weather was recorded and the air temperature was
estimated. Weather was recorded as sunny, overcast, raining, windy, or a combination
of thereof. Rain was further described as light, moderate/drizzle, heavy, or other
equivalent language.
After the survey was completed, the surveyors estimated the visibility and flow of the
entire reach based on the pre-determined WDFW code. Flow was estimated by speed
and volume of water in the stream and relative to each individual creek. Visibility was
estimated by turbidity of the stream (water clarity) as well as the amount of the stream
bed that was visible throughout the survey reach. If there were dark pools, large woody
debris, or other obstructions, the reach would receive a lower visibility rating.
2.3 SURVEY REACHES
Survey reaches were originally selected based on the available WDFW data. For
logistical reasons, the streams were selected based on their accessibility and also their
proximity to past or future NSEA stream restoration sites. The data collected on
spawning grounds surveys helps measure the effectiveness of NSEA habitat restoration
projects completed on those streams. See Figure 1 and Figure 2 for maps of NSEA
survey reaches across Whatcom County and Table 1 for a list of reaches surveyed, with
river miles and the number of surveys completed.

2013 NSEA Spawning Grounds Survey Report
10
Fig
ure
1. M
ap o
f N
SE
A s
paw
nin
g g
rou
nd
s su
rvey
re
ach
es.
2013 NSEA Spawning Grounds Survey Report
11
Fig
ure
2. M
ap o
f N
SE
A s
paw
nin
g g
rou
nd
s su
rvey
wat
ersh
eds.

2013 NSEA Spawning Grounds Survey Report
12
Table 1. Table containing stream WRIA Number, River Miles Surveyed, Survey Window, Number of
Surveys, and which organization performed the surveys for each of the 21 reaches. “Spot check”
surveys that consisted of going to the reach and confirming it to be either too turbid or unsafe to
survey are not included in the number of surveys count.
Stream Surveyed WRIA
Number
River
Miles
Surveyed
By Survey Window
Number of
Surveys
Anderson Creek, Upper 01-0228 2.7 - 4.0 BTC 10/18/13 - 2/7/14 13
McCauley Creek, Lower 01-0235 0.5 - 1.0 NSEA 10/17/13 - 2/11/14 17
McCaulay Creek, Upper 01-0235 1.0 - 1.5 NSEA 10/17/13 - 2/11/14 16
Mitchell Creek 01-0236 0.3 - 1.0 NSEA 10/17/13 - 2/11/14 15
Smith Creek 01-0234 2.5 - 3.5 BTC 10/20/13 - 2/8/14 10
Bertrand Creek 01-0201 8.2 - 8.7 NSEA 10/14/13 - 1/29/14 14
Deer Creek, Lower 01-0165 0.5 - 0.8 BTC 10/18/13 - 1/23/14 11
Deer Creek, Upper 01-0165 3.2 - 3.7 BTC 10/18/13 - 2/12/14 10
Fishtrap Creek, Lower 01-0210 4.9 - 5.7 NSEA 10/10/13 - 2/12/14 10
Fishtrap Creek, Upper 01-0210 8.8 - 9.2 NSEA 10/10/13 - 2/5/14 28
Silver Springs Creek 01-0189 0.0 - 0.5 BTC 10/18/13 - 1/22/14 12
Tawes Creek 01-0247 0.4 - 0.5 NSEA 10/16/13 - 2/5/14 15
Tinling Creek 01-0250 2.0 - 2.3 NSEA 11/14/13 - 1/30/14 9
Landingstrip Creek 01-0263 0.4 - 1.0 NSEA 10/16/13 - 1/29/14 15
Landingstrip Creek
Tributary 01-0263 0.0 - 0.4 NSEA 10/16/13 - 2/11/14 15
Whatcom Creek, Lower 01-0556 1.4 - 1.9 BTC 10/18/13 - 1/23/14 10
Whatcom Creek, Upper 01-0556 1.9 - 2.7 BTC 10/18/13 - 1/22/14 10
Terrell Creek 01-0089 4.9 - 5.3 BTC 10/18/13 - 1/23/14 14
Padden Creek 01-0622 0.0 - 0.8 BTC 10/18/13 - 1/23/14 11
Squalicum Creek 01-0522 0.0 - 0.5 BTC 10/18/13 - 1/23/14 13
Total 268
2013 NSEA Spawning Grounds Survey Report
13
3.0 RESULTS
The following section details the results of the 2013 NSEA spawning grounds surveys in
three sections, including: Survey Conditions and Effort, Results by Species, and Results
by Survey Reach.
3.1 SURVEY CONDITIONS AND EFFORT
The 2013 salmon spawning season began with above average rainfall during the month
of September. This resulted in all streams except Tinling and Deer creeks being
accessible to spawning salmon by the time surveys began in October. Below average
rainfall for the month of October made for optimal surveying conditions throughout the
month. Flow in Deer creek increased due to the rainfall, allowing access for spawning
salmon.
The month of November was characterized by heavy rain events followed by long
periods of little to no rain. This rain pattern continued into the beginning of December.
This periodic rain pattern caused less than ideal survey conditions for many of the
reaches. During November and December many reaches that are within the urban
sprawl of Bellingham such as Squalicum and Whatcom creeks were too turbid to
survey. By mid-November the rainfall increased the flow in Tinling creek enough to
make it accessible to spawning salmon.
During mid-December air temperatures stayed below freezing causing all of the reaches
to freeze. Streams that were surveyed had poor visibility conditions due to the ice and
turbidity. Temperatures rose in late December and the combination of snow/ice melt
and rain events of significant volume, caused the Anderson and Deer creek reaches to
be too turbid to survey.
In early January, many of the streams near Bellingham could not be surveyed due to a
combination of frozen streams and high flow causing increased turbidity. The creek bed
of Tinling creek was dry after January 30th.
Surveys continued into February in order to have two consecutive surveys with zero
fish or new redds counted, ensuring that the runs were finished. However some of the
final zero count surveys were not performed due to elevated turbidity and/or frozen
streams. These included the lower reach on Fishtrap creek on February 4th, the
Landingstrip reaches and Mitchell creek reach on February 5th, and the Fishtrap creek
reaches on February 12th. Live spawning salmon were not observed after January 23,
2014. In total, 268 surveys were completed (Table 1).

2013 NSEA Spawning Grounds Survey Report
14
Figure 3. Nooksack River discharge in cubic feet per second from September 1, 2013, to February 27,
2014. Data recorded at the Ferndale US Geological Survey Gauging Station and can be obtained at
http://waterdata.usgs.gov/usa/nwis/uv?site_no=12213100.
2013 NSEA Spawning Grounds Survey Report
15
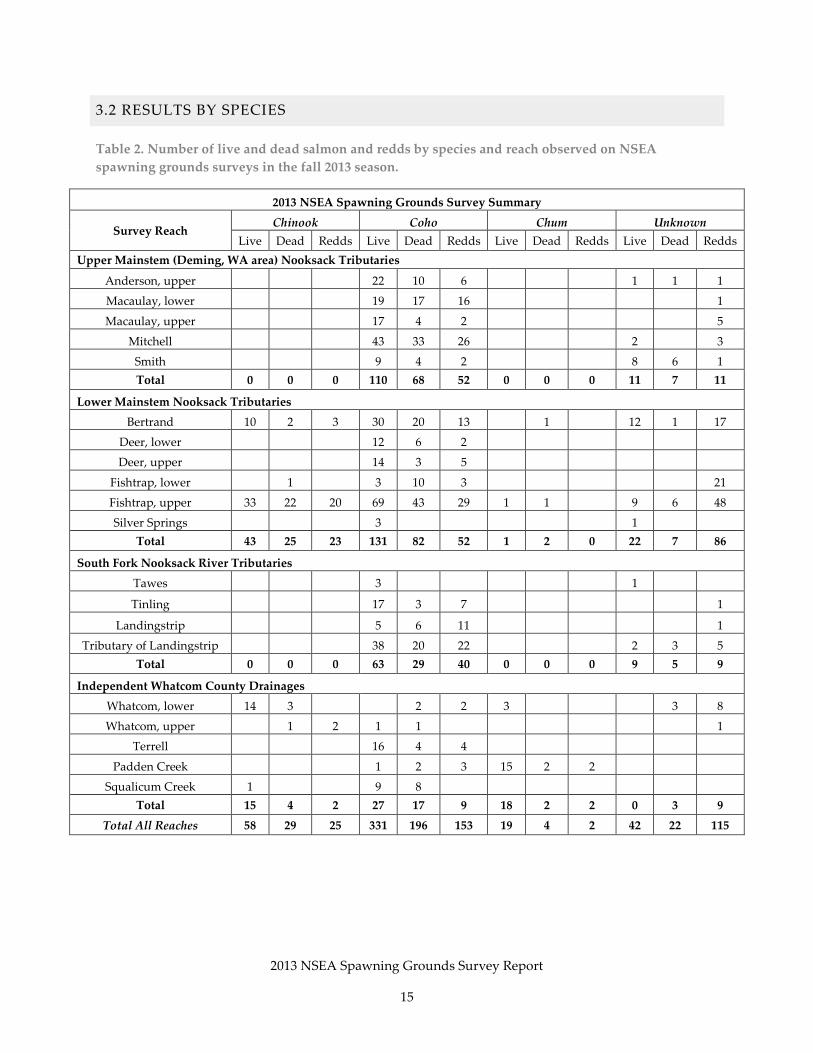
3.2 RESULTS BY SPECIES
Table 2. Number of live and dead salmon and redds by species and reach observed on NSEA
spawning grounds surveys in the fall 2013 season.
2013 NSEA Spawning Grounds Survey Summary
Survey Reach Chinook Coho Chum Unknown
Live Dead Redds Live Dead Redds Live Dead Redds Live Dead Redds
Upper Mainstem (Deming, WA area) Nooksack Tributaries
Anderson, upper 22 10 6 1 1 1
Macaulay, lower 19 17 16 1
Macaulay, upper 17 4 2 5
Mitchell 43 33 26 2 3
Smith 9 4 2 8 6 1
Total 0 0 0 110 68 52 0 0 0 11 7 11
Lower Mainstem Nooksack Tributaries
Bertrand 10 2 3 30 20 13 1 12 1 17
Deer, lower 12 6 2
Deer, upper 14 3 5
Fishtrap, lower 1 3 10 3 21
Fishtrap, upper 33 22 20 69 43 29 1 1 9 6 48
Silver Springs 3 1
Total 43 25 23 131 82 52 1 2 0 22 7 86
South Fork Nooksack River Tributaries
Tawes 3 1
Tinling 17 3 7 1
Landingstrip 5 6 11 1
Tributary of Landingstrip 38 20 22 2 3 5
Total 0 0 0 63 29 40 0 0 0 9 5 9
Independent Whatcom County Drainages
Whatcom, lower 14 3 2 2 3 3 8
Whatcom, upper 1 2 1 1 1
Terrell 16 4 4
Padden Creek 1 2 3 15 2 2
Squalicum Creek 1 9 8
Total 15 4 2 27 17 9 18 2 2 0 3 9
Total All Reaches 58 29 25 331 196 153 19 4 2 42 22 115
2013 NSEA Spawning Grounds Survey Report
16
Figure 4. The total number of live salmon, dead salmon, and redds of each species depicted as
percentage of total observed during 2013 Nooksack Salmon Enhancement Association spawning
grounds surveys.
2013Totals by Species
Chum
4% Pink
3%
Unknown
9%
Chinook
9%
Coho
52%
Chum
1%
Unknown
38%
Total Live (all species): 450 Total Dead (all species): 251
Total Redds (all species): 201
Chinook
12%
Coho
78%
Chum
1%
Unknown
9% Chinook
12%
Coho
75%
Chum
4%
Unknown
9%

2013 NSEA Spawning Grounds Survey Report
17
Table 3. The number of salmon carcasses counted during NSEA 2013 spawning surveys with a clipped,
unmarked, and unknown adipose fin status for each species in each survey region of the Nooksack
River basin.
2013 NSEA Spawning Grounds Survey Carcass Adipose Fin Data
Region Creek Chinook Coho
Clipped Unmarked Unknown Clipped Unmarked Unknown
Lower Mainstem Bertrand 2 0 0 3 11 0
Fishtrap 11 5 1 3 40 0
Upper Mainstem Macaulay
0 0 0 2 12 1
Mitchell 0 0 0 1 23 2
South Fork Landingstrip
(main & trib.) 0 0 0 5 15 0
Total 13 5 1 14 101 3
* Note: Adipose fin data was not collected on creeks surveyed by Bellingham Technical College,
including: Padden, Whatcom, Squalicum, Terrell, Deer, Silver Springs, Anderson, and Smith Creeks.
Table 4. The number of live and dead pink salmon and pink redds counted during NSEA 2013
spawning surveys in Nooksack River tributaries and Whatcom County independent drainages.
2013 NSEA Spawning Grounds Survey Pink Salmon
Survey Reach Live Dead Redds
Smith 9 5 4
Bertrand 1 2 2
Fishtrap, Upper 3 4 1
Landingstrip Tributary 3 17 7
Squalicum Creek 0 3 0
Total 16 31 14
* Note: Pink Salmon begin spawning in mid to late August in the Nooksack River basin, and NSEA
surveys began early October, so only the end of the spawning season was surveyed for pinks. Pink
salmon spawn during odd years, returning on a two year cycle. While pinks are not a target species for
surveys, NSEA does record pinks that are observed during surveys for Chinook, coho, and chum salmon.
2013 NSEA Spawning Grounds Survey Report
18
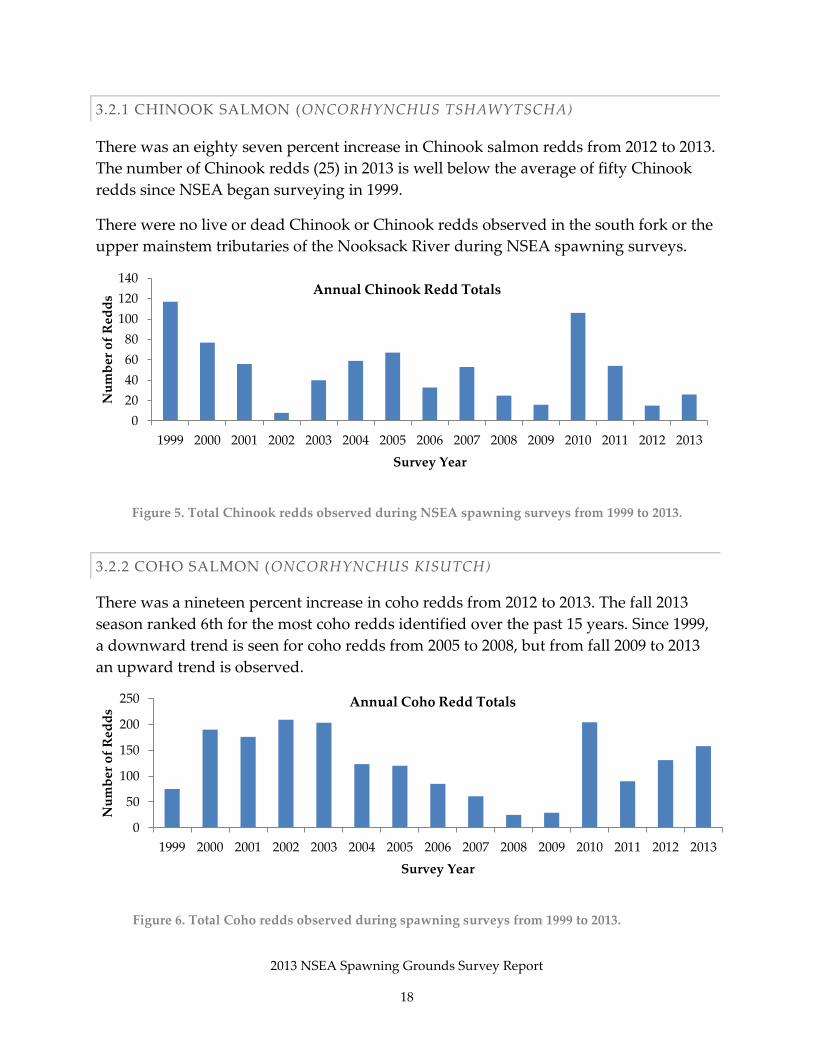
3.2.1 CHINOOK SALMON (ONCORHYNCHUS TSHAWYTSCHA)
There was an eighty seven percent increase in Chinook salmon redds from 2012 to 2013.
The number of Chinook redds (25) in 2013 is well below the average of fifty Chinook
redds since NSEA began surveying in 1999.
There were no live or dead Chinook or Chinook redds observed in the south fork or the
upper mainstem tributaries of the Nooksack River during NSEA spawning surveys.
Figure 5. Total Chinook redds observed during NSEA spawning surveys from 1999 to 2013.
3.2.2 COHO SALMON (ONCORHYNCHUS KISUTCH)
There was a nineteen percent increase in coho redds from 2012 to 2013. The fall 2013
season ranked 6th for the most coho redds identified over the past 15 years. Since 1999,
a downward trend is seen for coho redds from 2005 to 2008, but from fall 2009 to 2013
an upward trend is observed.
0
20
40
60
80
100
120
140
1999 2000 2001 2002 2003 2004 2005 2006 2007 2008 2009 2010 2011 2012 2013
Nu
mb
er o
f R
edd
s
Survey Year
Annual Chinook Redd Totals
Figure 6. Total Coho redds observed during spawning surveys from 1999 to 2013.
0
50
100
150
200
250
1999 2000 2001 2002 2003 2004 2005 2006 2007 2008 2009 2010 2011 2012 2013
Nu
mb
er o
f R
edd
s
Survey Year
Annual Coho Redd Totals

2013 NSEA Spawning Grounds Survey Report
19
3.2.3 CHUM SALMON (ONCORHYNCHUS KETA)
Nineteen live chum salmon were counted during 2013. Fifteen of the nineteen were
found at Padden Creek. The vast majority of chum redds have been found in Squalicum
and Padden Creeks over the past 15 years. Since 2007, chum redd totals have been low,
averaging only two redds counted per survey season.
There were no live or dead chum or chum redds observed in the Upper Mainstem
Nooksack Tributaries or in the South Fork Nooksack River Tributaries on NSEA
spawning grounds surveys.
3.2.4 UKNOWN SALMONIDS
In 2013, one hundred and fifteen redds were documented during NSEA surveys as
being created by an unknown species. Seventeen of these unknown redds were
observed in Bertrand Creek and sixty nine were recorded in the Upper and Lower
Fishtrap reaches. These redds were most likely coho or Chinook redds since they are
primarily coho and Chinook streams and the redds were observed during the usual
coho or Chinook spawning window. To avoid errors, NSEA records a redd as unknown
unless a live fish or carcass is seen on or near the redd. In many cases, redds are
observed without accompanying fish, and are therefore identified as an unknown
species. See Table 2 for a complete listing of where unknown species redds were seen.
0
50
100
150
200
250
300
350
1999 2000 2001 2002 2003 2004 2005 2006 2007 2008 2009 2010 2011 2012 2013
Nu
mb
er o
f R
edd
s
Survey Year
Annual Chum Redd Totals
Figure 7. Total Chum redds observed during spawning surveys from 1999 to 2013.

2013 NSEA Spawning Grounds Survey Report
20
Figure 8. Total redd counts by reach and species observed during 2013 NSEA spawning surveys.
3.3 REACH RESULTS AND HABITAT DESCRIPTIONS
0
10
20
30
40
50
60
Nu
mb
er o
f R
edd
s
Survey Reach
2013 Redd Counts by Survey Reach
Chinook
Coho
Chum
Unknown
2013 NSEA Spawning Grounds Survey Report
21
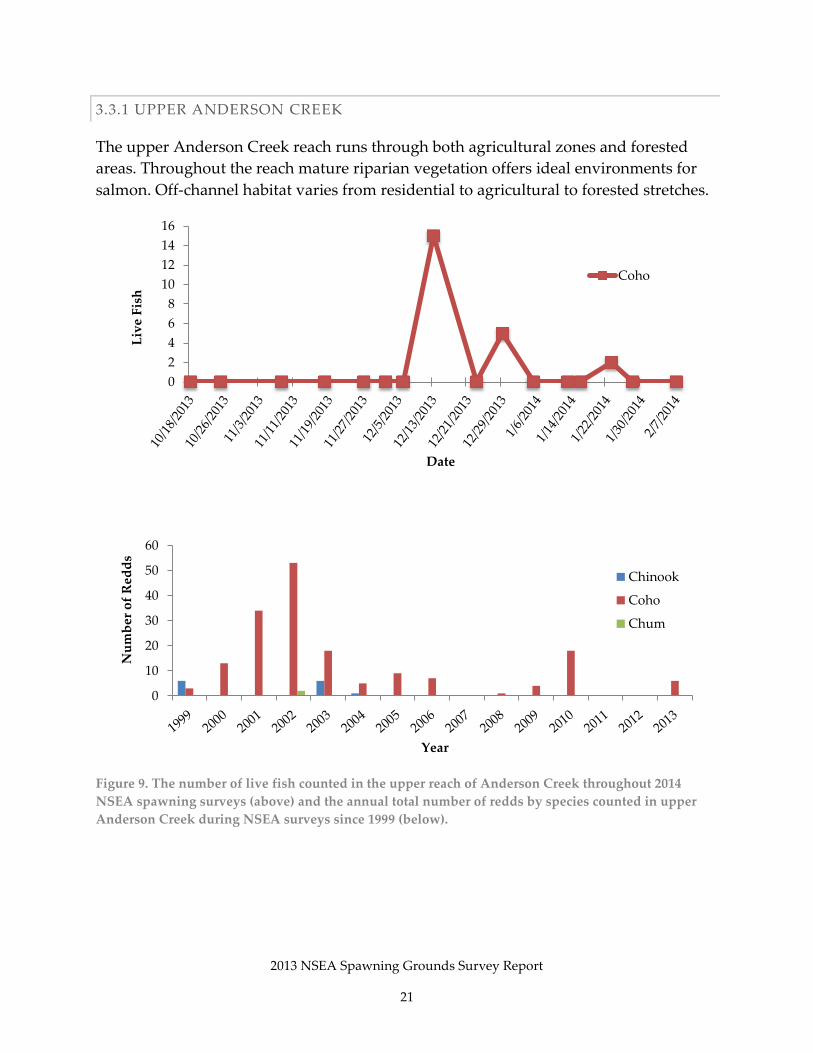
3.3.1 UPPER ANDERSON CREEK
The upper Anderson Creek reach runs through both agricultural zones and forested
areas. Throughout the reach mature riparian vegetation offers ideal environments for
salmon. Off-channel habitat varies from residential to agricultural to forested stretches.
Figure 9. The number of live fish counted in the upper reach of Anderson Creek throughout 2014
NSEA spawning surveys (above) and the annual total number of redds by species counted in upper
Anderson Creek during NSEA surveys since 1999 (below).
0
2
4
6
8
10
12
14
16
Liv
e F
ish
Date
Coho
0
10
20
30
40
50
60
Nu
mb
er o
f R
edd
s
Year
Chinook
Coho
Chum
2013 NSEA Spawning Grounds Survey Report
22
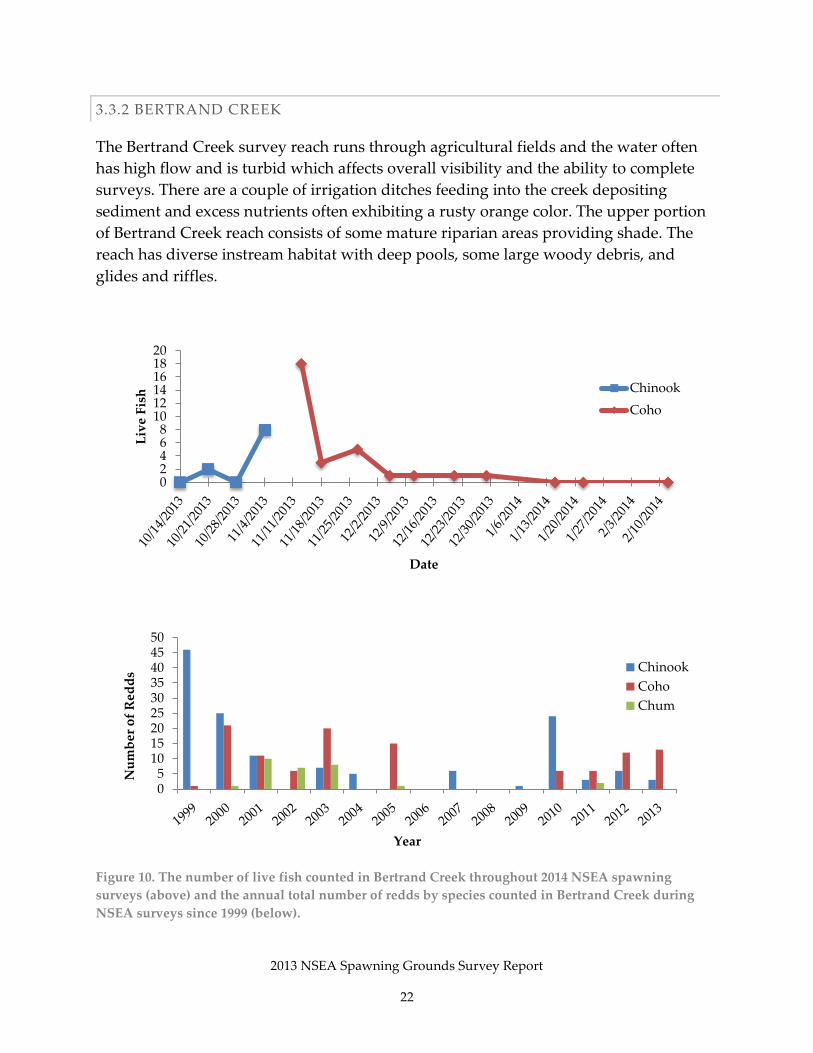
3.3.2 BERTRAND CREEK
The Bertrand Creek survey reach runs through agricultural fields and the water often
has high flow and is turbid which affects overall visibility and the ability to complete
surveys. There are a couple of irrigation ditches feeding into the creek depositing
sediment and excess nutrients often exhibiting a rusty orange color. The upper portion
of Bertrand Creek reach consists of some mature riparian areas providing shade. The
reach has diverse instream habitat with deep pools, some large woody debris, and
glides and riffles.
Figure 10. The number of live fish counted in Bertrand Creek throughout 2014 NSEA spawning
surveys (above) and the annual total number of redds by species counted in Bertrand Creek during
NSEA surveys since 1999 (below).
02468
101214161820
Liv
e F
ish
Date
Chinook
Coho
05
101520253035404550
Nu
mb
er o
f R
edd
s
Year
Chinook
Coho
Chum

2013 NSEA Spawning Grounds Survey Report
23
3.3.3 LOWER DEER CREEK
The habitat of the lower Deer Creek reach consists of a mature riparian zone that
provides ample shade, sections of coarse gravel suitable for spawning between areas of
sand and fine gravel, alternating pool and riffle sequences, and log jams formed by
large woody debris.
Figure 11. The number of live fish counted in the lower reach of Deer Creek throughout 2014 NSEA
spawning surveys (above) and the annual total number of redds by species counted in lower Deer
Creek during NSEA surveys since 1999 (below).
0
2
4
6
8
10
12
Liv
e F
ish
Date
Coho
0
5
10
15
20
25
30
35
Nu
mb
er o
f R
edd
s
Year
CohoChum

2013 NSEA Spawning Grounds Survey Report
24
3.3.4 UPPER DEER CREEK
The habitat of the upper Deer Creek reach is characterized by a mature riparian zone
that provides ample shade. However, essentially no woody riparian vegetation is
present in the upstream end of the reach as the property is an easement for high voltage
power lines. There are riffles and runs with mixtures of cobble and coarse gravel, side
channels that are wetted during high flows, and deep pools formed by large woody
debris jams. The water is clearer and less tannic than the Lower Deer Creek reach. Early
in the survey season there were a few weeks where the reach was dry.
Figure 12. The number of live fish counted in the upper reach of Deer Creek throughout 2014 NSEA
spawning surveys (above) and the annual total number of redds by species counted in upper Deer
Creek during NSEA surveys since 1999 (below).
0
2
4
6
8
10
12
14
Liv
e F
ish
Date
Coho
0
5
10
15
20
25
30
35
Nu
mb
er o
f R
edd
s
Year
CohoChum

2013 NSEA Spawning Grounds Survey Report
25
3.3.5 LOWER FISHTRAP CREEK
The lower Fishtrap Creek reach is urban in character and heavy runoff from Lynden
city streets dramatically increases turbidity and deposits trash into the stream.
However, portions of the reach are well shaded and contain many areas of spawning
gravel. The reach has a diversity of instream habitat with alternating pools and riffles;
however, the reach has little off-channel habitat due to rip rap and bulkheads placed on
the banks. There are two large stormwater culverts feeding into the reach located at the
beginning and end that often have a high output of brown or orange turbid water.
Figure 13. The number of live fish counted in the lower reach of Fishtrap Creek throughout 2014
NSEA spawning surveys (above) and the annual total number of redds by species counted in lower
Fishtrap Creek during NSEA surveys since 1999 (below).
0
1
2
3
Live
Fis
h
Date
Coho
0
5
10
15
20
25
30
35
40
Nu
mb
er o
f R
edd
s
Year
Chinook
Coho
Chum
2013 NSEA Spawning Grounds Survey Report
26
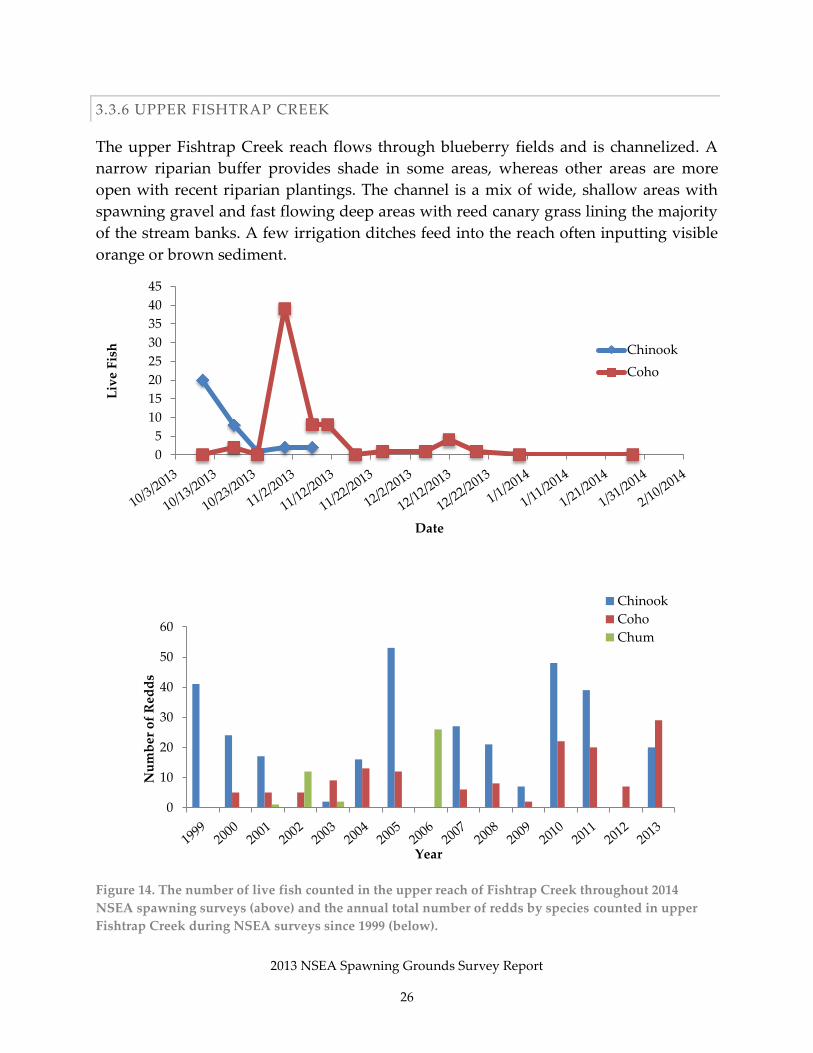
3.3.6 UPPER FISHTRAP CREEK
The upper Fishtrap Creek reach flows through blueberry fields and is channelized. A
narrow riparian buffer provides shade in some areas, whereas other areas are more
open with recent riparian plantings. The channel is a mix of wide, shallow areas with
spawning gravel and fast flowing deep areas with reed canary grass lining the majority
of the stream banks. A few irrigation ditches feed into the reach often inputting visible
orange or brown sediment.
Figure 14. The number of live fish counted in the upper reach of Fishtrap Creek throughout 2014
NSEA spawning surveys (above) and the annual total number of redds by species counted in upper
Fishtrap Creek during NSEA surveys since 1999 (below).
0
5
10
15
20
25
30
35
40
45
Liv
e F
ish
Date
Chinook
Coho
0
10
20
30
40
50
60
Nu
mb
er o
f R
edd
s
Year
Chinook
Coho
Chum

2013 NSEA Spawning Grounds Survey Report
27
3.3.7 LANDINGSTRIP CREEK
Landingstrip Creek is located on land recently cleared of a poplar plantation and
owned by Whatcom Land Trust. NSEA has been actively involved in restoration on the
site. Beginning in 2010, the channel was enhanced and modified with spawning gravel,
large woody debris placement, and riparian planting. Restoration work was completed
in 2012.
Figure 15. The number of live fish counted in Landingstrip Creek throughout 2014 NSEA spawning
surveys (above) and the annual total number of redds by species counted in Landingstrip Creek
during NSEA surveys since 2005 (below).
0
1
1
2
2
3
Liv
e F
ish
Date
Coho
0
2
4
6
8
10
12
2005 2006 2007 2008 2009 2010 2011 2012 2013
Nu
mb
er o
f R
edd
s
Year
Coho

2013 NSEA Spawning Grounds Survey Report
28
3.3.8 LANDINGSTRIP CREEK TRIBUTARY
The tributary of Landingstrip Creek was in an underground tunnel for over 50 years
before NSEA day-lighted the stream in 2009. Extensive restoration work, including
large woody debris placement, spawning gravel placement, and riparian planting, was
completed in 2012. The majority of spawning activity occurred along shallow gravel
bars, installed by NSEA during the restoration process, which are spaced between
deeper pools. During some of the surveys, fish carcasses were found on the banks and
elk tracks were also found traversing the streams.
Figure 16. The number of live fish counted in Landingstrip Creek tributary throughout 2014 NSEA
spawning surveys (above) and the annual total number of redds by species counted in Landingstrip
Creek tributary during NSEA surveys since 2009 (below).
0
1
2
3
4
5
6
7
8
9
Liv
e F
ish
Date
Coho
0
5
10
15
20
25
2009 2010 2011 2012 2013Nu
mb
er o
f R
edd
s C
ou
nte
d
year
Coho

2013 NSEA Spawning Grounds Survey Report
29
3.3.9 LOWER MACAULAY CREEK
The lower Macaulay Creek reach runs through an NSEA restoration project. The
restoration work was completed in 2009 and 2010 and included riparian planting,
channel modification, and large woody debris placement. The upper most portion of
the reach is ditched along Highway 542 and has reed canary grass lining the banks,
although it was recently replanted with native vegetation. The water is often turbid due
to runoff from the highway with heavy silt flows at various times throughout the
spawning season.
Figure 17. The number of live fish counted in the lower reach of Macaulay Creek throughout 2014
NSEA spawning surveys (above) and the annual total number of redds by species counted in lower
Macaulay Creek during NSEA surveys since 2010 (below).
0
1
2
3
4
5
6
Liv
e F
ish
Date
Coho
0
2
4
6
8
10
12
14
16
18
2010 2011 2012 2013
Nu
mb
er o
f R
edd
s C
ou
nte
d
Year
ChinookCoho
2013 NSEA Spawning Grounds Survey Report
30
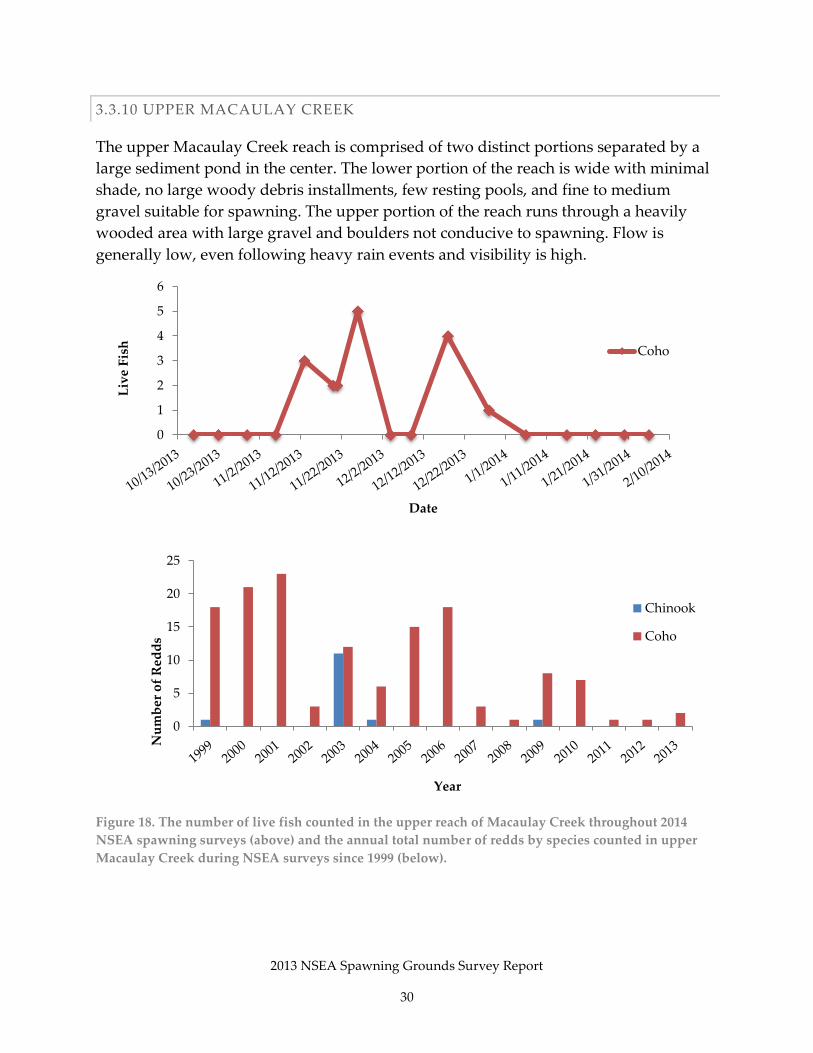
3.3.10 UPPER MACAULAY CREEK
The upper Macaulay Creek reach is comprised of two distinct portions separated by a
large sediment pond in the center. The lower portion of the reach is wide with minimal
shade, no large woody debris installments, few resting pools, and fine to medium
gravel suitable for spawning. The upper portion of the reach runs through a heavily
wooded area with large gravel and boulders not conducive to spawning. Flow is
generally low, even following heavy rain events and visibility is high.
Figure 18. The number of live fish counted in the upper reach of Macaulay Creek throughout 2014
NSEA spawning surveys (above) and the annual total number of redds by species counted in upper
Macaulay Creek during NSEA surveys since 1999 (below).
0
1
2
3
4
5
6
Liv
e F
ish
Date
Coho
0
5
10
15
20
25
Nu
mb
er o
f R
edd
s
Year
Chinook
Coho

2013 NSEA Spawning Grounds Survey Report
31
3.3.11 MITCHELL CREEK
The Mitchell Creek reach is well shaded and shallow. Some small pools provide resting
areas, large woody debris is present, and spawning gravel is abundant. Riparian
vegetation is mature in some areas, but the creek also borders the backyards of several
properties with few trees.
Figure 19. The number of live fish counted in Mitchell Creek tributary throughout 2014 NSEA
spawning surveys (above) and the annual total number of redds by species counted in Mitchell Creek
tributary during NSEA surveys since 1999 (below).
0
5
10
15
20
25
Liv
e F
ish
Date
Coho
0
5
10
15
20
25
30
35
40
Nu
mb
er o
f R
edd
s
Year
Chinook
Coho

2013 NSEA Spawning Grounds Survey Report
32
3.3.12 PADDEN CREEK
The Padden Creek reach meanders along the interurban trail and is well shaded. While
the reach contains three fish ladders, in-stream habitat remains advantageous to
spawning with shaded pools, riffles, and spawning gravel throughout. The mouth of
the creek is brackish and tidally influenced.
Figure 20. The number of live fish counted in Padden Creek throughout 2014 NSEA spawning surveys
(above) and the annual total number of redds by species counted in Padden Creek during NSEA
surveys since 2009 (below).
0
5
10
15
Liv
e F
ish
Date
Coho
Chum
0
1
2
3
4
2009 2010 2011 2012 2013
Nu
mb
er o
f R
edd
s C
ou
nte
d
Year
Coho
Chum
2013 NSEA Spawning Grounds Survey Report
33
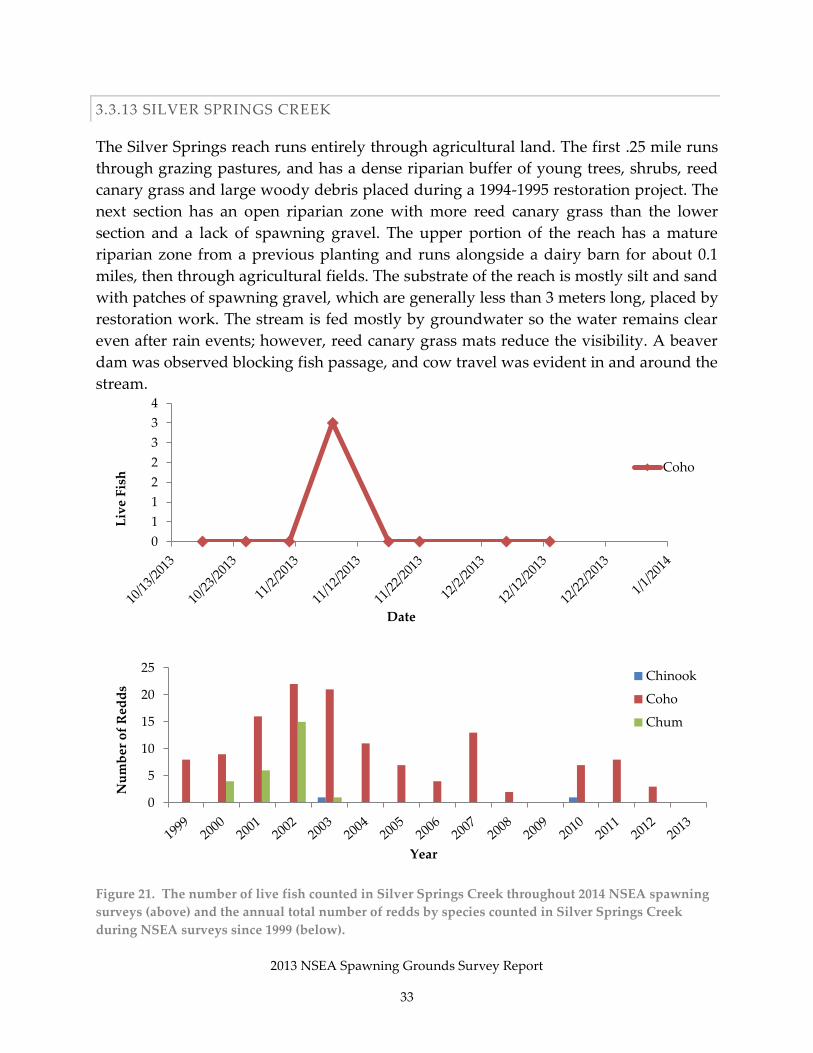
3.3.13 SILVER SPRINGS CREEK
The Silver Springs reach runs entirely through agricultural land. The first .25 mile runs
through grazing pastures, and has a dense riparian buffer of young trees, shrubs, reed
canary grass and large woody debris placed during a 1994-1995 restoration project. The
next section has an open riparian zone with more reed canary grass than the lower
section and a lack of spawning gravel. The upper portion of the reach has a mature
riparian zone from a previous planting and runs alongside a dairy barn for about 0.1
miles, then through agricultural fields. The substrate of the reach is mostly silt and sand
with patches of spawning gravel, which are generally less than 3 meters long, placed by
restoration work. The stream is fed mostly by groundwater so the water remains clear
even after rain events; however, reed canary grass mats reduce the visibility. A beaver
dam was observed blocking fish passage, and cow travel was evident in and around the
stream.
Figure 21. The number of live fish counted in Silver Springs Creek throughout 2014 NSEA spawning
surveys (above) and the annual total number of redds by species counted in Silver Springs Creek
during NSEA surveys since 1999 (below).
0
1
1
2
2
3
3
4
Liv
e F
ish
Date
Coho
0
5
10
15
20
25
Nu
mb
er o
f R
edd
s
Year
Chinook
Coho
Chum

2013 NSEA Spawning Grounds Survey Report
34
3.3.14 SMITH CREEK
The Smith Creek reach is partially shaded with mature riparian zones and blackberry
lined banks that provide limited shade and nutrients. The lower section of the reach is
mostly a deep, U-shaped channel with a streambed made of primarily sand and silt.
The upper section of the reach has a more complex channel containing large woody
debris, riffles, glides, and pools, and abundant coarse spawning gravel.
Figure 22. The number of live fish counted in Smith Creek throughout 2014 NSEA spawning surveys
(above) and the annual total number of redds by species counted in Smith Creek during NSEA
surveys since 1999 (below).
0
1
2
3
4
5
6
Liv
e F
ish
Date
Coho
0
5
10
15
20
25
Nu
mb
er o
f R
edd
s
Year
Chinook
Coho
2013 NSEA Spawning Grounds Survey Report
35
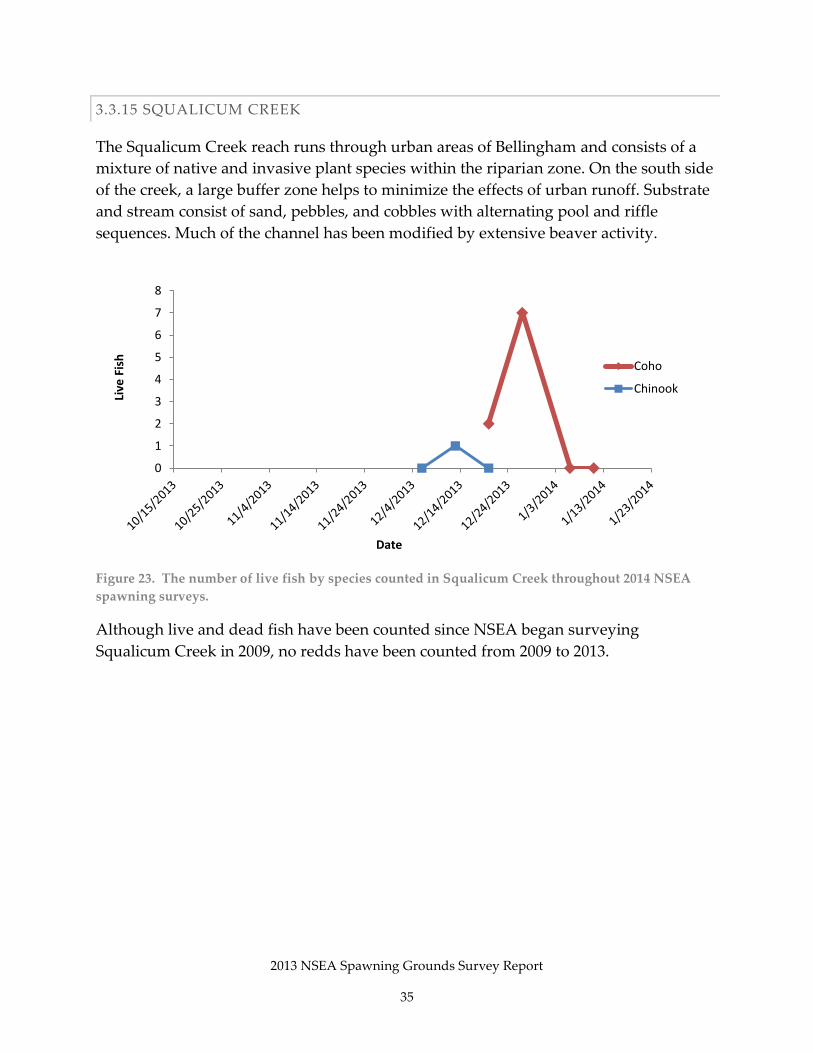
3.3.15 SQUALICUM CREEK
The Squalicum Creek reach runs through urban areas of Bellingham and consists of a
mixture of native and invasive plant species within the riparian zone. On the south side
of the creek, a large buffer zone helps to minimize the effects of urban runoff. Substrate
and stream consist of sand, pebbles, and cobbles with alternating pool and riffle
sequences. Much of the channel has been modified by extensive beaver activity.
Figure 23. The number of live fish by species counted in Squalicum Creek throughout 2014 NSEA
spawning surveys.
Although live and dead fish have been counted since NSEA began surveying
Squalicum Creek in 2009, no redds have been counted from 2009 to 2013.
0
1
2
3
4
5
6
7
8
Live
Fis
h
Date
Coho
Chinook
2013 NSEA Spawning Grounds Survey Report
36
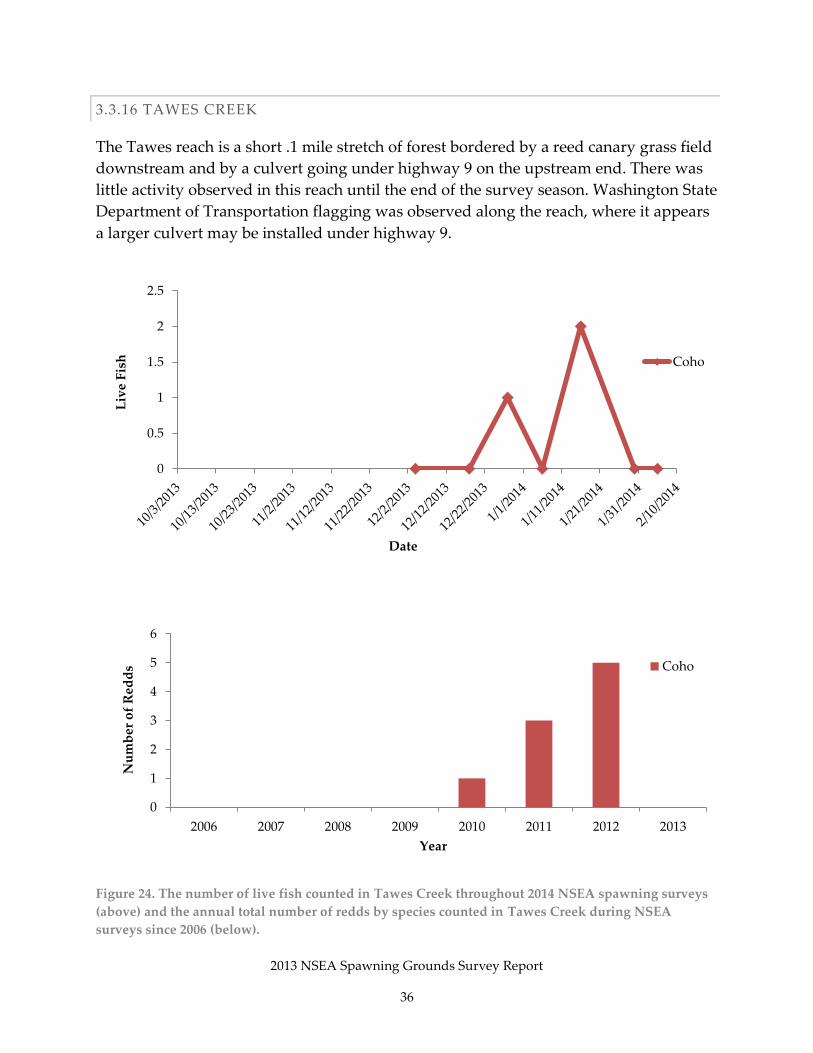
3.3.16 TAWES CREEK
The Tawes reach is a short .1 mile stretch of forest bordered by a reed canary grass field
downstream and by a culvert going under highway 9 on the upstream end. There was
little activity observed in this reach until the end of the survey season. Washington State
Department of Transportation flagging was observed along the reach, where it appears
a larger culvert may be installed under highway 9.
Figure 24. The number of live fish counted in Tawes Creek throughout 2014 NSEA spawning surveys
(above) and the annual total number of redds by species counted in Tawes Creek during NSEA
surveys since 2006 (below).
0
0.5
1
1.5
2
2.5
Liv
e F
ish
Date
Coho
0
1
2
3
4
5
6
2006 2007 2008 2009 2010 2011 2012 2013
Nu
mb
er o
f R
edd
s
Year
Coho

2013 NSEA Spawning Grounds Survey Report
37
3.3.17 TERRELL CREEK
Habitat of the Terrell Creek reach is low - gradient with ample shade, pools and riffles,
abundant large woody debris, and mixed substrate, ranging from boulders to clay. The
stream water is often dark brown and tannic, which reduces visibility.
.
Figure 25. The number of live fish counted in Terrell Creek throughout 2014 NSEA spawning surveys
(above) and the annual total number of redds by species counted in Terrell Creek during NSEA
surveys since 2003 (below).
0123456789
Liv
e F
ish
Date
Coho
0
2
4
6
8
10
12
14
16
2003 2004 2005 2006 2007 2008 2009 2010 2011 2012 2013
Nu
mb
er o
f R
edd
s
Year
Coho
2013 NSEA Spawning Grounds Survey Report
38
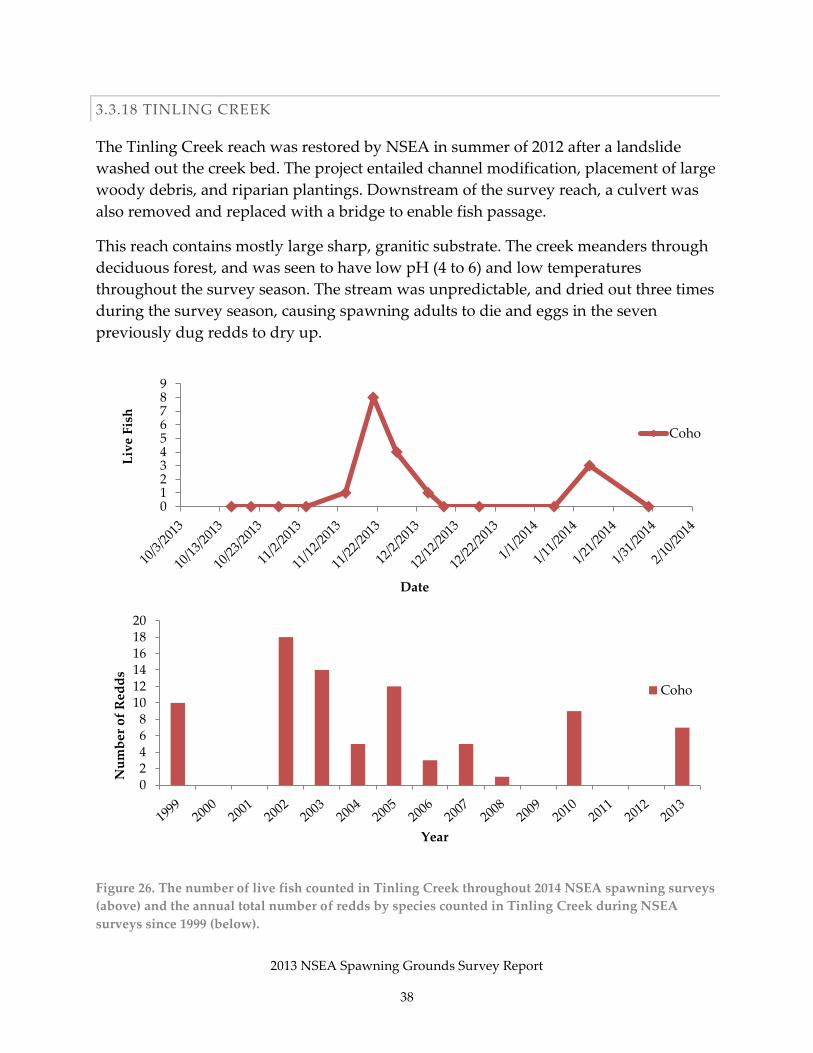
3.3.18 TINLING CREEK
The Tinling Creek reach was restored by NSEA in summer of 2012 after a landslide
washed out the creek bed. The project entailed channel modification, placement of large
woody debris, and riparian plantings. Downstream of the survey reach, a culvert was
also removed and replaced with a bridge to enable fish passage.
This reach contains mostly large sharp, granitic substrate. The creek meanders through
deciduous forest, and was seen to have low pH (4 to 6) and low temperatures
throughout the survey season. The stream was unpredictable, and dried out three times
during the survey season, causing spawning adults to die and eggs in the seven
previously dug redds to dry up.
Figure 26. The number of live fish counted in Tinling Creek throughout 2014 NSEA spawning surveys
(above) and the annual total number of redds by species counted in Tinling Creek during NSEA
surveys since 1999 (below).
0123456789
Liv
e F
ish
Date
Coho
02468
101214161820
Nu
mb
er o
f R
edd
s
Year
Coho

2013 NSEA Spawning Grounds Survey Report
39
3.3.19 LOWER WHATCOM CREEK
Land usages within the Whatcom Creek watershed include residential, commercial,
industrial, and forestry. There are three parks along Whatcom Creek, the largest being
Whatcom Falls Park and Maritime Heritage Park, as well as two hatcheries and a water
treatment plant. Whatcom Creek provides almost four miles of accessible spawning
habitat downstream of Lake Whatcom. The lower .5-mile reach meanders through
flatter, more urban habitat with sufficient spawning gravel.
Figure 27. The number of live fish counted in the lower reach of Whatcom Creek throughout 2014
NSEA spawning surveys (above) and the annual total number of redds by species counted in lower
Whatcom Creek during NSEA surveys since 2012 (below).
0
2
4
6
8
10
12
14
16
Liv
e F
ish
Date
Coho
Chinook
Chum
0
1
2
3
4
5
6
7
2012 2013
Nu
mb
er o
f R
edd
s C
ou
nte
d
Year
Chinook
Coho
2013 NSEA Spawning Grounds Survey Report
40
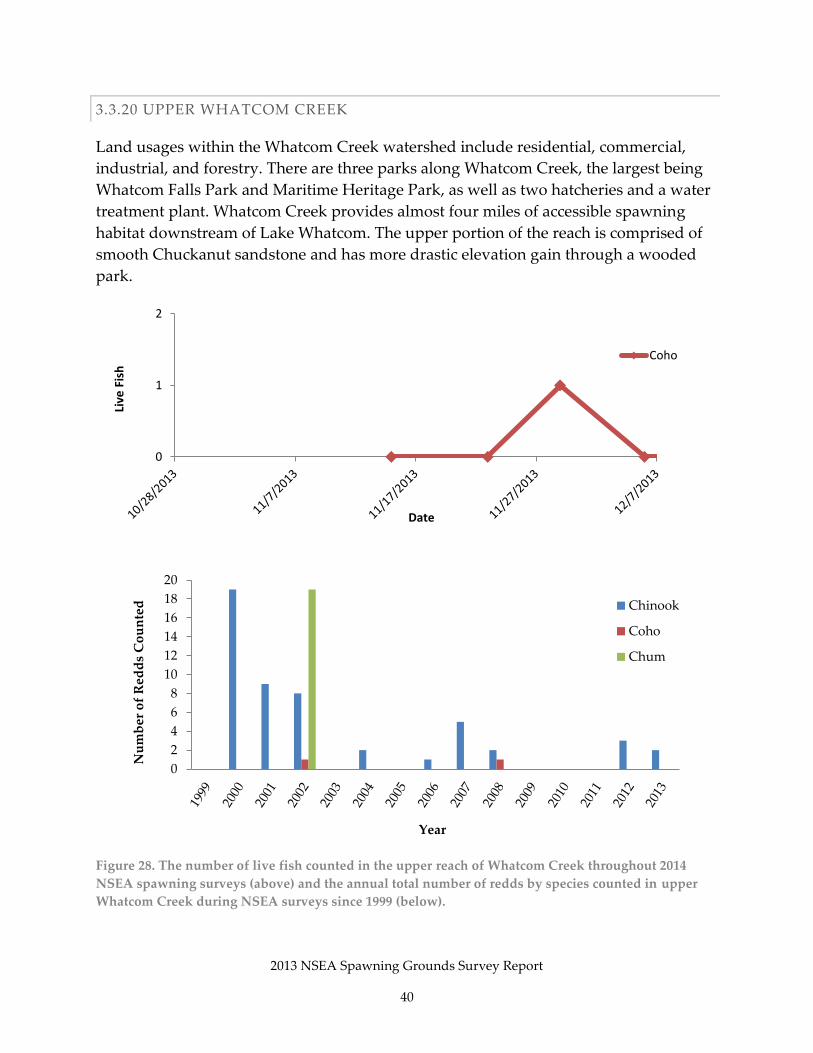
3.3.20 UPPER WHATCOM CREEK
Land usages within the Whatcom Creek watershed include residential, commercial,
industrial, and forestry. There are three parks along Whatcom Creek, the largest being
Whatcom Falls Park and Maritime Heritage Park, as well as two hatcheries and a water
treatment plant. Whatcom Creek provides almost four miles of accessible spawning
habitat downstream of Lake Whatcom. The upper portion of the reach is comprised of
smooth Chuckanut sandstone and has more drastic elevation gain through a wooded
park.
Figure 28. The number of live fish counted in the upper reach of Whatcom Creek throughout 2014
NSEA spawning surveys (above) and the annual total number of redds by species counted in upper
Whatcom Creek during NSEA surveys since 1999 (below).
0
1
2
Live
Fis
h
Date
Coho
0
2
4
6
8
10
12
14
16
18
20
Nu
mb
er o
f R
edd
s C
ou
nte
d
Year
Chinook
Coho
Chum

2013 NSEA Spawning Grounds Survey Report
41
4.0 DISCUSSION
The discussion section of this report details data limitations and caveats, notable fish
sightings, and historical trends in redd counts.
4.1 DATA LIMITATIONS AND CAVEATS
The discussion section of this report is necessarily limited. Only the trends over time at
specific NSEA survey reaches can be analyzed, rather than drawing basin-wide
conclusions. Salmon species have complex life cycles that span broad temporal and
spatial ranges. Therefore, there are many environmental and anthropogenic factors that
can influence any given salmon population at any time. Commercial and recreational
fishing, urbanization, land use, fish passage barriers, and ocean conditions can all have
detrimental effects on salmon populations. With these variables in mind, a cause and
effect relationship between any particular activity and an increase or decrease in
returning salmon cannot be assumed for any given year.
NSEA spawning grounds surveys have consistently covered many of the same reaches
since 1999. While these surveys alone are not extensive enough to show trends in
overall populations, they do allow us to investigate the roles that specific streams play
in salmon life histories by examining yearly data from the survey reaches. This data can
also be used by Nooksack River basin co-managers in combination with other spawning
surveys to estimate basin-wide return trends.
In addition to limitations with the size and scope of our surveys, certain methodological
constraints should be considered when interpreting spawning survey data. The
frequency of surveys and the likelihood of seeing salmon that are present in the streams
are dependent upon viewing conditions, stream accessibility, and timing. Late fall and
early winter commonly receive large amounts of precipitation in the Pacific Northwest.
The severity and timing of these rain and snowfall events can have significant impacts
on migrating salmon and the likelihood that surveyors see them. Whereas heavy rains
often draw spawning salmon upstream, they also can prevent human access to these
streams; potentially leaving many fish and redds uncounted. Carcasses are often
washed downstream and redds can be scoured out or filled in with sediment beyond
recognition. Surveys will have slightly different timing and frequency each year (based
on rainfall patterns), which will affect fish and redd counts from year to year.
Using the number of live fish observed as a population indicator presents an obstacle as
miscounts and recounts are more likely with live fish than with carcasses or redds.
Using carcasses as an indicator of populations could also lead to inaccurate estimates of

2013 NSEA Spawning Grounds Survey Report
42
returning salmon. For example, streams located in more rural or forested settings, such
as Macaulay, Mitchell, and Anderson creeks, typically have low numbers of carcasses
recovered in relation to live fish sightings. This is likely due to the prevalence of wildlife
in these areas that scavenge salmon carcasses for food and drag carcasses far from
streams.
In contrast to live and dead fish, redds may remain visible for a longer time period and
give a better estimate of the number of spawning fish, if it is assumed that for every
redd counted a minimum of two spawning adults returned to the stream. This
conservative number gives us an estimate of effective spawners as opposed to
escapement estimates, which show us how many individuals were able to make it back
to their spawning grounds. Additionally, salmon have been found dead during each
survey season before spawning for various reasons. If the goal is to assess the number
of effective spawners in a population, then using redds as a marker is more important
than counts of live or dead fish. However, redds can be tricky to identify no matter
how knowledgeable and experienced the surveyors are.
4.2 NOTABLE REDD COUNTS
One of the reasons NSEA conducts spawning grounds surveys is to measure the
effectiveness of restoration projects in improving salmon habitat. In 2013, several creeks
with NSEA restoration projects had notable fish sightings compared to previous years.
The number of coho redds in the tributary to Landingstrip Creek in 2013 was the
highest since NSEA began surveying it in 2010 (Figure 16). In 2009, NSEA completed a
restoration project on this tributary, day-lighting the creek after being underground in a
tunnel for over 50 years. Before NSEA completed this project, it was impossible for
salmon to spawn in this tributary; now the redd counts in this creek show an increasing
trend since the restoration project was completed (Figure 30).
Another creek with notable 2013 redd counts is the upper reach of Fishtrap Creek.
Although redd counts in Fishtrap Creek have not steadily increased since NSEA began
surveying here, there is an overall increasing trend in the number of coho redds
counted from 1999 to 2013 (Figure 30). In contrast, the lower reach of Fishtrap that
NSEA surveys exhibits decreasing trends in redd counts for all fish species surveyed
(Figure 13). This lower reach flows through urban and residential areas and faces
degraded water quality due to storm water runoff and loss of riparian habitat. Whereas
the upper reach of Fishtrap Creek only has a narrow riparian buffer (enhanced by an
NSEA planting project) and flows through agricultural fields, it does offer areas of
quality spawning gravel and may have fewer anthropogenic impacts than the lower,
more urban reach.

2013 NSEA Spawning Grounds Survey Report
43
0
5
10
15
20
25
2009 2010 2011 2012 2013
Nu
mb
er o
f R
edd
s C
ou
nte
d
year
Tributary of Landingstrip Creek
Coho
0
10
20
30
40
50
60
Nu
mb
er o
f R
edd
s
Year
Chinook
Coho
Chum
Coho
Trendline
Upper Fishtrap
Figure 30. The annual total number of coho redds counted in the tributary to Landingstrip Creek
during NSEA surveys since 2009.
Figure 29. The annual total number of redds by species counted in Upper Fishtrap Creek
during NSEA surveys since 1999.

2013 NSEA Spawning Grounds Survey Report
44
4.3 HISTORICAL TRENDS IN REDD COUNTS
The total number of coho redds observed during NSEA spawning grounds surveys in
2013 were higher than the 15 year average, but Chinook and chum salmon redds were
lower than the 15 year average. Chinook and coho redd counts from 2010 to 2013 have
been in general higher than they were from 2006 to 2009, but they still have not been
consistently increasing. The chum redd counts from 2010 to 2013 are higher than 2007 to
2009, but are still low and show a decreasing trend (Figure 31).
Figure 31. The total number of redds observed per species each year during NSEA spawning surveys,
including the 15 year average for each species. Unknown species redds are not shown.
0
25
50
75
100
125
150
175
200
225
Nu
mb
er o
f R
edd
s
Survey Year
Number of Redds Per Year
Chinook
Coho
Chum

2013 NSEA Spawning Grounds Survey Report
45
4.4 FUTURE WORK
Spawning grounds surveys should continue following WDFW protocols and be
conducted in the same survey reaches each year so long-term assessment of WRIA 1
salmon spawning populations can continue. The following list provides suggestions
and guidance about spawning grounds survey methodology:
1. Continue to collect survey data on stream temperature, pH, sex, fork length, and
adipose fin presence for all carcasses.
2. Continue to assist WDFW in conducting steelhead trout spawning surveys so
that WRIA 1 fisheries co-managers have a more comprehensive picture of
steelhead escapement in the Nooksack River basin.
3. In odd years, start surveys earlier to capture as much of the pink salmon run as
possible.
4. Further investigate future restoration projects at stream reaches that need
invasive plant removal, large woody debris placement, or channel modification
to improve spawning habitat. Specific streams that were noted as needing
improvement in 2013 were Smith Creek (extensive Himalayan blackberry
infestation along banks) and Macaulay Creek (needs further channel
reconstruction and invasive removal).
5. Add a new reaches where NSEA has completed restoration projects, especially
ones where fish passage barriers have been removed. One recommendation
would be to add a reach on the newly reconstructed tributary to Landingstrip
Creek. In 2012, NSEA completed a restoration project on this tributary to
Landingstrip that flows into the tributary that NSEA currently surveys, and a
reach could be added to assess the effectiveness of this project in improving
spawning habitat.
6. Continue to partner with Bellingham Technical College’s Fisheries &
Aquaculture program to facilitate further community involvement and provide
valuable field experience for students.
2013 NSEA Spawning Grounds Survey Report
46
5.0 PAST REPORTS
Moore, S. NSEA Salmon Spawner Survey 1999. Report on file, Nooksack Salmon
Enhancement Association, 3057 East Bakerview Road, Bellingham, Washington.
Moore, S. Nooksack Enhancement Association Salmon Spawner Survey 2000. Report on
file, Nooksack Salmon Enhancement Association, 3057 East Bakerview Road,
Bellingham, Washington.
Timmer, D. Salmon Spawner Survey 2001 Yearly Report. Report on file, Nooksack
Salmon Enhancement Association, 3057 East Bakerview Road, Bellingham, Washington.
Krancus, L. Nooksack Salmon Enhancement Association Spawner Survey 2002. Report
on file, Nooksack Salmon Enhancement Association, 3057 East Bakerview Road,
Bellingham, Washington
Hovezak, M. Lower Nooksack River Basin 2003 Salmon Spawner Survey. Report on file,
Nooksack Salmon Enhancement Association, 3057 East Bakerview Road, Bellingham,
Washington.
Roberts, M. Lower Nooksack River Basin 2004 Salmon Spawner Survey. Report on file,
Nooksack Salmon Enhancement Association, 3057 East Bakerview Road, Bellingham,
Washington.
Roberts, M. Nooksack Salmon Enhancement Association 2005 Salmon Spawner Survey.
Report on file, Nooksack Salmon Enhancement Association, 3057 East Bakerview Road,
Bellingham, Washington.
Brecha, C. Nooksack Salmon Enhancement Association 2006 Salmon Spawning
Grounds Survey Report on file, Nooksack Salmon Enhancement Association, 3057 East
Bakerview Road, Bellingham, Washington.
Van Leaven, K. Salmon Spawning Grounds Survey 2007. Report on file, Nooksack
Salmon Enhancement Association, 3057 East Bakerview Road, Bellingham, Washington.
Lundgren, N. Nooksack Salmon Enhancement Association 2008 Salmon Spawning
Grounds Survey. Report on file, Nooksack Salmon Enhancement Association, 3057 East
Bakerview Road, Bellingham, Washington.
Hines, E. Nooksack Salmon Enhancement Association 2009 Salmon Spawning Grounds
Survey. Report on file, Nooksack Salmon Enhancement Association, 3057 East
Bakerview Road, Bellingham, Washington.

2013 NSEA Spawning Grounds Survey Report
47
Riordan, C. Nooksack Salmon Enhancement Association 2010 Salmon Spawning
Grounds Survey. Report on file, Nooksack Salmon Enhancement Association, 3057 East
Bakerview Road, Bellingham, Washington.
Kunkel, N. Nooksack Salmon Enhancement Association Spawning Grounds Surveys
2011. Report on file, Nooksack Salmon Enhancement Association, 3057 East Bakerview
Road, Bellingham, Washington.
Rohrer, K. Nooksack Salmon Enhancement Association Spawning Grounds Surveys
2012. Report on file, Nooksack Salmon Enhancement Association, 3057 East Bakerview
Road, Bellingham, Washington.

2013 NSEA Spawning Grounds Survey Report
48
APPENDIX A. DIRECTIONS TO SPAWNING GROUNDS SURVEY REACHES
Directions to stream reach locations where NSEA surveys are conducted. RM indicates River Mile. Reaches
are listed in order by WRIA numbers so that creeks listed next to one another should be in relatively close
in proximity. Landowner contact information is available at the NSEA office.
2013 Spawning Grounds Survey Reach Locations and Directions
Terrell RM
4.9-5.3
Drive west on Grandview Road to Blaine Road. Turn right onto Blaine Road and take
the first left to the gated parking area. Find a small hunter’s path that follows the edge
of the trees that surround the creek. Walk next to the trees for about 0.25 miles until
you see an opening down to the stream (it should be marked with pink flagging). Start
your survey here. Walk upstream through the culvert unless water levels are too high
to make it through safely. Should this be the case, find your way up the bank, cross the
street, and scramble back down to the creek upstream of the culvert. Continue past the
culvert upstream for 0.4 miles. There are pink flags marking the end of the reach near a
small fork in the creek. Walk up the left bank and take the hunter’s path back to the
parking area.
Deer, lower RM
0.5-1.1
Turn south onto Judy Way off of Axton Road. Drive down Judy Way past the private
driveway sign and cross the bridge over the creek. Park in the pullout on the right side
of the driveway immediately past the bridge. Continue on foot along the right fork in
the road, walking downstream about 0.25 miles until you see pink flagging marking
the start point. There is a path here that leads to the creek. If you reach the hill, you
have gone too far. Enter the creek here and survey upstream to an old fallen wooden
bridge, and then stop. Turn around here and walk back downstream until reaching the
bridge where your vehicle is parked. Call the landowner before each survey (Fred
Lively: 360-312-8328).
Deer, upper RM
3.2-3.7
Turn North onto Manthey Road off of W Smith Road, directly across from North
Bellingham Golf Course. Halfway down the road, park at the barn (5390 Manthey
Road). Walk ENE (east-northeast) through fields for 0.25 miles. You will have to pass
through two separate fences. Walk on the left side of this field near the trees until you
come to a small stand of alders where you will see an entrance to the creek (and pink
flagging). Survey from here upstream to where the creek crosses under the power lines.
Exit creek on the right side and walk back through the fields to your vehicle.
Silver Springs,
lower
RM
0.0-0.5
Drive North on the Guide Merdian. Turn right on Hemmi Road. Park in the right of
way on the north side of the road near the dairy farm where the creek crosses under
Hemmi Road. Walk down the driveway and straight back through the farm north
downstream to the confluence with Tenmile Creek. Start your survey here and follow
the stream back to Hemmi Road. Cross the street and survey the stream until it goes
under the barn. Walk around the barn and join the stream where it exits the barn. Walk
up the creek until you reach a barbed wire fence. Contact the landowner before
surveying.

2013 NSEA Spawning Grounds Survey Report
49
Bertrand RM
8.2-8.7
Drive north on the Guide Meridian to H Street. Turn left and drive west to the bridge
over the creek. Park vehicle in the pullout near the bridge. Begin survey under bridge
and walk upstream. You will pass by some old bridge stanchions part way through the
reach. Pass the stanchions and continue walking until you see long flagging tape
marking the exit point, which is about .25 miles past a large logjam and clay slide area.
Once you reach the flagging, back track to the old bridge stanchions and when you see
a barbed wire fence on your left, exit the creek on the left bank (left hand side when
facing downstream). Walk up bank, over the barbed wire fence, through the
field/gravel pit area. Follow the gravel driveway (crosses back over the creek) out to H
St. If you miss the exit flags, you can walk to the border and turn around. Leave a note
on your vehicle for Border Patrol.
Fishtrap, lower RM
4.9-5.7
Drive to Lynden on Hannegan Road. Take a left on Main Street and then a right on
Depot Road. The entrance to Lynden City Park will be on your right. Park in the
parking lot. The reach begins 100 meters downstream of the Depot Road bridge and
continues all the way to Bender Road. Follow paved path through the park back to
vehicle.
Fishtrap, upper RM
8.8-9.2
Drive north on Northwood Road (east of Lynden) 0.8 miles past Pangborn Road. Take
a left at the gravel road immediately south of the house at 9621 Northwood Road.
Drive down the gravel road to where it crosses Fishtrap Creek. Park near the stream
and survey upstream to where the creek flows under an impenetrable thicket of
blackberries. Leave a note on your vehicle for Border Patrol.
Anderson, Upper RM
2.7-4.0
This reach is from E. Smith Road through to Kelly Road. Park one vehicle at the Kelly
Road Bridge and the second vehicle (recommended) at the Smith Road Bridge. Walk
upstream from the E Smith Road Bridge to the bridge on Kelly Road.
Smith RM
2.5-3.5
Drive east on Mt. Baker Highway (SR 542) and pass through Nugent's Corner. Park
one vehicle in gravel area next to the bridge where Smith Creek passes underneath SR
542 for the second time (upstream). If you get to Hillard Rd., you’ve gone too far. Walk
the train tracks and the highway to the first bridge and survey upstream.
Second vehicle option: After parking the first vehicle, get back on Mt. Baker Highway
in the second vehicle and drive west. Park in the driveway of the first house east of the
Smith Creek bridge (3957 Mt. Baker Hwy), where the creek passes under Mt. Baker
Highway for the first time. The drive way will be on your left when coming from the
east and is right after the Shumway’s Berries sign. Park on the right side of the
driveway/edge of the grass. Talk with the landowner at the beginning of the season
before you do the first survey. If you cannot get in touch with the landowner, another
option is to park the second vehicle in the public right-of-way on Deming Road. Walk
upstream to the bridge with the train tracks where vehicle is parked.
Macaulay, Lower RM
0.5-1.0
Going east on Mt. Baker Highway (SR 542), turn left on Green Acres Rd. (between
Nugent's Corner and Deming). Just after the crossing the bridge over the creek, turn
left onto a gravel pullout and park there. Walk through the fields west of Green Acres
Rd., following the creek, walking downstream until you cross a small foot bridge over a

2013 NSEA Spawning Grounds Survey Report
50
side channel. Continue along Macaulay Creek until you reach a small bridge, which is
the starting point. Survey upstream from the small bridge until you are back at the
bridge that crosses over Green Acres Rd, where your vehicle is parked.
Macaulay, Upper RM
1.0-1.5
Going east on Mt. Baker Highway (SR 542), turn left on Macaulay Road, which is the
next street after Green Acres Rd where the lower reach is. Drive down Macaulay Rd.
until you cross the creek. Turn right just after the bridge onto a dead-end gravel
road/pullout. Park here. Start this survey at the bridge on Macaulay Road, and survey
upstream until you reach a barbed wire fence running across the stream. Exit to the left
and follow the fence back to where the vehicle is parked.
Mitchell RM .3-
1.0
Going east on the Mt. Baker Highway (SR 542), turn left on Scarlett Road (a private
driveway with a sign advertising One Heron Pond Pottery Studio). Follow the
driveway past the first house and workshop and keep driving until you cross over the
creek. Park off the road, near the creek, or you can park in the driveway of the house
that is straight ahead after crossing the bridge (with land owner permission). Start the
survey at the bridge and walk upstream to the third bridge. You will know it is the
correct bridge because it is wooden and as you climb out and look to the left you will
see a "Private Forest" sign on the closest tree. Walk towards the highway on Mitchell
Road, then along the highway back to your vehicle.
Tinling RM
2.0-2.25
Take Strand Road off of SR 9 to Clipper Road. Park just past the creek in the driveway
at 3235 Clipper Rd (the red house on the right). Follow Tinling Creek downstream on
the trail/road behind the house for about 0.25 miles, until it reaches a swampy area
marked with pink and green flagging. Survey upstream to Clipper Road then cross the
road and continue upstream until you reach a small stream flowing into Tinling Creek
on the right hand side. Turn around here and walk back to Clipper Road. Contact the
Landowner at the beginning of the season.
Tawes RM
0.4-0.5
Take Mt. Baker HWY to HWY 9 South. Head south on HWY 9 for about 1.5 miles. The
house you can park at is at the large U curve just before Van Zandt (across the street
from Williams Lake Rd). Park on the far right of the driveway at 4298 HWY 9 (small
tan house on the right). Make sure to ask permission from the landowner at the
beginning of the season. Walk past the old outbuildings behind the house, on a narrow
trail, until you reach the stream. Survey about 0.1 miles of Tawes Creek, ending at SR 9.
This stream is located just off of SR 9 South.
Tributary of
Landingstrip
RM
0.0-0.4
Head south on SR 9 and go through Acme. Take a left onto Rothenbuhler Road. Park
just before the creek in the pullout by an apple tree. First, survey upstream of the
Rothenbuhler Road culvert until you reach a second culvert, just upstream of the
railroad bridge.
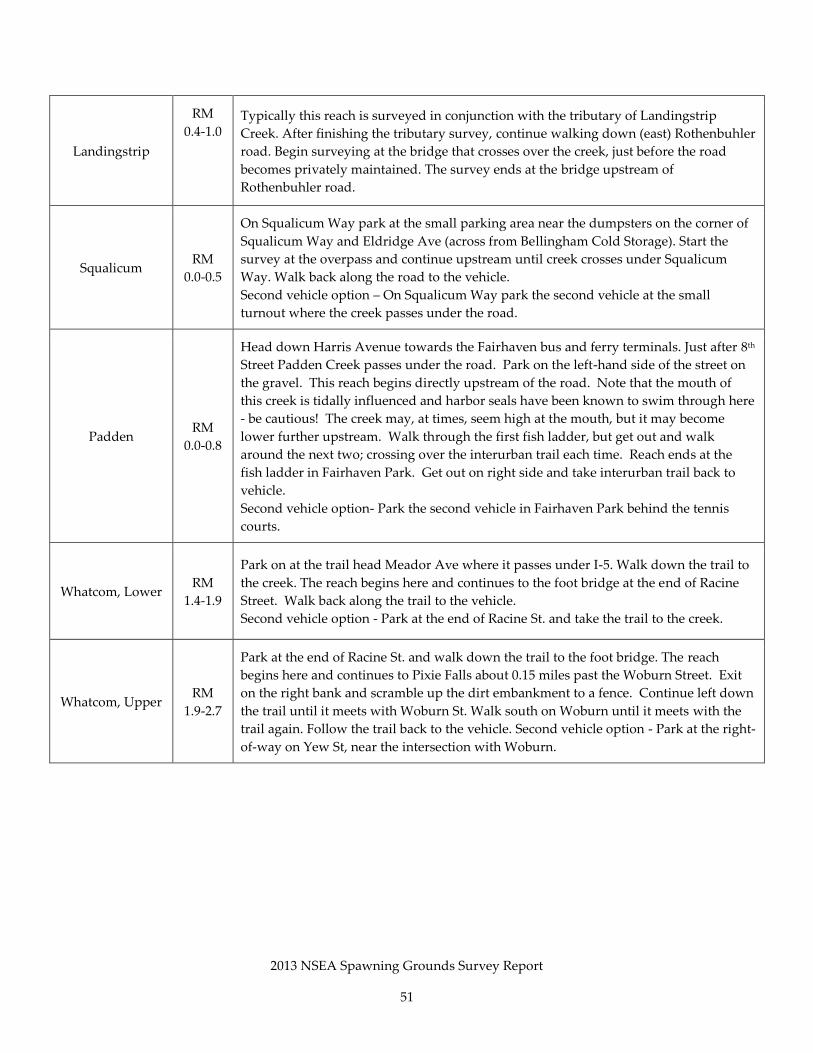
2013 NSEA Spawning Grounds Survey Report
51
Landingstrip
RM
0.4-1.0 Typically this reach is surveyed in conjunction with the tributary of Landingstrip
Creek. After finishing the tributary survey, continue walking down (east) Rothenbuhler
road. Begin surveying at the bridge that crosses over the creek, just before the road
becomes privately maintained. The survey ends at the bridge upstream of
Rothenbuhler road.
Squalicum RM
0.0-0.5
On Squalicum Way park at the small parking area near the dumpsters on the corner of
Squalicum Way and Eldridge Ave (across from Bellingham Cold Storage). Start the
survey at the overpass and continue upstream until creek crosses under Squalicum
Way. Walk back along the road to the vehicle.
Second vehicle option – On Squalicum Way park the second vehicle at the small
turnout where the creek passes under the road.
Padden RM
0.0-0.8
Head down Harris Avenue towards the Fairhaven bus and ferry terminals. Just after 8th
Street Padden Creek passes under the road. Park on the left-hand side of the street on
the gravel. This reach begins directly upstream of the road. Note that the mouth of
this creek is tidally influenced and harbor seals have been known to swim through here
- be cautious! The creek may, at times, seem high at the mouth, but it may become
lower further upstream. Walk through the first fish ladder, but get out and walk
around the next two; crossing over the interurban trail each time. Reach ends at the
fish ladder in Fairhaven Park. Get out on right side and take interurban trail back to
vehicle.
Second vehicle option- Park the second vehicle in Fairhaven Park behind the tennis
courts.
Whatcom, Lower RM
1.4-1.9
Park on at the trail head Meador Ave where it passes under I-5. Walk down the trail to
the creek. The reach begins here and continues to the foot bridge at the end of Racine
Street. Walk back along the trail to the vehicle.
Second vehicle option - Park at the end of Racine St. and take the trail to the creek.
Whatcom, Upper RM
1.9-2.7
Park at the end of Racine St. and walk down the trail to the foot bridge. The reach
begins here and continues to Pixie Falls about 0.15 miles past the Woburn Street. Exit
on the right bank and scramble up the dirt embankment to a fence. Continue left down
the trail until it meets with Woburn St. Walk south on Woburn until it meets with the
trail again. Follow the trail back to the vehicle. Second vehicle option - Park at the right-
of-way on Yew St, near the intersection with Woburn.

2013 NSEA Spawning Grounds Survey Report
52
APPENDIX B. MATERIALS AND EQUIPMENT
Recommended Materials and Equipment for Spawner Surveys
Sampling Kit (each surveyor):
polarized sunglasses
knife
pencils and sharpies
measuring tape
pH strips
scissors for tissue samples
hand pruners
otilith and/or DNA sample vials
thermometers
Rite in the Rain notebook binder
scale cards
survey flagging
head bags and labels
tweezers
forceps
fish counter devise
Additional equipment:
fish peughs
chest waders and felt-soled boots
survey vest
extra socks
extra pants
rubber gloves
map of area being surveyed
camera
watch or cell phone for time and emergencies
Coded Wire Tag (CWT) wand
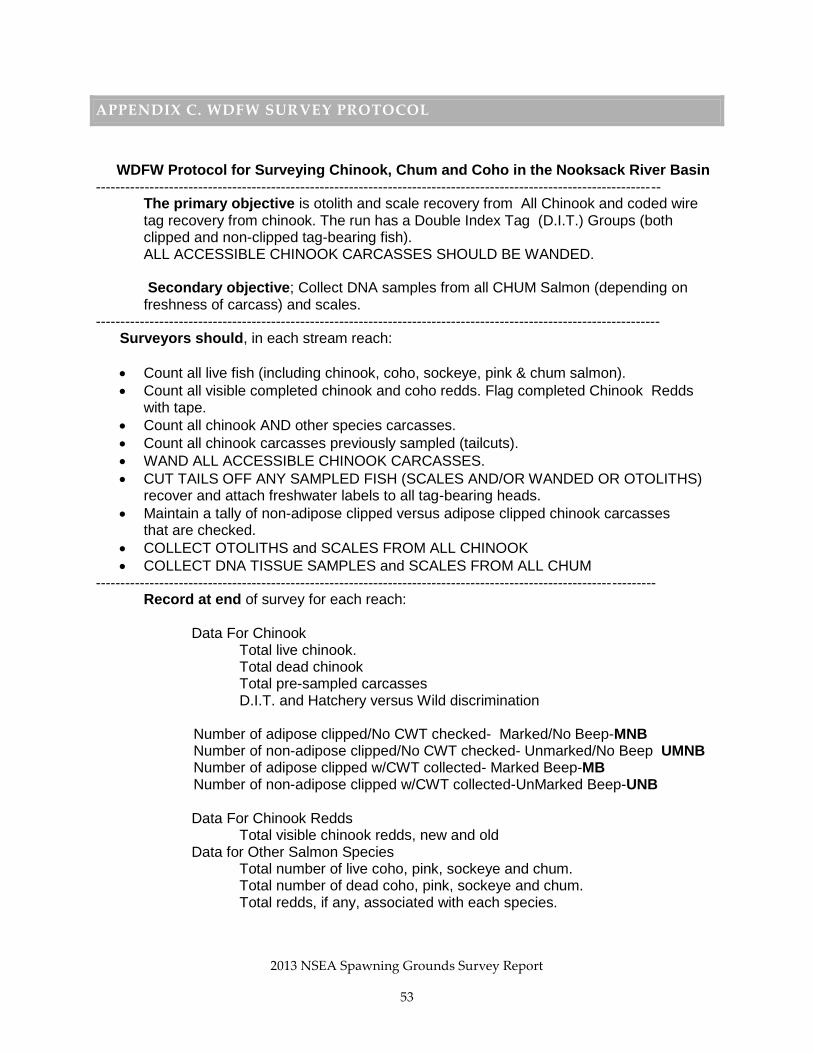
2013 NSEA Spawning Grounds Survey Report
53
APPENDIX C. WDFW SURVEY PROTOCOL
WDFW Protocol for Surveying Chinook, Chum and Coho in the Nooksack River Basin --------------------------------------------------------------------------------------------------------------------
The primary objective is otolith and scale recovery from All Chinook and coded wire tag recovery from chinook. The run has a Double Index Tag (D.I.T.) Groups (both clipped and non-clipped tag-bearing fish). ALL ACCESSIBLE CHINOOK CARCASSES SHOULD BE WANDED. Secondary objective; Collect DNA samples from all CHUM Salmon (depending on freshness of carcass) and scales.
-------------------------------------------------------------------------------------------------------------------- Surveyors should, in each stream reach:
Count all live fish (including chinook, coho, sockeye, pink & chum salmon).
Count all visible completed chinook and coho redds. Flag completed Chinook Redds with tape.
Count all chinook AND other species carcasses.
Count all chinook carcasses previously sampled (tailcuts).
WAND ALL ACCESSIBLE CHINOOK CARCASSES.
CUT TAILS OFF ANY SAMPLED FISH (SCALES AND/OR WANDED OR OTOLITHS) recover and attach freshwater labels to all tag-bearing heads.
Maintain a tally of non-adipose clipped versus adipose clipped chinook carcasses that are checked.
COLLECT OTOLITHS and SCALES FROM ALL CHINOOK
COLLECT DNA TISSUE SAMPLES and SCALES FROM ALL CHUM -------------------------------------------------------------------------------------------------------------------
Record at end of survey for each reach:
Data For Chinook Total live chinook. Total dead chinook Total pre-sampled carcasses
D.I.T. and Hatchery versus Wild discrimination
Number of adipose clipped/No CWT checked- Marked/No Beep-MNB Number of non-adipose clipped/No CWT checked- Unmarked/No Beep UMNB Number of adipose clipped w/CWT collected- Marked Beep-MB Number of non-adipose clipped w/CWT collected-UnMarked Beep-UNB
Data For Chinook Redds Total visible chinook redds, new and old
Data for Other Salmon Species Total number of live coho, pink, sockeye and chum.
Total number of dead coho, pink, sockeye and chum. Total redds, if any, associated with each species.
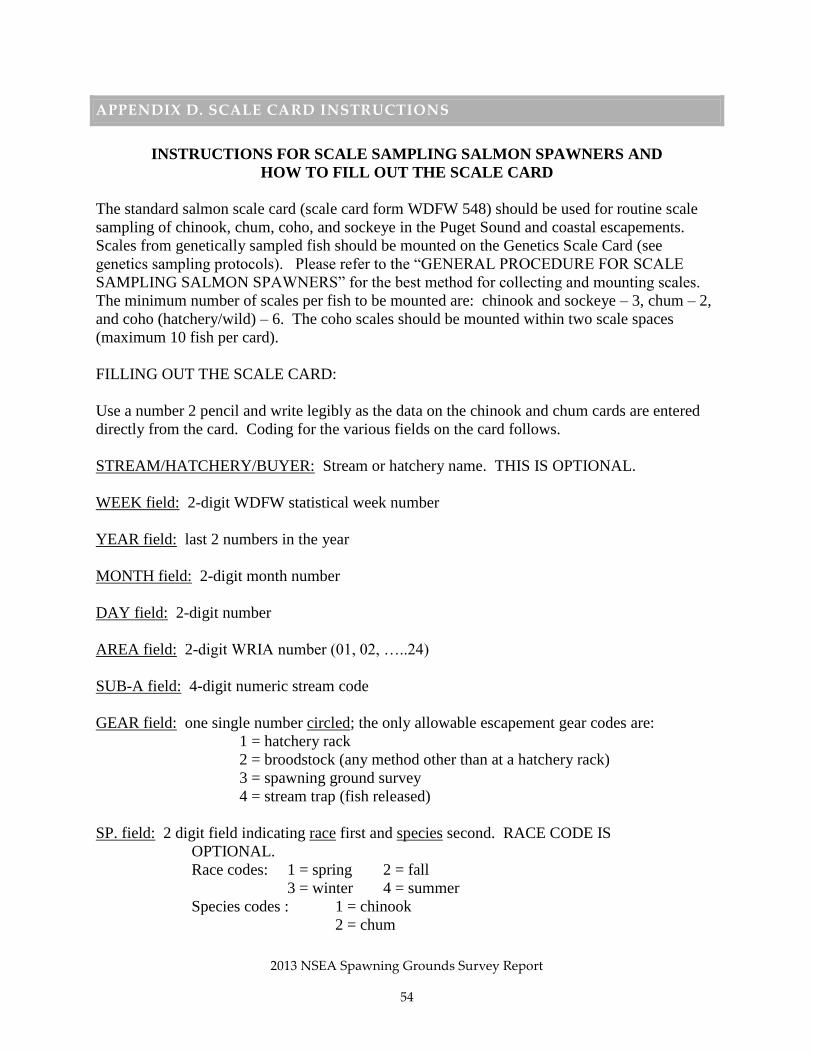
2013 NSEA Spawning Grounds Survey Report
54
APPENDIX D. SCALE CARD INSTRUCTIONS
INSTRUCTIONS FOR SCALE SAMPLING SALMON SPAWNERS AND
HOW TO FILL OUT THE SCALE CARD
The standard salmon scale card (scale card form WDFW 548) should be used for routine scale
sampling of chinook, chum, coho, and sockeye in the Puget Sound and coastal escapements.
Scales from genetically sampled fish should be mounted on the Genetics Scale Card (see
genetics sampling protocols). Please refer to the “GENERAL PROCEDURE FOR SCALE
SAMPLING SALMON SPAWNERS” for the best method for collecting and mounting scales.
The minimum number of scales per fish to be mounted are: chinook and sockeye – 3, chum – 2,
and coho (hatchery/wild) – 6. The coho scales should be mounted within two scale spaces
(maximum 10 fish per card).
FILLING OUT THE SCALE CARD:
Use a number 2 pencil and write legibly as the data on the chinook and chum cards are entered
directly from the card. Coding for the various fields on the card follows.
STREAM/HATCHERY/BUYER: Stream or hatchery name. THIS IS OPTIONAL.
WEEK field: 2-digit WDFW statistical week number
YEAR field: last 2 numbers in the year
MONTH field: 2-digit month number
DAY field: 2-digit number
AREA field: 2-digit WRIA number (01, 02, …..24)
SUB-A field: 4-digit numeric stream code
GEAR field: one single number circled; the only allowable escapement gear codes are:
1 = hatchery rack
2 = broodstock (any method other than at a hatchery rack)
3 = spawning ground survey
4 = stream trap (fish released)
SP. field: 2 digit field indicating race first and species second. RACE CODE IS
OPTIONAL.
Race codes: 1 = spring 2 = fall
3 = winter 4 = summer
Species codes : 1 = chinook
2 = chum
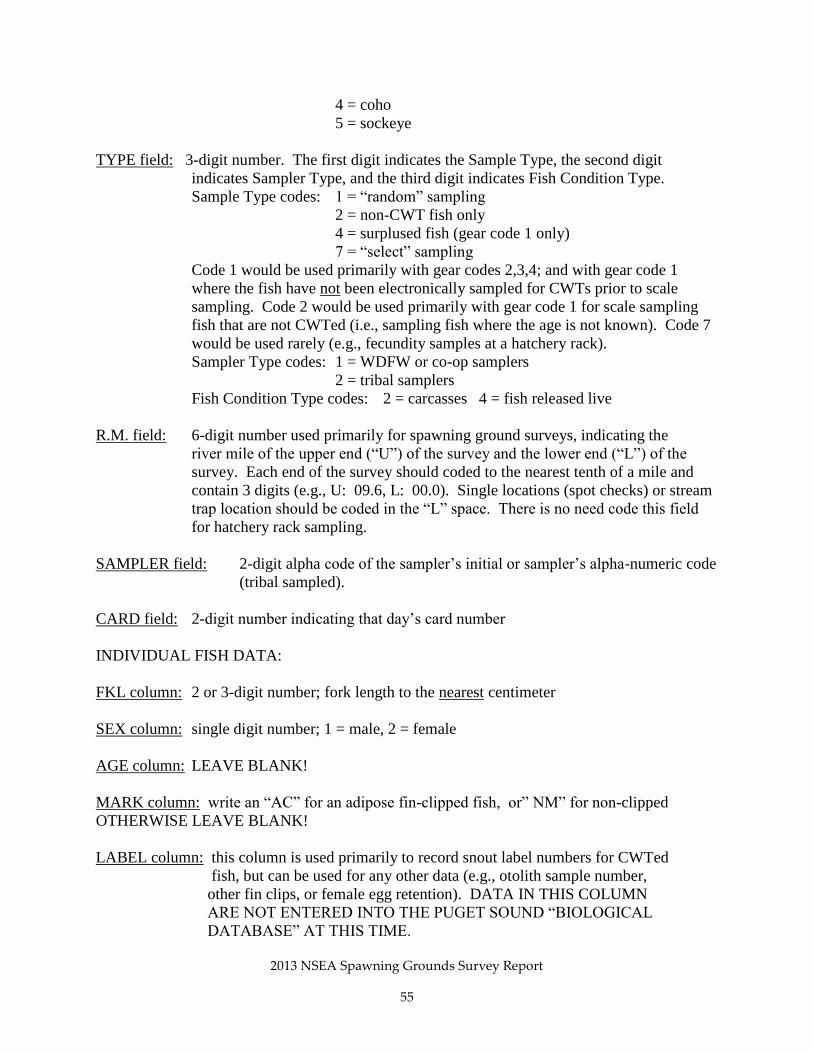
2013 NSEA Spawning Grounds Survey Report
55
4 = coho
5 = sockeye
TYPE field: 3-digit number. The first digit indicates the Sample Type, the second digit
indicates Sampler Type, and the third digit indicates Fish Condition Type.
Sample Type codes: 1 = “random” sampling
2 = non-CWT fish only
4 = surplused fish (gear code 1 only)
7 = “select” sampling
Code 1 would be used primarily with gear codes 2,3,4; and with gear code 1
where the fish have not been electronically sampled for CWTs prior to scale
sampling. Code 2 would be used primarily with gear code 1 for scale sampling
fish that are not CWTed (i.e., sampling fish where the age is not known). Code 7
would be used rarely (e.g., fecundity samples at a hatchery rack).
Sampler Type codes: 1 = WDFW or co-op samplers
2 = tribal samplers
Fish Condition Type codes: 2 = carcasses 4 = fish released live
R.M. field: 6-digit number used primarily for spawning ground surveys, indicating the
river mile of the upper end (“U”) of the survey and the lower end (“L”) of the
survey. Each end of the survey should coded to the nearest tenth of a mile and
contain 3 digits (e.g., U: 09.6, L: 00.0). Single locations (spot checks) or stream
trap location should be coded in the “L” space. There is no need code this field
for hatchery rack sampling.
SAMPLER field: 2-digit alpha code of the sampler’s initial or sampler’s alpha-numeric code
(tribal sampled).
CARD field: 2-digit number indicating that day’s card number
INDIVIDUAL FISH DATA:
FKL column: 2 or 3-digit number; fork length to the nearest centimeter
SEX column: single digit number; 1 = male, 2 = female
AGE column: LEAVE BLANK!
MARK column: write an “AC” for an adipose fin-clipped fish, or” NM” for non-clipped
OTHERWISE LEAVE BLANK!
LABEL column: this column is used primarily to record snout label numbers for CWTed
fish, but can be used for any other data (e.g., otolith sample number,
other fin clips, or female egg retention). DATA IN THIS COLUMN
ARE NOT ENTERED INTO THE PUGET SOUND “BIOLOGICAL
DATABASE” AT THIS TIME.

2013 NSEA Spawning Grounds Survey Report
56
APPENDIX E. WDFW SCALE CARD EXAMPLE

2013 NSEA Spawning Grounds Survey Report
57
APPENDIX F. SPAWNER SURVEY PHOTOS
NSEA interns, Amy Oppfelt (left) and Casey Pruitt
(right) sample scales from a coho salmon at
Landingstrip Creek.
NSEA intern, Brandon Osterlund, with a coho
salmon carcass at Fishtrap Creek.

2013 NSEA Spawning Grounds Survey Report
58
NSEA AmeriCorps members, Katie Duane and
Claire Woodward, surveying Chuckanut Creek.
NSEA assisted WDFW in surveying Chuckanut
Creek during December.
NSEA intern, James Berntson, surveying
Chuckanut Creek.

2013 NSEA Spawning Grounds Survey Report
59
Chinook salmon at Fishtrap Creek.
Chinook redd at Bertrand Creek. When identifying redds, surveyors look for a clean mound of
gravel downstream of a depression.


