64
NSIP Workshop Sam Gill
NSIP Workshop
Sam Gill

Sheep Genetics
• National genetic evaluation program for sheep in Australia
– Lamb production
– Wool production
• Launched on November 2005
– Common genetic language
– Merging of several Merino databases
– Research and development resource
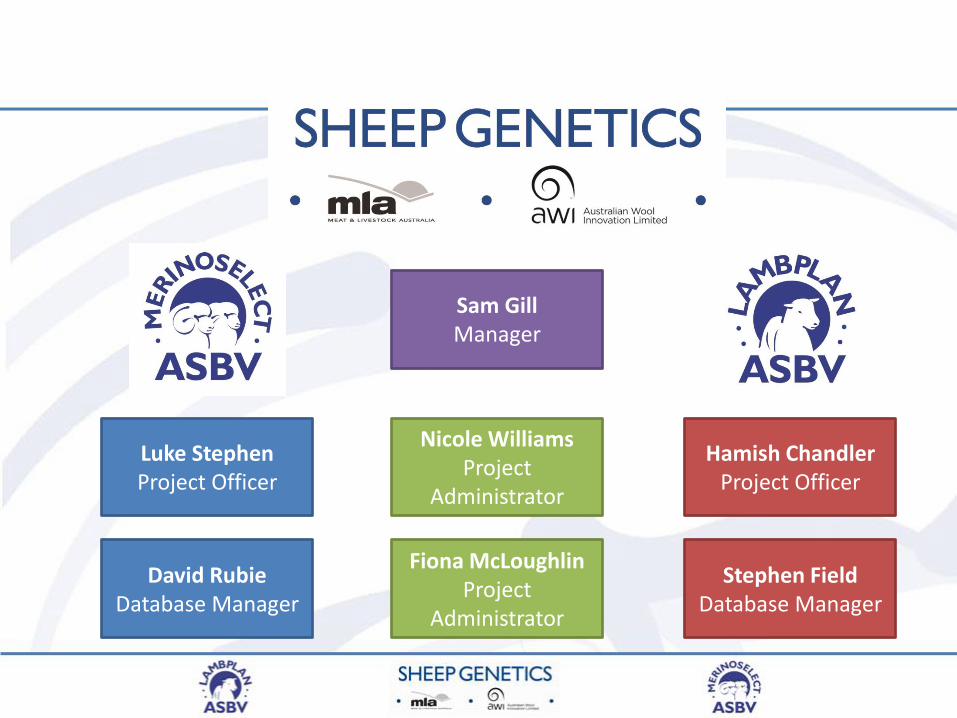
Sam Gill Manager
Nicole Williams Project
Administrator
Stephen Field Database Manager
Hamish Chandler Project Officer
Luke Stephen Project Officer
David Rubie Database Manager
Fiona McLoughlin Project
Administrator

GIENNA Superfine Merinos
• 1980’s - Starting breeding rams for own use • 2000 – Registered flock, started selling rams
• 2002 – EBVs (Merino Validation Project) • 2005 – ASBVs (Launch of MERINOSELECT)

Sheep Genetics products
• LAMBPLAN – Terminal sire (483 flocks)
• Across flock since 1995 • Across breed since 2001
– Maternal (112 flocks)
• Across flock since 1995
• MERINOSELECT – across flock Merino only (174 flocks)
• Other analyses – NSIP - US sheep analysis (134 flocks)
– Australian Dohne Breeders Association (83 flocks)
– Kidplan (Aus. Goat analysis)

New animals / year
-
50,000
100,000
150,000
200,000
250,000
300,000
350,000
400,000
2000 2001 2002 2003 2004 2005 2006 2007 2008 2009
TERMINAL NSIP BORDER OTHER BREEDS COOPWORTH MERINO DOHNE

LAMBPLAN – Terminal Breeds
POLL DORSET
41%
WHITE SUFFOLK
36%
DORPER 10%
SMALL BREEDS
4%
SUFFOLK 3%
CM 3%
TEXEL 2%
BREED ANIMALS / YEAR
POLL DORSET 43,611
WHITE SUFFOLK 37,546
DORPER 10,084
SMALL BREEDS 4,042
SUFFOLK 3,594
COMPOSITE 2,949
TEXEL 2,412
COOLALEE 1,541

Response in $ per ewe per year
Year of birth
Response (
$ p
er
ew
e)
0
5
10
15
1990 1995 2000 2005
Border LeicesterCoopworth
MerinoTerminals

Reported Index Trends
• LAMBPLAN
– TERMINAL
• Carcase Plus (desired gains)
• Increased growth, eye muscle depth, reduced fat
– BORDER LEICESTER
• Maternal $ ($ index)
• Increased growth, reproduction, eye muscle depth
• MERINOSELECT • Merino 7% (standardised $ index)
• Increased fleece weight, growth, lower fibre diameter

Comparing Indexes – SD units
0.0
0.5
1.0
1.5
2.0
2.5
2000 2001 2002 2003 2004 2005 2006 2007 2008 2009
Bre
ed
ing
Ob
ject
ive
Std
Dev
Progeny Year of Birth
Carcase Plus Mat$ M7
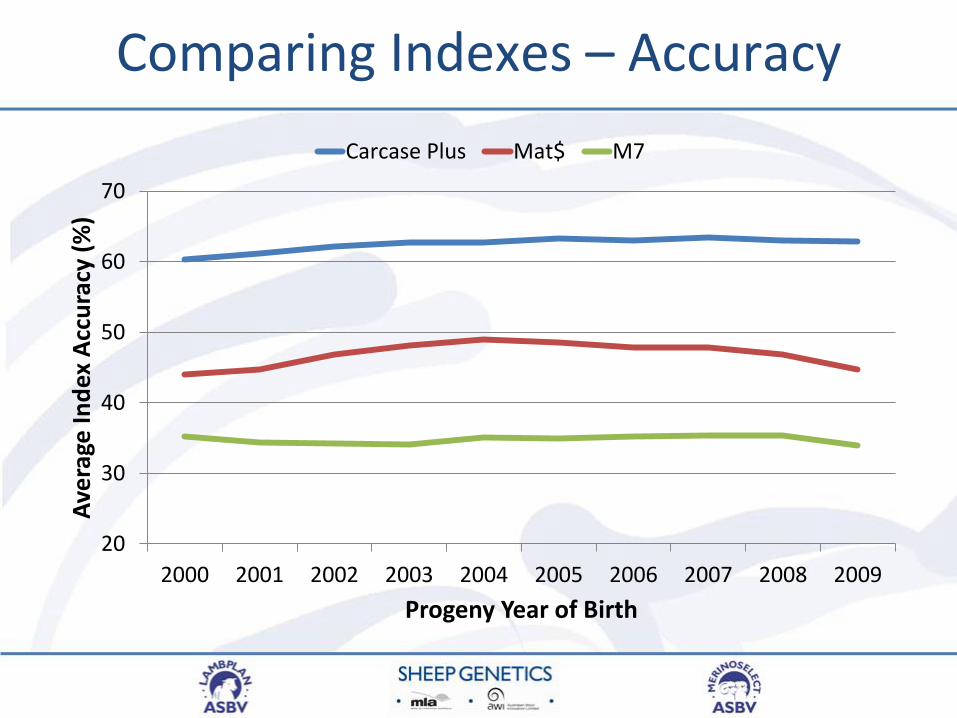
Comparing Indexes – Accuracy
20
30
40
50
60
70
2000 2001 2002 2003 2004 2005 2006 2007 2008 2009
Ave
rage
Ind
ex A
ccu
racy
(%
)
Progeny Year of Birth
Carcase Plus Mat$ M7

Relative contribution to a breeding value
0%
10%
20%
30%
40%
50%
60%
70%
80%
90%
100%
1 2 3 4 5 6 7
Bre
ed
ing
Valu
e A
ccu
racy (
%)
Progeny
Half Sibs
Animal
Parents
Fibre Diameter (60%) Staple Strength (30%)
Own Own, parents, 15 ½ sibs, 200 progeny
Own, parents, 15 ½ Sibs
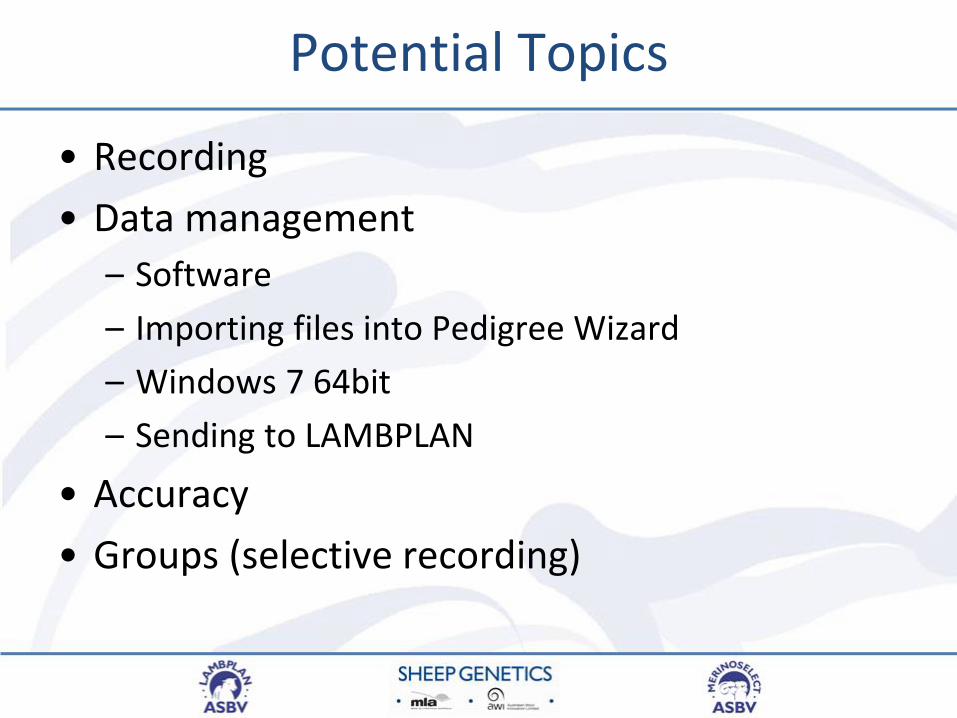
Potential Topics
• Recording
• Data management
– Software
– Importing files into Pedigree Wizard
– Windows 7 64bit
– Sending to LAMBPLAN
• Accuracy
• Groups (selective recording)

Pedigree Wizard help

Windows 7 (64bit) alternatives
• Pedigree Master
– under development
• Make your own file
– Needs to be in the correct format
– good knowledge of Excel
– Needs validation or be prepared for ‘robust’ feedback
• Microsoft Virtual Machine
– You will need to set-up email and printers again
• StockBook freeware
– Just released and also available
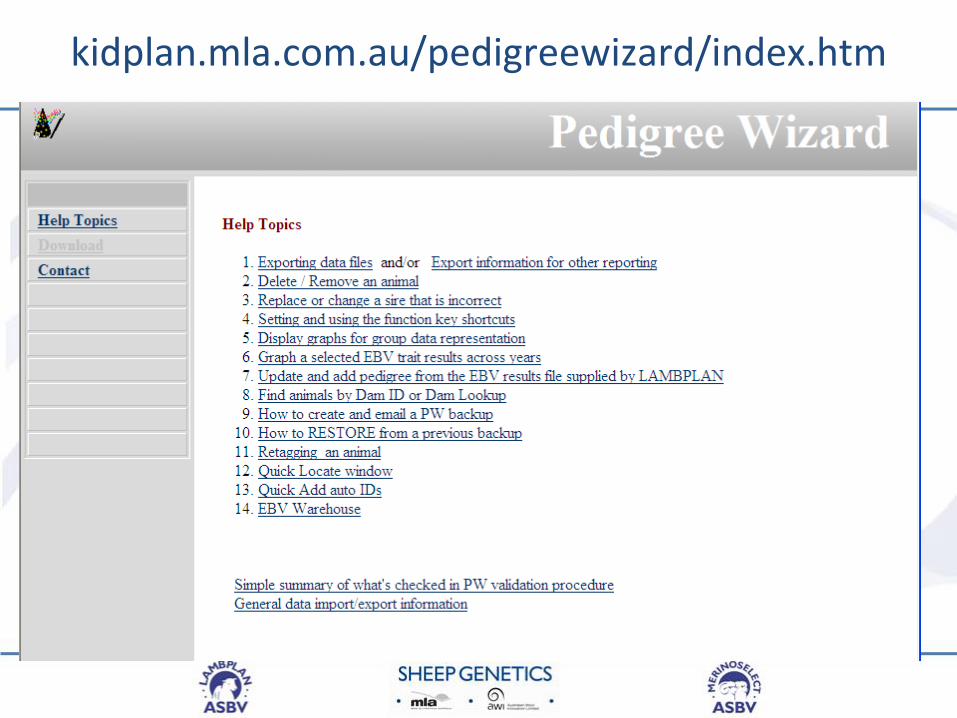
kidplan.mla.com.au/pedigreewizard/index.htm
• http://kidplan.mla.com.au/pedigreewizard/pw_download.htm


Importing data into Pedigree Wizard

Steps for importing data
1. Format the file in Excel
2. Copy all the data from Excel
3. Paste into a Notepad (.txt) file
4. Save the file in Pedigree Wizard directory – C:\lambplan\pw4
5. Open Pedigree Wizard
6. From the top menu, – open Text Importing and follow the steps
– Top menu > Utilities > Text Importing
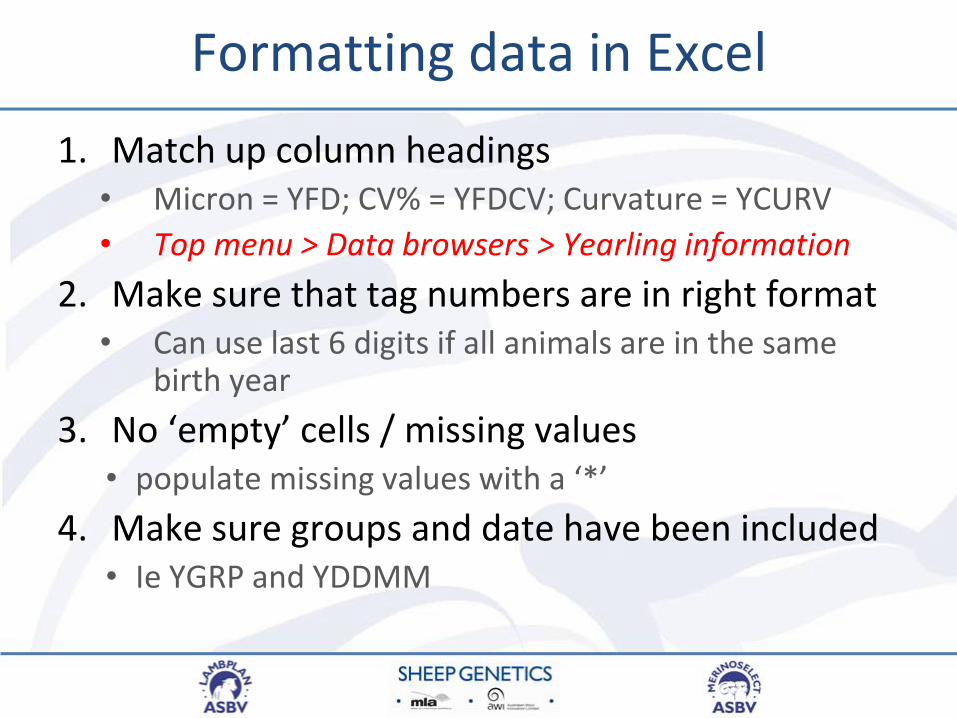
Formatting data in Excel
1. Match up column headings • Micron = YFD; CV% = YFDCV; Curvature = YCURV
• Top menu > Data browsers > Yearling information
2. Make sure that tag numbers are in right format • Can use last 6 digits if all animals are in the same
birth year
3. No ‘empty’ cells / missing values • populate missing values with a ‘*’
4. Make sure groups and date have been included • Ie YGRP and YDDMM

Column Headings
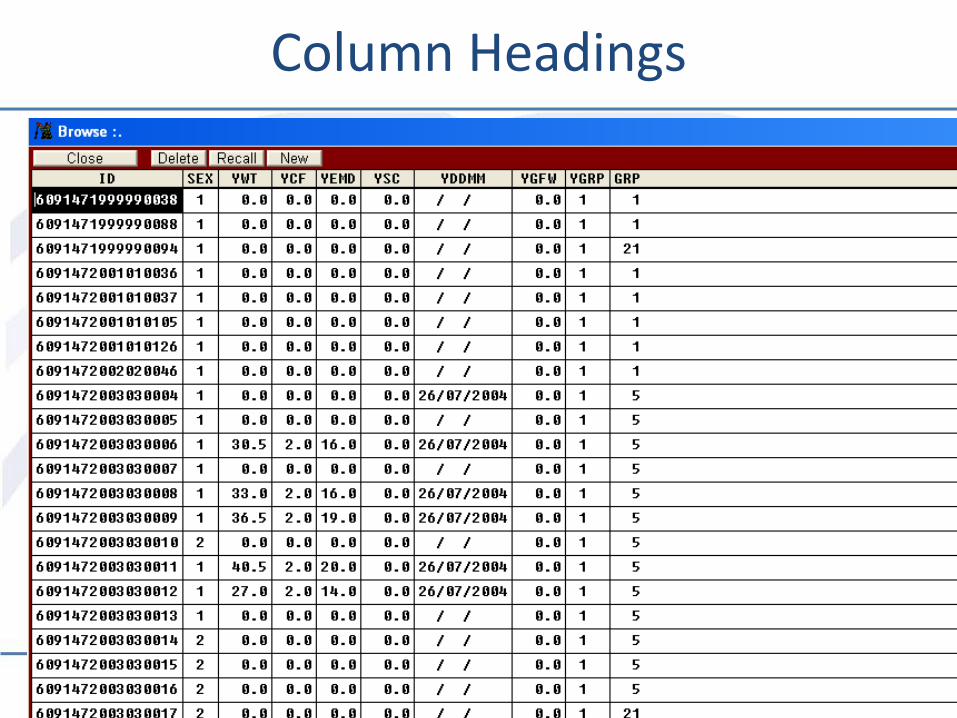
Column Headings
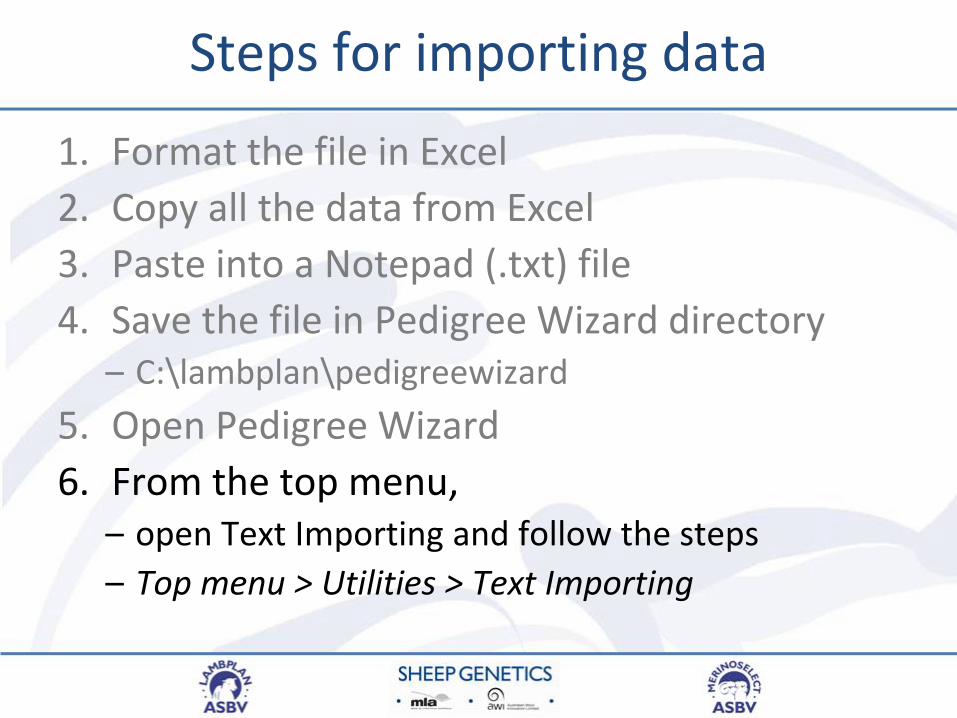
Steps for importing data
1. Format the file in Excel
2. Copy all the data from Excel
3. Paste into a Notepad (.txt) file
4. Save the file in Pedigree Wizard directory – C:\lambplan\pedigreewizard
5. Open Pedigree Wizard
6. From the top menu, – open Text Importing and follow the steps
– Top menu > Utilities > Text Importing

Import data

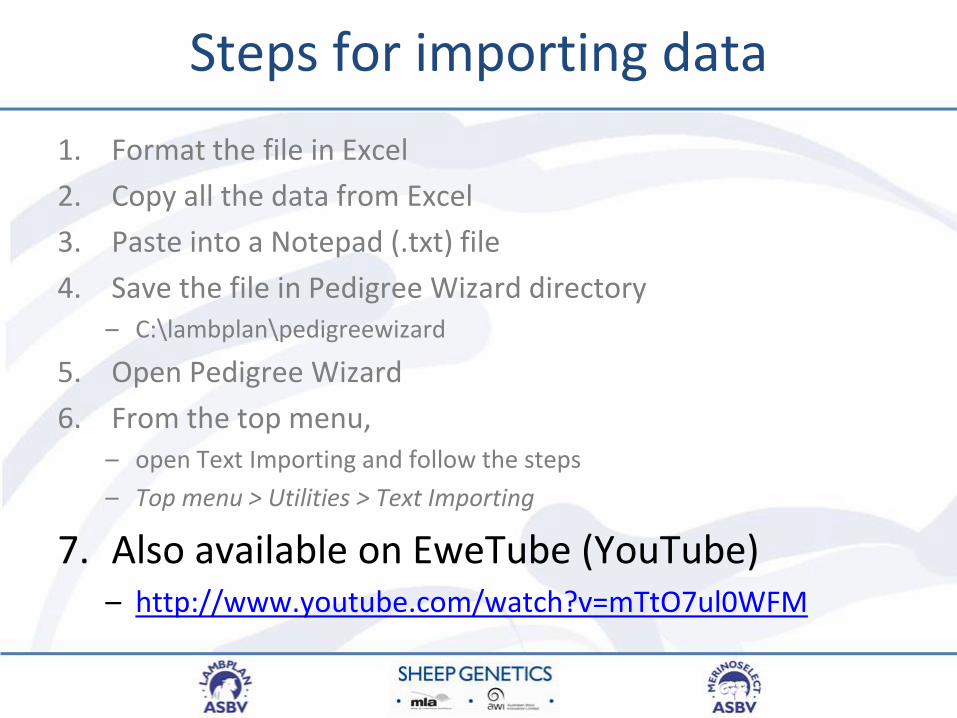
Steps for importing data
1. Format the file in Excel
2. Copy all the data from Excel
3. Paste into a Notepad (.txt) file
4. Save the file in Pedigree Wizard directory – C:\lambplan\pedigreewizard
5. Open Pedigree Wizard
6. From the top menu, – open Text Importing and follow the steps
– Top menu > Utilities > Text Importing
7. Also available on EweTube (YouTube) – http://www.youtube.com/watch?v=mTtO7ul0WFM
Measurements

Animal Identification and Pedigree
– animal identification (16-digit)
– sire pedigree
– dam pedigree
– date of birth
– birth/rearing status
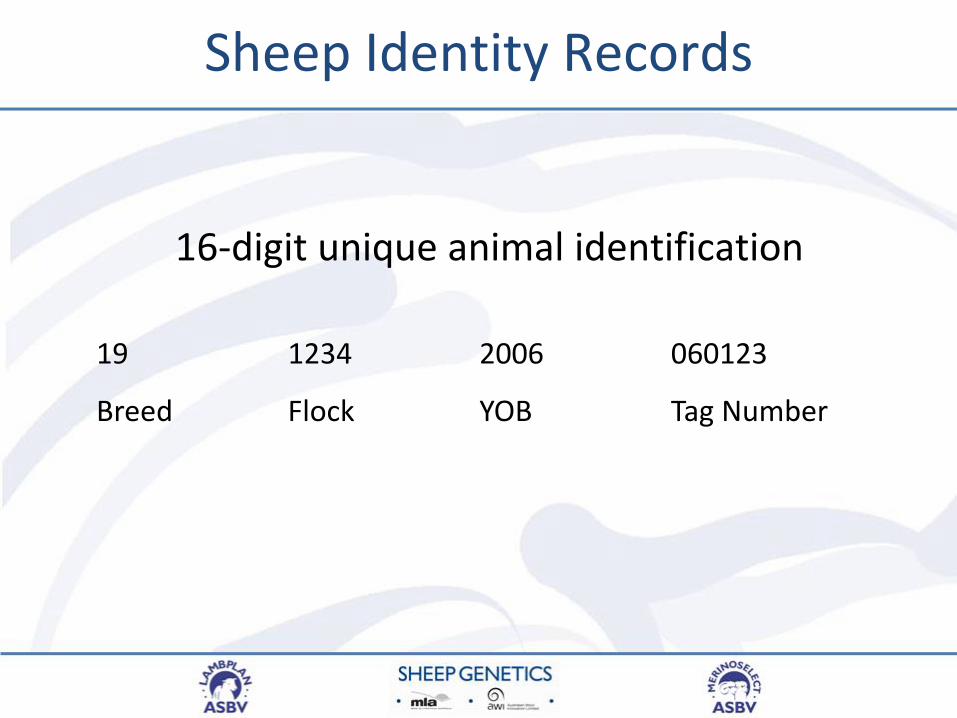
Sheep Identity Records
16-digit unique animal identification
19 1234 2006 060123
Breed Flock YOB Tag Number
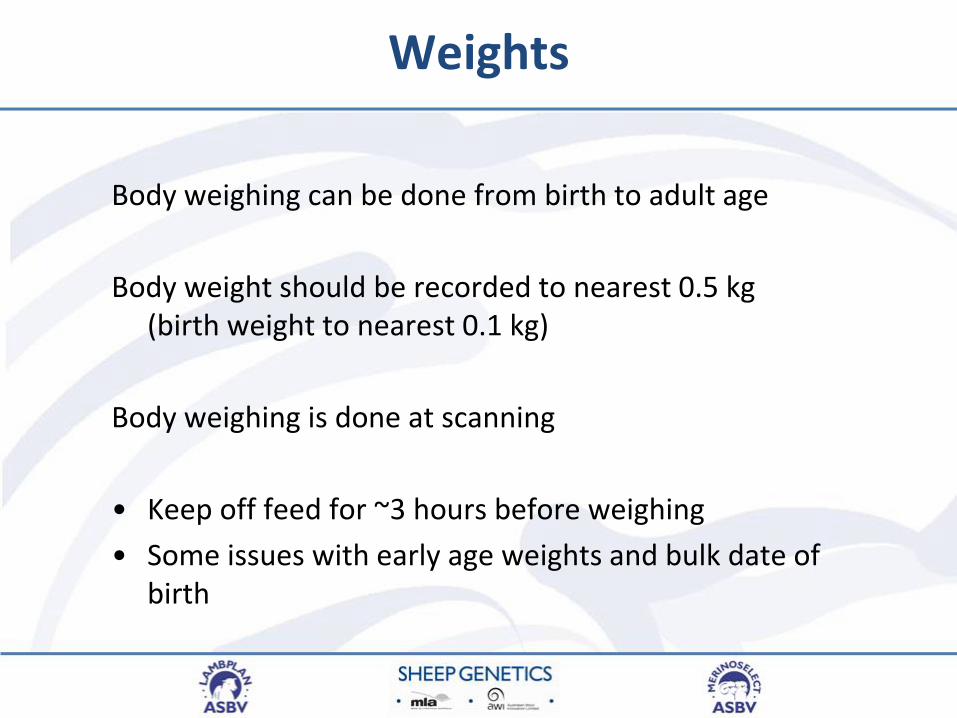
Weights
Body weighing can be done from birth to adult age
Body weight should be recorded to nearest 0.5 kg (birth weight to nearest 0.1 kg)
Body weighing is done at scanning
• Keep off feed for ~3 hours before weighing
• Some issues with early age weights and bulk date of birth

Fleece Traits
Fleece weighing
– Average min 10 months of age
– Average min 6 months wool growth • Tip shearing / bulk date of birth
Wool quality samples
– e.g. fibre diameter, CVFD, SL, SS, curv, yield
– Average min 10 months of age
– Average min 5 months wool growth • Use an OFFM QA accredited operator

Fat and Eye Muscle Depth
C Fat and eye muscle depth (EMD) must be measured by an accredited ultrasound scanner
Recommended group average:
– males average 45-60 kg
– Must be >30kg
– at least 2-3 mm of measured fat at the C site
Scanners also provide body weights and can measure scrotal circumference

GR Fat and Eye Muscle Depth
*****insert picture of C site and measurements of fat and EMD
C-site
Scan is done at the C-site (ASBV is for GR Fat & EMD)
(45 mm from the midline at the 12/13 rib)
GR tissue depth is the fat grading in Australia
GR site 110 mm out from the backbone at the 12/13 rib

Worm Egg Counts
Time of measurement varies between regions Summer rainfall areas Measure young sheep at least six weeks after weaning Measure WEC between six and 14 months of age Must have > 300 epg to be useful
Too many false ‘0’ values
Highly recommended that a flock health specialist monitor the program

Sending Data to LAMBPLAN
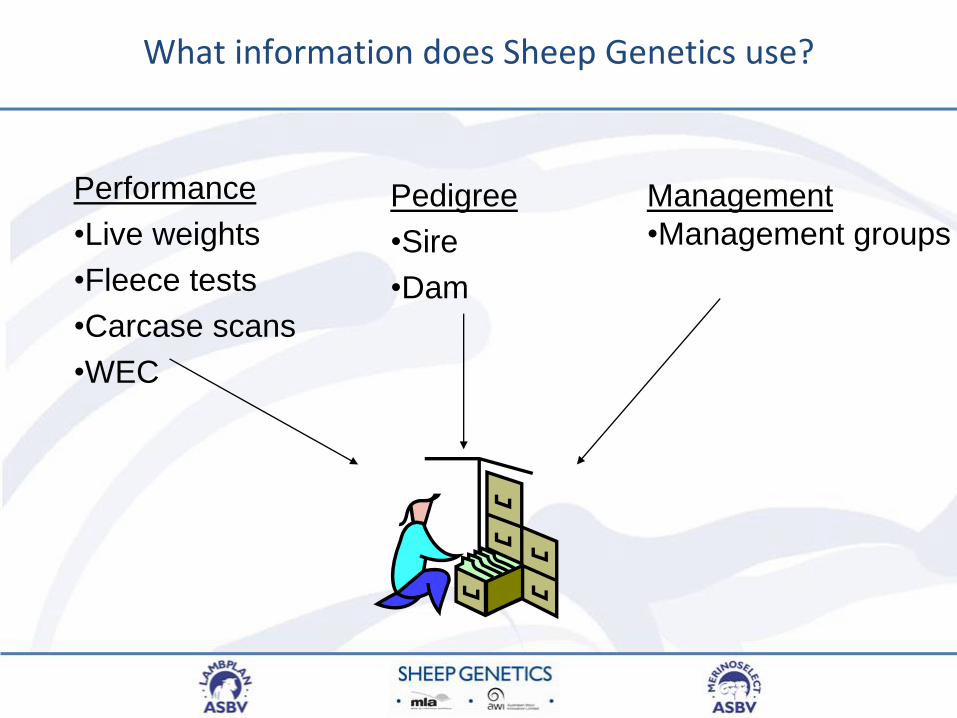
What information does Sheep Genetics use?
Pedigree
•Sire
•Dam
Performance
•Live weights
•Fleece tests
•Carcase scans
•WEC
Management
•Management groups
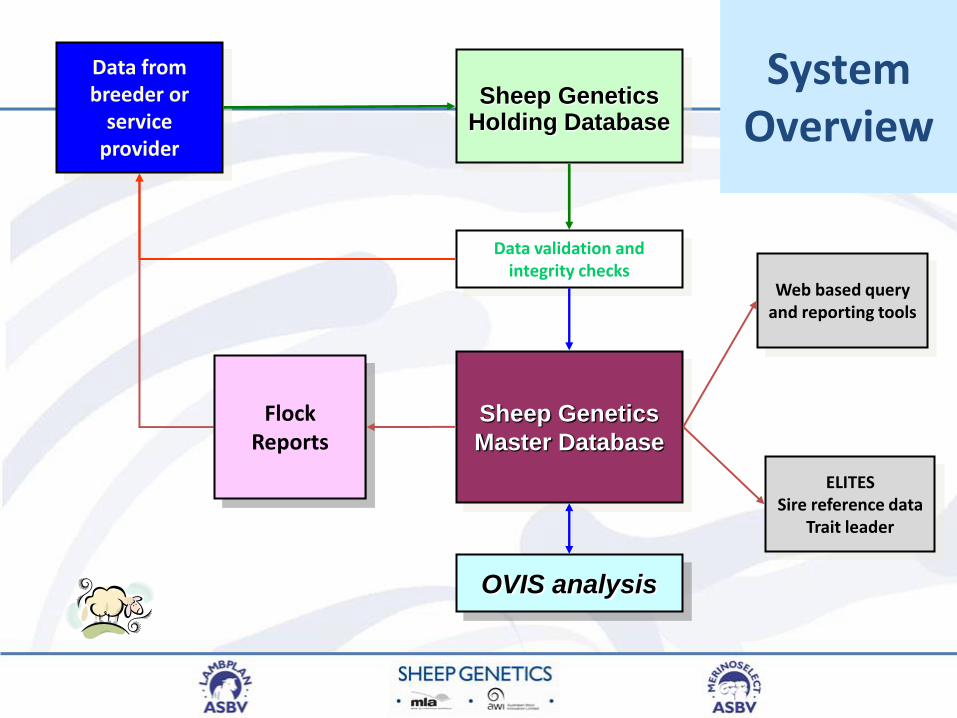
Data from breeder or
service provider
Sheep Genetics
Master Database
Data validation and integrity checks
OVIS analysis
Flock Reports
Web based query and reporting tools
ELITES Sire reference data
Trait leader
Sheep Genetics Holding Database
System Overview
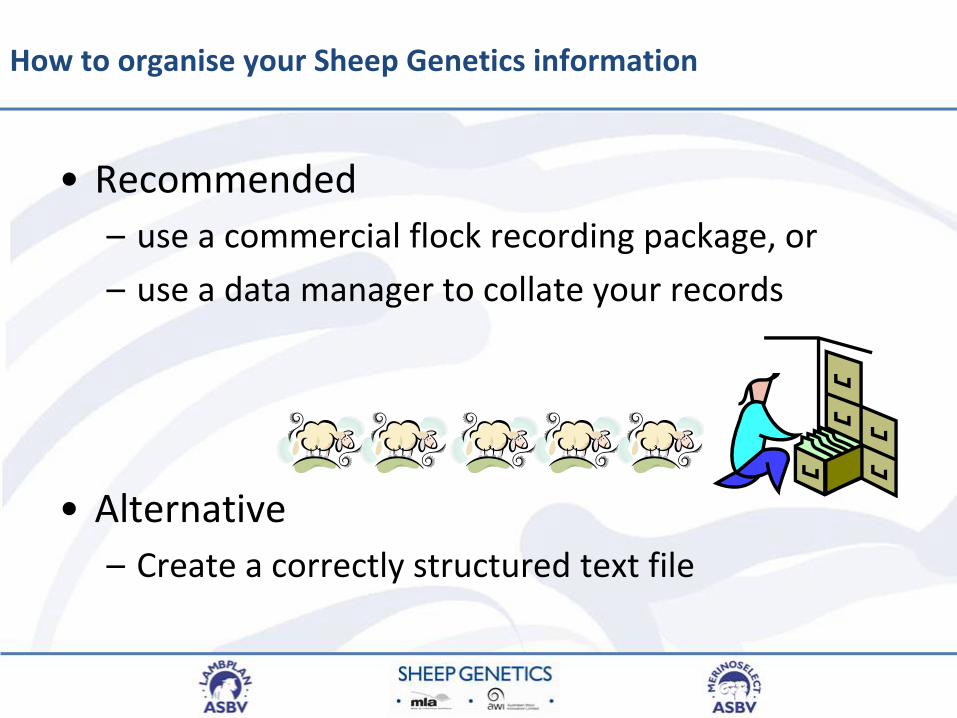
How to organise your Sheep Genetics information
• Recommended
– use a commercial flock recording package, or
– use a data manager to collate your records
• Alternative
– Create a correctly structured text file
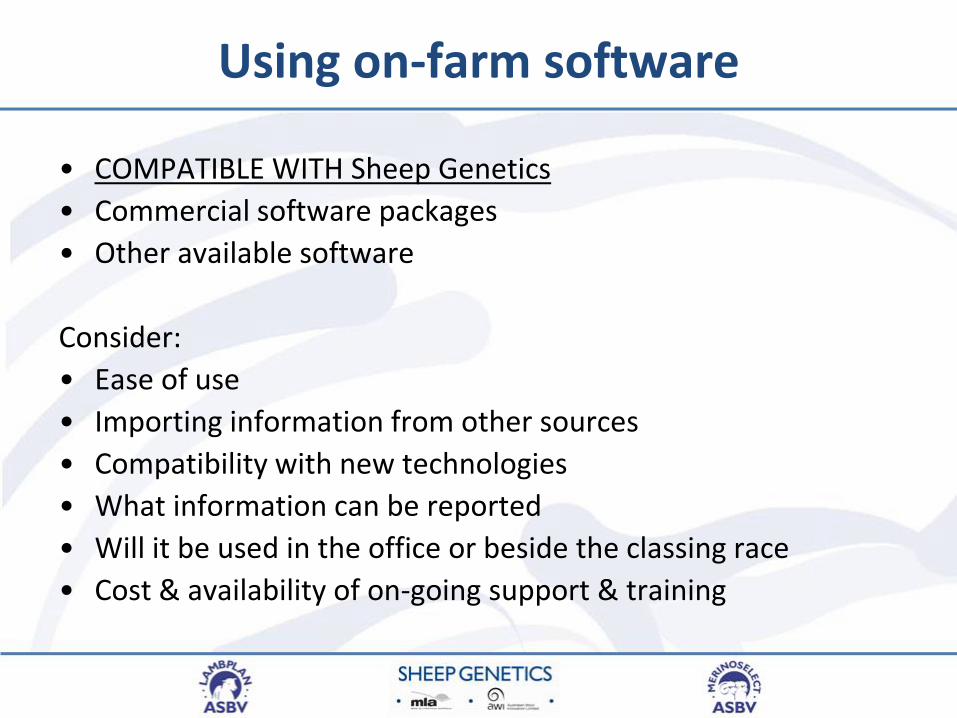
Using on-farm software
• COMPATIBLE WITH Sheep Genetics
• Commercial software packages
• Other available software
Consider:
• Ease of use
• Importing information from other sources
• Compatibility with new technologies
• What information can be reported
• Will it be used in the office or beside the classing race
• Cost & availability of on-going support & training
File contents
• Entire flock / drop must be submitted as a unit (or entire flock covering all years).
• Ensures management group structure is always consistent
• Flock / drop information only replaced when more records are received

Linkage

Linkage
Genetic linkage occurs when two or more flocks share common genes.
Genetic linkage allows the direct comparison of
animals across flocks and is essential for the calculation of ASBVs.
Genetic linkage is required for comparisons:
– across management groups – across years within flocks – across flocks within breeds – across breeds
Linkage
Linkage is assessed every run for the five trait groups
– Reproduction
– Growth
– Fleece
– Carcase
– WEC
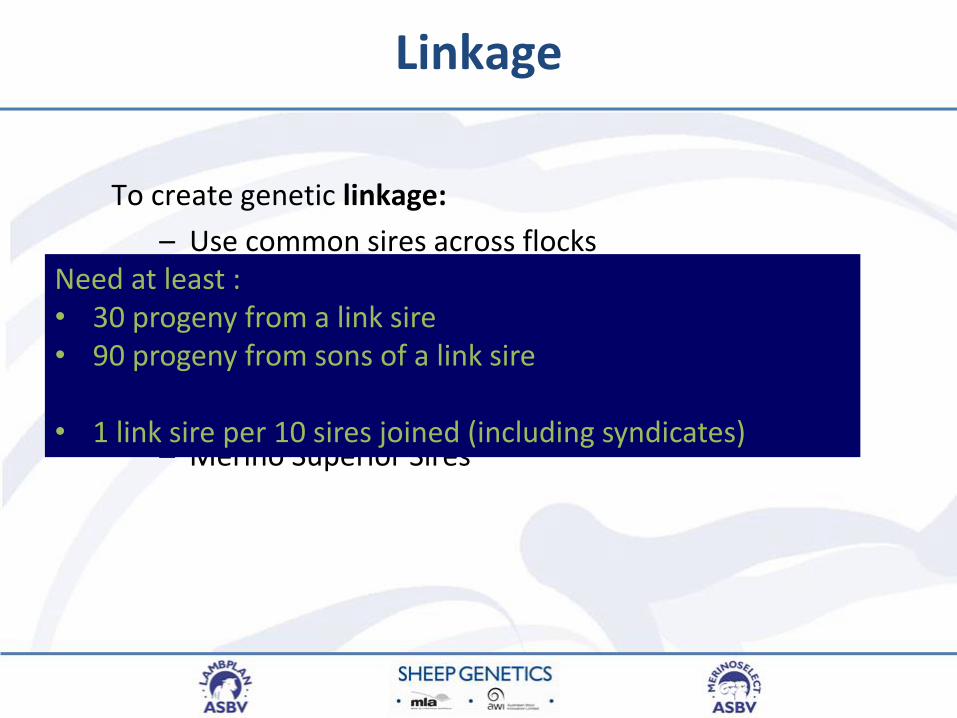
Linkage
To create genetic linkage:
– Use common sires across flocks
– Use common (link) sires across years within flocks
– Purchase new sires (or semen) from other flocks participating in Sheep Genetics
– Merino Superior Sires
Need at least : • 30 progeny from a link sire • 90 progeny from sons of a link sire
• 1 link sire per 10 sires joined (including syndicates)

A
Live Weight of Progeny
B C
45
35
Property
+ 1kg
+ 5kg
- 3kg
Comparing Rams Across Property
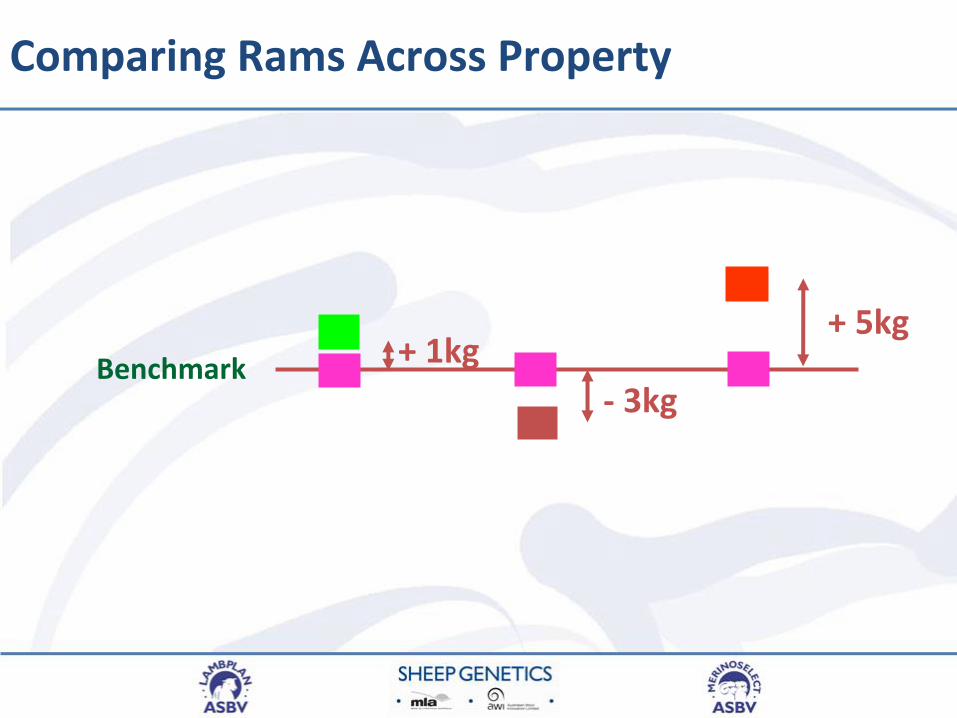
Comparing Rams Across Property
Benchmark + 1kg
- 3kg
+ 5kg

Syndicates

Syndicates
Progeny born from syndicate matings can be submitted to Sheep Gentics
A flock with only syndicate matings will receive FBVs, as syndicate matings do not allow for linkage.
Note: Syndicate data is not as accurate as pedigree data

Submitting Syndicate Data
1. Known ram syndicates (NAM)
e.g. 50-4967-2005-NAM005
Submit IDs of rams in syndicate
2. Half sib syndicates (SIB)
e.g. 50-4967-2005-SIB002
Submit ID of sire of syndicate
3. Unknown sire syndicates (SYN)
e.g. 50-4967-2005-SYN007
Note: Year of drop of sires should be year of drop of
progeny minus one.

Management Groups
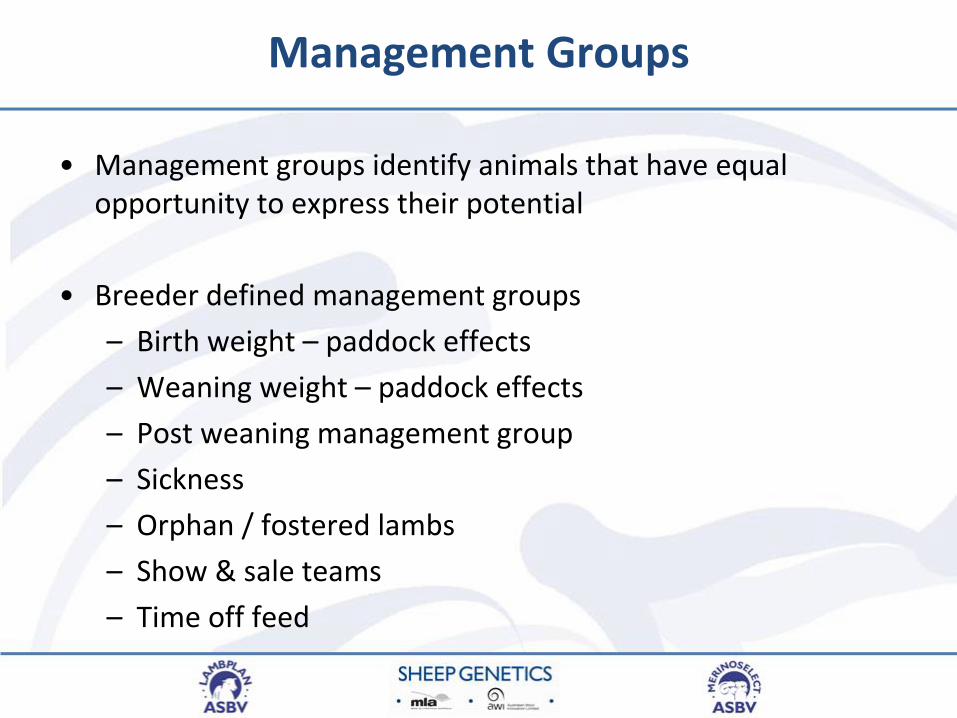
Management Groups
• Management groups identify animals that have equal opportunity to express their potential
• Breeder defined management groups
– Birth weight – paddock effects
– Weaning weight – paddock effects
– Post weaning management group
– Sickness
– Orphan / fostered lambs
– Show & sale teams
– Time off feed

Different Management Groups
Compare apples with apples
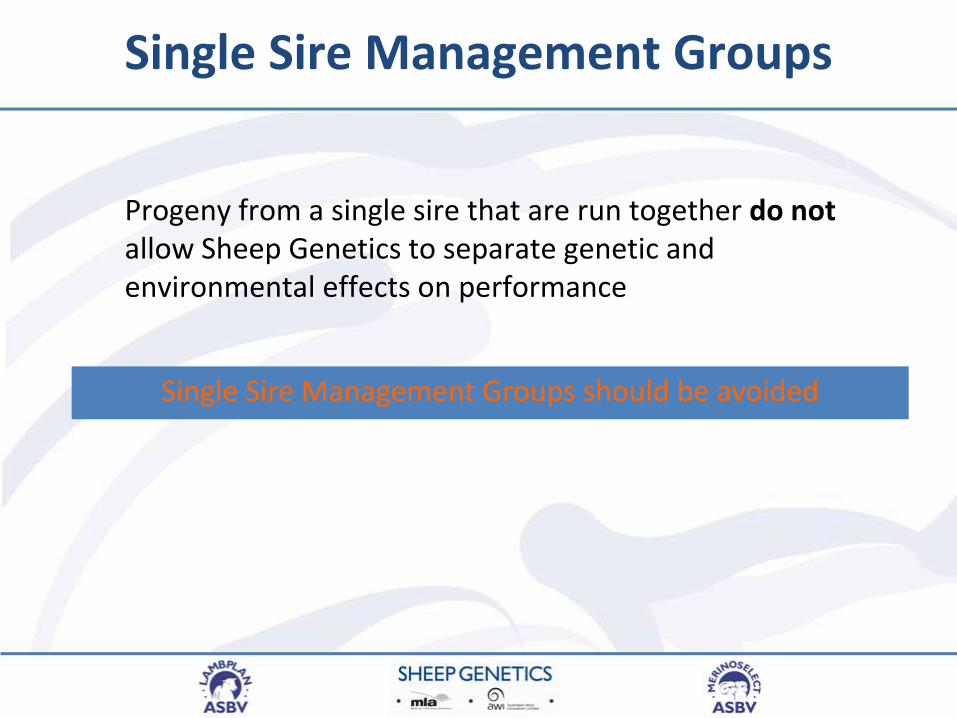
Single Sire Management Groups
Progeny from a single sire that are run together do not allow Sheep Genetics to separate genetic and environmental effects on performance
Single Sire Management Groups should be avoided
Selective recording

Submitting selected data
+ 2 kg
+ 6 kg
Average = 45kg
Average = 49kg

Accuracy

ASBV Accuracy
Accuracy is a reflection of the amount of effective information that is available to calculate an animals’ breeding values.
Accuracy does not account for:
– quality of management group definition
– genetic linkage
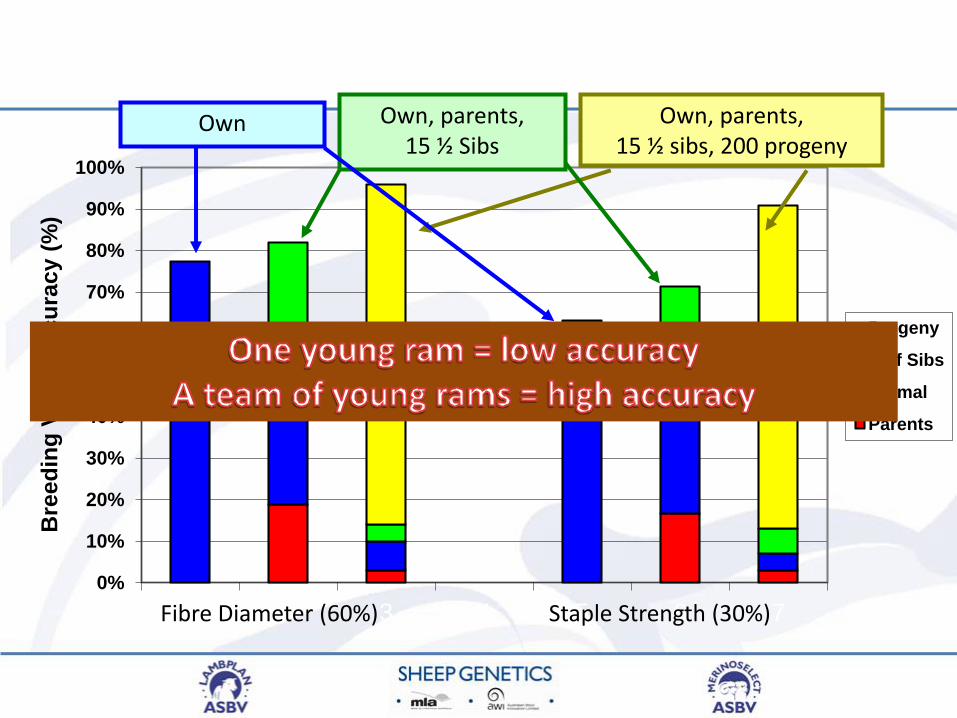
Relative contribution to a breeding value
0%
10%
20%
30%
40%
50%
60%
70%
80%
90%
100%
1 2 3 4 5 6 7
Bre
ed
ing
Valu
e A
ccu
racy (
%)
Progeny
Half Sibs
Animal
Parents
Fibre Diameter (60%) Staple Strength (30%)
Own Own, parents, 15 ½ sibs, 200 progeny
Own, parents, 15 ½ Sibs

Accuracy vs Effective Progeny
20%
30%
40%
50%
60%
70%
80%
90%
100%
0 5 10 15 20 25 30 35 40 45 50 55 60 65 70
No of Effective Progeny
Ac
cu
rac
y
YWT YWT (+ 14 half-sibs)

Accuracy Thresholds
10 15 20 25 30 35 40 45 50 55 60 65
F EC
N LW
EM D
F A T
A WT
YWT
P WT
WWT
B WT
SS
SL
F D C V
F D
C F W
Accuracy Threshold
Reproduction – NLW

Where NLW records come from
0%
5%
10%
15%
20%
25%
30%
35%
40%
45%
50%
MID PARENT MP + WT/SC OWN RECORD +30 HALF SIBS
OWN RECORD +80 HALF SIBS
+ 2 LAMBS + 6 LAMBS
OWN DAM SIRE SIBS PROG CORRELATED

0
50
100
150
200
250
300
350
0% 2% 4% 6% 8% 10% 12% 14% 16% 18% 20% 22% 24% 26% 28% 30%
Before Feb 2009 After Feb 2009
Range of changes to sire NLW pre/post model updates
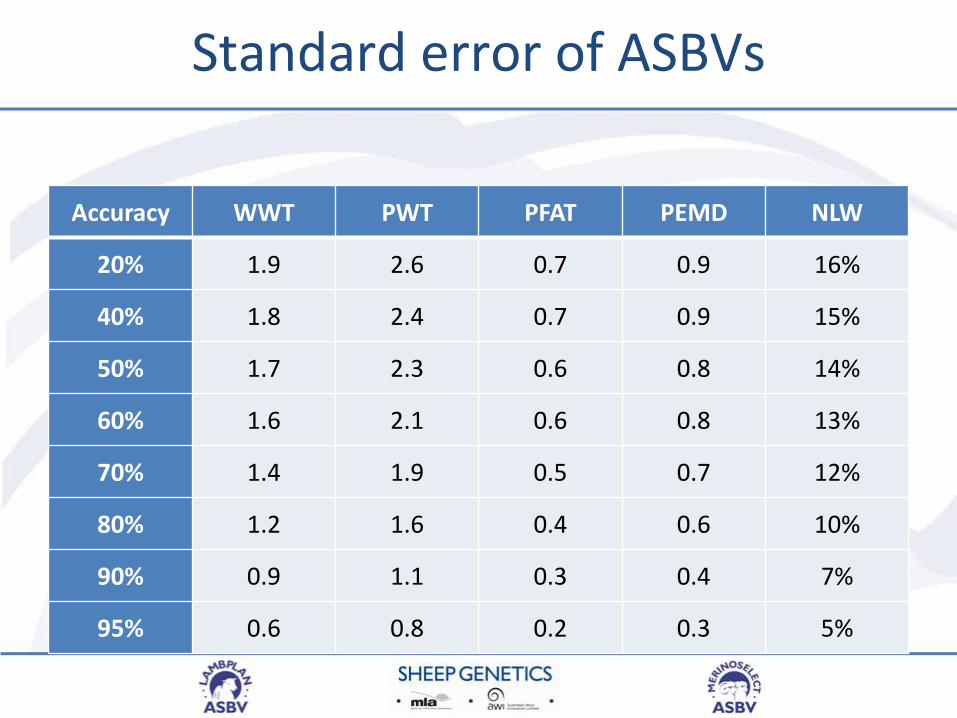
Standard error of ASBVs
Accuracy WWT PWT PFAT PEMD NLW
20% 1.9 2.6 0.7 0.9 16%
40% 1.8 2.4 0.7 0.9 15%
50% 1.7 2.3 0.6 0.8 14%
60% 1.6 2.1 0.6 0.8 13%
70% 1.4 1.9 0.5 0.7 12%
80% 1.2 1.6 0.4 0.6 10%
90% 0.9 1.1 0.3 0.4 7%
95% 0.6 0.8 0.2 0.3 5%


