23
. NST TUTE . FOR 127-72 RESEARCH ON·, THE POTENTIAL OF BLACK CAPITALISM Timothy Bates . ..< UNIVERS/1Y OF WISCONSIN -MADISON
. NSTTUTE .FOR 127-72
RESEARCH ON·,POVERTYD,scWK~~~
THE POTENTIAL OF BLACK CAPITALISM
Timothy Bates .
..<
UNIVERS/1Y OF WISCONSIN -MADISON

THE POTENTIAL OF BLACK CAPITALISM
Timothy Bates
The research report here was made possible by the joint cooperation ofthe Small Business Administration and the Federal Deposit InsuranceCorporation and by funds granted to the Institute for Research on Povertyat the University of Wisconsin by the Office of Economic Opportunitypursuant to the provisions of the Economic Opportunity Act of 1964.The author is particularly grateful for the assistance received underthe fellowship program of the FDIC. The conclusions are the soleresponsibility of the author.
May 1972
Copyright ~ 1972 by the Regents of the University of Wisconsin Systemon behalf of the Institute for Research on Poverty.
ABSTRACT
This paper examines Andrew Brimmer's well known thesis, supported
by empirical analysis, on the nature of Black business. In his
Public Policy article, Brimmer states his thesis that a "barrier of
segregation" protects the Black business community and that Black
businesses exist primarily because White firms have failed to offer
a number of personal services or public accommodations to-Black customers.
It will be argued that Brimmer's analysis of the Black business community
is misleading because the data from which his empirical analysis is
derived are incorrectly handled, thus limiting the scope of his thesis.
In this paper the same financial data on Black businesses are used but
analyzed differently. In addition new data have been added. From analysis
of both, an alternative thesis is developed which states that Black
businesses may grow due to the increased availability of capital to
Black entrepreneurs.

THE POTENTIAL OF BLACK CAPITALISM
Timothy Bates
Introduction
Black capitalism is a vaguely defined expression, but two elements
are usually associated with the concept: Black business ownership and
location of these enterprises in or near Black residential areas.
Accordingly, data analyzed in this paper have been collected from Black
owned firms operating in metropolitan areas having substantial Black
populations. Articles analyzing the Black business community typically
state that segregation and discrimination have been instrumental in creating
Black enterprises that are small. Of these articles, Andrew Brimmer and
Henry Terrell's contains the most extensive empirical analysis of the Black
business community to appear in socio-politico-economic literature in
recent years. Their article, "The Economic Potential of Black Capitalism,"
which appeared in Public Policy, Spring, 1971, is an attempted evaluation
of the economic potential of Black capitalism as a "means of stimulating
economic development for Negroes. ,,1 In this paper I will re-evaluate the
Brimmer-Terrell empirical analysis and examine the role that capital
markets play in determining the nature of the Black business community.
Contrary to Brimmer's views, the erosion of segregation and discrimination
may be ushering in a new era of opportunity for Black entrepreneurs; the
Black business community of the future will not necessarily resemble the
present-day population of Black firms.
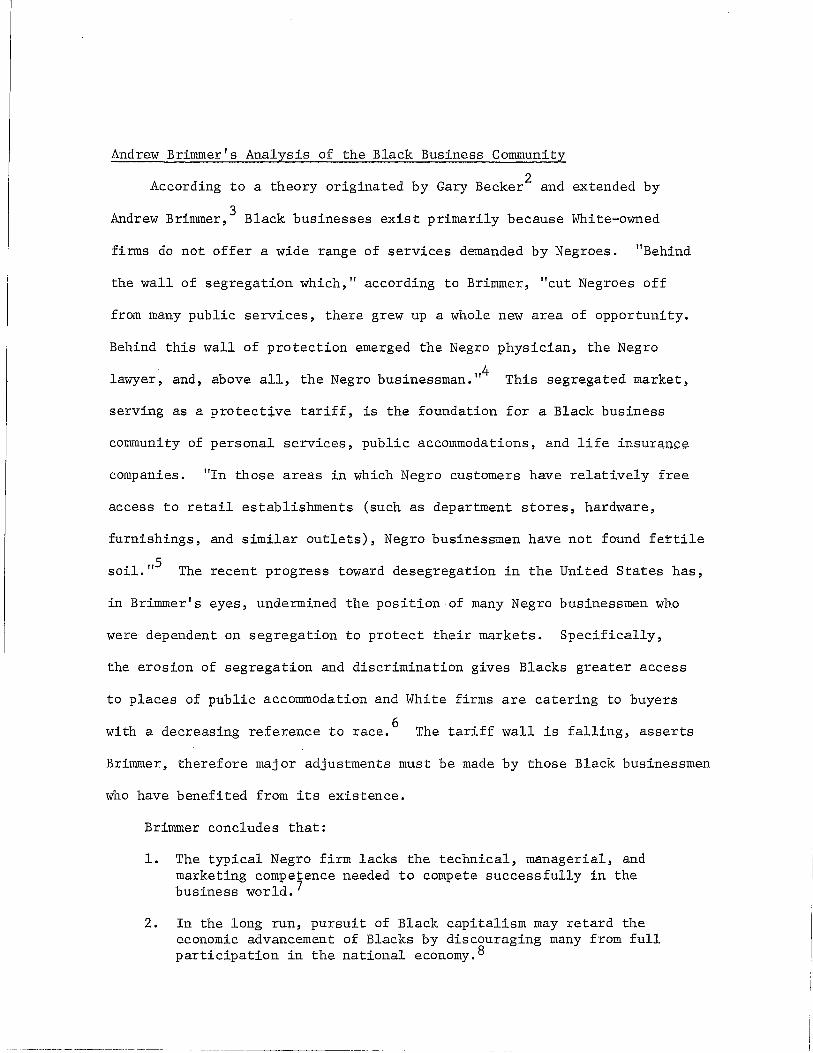
Andrew Brimmer's Analysis of the Black Business Community
2According to a theory originated by Gary Becker and extended by
Andrew Brimmer,3 Black businesses exist primarily because White-owned
firms do not offer a wide range of services demanded by Negroes. "Behind
the wall of segregation which," according to Brimmer, "cut Negroes off
from many public services, there grew up a whole new area of opportunity.
Behind this wall of protection emerged the Negro physician, the Negro
lawyer, and, above all, the Negro businessman.·A This segregated market,
serving as a protective tariff, is the foundation for a Black business
community of personal services, public accommodations, and life insurance
companies. "In those areas in which Negro customers have relatively free
access to retail establishments (such as department stores, hardware,
furnishings, and similar outlets), Negro businessmen have not found fertile
soil. ,,5 The recent progress toward desegregation in the United States has,
in Brimmer's eyes, undermined the position of many Negro businessmen who
were dependent on segregation to protect their markets. Specifically,
the erosion of segregation and discrimination gives Blacks greater access
to places of public accommodation and White firms are catering to buyers
with a decreasing reference to race.6
The tariff wall is falling, asserts
Brimmer, therefore major adjustments must be made by those Black businessmen
who have benefited from its existence.
Brimmer concludes that:
1. The typical Negro firm lacks the technical, managerial, andmarketing competence needed to compete successfully in thebusiness world. 7
2. In the long run, pursuit of Black capitalism may retard theeconomic advancement of Blacks by discouraging many from fullparticipation in the national economy.S
--.__ ..•._--_._-------_.,"_._._-~-- _. __ ._---------_._._~ ----

2
Brimmer's analysis of the Black business community would imply that
recent governmental efforts to promote Black business ownership will not
alleviate any economic problems in Black communities. This conclusion
is directly counter to the goals of present government policy and the
views of many leading officials in government and industry. This is
illustrated by the Small Business Administration's present policy "to
substantially increase the number of minority-owned, operated and managed
businesses,,,9 and by Ross Davis, Assistant Secretary of Commerce for
Economic Development, who has stated that, "When ghetto residents have
substantial full-time jobs in businesses managed and owned by Black
people, I believe that many of the social and economic problems of our
cities may be solved. ,,10 How does Brimmer support his controversial
assertion that business ownership will not provide an economically viable
future for Black entrepreneurs? As Brimmer acknowledges, comprehensive
financial data on the Black business community are virtually nonexistent.
"To date, little has been known about the detailed characteristics of
Black businesses. A recent seven-city survey of 564 Black-owned businesses
conducted by the National Business league (NBL) in early 1968 has helped
to fill this data gap. "II
To support his analysis on the nature of Black entrepreneurship,
Andrew Brimmer employs this NBL survey data. Of the 564 businesses included
in the survey, 102 (18.2%) were barber shops or beauty shops, 82 (14.5%)
were grocery stores, 54 (9.6%) were restaurants, 38 (6.7%) were laundries,
and 40 (7.1%) were service stations or auto repair places. The mean
profit earned by a sample firm was reported to be $3,480. Ave~age gross
receipts per establishment were correspondingly small:
----_._---- -------

all service and retail businesseslaundriesbeauty and barber shppsgrocery storesrestaurantsservice stations and auto repair places
$19,14714,655
6,67828,258
7,34618,065
3
The 1963 Census of Business reported average gross receipts per
establishment of $102,538 for all service and retail businesses in the
United States. Apparently these Black businesses are very small compared
to representative firms in the White business community.
12Again using the NBL survey data, Brimmer and Terrell regressed net
profits per worker on a number of business characteristics recorded in
the sample. The equation was:
Profits per worker -151.32 + .00993X! + l8.91X~ + 439.l5X~*
-2 .09 F 20.29R = =
where: Xl Total Receipts
X2= Age of Owner
Membership in Business Organization
*Significant at 1 percent level.
,~*Significant at 10 percent level. (one-tailed tests).
This regression equation, according to Brimmer and Terrell, "showed
quite clearly that efficiency, as measured by profits per worker, varied
1 1 1 f f d 1 · ,,13c ose y with the abso ute size 0 irm as measure by its tota rece~pts.
I contend that Brimmer's evidence is not solid. His profit and sales
figures are based upon the NBL survey of 564 Black firms, as with many
surveys, nonre~ponse was a major problem in the NBL survey. In Durham,
North Carolina, for example, a sociology class collected data on eighty

4
Black businesses by interviewing the owners--only eighteen of the eighty
would reveal their profit and sales figures. In Jackson, Mississippi,
six Black businessmen did the data collecting and succeeded in obtaining
14profit and sales figures from fifty of 112 Black business owners.
The'pattern is similar for the other five cities in which data were
collected. Brimmer's calculations0of average profits ($3,480) and
average sales ($19,1'47) are based on his assumption that all non-responders
(sixty-two of eighty in Durham) had zero sales and profits. Close
examination of the data which Brimmer used for his profit and sales
calculations reveals other inconsistencies, for example:
a. Eleven firms had zero sales and positive (sometimes very large)profits.
b. A superm~rket with sales of $340,000 was included three times.
c. 343 firms would not divulge their net profits; profits were takenas zero for all of these firms.
When average profits and sales calculations were made for firms
reporting "complete" information, the results were predictably different.
Information "completeness" refers only to those variables used in the
analysis presented in the Spring,197l, Public Policy article. Most of
the deleted firms (361) failed to report both sales and profit figures;
eight additional firms did not report information on either age of owner
or business organization affiliation. Three firms were dropped due to
obvious errors in the data cards. Profit and sales figures for those
192 firms in the NBL sample that reported complete information are shown
below.
IIII
5
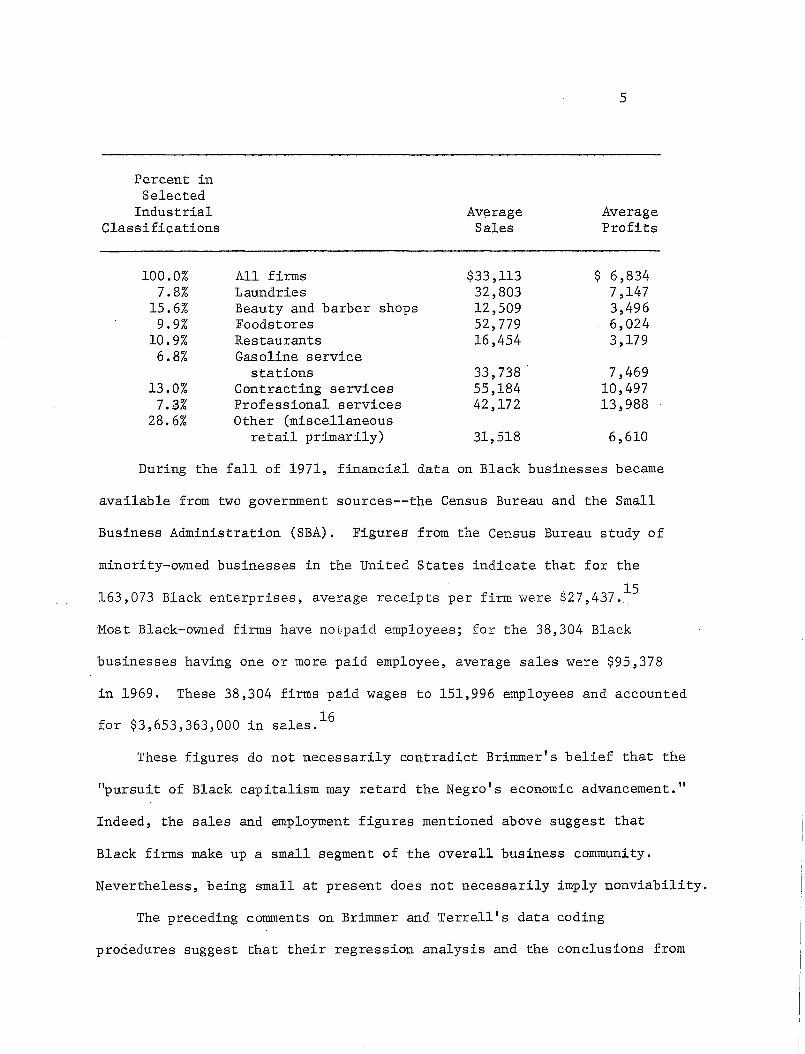
Percent inSelected
Industrial Average AverageClassifications Sales Profits
100.0% All firms $33,113 $ 6,8347.8% Laundries 32,803 7,147
15.6% Beauty and barber shops 12,509 3,4969.9% Foodstores 52,779 6,024
10.9% Restaurants 16,454 3,1796.8% Gasoline service
stations 33,738 7,46913.0% Contracting services 55,184 10,497
7.3% Professional services 42,172 13,98828.6% Other (miscellaneous
retail primarily) 31,518 6,610
During the fall of 1971, financial data on Black businesses became
available from two government sources--the Census Bureau and the Small
Business Administration (SBA). Figures from the Census Bureau study of
minority-owned businesses in the United States indicate that for the
163,073 Black enterprises, average receipts per firm were $27,437.15
Most Black-owned firms have notpaid employees; for the 38,304 Black
businesses having one or more paid employee, average sales were $95,378
in 1969. These 38,304 firms paid wages to 151,996 employees and accounted
for $3,653,363,000 in sa1es. 16
These figures do not necessarily contradict Brimmer's belief that the
"pursuit of Black capitalism may retard the Negro's economic advancement."
Indeed, the sales and employment figures mentioned above suggest that
Black firms make up a small segment of the overall business community.
Nevertheless, being small at present does not necessarily imply nonviabi1ity.
The preceding comments on Brimmer and Terrell's data coding
procedures suggest that their regression analysis and the conclusions from

6
it may be misleading. To evaluate the effects of missing information
on the Brimmer-Terrell regression results, their equation was
re-estimated using all firms reporting complete information (regarding
the variables appearing in the regression equation):
Profits per worker = 2622.9 + .005Xl - 20.9X2+ 293.0X3(3.58) (1.66) (-1.38) (.87)
T - statistic value is in parentheses
-2R = .019 F = 2.24
In the re-estimated model, none of the explanatory variables (total
receipts, age of owner, business organization membership) is significant
at the .01 level and the regression equation is insignificant at the
.05 level when an F Test is applied.
While the Brimmer-Terrell empirical analysis of the Black business
community is clearly wrought with errors, close analysis of Brimmer's
"wall of segregation," "protective tariff" thesis reveals that his
theoretical work is similarly limited in its validity.
To observe that segregation and discrimination have provided a wall
of protection for Black businesses is a one-sided analysis of the
historical development of Black entrepreneurship in America. As Black
economist Charles Tate has noted, the Brimmer thesis is deficient because
it fails to explore the causal relationship between the conditions of
Black poverty and the workings of the American political and economic
17systems. Among the more observable causal relationships the fact that
capital markets have frequently been closed to Black firms can account for
part of the Black business community's small size and industry orientation.
7
Lack of Black-owned construction companies is, of course, partially
caused by the traditional practice of barring Blacks from entering most
apprentice programs of the bUilding trades. Past and present limitations
on the educational opportunities available to Blacks undoubtedly handicap
Black entrepreneurs in certain lines of business. This list is merely
illustrative; it could be expanded to include other interrelations between
discrimination, institutional racism, and the resultant present-day
backwardness of the Black business community.
The Brimmer thesis fails to distinguish between White-owned firms
who serve ,a White clientele and White-owned firms oriented toward Black
customers. While Blacks have undoubtedly been denied service in numerous
White restaurants historically, this fact does not logically imply that
Blacks will be forced to patronize only Black-owned restaurants. If White
entrepreneurs can operate profitably by serving a Black clientele, they
have rarely shown hesitancy to exploit such opportunities, especially
in highly competitive lines of business requiring little capital investment.
Only in certain less competitive, difficult-to-enter lines of ?usiness
have Whites failed to fully exploit the potential Black market.
Black Business and Capital Markets
Developing a strong Black business community necessarily hinges upon
finding sources of capital for existing and planned Black firms. This
study will now analyze responses to recent programs for making long term
credit available to Black entrepreneurs. Financial information has been
collected from the Small Business Administration (SBA) for a sample of
559 new and existing Black-owned firms in Boston, New York and Chicago. lS
8
Because all of the businesses being considered have received long-term
loans from banks or the SBA, this body of data focuses upon a potentially
expansive segment from the population of Black firms.
Prior to the urban riots and rebellions of the 1960's, financial
institutions rarely extended credit to Black entrepreneurs. 19 As
Theodore Cross notes, "Rioting and burning have invariably been followed
by industry commitments for new plants, etc. • • . . The motive most
calculated to insure that businessmen will work for the enrichment of
the ghetto is the threat to their corporate plans and pX!oduct markets. ,,20
For large banks, locked into central cities and relying increasingly on
a Black labor force, this is particularly true.
In 1968, the director of the Small Business Administration engineered
a series of institutional innovations which brought about a vast increase
in bank lending to Black entrepreneurs. Under Project OWN, bank loans
to minority firms were insured against default risk by the SBA. . SBA
chief, Howard Samuels, believed in "compensatory capitalism:" in order
to develop the minority resources seeking to fin4 expression3.in business,
bankers would have to accept the principle of less stringent requirements
for loans to minorities. Higher risks would be accepted because higher
priority social objectives were at stake; with the SBA assuming the
default risk, banks increased their rate of lending to minority-owned
businesses by more than 800 percent during the first seven months of
Project OWN. 21
The Small Business Administration, because of Project OWN and similar
programs for lending to minorities, possesses a most comprehensive
collection of data on Black businesses. Using information provided by
j,.'

9
SBA's Office of Records, a random sample of Black firms in Chicago,
New York, and Boston was selected for analysis. For these firms,
extensive financial information was collected over a four month period
by individually examining the loan files of Black borrowers in the
local SBA offices of Chicago, Boston and New York. Brief statistics are
presented below to summarize the more important traits of the sample of
Black loan recipients. (Bank loans guaranteed by SBA are included in the
sample and in all summary statistics.)22
Table 1
Black Existing Business Loan Recipients in Boston, New York and Chicago:Mean Values for Selected Business Characteristics
Total SalesNet Profits (including
owner's withdrawals)Current Assets
(excluding intangibles)Total Assets
(excluding intangibles)Total LiabilitiesOwner's Management
Experience (years)Loan AmountNumber of Observations
in This Group
Table 2
$74,101
7,000
17 ,110
30,02919,528
8.4527,740
285
Blacks Forming New Businesses in Boston, New York and Chicago: MeanValues for Selected Characteristics
Personal Net Worth of DwnerPersonal Income of OwnerOwner's Management Experience (years)Loan AmountNumber of Observations in
This Group
$11,2559,1735.01
27,694
273
-'-~_.~~-~------'--_. __._-_._----_.._------------------_.,-~--
10
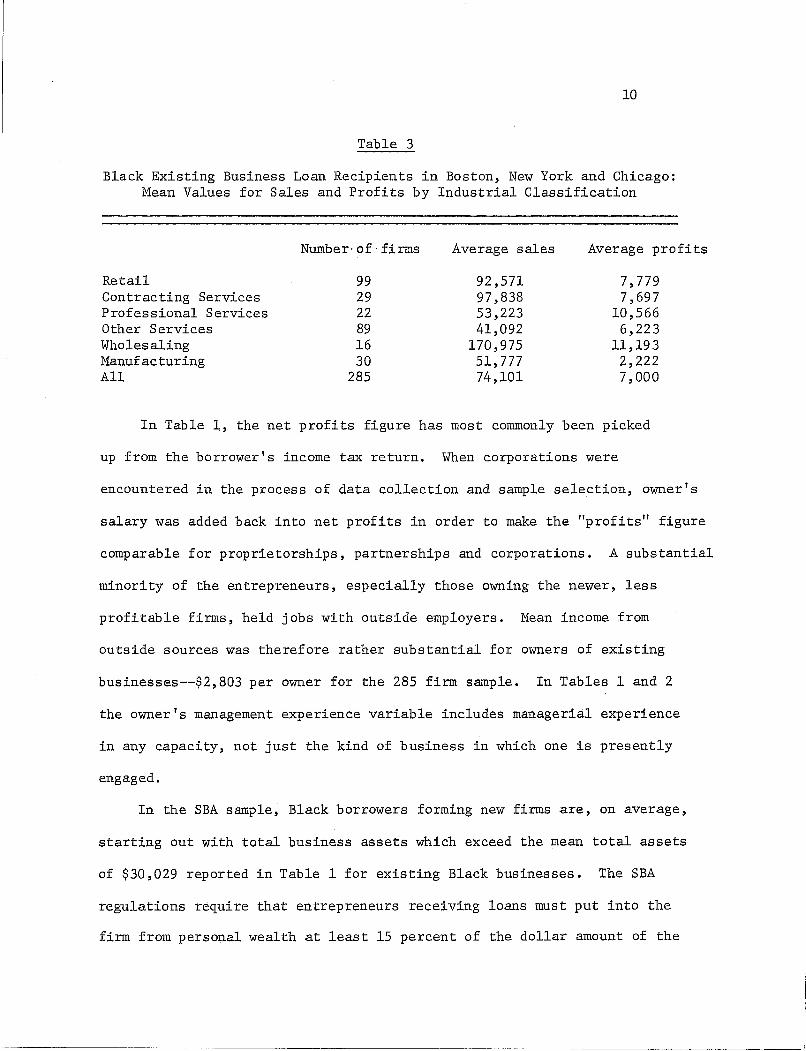
Table 3
Black Existing Business Loan Recipients in Boston, New York and Chicago:Mean Values for Sales and Profits by Industrial Classification
RetailContracting ServicesProfessional ServicesOther ServicesWholesalingManufacturingAll
Number- of firms
992922891630
285
Average sales
92 ,57197,83853,22341,092
170,97551,77774,101
Average profits
7,7797,697
10,5666,223
11,1932,2227,000
In Table 1, the net profits figure has most commonly been picked
up from the borrower's income tax return. When corporations were
encountered in the process of data collection and sample selection, owner's
salary was added back into net profits in order to make the "profits" figure
comparable for proprietorships, partnerships and corporations. A substantial
minority of the entrepreneurs, especially those owning the newer, less
profitable firms, held jobs with outside employers. Mean income from
outside sources was therefore rather substantial for owners of existing
businesses--$2,803 per owner for the 285 firm sample. In Tables 1 and 2
the owner's management experience variable includes managerial experience
in any capacity, not just the kind of business in which one is presently
engaged.
In the SBA sample, Black borrowers forming new firms are, on average,
starting out with total business assets which exceed the mean total assets
of $30,029 reported in Table 1 for existing Black businesses. The SBA
regulations require that entrepreneurs receiving loans must put into the
firm from personal wealth at least 15 percent of the dollar amount of the
11
loan received. Assuming (conservatively) that borrowers put up the
minimum 15 percent, the average new firm would begin with $31,850 in total
assets.
The sample data on 559 Black SBA borrowers indicate that Black
businesses of the future may differ substantially from the present
population of Black firms~ Among the 285 existing Black business
borrowers, only 48 firms would qualify as personal services and public
accommodations which would be IIprotected ll according to Brimmer's implicit·
definition of the barrier of segregation. IIProtectedll firms were defined
as encompassing the following industrial classifications: barber shops
and beauty shops; funeral parlors; eating, drinking and entertainment places;
hotels; convalescent and rest homes; cosmetic manufacturers and distributors;
photographic studios; insurance; real estate and certain professional
services--medicine, law and education.
After detailed scrutiny, pr~hlems. in the IIprotective barrier of
segregationll thesis become obvious. If one examines, for example, the
profitability figures for Black firms reported on page 3, it is quite
apparent that such IIprotectedll fields as barbershops and restaurants are
minimal profit makers; gasoline stations and contracting services, neither
of which are "protected," are two of the most profitable lines of
business. The same pattern exists in the SBA sample data.
The SBA sample of Black borrowers differs from the overall population
of Black businesses in several important respects. Average receipts per
firm (Table 1) are over twice as large as the average sales figure ($33,123)
reported for all Black businesses in New York, Chicago and Boston. 23 The
Black loan recipients are disproportionately engaged in lines of business

12
that are not part of the Brimmer characterization of the Black business
community. In evaluating the existing population of Black firms in
Washington, D.C., Brimmer asserts that, "The general pattern which
emerges is a mosaic of small, service-oriented businesses which owe their
existence to a protective barrier of segregation.,,24 The NBL survey
data on 564 firms indicate that barber shops or beauty shops and grocery
stores are the two most common types of Black owned businesses, but
Blacks receiving SBA loans are not concentrating in these fields:
barber shops and beauty shops make up 18.2 percent of the NBL sample of
firms and 4.1 percent of the SBA sample; grocery stores comprise 14.5
percent of the NBL sample and 7.9 percent of the SBA sample. In terms
of both industrial classification and annual sales volume, Black firms
receiving loans from the SBA (including bank guaranteed loans) belong to
a distinct subset of the overall population of Black-owned businesses
and herein lies a key factor for determining the future prospects of
Black economic development via'business ownership. Consider the logic
underlying one of Brimmer's primary reasons for concluding that Black
capitalism faces a bleak future:
1. The Black business community has traditionally consisted of
small firms operating in a market protected by segregation and discrimination;
2. Segregation and discrimination are gradually being eliminated
(or reduced); future prospects, therefore, are bleak for Black businessmen.
An alternative approach to the same question would stress that,
despite a myriad of adverse conditions, a small Black business community
has stubbornly managed to survive; because capital was extremely scarce,
the overwhelming majority of Black entrepreneurs concentrated in lines

13
of business requiring little capital. When capital markets finally
open up, Black businesses will expand into fields in which they
theretofore had been unable to compete on an equal basis. Because the
Black business community has, to date, been restricted from competing
effectively in highly capitalized lines of business, SBA's program for
making the capital markets available to Black entrepreneurs gives them
an excellent opportunity for creating new firms and expanding existing
ones. The distribution of Black firms (regarding industrial classification)
who borrow through the SBA sharply differs from the distribution of all
Black businesses because most of these loan recipients are moving into
new territory: capital intensive and highly capitalized operations. If
capital markets remain open to Black firms in the f,uture, then the entire
nature of the Black business community would possibly shift away from its
present low capitalization orientation in personal services and low
volume retailing.
Within a given industrial clas.sification, particularly food store
operation~ poorly capitalized, low volume enterprises may operate in
competition with highly capitalized, high turnover firms. A Black
entrepreneur receiving long term credit from the SBA may be operating
in a traditional Black line of business but that does not imply that he
will be operating in the traditional fashion. He may, instead, be operating
on a sufficiently large scale and with enough capital to be highly efficient.
Two traditional lines of Black entrepreneurship--laundries and restaurants-
should benefit substantially from the availability of long term credit
and the resultant opportunity to become more capital intensive (i.e., to
invest relatively more in plant and equipment) and to expand the scale of

14
their operations. While Black groceries certainly need to pperate on
a larger scale to be efficient, this type of business probably faces
such stiff competition from supermarket chains that the SBA may be
wasting resources in lending to small grocers.
Black economic development programs call for the expansion of existing
businesses and the creation of new ones. The SBA data cited herein
suggests that it is probably incorrect to assume, as Brimmer does, that
new and expanding Black firms will conform to the stereotype of the small,
undercapitalized, inefficient Black firm of the past. The NBL data cited
in the Brimmer and Terrell article focus upon present Black enterprises
(and are incorrectly handled), therefore it is inappropriate for judging
the economic potential, especially the employment potential, of Black
capitalism. To determine the "potential" of Black entrepreneurship, one
should examine data on existing firms that are expanding and on new firms
being formed. One cannot validly examine a cross section of the present
Black business community and make inferences, based upon the present status
of Black enterprise, about the future potential of Black capitalism. What
exists today may be irrelevant to what will exist in the future. With
capital markets opening up for Black entrepreneurs, the Black business
community of the future may be ~haracterized by a relatively greater number
of large firms competing effectively in all lines of business.
-----------_._------- --~-~---~---
I
IIr
IJ

15
Appendix: Data Handling and Sample Selection
In the spring of 1967 the SBA ordered its regional offices to
start classifying all loan applicants into appropriate racial,
ethnic groupings. Although loans then in process were generally
not classified, by June 1967, racial designations were available for
more than 95 percent of the loans reaching final approval status. As
the first step in selecting the sample of firms analyzed in this study,
a listing (on tape) was received of all loan approvals originating
in the Boston, New York and Chicago regional offices of the SBA. This
listing covered the period from June 1967 - June 1970, and specified
racial, ethnic group membership of the 3,000+ borrowers. Six minority
codes were being used by the SBA: Eskimo, Indian, Puerto Rican,
Spanish American, Asian and Negro.
The SBA data listed above were then punched on data cards (from the
magnetic tape). These cards were sorted by race (ethnic group) and
geographic location so that the following relevant groups were formed:
Loans to Blacks in Suffolk County, Massachusetts;
Loans to Whites in Suffolk County, Massachusetts;
Loans to Blacks in New York City;
Loans to Whites in New York City;
Loans to Blacks in Cook County, Illinois;
Loans to Whites in Cook County, Illinois.
Loans to Eskimos, Indians, Puerto Ricans, Spanish Americans, and Asians
were dropped from further consideration.

16
The above data processing operations produced a group of 1074
loans to Blacks from which a final sample of 559 Black businesses
was formed. The following series of steps illustrates the processes
by which 515 potential observations were dropped from consideration;
the same general pattern is applicable to the White sample of
businesses:
Number of observations according to the SBA computer
A. Automatic deletions:
1. Loan proceeds never disbursed
2. Second or third loan to a businessalready in the sample; no businesswas included more than once
3. Loan numbers listed by the SBA computer which corresponded to nothinglisted with the regional offices;error in SBA records
4. Loan file never located; these primarily consisted of new businessesthat changed names between the dateof loan application and final approval
5. Loan repayment deferred; repaymentstatus was therefore irrelevant
6. Miscellaneous; included declinedloans, borrowers that were not Black,and borrowers whose businesses had leftthe geographic area under consideration
B. Relevant sample for data collection:
1. 50% of the new businesses in New Yorkand Chicago randomly selected anddropped from further consideration
2. Observations dropped because ofmissing or inadequate information:
a. personal financial statement 38b. profit and loss statement 32c. business balance sheet 8d. other 16
90
69
15
23
10
6
202
94
1074
213
,:2:96'
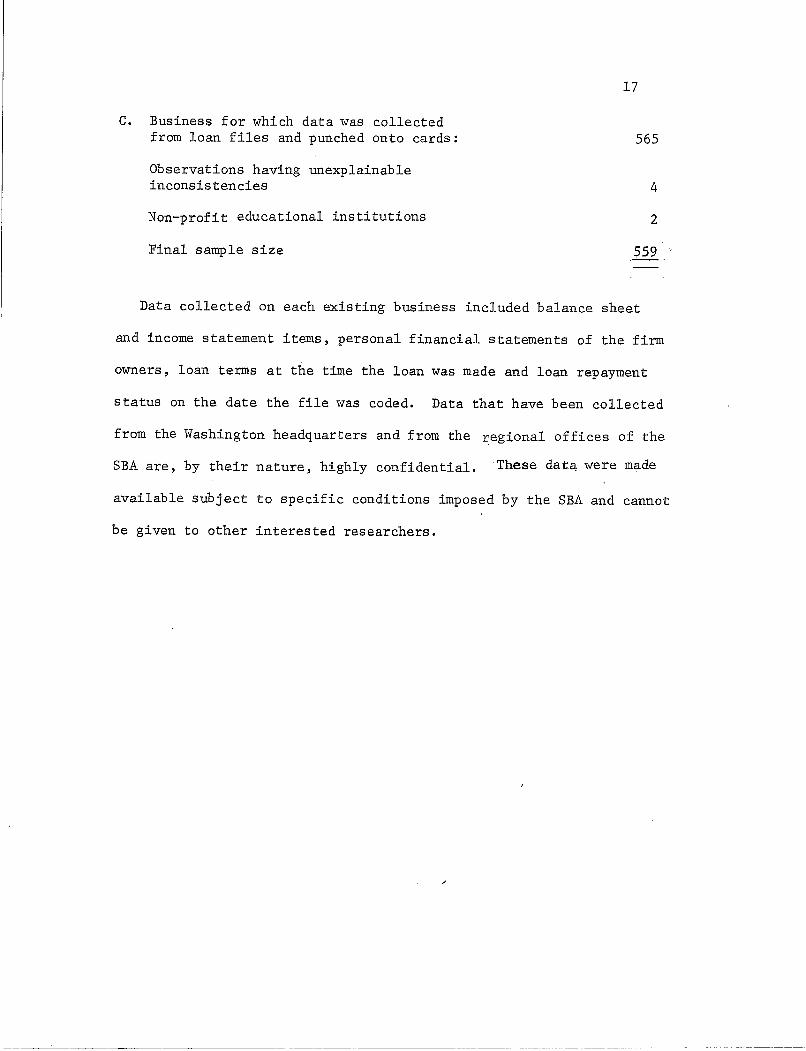
C. Business for which data was collectedfrom loan files and punched onto cards:
Observations having unexplainableinconsistencies
Non-profit educational institutions
Final sample size
17
565
4
2
5~
Data collected on each existing business included balance sheet
and income statement items, personal financial statements of the firm
owners, loan terms at the time the loan was made and loan repayment
status on the date the file was coded. Data that have been collected
from the Washington headquarters and from the regional offices of the
SBA are, by their nature, highly confidential. These datq were made
available subject to specific conditions imposed by the SBA and cannot
be given to other interested researchers.

18
Notes
1. Andrew Brimmer and Henry Terrell, "The Economic Potential of BlackCapitalism," Public Policy, Spring 1971, pp. 289-308.
2. See Gary Becker, The Economics of Discrimination, Chicago: Universityof Chicago Press, 1957.
3. This theory is explained most fully in Andrew Brimmer, "The Negro inthe National Economy," American Negro Reference Book, John David,editor, Englewood Cliffs, New Jersey: Prentice-Hall, 1966; pp. 291-292of the Spring, 1971 Public Policy article by Brimmer and Terrell containa brief summary of Mr. Brimmer's theory of the Black business community.Mr. Brimmer is a member of the Board of Governors of the Federal ReserveSystem.
4. Andrew Brimmer, "Desegregation and Negro Leadership," Business Leadershipand the Negro Crisis, Eli Ginsberg, editor, New York: McGraw-Hill, 1968,p. 34.
5. Brimmer, "The Negro in the National Economy, "Q£.. cit., p. 331.
6. Ibid., p. 291.
7. Ibid., p. 328.
8. Brimmer and Terrell, ~. cit., p. 307.
9. Small Business Administration, SBA: What It Is ... What It Does,Washington, D.C.: U.S. Government Printigg Office, 1970, p. 9.
10;'. Bernard H. Booms and James G. Ward, Jr., "The Cons of Black Ci3.pitalism,"Business Horizons Vol. l2~ October 1969. p. 19.
11. Brimmer and Terrell, ~. ciL', p. 295.
12. Regressions were computed on data from 561 of 564 respondents; threefixms were deleted because of obvious errors in the data cards.
12. Brimmer and Terrell, ~. cit., p. 296.
14. Berkeley Burrell, "Final Report Project Outreach," submitted to theOffice of Economic Opportunity on January 15, 1969. p." 18.
15. Minority-Owned Businesses: 1969,~! cit., p. 154.
16. Ibid., p. 154.
17. Charles Tate, "Brimmer and Black Capitalism: An Analysis," Review ofBlack Political Economy Vol. 2, Spring, 1970, p. 86.

19
18. For details on sample selection proced~res, see the appendix on datahandling and sample selection.
19. Peter McNeish of the American Bankers Association explainsc:why bankshave, until recently, been extremely hesitant to extend credit toBlack firms in urban areas. See McNeish, "Where Does the Money ComeFrom?" in Black Economic Development, G. Douglas Pugh and WilliamHaddard, eds., Englewood Cliffs, New Jersey: Prentice-Hall, 1969,pp. 85-86.
20. Theodore Cross, Black Capitalism, New York: Antheum, 1969. pp.118-119.
21. Samuels, Howard J., "Compensatory Capitalism," in Black EconomicDevelopment, G. Douglas Pugh and William F. Haddard, eds., EnglewoodCliffs, New Jersey: Prentice-Hall, 1969, p. 70.
22. The mean values reported in Table 1 are intended to describe a"typical" Black firm; one extremely large Black firm was thereforenot included when the mean values were calculated. For flowvariab~es (sales, profits, personal income), means are reportedfor the most recent full year prior to filing the SBA loan appli~
cation. For new businesses having more than one owner, average 'net worth and income figures were picked up. The manufacturingcategory in Table 3 includes, most frequently, modest cottageindustries.
23. Minority-Owned Businesses: 1969, ££. cit., pp. 121-123.
24. Brimmer and Terrell, ££. cit., p. 295.


