97
ANNUAL REPORT 2009/10

Assisting parliament to improve the accountability and performance of the state
Level 15, 1 Margaret Street Sydney NSW 2000 Australia GPO Box 12 Sydney NSW 2001 Tel +61 2 9275 7100Fax +61 2 9275 [email protected] am–5.00 pm
www.audit.nsw.gov.au
The A
ud
iT Office O
f NeW
SOu
Th W
ALeS A
NN
uA
L RePORT / yeA
R eNd
ed 30 Ju
Ne 2010
ANNuAL RePORT
2009/10
highlights inside front cover
Ourorganisation 1
Parliament Regularly seek and use our advice 7
agencies Act on our recommendations and regularly seek advice 15
People Our people are highly skilled and dedicated to improving the public sector 29
Profession We are known for influencing auditing in Australia 39
Finances We break even financially over the medium term 43
Financialreport 47
appendices 71
index inside back cover
contents
GPO BOX 12 Sydney NSW 2001
Members of Legislative Assembly Parliament house Sydney NSW 2000
under section 12A of the Annual Reports (Statutory Bodies) Act 1984, i have pleasure in submitting for the information of members, the Reports of the activities of the Audit Office of New South Wales for the year ended 30 June 2010.
Peter Achterstraatauditor-General29October2010
cover: L–R chariee Bultitude, Angelina Pillay, Jonathan Lam, daniel AlizadehThisreport
This annual report summarises the activities and performance of the Audit Office of New South Wales for 2009–10 against the main objectives, strategies and targets in its strategic plan. As well as looking at the year gone past, the report looks to the year ahead and reports on financial results for the year. This and earlier annual reports are available on the Audit Office website: www.audit.nsw.gov.au. Printed copies are available on request from the Office.

The Audit Office of New South Wales AnnuAl RepoRt 2009/10a
allegations of waste 13annual report costs inside back cover contact details back coverAudit and Risk Committee 36Auditor-General message 2 history 1Australasian Council of Auditors-General 41
b
benchmarking inside front cover, 9, 11, 36budget 44business risks 35
c
central government reporting 36client satisfaction 16code of conduct 35committees 36–37consultants 66corporate governance 35credit card certification 92creditor payments 45
d
disability action plan 90
e
employee satisfaction 30energy management 38environmental action 38equal employment opportunity 89equity 33executive positions 4, 72–73
f
financial audits clients 74 qualifications 10, 20 recommendations, acceptance of 18 reports 87 satisfaction with 16 timeliness 19financial commentary 44 accounts payable performance 92 break-even target 44 financial statistics 46financial statements 47freedom of information 37
h
highlights inside front cover
i
industrial relations 32information management 31internal audit and risk management statement 35, 37, 91ISO 9001 37ISO 27001 31
l
legislation 35letter of transmission inside front cover
m
mission 1multicultural policies and services program 89–90
o
objectives 1occupational health and safety 38office executive 4 performance statements 72office hours back coveroverseas secondments 32, 34 travel 80
p
parliamentarian satisfaction 8parliamentary committees, appearances before 81people 29people development 34
performance audits 22 follow-up 14, 22, 28 recommendations, acceptance of 18 reports 87 satisfaction 16performance management 31presentations private sector 40, 85 public sector 40, 82privacy 37professional activities 40–41professional development 34Public Accounts Committee 14 hearings 14publications 87
q
quality assurance 36–37
r
reviews, internal and external 37risk management 35, 37
s
social club 33stakeholders/clients 1staff counselling 33 productivity 31 recruitment 32strategic plan 6, 35structure 4
t
training 34, 41turnover 32
v
values 1vision 1
w
Waste Reduction and Purchasing Plan 38
y
year ahead, the 6
Index
Annualreportproduction
Total external costs to produce 400 copies were $32,000 for design, photography and printing.
Design
CampbellBarnett www.campbellbarnett.com
photography
Martin Mischkulnig www.martinmischkulnig.com
Parliament
Parliamentarians generally satisfied with our reports and refer to them frequently.
90 per cent satisfied with our reports and services.
95 per cent agree that our financial audits provide valuable assurance.
90 per cent believe our financial audit reports have effective layout and design.
93 per cent believe our performance audit reports identify significant issues.
86 per cent of financial audits reported to parliament on time.
8 performance audits reviewed by the Parliament of New South Wales’ Public Accounts Committee.
Refer to page 7
Agencies
Good ratings for agencies’ overall perceptions of our financial audits.
Significant increase in agencies’ overall perceptions of our performance audits.
97 per cent of financial audit recommendations accepted.
92 per cent of performance audit recommendations accepted.
95 per cent of audit opinions were unqualified.
495 financial audits completed.
14 performance audits completed, 7 more than last year.
Refer to page 15
People
79 per cent employee satisfaction.
91 per cent of staff ‘satisfied’ or ‘extremely satisfied’.
83 per cent of employees highly engaged.
86 per cent employee morale—a 7-year high.
65 per cent productivity—an increase on last year.
44 per cent of middle management are women— a significant increase on last year.
7 per cent staff turnover.
4-star greenhouse building rating maintained.
Refer to page 29
Profession
38 presentations delivered to the public and the profession.
23 submissions made on proposed changes to accounting and auditing standards.
Refer to page 39
Finances
$0.8 million loss (excluding superannuation adjustments), the 5-year cumulative result outside our medium-term break-even point.
Current ratio (solvency) is healthy.
99 per cent of our creditors paid on time.
Refer to page 43
Benchmarks
We benchmark ourselves against the national average for audit offices.
We expect our costs, as a proportion of total state assets and transactions, to be lower than most other states. As NSW agencies are typically larger than their interstate counterparts and the Audit Office of New South Wales is also larger, the economies of scale allow us to achieve lower costs on these measures.
Audit Office of NSW Average of Australian audit offices
Total audit costs (excluding payroll tax) per $’000 of public sector assets $2010 results not available.
.14
.23
.13
.20
.12
.21
.13.21
.14.20
2005
2006
2007
2008
2009
38 presentations made, 3 more than last year
$0.8 million loss (excluding superannuation adjustments), the 5-year cumulative result outside our medium-term break-even target
Our costs are significantly less than other Australian state audit offices
90% satisfied with our reports and services
97% of financial audit and 92% of performance audit recommendations accepted
91% of staff ‘satisfied’ or ‘extremely satisfied’
Highlights
86
93
91
94
90
2005
2006
2008
2009
2010
Overall satisfaction % satisfied or very satisfied.Surveys not conducted in 2007.
2011 target 90
Overall satisfaction %Aggregate performance indices.
Financial audit clients
702006
Performance audit clients
67
712007
68
712008
77
702009
67
702010
73
752011 target
75
76
79
76
78
79
80
2006
2007
2008
2009
2010
2011 target
Employee satisfaction %
35
31
21
36
38
35
2006
2007
2008
2009
2010
2011 target
Presentations given
2006
2007
2008
2009
2010
2011
tar
get
2006
2007
2008
2009
2010
2011 target-1.0
-0.8
2.2
2.6
3.7
Operating results $mExcluding superannuation.
2.1
Total audit costs (excluding payroll tax) per $’000 of public sector transactions $ 2010 results not available.
Audit Office of NSW Average of Australian audit offices
.38
.35
.37
.39
.37
.282005
.252006
.242007
.262008
.272009

The Audit Office of New South Wales annualrePOrT2009/10a
allegations of waste 13annual report costs inside back cover contact details back coverAudit and Risk committee 36Auditor-General message 2 history 1Australasian council of Auditors-General 41
b
benchmarking inside front cover, 9, 11, 36budget 44business risks 35
c
central government reporting 36client satisfaction 16code of conduct 35committees 36–37consultants 66corporate governance 35credit card certification 92creditor payments 45
d
disability action plan 90
e
employee satisfaction 30energy management 38environmental action 38equal employment opportunity 89equity 33executive positions 4, 72–73
f
financial audits clients 74 qualifications 10, 20 recommendations, acceptance of 18 reports 87 satisfaction with 16 timeliness 19financial commentary 44 accounts payable performance 92 break-even target 44 financial statistics 46financial statements 47freedom of information 37
h
highlights inside front cover
i
industrial relations 32information management 31internal audit and risk management statement 35, 37, 91iSO 9001 37iSO 27001 31
l
legislation 35letter of transmission inside front cover
m
mission 1multicultural policies and services program 89–90
o
objectives 1occupational health and safety 38office executive 4 performance statements 72office hours back coveroverseas secondments 32, 34 travel 80
p
parliamentarian satisfaction 8parliamentary committees, appearances before 81people 29people development 34
performance audits 22 follow-up 14, 22, 28 recommendations, acceptance of 18 reports 87 satisfaction 16performance management 31presentations private sector 40, 85 public sector 40, 82privacy 37professional activities 40–41professional development 34Public Accounts committee 14 hearings 14publications 87
q
quality assurance 36–37
r
reviews, internal and external 37risk management 35, 37
s
social club 33stakeholders/clients 1staff counselling 33 productivity 31 recruitment 32strategic plan 6, 35structure 4
t
training 34, 41turnover 32
v
values 1vision 1
w
Waste Reduction and Purchasing Plan 38
y
year ahead, the 6
index
Annualreportproduction
Total external costs to produce 400 copies were $32,000 for design, photography and printing.
Design
campbellBarnett www.campbellbarnett.com
Photography
Martin Mischkulnig www.martinmischkulnig.com
Parliament
Parliamentarians generally satisfied with our reports and refer to them frequently.
90 per cent satisfied with our reports and services.
95 per cent agree that our financial audits provide valuable assurance.
90 per cent believe our financial audit reports have effective layout and design.
93 per cent believe our performance audit reports identify significant issues.
86 per cent of financial audits reported to parliament on time.
8 performance audits reviewed by the Parliament of New South Wales’ Public Accounts committee.
Refer to page 7
Agencies
Good ratings for agencies’ overall perceptions of our financial audits.
Significant increase in agencies’ overall perceptions of our performance audits.
97 per cent of financial audit recommendations accepted.
92 per cent of performance audit recommendations accepted.
95 per cent of audit opinions were unqualified.
495 financial audits completed.
14 performance audits completed, 7 more than last year.
Refer to page 15
People
79 per cent employee satisfaction.
91 per cent of staff ‘satisfied’ or ‘extremely satisfied’.
83 per cent of employees highly engaged.
86 per cent employee morale—a 7-year high.
65 per cent productivity—an increase on last year.
44 per cent of middle management are women— a significant increase on last year.
7 per cent staff turnover.
4-star greenhouse building rating maintained.
Refer to page 29
Profession
38 presentations delivered to the public and the profession.
23 submissions made on proposed changes to accounting and auditing standards.
Refer to page 39
Finances
$0.8 million loss (excluding superannuation adjustments), the 5-year cumulative result outside our medium-term break-even point.
current ratio (solvency) is healthy.
99 per cent of our creditors paid on time.
Refer to page 43
Benchmarks
We benchmark ourselves against the national average for audit offices.
We expect our costs, as a proportion of total state assets and transactions, to be lower than most other states. As NSW agencies are typically larger than their interstate counterparts and the Audit Office of New South Wales is also larger, the economies of scale allow us to achieve lower costs on these measures.
Audit Office of NSW Average of Australian audit offices
Total audit costs (excluding payroll tax) per $’000 of public sector assets $2010 results not available.
.14
.23
.13
.20
.12
.21
.13.21
.14.20
2005
2006
2007
2008
2009
38 presentations made, 3 more than last year
$0.8 million loss (excluding superannuation adjustments), the 5-year cumulative result outside our medium-term break-even target
Our costs are significantly less than other Australian state audit offices
90% satisfied with our reports and services
97% of financial audit and 92% of performance audit recommendations accepted
91% of staff ‘satisfied’ or ‘extremely satisfied’
highlights
86
93
91
94
90
2005
2006
2008
2009
2010
Overall satisfaction % satisfied or very satisfied.Surveys not conducted in 2007.
2011 target 90
Overall satisfaction %Aggregate performance indices.
Financial audit clients
702006
Performance audit clients
67
712007
68
712008
77
702009
67
702010
73
752011 target
75
76
79
76
78
79
80
2006
2007
2008
2009
2010
2011 target
Employee satisfaction %
35
31
21
36
38
35
2006
2007
2008
2009
2010
2011 target
Presentations given
2006
2007
2008
2009
2010
2011
tar
get
2006
2007
2008
2009
2010
2011 target-1.0
-0.8
2.2
2.6
3.7
Operating results $mExcluding superannuation.
2.1
Total audit costs (excluding payroll tax) per $’000 of public sector transactions $ 2010 results not available.
Audit Office of NSW Average of Australian audit offices
.38
.35
.37
.39
.37
.282005
.252006
.242007
.262008
.272009
Assisting parliament to improve the accountability and performance of the state
Level 15, 1 Margaret Street Sydney NSW 2000 Australia GPO Box 12 Sydney NSW 2001 Tel +61 2 9275 7100Fax +61 2 9275 [email protected] am–5.00 pm
www.audit.nsw.gov.au
The A
ud
iT Office O
f NeW
SOu
Th W
ALeS A
NN
uA
L RePORT / yeA
R eNd
ed 30 Ju
Ne 2010
ANNuAL RePORT
2009/10
highlights inside front cover
Ourorganisation 1
Parliament Regularly seek and use our advice 7
agencies Act on our recommendations and regularly seek advice 15
People Our people are highly skilled and dedicated to improving the public sector 29
Profession We are known for influencing auditing in Australia 39
Finances We break even financially over the medium term 43
Financialreport 47
appendices 71
index inside back cover
contents
GPO BOX 12 Sydney NSW 2001
Members of Legislative Assembly Parliament house Sydney NSW 2000
under section 12A of the Annual Reports (Statutory Bodies) Act 1984, i have pleasure in submitting for the information of members, the Reports of the activities of the Audit Office of New South Wales for the year ended 30 June 2010.
Peter Achterstraatauditor-General29October2010
cover: L–R chariee Bultitude, Angelina Pillay, Jonathan Lam, daniel AlizadehThisreport
This annual report summarises the activities and performance of the Audit Office of New South Wales for 2009–10 against the main objectives, strategies and targets in its strategic plan. As well as looking at the year gone past, the report looks to the year ahead and reports on financial results for the year. This and earlier annual reports are available on the Audit Office website: www.audit.nsw.gov.au. Printed copies are available on request from the Office.

Who we are
The Audit Office of New South Wales (the ‘Office’) is a statutory authority, established under the Public Finance and Audit Act 1983, that conducts audits for the Auditor-General. The Auditor-General helps parliament hold government accountable for its use of public resources.
What we do
The Auditor-General is responsible for audits and related services.
The Office conducts financial and performance audits, principally under the Public Finance and Audit Act 1983 and the Corporations Act 2001, and examines allegations of serious and substantial waste of public money (under the Protected Disclosures Act 1994).
The Auditor-General also provides certain assurance services for Commonwealth grants and payments to the state under Commonwealth legislation.
Our main clients
Parliament of New South Wales.
NSW government agencies.
The people of New South Wales.
Our resources
254 staff at 30 June 2010.
$28.6 million from government agencies for audits of their financial reports.
$5.8 million from the government towards our performance audits and reports to parliament.
Nine external audit contractors assist with our financial report audits, representing about six per cent of our financial audit work.
Our history
For more than 180 years, the Audit Office of New South Wales has been assisting the Parliament of New South Wales hold government accountable for its use of public resources.
We do this by reporting directly to parliament on our audits of government financial reports and performance.
Our organisationBuilt on strategic foundations
The history of the Auditor-General
1824William Lithgow appointed Colonial Auditor-General, to compile and examine the colony’s accounts and report on government departments to the Governor.
1855The UK Constitution Act 1855 formalised government in New South Wales, and Auditor-General made a member of the government.
1870Powers and duties of Auditor-General first set in legislation, in the Audit Act 1870.
1902Audit Act 1902 prohibited the Auditor-General from being a member of the Executive Council or of parliament.
1929Audit (Amendment) Act 1929 changed the tenure of office of the Auditor-General from life to ceasing at 65. Position of Assistant Auditor-General created.
1984Public Finance and Audit Act 1983 established Auditor-General’s Office (6 January 1984).
1989Auditor-General’s Office declared a statutory body, allowing it to be both more independent and more commercial.
1991The Public Finance and Audit Act 1983 expanded the Auditor-General’s role to include performance audits, limited tenure to seven years and prevented acceptance of any other post in the NSW public service.
2001Auditor-General’s role expanded to reporting on issues of waste, probity and financial judgement.
2004Auditor-General given power to employ staff directly, and set wages and conditions.
Our vision
To make the people of New South Wales proud of the work we do.
Our mission
To perform high quality independent audits of government in New South Wales.
Our objectives
Our advice—parliament and agencies regularly seek our advice and act on our recommendations.
Our people—our people are highly skilled and dedicated to improving the public sector.
Our profession—we are known for influencing auditing in Australia.
Our finances—we break even over the medium term.
Our values
Purpose—we have an impact, are accountable, and work as a team.
People—we trust and respect others and have a balanced approach to work.
Professionalism—we are recognised for our independence and integrity and the value we deliver.
The Audit Office of New South Wales AnnuAl RePORt 2009/10
1
The Audit Office of New South Wales AnnuAl RePORt 2009/10
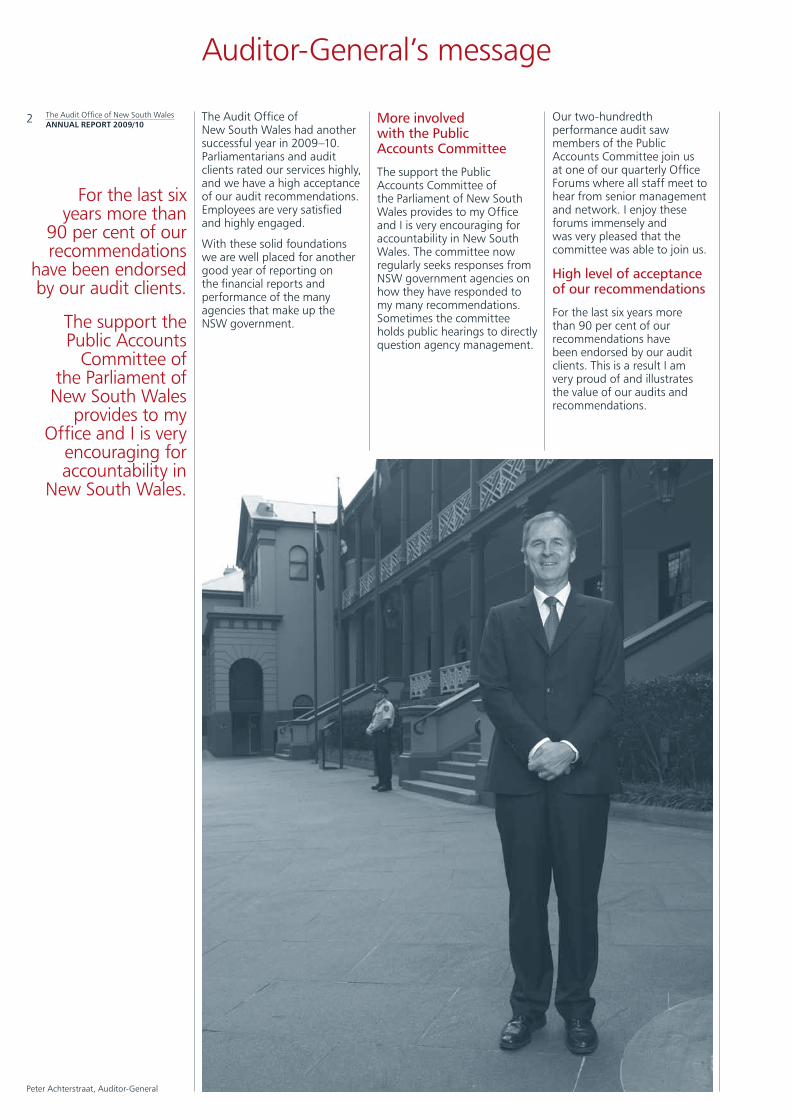
2 The Audit Office of New South Wales had another successful year in 2009–10. Parliamentarians and audit clients rated our services highly, and we have a high acceptance of our audit recommendations. Employees are very satisfied and highly engaged.
With these solid foundations we are well placed for another good year of reporting on the financial reports and performance of the many agencies that make up the NSW government.
More involved with the Public Accounts Committee
The support the Public Accounts Committee of the Parliament of New South Wales provides to my Office and I is very encouraging for accountability in New South Wales. The committee now regularly seeks responses from NSW government agencies on how they have responded to my many recommendations. Sometimes the committee holds public hearings to directly question agency management.
Our two-hundredth performance audit saw members of the Public Accounts Committee join us at one of our quarterly Office Forums where all staff meet to hear from senior management and network. I enjoy these forums immensely and was very pleased that the committee was able to join us.
High level of acceptance of our recommendations
For the last six years more than 90 per cent of our recommendations have been endorsed by our audit clients. This is a result I am very proud of and illustrates the value of our audits and recommendations.
For the last six years more than
90 per cent of our recommendations
have been endorsed by our audit clients.
The support the Public Accounts
Committee of the Parliament of New South Wales
provides to my Office and I is very
encouraging for accountability in
New South Wales.
Auditor-General’s message
Peter Achterstraat, Auditor-General

I am very pleased that senior management now have a collective understanding of what we need to focus on, what we are trying to achieve and how we will get there.
I feel fortunate to have the role I have and would like to sincerely thank all the people that make up the Office for the work they do.
New look financial audit reports
A pleasing achievement for the year was the publication of 12 volumes of my financial audit reports to the Parliament of New South Wales that are each based on the broad services of government. For the first time, we issued separate reports on the agencies that collectively provide public services such as education, health, transport and law and order.
These service-based reports on the outcomes of my financial audits provide a more complete picture of NSW government agencies’ financial reporting.
Clients rate us highly
The clients we audit continued to be satisfied with our work. A notable achievement for the year was the improved satisfaction from our performance audit clients.
Last year some of our performance audit clients had concerns about our value, audit process and reporting. This year a lot of effort went into improving these perceptions with our clients now giving us our best ever value rating of 71 per cent and returning to the previously high satisfaction levels for our audit processes and reporting.
Our people are very satisfied and highly engaged
Our people continue to be highly motivated with engagement levels of over 80 per cent. A very pleasing part of our culture is that more than 90 per cent of staff are willing to go that ‘extra mile’ to help co-workers and clients. This is a very encouraging sign for an organisation that depends so much on team work and client satisfaction.
An improved strategic planning process
This year saw the start of a new strategic planning process — one that involves more of our senior staff and has a strong focus on accountability and developing the leadership potential of our current and future leaders.
The leadership team now meets every month. At these meetings we assess our progress against our key focus areas and if necessary modify what we will do in the next three months, keeping in mind our long term vision of making the people of New South Wales proud of the work we do.
I am very pleased that senior management now have a collective understanding of what we need to focus on, what we are trying to achieve and how we will get there.
Thank you to all staff
I feel very fortunate to have the role I have and would like to sincerely thank all the people that make up the Office for the work they do. Without their commitment, dedication and professionalism our achievements would not be possible.
Peter Achterstraat Auditor-General
The Audit Office of New South Wales AnnuAl RePORt 2009/10
3
The Audit Office of New South Wales AnnuAl RePORt 2009/10
4
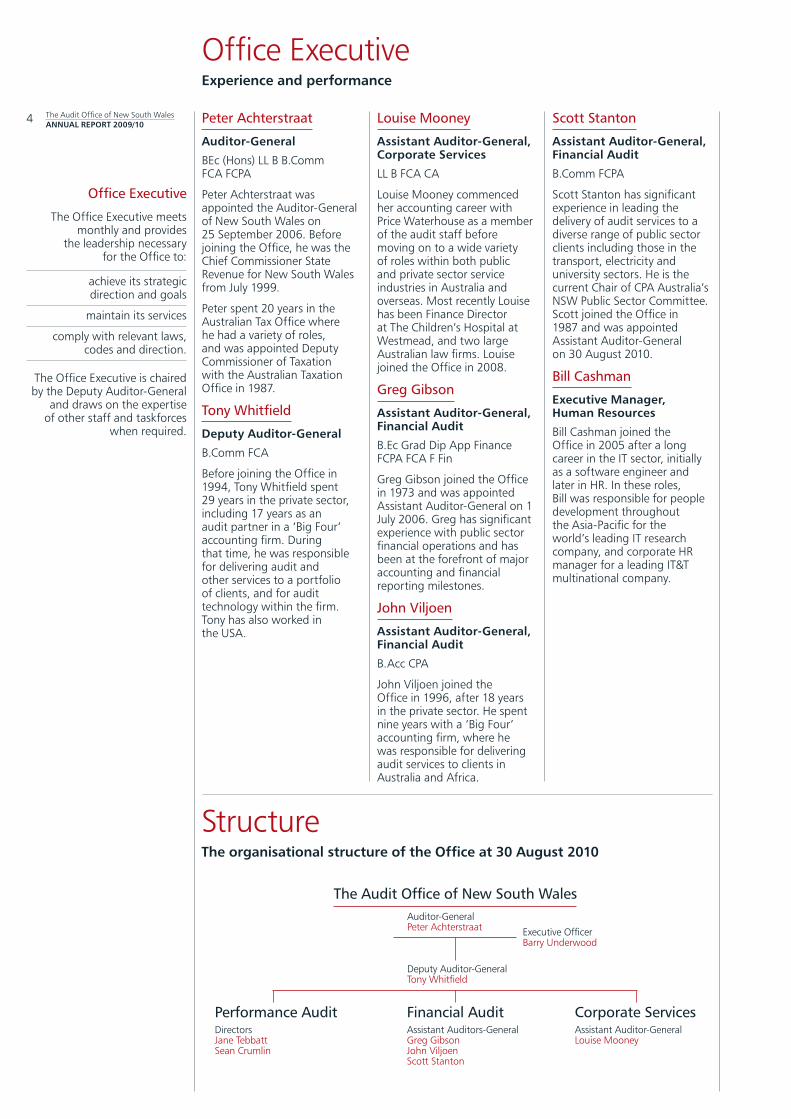
Office Executive
The Office Executive meets monthly and provides
the leadership necessary for the Office to:
achieve its strategic direction and goals
maintain its services
comply with relevant laws, codes and direction.
The Office Executive is chaired by the Deputy Auditor-General
and draws on the expertise of other staff and taskforces
when required.
Office Executiveexperience and performance
Peter Achterstraat
Auditor-General
BEc (Hons) LL B B.Comm FCA FCPA
Peter Achterstraat was appointed the Auditor-General of New South Wales on 25 September 2006. Before joining the Office, he was the Chief Commissioner State Revenue for New South Wales from July 1999.
Peter spent 20 years in the Australian Tax Office where he had a variety of roles, and was appointed Deputy Commissioner of Taxation with the Australian Taxation Office in 1987.
Tony Whitfield
Deputy Auditor-General
B.Comm FCA
Before joining the Office in 1994, Tony Whitfield spent 29 years in the private sector, including 17 years as an audit partner in a ‘Big Four’ accounting firm. During that time, he was responsible for delivering audit and other services to a portfolio of clients, and for audit technology within the firm. Tony has also worked in the USA.
Louise Mooney
Assistant Auditor-General, Corporate Services
LL B FCA CA
Louise Mooney commenced her accounting career with Price Waterhouse as a member of the audit staff before moving on to a wide variety of roles within both public and private sector service industries in Australia and overseas. Most recently Louise has been Finance Director at The Children’s Hospital at Westmead, and two large Australian law firms. Louise joined the Office in 2008.
Greg Gibson
Assistant Auditor-General, Financial Audit
B.Ec Grad Dip App Finance FCPA FCA F Fin
Greg Gibson joined the Office in 1973 and was appointed Assistant Auditor-General on 1 July 2006. Greg has significant experience with public sector financial operations and has been at the forefront of major accounting and financial reporting milestones.
John Viljoen
Assistant Auditor-General, Financial Audit
B.Acc CPA
John Viljoen joined the Office in 1996, after 18 years in the private sector. He spent nine years with a ‘Big Four’ accounting firm, where he was responsible for delivering audit services to clients in Australia and Africa.
Scott Stanton
Assistant Auditor-General, Financial Audit
B.Comm FCPA
Scott Stanton has significant experience in leading the delivery of audit services to a diverse range of public sector clients including those in the transport, electricity and university sectors. He is the current Chair of CPA Australia’s NSW Public Sector Committee. Scott joined the Office in 1987 and was appointed Assistant Auditor-General on 30 August 2010.
Bill Cashman
executive Manager, Human Resources
Bill Cashman joined the Office in 2005 after a long career in the IT sector, initially as a software engineer and later in HR. In these roles, Bill was responsible for people development throughout the Asia-Pacific for the world’s leading IT research company, and corporate HR manager for a leading IT&T multinational company.
Structurethe organisational structure of the Office at 30 August 2010
Performance AuditDirectorsJane TebbattSean Crumlin
Financial AuditAssistant Auditors-General Greg GibsonJohn ViljoenScott Stanton
Corporate ServicesAssistant Auditor-General Louise Mooney
Auditor-General Peter Achterstraat
Deputy Auditor-GeneralTony Whitfield
The Audit Office of New South Wales
Executive Officer Barry Underwood

L–R Tony Whitfield, Louise Mooney, Bill Cashman, Greg Gibson,
Peter Achterstraat, Scott Stanton, John Viljoen

The Audit Office of New South Wales AnnuAl RePORt 2009/10
6 Strategic planning process
Our strategic planning process was expanded in 2009–10 to include a much wider representation of Office staff. This expansion has resulted in the creation of a Leadership Team which includes financial audit and performance audit Business Team Leaders, as well as senior Corporate Services managers. The Leadership Team meets with the Office Executive every 30 days to set and report on tasks, develop and review strategic milestones, and monitor and review the outcomes we expect to achieve at the end of the annual strategic planning cycle.
Strategic focus areas
Outlined below are the outcomes we are expecting to achieve within each of our strategic focus areas by the end of 2010–11. Some of the activities we plan to undertake to achieve these outcomes are detailed throughout this report and referenced below.
Double-Glazing the Glasshouse
Outcomes:
We are recognised as a centre of excellence for governance
Our KPIs are recognised as relevant, understood and actioned
We action relevant recommendations we receive from the Public Accounts Committee, internal audit and other external reviews
Issues reported to clients do not exist in the Office.
Activity includes:
Forming a group of dedicated risk management champions
Performing a gap analysis on our current governance policies and practices
Developing a reporting system that ensures no issues reported to our clients exist in the Office.
See page 35 for further details
Putting the Business into Business teams
Outcomes:
Our teams operate as a business
We have the right systems in place to operate our business
Our people can access the information they need to do their job.
Activity includes:
Creating a robust business indicators measurement framework to give managers clear, real-time views of goals and productivity.
See page 31 for further details
People Power
Outcomes:
Our people are ready to step forward
We recognise our people for excellence
Our people are satisfied and rewarded for the contributions they make
Underperformance is actively addressed
We have the right number of people with the right skills in the right jobs at the right time.
Activity includes:
Delivering a comprehensive and continuous workforce plan to ensure the Office has the right people with the right skills at the right time
Consolidating the work that has been done to define leadership behaviours and modelling at all levels.
See page 31 for further details
Delivering Value
Outcomes:
Agencies and parliament value our services
Our reports and recommendations add value.
Activity includes:
A complete redesign of our Auditor-General’s Reports to Parliament
A complete redesign of our financial audit management letters
The expansion of performance audit’s ‘3x3’ methodology into financial audit, ensuring each report has at least three clear issues and three clear recommendations.
See pages 9 and 17 for further details
Influencing for Impact
Outcomes:
Our work informs and influences
We are a key player in the auditing profession
Our brand is recognised for professional excellence.
Activity includes:
The development of a new corporate website with better presented online reports
Increased representation on key professional accounting bodies
Using Hansard to track how much impact our reports have on parliament in terms of discussion or debate on the key issues and recommendations in our tabled reports.
See pages 9, 17 and 41 for further details
The year aheadAchieving our strategic objectives
Right hand page: Peter Achterstraat, Auditor-General and Tom Muller

ParliamentRegularly seek and
use our adviceThe Auditor-General and the
Audit Office of New South Wales assess the performance
and accountability of NSW government agencies by:
reporting to the Parliament of New South Wales on our audits
working closely with parliamentary committees

The Audit Office of New South Wales AnnuAl RePORt 2009/10
8 Satisfaction remains high
Parliament is our primary client, so it is vital that we understand parliamentarians’ views of our performance. We gather their views in an annual survey, except in election years such as 2007. The 2010 survey was conducted in June and July and 48 of the 135 parliamentarians responded.
The results provide feedback on how parliamentarians view the Audit Office of New South Wales. We are proud that our Office continues to perform strongly in its drive to meet the expectations of parliamentarians.
In 2010, we continued to meet our satisfaction target for our reports and services of 90 per cent, a target that we have met for the past four years. Parliamentarians were positive about:
— our responsiveness to their requests, with 91 per cent rating it as good or higher, similar to 93 per cent in 2009
— our integrity in conducting our audits, with 93 per cent in agreement, up from 89 per cent in 2009
— our assurance to parliament, with 95 per cent in agreement, up from 93 per cent in 2009.
The results also highlighted some areas for improvement. We had a slight decline in parliamentarians agreeing that our reports communicate issues clearly at 87 per cent, down from 90 per cent in 2009. We also noted a slight decrease in the perception that our reports and services are of a high quality at 84 per cent, down from 86 per cent in 2009. In response to this we have redesigned the structure and appearance of our reports to ensure they more clearly highlight our recommendations.
Financial audit reports rate well
Parliamentarians rated the Auditor-General’s financial audit reports very well. The majority of parliamentarians who had referred to our reports in the previous 12 months felt they:
— clearly identified significant issues and their implications, the 88 per cent agreement up from 83 per cent in 2009
— were easy to understand, 91 per cent agreeing, matching the 91 per cent in 2009 and above our target of 90 per cent
— had effective layout and design, the agreement remaining high at 90 per cent, but down from 97 per cent in 2009.
Parliamentarians referring to our financial audit reports for information trended up, with 45 per cent stating they often referred to the reports compared to 41 per cent in 2009. Parliamentarians felt our financial audit reports could be improved by making them more effective in helping parliament monitor the financial performance of the NSW public sector.
SatisfactionParliamentarians very satisfied with reports and services
Satisfaction with financial audit reportsSurveys not conducted in 2007.
2006
2008
2009
8792
83
2010
90
2011
tar
get
9193 93 91 90
2006
2008
2009
2010
2011
tar
get
Identify issues and implications Easy to understand
88
Identify issues and implications
8793 91
979089
9490
Satisfaction with performance audit reports Surveys not conducted in 2007.
2006
2008
2009
2010
2011
tar
get
2006
2008
2009
2010
2011
tar
get
Easy to understand
9397
95% agree that our financial audits
provide valuable assurance
90% believe our financial reports
have effective layout and design
93% believe our performance audit
reports identify significant issues

Performance audit reports rate highly
Parliamentarians rated the Auditor-General’s performance audit reports highly. Parliamentarians who had referred to a performance audit report in the previous 12 months thought the reports:
— were easy to understand, the 97 per cent agreement matching the 97 per cent in 2009
— clearly identified significant issues and their implications, the 93 per cent agreement marginally down from the 94 per cent in 2009, but still above our target of 90 per cent
— had effective layout and design, with 97 per cent agreeing, matching the 97 per cent in 2009.
Although our performance audit reports rate well, fewer than half the respondent parliamentarians accessed them regularly. Forty-one per cent had often accessed information from our performance audit reports during the previous 12 months, matching the 41 per cent in 2009. However, 20 per cent reported rarely or never using our reports, down slightly from 21 per cent in 2009.
Satisfaction with our reports down slightly compared with other state audit offices
The Auditor-General has regularly suggested that government agencies should assess their performance by comparing results with similar organisations in other states. In 2005, we began comparing how satisfied our parliamentarians were with our reports and services against results from other state audit offices. In 2010, the Victorian, Western Australian and Tasmanian audit offices conducted similar surveys.
On an overall measure of satisfaction with reports and services, 90 per cent of our parliamentarians were satisfied, slightly below the 92 per cent average for Victoria, Western Australia and Tasmania.
A lower satisfaction rating is further reflected in 91 per cent of parliamentarians agreeing our services provide valuable information on public sector performance. This is lower than the 96 per cent average of other states. Our parliamentarians also rated us comparably lower on the clarity of how we report our issues, 87 per cent compared with the Victorian, Western Australian and Tasmanian state averages of 90 per cent.
The Audit Office of New South Wales AnnuAl RePORt 2009/10
9
The year ahead
Our Strategic Plan has a number of initiatives aimed at improving the value and impact of our audits and reports within the ‘Delivering Value’ and ‘Influencing for Impact’ focus areas (see page six for more details on our strategic focus areas).
These initiatives include:
a complete redesign of our Auditor-General’s Reports to Parliament, both financial and performance audit, with a clearer presentation of our findings and greater focus on key issues
the expansion of performance audit’s ‘3x3’ methodology into financial audit, ensuring each report has at least three clear issues and three clear recommendations which will make it easier for parliamentarians to see ‘at a glance’ what the big issues in a particular portfolio may be
the development of a new corporate website with better presented online reports allowing parliamentarians to access electronic versions of reports quickly and in a more reader-friendly format
using Hansard to track how much impact our reports have on parliament in terms of discussion or debate on the key issues and recommendations in our tabled reports
reviewing the way we select the topics and issues we audit to ensure they appeal to parliamentarians and the ‘person in the street’.
Satisfaction compared with other participating state audit offices
Audit Office of NSW Other state audit offices
Satisfaction with reports and services
Provide information on public sector performance
Help improve public sector administration
Reports communicate clearly
91
83
87
90
92
96
90
90

The Audit Office of New South Wales AnnuAl RePORt 2009/10
10 Providing an independent opinion
The core task of the Audit Office of New South Wales is to issue opinions on whether NSW government agencies’ financial reports are fairly presented and accord with accounting standards and legislative requirements. These financial reports show the agencies’ financial position and financial performance for the year.
We issue a ‘qualified’ audit opinion if we believe a financial report contains material errors or does not comply with accounting standards, relevant laws and government directions. An ‘unqualified’ opinion provides reasonable assurance that an agency’s financial report is materially correct.
We report opportunities for improving financial management methods and processes. Our work includes consideration of waste, probity, financial judgment and agency performance.
We completed 495 financial audits of NSW government agencies this financial year— see Appendix Two for a full list of our financial report audit clients.
We report to parliamentarians on the outcomes of these audits so they are better informed when considering the state’s financial performance and position, and when deciding on how best to allocate public resources.
Qualified audit opinions
During the year, we issued qualified audit opinions on the financial reports of five per cent (23 of the 495) of NSW government agencies, an increase of one per cent on last year.
Qualified audit opinions mean these agencies’ financial reports did not fully comply with accounting standards, contained material errors or there were limitations on the scope of our audits. Many of these were for agencies that have collections from fundraising activities and due to their nature are unable to have sufficient controls over these activities prior to the receipt of funds.
Repeat qualifications
During 2009–10, there were 18 repeat qualifications, which is three more than in 2008–09. We will continue to notify parliament of these qualifications and encourage the agencies concerned to act on our recommendations.
New qualifications
We issued five new qualifications in 2009–10, compared with seven in 2008–09. For details of these qualifications see pages 20 and 21.
Costs compare well with other states
We compare our financial audit costs with other Australian audit offices.
At $60,500, our average cost of a financial audit compares very favourably with the $68,000 average for all Australian audit offices. As the Audit Office of New South Wales is larger than its interstate counterparts, the economies of scale allow us to achieve lower costs. However, because we audit larger organisations, we would expect our costs per audit opinion to be higher.
Our lower than average cost is most pleasing, and is the result of our ongoing drive to improve our processes.
495 financial audits completed
Average cost per financial audit lower than other
audit offices
AssuranceOur financial audits provide assurance to parliament
448
513495 496
Number of audited entities
2006
2007
2008
2009
2010
495
5
16
9
34
2006
2007
2008
2009
2010
Qualified audit opinions %

The Audit Office of New South Wales AnnuAl RepoRt 2009/10
11Timeliness of reporting to parliament
We report the results of our financial audits to parliament. To better assist parliament, in 2009–10 we aligned our reports with the new super department structure implemented by the government in July 2009. We now report to parliament in 12 volumes compared to six volumes in 2008–09. Most of the 12 volumes published in 2009–10 had a specific industry focus as follows:
Volume 1 No industry focus
Volume 2 Universities
Volume 3 Electricity
Volume 4 Total State Sector
Volume 5 Treasury
Volume 6 Human Services and Technology
Volume 7 Environment, Climate Change and Water
Volume 8 Emergency Services and Law and Order
Volume 9 Education and Communities
Volume 10 Transport, Planning and Industry
Volume 11 Health
Volume 12 No industry focus
Our reports included results for each agency audited. Of those agencies, 86 per cent were reported within 19 weeks of receiving their financial reports (our internal benchmark), slightly below our 90 per cent target and similar to the 87 per cent achieved in 2008–09.
We believe that timely reporting of our audit findings is important as it allows parliament to promptly scrutinise agencies’ financial reports.
For clients with a 30 June balance date (the majority of our clients) we aim to report to parliament before the end of the calendar year. Our other financial audits (mainly universities) have a December year-end and we aim to report on these by May each year.
Other assurance engagements
We assess how well agencies comply with legal requirements, government policies and central agency directives. In undertaking these assessments we comply with the requirements of the Standard on Assurance Engagements, ASAE 3100 Compliance Engagements issued in September 2008.
In 2009–10 we reported the results of our first compliance engagement under the standard, a review of compliance with the government’s ‘Total Asset Management’ policy. The results were reported to parliament in Volume 12 of the Auditor-General’s report for 2009. Of 12 major agencies reviewed, none fully complied with the government’s requirements.
We anticipate recommendations from our compliance assurance programs will provide solutions to issues that may be applied across the NSW public sector.
The year ahead
In 2010–11 we will:
continue improving the content of our reports to parliament by providing more analysis of issues at the agency and industry levels
focus on improving the timeliness of our reporting to agencies through our audit opinions on financial statements and management letters
continue to work with agencies when auditing their financial reports to clear up as many financial report qualifications as possible
collaborate with individual and central agencies to resolve financial reporting and governance issues arising from the implementation of the new super department structure
continue refinement of our Special Interest Groups to ensure they are focused on the important issues facing agencies, their industries and the government
evaluate available audit methodologies and compare them with our current methodology to ensure we have the most suitable approach for our public sector audits.
2005 2006 2007 2008 2009
Cost per financial audit opinion $’000Data for 2010 is not yet available.
5053 51
60
51
5761
67
Audit Office of NSW All Australian audit offices
61
6889
95
8487
90
2006
2007
2008
2009
2010
2011
tar
get
Reports to parliament within 19 weeks %
86
Audit_text_2010_ART+varnish_v2.indd 11 29/10/10 9:03 AM

The Audit Office of New South Wales AnnuAl RePORt 2009/10
12 Helping to improve public administration
Our performance audits review the effectiveness, efficiency and economy of government agencies. A performance audit may assess the whole of an agency’s operations, one agency’s activity, or an activity that involves more than one agency.
If an issue affects a number of agencies, we may issue a better practice guide to help them, and other agencies, improve.
We published 14 performance audit reports during the year, seven more than last year. Detailed information on our reports, findings, recommendations and agency responses is on pages 22 to 28.
We aim to release 10 performance audit reports in 2010–11.
The cost of performance audits
Each performance audit cost an average of $198,429 in 2009–10, which was lower than the $390,000 of last year, and lower than our target of $290,000.
We have initiated new practices in audit planning and design to produce more reports. This has allowed us to improve our productivity compared to last year. We are confident that the average cost of performance audits in 2010–11 will meet our target of $200,000.
Another indicator of our productivity is the number of performance audit reports per staff member. This year we produced 0.73 performance audits per staff member which was more than our target of 0.60 and a significant increase on the 0.35 reports per staff member achieved in 2008–09.
Some of the improvements in productivity can be attributed to a change in audit focus to ensure our audits better meet the needs of parliamentarians and the public. We have achieved this improvement and continued to assist the Public Accounts Committee in its follow-ups of previously tabled audits. Detailed information on our work with the Public Accounts Committee is on page 14.
This is an essential part of making sure that our audits make a difference.
Reporting agency performance information
During 2009–10, our financial audit reports to parliament included comments on agencies’ key performance indicators and focused on:
— Universities — Electricity — Total State Sector — Treasury and Public
Financing Enterprises — Human Services
and Technology — Environment, Climate
Change and Water — Law and Order and
Emergency Services — Transport, Planning
and Industry — Education — Communities and Health.
The reports included recommendations for financial and operational improvements focusing on large agencies across these sectors.
Most agencies exist to provide services efficiently to the people of New South Wales, and whilst much information relating to financial performance is reflected in the financial statements of the agencies we audit, we believe that publishing additional key performance information offers parliament a balanced ‘report card’ on agencies’ performance. We also believe this information helps citizens assess whether their tax dollars have been spent efficiently and effectively.
14 performance audits completed,
7 more than last year
Effectiveness, efficiency and economyOur performance and financial audits help improve agency performance
11
15 15
7
14
2006
2007
2008
2009
2010
2011
tar
get
Number of performance audits completed
10
265
200
264 262
390
198
2006
2007
2008
2009
2010
2011
tar
get
Average cost of performance audits $’000
0.73
0.35
0.73
0.58 0.60
2006
2007
2008
2009
2010
2011
tar
get
Performance audits per staff member
0.73

13The Audit Office of New South Wales AnnuAl RePORt 2009/10Auditing performance
information
Each year the Audit Office of New South Wales is asked to verify the accuracy of specific performance data published in the NSW Government’s State Plan Annual Report. The work we performed for the year ended 30 June 2009 did not identify any errors or exceptions and we reported our findings in March 2010.
We identified some opportunities for improved reporting of State Plan performance data and reported these to the Department of Premier and Cabinet and to parliament in June 2010.
Allegations of serious and substantial waste
The Audit Office of New South Wales examines allegations of serious and substantial waste of public money under the Protected Disclosures Act 1994. This Act protects public officers who become ‘whistle-blowers’ when they identify maladministration, corruption, or serious and substantial waste.
We assess any allegations of serious and substantial waste in NSW public agencies other than local government. The NSW Ombudsman examines maladministration, and the Independent Commission Against Corruption investigates corruption.
We received and examined 21 allegations in 2009–10. Most did not have sufficient evidence to conclude serious or substantial waste. One was significant enough to warrant a separate performance audit which commenced during the year.
When confidentiality of the complainant is not compromised, we advise management of the relevant agency so it can improve its processes and controls.
The year ahead
We will continue to work closely with parliament through the Public Accounts Committee in choosing the topics and issues we will audit. This should ensure that our audits look at areas of most interest to parliamentarians and the community. We expect that the general topic areas we audit will remain similar to previous years, namely:
transport services
law, order and public safety
health and welfare services
education
water management
governance and public sector management.
2119
15
19
2006
2007
2008
2009
Number of allegations of serious and substantial waste
21
2010

The Audit Office of New South Wales AnnuAl RePORt 2009/10
14
The year ahead
To improve on our already high parliamentarian satisfaction
we will continue to:
support the Public Accounts Committee in its inquiries into
the activities of government and its follow-up of our
report recommendations
meet with the committee on sitting days to brief
parliamentarians on the reports we are presenting
to parliament
provide advice and support to parliamentary committees
for their reviews.
Parliamentary response to our workParliament continues to use our reports
Parliament now regularly questions agencies on our report recommendations
As parliament is our most important client, we always look at how it responds to the reports we publish.
Our work for parliament extends well beyond its reading of our reports. We work actively and closely with parliamentary committees, and they regularly draw on our audits and advice, and follow up and reinforce our work.
Our primary relationship is with the Public Accounts Committee which follows up aspects of the Auditor-General’s reports to parliament. We regularly meet with the committee on sitting days to brief parliamentarians on the reports we are presenting to parliament. At times, we also make submissions to the committee and appear at its inquiries.
In 2007–08 the Public Accounts Committee started to regularly follow up with agencies on what they have done in response to our performance audit report recommendations. These reviews occur about 12 months after the release of a report. We comment on what the agency says it has been doing to address the issues we raised and give evidence at the committee’s follow-up hearings.
In 2009–10 the Public Accounts Committee released three reports on follow-up reviews of the following eight performance audits:
Ageing Workforce—Teachers
Efficiency of the Office of the Director of Public Prosecutions (29/10/09 and 24/6/10)
Working with Hotels and Clubs to Reduce Alcohol-related Crime
Signal Failures on the Metropolitan Rail Network
Recycling and Reuse of Waste by the NSW Public Sector
Improving Literacy and Numeracy in NSW Public Schools
Delivering Health Care out of Hospitals
Managing Injured Police.
Follow-up reviews by the Public Accounts Committee have provided an effective means for parliament to assess agency responses to our reports, to encourage agency performance improvement, and for us to obtain useful feedback on our impact.
The Public Accounts Committee reports to parliament on the outcome of its follow-up examinations of our performance audit reports. In its fifth report to parliament in this series, Mr Paul Gibson MP, Chair of the Public Accounts Committee, stated:
‘I am pleased to table the Public Account Committee’s fifth report under its comprehensive performance audit follow-up review program. Since implementing the program, the committee has seen tangible evidence of its effectiveness, with agencies providing comprehensive information on the action they have taken in the year since the performance audit was tabled, and agreeing to adopt recommendations they had previously rejected in the face of evidence of the recommendations’ efficacy.
In our fourth follow up report, we quoted the Director-General of the Department of Education who had stated, “Since our March correspondence, which informed the committee of our response to the recommendations of the audit, we as a departmental executive met and modified to some extent the bald rejection of a couple of those proposals.” The Director-General then went on to say that the committee’s review process “is a good mechanism for keeping the pressure on us and, frankly, it was part of the reason that we as an executive revisited the March response.”
While we found the Department of Environment, Climate Change and Water and the Department of Education and Training to be very responsive to our inquiries,
the same cannot be said of RailCorp. In the committee’s opinion, RailCorp’s repeated delays in responding to the committee’s requests for information and its inconsistent and confusing answers mean that it has failed to discharge its obligations to parliament in a timely and transparent manner. The Public Accounts Committee was set up to examine the efficiency and effectiveness of government activity on behalf of the people of New South Wales, and it is not for RailCorp to decide that it will undermine the committee’s capacity to fulfil its role.
I would like to thank the Auditor-General and the Audit Office staff, as well as the departmental staff who assisted us with our inquiries.’
Case studyWorking with the Public Accounts Committee
Right hand page: L–R Lauren Sharp, Steven Martin, Harminder Singh

The Audit Office of New South Wales AnnuAl RePORt 2009/10
15
AgenciesAct on our
recommendations and regularly seek advice
We work collaboratively with our financial and
performance audit clients
Together with our financial audit clients we identify opportunities
to improve financial reporting and management
Our performance audits examine agency programs critically and from an independent
perspective in order to identify potential improvements

The Audit Office of New South Wales AnnuAl RePORt 2009/10
16
Over 90% of clients believe we
conduct our audits professionally
Improvements made in providing a value
for money service
SatisfactionOur audits are well regarded
General satisfaction with our services
We survey our audit clients every year to determine how satisfied they are with our work and where we can improve. This year we surveyed 435 financial audit clients and received 327 responses. This response rate of 75 per cent is a significant improvement on the 55 per cent achieved in both 2008 and 2007. The response rate for performance audit clients was 70 per cent, lower than the 83 per cent of 2009, with 14 out of 20 invited agencies participating in the survey.
Financial audit process improved
Our financial audit clients generally assessed us favourably for our audit processes and reporting, and for adding value to their organisation, with overall results steady in comparison to 2009. Although there was a slight drop in overall perceptions of value, this was offset by a slight increase in satisfaction with our audit process.
Performance audits significantly improved overall
Performance audit clients generally assessed us favourably in relation to the quality of audit process, reporting and value in 2010, with overall results significantly higher than those achieved in 2009.
Our value for money increases
Financial audit value for money increases
The number of respondents who think our fees are reasonable remained steady, the 55 per cent result only marginally lower than last year’s 56 per cent. There was a five per cent increase in the number of respondents who thought our financial audit services provide value for money, from 53 per cent in 2009 to 58 per cent in 2010. This builds on a previous five per cent increase on the measure from 2008 to 2009. Although we are pleased with these improvements, work still needs to be done in improving clients’ perceptions of the reasonableness of our fees.
Other measures of value were down on last year, with financial audit clients believing we can improve the sense of assurance our audits provide, and the value of our advice.
Significant increase in performance audit value
Both key measures of performance audit value were up significantly on last year, with the 2010 result the most positive result achieved to date. Seventy-nine per cent of clients believed the audit would help improve their administration of the activity audited, up from 60 per cent in 2009. Clients also value the contribution our audits make in providing them with a sense of assurance, up from 70 per cent in 2009 to 79 per cent in 2010.
Audit process shows improvement
Financial audit process rated positively
Clients believe the continuity of audit staff has improved, up from 68 per cent in 2009 to 77 per cent in 2010. Our understanding of our clients’ organisation has also improved, the 75 per cent result in 2010 up from 69 per cent in 2009. Improvements were made on the timeliness of audits, with 70 per cent agreeing our audits were conducted in a timely manner, up from 66 per cent in 2009, and that we used clients’ staff time efficiently, up from 72 per cent in 2009 to 75 per cent in 2010.
As in 2009, more than 80 per cent agreed they had adequate opportunity to comment on the audit plan, senior audit staff were appropriately involved in the audit, and communication was effective.
Clients believe we can improve the professionalism of our staff in their interactions with clients, as although the 90 per cent result is good, it is down on the 95 per cent achieved in 2009. Further areas for improvement are our responsiveness to our clients’ needs, and keeping them better informed of significant issues and findings during the course of the audit.
Performance audit process improves significantly
Over 90 per cent of respondents agreed that our interaction with staff was professional, communication between auditors and their organisation was effective, and our auditors responded promptly to requests or concerns raised.
Significant improvements were made in auditors clearly explaining the audit approach, up from 89 per cent in 2009 to 100 per cent in 2010, and in clients being given adequate opportunity to comment on audit findings before reports are finalised, up from 80 per cent in 2009 to 93 per cent in 2010. The biggest improvement was an increase in our understanding of client organisations and their operating environments, up sharply from 40 per cent in 2009 to 79 per cent in 2010.
605962
69 7168 69 68 69 70
Satisfaction with audit value Aggregate performance indices.
Financial audit clients
2006
2007
2008
2009
2010
2011
tar
get
Performance audit clients
2007
2008
2009
2010
2006
2011
tar
get
6670

The Audit Office of New South Wales AnnuAl RePORt 2009/10
17
The year ahead
Our Strategic Plan has a number of initiatives aimed at improving the value and impact of our audits and reports within the ‘Delivering Value’ and ‘Influencing for Impact’ focus areas (see page six for more details on our strategic focus areas).
These initiatives include:
A complete redesign of our Auditor-General’s reports to parliament with a clearer presentation of our findings and greater focus on the issues of relevance to our clients
A complete redesign of our financial audit management letters to improve the way we communicate our findings and provide more value to our clients in terms of the information they receive in these letters
The expansion of performance audit’s ‘3x3’ methodology into financial audit, ensuring each report has at least three clear issues and three clear recommendations of real value and benefit to our clients
The development of a new corporate website with better presented online reports allowing our clients to access electronic versions of reports quickly and in a more reader-friendly format.
We are also continually analysing the reasons we don’t meet the expectations of our clients and in 2010–11 we will be focusing on:
improving the timeliness of reporting
improving our interactions with our clients
continuing to improve clients’ perceptions of the reasonableness of our fees.
Areas that require improvement are the quality of our research and analysis, and our understanding of the specific subject matter addressed in our audits.
Our reports are well received
Financial audit reports rate positively
Eighty-five per cent of clients felt our audit findings were reported in a balanced and fair way, a marked increase of eight per cent on 2009. The perceived accuracy of our findings has also improved, up from 83 per cent in 2009 to 88 per cent in 2010.
However, there was an overall decline in satisfaction with our management letters. Our clients were less likely to agree that our management letters were: balanced and fair, down slightly to 76 per cent from 78 per cent; were issued in a timely manner, down from 78 per cent to 71 per cent; and contained ‘no surprises’, down from 75 per cent to 69 per cent.
Practical recommendations for improving performance
Ninety-three per cent of performance audit respondents felt they were given adequate opportunity to comment on performance audit findings before the report was finalised, up significantly on the 80 per cent achieved last year. Respondents also rated positively how clearly our reports communicate audit findings, the 86 per cent result up 16 per cent on last year.
There was a sharp decline in the perceived practicality of our recommendations, down from 90 per cent in 2009 to 69 per cent in 2010, and the presentation of our findings in a balanced and fair manner, down from 80 per cent in 2009 to 57 per cent in 2010.
Other areas that require improvement are ensuring reports contain ‘no surprises’, and that the benefits of our audit recommendations are clear.
Comparing well with other states
We began comparing our client satisfaction with other state audit offices in 2005. Queensland, Victoria, Western Australia and Tasmania conducted surveys in 2010, using the same method.
When compared with these other states, our financial audit clients were more satisfied with the accuracy, and the balance and fairness, of our findings, and equally satisfied with our audit fees, professionalism and the capacity for our recommendations to improve their financial management.
However, we rated below other states for our communication, timeliness, continuity of audit staff, understanding of our clients’ organisations, and our skills and knowledge.
The survey placed our performance audit clients’ satisfaction as higher than the other states in terms of communication between our staff and the organisation, and our professionalism and assurance. We also rated higher than most states in informing our clients of significant issues and our understanding of their organisation and operating environment. However, we rated below other states for senior staff involvement, and presenting our findings in a balanced and fair manner.
71 69
79
68
7571 71 72 71
Satisfaction with audit processAggregate performance indices.
Financial audit clients Performance audit clients
2006
2007
2008
2009
2010
2011
tar
get
2006
2007
2008
2009
2010
2011
tar
get
7275 76
Satisfaction with audit reportingAggregate performance indices.
Financial audit clients
71 7172 72 73 75
2006
2007
2008
2009
2010
2011
tar
get
73 7571
74
82
Performance audit clients
2007
2008
2009
2010
2006
2011
tar
get
74

97% of financial audit and 92% of
performance audit recommendations
accepted
The Audit Office of New South Wales AnnuAl RePORt 2009/10
18
Acceptance of recommendationsHigh acceptance
Continued high acceptance of our financial audit recommendations
A good measure of the effectiveness of our financial audits is an agency’s acceptance of our recommendations. We include most of our recommendations in our reports to client management, and publish the more significant matters in our reports to parliament. Our recommendations are varied and come from our assessment of agencies’ financial reporting and management systems.
Of the 898 recommendations we made to our top 50 clients in 2009–10, 867 (97 per cent) were accepted, up from 94 per cent in 2008–09.
Continued high acceptance of our performance audit recommendations
Similarly, a performance audit client’s acceptance of our recommendations increases the likelihood that we will have a positive impact on agency performance— a good measure of our success.
Of the 14 performance audit reports completed in 2009–10, agencies accepted 98 of our 106 recommendations. At 92 per cent this is slightly down on the 99 per cent result last year. Most significantly, agencies accepted all recommendations in 10 of the 14 completed performance audits.
Recommendations accepted %
2006
2007
2008
2009
2010
2011
tar
get
9494 9297
9993 93
9095
Financial audits
Performance audits
2009
2006
2007
2008
2010
95
2011
tar
get
97
92
Case studyImproving the road safety of school zones
In 2010, we conducted a performance audit into the effectiveness of school zones and found that motorists continue to exceed the 40 km/h school zone speed limit, and that enforcement of school zone speed limits was almost entirely dependent on fixed speed cameras. The one per cent of school zones fitted with fixed speed cameras accounted for 93 per cent of all school zone speeding infringements.
We recommended that the RTA publish how many of the mobile speed cameras promised in 2006 have been acquired for school zone purposes and how often they have been deployed.
The Minister for Roads announced on 27 June that six mobile cameras will start operating from 19 July 2010. From July 2011, a larger program will start operating, ramping up to 12,200 hours per month of mobile speed enforcement.

The year ahead
Improving the timeliness of our reporting allows our clients to act promptly on our findings and recommendations.
We will continue to work on improving the timeliness of our financial audit opinions and management letters.
We will also continue to work on delivering performance audit reports in the most efficient and timely way.
We will closely analyse where we don’t meet the expectations of our financial and performance audit clients, and over the next three years implement initiatives to address these expectations.
The Audit Office of New South Wales AnnuAl RePORt 2009/10
19We are working to improve the timeliness of our reporting to agencies. The earlier we give agencies our audit opinions and management letters, the sooner they can develop any necessary solutions.
In 2008–09, we changed how we measure the timeliness of issuing our financial audit opinions. In prior years, if we had completed our audit by the due date but our opinion was issued late due to delays caused by the agency, we concluded we had achieved our target. Public accountability requires agencies to report in a timely manner and the Office has a role in influencing agencies to improve their timeliness. We therefore now measure the time taken to issue financial audit opinions irrespective of delays caused by agencies. If we improve our performance, the timeliness of agencies’ financial reporting to stakeholders will also improve.
The percentage of opinions issued within 10 weeks was 71 per cent in 2009–10 which was an improvement over last year’s 61 per cent. We have set a target for 2010–11 of 100 per cent due to the importance of this measure.
In 2008–09, we also changed how we measure the timeliness of issuing our management letters to agencies to improve on their timeframes. Our goal now is to have our management letters, including agency comments, issued to agencies within six weeks from the issue of the audit opinion. In 2009–10 we achieved 48 per cent which was less than the 52 per cent achieved in 2008–09 and significantly below our target of 85 per cent.
Management letters include suggestions for improving the systems and processes we review during our audits. We have increased our efforts to ensure the letters are issued earlier by ensuring reporting to large and higher risk agencies follows the completion of both interim and final audit work. Another change in our approach includes increased liaison with agencies to obtain their responses to matters raised in a timelier manner.
Timeframes for performance audits similar to other states
The average time for Australian audit offices to complete a performance audit decreased slightly from 10.4 months in 2007–08 to 10.1 months in 2008–09 (the most recent result available).
We take longer, 11 months in 2007–08 increasing to 12.1 months in 2008–09.
During 2009–10 we put in place a strategy to perform more shorter, sharper performance audits. This strategy includes the selection of suitable topics that lend themselves to that style of audit. It also involves reducing the size of the performance audit reports to no more than 20 pages and costing no more than $200,000 each. We have also looked at the structure of our performance audit reports and standardised them to allow readers to quickly understand the focus of the audit and its outcomes.
Timelinesstimeliness of reporting to agencies
71
61
100
2009
2010
2011
tar
get
Audit opinions within 10 weeks %Calculated for the first time in 2009.
4852
85
2009
2010
2011
tar
get
Management letters within 6 weeks %Calculated for the first time in 2009.

The Audit Office of New South Wales AnnuAl RePORt 2009/10
20
Our financial auditsProviding value to our financial audit clients
What are financial audits?
Financial audits provide independent opinions on NSW government agencies’ financial reports. They identify whether agencies comply with accounting standards and relevant laws, regulations and government directions. Additional financial report audits are undertaken each year on the Total State Sector Accounts and the Statement of the Budget Result. Financial report audits also highlight opportunities for agencies to improve their accounting and financial systems.
A report on each financial audit is provided to the minister responsible for the agency, the agency, the Treasurer, and parliament through the Auditor-General’s reports to parliament.
Our client base
We completed 495 financial audits of NSW government agencies in 2009–10 (see Appendix Two for the full list of our clients). These agencies collected income of approximately $92.2 billion, spent about $77.9 billion and managed more than $337.6 billion in assets. They provide a diverse range of services and vary in size from large government departments, universities, state super-annuation entities and utilities, to small boards and trusts.
Less new qualifications
In 2009–10 we issued five new qualifications, two less than 2008–09.
Agency Reason for qualification
Forestry Commission of New South Wales (Trading as Forests NSW)
We were unable to form an opinion as to whether costs incurred to establish a plantation forest are deductible for tax purposes.
NSW Department of Primary Industries
We were unable to form an opinion as to whether costs incurred to establish a plantation forest are deductible for tax purposes.
Greyhound & Harness Regulatory Authority
The authority was abolished on 1 July 2009. Due to the unavailability of staff and lack of relevant accounting records, we were unable to obtain all the information and explanations required to form an opinion on the authority’s financial statements.
International Film School Sydney Pty Ltd (Previously Sydney International Film School Sydney Pty Ltd)
Due to the timing of the appointment of the auditor, we were unable to form an opinion on prior period comparative figures. (Two years financial reports qualified).
Qualifications cleared
We work closely with agencies to clear financial reports we have previously qualified. This year we cleared four qualifications, compared with three in 2008–09.
University of New England Sports Association
The financial report of the association is no longer subject to the previously qualified comparative figures.
A.C.N. 093 230 374 Pty Ltd (Formerly TAFE Global)
The financial report of the association is no longer subject to the previously qualified comparative figures.
Forestry Commission of New South Wales (Trading as Forests NSW)
The valuation approach which was qualified last year has now been changed as a result of a change in accounting policy.
NSW Department of Primary Industries
The valuation approach which was qualified last year has now been changed as a result of a change in accounting policy.
Efficiency audit compliance
We also issued one efficiency compliance audit qualification.
Waste Recycling and Processing Corporation
We were unable to form an opinion on the efficiency of the corporation’s operations as relates to comparable businesses as the corporation did not develop suitable financial and non-financial comparators.
Education and universities Health and community Electricity and water Central agencies, finance, insurance Commerce, construction, housing Law and social justice Primary industries, natural resources, environment Transport and ports Other
Financial audit clients per sector %
32
10
910
5
4
5
5
20
5 new qualifications issued
4 qualifications cleared

The Audit Office of New South Wales AnnuAl RePORt 2009/10
21Some qualifications remain
Eighteen qualifications remain unresolved.
Audit client Reason for qualification
UON Foundation Trust It is not possible for fundraising entities to maintain an effective system of internal control over fundraising revenue and voluntary donations until their initial entry in the financial records.
NSW Ovine Johne’s Disease Transaction Based Contribution Scheme
Lack of income records available for review and audit.
Riverina Citrus Previously the scheme did not have an effective system of internal control to ensure completeness of contributions revenue. This issue has now been addressed. The qualification is in relation to comparatives.
Sydney Water Corporation The treatment of assets and liabilities from build-own-operate schemes is not in accordance with AASB 117 Leases.
Royal Alexandra Hospital for Children
It is not possible for fundraising entities to maintain an effective system of internal control over fundraising revenue and voluntary donations until their initial entry in the financial records.
NSW Self Insurance Corporation (SICorp)
The entity does not properly apply AASB 1023 General Insurance Contracts, resulting in a material misstatement of general insurance liabilities.
Treasury Managed Fund (TMF)
The entity does not properly apply AASB 1023 General Insurance Contracts, resulting in a material misstatement of general insurance liabilities.
Crown Entity We were unable to substantiate the value of Crown Reserves.
Centennial Parklands Foundation
It is not possible for fundraising entities to maintain an effective system of internal control over fundraising revenue and voluntary donations until their initial entry in the financial records.
Total State Sector We were unable to substantiate the value of Crown reserves. In addition, we believe AASB 1049 Whole of Government and General Government Sector Financial Reporting was not properly applied, resulting in a material understatement of assets.
ANZAC Health and Medical Research Foundation Trust Fund
It is not possible for fundraising entities to maintain an effective system of internal control over fundraising revenue and voluntary donations until their initial entry in the financial records.
Gosford Water Supply Authority
The volatility in global financial markets, coupled with the style of investments held by the authority, resulted in an inability to obtain sufficient appropriate evidence as to the fair value and recoverability of the authority’s investment portfolio.
University of New South Wales Foundation Trust
It is not possible for fundraising entities to maintain an effective system of internal control over fundraising revenue and voluntary donations until their initial entry in the financial records.
Charles Sturt University Foundation Trust
It is not possible for fundraising entities to maintain an effective system of internal control over fundraising revenue and voluntary donations until their initial entry in the financial records.
Whitlam Institute within the University of Western Sydney Trust
It is not possible for fundraising entities to maintain an effective system of internal control over fundraising revenue and voluntary donations until their initial entry in the financial records.
University of Western Sydney Foundation Trust
It is not possible for fundraising entities to maintain an effective system of internal control over fundraising revenue and voluntary donations until their initial entry in the financial records.
UNSW & Study Abroad — Friends and US Alumni Inc.
It is not possible for fundraising entities to maintain an effective system of internal control over fundraising revenue and voluntary donations until their initial entry in the financial records.
UNSW Hong Kong Foundation Limited
It is not possible for fundraising entities to maintain an effective system of internal control over fundraising revenue and voluntary donations until their initial entry in the financial records.
2006
2007
2008
2009
2010
8
5
4
7
5
Number of new qualifications
4
5
12
10
2007
2008
2009
2010
Number of qualifications cleared
3
2006
18
63
43
11
2006
2007
2008
2009
2010
Number of repeat qualifications
15

The Audit Office of New South Wales AnnuAl RePORt 2009/10
22
Our performance auditsIndependence and professionalism
Performance audits are special in-depth assessments of whether government agencies are achieving value for money.
A performance audit may cover:
— the whole of an agency’s operations
— one particular agency’s activity
— an activity across a number of agencies.
We report the results of these audits to the CEO of each agency, the responsible minister, the Treasurer and parliament.
Choosing a topic
Our goal is to choose topics that reflect the interests of both parliament and the community. When selecting which areas to audit, we combine our own research with suggestions from parliamentarians, agency CEOs and members of the public. We then evaluate the benefits of each topic, including the potential for cost savings, the likely impact, and possible improvements in public administration.
Are recommendations followed-up?
Twelve months after a performance audit is tabled, the Public Accounts Committee will examine whether agencies have implemented recommendations from performance audits and whether any changes in practice or performance have occurred in response to these audits.
In some cases, the Public Accounts Committee will hold a hearing and invite the agency and the Auditor-General to attend and answer questions.
Detailed information on our work with the Public Accounts Committee is on page 14.
Case studies
Working with parliament
Parliament’s Public Accounts Committee conducted a follow-up review of our September 2008 performance audit report ‘Delivering Health Care out of Hospitals’. At the hearing, the committee expressed concerns about the Department of Health’s progress in implementing our recommendations. The committee advised the department that it would be calling its representative back before them in three months to be updated on the department’s progress. The committee has sent
the department a list of supplementary questions, and will consider its response in detail before deciding whether to hold a second hearing on this matter.
The Public Accounts Committee also stated:
‘It was encouraging to see that agencies were responding positively to the audits and that this will lead to the better provision of services in New South Wales. The committee has made some further recommendations on some matters where it considers that agency responses could be further enhanced.’
Professional influence
Our performance audit staff often provide assistance to other audit offices and the profession. For example:
— in November 2009 we reviewed the ACT Audit Office performance audit manual
— during the year we provided assistance in the review of Australian Assurance Standards (ASAEs) to the Australasian Council of Auditors-General and the CPA
— in June 2010 staff provided a presentation on performance auditing to a delegation from the State Audit Bureau of Kuwait.

23The Audit Office of New South Wales AnnuAl RePORt 2009/10
This audit examined the participation of Aboriginal defendants in the Magistrates Early Referral Into Treatment (MERIT) court diversion program, that targets adult defendants with illicit drug use problems. MERIT has the potential to impact on a large number of Aboriginal defendants. However:
— MERIT is not available in all courts including some with high proportions of Aboriginal defendants
— although referrals have increased, Aboriginal defendants were less likely to be accepted into MERIT
— Aboriginal defendants were less likely to finish MERIT than non-Aboriginal defendants.
Our recommendations included:
— expanding the program to additional courts
— simplifying the eligibility criteria to focus on suitability for release on bail and clients with a demonstrable drug or alcohol problem.
Response
The majority of our recommendations were supported and accepted by the agencies. The Director General of the NSW Attorney General’s Department stated, ‘I take this opportunity to thank the Audit Office for its considered recommendations on how this well-regarded and successful program could work better for Aboriginal defendants.’
This report was released on 5 August 2009.
This year’s performance auditsOur recommendations are well received
Helping Aboriginal Defendants through MERIT
This audit looked at ten environmental programs that granted $200 million between 2002–03 and 2006–07 to find out whether they were managed well.
We found many aspects of good grants management. All of the programs were clearly aligned to the government’s objective to improve environmental outcomes.
Grants were distributed geographically according to need and the Environmental Trust’s overall management of grants was good. There were problems with some programs now administered
by the Department of Environment, Climate Change and Water (DECCW).
The Trust and DECCW have a range of controls to ensure funding was used for the intended purpose, but these weren’t always well implemented.
We recommended that:
— agencies reduce red-tape and delay when administering grants
— Ministers act transparently — agencies monitor
grants and evaluate funding programs.
Response
The Trust and DECCW accepted our recommendations. DECCW noted that its programs had only been recently transferred to it.
This report was released on 26 August 2009.
This audit concluded that NSW Maritime and the Lands Authority are both administering domestic waterfront tenancies broadly in line with government policy, however a lack of collaboration was resulting in different practices and variations in rents and conditions between the two agencies.
The agencies had been slow in responding to criticism by tenants about the review of the market-based components of the rental formula, especially the rate of return.
We recommended that the agencies:
— agree an overall strategy and the way that they administer the tenancies
— jointly review the net rate of return in an open and consultative manner
— improve communications with waterfront tenants.
Response
NSW Maritime and the Lands Authority accepted the recommendations and indicated that they have already implemented some of the recommendations.
This report was released on 23 September 2009.
Environmental Grants Administration
Administering Domestic Waterfront Tenancies

The Audit Office of New South Wales AnnuAl RePORt 2009/10
24
This audit assessed whether the Government Licensing Project (GLP) had achieved its aim of standardising and simplifying licensing processes.
The GLP was standardising and simplifying processes, however it was found that it was:
— running over the planned completion date
— exceeding the original budget
— expected to produce less savings than originally planned.
We recommended that agencies planning or implementing similar large-scale whole-of-government projects should:
— ensure that they comply with all guidelines for business case development and project management
— establish project governance structures that are able to respond and keep the project on track by:
• having clearly defined responsibility for project oversight
• providing regular reporting against clear milestones to ensure early warning of any slippage
• having clear authority to respond to problems which threaten the project’s success.
Response
The Department of Services, Technology and Administration accepted our recommendations.
This report was released on 7 October 2009.
Government Licensing Project
Handback of the M4 Tollway
At midnight on 15 February 2010, the M4 was handed back to government and the toll removed. It was the first major Public Private Partnership infrastructure handed back to government.
Our audit, conducted in the lead-up to handback, focused on whether the road would be in good condition when the state got it back, and how well it would cope with the extra traffic after the toll was removed.
We found that toll removal would increase the number of vehicles using the M4 in peak periods, and despite
the M4 project deed’s shortcomings, the M4 should not require costly repairs when handed back.
Our recommendations included that the RTA:
— in all future tollway deeds, spell out how to determine the repairs needed to bring roads up to a satisfactory condition at handback
— review existing agreements and start negotiating any necessary changes to ensure smooth handback
— complete planned M4 roadworks on time.
Response
The RTA accepted our recommendations.
This report was released on 27 October 2009.
This year’s performance audits (continued)
Our recommendations are well received
Government Advertising
This audit examined whether four recent advertising campaigns were appropriate, properly approved and whether statements made in one of the advertising campaigns were substantiated.
We found that two of the advertising campaigns we reviewed had followed the required approval processes and were appropriate.
We had some concerns with the other two. There was a high risk that a reasonable person could judge one of the advertising campaigns as serving party political interests. Members of the former
premier’s staff made key decisions in what were meant to be non-political campaigns. And while statements made in one of the advertising campaigns were substantiated, they could have misled the public.
We recommended:
— stricter rules in publicly funded advertising to improve guidance, transparency and accountability
— chief executives provide written certification that advertising campaigns are appropriate.
Response
The Departments of Premier and Cabinet and Services, Technology and Administration accepted all recommendations. The revised Government Advertising Guidelines published in May 2010 implement our recommendations.
This report was released on 10 December 2009.

The Audit Office of New South Wales AnnuAl RePORt 2009/10
25
This audit examined what police have done to manage demand for analysis as well as what has been done to increase capacity. We looked at both fingerprint and DNA evidence.
The complexity of DNA analysis and its growing use has led to delays in analysis and a backlog of cases in New South Wales, similar to many other jurisdictions.
We found that while police effectively prioritise fingerprint evidence, it could better manage the screening and
analysis of both fingerprint and DNA evidence to reduce delays. In particular, we found that the backlog of cases waiting for DNA evidence to be analysed was around 6,400 cases in 30 November 2009 and would take more than a year to process with existing resources even if no more cases were received.
We made a series of recommendations designed to address backlogs and delays in getting the results of forensic analysis back to police.
Response
The NSW Police force and NSW Health accepted all recommendations.
This report was released on 10 February 2010.
Managing Forensic Analysis—Fingerprints and DNA
This audit examined the role of the Commission for Children and Young People (CCYP) in identifying those who may pose a risk to children through the Working With Children Check (WWCC).
Key findings included:
— the CCYP did not monitor compliance with the WWCC
— the outcomes of risk estimates were not always consistent, and whatever the risk a person may pose to children, as long as they are not prohibited, the CCYP cannot stop an employer from hiring them
— there was no certainty that new offences committed by paid employees or volunteers after they have been employed will be picked up.
Our recommendations included that the CCYP:
— undertake regular audits — improve risk estimate
outcomes and consistency — ensure employers of
significant-risk employees implement Child Safe Child Friendly strategies
— review its approach to collecting and analysing relevant employment information.
Response
CCYP accepted our recommendations and commented: ‘Its recommendations will help to strengthen the Working With Children Check.’
This report was released on 24 February 2010.
Working With Children Check
Improving Road Safety: School Zones
This audit assessed whether school zone initiatives have made a difference to safety around schools.
The number of school zone casualties was small compared to all school age casualties. In the last decade none of the child pedestrian fatalities around schools or in school zones was caused by speeding.
Enforcement of the school zone speed limit is almost entirely dependent on fixed speed cameras. Unsafe parking may contribute to the hazards around schools.
We recommended that the RTA:
— retain existing school zone facilities
— improve awareness, compliance and effectiveness of school zones
— determine and publish:• progress on the
commitment made by the Minister for Roads in 2006 that revenue raised by school zone speed cameras would be reinvested in road safety projects
• how many of the mobile speed cameras promised in 2006 have been acquired for school zone purposes and how often they have been deployed.
Response
The RTA accepted some of our recommendations wholly and the remainder in part.
This report was released on 25 February 2010.

The Audit Office of New South Wales AnnuAl RePORt 2009/10
26
This year’s performance audits (continued)
Our recommendations are well received
This audit assessed how well NSW Transport and Infrastructure (NSWTI) manages the performance of metropolitan bus services.
All scheduled public and private bus services in the Sydney metropolitan area are provided under Metropolitan Bus Service Contracts managed by NSWTI. The contracts, which guarantee monopoly rights to the operators, were introduced in 2005 and are worth $5.6 billion over seven years.
The contracts require a performance management regime to hold operators accountable. But this is still being developed and it remains unproven as a basis for ensuring value for money from the contracts.
We recommended that NSWTI increase pressure to improve performance and drive costs down by:
— specifying a range of performance objectives for each contract region
— comprehensively benchmarking performance, with penalties for poor performance
— strengthening controls on operator self-reporting
— publicly reporting operator performance by route and by region
— conducting more frequent bus customer satisfaction and usage surveys.
Response
NSW Transport and Infrastructure accepted our recommendations.
The report was released on 10 March 2010.
Improving the Performance of Metropolitan Bus Services
This audit assessed performance against targets in the Working Together Strategy 2005–2008 to improve injury management in the NSW public sector, and what has happened since the strategy finished in 2008.
We found a reduction in workplace injuries and other initiatives have resulted in savings from lower claim costs and lower workers’ compensation premiums. The average cost of claims and the incidence rate of claims for the public sector remains higher than the private sector.
Since Working Together finished, claims across the public sector have increased by nearly 15 per cent, and the cost of premiums has increased by around $17 million.
We recommended three key actions:
— releasing an updated Working Together Strategy
— agencies setting specific targets
— agencies to refer all alleged workers’ compensation frauds to WorkCover NSW and report performance against Working Together targets in their annual reports.
Response
The government accepted our recommendations and released a new Working Together Strategy. This addresses our main recommendation.
This report was released on 31 March 2010.
Injury Management in the NSW Public Sector

The Audit Office of New South Wales AnnuAl RePORt 2009/10
27
This audit assessed whether access to short-term accommodation in a respite centre is working well to support people with disabilities and their carers.
The Department of Human Services has increased the amount of respite provided by 20 per cent since 2006–07, but there were no consistent criteria for distributing respite and the amount provided was not necessarily based on need.
While the department had reduced the number of blocked beds and expedited urgent cases, the needs
of heavy respite users were not reassessed, some beds were unoccupied and the cost-effectiveness of some Non-Government Organisation (NGO) centres had not been monitored.
Our recommendations included that the department:
— speed up the introduction of a consistent approach to distribute respite on the basis of need
— determine where beds are and how they are used so it can make the best use of available funds.
Response
The department supported the findings that it should expedite and enhance respite initiatives. It agreed to implement all recommendations.
This report was released on 5 May 2010.
Access to Overnight Centre-Based Disability Respite
Severance Payments to Special Temporary Employees (STEs)
Government Investment in V8 Supercar Races at Sydney Olympic Park
STEs comprise most of the ‘personal’ staff of the premier, ministers and the leader of the opposition. This audit examined whether severance payments totalling $5.9 million made to 147 STEs were made in accordance with clear rules and were not excessive.
Two recent severance payments involved special deals that were legal but outside the guidelines and cost the taxpayer nearly $180,000 extra. The Department of Premier and Cabinet treated all STE terminations as redundancies, which attract a lower taxation
rate. Redundancies imply that the position is abolished, but the usual practice was for a new person to be employed after the STE was terminated.
Our recommendations included that the department:
— follow the guidelines on severance pay
— obtain taxation advice on its treatment of STE severance payments
— consider providing reduced severance payments where an STE’s termination is not due to a ministerial reshuffle.
Response
The department accepted four of our five recommendations, reserving the right to offer severance payments outside the guidelines.
This report was released on 16 June 2010.
The V8 Supercar event was prepared in a tight timeframe, attracted a large crowd and was proclaimed a success by the premier.
We estimated that the five races cost $10 million more than planned and provided nearly 25 per cent fewer benefits than expected.
The government’s negotiating position was weakened by media reports about government’s in-principle support for the event ten months before negotiations commenced. Initial advice
to Cabinet in June 2008 was based on limited analysis and consideration of options.
Our recommendations included that:
— government should get the best possible advice from its experts on assessing and negotiating major event proposals
— proper business cases should be prepared
— there needs to be a more consistent and accurate costing of events, and more detailed reporting on major event performance.
Response
The agencies responsible for the event have failed to publicly commit to implementing our recommendations. This is disappointing as the recommendations aim to achieve a coherent strategy for approaching and assessing future major events.
This report was released on 23 June 2010.

The Audit Office of New South Wales AnnuAl RePORt 2009/10
28 Government Grants
In May 2009, the Audit Office published the Performance Audit on Grants Administration. This audit asked how grants are defined, where grants went and what recipients think of the grant system. It was followed by a second report in August 2009 that examined specific environmental grant programs.
The Department of Premier and Cabinet accepted our recommendations and substantially revised its Good Practice Guide to Grants Administration in May 2010 to explicitly reflect our recommendations. It calls on departments to:
— manage risk and streamline procedures to the minimum needed to ensure accountability and value for money
— improve transparency by publishing a rolling calendar of grants, procedures for making grant decisions, reasons for any variations from normal procedures in the granting or refusal of grants, and evaluation of what grant programs achieved and how the distribution of funds has supported government objectives
— set up timely monitoring systems, tie payment to clear performance measures and require the recipient to establish internal controls
— consider using web technology to streamline applications and administration
— reduce red-tape by using standard terminology when dealing with grant recipients, set targets to better manage the time taken to process grants, and consider harmonising requirements such as audit thresholds across different grant programs
— regularly evaluate programs and publish the results.
Impacts from previous yearsOur reports continue to influence
Right hand page: L–R Laura Roemekso, Steven Black, Leeanne Strange, Megan Hrdina, Nathan Carter
Distributing Legal Aid in NSW
An impact of our audits and parliament’s Public Accounts Committee follow-up of our report recommendations is indicated by the CEO of Legal Aid NSW in their 2008–09 annual report. The CEO reported:
‘Significantly, this annual report includes, for the first time, a set of service delivery targets for the coming year. The publication of targets was recommended by the Auditor-General in his performance audit, completed in 2006, and supported by the Public Accounts Committee in its review of the performance audit in 2008. We have started with a small set of core targets, linked to strategies in our new corporate plan. Next year, we will report on our performance against these targets. We also hope to add to the range of targets, as we improve data collection in other areas of service delivery.’
Improving Road Safety: Heavy Vehicles
In May 2009, the Audit Office published a performance audit on Improving Road Safety: Heavy Vehicles. This audit assessed how well the Roads and Traffic Authority of NSW (RTA) managed on-road enforcement to reduce the number and severity of crashes involving heavy vehicles.
In response to our recommendation that the RTA use Safe-T-Cam or better technology to enforce point-to-point speed offences against heavy vehicle drivers, it has implemented one point-to-point system, with 18 more scheduled over the next 18 months.
Previous years’ reports

PeopleOur people are highly skilled and dedicated
to improving the public sector
At the Audit Office of New South Wales, we have built a
working environment that:
is founded on respect for staff, clients and stakeholders
strives to maintain a balance between work life and personal life
fosters and values trust and allows staff to be the best they can be
attracts and retains highly skilled staff who share our commitment to
lifelong learning

The Audit Office of New South Wales AnnuAl RePORt 2009/10
30
787976 76
80
2006
2007
2008
2009
2010
2011
tar
get
Employee satisfaction %79
Improvements in staff satisfaction
91% of staff ‘satisfied’ to
‘extremely satisfied’
91% of staff describe the
Office as ‘a great place to work’
The year ahead
We have worked actively through the 2009–10 year to consolidate our strong survey results and improve areas of
opportunity. To continue these positive results, in 2010–11 we
will focus on areas important to our staff such as:
building on our leadership excellence and constructive
behaviours to continue to improve feedback, recognition
and communication
continuing to provide the resources, equipment and technologies they need to
manage their workload and enhance productivity
maintaining the focus on work-life balance by
re-enforcing our commitment to flexible work practices.
Employee satisfactionKeeping the values ‘real’
Employee satisfaction
We received 193 responses to the 2010 staff survey representing a 77 per cent response rate. This is slightly less than our highest level of 82 per cent achieved in 2009, however it is still considered to be an outstanding response rate by survey professionals.
The survey calculates a weighted satisfaction index about work at the Office, and an overall ‘gut feel’ measure of employee satisfaction.
This year’s results continued the strong levels of recent years, with a return to the benchmark high level of 2006.
The weighted satisfaction index was 79 per cent for respondents, improving markedly from 76 per cent in 2009. This maintains our high positioning in the satisfaction zone as ‘best employers’ by leading survey organisations.
The ‘gut feel’ result was outstanding, with more than 91 per cent of respondents being ‘satisfied’ to ‘extremely satisfied’, up on the 89 per cent achieved in 2009.
Morale continues to grow
Staff morale continued to grow to a new high point, with 86 per cent of respondents reporting ‘reasonable’ to ‘very high’ morale. This represents an improvement in almost every year of the survey. Ninety-one per cent of staff feel that the Office is ‘a great place to work’.
High levels of engagement continue
Employee engagement measures staff commitment, how hard people are willing to work, and how long they are likely to stay at the Office. At almost 83 per cent, our employee engagement continues at an excellent level, that is now at its highest to date.
Staff commitment is outstanding, with more than 95 per cent of respondents prepared to go that ‘extra mile’ to assist co-workers and clients, or to achieve the Office’s objectives.
Values alignment
This is the second year we have surveyed our staff on how well they feel the Office values are practiced. Across every dimension we have grown from last year’s already high ratings—the ‘Purpose’ value score has grown from 75 per cent to 79; the ‘People’ value has risen from 77 per cent to 79; and the ‘Professionalism’ value has increased from 77 per cent to above 81.
Performance gaps
The opinion survey tells us what our staff consider to be most important, and shows the gaps between their expectation of the ‘ideal’ and how well we’re currently performing. Where the gaps are substantial (more than 20 points) we need to find active ways to close the difference. However, we need to also recognise where staff acknowledge that we are currently performing well.
Opportunities for improvement continue in areas such as work-life balance, which has improved from a gap of 25 in 2009 to 21 in 2010. There has also been opportunities for improving staff skills and knowledge, which has shown significant improvement on previous years, the gap reducing from 26 in 2009 to 22 in 2010.
We again measured the dimension of workload ‘sustainability’ which shows how balanced our employees are in their work practices. Results show an improvement from 2009 levels to a point where almost 80 per cent of staff are now working in a ‘sustainable’ to ‘highly sustainable’ manner, with 20 per cent potentially at risk of working in an ‘unsustainable’ manner. We will continue to encourage and facilitate balanced work practices to ensure our staff are not overworked and at risk of burning out.
8185
75 74
8386
2006
2007
2008
2009
2010
2011
tar
get
Employee morale %
2010
2122
2008
21
25
2009
2526
Significant performance gaps
Work-life balanceSkills and knowledge

The Audit Office of New South Wales AnnuAl RePORt 2009/10
31
65% productivity achieved, an improvement on previous years
The year ahead
Our Strategic Plan has a number of initiatives aimed at improving the way we develop our people within the ‘People Power’ and ‘Putting the Business into Business Teams’ focus areas (see page six for more details on our strategic focus areas).
These initiatives include:
delivering a comprehensive and continuous workforce plan to ensure the Office has the right people with the right skills at the right time
consolidating the work that has been done to define leadership behaviours and modelling at all levels
creating a robust business indicators measurement framework to give managers clear, real-time views of goals and productivity.
Productivity on target
Our services help to improve the state’s performance. Despite increased demands on staff due to changes in mandatory auditing standards, our staff productivity (the percentage of total hours that we charge to our audit work) remains on target. The total hours include those of Corporate Services staff who do not charge time directly to audits.
The 65 per cent result for 2009–10 is an improvement on previous years. This increase in productivity demonstrates improved value for money of our audit work to parliament and agencies.
Continuing to build the performance management framework
During 2009–10, we commenced a project to upgrade our online performance management system to support the work done to improve management practices and behaviours in the Office. We have also continued to refine the definitions of required operational and behavioural competencies for all staff, and are working to align our learning offerings to those competencies.
Every member of staff reviews their competencies with their manager to determine gaps or opportunities in their development, sets tailored ‘learning and growth’ goals for the year ahead, and now utilise the new Learning Management System (LMS) to ‘self-manage’ their development.
All levels of management have received business skills and leadership behaviour development, with individual coaching to focus on personal excellence.
Enhancing IM&T infrastructure
Reliable and up-to-date information and technology are critical to both the performance and satisfaction of our staff. Much of our work takes place at client premises, so our largely mobile workforce depends on our technology to perform audit work.
In 2009–10, we worked on a number of critical projects including:
— development of a new five-year IMT Strategy and Road Map
— implementing a new intranet to provide staff with the information they need, when they need it
— providing all our mobile workforce with wireless access to the corporate network
— implementing an employee self-service HR kiosk
— implementing a Learning Management System (LMS) to improve staff access to learning opportunities and provide just-in-time online learning
— continuing to improve our practice management system
— continuing to develop reports for our management information system
— certification of our Information Security Management System to the ISO 27001 standard.
Remuneration process robust
We have continued this year with online access and automated workflow for our annual remuneration process. With a focus on continuous improvement, our remuneration committee met with all reviewing managers individually to ensure that the quality and consistency of staff assessments remain high.
The process is now well understood by all staff, and fairness and transparency remain fundamental to our operations. In 2010, we will continue to improve the goal-setting and assessment process to create an even stronger mechanism.
PerformanceOur staff continue to deliver quality results
6065 67
61 5963
2006
2007
2008
2009
2010
2011
tar
get
Productivity %

The Audit Office of New South Wales AnnuAl RePORt 2009/10
32
254 full-time equivalent staff
7% staff turnover, our lowest turnover
in several years
Staffing and recruitmentOperating in a changing environment
Small increase in staff numbers
We continue to see refinements in accounting and auditing standards, causing an increased focus on staff development and the complexity of the work performed. The number of full-time equivalent permanent staff in the Office has risen over the year from 249 to 254. This represents relatively modest growth considering we have continued low attrition levels and the volume of additional work in preparation for the consolidation of government agencies into super departments.
We remain committed to our graduate and school leaver recruitment program to fill base-level auditor positions. We appointed 12 graduates and seven HSC school leavers, leveraging our very strong brand in this space. The Office continues to liaise with universities throughout Australia through internet advertising, campus publications and with professional accounting bodies at their careers events.
Our strategy of managing more with permanent staff in 2009–10 has been effective at lessening the need for temporary staff, and ensuring consistency of service and value to our clients. It also helps us to manage our leave liability and significant development commitment.
We have started to see a more active market for audit talent in the latter part of the year, and anticipate that 2010–11 will see more volatility in workforce management. Our brand is strong and our organisational excellence and reputation will provide us with a strong buffer against unwanted attrition.
Turnover still low, but unpredictable
Employee turnover remained low at seven per cent, down from eight per cent in 2009 and significantly lower than historical norms. We continue to balance making our Office an attractive place to work with the knowledge that we do require some level of manageable turnover to bring fresh perspectives and practices.
Through 2009–10 we continued to offer our staff a variety of work and development opportunities. Once again, Office staff accepted opportunities for secondment to audit offices overseas, including to the State Audit Institution of the United Arab Emirates in Abu Dhabi, where this year we had our first Corporate Services secondee, and secondments to other divisions within the Office.
We are actively managing approaching senior retirements by encouraging staff to share their plans with us so we can better ensure knowledge transfer and continuity of service to our clients.
Negotiation of revised Award
We are pleased to enjoy a very cooperative industrial environment. The Award Negotiation Team met regularly through the year to negotiate improvements and updates to the Audit Office Award, which have been ratified by members.
Most significantly the award has been extended to cover all new administrative and clerical roles in the Office, and to incorporate all general conditions of employment.
The revised award will soon be registered, and will form the basis of the next revision. The Award Negotiation Team also acts as a Joint Consultative Committee, a forum used to discuss and resolve human resource issues of common interest across the Office.
Total staff* * FTE: Full-time equivalent.
214
254
205 201
249
2006
2007
2008
2009
2010
Executive CorporateAudit
18
7
11
17
12
2006
2007
2008
2009
2010
2011
tar
get
Staff turnover %
8

The Audit Office of New South Wales AnnuAl RePORt 2009/10
33
Women represent 44% of middle management, a 5% increase on last year
The year ahead
We have a very strong and recognisable employment brand. We will work to leverage this and will remain a highly regarded employer by:
continuing to look for ways to strengthen and vary the employment conditions we offer, and promote the unique public accountability position we hold in a Westminster system of government
maintaining our reputation as a safe, family friendly workplace with work-life balance employment conditions, coupled with flexible working practices and the merit-pay approach of our award
continuing to promote equity in all initiatives.
Under our ‘Influencing for Impact’ strategic focus area we will also be developing a new corporate website for the Office to include a modern careers and recruitment centre. This will further help us promote the Office as an attractive place to work and strengthen our employment brand even further (see page six for more details on our strategic focus areas).
Equity and support
Promoting equity
We are proactive in our efforts to ensure our workplace is free from harassment and discrimination, and take pride in having a work environment where all staff are treated fairly and equally.
All appointments and promotions are made on merit and on demonstration of faith with Office values.
The percentage of women in executive and senior management positions is almost 23 per cent. The number of women as a percentage of the workforce has risen to 49 per cent, and women now represent 44 per cent of middle management, up from 39 per cent last year, continuing growth year-on-year in women’s management representation.
For more information on equal employment opportunity groups and their distribution, see our ‘EEO, multicultural policies and disability action plan’ on page 89.
Supporting our staff
We have continued to promote health and wellbeing for our staff. The very popular initiative of the Office providing an assortment of fruit every day to promote healthier eating has continued, as well as making available a variety of non-caffeinated drink options. The Office once again provided support to staff competing in the Corporate Games and the Corporate Cup competitions, and Pilates classes are still running for staff during lunch-breaks. Office staff also compete regularly as teams in major sporting events such as the City to Surf. Free flu vaccinations were also made available to all staff.
For the first time this year we ran weekend safe cycling training courses using grants from the NSW Department of Environment, Climate Change and Water. These courses not only promote the health of our staff but also potentially reduce our carbon footprint by encouraging staff to cycle, rather than use more energy-hungry methods of transport. For more on initiatives aimed at reducing our carbon footprint refer to the ‘Workplace and environment’ section on page 38.
The Office’s employee assistance program provides an independent, confidential counselling service for staff and their immediate families. The counselling is provided by experienced, highly qualified professionals who have extensive training in workplace consulting.
Twelve people sought assistance through 51 counselling sessions during the year, and 100 staff and family members have used the service since it began in 2000.
Recreation Club
Our Recreation Club remains a key social mechanism for our staff, adding an essential balance of social and sporting activities into the working environment. The club is fully funded by staff and run by a representative committee.
About 80 per cent of staff are members of the Recreation Club and participate in a range of social and sporting activities. The club coordinates activities such as the Launch Picnic, Annual Dinner and a golf day. It also supports fundraising events including Australia’s Biggest Morning Tea and Movember. The Recreation Club also coordinates regular happy hours and participation in the annual City to Surf.
26
31
39
44
24
2006
2007
2008
2009
2010
Women in middle management %

The Audit Office of New South Wales AnnuAl RePORt 2009/10
34
Two of our key strategic focus areas are ‘Delivering Value’—our work delivers value to our clients, and ‘Influencing for Impact’—our clients act on our recommendations.
This year we developed a simulation based on these focus areas so our managers could see the impact of their decisions on the quality of the product and their relationship with our clients. All senior managers undertook the program in 2009–10.
Typical comments were:
I learnt we should spend more time on planning, writing for impact, and keeping an eye on the ‘bigger picture’.
I now understand the importance of delivering high quality service and building relationships with clients.
I feel more engagement with the organisation with a worthwhile common purpose.
11.5 training days per employee, our
biggest investment in several years
The year ahead
We will continue to increase our investment in training
in 2010–11 to increase productivity by teaching more effective methods of conducting our work.
Having delivered a leadership business simulation experience
to all levels of management, we will now work to
consolidate both business and leadership behaviours on the
job. We will take this year’s client relationship simulation to
the next level of managers during 2010–11, and look to
supplement this program with focused skills sessions.
A new key initiative under our ‘People Power’ strategic focus
area is to expand overseas secondment opportunities
to develop our staff. We will be negotiating for an increased number of
secondments in 2010–11.
Highly qualified people
The Office requires highly skilled staff in all areas to enable us to deliver the quality and value expected of a leading professional services organisation.
Nearly half of our financial audit staff are full members of the Institute of Chartered Accountants in Australia or CPA Australia. Most of the remainder— mainly undergraduates or recent graduates—are working towards gaining these qualifications. All our performance audit staff hold tertiary qualifications and nearly all belong to one or more professional associations. The majority of our corporate services managers hold tertiary qualifications.
The Office assists with qualifications and professional memberships by paying 100 per cent of tertiary and professional education fees for our graduates and school leavers, and by granting study leave. We also provide assistance to all staff for courses relevant to their development needs, and a number of staff are currently undertaking postgraduate studies.
Technical and leadership focus
All planned learning programs for 2009–10 took place as anticipated, including intensive technical and standards training for financial audit professionals.
We have continued to develop operational and behavioural competencies for all staff, and have competency-aligned technical and non-technical skills training programs, including a number of online offerings.
We remain committed to developing leadership excellence, and this year developed a ‘client value’ simulation experience for managers to teach an understanding of delivering a quality product. We schedule plain English writing workshops for all new employees to ensure our reports are clear, readable and have impact, and the Office also supports a wide variety of external conferences, courses and seminars for staff.
A new Learning Management System was implemented in 2009–10, ensuring each member of staff has full access to course enrolments, online training, staff surveys, quizzes and knowledge testing.
Shared learning
We have continued to encourage staff to be seconded to audit offices overseas, where they have gained valuable experience while imparting knowledge to their hosts. This year we have extended this program to include corporate services staff.
We have also continued the approach of including junior auditors from Papua New Guinea in our graduate program. These assignees are partially sponsored by AUSAID and partially funded by the Auditor-General’s Office of Papua New Guinea, and undertake the same work development and experiences as our other graduate staff.
Professional developmentStrong focus on people development
Case studythe mark of our success is the value we deliver 595
513 487
1,110
1,510
2006
2007
2008
2009
2010
2011
tar
get
People development spending $’000
1,508
10.0
6.6
8.0
5.0
11.512
2006
2007
2008
2009
2010
2011
tar
get
Training days per employee

In 2009–10 we focused on five strategic focus areas that will drive our activity until 2011
The year ahead
Our strategic plan has a number of initiatives within the ‘Double-Glazing the Glasshouse’ focus area aimed at improving our governance framework in order to drive ethical behaviour (see page six for more details on our strategic focus areas).
These initiatives include:
forming a group of dedicated risk management champions
performing a gap analysis on our current governance policies and practices
developing a reporting system that ensures no issues reported to our clients exist in the Office.
To build on work done in 2009–10 to develop a ‘Human Resources Strategy’ and ‘Information Management Technology Strategy and Roadmap’ we will be developing an ‘Internal Communications Strategy’ in 2010–11 to improve communication, collaboration and knowledge sharing and ensure staff have the information they need to do their job.
The Audit Office of New South Wales AnnuAl RePORt 2009/10
35Our strategic plan
Our strategic planning in 2009–10 again focused on five strategic areas that will guide our activity until April 2011:
— double-glazing the glasshouse
— putting the business into business teams
— people power — delivering value — influencing for impact.
A full description of these focus areas, including outcomes for April 2011, are presented on page six of this report.
This broader corporate strategic plan is supported by whole-of-office and business unit budgets. We also this year developed a ‘Human Resources Strategy’ and ‘Information Management Technology Strategy and Roadmap’ to underpin the corporate plan and bring greater focus to key functional areas of the Office.
Principal legislation unchanged
Our role is set by the Parliament of New South Wales. We are independent of the executive government and report directly to parliament providing assurance about NSW government operations.
The Auditor-General and the Audit Office of New South Wales operate under the Public Finance and Audit Act 1983. The most recent significant change to this legislation was in 2004, giving the Auditor- General the power to employ staff directly and set wages and conditions.
High standards of conduct
Our code of conduct governs the Office and its people in their day-to-day activities and decisions.
The code establishes a set of principles to guide our employees rather than detailed rules. It is based on our view that we do not expect to have to tell our people in detail what they should and should not do. We expect them to be professional and to appropriately apply our values.
A structured approach to risk management
We regularly review our key business risks as input into our strategic and business planning processes. We also apply risk management to all major projects, our financial and performance auditing services, and to key corporate service functions.
To reflect the effects of the recent global financial crisis, some of our business risks have changed. Our key business risks are:
our dependence on a third party audit methodology
our inability to attract and retain enough skilled people
insufficient funds to meet organisational needs
not meeting changing stakeholder expectations
changing public sector structure
not having the right technology to support our business.
The Office uses a structured approach to managing risks and opportunities. This approach is based on NSW Treasury’s Risk Management and Internal Control Matrix and the Australian/New Zealand Risk Management Standard–AS/NZS 4360:2004.
Our ‘Internal Audit and Risk Management Statement’ can be found in Appendix Seven.
Setting directionPlanning and risk management
The Audit Office of New South Wales AnnuAl RePORt 2009/10
36 30-day strategic reviews
The Office Executive and Leadership Team monitor progress against our strategic targets and focus areas every 30 days. The executive team reviews business unit and whole-of-office financial reports. These help us assess progress against longer-term financial targets.
Benchmarking
We also compare our performance with other state audit offices. For more details on benchmarking see Highlights, inside front cover.
Fraud control
In 2009–10, as in previous years, we reviewed our fraud control policy and processes by conducting a fraud risk assessment.
In 2010–11 we will again focus on improving our employee awareness of fraud responsibilities.
Complaints handling
Complaints about our services are taken seriously and are reviewed by the Office Executive. We regard complaints as opportunities for us to improve our services. We also collect information on any compliments and suggestions.
There were no formal complaints about our services in 2009–10. Our audit teams dealt with informal complaints in the normal course of their audits.
Monthly reviews
The Office Executive meets monthly to review operational issues relating to audit clients, people, audit processes and technology.
The team also regularly reviews our financial performance.
Information Management Technology Steering Committee
The committee regularly reports to the Office Executive and provides valuable input on how we manage our information and on the progress of key technology projects.
For further information on these projects see page 31.
Award-winning annual report
In recognition of our high standard in annual reporting, we received a gold award for the 2008–09 report from the Australasian Reporting Awards, following a gold award the previous year.
We voluntarily adopt full and open reporting on our performance in our annual report.
We comment extensively on what parliament and our audit clients think of our services, and on whether agencies have accepted and acted on our audit recommendations. This is the best way of measuring our success because we can only inform and influence— we do not have the power to direct the government and its agencies on how to operate or report.
Central government reporting
We report to a number of NSW government agencies on how we are contributing to whole-of-government initiatives. For example, we report to the Department of Services, Technology and Administration on how we minimise our energy usage and manage waste. (For more information see our ‘Workplace and environment’ section on page 38.) We also regularly report to NSW Treasury about our finances—both budgeted and actual.
Audit and Risk Committee
The Audit and Risk Committee met quarterly during 2009–10 to oversee the integrity of the Office’s financial information, internal controls, and compliance with laws, applicable government directions and codes of conduct. In addition, the committee held a separate meeting in September 2009 to review the Office’s financial report.
To comply with the requirements of the Treasury Circular NSW TC 09/08 August 2009, committee membership was reviewed and now includes the external Chair, Brian Suttor, independent member, Greg Fletcher, and the Deputy Auditor-General, Tony Whitfield. Jane Tebbatt and Chris Giumelli stepped down from the committee after the September 2009 meeting.
The committee’s external Chair, Brian Suttor, brings an independent perspective to the committee. He has considerable experience in auditing, having been a partner in a ‘Big Four’ accounting firm. The committee engaged a second external independent member in 2009–10. Greg Fletcher attended the last three meetings of 2009–10 and brings considerable experience in having been a senior partner in a ‘Big Four’ accounting firm and now an audit committee chair and member of a number of listed companies and public sector organisations. Both independent members have been appointed for a four-year term.
During 2009–10, the Deputy Auditor-General was a permanent member of the committee, bringing considerable expertise in senior management, public and private sector finance and auditing having been a partner in a ‘Big Four’ accounting firm.
Monitoring performance and qualityRegular reviews and independent scrutiny
We received a gold award for our 2009 annual report from
the Australasian Reporting Awards

The Audit Office of New South Wales AnnuAl RePORt 2009/10
37
The year ahead
WalterTurnbull have finished their three-year contract as our internal auditor. The Office has appointed another firm to provide the Office’s internal audit function for the next three years. In 2010–11, they will review a number of areas including:
management/financial reporting cycle
expenditure accounting cycle
payroll accounting cycle
quality management system
fraud control
IT staffing and workforce planning
new intranet development
records management and TRIM electronic records system
strategic planning
knowledge management
internal audit findings follow-up.
Audit and Risk Committee meetings attended
Who no.
Brian Suttor, Chair 5
Greg Fletcher 3
Tony Whitfield, Deputy Auditor-General
5
Jane Tebbatt, Director, Performance Audit Branch
1
Chris Giumelli, Director, Financial Audit Branch
2
External auditor 4
Internal auditor 4
Internal Audit and Risk Management Statement
The Audit Office of New South Wales is compliant with the core requirements of the Treasury Circular NSW TC 09/08 Internal Audit and Risk Management Policy. Our ‘Internal Audit and Risk Management Statement’ can be found in full in Appendix Seven.
Internal and external reviews
Internal reviews
WalterTurnbull, a chartered accounting and management consulting firm, provided internal audit services for the Office. They have considerable expertise in public sector internal audit and were very active in 2009–10, completing several reviews in the following areas:
— post implementation review of eTrack, our practice management system
— systems interfaces — asset management — staff opinion survey — Auditor-General’s
recommendations — legislative requirements — payroll and expenditure — quality management
system — follow-up review
of previous internal audit findings.
external reviews
Our annual external review found that our performance and financial auditing services complied with the international quality management standard ISO 9001.
Protecting privacy
The Office is committed to protecting an individual’s privacy as we collect, use or disclose personal information.
When dealing with private information, we apply the principles in the Privacy and Personal Information Act 1998 to ensure that the collection is lawful, direct, open and relevant; the information is stored securely; access is transparent, accessible and correct; its use is accurate and limited; and disclosure is restricted and safeguarded.
Freedom of information
The Office is committed to ensuring its administrative information is available to the public.
We received two freedom of information applications in 2009–10, both of which were unsuccessful as they did not relate to Office administrative matters. The Office is exempt from the requirements of the Freedom of Information Act 1989 for its auditing, investigative and reporting functions, however is covered for administrative matters.

The Audit Office of New South Wales AnnuAl RePORt 2009/10
38
All reports printed on 100% recyclable paper
4-star greenhouse building rating
maintained
The year ahead
Throughout next year we will continue to meet our occupational health and
safety obligations by:
implementing an OHS systems review project to ensure
all tools, mechanisms and strategies retain their validity
ensuring we adhere to the principles and targets of the Working Together
Strategy 2010–12
compulsory OHS training for our senior management
putting more emphasis on client sites in our risk management processes.
We have commissioned an external audit into our energy
use and anticipate a number of potential footprint reduction
proposals that we will consider as part of our overarching
strategy. We will continue to meet our green building rating of four stars however will look to reducing our reliance on the
purchase of green power to achieve this rating.
We will continue to investigate significantly
reducing the number of hard copy reports we produce.
Very few occupational health and safety incidents
The Office is committed to providing the best possible standard of occupational health and safety for employees on site and at client premises, and visitors to the Office. We strive for early intervention and support when staff are injured, to ensure every opportunity for a quick recovery and return to the workplace.
During the year, there were seven reported safety incidents, largely relating to travel to and from work. There was one new workers’ compensation claim and three ongoing.
Occupational Health and Safety Committee
The committee meets quarterly to review our safety management systems, monitor changes in law and recommend improvements.
Key occupational health and safety achievements in 2009–10 included:
— continuing ergonomic desk assessments with an emphasis on prevention
— a decrease in the number of reported incidents and in the number of new workers’ compensation cases.
The ‘Health’ component of occupational health and safety became one of our key focuses in 2008–09 in response to the premier’s ‘Healthy Workforce Policy’. This policy acted as a springboard for a number of key initiatives aimed at improving the health of our staff, initiatives we expanded even further in 2009–10. These initiatives are discussed in the ‘Staffing and recruitment’ section of this report on page 33.
Environmental action
Reducing our impact
The Office continued to implement its revised Waste Reduction and Purchasing Plan which guides us towards meeting environmental targets such as reducing our waste and increasing our recycling.
We have reduced the number of reports we print and now distribute more than 60 per cent electronically—via email or on the Office website. We release some of our publications in electronic format only, and those we do print are printed on 100 per cent recyclable paper. We currently use 50 per cent recycled content paper in all of our photocopiers and printers and we will continue to investigate ways to reduce the amount of printing we do.
The Office recycles 100 per cent of its waste paper using secure disposal processes. We also recycle 100 per cent of our ink and toner cartridges and ensure all laptop batteries are disposed of in an environmentally-friendly way.
We are also working to increase staff commitment to Waste Reduction and Purchasing Plan principles. For example, during the year we conducted periodic waste assessments to determine how we can minimise our waste and improve our recycling systems. We also introduced a recycling program in partnership with the management of our building.
To support our internal communications strategy on environmental action, our August 2009 staff Office Forum was dedicated to ’green’ topics and presentations, aimed at increasing staff awareness of the Office’s impact on the environment.
Greenhouse performance continues to improve
The Office again maintained its greenhouse building rating of four stars in line with government targets. We achieved this by:
— buying 40 per cent of our electricity as green
— encouraging staff to adopt energy efficient practices
— using timers on tenancy lights and on equipment
— buying energy efficient monitors and photocopiers
— continuing to choose and run small, fuel-efficient vehicles in our fleet and when choosing hired vehicles.
Workplace and environmentOur workplace is safe and we are reducing our environmental footprint
Right hand page: L–R Chris Bowdler, Heather Watson, Peter Boulous, Alison Gatt

ProfessionWe are known for influencing
auditing in Australia
We work closely with the auditing profession, commenting on
draft accounting and auditing standards, and also present
to various forums on auditing and governance
This helps us maintain our professional presence
and influence the direction of auditing in Australia
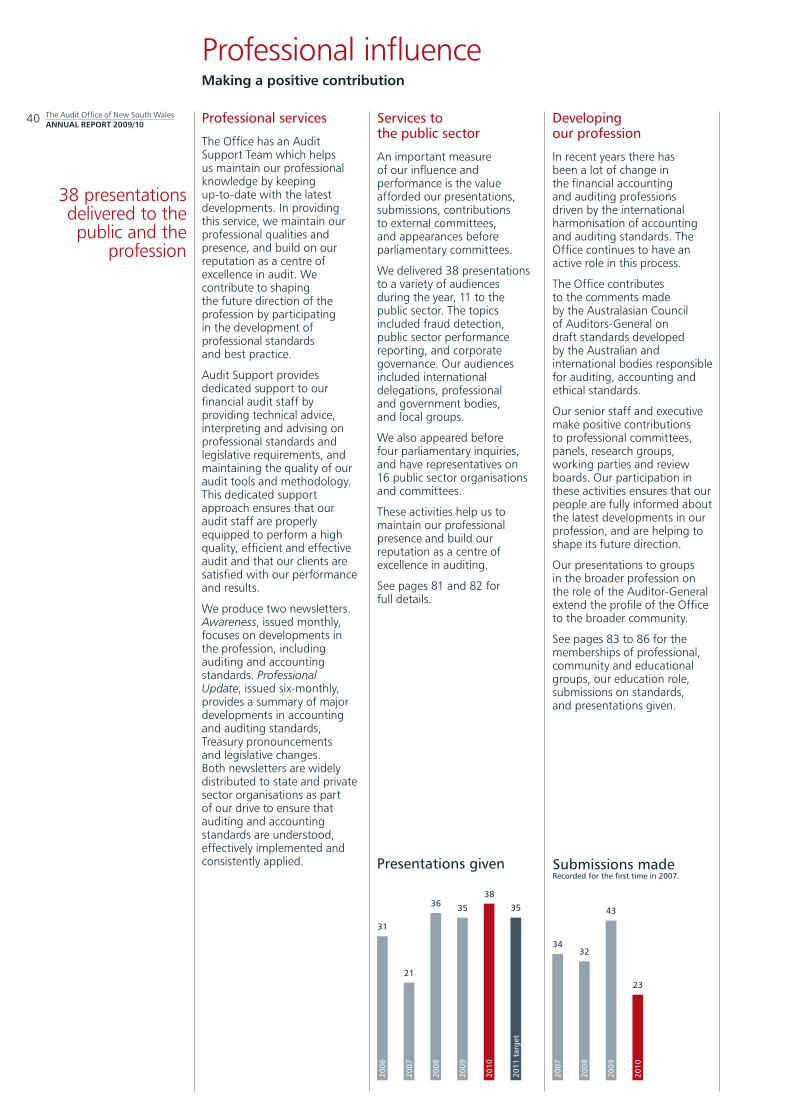
The Audit Office of New South Wales AnnuAl RePORt 2009/10
40
38 presentations delivered to the public and the
profession
Professional influenceMaking a positive contribution
Professional services
The Office has an Audit Support Team which helps us maintain our professional knowledge by keeping up-to-date with the latest developments. In providing this service, we maintain our professional qualities and presence, and build on our reputation as a centre of excellence in audit. We contribute to shaping the future direction of the profession by participating in the development of professional standards and best practice.
Audit Support provides dedicated support to our financial audit staff by providing technical advice, interpreting and advising on professional standards and legislative requirements, and maintaining the quality of our audit tools and methodology. This dedicated support approach ensures that our audit staff are properly equipped to perform a high quality, efficient and effective audit and that our clients are satisfied with our performance and results.
We produce two newsletters. Awareness, issued monthly, focuses on developments in the profession, including auditing and accounting standards. Professional Update, issued six-monthly, provides a summary of major developments in accounting and auditing standards, Treasury pronouncements and legislative changes. Both newsletters are widely distributed to state and private sector organisations as part of our drive to ensure that auditing and accounting standards are understood, effectively implemented and consistently applied.
Services to the public sector
An important measure of our influence and performance is the value afforded our presentations, submissions, contributions to external committees, and appearances before parliamentary committees.
We delivered 38 presentations to a variety of audiences during the year, 11 to the public sector. The topics included fraud detection, public sector performance reporting, and corporate governance. Our audiences included international delegations, professional and government bodies, and local groups.
We also appeared before four parliamentary inquiries, and have representatives on 16 public sector organisations and committees.
These activities help us to maintain our professional presence and build our reputation as a centre of excellence in auditing.
See pages 81 and 82 for full details.
Developing our profession
In recent years there has been a lot of change in the financial accounting and auditing professions driven by the international harmonisation of accounting and auditing standards. The Office continues to have an active role in this process.
The Office contributes to the comments made by the Australasian Council of Auditors-General on draft standards developed by the Australian and international bodies responsible for auditing, accounting and ethical standards.
Our senior staff and executive make positive contributions to professional committees, panels, research groups, working parties and review boards. Our participation in these activities ensures that our people are fully informed about the latest developments in our profession, and are helping to shape its future direction.
Our presentations to groups in the broader profession on the role of the Auditor-General extend the profile of the Office to the broader community.
See pages 83 to 86 for the memberships of professional, community and educational groups, our education role, submissions on standards, and presentations given.
2006
2007
2008
2009
2010
2011
tar
get
Presentations given
36
31
21
35
38
35
3234
2007
2008
Submissions madeRecorded for the first time in 2007.
2009
43
2010
23

The Audit Office of New South Wales AnnuAl RepoRt 2009/10
41
The year ahead
In 2010–11, we will maintain our professional presence by:
informing members of parliament, the profession and the broader community about our role and activities, and the value of our audits
continuing to make submissions on proposed changes to accounting and auditing standards
continuing to be involved in accounting and governance professional bodies’ education programs.
Under our ‘Influencing for Impact’ strategic focus area we will also be increasing our representation on key professional accounting bodies (see page six for more details on our strategic focus areas).
Influencing by educating, advising and training
educating
Those people aspiring to membership of the Institute of Chartered Accountants in Australia or CPA Australia are required to complete postgraduate level training set by those bodies. For many years Office staff have been involved in deciding the content of various training modules, developing material for the modules, leading training sessions and marking exams.
Office staff have also developed training materials and delivered lectures in public sector governance for the Chartered Secretaries of Australia Graduate Diploma in Applied Governance.
Advising
Through the Office’s interaction with Australian accounting bodies, and participation in their committees and working parties, these professional bodies gain a deep understanding of public sector issues. This understanding can then form the basis for an appropriate response in the form of lobbying, training and alerts to members.
training auditors
We provide our own approved training to Office staff in the form of courses organised and conducted internally, and those which are conducted by external providers.
The Office also presents training on behalf of accounting bodies to their broader membership. The Office is committed to the continuing professional development of its staff. For staff to progress to the level of senior auditor and above they must be full members of either CPA Australia or the Institute of Chartered Accountants in Australia and, by virtue of that membership, they undertake continuing professional development to a level and a standard approved by these accounting bodies.
Influencing through the Australasian Council of Auditors-General
The Office is an active participant in the Australasian Council of Auditors-General (ACAG) which was established in 1993 to encourage sharing and cooperation between audit offices in Australasia.
The Office provides administrative support for the ACAG Executive Director and the ACAG Financial Reporting and Auditing Committee (FRAC) which deals with accounting and auditing issues. Executives and staff of the Office chair, sponsor and support council subgroups, working parties, and committees of professional and standard-setting bodies. The Auditor-General is a member of the ACAG Executive.
The Office contributes to the development of the council’s position on various issues including submissions to public inquiries on matters of public sector accountability, and providing comments on accounting and audit standard setting in both international and Australian jurisdictions.
The Office is also an active participant in regional organisations such as the Pacific Association of Supreme Audit Institutions (PASAI) and the PASAI Regional Working Group on Environmental Auditing.
Audit_text_2010_ART+varnish_v2.indd 41 29/10/10 9:04 AM

The Audit Office of New South Wales AnnuAl RePORt 2009/10
42
The Office makes a significant contribution to the accounting profession through the involvement of its senior staff and executives at CPA Australia and the Institute of Chartered Accountants in Australia. Scott Stanton (Assistant Auditor-General, Financial Audit) is the current Chair of CPA Australia’s NSW Public Sector Committee. The NSW Public Sector Committee comprises representatives at the Chief Financial Officer level of Commonwealth, state and local government agencies.
During Scott’s current two year term as Chair, the committee created a public sector issues register that helps guide CPA Australia to deliver targeted services on topics of interest to its public sector members. The committee also initiated a submission to the NSW Public Accounts Committee on improving financial reporting from CPA Australia. Scott has chaired numerous CPA Australia events such as congress sessions and public sector leaders forums, and represents New South Wales in national CPA public sector group joint meetings.
Case studyDeveloping our profession
In March 2010, the Auditor-General attended the ACAG-CCOLA Public Sector Audit Forum in Vancouver hosted by the Canadian Council of Legislative Auditors (CCOLA), with the Australasian Council of Auditors-General (ACAG) in attendance as guests. CCOLA’s membership consists of the provincial Auditors General or Provincial Auditors of the Canadian provinces and the federal Auditor General, as well as one associate member—the Auditor General of Bermuda. The forum is held every two years with ACAG and CCOLA taking turns at hosting the event. The forum is an opportunity for participants to share knowledge in auditing and to learn lessons in international best practice. Topics in this year’s forum included:
— the use of technology and social media
— identification of risks and opportunities
— training solutions — collaborative audits — auditing in health
and education — environmental auditing.
The NSW Auditor-General also delivered a presentation and led a discussion group on ‘Monitoring the Federal Government’s Economic Stimulus Package’ as part of a broader international forum topic on ‘Auditing the Global Financial Crisis’.
Forums such as these give the Audit Office of New South Wales the opportunity to influence the auditing profession internationally as well as learn new ways to improve our own services to agencies and parliament.
Case studyInfluencing international audit practice
Right hand page: L–R Kristie Amey, Amy Minaskanians
FinancesWe break even financially
over the medium termWe aim to:
collect our debts within a reasonable time
pay our creditors promptly
break even over the medium term

The Audit Office of New South Wales AnnuAl RePORt 2009/10
44
$0.8 million loss (excluding
superannuation adjustments), the 5-year cumulative result outside our
medium-term break-even target
Financial performanceWorking towards our goal to break even over the medium term
Just outside our break-even target
The work of the Office is largely self-funded with most of our income coming from audit fees paid by our clients. We set these fees carefully to cover our expenses while maximising value for the NSW public sector. Unlike private sector auditors, we aim to break even overall rather than make a profit.
Our 2009–10 result was a loss of $0.8 million, excluding superannuation. Over the five years to 2009–10, the cumulative result was a surplus of $9.8 million representing seven per cent of turnover. This is outside our break-even target and will need close attention in the coming year.
Our 2009–10 revenue of $35.3 million was less than the previous year’s $36.4 million. Government agencies paid $28.6 million for the audit of their financial reports. Parliament contributed $5.8 million towards our performance audits and reports to parliament. Our total expenditure of $36.2 million in 2009–10 was $1.9 million more than the previous year’s $34.3 million.
Revenue decreased as a result of a four per cent charge-out rate reduction in 2009, whereas expenditure increased largely due to award increases and training-related expenditure. Interest income decreased marginally despite the maintenance of a healthy cash balance.
In monitoring our financial performance, we exclude the impact of the annual superannuation adjustments that affect our operating results. Like all government agencies with staff in the state’s defined benefit superannuation schemes, the schemes’ assessment of our liability to them varies substantially from year to year. These annual variations are outside our control and reflect the investment performance of the scheme and changes in actuarial assumptions.
These superannuation adjustments are fully reflected in our audited financial statements, but are excluded from the information presented here so we can focus on our own performance.
Budgeting
We are budgeting for a $1.0 million deficit in 2010–11. Revenue is expected to be $36.9 million, higher than the $35.3 million of 2009–10 reflecting a slight increase in our fees. We expect our expenditures to be slightly higher than 2009–10, mainly in remuneration due to award increases.
Our 2009–10 operating result was favourable to budget by $0.2 million. This was primarily because audit fees were $2.0 million more than budgeted, largely due to extra work we needed to do as a result of agency amalgamations.
Our expenses were also higher, specifically with regard to people development program costs which focused on technical and leadership training.
-1.0
2.2
2.6
3.7
2.1
2006
2007
2008
2009
2010
2011
tar
get
Operating results $mExcluding superannuation.
-0.8

The Audit Office of New South Wales AnnuAl RePORt 2009/10
45
The year aheadIn an effort to balance our budget and meet increased costs, including remuneration and training and development, our charge-out rates have been increased by four per cent for 2011 audits.
We will continue to pay close attention to the collection of our fees.
Our financial position is sound
Most of our assets and liabilities are of a financial rather than physical nature, as we do not own major buildings or machinery.
Our largest asset is cash with a balance of $11.8 million at 30 June 2010. This is an increase of $0.6 million from last year and is largely due to audit fees from increased activity and some strategic projects being deferred.
Our assets included $6.2 million for the Crown’s assumption of the liability for our staff’s long service leave entitlements. This offsets the liability in our accounts. We also have $3.2 million in receivables, mostly from government agencies for our auditing services.
Our liabilities at 30 June 2010 were $24.5 million, increased from $21.3 million in the previous year. Our largest liability was $13.3 million for superannuation and we also have a leave liability of $9.4 million.
Effective solvency, debtor management needs to improve
Our current ratio at 30 June 2010 shows we had $2.20 in current assets to meet every $1.00 of our current liabilities. This is a small decrease on the previous year’s ratio and a move closer to our target range of between one and two dollars.
Our debtors are paying us a little slower than in the previous year. In 2009–10, it took us an average of 44 days from invoice to collection, slightly up on last year’s average of 43 days. Our target is 35 days.
Timely creditor payments
During the year we paid 99 per cent of our creditors on time. We are expected to pay all creditors for their invoices received in one month no later than the end of the following month, unless contracts state otherwise.
For more detail on our performance with creditor payments, see page 92.
Financial positionOur financial management is sound
1.6
2.4
1.5 to 21.4
2.2 2.2
2006
2007
2008
2009
2010
2011
tar
get
Solvency — current ratio
44
35
2006
2007
2008
2009
2010
2011
tar
get
Debtor management — average days to collect
39
4346
43

The Audit Office of New South Wales AnnuAl RePORt 2009/10
46 Key financial statistics
three year trend
2007–08 2008–09 2009–10 $’000 $’000 $’000
Financial performance1
Total revenue 34,080 36,386 35,316
Total expenses 30,344 34,372 36,117
Profit/(loss) on disposal – 39 (40)
Operating profit/(loss) 3,736 2,053 (841)
Financial position2
Total assets 26,155 24,936 25,146
Accumulated funds 16,194 3,656 619
Solvency and debtor management
Current ratio 2.2 2.4 2.2
Average days to collect debts 46 43 44
2009–10 2009–10 2010–11Budget Actual Budget $’000 $’000 $’000
Performance against budget1
Revenue
Audit fees 26,607 28,587 30,408
Contribution by government 5,820 5,825 6,020
Interest 360 442 370
Other revenue 67 462 107
32,854 35,316 36,905
expenditure
Salaries and related expenses 28,015 27,464 31,508
Maintenance and other operating expenses 3,618 6,222 3,662
Contract audit agent costs 1,496 1,807 1,939
Depreciation and amortisation 876 664 807
34,005 36,157 37,916
Operating profit/(loss) (1,151) (841) (1,011)
1 Excludes superannuation adjustments of $275,0002 Includes superannuation adjustments

Financial report
Contents
Independent auditor’s report 48
Statement by Auditor-General of New South Wales 49
Statement of comprehensive income 50
Statement of financial position 51
Statement of cash flows 52
Statement of changes in equity 53
Notes to and forming part of the financial statements
1 Summary of significant accounting policies 54
2 Revenues 57
3 Salaries and related expenses 57
4 Contract audit agents costs 57
5 Depreciation and amortisation 57
6 Other operating expenses 58
7 Net profit/(loss) on disposal of plant, equipment and furniture 58
8 Current assets—receivables 58
9 Current assets—other 58
10 Non-current assets—plant, equipment and furniture 59
11 Intangible assets 60
12 Superannuation 61
13 Current liabilities —payables 64
14 Provisions 64
15 Employee benefits 65
16 Changes in equity 65
17 Auditor’s remuneration 65
18 Audit and Risk Committee 65
19 Commitments 66
20 Material assistance provided at no or nominal cost 66
21 Consultants engaged 66
22 Notes to the cash flow statement 66
23 Financial instruments 67

The Audit Office of New South Wales AnnuAl RePORt 2009/10
48 I have audited the accompanying financial report of The Audit Office of New South Wales (the “Audit Office”), which comprises the balance sheet as at 30 June 2010, the income statement, the statement of recognised income and expense, and the cash flow statement for the year ended on that date, a summary of significant accounting policies, other explanatory notes numbered 2 to 23 and the Auditor General of New South Wales’ declaration.
Directors’ Responsibility for the Financial Report
The Auditor General of New South Wales is responsible for the preparation and fair presentation of the financial report in accordance with Australian Accounting Standards (including the Australian Accounting Interpretations) and the Public Finance and Audit Act 1983, the Public Finance and Audit Regulation 2010 and the Treasurer’s Directions. This responsibility includes designing, implementing and maintaining internal control relevant to the preparation and fair presentation of the financial report that is free from material misstatement, whether due to fraud or error; selecting and applying appropriate accounting policies; and making accounting estimates that are reasonable in the circumstances.
Auditor’s Responsibility
My responsibility is to express an opinion on the financial report based on the audit. I have conducted an audit in accordance with Australian Auditing Standards. These Auditing Standards require that we comply with relevant ethical requirements relating to audit engagements and plan and perform the audit to obtain reasonable assurance as to whether the financial report is free from material misstatement.
An audit involves performing procedures to obtain audit evidence about the amounts and disclosures in the financial report. The procedures selected depend on the auditor’s judgement, including the assessment of the risks of material misstatement of the financial report, whether due to fraud or error. In making those risk assessments, the auditor considers internal control relevant to the Audit Office’s preparation and fair presentation of the financial report in order to design audit procedures that are appropriate in the circumstances, but not for the purpose of expressing an opinion on the effectiveness of the Audit Office’s internal control. An audit also includes evaluating the appropriateness of accounting policies used and the reasonableness of accounting estimates made by the Auditor General of New South Wales, as well as evaluating the overall presentation of the financial report.
I believe that the audit evidence we have obtained is sufficient and appropriate to provide a basis for our audit opinion.
Independence
In conducting my review, I have complied with the independence requirements of the Australian professional accounting bodies.
Auditor’s Opinion
In my opinion, the financial report presents fairly, in all material respects, the financial position of The Audit Office of New South Wales as at 30 June 2010, and of its financial performance, its cash flows and its changes in equity for the year ended in accordance with Australian Accounting Standards (including the Australian Accounting Interpretations) and the Public Finance and Audit Regulation 2010 and the Treasurer’s Directions.
Andrew Hoffmann Chartered Accountant Sydney, 13 September 2010
Independent Auditor’s Reportto the Members of the new South Wales Parliament

The Audit Office of New South Wales AnnuAl RePORt 2009/10
49Under section 41C of the Public Finance and Audit Act 1983, I state that, in my opinion, the accompanying financial statements and notes thereto exhibit a true and fair view of the financial position of the Audit Office of New South Wales at 30 June 2010 and the transactions for the year then ended.
I further state:
(a) that the financial statements and notes thereto comply with applicable Australian Accounting Standards (which include Australian Accounting Interpretations), the Public Finance and Audit Act 1983, the Public Finance and Audit Regulation 2010, and the Treasurer’s Directions.
(b) that I am not aware of any circumstances which would make any details in the financial statements misleading or inaccurate.
P Achterstraat Sydney, 13 September 2010
Statement by Auditor-General of New South Walesfor the year ended 30 June 2010

The Audit Office of New South Wales AnnuAl RePORt 2009/10
50
The Audit Office of New South WalesStatement of comprehensive income for the year ended 30 June 2010
Revenue
2010 2009note $’000 $’000
Audit fees 2(a) 28,587 29,885
Contributions by Government 2(b) 5,825 5,640
Interest income 442 503
Other revenue 2(c) 849 1,365
Total revenue 35,703 37,393 Expenses
Salaries and related expenses 3 27,577 25,625
Contract audit agents costs 4 1,807 1,593
Depreciation and amortisation 5 664 739
Maintenance 238 436
Rent 1,313 1,162
Finance costs 15 –
Other operating expenses 6 4,616 4,846
Total expenses excluding losses 36,230 34,401
Profit/(loss) on disposal 7 (40) 39
Total expenses 36,270 34,362
PROFIT/(LOSS) FOR THE YEAR (567) 3,031
Other comprehensive income
—Superannuation actuarial loss 12 (2,470) (15,569)
Other comprehensive income for the year (2,470) (15,569)
TOTAL COMPREHENSIVE LOSS FOR THE YEAR (3,037) (12,538)
The accompanying notes form part of these financial statements

The Audit Office of New South Wales AnnuAl RePORt 2009/10
51
The Audit Office of New South WalesStatement of financial position as at 30 June 2010
Assets
2010 2009note $’000 $’000
Current assets
Cash and cash equivalents 22(a) 11,845 11,227
Receivables 8 3,161 4,419
Work in progress 1,288 785
Other financial assets
—Crown acceptance of long service leave liability 15(b) 5,892 5,610
Other 9 474 313
Total current assets 22,660 22,354
non-current assets
Plant, equipment and furniture 10 1,702 1,951
Intangible assets 11 474 499
Other financial assets
—Crown acceptance of long service leave liability 15(b) 310 132
Total non-current assets 2,486 2,582
Total assets 25,146 24,936
Liabilities
Current liabilities
Fees in advance 108 169
Payables 13 1,145 1,141
Provisions 14 9,110 8,201
Total current liabilities 10,363 9,511
non-current liabilities
Payables 13 189 226
Provisions 14 13,975 11,543
Total non-current liabilities 14,164 11,769
Total liabilities 24,527 21,280
Net assets 619 3,656
Equity
Accumulated funds 16 619 3,656
Total equity 619 3,656
The accompanying notes form part of these financial statements

The Audit Office of New South Wales AnnuAl RePORt 2009/10
52
The Audit Office of New South WalesStatement of cash flows for the year ended 30 June 2010
2010 2009$’000 $’000
Inflows Inflows note (Outflows) (Outflows)
Cash flows from operating activities
Receipts from operations 39,959 40,460
Payments to suppliers and employees (39,337) (37,980)
Interest received 384 598
Net cash generated by operating activities 22(b) 1,006 3,078
Cash flows from investing activities
Proceeds from disposal of plant, equipment and furniture
–
40
Purchase of plant, equipment and furniture (92) (520)
Leasehold improvements (106) (47)
Purchase of management information systems (190) (68)
Net cash used in investing activities (388) (595)
Net increase in cash and cash equivalents 618 2,483
Cash and cash equivalents at the beginning of the financial year
11,227
8,744
Cash and cash equivalents at the end of the financial year
22(a)
11,845
11,227
The accompanying notes form part of these financial statements

The Audit Office of New South Wales AnnuAl RePORt 2009/10
53
The Audit Office of New South WalesStatement of changes in equity for the year ended 30 June 2010
2010Accumulated
Fundsnote $'000
Balance at 1 July 2009 3,656
Loss for the year (567)
Other comprehensive income
Superannuation actuarial loss 12 (2,470)
Total other comprehensive income (2,470)
Total comprehensive loss for the year (3,037)
Balance at 30 June 2010 619
Balance at 1 July 2008 16,194
Profit for the year 3,031
Other comprehensive income
Superannuation actuarial loss 12 (15,569)
Total other comprehensive income (15,569)
Total comprehensive income for the year (12,538)
Balance at 30 June 2009 3,656
The accompanying notes form part of these financial statements

The Audit Office of New South Wales AnnuAl RePORt 2009/10
54
The Audit Office of New South Walesnotes to and forming part of the financial statements for the year ended 30 June 2010
1 Summary of significant accounting policies
(a) Reporting entity
Schedule 2 of the Public Finance and Audit Act 1983 designates the Audit Office of New South Wales (the “Office”) as a statutory body for reporting purposes.
These financial statements have been authorised for issue by the Auditor-General on 13 September 2010.
(b) Basis of preparation
The Office prepares its financial statements as general purpose financial statements on an accruals basis to comply with:
— applicable Australian Accounting Standards (which include Australian Accounting Interpretations);
— the requirements of the Public Finance and Audit Act 1983 and the Public Finance and Audit Regulation 2010 and Treasurer’s Directions.
Where these requirements are inconsistent, we apply the legislative provisions. There were no inconsistencies in the years covered in this financial report.
Where there was no specific accounting standard or other authoritative pronouncements of the AASB, we considered the hierarchy of other pronouncements as outlined in AASB 108—Accounting Policies, Changes in Accounting Estimates and Errors.
The Office uses the historical cost convention to prepare its financial report unless otherwise stated.
Judgements, key assumptions and estimations that management has made are disclosed in the relevant notes to the financial statements.
We rounded all amounts to the nearest one thousand dollars and expressed them in Australian currency.
(c) Revenue recognition
Revenue is measured at fair value of the consideration or contribution received or receivable and represents amounts receivable for services rendered in the normal course of our operations, net of GST.
(i) Rendering of services—audit fees
Audit fees are recognised when an invoice is raised, except to the extent the invoiced amount is in excess of the services provided. Any excess amounts are treated as fees in advance.
(ii) Contributions by Government
Treasury contributions for the Auditor-General’s reports and performance audits are recognised in the statement of comprehensive income as related services are performed.
(iii) Interest income
Interest income is accrued on a time basis using the effective interest method as set out in AASB 139—Financial Instruments: Recognition and Measurement.
(d) employee benefits
(i) Salaries and wages, annual leave and sick leave
Liabilities for salaries and wages, including non-monetary benefits, annual leave and sick leave are measured on an undiscounted basis. Where annual leave is not expected to be settled within 12 months, we account for it as a long-term benefit and use the present value method.
We do not recognise a liability for unused non-vested sick leave entitlement because we consider that the sick leave taken in the future will be greater than the benefits accrued in the future.
(ii) long service leave
The Crown Finance Entity takes on the Office’s liability for long service leave. The Office accounts for the liability and then offsets it by showing a corresponding asset, “Crown Acceptance of Long Service Leave Liability”. It is a statutory asset/liability and not considered as a financial asset/liability within the scope of AASB 7—Financial Instruments: Disclosures.
We recognise our long service leave liability as long-term employee benefit and measure it for all employees with five or more years of service. We use the present value method based on remuneration rates approved to be payable post 30 June. When calculating the liability we apply oncosts.
(iii) Superannuation
The superannuation schemes for the Office are:
— the State Superannuation Scheme (SSS) — the State Authorities Superannuation
Scheme (SASS) — the State Authorities Non Contributory
Superannuation Scheme (SANCS— Basic Benefits Scheme)
— the First State Super Scheme (FSS) and other schemes to receive Superannuation Guarantee Contributions.
The first three are defined benefit schemes—at least a component of the final benefit is derived from a multiple of member salary and years of membership. The Pooled Fund holds in trust the investments of these closed NSW public sector superannuation schemes. These schemes are closed to new members. Note 12 details the reserves, overfundings, provisions and other disclosures provided by the Scheme actuary.
Actuarial gains and losses are recognised immediately in other comprehensive income in the year in which they occur.
The Office has no ongoing liability for First State Superannuation (FSS) and the other SGC schemes because they are accumulation schemes.

The Audit Office of New South Wales AnnuAl RePORt 2009/10
55
The Audit Office of New South Walesnotes to and forming part of the financial statements for the year ended 30 June 2010
(e) Accounting for the goods and services tax (GSt)
We recognise revenues, expenses and assets net of GST, except for:
— the GST the Office incurs as a purchaser that we cannot recover from the Australian Taxation Office, which is recognised as part of the cost of buying an asset or as part of an item of expense.
— receivables and payables, which include GST.
Cash flows are included in the statement of cash flows on a gross basis. We classify the GST component of cash flows from investing and financing activities which is recoverable from, or payable to, the taxation authority as operating cash flows.
(f) Plant, equipment and furniture
We show plant, equipment and furniture at historic cost less accumulated depreciation, which we consider as an acceptable surrogate for fair value of these assets. This is because the difference between fair value and depreciated cost is considered immaterial.
We review the carrying values to determine whether events or changes in circumstances indicate that these values may be impaired.
If the carrying value of the asset exceeds its estimated recoverable amount, it is written down to its recoverable amount. This amount is the higher of the depreciated cost and the value of using it. Impairment losses are recognised in the statement of comprehensive income.
We capitalise items costing $1,000 or more. We depreciate these assets on a straight line basis over their estimated useful lives. The rates we use are:
— computer equipment 33.3% — office equipment 20% — furniture and fittings 10% — leasehold improvements over the term
of the lease.
We have included the costs of restoration for our leasehold improvements in accordance with AASB 116—Property, Plant and Equipment.
The gain or loss on disposal or retirement of an item is determined as the difference between the sales proceeds and the carrying amount of the asset and is recognised in the statement of comprehensive income.
(g) Intangible assets
The Office uses third party Audit Methodology software and Management Information System (MIS) software and has capitalised the licences and associated costs in accordance with AASB 138—Intangible Assets.
We show these assets at historical cost less accumulated amortisation. We consider the cost of acquisition as its fair value. As a not-for-profit entity, the Office is effectively exempted from AASB 136—Impairment of Assets and Impairment Testing.
We amortise our intangible assets on a straight line basis over their estimated useful lives. The rates we use are:
— audit methodology software 33.3% — MIS software 20%.
(h) Receivables
The Office recognises receivables initially at fair value, based on the invoice amount. Because our receivables are due for settlement within 30 days from the date of issue of the invoice, we do not amortise or discount their value as the effect of discounting is immaterial.
These receivables are reviewed on an ongoing basis. When there is objective evidence that the Office will not be able to collect all amounts due, an allowance for doubtful debts is established. The amount of the allowance is the difference between the asset’s carrying amount and the present value of estimated future cash flows, discounted at the effective rate. Bad debts are written off.
(i) Work in progress
We state work in progress as the cost of staff directly engaged in financial audit services plus direct expenses not yet invoiced. Work in progress is not a financial asset within the scope of AASB 7.
(j) Payables
The Office carries liabilities for trade creditors and other payables, which are initially recognised at fair value, usually based on the transaction cost or face value. These payables are subsequently measured at an amortised cost using the effective interest rate method. Trade payables with no stated interest rate are measured at the original invoice amount where the effect of the discounting is immaterial.
(k) leases
The Office leases assets using operating leases. We recognise operating lease payments in the statement of comprehensive income in the periods we incur them, using a straight line basis over the period of the lease. Our operating leases are for office accommodation and motor vehicles.

The Audit Office of New South Wales AnnuAl RePORt 2009/10
56
The Audit Office of New South Walesnotes to and forming part of the financial statements for the year ended 30 June 2010
(l) Provisions
The Office recognises provisions when there are legal or constructive obligations as a result of a past event, it is probable that an outflow of resources will be required to settle the obligation and a reliable estimate can be made of the amount of the obligation.
We recognise provisions for employee benefits and the restoration costs of our leasehold improvements asset.
(m) Financial instruments
Financial instruments generate financial assets or liabilities (or equity instruments) for the Office or another party. These include cash and cash equivalents and receivables. Note 23 discloses the credit risk, liquidity risk and market risk of financial instruments.
(n) Comparatives
Where necessary, we have reclassified and repositioned comparatives to be consistent with current year disclosures except when an Australian accounting standard permits or requires otherwise.
(o) Accounting standards and interpretations issued but not yet operative
At the reporting date, a number of accounting standards and interpretations adopted by the AASB had been issued but not yet operative and have not been early adopted by the Office. The initial application of these standards will have no impact on the financial results of the Office. The standards are operative for annual reporting periods beginning on or after 1 January 2010.
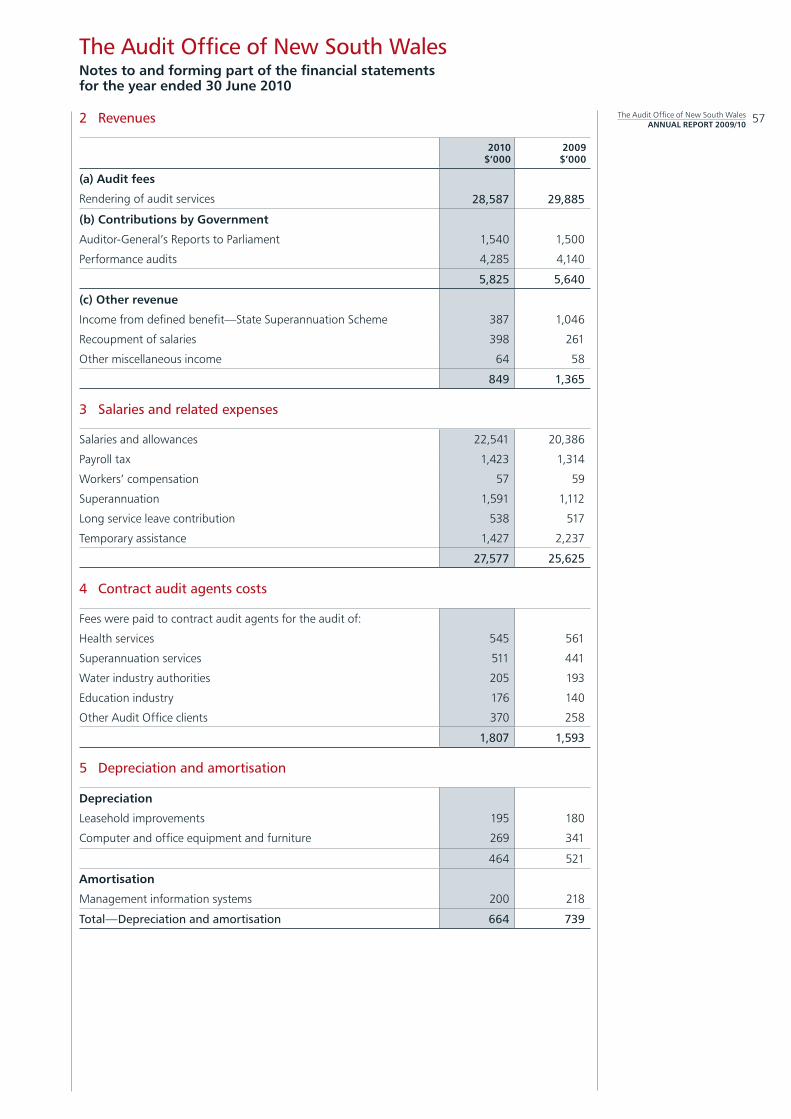
The Audit Office of New South Wales AnnuAl RePORt 2009/10
57
The Audit Office of New South Walesnotes to and forming part of the financial statements for the year ended 30 June 2010
2 Revenues
2010 2009$’000 $’000
(a) Audit fees
Rendering of audit services 28,587 29,885
(b) Contributions by Government
Auditor-General’s Reports to Parliament 1,540 1,500
Performance audits 4,285 4,140
5,825 5,640
(c) Other revenue
Income from defined benefit—State Superannuation Scheme 387 1,046
Recoupment of salaries 398 261
Other miscellaneous income 64 58
849 1,365
3 Salaries and related expenses
Salaries and allowances 22,541 20,386
Payroll tax 1,423 1,314
Workers’ compensation 57 59
Superannuation 1,591 1,112
Long service leave contribution 538 517
Temporary assistance 1,427 2,237
27,577 25,625
4 Contract audit agents costs
Fees were paid to contract audit agents for the audit of:
Health services 545 561
Superannuation services 511 441
Water industry authorities 205 193
Education industry 176 140
Other Audit Office clients 370 258
1,807 1,593
5 Depreciation and amortisation
Depreciation
Leasehold improvements 195 180
Computer and office equipment and furniture 269 341
464 521
Amortisation
Management information systems 200 218
Total—Depreciation and amortisation 664 739

The Audit Office of New South Wales AnnuAl RePORt 2009/10
58
The Audit Office of New South Walesnotes to and forming part of the financial statements for the year ended 30 June 2010
6 Other operating expenses
2010 2009$’000 $’000
Fees for services rendered 913 1,112
Staff development and training (excluding salaries) 1,532 1,111
Consultants 66 674
Travelling 703 633
Telecommunications 401 332
Motor vehicle running 216 263
Stores 158 234
Printing 198 109
Other general expenses 429 378
4,616 4,846
Fees for services rendered includes payments for taxation and actuarial services on financial audits $357,000 (2009: $361,000), employee related services $122,000 ($317,000), performance audits $66,000 ($41,000) and information technology costs $132,000 (102,000).
Other general expenses include an amount representing the movement in the direct costs of the valuation of work in progress, calculated in accordance with AASB 102—Inventories. For the year ended 30 June 2010, the amount is $6,000. For the prior year, the figure was $32,000.
7 Net profit/(loss) on disposal of plant, equipment and furniture and intangible assets
Computer and office equipment and furniture (7) 39
Intangible assets (33) –
(40) 39
8 Current assets—receivables
Audit fee debtors (less allowance for doubtful accounts nil; (2009—nil))
2,750
4,007
Miscellaneous debtors 411 412
3,161 4,419
9 Current assets—other
Prepayments 211 127
Accrued income 263 186
474 313

The Audit Office of New South Wales AnnuAl RePORt 2009/10
59
The Audit Office of New South Walesnotes to and forming part of the financial statements for the year ended 30 June 2010
10 Non-current assets—plant, equipment and furniture
2010 2009$’000 $’000
Office equipment
Gross carrying amount 258 218
Accumulated depreciation (182) (156)
Net carrying amount 76 62
Computer and related equipment
Gross carrying amount 1,101 1,192
Accumulated depreciation (836) (743)
Net carrying amount 265 449
Furniture and fittings
Gross carrying amount 301 287
Accumulated depreciation (169) (141)
Net carrying amount 132 146
leasehold improvements
Gross carrying amount 1,954 1,848
Restoration cost 324 300
Accumulated amortisation (1,049) (854)
Net carrying amount 1,229 1,294
Total plant, equipment and furniture at net carrying amount 1,702 1,951
The following table shows how we reconciled the carrying amounts of each class of plant, equipment and furniture at the beginning and end of the current and previous financial years.
Office
equipment $’000
Computer and Related equipment
$’000
Furniture
and Fittings $’000
leasehold Improve-
ments $’000
tOtAl $’000
2010
Carrying amount as at 1 July 62 449 146 1,294 1,951
Additions 40 36 16 130 222
Disposals – (127) (2) – (129)
Depreciation expense (26) (214) (29) (195) (464)
Write-back of depreciation on disposal
–
121
1
122
Carrying amount as at 30 June 76 265 132 1,229 1,702
2009
Carrying amount as at 1 July 68 238 173 1,427 1,906
Additions 14 504 2 47 567
Disposals (1) (491) (1) – (493)
Depreciation expense (20) (293) (28) (180) (521)
Write-back of depreciation on disposal
1
491
–
–
492
Carrying amount as at 30 June 62 449 146 1,294 1,951

The Audit Office of New South Wales AnnuAl RePORt 2009/10
60
The Audit Office of New South Walesnotes to and forming part of the financial statements for the year ended 30 June 2010
11 Intangible assets
2010 2009$’000 $’000
Audit methodology software
Gross carrying amount 504 504
Accumulated amortisation (481) (434)
Net carrying amount 23 70
Management information systems
Gross carrying amount 1,251 1,168
Accumulated amortisation (800) (739)
Net carrying amount 451 429
Total intangbile assets at net carrying amount 474 499
The following table shows how we reconciled our carrying amounts of each class of intangible assets at the beginning and end of the current and previous financial years.
Audit
Methodology Software
$’000
Management Information
Systems Software
$’000
tOtAl $’000
2010
Carrying amount as at 1 July 70 429 499
Additions – 208 208
Disposals – (125) (125)
Amortisation expense (47) (153) (200)
Write-back of amortisation on disposal – 92 92
Carrying amount as at 30 June 23 451 474
2009
Carrying amount as at 1 July 117 532 649
Additions – 68 68
Amortisation expense (47) (171) (218)
Carrying amount as at 30 June 70 429 499

The Audit Office of New South Wales AnnuAl RePORt 2009/10
61
The Audit Office of New South Walesnotes to and forming part of the financial statements for the year ended 30 June 2010
12 Superannuation
All funds from 30 June 2009 have remained at an unfunded liability position, with a net movement of $2,195,000. Employer contributions to all funds have been suspended since 1 December 2005.
The following information has been prepared by the Scheme actuary.
Reconciliation of the present value of the defined benefit obligation
2010 2009$’000 $’000
Present value of partly funded defined benefit obligation at beginning of the year
65,128
53,516
Current service cost 688 558
Interest cost 3,564 3,427
Contributions by Fund participants 434 446
Actuarial losses 2,005 9,884
Benefits paid (2,879) (2,703)
Present value of partly funded defined benefit obligation at end of the year
68,940
65,128
Reconciliation of the fair value of Fund assets
Fair value of Fund assets at beginning of the year 54,025 62,258
Expected return on Fund assets 4,527 4,963
Actuarial losses (465) (10,939)
Contributions by Fund participants 434 446
Benefits paid (2,879) (2,703)
Fair value of Fund assets at end of the year 55,642 54,025
Reconciliation of the assets and liabilities recognised in statement of financial position
Present value of partly funded defined benefit obligation at end of year
68,940
65,128
Fair value of Fund assets at end of year (55,642) (54,025)
Net liability/(asset) recognised in statement of financial position at end of year
13,298
11,103
expense/income recognised in income statement
Components Recognised in Income Statement
Current service cost 688 558
Interest cost 3,564 3,427
Expected return on Fund assets (net of expenses) (4,527) (4,963)
Income recognised (275) (978)
Amounts recognised in other comprehensive income
Actuarial losses 2,470 20,823
Movement in adjustment for limitation on net asset – (5,254)
2,470 15,569

The Audit Office of New South Wales AnnuAl RePORt 2009/10
62
The Audit Office of New South Walesnotes to and forming part of the financial statements for the year ended 30 June 2010
Cumulative amount recognised in other comprehensive income
2010 2009 2008 2007 2006$‘000 $‘000 $‘000 $‘000 $‘000
Actuarial (gains)/losses 2,470 20,823 9,283 (7,358) (10,545)
Movement in adjustment for limitation on net asset – (5,254) (7,433) 9,202 3,484
2,470 15,569 1,850 1,844 (7,061)
Cumulative (gains)/ losses recognised 17,142 14,672 (897) (2,747) (4,591)
Fund assets
The percentage invested in each asset class at the balance sheet date:
30 Jun 2010
Australian equities 31.00%
Overseas equities 26.80%
Australian fixed interest securities 6.10%
Overseas fixed interest securities 4.30%
Property 9.50%
Cash 9.60%
Other 12.70%
Fair value of Fund assets
All Fund assets are invested by SAS Trustee Corporation (STC) at arm’s length through independent fund managers.
expected rate of return on assets
The expected return on assets assumption is determined by weighting the expected long-term return for each asset class by the target allocation of assets to each class. The returns used for each class are net of investment tax and investment fees.
Actual return on Fund assets
2010 2009$’000 $’000
Actual return on Fund assets 4,923 (6,040)
Valuation method and principal actuarial assumption at the balance sheet date
(a) Valuation method
The Projected Unit Credit (PUC) valuation method was used to determine the present value of the defined benefit obligations and the related current service costs. This method sees each period of service as giving rise to an additional unit of benefit entitlement and measures each unit separately to build up the final obligation.
(b) economic assumptions
30 Jun 2010
Salary increase rate (excluding promotional increases) 3.5%
Rate of CPI Increase 2.5%
Expected rate of return on assets 8.60%
Discount rate 5.17%

The Audit Office of New South Wales AnnuAl RePORt 2009/10
63
The Audit Office of New South Walesnotes to and forming part of the financial statements for the year ended 30 June 2010
(c) Demographic assumptions
The demographic assumptions at 30 June 2010 are those that were used in the 2009 triennial actuarial valuation. The triennial review report is available from the NSW Treasury website.
Historical information
2010 2009 2008 2007 2006$‘000 $‘000 $‘000 $‘000 $‘000
Present value of defined benefit obligation 68,940 65,128 53,515 54,102 54,286
Fair value of Fund assets (55,642) (54,025) (62,258) (70,587) (62,473)
(Surplus)/deficit in Fund 13,298 11,103 (8,743) (16,485) (8,187)
Experience adjustments —Fund liabilities 2,005 9,884 (854) (3,284) (6,534)
Experience adjustments —Fund assets 465 10,939 10,136 (4,075) (4,011)
expected contributions
2010 2009$’000 $’000
Expected employer contributions to be paid in the next reporting period – –
Funding arrangements for employer contributions
(a) Surplus/deficit
The following is a summary of the 30 June 2010 financial position of the Fund calculated in accordance with AAS 25—Financial Reporting by Superannuation Plans.
Accrued benefits 49,283 48,835
Net market value of Fund assets (55,642) (54,025)
Net (surplus)/deficit (6,359) (5,190)
(b) Contribution recommendations
Recommended contribution rates for the Office are:
SASS SAnCS SSS
Multiple of member contributions – – –
% member salary – – –
(c) Funding method
Contribution rates are set after discussions between the Office, STC and NSW Treasury.
(d) economic assumptions
The economic assumptions adopted for the 2009 actuarial review of the Fund were:
Weighted-average assumptions
Expected rate of return on Fund assets backing current pension liabilities 8.30% pa
Expected rate of return on Fund assets backing other liabilities 7.30% pa
Expected salary increase rate 4.00% pa
Expected rate of CPI increase 2.50% pa
nature of assets/liabilities
If a surplus exists in the Office’s interest in the Fund, the Office may be able to take advantage of it in the form of a reduction in the required contribution rate, depending on the advice of the Fund’s actuary.
Where a deficiency exists, the Office is responsible for any difference between the Office’s share of Fund assets and the defined benefit obligation.

The Audit Office of New South Wales AnnuAl RePORt 2009/10
64
The Audit Office of New South Walesnotes to and forming part of the financial statements for the year ended 30 June 2010
13 Payables
2010 2009$’000 $’000
Current
Salaries and related expenses 420 258
Payroll tax 98 113
Unremitted GST 288 311
Contract audit agent costs 40 10
Other creditors 299 449
1,145 1,141
non-current
Rental incentive 189 226
14 Provisions
Current
Annual leave (a) 2,377 2,002
Long service leave (b) 5,892 5,610
Accrued oncosts 841 589
9,110 8,201
non-current
Superannuation (note 12) 13,298 11,103
Long service leave (b) 310 132
Accrued oncosts 28 8
Restoration costs (c) 339 300
13,975 11,543
(a) Annual leave
The liability at 30 June 2010 was $2,377,000 (2009: $2,002,000). This is based on leave entitlements at 30 June using remuneration rates approved to be payable post 30 June.
The value of annual leave expected to be taken within 12 months is $1,681,000 and $696,000 after 12 months.
leave taken and entitlement for the year are as follows:
Balance at beginning of the financial year 2,002 1,757
Less: Value of leave taken during the year 1,627 1,366
375 391
Add: Value of increased entitlement during the year 2,002 1,611
Balance at the end of the financial year 2,377 2,002
The amount of annual leave as disclosed above is increased by oncosts in the determination of the total provision.
(b) long service leave
The total liability at 30 June 2010 was $6,202,000 (2009: $5,742,000) which we show as current $5,892,000 ($5,610,000) and non-current $310,000 ($132,000). This liability comprises:
Short term—expected to be settled within 12 months 182 598
Long term—not expected to be settled within 12 months 6,020 5,144
6,202 5,742
We contributed $538,000 (2009: $517,000) to the Crown Finance Entity pool account during this financial year. Re-imbursements from the Crown Finance Entity because of payments to staff, or transfers of entitlements to other agencies, were $637,000 ($1,021,000).
The amount of long service leave as disclosed above is increased by oncosts in the determination of the total provision.

The Audit Office of New South Wales AnnuAl RePORt 2009/10
65
The Audit Office of New South Walesnotes to and forming part of the financial statements for the year ended 30 June 2010
(c) Restoration costs
The costs of restoration for the leasehold improvements at 1 Margaret Street are recognised as a provision in accordance with AASB 137—Provisions, Contingent Liabilities and Contingent Assets.
15 Employee benefits
(a) liability
The aggregate employee benefit liability recognised and included in the financial statements is as follows:
2010 2009$’000 $’000
Provision for employee benefits:
Current (note 14) 9,110 8,201
Non-current (note 14) 13,637 11,243
Accrued salaries and related expenses (note 13) 518 371
Balance at the end of the financial year 23,265 19,815
The aggregate employee benefit liability disclosed includes liabilities from providing employee benefits and liabilities relating to payroll tax and other similar on-costs.
(b) Asset
The aggregate employee benefit asset recognised and included in the financial statements is as follows:
Current
Crown acceptance of long service leave liability 5,892 5,610
non-Current
Crown acceptance of long service leave liability 310 132
Balance at the end of the financial year 6,202 5,742
16 Changes in equity
Accumulated Funds
Balance at beginning of the financial year 3,656 16,194
Profit/(loss) for the year (567) 3,031
Superannuation actuarial loss (2,470) (15,569)
Balance at the end of the financial year 619 3,656
17 Auditor’s remuneration
Audit fees 37 30
In May 2008, the Governor appointed Mr Andrew Hoffmann, a partner of Nexia Court & Co, to audit our accounts for a period of three years, commencing in the 2007-08 financial year. Nexia Court & Co does not provide any other services to the Office.
18 Audit and Risk Committee
The Office has appointed two independent members to its Audit and Risk Committee. Mr Brian Suttor was appointed as chair on 28 November 2008 and is paid $12,000 per annum. Mr Greg Fletcher was appointed as a member on 8 December 2009 and is paid $1,200 per meeting.

The Audit Office of New South Wales AnnuAl RePORt 2009/10
66
The Audit Office of New South Walesnotes to and forming part of the financial statements for the year ended 30 June 2010
19 Commitments
Commitments for leased office accommodation and motor vehicles under operating leases are:
2010 2009$’000 $’000
Lease commitments:
not later than one year 1,168 1,187
later than one year but not later than five years 4,924 4,780
later than five years 1,468 2,771
7,560 8,738
The Office occupied new premises during 2004 in 1 Margaret Street, Sydney, under a lease agreement for floor space to expire in July 2016.
Our commitments include GST of $687,000 (2009: $794,000). A contingent asset exists for the calculated GST, being an input tax credit recoverable from the Australian Taxation Office after this payment.
20 Material assistance provided at no or nominal cost
Audit clients provide, at no cost, accommodation and facilities at their premises for staff of the Office during our audits. It is not possible to quantify the cost of providing these facilities.
21 Consultants engaged
During the year the Audit Office engaged five consultants at a total cost of $66,000. This compares with eight last year at a cost of $674,000.
22 Notes to the statement of cash flows
(a) Cash and cash equivalents
For the purposes of the statement of cash flows, the Office considers cash and cash equivalents to include cash on hand and in the bank. At 30 June 2010, cash as shown in the statement of cash flows of $11,845,000 (2009: $11,227,000) is equal to the amount shown in the statement of financial position.
(b) Reconciliation of net cash provided by operating activities to operating result
Operating profit/(loss) (567) 3,031
Depreciation and amortisation 664 739
Net profit/(loss) on disposal of plant, equipment and furniture and intangible assets
(40) 39
Finance costs 15 –
Increase in superannuation income – (978)
(Increase)/decrease in receivables 1,258 (18)
(Increase)/decrease in work in progress (503) 65
(Increase)/decrease in other current assets (161) 62
Increase/(decrease) in fees in advance (61) 65
Decrease in payables (13) (117)
Increase in provisions 334 268
Net cash provided by operating activities 1,006 3,078
The decrease in payables excludes accrual on capital expenditure of $20,000 and the movements in provisions do not include the increase in leasehold restoration costs for $24,000, superannuation loss of $2,470,000 and finance costs of $24,000.

The Audit Office of New South Wales AnnuAl RePORt 2009/10
67
The Audit Office of New South Walesnotes to and forming part of the financial statements for the year ended 30 June 2010
23 Financial instruments
The Office’s principal financial instruments and the main risks associated are outlined below. These financial instruments arise directly from our operation. We do not enter into or trade financial instruments for speculative purposes.
Quantitative and qualitative disclosures together with the Office’s objectives, policies and processes for measuring and managing risk are included throughout this financial report.
The Office’s Strategy Group has overall responsibility for the establishment and oversight of risk management and reviews and agreed policies for managing each of these risks. We establish risk management policies to identify and analyse the risks faced by the Office, to set risk controls and to monitor risks. Compliance with policies is reviewed by the Audit and Risk Committee on a continuous basis.
(a) Financial instrument categories
note
Category
Carrying Amount
2010 $’000
Carrying Amount
2009 $’000
Financial asset
Class:
Cash and cash equivalents 22(a) N/A 11,845 11,227
Receivables* 8 Loans and receivables (at amortised cost)
3,038
4,344
Financial liabilities
Class:
Payables* 13 & 23 (c) Financial liabilities measured at amortised cost
56
231
* Excludes statutory receivables/payables and prepayments as these are not within the scope of AASB 7, therefore, the “total” will not reconcile to the receivables total recognised in the statement of financial position.
(b) Credit risk
Credit risk is the risk of financial loss arising from another party to a contract or financial obligation. The Office’s maximum exposure to credit risk is represented by the carrying amounts of the financial assets (net of any allowance for impairment).
Credit risk arises from the financial assets of the Office, which are cash and receivables. The Office does not hold collateral and has not granted any financial guarantees.
Cash
Cash comprises cash on hand and bank balances within the NSW Treasury Banking System. Interest rate as determined by NSW Treasury is earned on daily bank balances and paid twice yearly.
Receivables
All trade debtors are recognised as amounts receivable at balance date. We review our debtors on an ongoing basis and report debtors’ status to the Office Executive on a regular basis. Procedures as established in the Treasurer’s Directions are followed to recover outstanding amounts, including letters of demand. Debts which are known to be uncollectible are written off. An allowance for impairment is raised when there is objective evidence that we are not able to collect all amounts due. No interest is earned on our receivables. Invoices are made on 30 day terms.
The Office is not materially exposed to concentrations of credit risk to a single debtor or group of debtors. Most of our debtors are government agencies whose credit ratings are considered less risky. There are no debtors whose terms have been renegotiated.
The following table outlines our financial assets that are past due or impaired, which are the receivables category in the statement of financial position.

The Audit Office of New South Wales AnnuAl RePORt 2009/10
68
The Audit Office of New South Walesnotes to and forming part of the financial statements for the year ended 30 June 2010
total
$’000
Current
$’000
Past due but not impaired
$’000
Considered impaired
$’000
2010
< 3 months overdue 2,937 2,254 683 –
3 months–6 months overdue 91 – 91 –
> 6 months overdue 10 – 10 –
3,038 2,254 784 –
2009
< 3 months overdue 4,070 3,085 985 –
3 months–6 months overdue 153 – 153 –
> 6 months overdue 121 – 121 –
4,344 3,085 1,259 –
* The ageing analysis excludes statutory receivables as these are not within the scope of AASB 7, therefore, the “total” will not reconcile to the receivables total recognised in the statement of financial position.
(c) liquidity risk
Liquidity risk is the risk that the Office will be unable to meet its payment obligations when they fall due. The Office continuously manages risk through monitoring future cash flows to ensure adequate holding of liquid assets.
During the current and prior years, there were no defaults on our payables. No assets have been pledged as collateral. The Office’s exposure to liquidity risk is deemed insignificant based on prior period’s data and current assessment of risk.
The liabilities are recognised for amounts due to be paid in the future for goods or services received, whether or not invoiced. Amounts showing to suppliers (which are unsecured) are settled in accordance with the policy set out in Treasurer’s Directions 219.01. If trade terms are not specified, payment is made no later than the end of the month following the month in which an invoice or statement is received. Treasurer’s Direction 219.01 allows the Minister to award interest for late payment. The rate of interest applied during the year was 0%. (2009: 0%).
The table below summarises the maturity profile of the Office’s financial liabilities, together with the interest rate exposure.
Interest Rate exposure Maturity Dates
nominal Amount
Fixed Interest
Rate
Variable Interest
Rate
non-Interest Bearing
< 1 year
1–5 yrs
> 5 yrs
$’000 $’000 $’000
2010
Payables 56 – – 56 56
56 – – 56 56 – –
2009
Payables 231 – – 231 231 – –
231 – – 231 231 – –
The amounts disclosed are the contractual undiscounted cash flows of each class of financial liabilities, therefore, the amounts disclosed above will not reconcile to the statement of financial position.
(d) Market risk
Market risk is the risk that the fair value or future cash flows of a financial instrument will fluctuate because of changes in market prices. The Office has no exposure to foreign currency risk and does not enter into commodity contracts.
Interest rate risk—sensitivity analysis
The sensitivity analysis is performed based on risk exposures in existence at the balance sheet date to show how profit or loss and equity would have been affected by changes in the relevant risk variable that were reasonably possible at that date. This is determined after taking into account the economic environment in which the Office operates and the time frame for the assessment (i.e. until the end of the next annual reporting period).

The Audit Office of New South Wales AnnuAl RePORt 2009/10
69
The Audit Office of New South Walesnotes to and forming part of the financial statements for the year ended 30 June 2010
At reporting date, if interest rates had been 100 basis points higher or lower and all other variables were held constant, the Office’s loss and equity would have decreased or increased by $118,000 (2009: $112,000).
(e) Credit facility
The Office closed its standing credit facility of $2 million with NSW TCorp in November 2009. We did not use this credit facility in the current nor prior periods.
(f) Fair value compared to carrying amount
Our financial instruments as shown in Note 23(a) are recognised in the statement of financial position at amortised cost, which approximates the fair value because of the short-term nature of these financial instruments.
End of audited financial statements

The Audit Office of New South Wales AnnuAl RePORt 2009/10
70
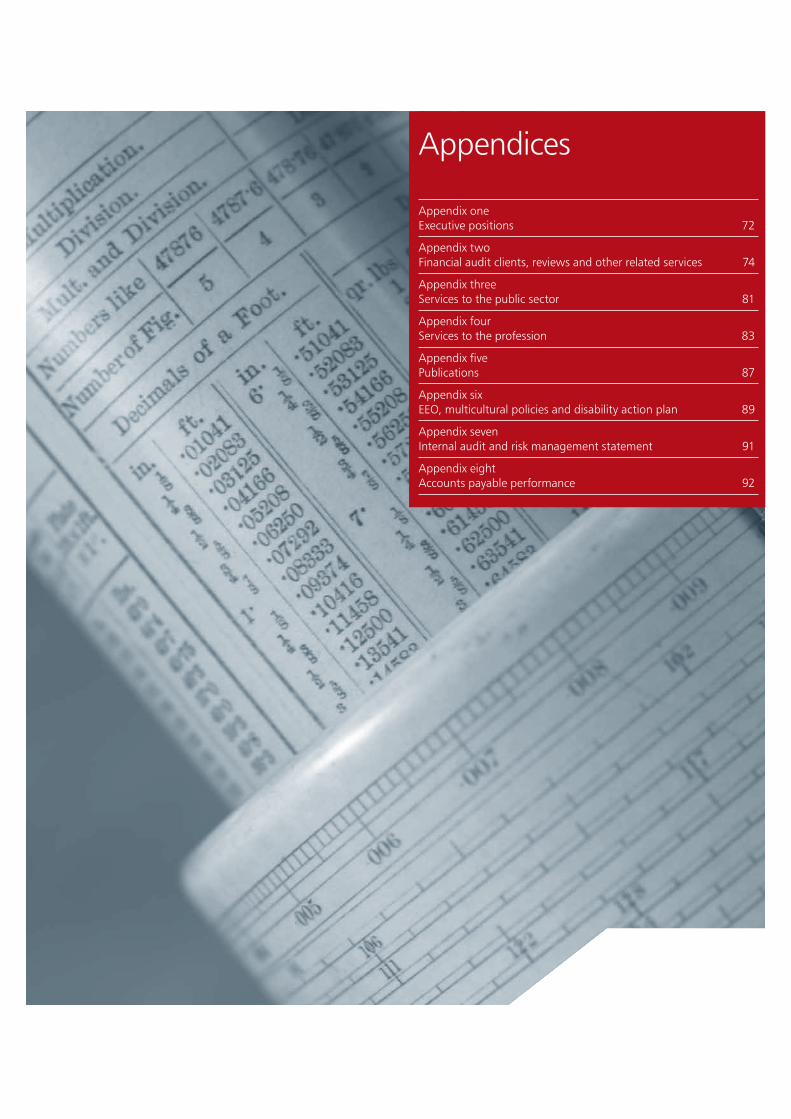
Appendices
Appendix one Executive positions 72
Appendix two Financial audit clients, reviews and other related services 74
Appendix three Services to the public sector 81
Appendix four Services to the profession 83
Appendix five Publications 87
Appendix six EEO, multicultural policies and disability action plan 89
Appendix seven Internal audit and risk management statement 91
Appendix eight Accounts payable performance 92

The Audit Office of New South Wales AnnuAl RePORt 2009/10
72 Number of executive positions in 2009–10
Remuneration band total 30 June 2009
total 30 June 2010
125,000−149,999 – –
150,000−174,999 9 3
175,000−199,999 9 8
200,000−224,999 3 8
225,000−249,999 3 1
250,000−274,999 – 2
275,000−299,999 – –
300,000−324,999 1 –
325,000−349,999 – 1
350,000−374,999 – –
375,000−399,999 – –
400,000−424,999 1 –
425,000−449,999 – 1
TOTAL 26* 24**
* Two executives were on pre-retirement leave.** One on pre-retirement leave and one on maternity leave
Number of executive positions filled by women
2005−06 3
2006−07 3
2007−08 4
2008−09 5
2009−10 5
Performance statements for positions equivalent to SES level 5 and above
Peter Achterstraat
Position Auditor-General of the Audit Office
Remuneration package $428,452
Comment
The Auditor-General is responsible to parliament. There is no performance agreement with, or annual review by, a minister.
Appendix one
Executive positions

The Audit Office of New South Wales AnnuAl RePORt 2009/10
73tony Whitfield
Position Deputy Auditor-General
Remuneration package $333,928
Comment
As Deputy Auditor-General, the main functions of Mr Whitfield’s position are to:
— lead the Audit Office of New South Wales as CEO, taking charge of the day to day operations of the business and providing strategic leadership and oversight
— assume the role and responsibilities of the Auditor-General in his absence. — oversee and coordinate the Office’s financial and performance audit operations, including policy,
research and other professional support activities.
Deliverables in 2009–10 included:
— together with the Auditor-General and the leadership team, developing and progressing the Office’s strategic plan, and implementing programs to improve client engagement
— maintaining sound professional relations with audit clients — chairing the Office Executive and Information Management and Technology Steering Committee — representing the Office in briefing a number of overseas parliamentary, audit and public
sector delegations — continuing to make a strong external contribution to the accounting and auditing profession.
Mr Whitfield successfully met the required performance criteria at an expert level.
Gregory Gibson
Position Assistant Auditor-General
Remuneration package $258,038
Comment
As an Assistant Auditor-General, Financial Audit, the main function of Mr Gibson’s position is to assist in overseeing and coordinating the Office’s financial audit operations, in particular the financial and resourcing aspects.
Deliverables in 2009–10 included:
— refining the method for developing the budget for fees and production costs in Financial Audit, monitoring branch results and business management improvements
— in conjunction with the Assistant Auditor-General, Corporate Services, contributing to the enhancement of the practice management system for the Office
— monitoring the eight special interest groups in the Office — maintaining sound professional relations with audit clients — actively participating in creating development opportunities for staff within the Office.
Mr Gibson successfully met the required performance criteria at a superior level.
John Viljoen
Position Assistant Auditor-General
Remuneration package $250,807
Comment
As an Assistant-Auditor General, Financial Audit, the main function of Mr Viljoen’s position is to assist in overseeing and coordinating the Office’s financial audit operations, in particular the financial audit methodology, quality and reporting aspects.
Deliverables in 2009–10 included:
— overseeing the upgrading of the financial audit methodology — refining the format of the Auditor-General’s financial audit reports to parliament — overseeing the quality assurance program — maintaining sound professional relations with audit clients — actively participating in creating development opportunities for staff within the Office.
Mr Viljoen successfully met the required performance criteria at a superior level.
The Audit Office of New South Wales AnnuAl RePORt 2009/10
74 Financial audit clients
Aboriginal Housing Office Aboriginal Housing
Office Group of Staff
Agricultural Scientific Collections Trust
Art Gallery of New South Wales Foundation, The
Art Gallery of New South Wales Trust Australian Institute
of Asian Culture and Visual Arts Limited, The
Arts Education Foundation Trust
Attorney General’s Department
Australian Museum Trust
Banana Industry Committee
Barangaroo Delivery Authority Office of the
Barangaroo Authority
Belgenny Farm Agricultural Heritage Centre Trust
Board of Surveying and Spatial Information
Board of Studies, The Board of Studies
Casual Staff Division
Boxing Authority of New South Wales
Brett Whiteley Foundation, The
Building and Construction Industry Long Service Payments Corporation
Building Insurers’ Guarantee Corporation
Building Professionals Board
Bush Fire Co-ordinating Committee
Cancer Institute NSW Cancer Institute Division
Casino, Liquor and Gaming Control Authority
Catchment Management Authorities (13)
C.B. Alexander Foundation
CCP Holdings Pty Limited
Centennial Park and Moore Park Trust
Centennial Parklands Foundation
Charles Sturt University Charles Sturt
Foundation Limited Charles Sturt Services Limited
Charles Sturt Foundation Trust
Charles Sturt Campus Services Limited
Rivservices Limited Western Research
Institute Limited
Chief Investigator of the Office of Transport Safety Investigations
Chipping Norton Lake Authority
City West Housing Pty Limited
Clinical Excellence Commission Clinical Excellence
Commission Special Purpose Service Entity
Cobar Water Board Cobar Water Board Division
Cobbora Coal Unit Trust
Cobbora Management Company Pty Limited
Cobbora Unicorporated Joint Venture
Coffs Harbour Technology Park Limited
Community Relations Commission for a Multicultural NSW Office of the Community
Relations Commission
Corporation Sole ‘Minister Administering the Environmental Planning and Assessment Act 1979’
Corporation Sole ‘Minister Administering the Heritage Act 1977’
Country Energy Country Energy Gas
Pty Limited NorthPower Energy Services
Pty Limited
Cowra Japanese Garden Maintenance Foundation Ltd Cowra Japanese Garden Trust
Crown Employees (NSW Fire Brigades Firefighting Staff Death and Disability) Superannuation Fund
Crown Entity, The Crown Lands
Homesites Program Crown Leaseholds Entity Electricity Tariff Equalisation
Ministerial Corporation Land Development
Working Account Liability Management
Ministerial Corporation
New South Wales Self Insurance Corporation
State Rail Authority Residual Holding Corporation
Dams Safety Committee
Delta Electricity Delta Electricity Australia
Pty Ltd Mid West Primary Pty Ltd
Department of Aboriginal Affairs
Department of Ageing, Disability and Home Care
Department of Commerce Australian Centre for
Advanced Computing and Communications Pty Limited
New South Wales Government Telecommunications Authority, The
Department of Community Services
Department of Corrective Services
Department of Education and Training NSW Adult Migrant
English Service
Department of Environment, Climate Change and Water
Department of Health Area Health Services Greater Southern Greater Southern Area
Health Service Special Purpose Service Entity
Greater Western Greater Western Area
Health Service Special Purpose Service Entity
Hunter and New England Hunter and New
England Area Health Service Special Purpose Service Entity
North Coast North Coast Area
Health Service Special Purpose Service Entity
Northern Sydney and Central Coast
Northern Sydney and Central Coast Area Health Service Special Purpose Service Entity
South Eastern Sydney and Illawarra
South Eastern Sydney and Illawarra Area Health Service Special Purpose Service Entity
Appendix two
Financial audit clients, reviews and other related services
The Audit Office of New South Wales AnnuAl RePORt 2009/10
75 Sydney South West ANZAC Health and
Medical Research Foundation
ANZAC Health and Medical Research Foundation Trust Fund
Ingham Health Research Institute
Sydney South West Area Health Service Special Purpose Service Entity
Sydney West Sydney West Area
Health Service Special Purpose Service Entity
Department of Housing New South Wales Land
and Housing Corporation Rental Housing
Assistance Fund
Department of Juvenile Justice
Department of Lands
Department of Local Government
Department of Planning
Department of Premier and Cabinet
Department of Primary Industries
Department of State and Regional Development
Department of the Arts, Sport and Recreation Responsible Gambling Fund
Department of Water and Energy
Dumaresq-Barwon Border Rivers Commission
Election Funding Authority of New South Wales
EnergyAustralia Downtown Utilities
Pty Limited EnergyAustralia Pty Limited
Energy Industries Superannuation Scheme Energy Industries
Superannuation Scheme (EISS)—Pool A and Pool B
Energy Industries Superannuation Scheme Pty Limited
Energy Investment Fund
Environment Protection Authority
Environmental Trust
Eraring Energy Rocky Point Holdings
Pty Limited
Events New South Wales Pty Limited
Fair Trading Administration Corporation
Festival Development Corporation
Financial Counselling Trust Fund
Forestry Commission of New South Wales (trading as Forests NSW) Forestry Commission DivisionGame Council of New South Wales Game Council Division
Gosford Water Supply Authority
Greyhound and Harness Racing Regulatory Authority Greyhound and Harness
Racing Regulatory Authority Division
Growth Centres Commission
Health Administration Corporation Health Administration
Corporation Special Purpose Service Entity
Health Care Complaints Commission Office of the Health Care
Complaints Commission
HealthQuest HealthQuest Special
Purpose Service Entity
Health Professionals Registration Boards (12)
Historic Houses Trust of New South Wales Foundation for the Historic
Houses Trust of NSW Foundation for the Historic
Houses Trust of NSW Limited Hamilton Rouse Hill
Trust, The Rouse Hill Hamilton
Collection Pty Limited
Home Care Service of New South Wales Home Care Service Division
Home Purchase Assistance Fund
Hunter Development Corporation
Hunter Water Corporation Hunter Water Australia
Pty Limited
Independent Commission Against Corruption
Independent Pricing and Regulatory Tribunal
Independent Pricing and Regulatory Tribunal Division
Independent Transport Safety and Reliability Regulator Independent Transport
Safety and Reliability Regulator Division
Infrastructure Implementation Corporation
Integral Energy Australia
Internal Audit Bureau of New South Wales Internal Audit
Bureau Division
Jenolan Caves Reserve Trust Jenolan Caves Reserve
Trust Division
Judicial Commission of New South Wales
Justice Health Justice Health Special
Purpose Service Entity
Lake Illawarra Authority
Landcom
Legal Aid Commission of New South Wales Legal Aid Temporary
Staff Division Office of the Legal
Aid Commission
Legal Profession Admission Board
Legislature, The
Legislature (Audit of Members’ Additional Entitlements), The
Library Council of New South Wales State Library of New
South Wales Foundation
Lifetime Care and Support Authority of New South Wales
Lord Howe Island Board
Luna Park Reserve Trust
Macquarie Generation Midwest Development
Corporation Pty Limited
Macquarie University Access Macquarie Limited Australian Proteome
Analysis Facility Ltd Centre for Money, Banking
and Finance Limited COH Property Trust Learning Activity

The Audit Office of New South Wales AnnuAl RePORt 2009/10
76
Appendix two (continued)
Financial audit clients, reviews and other related services
Management Systems (LAMS) Foundation Limited
Learning Activity Management Systems (LAMS) International Pty Limited
Macquarie Graduate School of Management Pty Limited
Macquarie University Medical Research Foundation Limited
Macquarie University Medical Research Trust
Macquarie University Private Hospital Trust
Macquarie University Professorial Superannuation Scheme
Macquarie University Property Investment Company Pty Limited
Macquarie University Property Investment Company No 2 Pty Limited
Macquarie University Property Investment Company No 3 Pty Limited
Macquarie University Property Investment Trust
MU Private Hospital Pty Limited
MUH Operations Pty Limited MUH Operations No 2
Pty Limited MUP IT Sub-Trust No 1 MUP IT Sub-Trust No 2 MUP IT Sub-Trust No 3 MUP IT Sub-Trust No 4 MUP H Clinic Pty Limited MUP H Clinic Sub-Trust MUP H Hospital Pty Limited MUP H Hospital Sub-Trust MUP I Holding Trust No 1 MUP I Holding Trust No 2 MUP I Holding Trust No 3 MUP I Holding Trust No 4 MUP I Holding Trust No 5 MUP I Holding Trust No 6 Risk Frontiers Flood
(Australia) Pty Limited Risk Frontiers Group
Pty Limited U @MQ Limited
Marine Parks Authority
Maritime Authority of NSW Maritime Authority
of NSW Division
Mine Subsidence Board
Ministerial Corporation for Industry
Ministry for Police
Ministry of Transport
Motor Accidents Authority of New South Wales Office of Motor
Accidents Authority of New South Wales
Motor Vehicle Repair Industry Authority
Natural Resources Commission Natural Resources
Commission Division
New South Wales Aboriginal Land Council
New South Wales Crime Commission New South Wales Crime
Commission Division Office of the New South
Wales Crime Commission
New South Wales Electoral Commission
New South Wales Fire Brigades
New South Wales Food Authority Milk Marketing (NSW)
Pty Limited Office of the NSW
Food Authority Pacific Industry Service
Corporation Pty Limited
New South Wales Health Foundation
New South Wales Institute of Psychiatry
New South Wales Institute of Sport Institute of Sport Division
New South Wales Institute of Teachers Office of the Institute
of Teachers
New South Wales Lotteries Corporation
New South Wales Rural Assistance Authority Office of the New
South Wales Rural Assistance Authority
New South Wales Treasury Corporation T Corp Nominees Pty Limited Treasury Corporation Division
Newcastle International Sports Centre Trust Newcastle International
Sports Centre Club
Newcastle Port Corporation
Newcastle Showground and Exhibition Centre Trust
NSW Architects Registration Board
NSW Board of Vocational Education and Training
NSW Businesslink Pty Ltd
NSW Commission for Children and Young People
NSW Film and Television Office
NSW Fire Brigades Superannuation Pty Limited
NSW Maritime Authority NSW Maritime
Authority Division
NSW Ovine Johne’s Disease Transaction-Based Contribution Scheme
NSW Police Force
NSW Rural Fire Service
NSW Vocational Education and Training Accreditation Board
Office for Children
Office of the Board of Studies
Office of the Director of Public Prosecutions
Office of the Protective Commissioner and Public Guardian— Administration Fund
Office of the Protective Commissioner—Common Fund
Office of the WorkCover Authority
Ombudsman’s Office
Parliamentary Contributory Superannuation Fund
Parramatta Park Trust
Parramatta Stadium Trust Parramatta Stadium
Trust Division
Payments to Other Government Bodies under the Control of the Minister
Police Integrity Commission Policy Integrity
Commission Division Office of the Police
Integrity Commission
Port Kembla Port Corporation
Public Transport Ticketing Corporation Public Transport Ticketing
Corporation Division
Public Trustee NSW
Public Trustee New Common Fund
Rail Corporation New South Wales
Rail Infrastructure Corporation

The Audit Office of New South Wales AnnuAl RePORt 2009/10
77Redfern Waterloo Authority Australian Technology
Park Precinct Management Limited
Office of the Redfern Waterloo Authority
Rental Bond Board
Residual Business Management Corporation Pacific Solar Pty Limited
and Pacific Power (Subsidiary No 1) Pty Limited
Rice Marketing Board for the State of New South Wales
Riverina Citrus
Roads and Traffic Authority of New South Wales Roads and Traffic
Authority Division
Royal Alexandra Hospital for Children, The Royal Alexandra Hospital
for Children Special Purpose Service Entity
Royal Botanic Gardens and Domain Trust
SAS Trustee Corporation SAS Trustee
Corporation Division
SAS Trustee Corporation— Pooled Fund Buroba Pty Limited Duquesne Utilities Pty Ltd Police Superannuation
Scheme State Authorities
Non-Contributory Superannuation Scheme
State Authorities Superannuation Scheme
State Superannuation Scheme
Valley Commerce Pty Limited
Sesquicentenary of Responsible Government Trust Fund
Small Business Development Corporation of New South Wales
Southern Cross University Australian Plant
DNA Bank Limited Biobank Pty Limited Norsearch Limited
Sporting Injuries Committee
State Council of Rural Lands Protection Boards State Council of Rural Lands
Protection Boards Division
State Emergency Service
State Property Authority Office of the State
Property Authority
State Records Authority of New South Wales
State Rescue Board
State Sports Centre Trust State Sports Centre
Trust Division
State Super Financial Services Australia Limited State Super Retirement Fund State Super Allocated
Pension Fund State Super Fixed Term
Allocated Pension Fund State Super Investment Fund State Super Personal
Retirement Plan
State Transit Authority State Transit
Authority Division Western Sydney
Buses Division
State Water Corporation
Superannuation Administration Corporation (trading as Pillar Administration)
Sydney Catchment Authority Sydney Catchment
Authority Division
Sydney Cricket and Sports Ground Trust Sydney Cricket and Sports
Ground Trust Division
Sydney Ferries Corporation
Sydney Harbour Foreshore Authority Cooks Cove
Development Corporation Office of the Sydney
Harbour Authority Sydney Harbour Authority
Casual Staff Division
Sydney Metro Sydney Metro Division
Sydney Olympic Park Authority Office of the Sydney
Olympic Park Authority Parklands Foundation Limited Sydney Olympic Park
Authority Sydney Olympic Park Aquatic and Athletic Centres Division
Sydney Opera House Trust
Sydney Ports Corporation Sydney Pilot Service Pty Ltd
Sydney Water Corporation Australian Water
Technologies Pty Ltd AWT International
(Thailand) Limited Sydney Desalination
Plant Pty Limited
Sydney 2009 World Masters Games Organising Committee Office of the Sydney 2009
World Masters Games Organising Committee
Sydney 2009 WorldMasters Games Organising Committee Division
Taronga Conservation Society Australia Taronga Conservation
Society Australia Division
Teacher Housing Authority of New South Wales
Technical and Further Education Commission, New South Wales A.C.N. 093 230 374
Pty Limited New South Wales
Technical and Further Education Division
Technical Education Trust Funds
TransGrid
Transport Infrastructure Development Corporation
Treasury
Trustees of the ANZAC Memorial Building
Trustees of the Farrer Memorial Research Scholarship Fund
Trustees of the Museum of Applied Arts and Sciences
UNILINC Limited
Uniprojects Pty Limited
Universities Admission Centre (NSW & ACT) Pty Limited
University of Newcastle, The GraduateSchool.com
Pty Limited Newcastle Innovation Limited UON Foundation Limited UON Foundation Trust UON Services Limited Degrees in Catering Pty Ltd UON Singapore Pte Ltd
University of New England Agricultural Business
Research Institute Limited International Livestock
Resources and Information Centre Ltd

The Audit Office of New South Wales AnnuAl RePORt 2009/10
78
Appendix two (continued)
Financial audit clients, reviews and other related services National Marine
Science Centre Pty Ltd Services UNE Limited Sport UNE Limited UNE Foundation UNE Foundation Limited UNE Partnerships Pty Limited University of New England
Sports Association University of New
England Professorial Superannuation Fund
University of New South Wales A.C.N. 125 694 546
Pty Limited AGSM Limited HepatoCell Therapeutics
Pty Limited NewSouth Global
Pty Limited Group Australian Education
Consultancy Limited NewSouth Global
India Pvt Limited NewSouth Global
(Thailand) Limited UNSW Asia School Limited UNSW (Hong Kong)
Limited UNSW (Singapore)
Pte Limited UNSW (Thailand) Limited NewSouth Innovations
Pty Limited Audio Nomad Pty Ltd Cystemix Pty Limited NewSouth One Pty Ltd NewSouth Four Pty Ltd NewSouth Five Pty Ltd NewSouth Six Pty Ltd NewSouth Seven Pty Ltd NewSouth Eight Pty Ltd Qucor Pty Limited University of
New South Wales Foundation Limited, The
John Lewis and Pamela Lightfoot Trust, The
New South Wales Minerals Industry/ University of New South Wales Education Trust
University of New South Wales Foundation
University of New South Wales International House Limited
University of New South Wales Press Limited
UNSW Hong Kong Foundation Limited
UNSW Study Abroad—Friends and US Alumni Inc
University of Technology, Sydney accessUTS Pty Limited Insearch Limited Insearch
(Shanghai) Limited Sydney Educational
Broadcasting Limited UTSM Services (Malaysia)
Sdn Bhd
University of Sydney, The Bosch Institute, The Institute of Magnetic
Resonance Research Sports Knowledge
Australia Pty Limited Sydney Institutes of Health
and Medical Research, The SydneyLearning Pty Limited Sydney Talent Pty Limited The Warren Centre
for Advanced Engineering Limited
Ucom Sixteen Pty Limited United States Studies
Centre Limited University of
Sydney Professorial Superannuation System
Wayahead Pty Limited Wentworth Annexe LimitedUniversity of Western Sydney, The CADRE Design Pty Limited
and Cadre Design Unit Trust Education Training
Community Television (ET CTV) Limited
Television Sydney (TVS) Limited
Television Sydney Foundation Limited
SGSM Limited University of Western
Sydney Foundation Limited University of Western
Sydney Foundation Trust UWS College Pty Limited Sydney West International
College Pty Limited UWS Conference and
Residential Colleges Limited uwsconnect Limited Whitlam Institute within
the University of Western Sydney Limited and Whitlam Institute within the University of Western Sydney Trust
University of Wollongong Illawarra Technology
Corporation Limited International School
of European Aviation Pty Limited
ITC Education Ltd ITC Emirates Limited ITC (Europe) Ltd ITC (New Zealand) Limited ITC (Middle East) Limited International Film School
Sydney Pty Limited Sydney Business School
Pty Limited University of Wollongong
Recreation and Aquatic Centre Limited
Wollongong UniCentre Limited
Upper Parramatta River Catchment Trust Upper Parramatta River
Catchment Trust Division
Veterinary Practitioners Board
Waste Recycling and Processing Corporation
Wentworth Park Sporting Complex Trust
Western Sydney Parklands Trust
Wild Dog Destruction Board Wild Dog Destruction Board
Division
Wine Grapes Marketing Board for the City of Griffith and the Shires of Leeton, Carrathool and Murrumbidgee
Wollongong Sportsground Trust Wollongong
Sportsground Trust Division
WorkCover Authority of New South Wales
Workers Compensation Commission
Workers’ Compensation (Dust Diseases) Board
Workers Compensation Nominal Insurer (trading as The NSW WorkCover Scheme)
Wyong Water Supply Authority

The Audit Office of New South Wales AnnuAl RePORt 2009/10
79Audit-related services requested by the Treasurer under s27B(3)(c) of the Public Finance and Audit Act 1983
Attendance at each draw of a public lottery under the Public Lotteries Act 1996 and inspect/test any Draw Lotteries Equipment
Audit of General Purpose Financial Statements for the Public Trustee—Common Funds and the Protective Commissioner—Common Fund
Audit or audit related service to enable NSW public sector agencies to meet requirements under the Corporations Act 2001 or the Superannuation Industry (Supervision) Act 1993
Audit reports required by s24 of the Charitable Fundraising Act 1991 for NSW government agencies that conduct fundraising appeals
Certify financial management, control systems and other matters for the Office’s clients required by AusAID as a condition of AusAid funding
Contract summaries prepared under the Working with Government Guidelines (December 2006)
Data returns or reports required under the Australian Government/State Agreements
Data returns or reports to acquit Disaster Relief Payments from the Australian Government
Data returns or reports to acquit grants provided by the Australian Government and other donors to NSW government agencies
Financial data returns or reports by universities to the Department of Education, Science and Training as required by the Australian Government funding arrangements and/or agreements
Letters of comfort to interested parties of NSW Treasury Corporation regarding the Euro Medium Note Program
Special purpose and trust funds for controlled entities of the Department of Health
The financial report of the Nippon Fellowship Fund in accordance with an agreement between Macquarie University and the Nippon Foundation
Letters of comfort to interested parties of NSW Treasury Corporation regarding its domestic and offshore funding activities
Any audit or audit related services for which:
— A Commonwealth or State Body requires, for regulatory purposes, a NSW Public Sector Agency to have information, reports or returns audited, reviewed, examined or certified by an auditor, and
— a NSW Agency asks the Office to undertake the audit, review, examination or certification
Limited Assurance Review of Agencies’ compliance with Total Asset Management (TAM) requirements as agreed with Treasury
Request for Particular Audit Services Under Section 27B(3)(c) of the Public Finance and Audit Act 1983 in relation to Residual Business Management Corporation (RBMC)

The Audit Office of New South Wales AnnuAl RePORt 2009/10
80 Overseas visits
Staff member Date of travel Return date Destination Reason
Alison Gatt 31 July 2009 21 August 2009 Abu Dhabi, UAE To undertake a peer review of the State Audit Institution
Tony Whitfield 7 August 2009 21 August 2009 Abu Dhabi, UAE To undertake a peer review of the State Audit Institution
Greg Rowling Peter Armstrong Sheena Khatri
13 September 2009
25 September 2009
Lord Howe Island
Audit of the Lord Howe Island Board
Greg Parkes 11 March 2010 15 March 2010 Singapore Audit of UON Singapore Pte Ltd, an entity controlled by the University of Newcastle
Bola Oyetunji Michael Chan
14 March 2010 21 March 2010 China and Vietnam
To assess a contractor as the local auditor for joint venture partnerships of Insight Limited, a controlled entity of the University of Technology, Sydney
Peter Achterstraat John Rosier
15 March 2010 20 March 2010 Canada Attendance at the Australasian Council of Auditors-General and the Canadian Council of Legislative Auditors joint Public Sector Audit Forum
Sheena Khatri Meagan Griffin
27 June 2010 2 July 2010 Lord Howe Island
Audit of the Lord Howe Island Board
Steven Martin 29 June 2010 2 July 2010 Lord Howe Island
Audit of the Lord Howe Island Board

The Audit Office of New South Wales AnnuAl RePORt 2009/10
81
Appendix three
Services to the public sector
Appearances before parliamentary committees
Office staff appeared before the following parliamentary committees.
Date Committee event Who
12 August 2009 Public Accounts Committee
Public Hearing on Performance Audit Reports: —Signal Failures on the Metropolitan Rail Network —Ageing Workforce—Teachers
Peter Achterstraat Sean Crumlin Rod Longford Chris Yates Angelina Pillay Neil Avery
30 October 2009 Public Accounts Committee
Public Hearing on Performance Audit Report: —Recycling and Reuse of Waste by the NSW Public Sector
Peter Achterstraat Jane Tebbatt Rod Longford Neil Avery
2 February 2010 Joint Standing Committee on Electoral Matters
Inquiry into public funding of election campaigns
Peter Achterstraat
5 May 2010 Public Accounts Committee
Public Hearing on Performance Audit Reports: —Delivering Health Care Out of Hospitals —Managing Injured Police
Peter Achterstraat Jane Tebbatt Sean Crumlin Geoff Moran Henriette Zeitoun Sandra Tomasi
Memberships
Office staff were members of the following public sector organisations and committees.
Peter Achterstraat Australasian Council of Auditors-General Premier’s Annual Reports Awards—Judging Panel Institute of Public Administration NSW Federal Electoral Division Redistribution Committee
Peter Barnes Hardship Review Board Australasian Council of Auditors-General—GAAP/GFS AASB 1049 Working Group
Sean Crumlin Premier’s Annual Reports Awards—Technical Panel Australasian Council of Auditors-General—Heads of Performance Audit Group
Louise Mooney Australasian Council of Auditors-General—Practice Management Group
Bola Oyetunji Department of Local Government Accounting Advisory Committee
Angelina Pillay Corruption Prevention Network
Maria Spriggins NSW Public Sector Community of Finance Professionals
Henry Szus Australasian Council of Auditors-General—Intra-Jurisdictional IS Audit Group
Heather Watson Internal Audit in the NSW Public Sector—Steering Committee Internal Audit in the NSW Public Sector—Human Resources Sub-Committee
Tony Whitfield Australasian Council of Auditors-General—Financial Reporting and Auditing Committee

The Audit Office of New South Wales AnnuAl RePORt 2009/10
82 Presentations
Office staff gave the following presentations to various public sector audiences.
title Presenter(s) Date Audience
Audit and Risk Committee pre-qualification scheme
Peter Achterstraat 10 August 2009 Department of Premier and Cabinet Seminar
Audit and Risk Committee pre-qualification scheme
Peter Achterstraat 18 August 2009 Department of Premier and Cabinet Seminar
Informal discussions on governance
Peter Achterstraat 19 August 2009 Sydney Water
The future for risk management in the public sector
Peter Achterstraat 30 September 2009
Treasury Managed Fund (TMF)—Risk Management Conference and Awards Function
Disclosure in the public sector
Barry Underwood 21 October 2009 Chartered Secretaries Australia—CSA Public Sector Governance Committee
The role of the Auditor-General
Peter Achterstraat 26 October 2009 University of Sydney
Public accountability for public funds
Peter Achterstraat 24 November 2009 Corruption Prevention Network (CPN)
Government property register
Scott Stanton 30 November 2009 Land and Property Management Authority
Best practice in grant management
Sean Crumlin Michael Johnston
28 February 2010 Australian Institute of Grants Management— Best Practice in Grants Management Conference
Occasional address Peter Achterstraat 22 April 2010 University of Western Sydney—Graduation Ceremony
Working in the tax office was better in my day
Peter Achterstraat 27 May 2010 Australian Taxation Office

The Audit Office of New South Wales AnnuAl RePORt 2009/10
83
Appendix four
Services to the profession
Memberships
Office staff were members of the following committees, professional associations, panels or working parties.
Chris Bowdler CPA Australia—Sydney Accountants in Government Discussion Group—Convenor CPA Australia—NSW Congress 2010—Task Force Committee
Steve Fryer Institute of Chartered Accountants in Australia—Research Group CPA Australia—Member of Financial Reporting and Disclosure Panel
Alison Gatt Institute of Chartered Accountants in Australia—Research Group
Vijyata Kirpalani Institute of Chartered Accountants in Australia—Young Professionals Panel (YPP) Public Sector Representative
Scott Stanton CPA Australia—NSW Public Sector Committee, Chair
Barry Underwood Chartered Secretaries of Australia—Education Group
Heather Watson Institute of Chartered Accountants in Australia—Research Group
Tony Whitfield Institute of Chartered Accountants in Australia—Chair of the Audit Advisory Committee
Education
Members of staff contributed to the professional qualification programs (CA, CPA and CSA designations)
Chris Clayton Institute of Chartered Accountants in Australia—CA Program—author of materials for Audit and Assurance module
Kaveh Daemi Institute of Chartered Accountants in Australia—CA Program—Focus Session Facilitator
Alison Gatt Institute of Chartered Accountants in Australia—Research Group—CA Program —member of Audit Module Advisory Committee
Vijyata Kirpalani Institute of Chartered Accountants in Australia—CA Program—author of material for Audit and Assurance module
Barry Underwood Chartered Secretaries Australia—Graduate Diploma of Applied Corporate Governance—author of some public sector modules and subject director for Public Sector Accountability and Transparency
Heather Watson Institute of Chartered Accountants in Australia—CA Program—author of materials for Audit and Assurance module, Focus Session Facilitator

The Audit Office of New South Wales AnnuAl RePORt 2009/10
84
Appendix four (continued)
Services to the profession
Submissions
During the year we contributed to the following submissions on proposed changes to accounting and auditing pronouncements.
title Date
AASB—Australian Accounting Standards Board
Exposure Draft 180—‘Income from Non-exchange Transactions (Taxes and Transfers)’
30 November 2009
Exposure Draft 192—‘Revised Differential Reporting Framework’ 23 April 2010
Exposure Draft 193—‘Conceptual Framework for Financial Reporting: The Reporting Entity’
21 June 2010
Exposure Draft 194—Request for Comment on IPSASB Exposure Draft 43 ‘Service Concession Arrangements: Grantor’
24 May 2010
Invitation to Comment 22—Request for Comment on IPSASB Consultation Paper ‘Reporting on the Long-Term Sustainability of Public Finances’
1 April 2010
Request to Comment on Gaps in GAAP item— ‘Impairment of statutory receivables’
31 March 2010
AuASB—Auditing & Assurance Standards Board
Exposure Draft 18/09—Proposed Auditing Standard ASA 101 ‘Preamble to Australian Auditing Standards’
20 July 2009
Exposure Draft 19/09—Proposed Auditing Standard ASA 520 ‘Analytical Procedures’
20 July 2009
Exposure Draft 20/20—Proposed Auditing Standard on Review Engagements ASRE 2410 ‘Review of a Financial Report Performed by the Independent Auditor of the Entity’
20 July 2009
Exposure Draft 21/09—Proposed Auditing Standard ASA 102 ‘Compliance with Ethical Requirements when Performing Audits, Reviews and other Assurance Engagements’
7 October 2009
Exposure Draft 01/10—Proposed Standards on Assurance Engagements ASAE 3402 ‘Assurance Reports on Controls at a Service Organisation’
21 May 2010
Exposure Draft 02/10—Proposed Auditing Standard on Review Engagements ASRE 2415 ‘Review of a Financial Report—Company Limited by Guarantee’
24 June 2010
IASB—International Accounting Standards Board
Exposure Draft 2009/5—‘Fair Value Measurement’ 28 September 2009
Exposure Draft 2009/10—‘Discount Rate for Employee Benefits (proposed amendments to IAS 19)’
30 September 2009
Exposure Draft 2009/8—‘Rate Regulate Activities’ 20 November 2009
Exposure Draft 2010/1—‘Measurement of Liabilities in IAS 37— Proposed amendments to IAS 37’
12 April 2010
Exposure Draft 2009/12—‘Financial Instruments: Amortised Cost and Impairment’
30 June 2010
Discussion Paper 2009/1—‘Leases: Preliminary Views’ 17 July 2009
IPSASB—International Public Sector Accounting Standards Board
Exposure Draft 37—‘Financial Instruments: Presentation’ 31 July 2009
Exposure Draft 38—‘Financial Instruments: Recognition and Measurement’ 31 July 2009
Exposure Draft 39—‘Financial Instruments: Disclosures’ 31 July 2009
Consultation Paper—‘Reporting on the Long-Term Sustainability of Public Finances’
30 April 2010
Exposure Draft 43—‘Service Concession Arrangements: Grantor’ 30 June 2010

The Audit Office of New South Wales AnnuAl RePORt 2009/10
85Presentations
Office staff gave the following presentations to various private sector audiences.
title Presenter(s) Date Audience
Recent performance audits and the structure and nature of the NSW Government
Peter Achterstraat 2 September 2009 Institute of Chartered Accountants in Australia
Role of the Auditor-General of NSW
Bola Oyetunji 8 September 2009 Insearch Ltd
Governance and audit committees
Peter Achterstraat 12 November 2009 KPMG—Public Sector Roundtable
Performance Audit and non-financial indicators
Peter Achterstraat 13 November 2009 National Institute of Accountants—NSW State Congress and Business Expo
Aspects of public sector audit in NSW
James Sugumar 17 November 2009 Officers from the Ningbo Audit Bureau (China)
Performance auditing in NSW
Chris Bowdler 18 November 2009 Officers from the Ningbo Audit Bureau (China)
Effective grants management (keynote speaker)
Peter Achterstraat 23 November 2009 CPA Australia— Grants Management Conference Melbourne
Effective grants management (keynote speaker)
Peter Achterstraat 25 November 2009 CPA Australia— Grants Management Conference Sydney
Integrated fraud control strategy (keynote presentation)
Peter Achterstraat 3 December 2009 Annual Governance, Risk and Compliance Forum
Issues arising in current financial audits on government agencies
Peter Achterstraat 16 February 2010 Ernst & Young—Public Sector Accounting Forum Breakfast
Problem audit reports Heather Watson 26 March 2010 Institute of Chartered Accountants in Australia—Audit Conference Sydney
The importance of professional scepticism in an audit
Heather Watson 26 March 2010 Institute of Chartered Accountants in Australia— Audit Conference Sydney
Role of the Auditor-General
Peter Achterstraat 1 April 2010 Rotary Club, North Sydney
Probity requirements for funded organisations
Jane Tebbatt Angelina Pillay
14 April 2010 NSW Ombudsman—Roundtable Discussion
Problem audit reports Heather Watson 23 April 2010 Institute of Chartered Accountants in Australia—Audit Conference Melbourne
The importance of professional scepticism in an audit
Heather Watson 23 April 2010 Institute of Chartered Accountants in Australia— Audit Conference Melbourne

The Audit Office of New South Wales AnnuAl RePORt 2009/10
86
title Presenter(s) Date Audience
Reviving the lost art of fieldwork
Jane Tebbatt 10 May 2010 The Institute of Internal Auditors Australia— South Pacific and Asia Conference 2010
Meeting your fraud obligations— a NSW Auditor-General case study
Peter Achterstraat 11 May 2010 Fraud Detection and Prevention Conference
Performance auditing in action—case study, State Audit Institution, UAE
Tiffany Blackett 12 May 2010 The Institute of Internal Auditors Australia— South Pacific and Asia Conference 2010
Problem audit reports Heather Watson 14 May 2010 Institute of Chartered Accountants in Australia—Perth
The importance of professional scepticism in an audit
Heather Watson 14 May 2010 Institute of Chartered Accountants in Australia—Perth
Problem audit reports Heather Watson 24 May 2010 Institute of Chartered Accountants in Australia—Brisbane
The importance of professional scepticism in an audit
Heather Watson 24 May 2010 Institute of Chartered Accountants in Australia—Brisbane
The role of the Auditor-General
Peter Achterstraat 25 May 2010 Governance and Accountability Models to support Aboriginal and Torres Strait Islander Organisations Conference
Performance audit practices
Chris Bowdler 9 June 2010 State Audit Bureau of Kuwait
Fraud control in the public sector
Peter Achterstraat 28 June 2010 IIR 11th Annual Fraud Summit 2010
Dealing with risk during times of profound change
Peter Achterstraat 29 June 2010 Ernst & Young—Risk Forum
Presentations (continued)

The Audit Office of New South Wales AnnuAl RePORt 2009/10
87
Appendix five
Publications
Financial audit reports
Volume Date released
Volume Three 2009 28 October 2009
Volume Four 2009 29 October 2009
Volume Five 2009 4 November 2009
Volume Six 2009 17 November 2009
Volume Seven 2009 25 November 2009
Volume Eight 2009 2 December 2009
Volume Nine 2009 7 December 2009
Volume Ten 2009 8 December 2009
Volume Eleven 2009 16 December 2009
Volume Twelve 2009 18 December 2009
Volume One 2010 15 April 2010
Volume Two 2010 15 June 2010
Performance audit reports
title Agency examined Date released
Helping Aboriginal Defendants through MERIT
NSW Attorney General’s Department
NSW Department of Health
NSW Police Force
5 August 2009
Environmental Grants Administration
Department of Environment, Climate Change and Water
NSW Environmental Trust
26 August 2009
Administering Domestic Waterfront Tenancies
Land and Property Management Authority
Maritime Authority of NSW
23 September 2009
Government Licensing Project Department of Services, Technology and Administration
7 October 2009
Handback of the M4 Tollway Roads and Traffic Authority of NSW
27 October 2009
Government Advertising Department of Premier and Cabinet
Department of Services, Technology and Administration
NSW Treasury
10 December 2009
Managing Forensic Analysis—Fingerprints and DNA
NSW Police Force
NSW Department of Health
10 February 2010
Working With Children Check NSW Commission for Children and Young People
24 February 2010
Improving Road Safety: School Zones
Roads and Traffic Authority of NSW
25 February 2010
Improving the Performance of Metropolitan Bus Services
NSW Transport and Infrastructure
10 March 2010
Injury Management in the NSW Public Sector
Department of Premier and Cabinet
NSW Treasury
WorkCover NSW
31 March 2010
Access to Overnight Centre-Based Disability Respite
Department of Human Services Ageing, Disability and Home Care
5 May 2010
Severance Payments to Special Temporary Employees
Department of Premier and Cabinet
16 June 2010
Government Investment in V8 Supercar Races at Sydney Olympic Park
Industry & Investment NSW
Events NSW
23 June 2010

The Audit Office of New South Wales AnnuAl RePORt 2009/10
88 Annual Report
Annual Report 2009
Awareness
Issue 5 July 2009
Issue 6 August 2009
Issue 7 September 2009
Issue 8 October 2009
Issue 9 November 2009
Issue 10 December 2009
Issue 1 February 2010
Issue 2 March 2010
Issue 3 April 2010
Issue 4 May 2010
Issue 5 June 2010
Professional Update
Issue 2 August 2009
Issue 1 February 2010

The Audit Office of New South Wales AnnuAl RePORt 2009/10
89Trends in the representation of EEO groups1
Benchmark or target
2007
2008
2009
2010
% % of total staff2
Women 50 46 47 49 50
Aboriginal people and Torres Strait Islanders 2.6 – – – 0.4
People whose first language was not English
19
33
36
42
45
People with a disability 12 5 5 5 4
People with a disability requiring work-related adjustment
7
2.3
2.1
1.8
1.8
Trends in the distribution of EEO groups3
Benchmark or target
2007
2008
2009
2010
% % of total staff2
Women 100 77 79 87 87
Aboriginal people and Torres Strait Islanders
100
–
–
–
–
People whose first language was not English 100 92 85 87 87
People with a disability 100 n/a n/a n/a n/a
People with a disability requiring work-related adjustment
100
n/a
n/a
n/a
n/a
1. Staff numbers are as at 30 June.2. Excludes casual staff.3. A distribution index of 100 indicates that the centre of the distribution of the EEO group across
salary levels is equivalent to that of other staff. Values less than 100 mean that the EEO group tends to be more concentrated at lower salary levels than is the case for other staff. The more pronounced this tendency is, the lower the index will be. In some cases the index may be more than 100, indicating that the EEO group is less concentrated at lower salary levels.
n/a = not available
EEO outcomes
In 2009–10 the Office focused on the following policies and programs: — the recruitment in early 2010 of an indigenous school leaver to join the Financial Audit Branch
as an auditor — the continuous focus on equal opportunity and discrimination training for all inductees — the development of a program for senior managers on anti-bullying — a leadership program for all levels of employee from Executive to Senior Auditor
(and equivalent) with tailored coaching programs to help develop individuals — a new general recruitment process that is based on ‘assessment centre’ methods and
ensures greater adherence to equal employment opportunity principles — opportunities for temporary attachment to overseas audit offices to gain experience,
knowledge and an appreciation of other cultures.
In 2010–11 we will focus on the following policies and programs: — conduct training sessions for senior managers on anti-discrimination and bullying — continue to focus on individual leadership development — implement competencies that ensure performance and development for all members
of the Office — a new recruitment process for school leavers that ensures equal opportunity for candidates
through the process — further opportunities for overseas attachments.
Appendix six
EEO, multicultural policies and disability action plan
The Audit Office of New South Wales AnnuAl RePORt 2009/10
90 Multicultural policies and services program
The Office’s activities are centred on providing services to parliament and government agencies, not directly to members of the public. Therefore the Office has limited capacity to address multicultural services issues.
The Office respects the rights of Australian citizens and residents who wish to become citizens to seek employment from advertised vacancies in the Office.
Our employment record is evidence of our support for cultural diversity. The commitment by the Office is reflected in the number of racial, ethnic and ethno religious groups that comprise our staff.
Our Multicultural Policies and Services Program Statement is the Office’s planning document showing how it will address the needs of a culturally diverse society, according to its charter.
Disability action plan
The Audit Office Disability Action Plan continues to meet the needs of people with a disability both as employees and clients by:
— ensuring their access to head office premises and the premises they need to visit in the course of their duties
— ensuring their access to information about services of the Office — improving their employment opportunities at the Office.

The Audit Office of New South Wales AnnuAl RePORt 2009/10
91
Appendix seven
Internal Audit and Risk Management Statement
Internal Audit and Risk Management Statement for the 2009–10 Financial Year for The Audit Office of New South Wales
I, Peter Achterstraat, am of the opinion that The Audit Office of New South Wales has internal audit and risk management processes in place that are, in all material respects, compliant with the core requirements set out in Treasury Circular NSW TC 09/08 Internal Audit and Risk Management Policy.
I, Peter Achterstraat, am of the opinion that the Audit and Risk Committee for The Audit Office of New South Wales is constituted and operates in accordance with the independence and governance requirements of Treasury Policy and Guidelines Paper TPP 09-5.
The Chair and Members of the Audit and Risk Committee are:
Brian Suttor, Independent Chair (four-year term)
Greg Fletcher, Independent Member (four-year term)
Tony Whitfield, Non-Independent Member (permanent).
These processes provide a level of assurance that enables the senior management of The Audit Office of New South Wales to understand, manage and satisfactorily control risk exposures.
Peter Achterstraat Auditor-General 11 October 2010

The Audit Office of New South Wales AnnuAl RePORt 2009/10
92
Appendix eight
Accounts payable performance
Aged analysis at the end of each quarter
Quarter Current (ie within due date)
less than 30 days overdue
Between 30 & 60 days overdue
Between 60 & 90 days overdue
More than 90 days overdue
$ $ $ $ $
September – – – – –
December – – – – –
March – – – – –
June 56,007 – – – –
Accounts paid on time each quarter
total accounts paid on time
Quarter target %
Actual %
$
total Amount Paid $
September 95 98 3,553,017 3,622,533
December 95 99 3,401,598 3,433,010
March 95 100 2,488,702 2,489,467
June 95 98 3,574,300 3,635,417 Commentary
During the year, we paid most of our accounts on time and at least achieved our target of 95 per cent for each quarter.
We continuously review our payment process to ensure that our suppliers are paid within a reasonable time.
Interest on late payments
We did not incur any interest penalties for late payments.
Credit card certification
The Corporate Credit Card policy was last amended in February 2006. It is reviewed annually and is considered current. It outlines requirements for the issue, use and administration of cards. Its rules are consistent with government policy as outlined in Treasurer’s Directions and Treasury Circulars.
In accordance with Treasurer’s Direction 205.01, it is certified that the credit card usage by officers of the Audit Office has been in line with Government requirements.

The Audit Office of New South Wales annualrePOrT2009/10a
allegations of waste 13annual report costs inside back cover contact details back coverAudit and Risk committee 36Auditor-General message 2 history 1Australasian council of Auditors-General 41
b
benchmarking inside front cover, 9, 11, 36budget 44business risks 35
c
central government reporting 36client satisfaction 16code of conduct 35committees 36–37consultants 66corporate governance 35credit card certification 92creditor payments 45
d
disability action plan 90
e
employee satisfaction 30energy management 38environmental action 38equal employment opportunity 89equity 33executive positions 4, 72–73
f
financial audits clients 74 qualifications 10, 20 recommendations, acceptance of 18 reports 87 satisfaction with 16 timeliness 19financial commentary 44 accounts payable performance 92 break-even target 44 financial statistics 46financial statements 47freedom of information 37
h
highlights inside front cover
i
industrial relations 32information management 31internal audit and risk management statement 35, 37, 91iSO 9001 37iSO 27001 31
l
legislation 35letter of transmission inside front cover
m
mission 1multicultural policies and services program 89–90
o
objectives 1occupational health and safety 38office executive 4 performance statements 72office hours back coveroverseas secondments 32, 34 travel 80
p
parliamentarian satisfaction 8parliamentary committees, appearances before 81people 29people development 34
performance audits 22 follow-up 14, 22, 28 recommendations, acceptance of 18 reports 87 satisfaction 16performance management 31presentations private sector 40, 85 public sector 40, 82privacy 37professional activities 40–41professional development 34Public Accounts committee 14 hearings 14publications 87
q
quality assurance 36–37
r
reviews, internal and external 37risk management 35, 37
s
social club 33stakeholders/clients 1staff counselling 33 productivity 31 recruitment 32strategic plan 6, 35structure 4
t
training 34, 41turnover 32
v
values 1vision 1
w
Waste Reduction and Purchasing Plan 38
y
year ahead, the 6
index
Annualreportproduction
Total external costs to produce 400 copies were $32,000 for design, photography and printing.
Design
campbellBarnett www.campbellbarnett.com
Photography
Martin Mischkulnig www.martinmischkulnig.com
Parliament
Parliamentarians generally satisfied with our reports and refer to them frequently.
90 per cent satisfied with our reports and services.
95 per cent agree that our financial audits provide valuable assurance.
90 per cent believe our financial audit reports have effective layout and design.
93 per cent believe our performance audit reports identify significant issues.
86 per cent of financial audits reported to parliament on time.
8 performance audits reviewed by the Parliament of New South Wales’ Public Accounts committee.
Refer to page 7
Agencies
Good ratings for agencies’ overall perceptions of our financial audits.
Significant increase in agencies’ overall perceptions of our performance audits.
97 per cent of financial audit recommendations accepted.
92 per cent of performance audit recommendations accepted.
95 per cent of audit opinions were unqualified.
495 financial audits completed.
14 performance audits completed, 7 more than last year.
Refer to page 15
People
79 per cent employee satisfaction.
91 per cent of staff ‘satisfied’ or ‘extremely satisfied’.
83 per cent of employees highly engaged.
86 per cent employee morale—a 7-year high.
65 per cent productivity—an increase on last year.
44 per cent of middle management are women— a significant increase on last year.
7 per cent staff turnover.
4-star greenhouse building rating maintained.
Refer to page 29
Profession
38 presentations delivered to the public and the profession.
23 submissions made on proposed changes to accounting and auditing standards.
Refer to page 39
Finances
$0.8 million loss (excluding superannuation adjustments), the 5-year cumulative result outside our medium-term break-even point.
current ratio (solvency) is healthy.
99 per cent of our creditors paid on time.
Refer to page 43
Benchmarks
We benchmark ourselves against the national average for audit offices.
We expect our costs, as a proportion of total state assets and transactions, to be lower than most other states. As NSW agencies are typically larger than their interstate counterparts and the Audit Office of New South Wales is also larger, the economies of scale allow us to achieve lower costs on these measures.
Audit Office of NSW Average of Australian audit offices
Total audit costs (excluding payroll tax) per $’000 of public sector assets $2010 results not available.
.14
.23
.13
.20
.12
.21
.13.21
.14.20
2005
2006
2007
2008
2009
38 presentations made, 3 more than last year
$0.8 million loss (excluding superannuation adjustments), the 5-year cumulative result outside our medium-term break-even target
Our costs are significantly less than other Australian state audit offices
90% satisfied with our reports and services
97% of financial audit and 92% of performance audit recommendations accepted
91% of staff ‘satisfied’ or ‘extremely satisfied’
highlights
86
93
91
94
90
2005
2006
2008
2009
2010
Overall satisfaction % satisfied or very satisfied.Surveys not conducted in 2007.
2011 target 90
Overall satisfaction %Aggregate performance indices.
Financial audit clients
702006
Performance audit clients
67
712007
68
712008
77
702009
67
702010
73
752011 target
75
76
79
76
78
79
80
2006
2007
2008
2009
2010
2011 target
Employee satisfaction %
35
31
21
36
38
35
2006
2007
2008
2009
2010
2011 target
Presentations given
2006
2007
2008
2009
2010
2011
tar
get
2006
2007
2008
2009
2010
2011 target-1.0
-0.8
2.2
2.6
3.7
Operating results $mExcluding superannuation.
2.1
Total audit costs (excluding payroll tax) per $’000 of public sector transactions $ 2010 results not available.
Audit Office of NSW Average of Australian audit offices
.38
.35
.37
.39
.37
.282005
.252006
.242007
.262008
.272009


