368
NSW Department of Trade and Investment, Regional Infrastructure and Services ANNUAL REPORT 2010 -11

NSW Depar tment of Trade and Investment, Regional Infrastructure and Ser vices
ANNUAL REPORT2010 -11
31 October 2011
The Hon. Mr Andrew Stoner, MPDeputy Premier Minister for Trade and Investment Minister for Regional Infrastructure and Services Parliament House Macquarie Street SYDNEY NSW 2000
Dear Minister
In accordance with the Annual Reports (Departments) Act 1985, the Public Finance and Audit Act 1983, and the Regulations under these Acts, I am pleased to submit to you as the Department’s co-ordinating Minister, the 2010-2011 Annual Report of the New South Wales Department of Trade and Investment, Regional Infrastructure and Services for presentation to Parliament.
The document reports on the Department’s achievements for the past year against the corporate outcomes. These achievements were made possible by the willingness and commitment of staff and I would like to take this opportunity to thank them for their dedication and hard work, as well as the leadership and direction provided by the Divisional heads throughout the year.
The report also includes a summary of the major achievements of the Department’s statutory agencies. These agencies will also be submitting their own Annual Reports as required under the Act.
Yours sincerely
Mark I Paterson AODirector General

1NSW TRADE & INVESTMENT ANNUAL REPORT 2010 -11 CONTENTS
CONTENTS
Director General’s Year in Review 2
Corporate governance 5
About us 5
Organisational structure 6
Our results 7
Financial overview 9
Review of NSW Trade & Investment operations 11
Department of Primary industries 12NSW Office of Water 28
Crown Lands Division 42
Soil Conservation Service 49
Industry, Innovation and Investment Division 53Arts NSW 68
Office of Liquor, Gaming and Racing 80
Resources and Energy Division (incl. Office of Biofuels) 87Policy, Governance and Communications Division 103Corporate Services Division 110Statutory Agencies 114
Screen NSW 115
Forests NSW 116
NSW Food Authority 117
NSW Rural Assistance Authority 117
Game Council NSW 118
Art Gallery of NSW 119
Australian Museum 119
Museum of Applied Arts and Sciences 120
State Library of NSW 120
Sydney Opera House 120
Responsible Gambling Fund 121
Casino, Liquor and Gaming Control Authority 121
Catchment Management Authorities 122
Appendices 127
Financial statements 240
Index 364
Access and business hours inside back cover
1

2 DIRECTOR GENERAL’S YEAR IN REVIEW NSW TRADE & INVESTMENT ANNUAL REPORT 2010 -11
The year to 30 June 2011 marks the first reporting period for the new Department of Trade and Investment, Regional Infrastructure and Services (NSW Trade & Investment). The department unites the key NSW Government economic development agencies, offices and authorities that were previously part of a range of clusters.
In relation to the previous reporting period, the new department combines elements of the former:
● Industry & Investment NSW ● Communities NSW (Office of Liquor, Gaming and Racing;
Arts NSW)● Department of Planning (Crown Lands; Soil Conservation
Services)● Department of Environment, Climate Change and Water
(Office of Water; Marine Parks Authority; Catchment Management)
The creation of the new department is an opportunity to build on common skills and knowledge while maintaining an industry-specific, customer focus within each division. This annual report discusses these opportunities, and the challenges that come with them, under the five topic groupings:
● Trade, business and investment● Primary industries, land and water● Mineral resources and energy● Tourism, major events, hospitality, racing and arts● Positive business environment
Trade, business and investment
In a difficult environment of fluctuating business and consumer confidence and a strong Australian dollar, the department supported NSW industry by bringing investment and jobs to the State. NSW Trade & Investment attracted over 15 000 jobs and $2.6 billion in investment to NSW across a diversity of industry sectors. This included securing major information, communications and technology projects for the State worth over $200 million and attracting several substantial manufacturing projects with companies such as Midal Cables and Amcor Packaging to support over 1700 jobs.
Work also began on the implementation of Government policy to establish the NSW Export and Investment Advisory Board, the Multicultural Business Advisory Panel and the Office of the Small Business Commissioner.
With the Australian Government, the department hosted
and co-sponsored the 2010 Forbes Global CEO Conference in Sydney which attracted 380 leading business delegates, including 298 international chairmen, presidents, CEOs, philanthropists and thought-leaders. The conference was an outstanding opportunity to showcase Sydney and NSW to world business leaders.
The department helped improve the State’s global competitiveness by encouraging exports through the Global Growth Program, the International Tourism Incentive Fund, the NSW Export Lab and the Premier’s NSW Export Awards. Our involvement in the 2010 Shanghai Expo, G’Day USA and other trade events, efforts of our international offices in China (Shanghai and Guangzhou), India (Mumbai) and the United Arab Emirates (Abu Dhabi) and targeted international trade missions helped support NSW exports and attract international investment.
The department also funded over 30 scientific research and infrastructure projects through the Science Leveraging Fund to the value of more than $9.5 million.
We also provided assistance to regional and rural areas with numerous initiatives including, the Regional Business Development Scheme, managing the Building the Country Program and the Regional Development Advisory Council.
Primary industries, land and waterNSW Trade & Investment supports the development of profitable primary industries, creating a more prosperous New South Wales and contributing to a better environment through the sustainable use of our State’s natural resources.
The department successfully oversaw the restructuring of the State’s forestry industry. The restructure involved coordinating the NSW Government’s $51.5 million red gum structural adjustment package to manage the voluntary exit of sufficient red gum businesses to achieve a balance between the remaining industry and the available timber supplies.
Water management is a major priority for primary industries, regional communities and the department. The department led the management of the Border Rivers-Gwydir ‘Sustaining the Basin Farm Modernisation’ project; the first activity funded under the Australian Government’s seven-year $300 million Water for the Future initiative. The total value of on-farm works was $5.8 million, which achieved a total of 2.264 gigalitres (GL) of water savings, with 1.274 GL of entitlement transferred to the Commonwealth Environmental Water Holder.
The department’s Office of Water developed, implemented and assessed water sharing plans, expanded the water
DIRECTOR GENERAL’S YEAR IN REVIEW
3NSW TRADE & INVESTMENT ANNUAL REPORT 2010 -11 DIRECTOR GENERAL’S YEAR IN REVIEW
monitoring network and managed water sharing to ensure delivery of critical water supplies, while minimising impacts to the irrigation industry.
The Office also managed the $1.2 billion Country Towns Water Supply and Sewerage Program with 464 water and sewerage projects delivered since 1996 directly benefiting more than one million residents in country NSW.
With the breaking of the nine-year drought, the department continued to support regions through a new Rural Support Worker Program that will build long term community resources in the areas of change management of climate variability, household and business finance and personal wellbeing. During the entire drought period the NSW Government’s commitment to supporting rural industries exceeded $535 million.
NSW Trade & Investment, Catchment Management Authorities, other state agencies and local communities worked closely together to commence a process to update Catchment Action Plans within two years. This will deliver programs that remediate or improve natural resources such as native vegetation and soils, and deal with environmental hazards such as salinity.
The State’s biosecurity management capacity was enhanced through a $56.7 million upgrade of the Elizabeth Macarthur Agricultural Institute. The upgrade, which is on budget and due for completion ahead of schedule, will deliver new laboratory buildings that comply with the latest Australian Quarantine Inspection Service standards for biosecurity containment.
Emergency management and biosecurity were at the forefront as the department was confronted by the State’s worst mouse plague in over 15 years, a major locust plague and incursions by myrtle rust, Queensland fruit fly, chestnut blight, cattle ticks, Asian honey bees, Pacific Oyster Mortality Syndrome, aquatic weeds, and redfin perch. The department also responded to and supported industry through two major flood episodes.
Science and research continued to produce dividends for rural producers. Among the year’s successes were the breeding of cattle and sheep for lower greenhouse gas emissions, our work in helping landholders turn their farms into carbon sinks, development of the new Sherpa Rice variety and work on the Australian Durum Wheat Improvement Program.
Our ability to manage the State’s marine environment was improved by the commissioning of new Fisheries patrol boats and the establishment of the Aboriginal Fishing Advisory Council. The release of captive-bred Macquarie perch fingerlings added to a successful year of improved fish stocking. Our oceans were monitored by Fisheries staff, with several successful compliance campaigns including Operation Fusion, which smashed an illegal abalone syndicate. The derelict oyster-lease clean-up project continues to improve estuarine health, reduce the risk of pest species, and increase industry awareness of sustainable behaviour.
This year, the department published the Status of Fisheries Resources in NSW report, an important component of the reporting requirements for the State’s commercial fishery management strategies, which ensure fisheries resources are managed in a sustainable way.
In a year of challenging weather conditions, the department’s Soil Conservation Service achieved a record $23.2 million of business by delivering environmental projects for numerous clients across the State and treating a total of 7207 hectares of land. Strong demand from rural landholders, particularly those eligible for Rural Assistance Disaster Funding, continued throughout the year.
The department continued to manage over $6 billion of Crown land assets and worked with government entities and local communities to develop community assets. With the Clarence Valley Council, we developed a number of new natural camping sites to enhance low-cost holiday opportunities. We also provided staffing and support services to the Lake Illawarra Authority to restore the ecological and tourism values of a lake heavily degraded by the pressures of urban development. Further recreational opportunities were provided through the creation of an artificial reef and dive site on the Central Coast of NSW using the ex-HMAS Adelaide gifted to the State by the Australian Government.
Mineral resources and energy The combined value of NSW mineral production in 2010 -11 was approximately $19.5 billion. Coal production, at over $15 billion, accounted for around 80 per cent of the total, reflecting the continued significance of the coal industry to the State. The value of metallic and industrial mineral production was approximately $4.1 billion. Investment in petroleum exploration increased to a projected $160 million.
NSW mining royalty figures for 2010 -11 increased by $255 million from the previous year as a result of stronger commodity prices. The net royalty collected was $1.24 billion, with $1152 billion from coal and $88 million from minerals.
The department developed and implemented the Mining Regulation 2010, which provides for increased environmental protection, processes for significant improvement claims, penalty notice offences, service fees, fossicking provisions and information to accompany title applications.
We also assisted the Clean Coal Council to support the NSW Carbon Capture and Storage Demonstration Project, NSW Drilling Program to identify the CO2 storage potential in NSW, nine research and development projects and other initiatives in low emissions coal.
Key challenges included the delivery of electricity reliability. In 2010 -11 a target result of 99.9762 per cent was achieved, which is slightly better than the target of 126 minutes without supply.
A second major focus was the Solar Bonus Scheme, which created a significant workload because of the high levels of interest in the Scheme. The Statutory Review of the scheme began in August 2010 and the Scheme was formally closed on 1 July 2011 to new connections.

4 DIRECTOR GENERAL’S YEAR IN REVIEW NSW TRADE & INVESTMENT ANNUAL REPORT 2010 -11
The department began implementing the NSW Government’s commitments to reduce the burden of electricity prices by preparing the $200 Low Income Household Rebate program, starting to merge the three electricity distributors into two and reviewing the electricity network’s reliability license conditions. It delivered consumer protection measures to help customers with energy bills, including financial counselling, a free price comparison service and an Energy Assistance Guide.
We finalised the NSW contribution to an Intergovernmental Agreement on Energy Supply Industry Safety to progress nationally harmonised safety and technical regulation for energy networks.
The department’s Biofuels branch continued to implement the second stage of the biofuels program, embodied in the Biofuel (Ethanol Content) Amendment Act 2009.
Tourism, major events, hospitality, racing and artsThe department began implementing the NSW Government’s reform agenda with the passing of the Destination NSW Act 2011 and the establishment of the Visitor Economic Taskforce, which together will enhance Sydney and NSW as a major tourist and event destination.
The department secured major support for contemporary arts, mainly in the small to medium performing arts sector, including $1.5 million for the management of CarriageWorks at North Eveleigh.
This year’s Sydney Festival showcased new works and provided local creative workers with exposure to leading edge and established artists. Almost 700 000 people participated in a diverse program of 338 performances and 109 events by over 1000 artists in more than 30 venues.
The Biennale of Sydney was another major cultural event organised by the department’s Arts NSW. Held every two years across a number of venues in Sydney, the Biennale is Australia’s premier visual arts event. It attracted more than 517 000 visits, a 19 per cent increase on the 2008 event.
The department released the NSW Aboriginal Arts and Cultural Strategy to foster a vibrant and high profile Aboriginal arts and culture sector and allocated over $2 million for more than 50 Aboriginal arts and cultural programs across the State.
In May 2011 the Art Gallery of NSW launched a new free-entry display space for contemporary art, featuring the John Kaldor Family Gallery. The new contemporary galleries are supported by the first iPad App commissioned by the Gallery.
The department, through the Office of Liquor, Gaming and Racing, continued to protect the integrity of the liquor licensing system by introducing a regulation under the Liquor Act 2007 which imposed conditions on caterers selling liquor away from their permanent licensed premises. It also prepared for the introduction of a photo identity card for the Responsible Service of Alcohol and Responsible Conduct of Gambling competencies to improve regulation and marketplace monitoring.
Positive business environment The establishment of the new department in April 2011 was a significant challenge. Working groups were established to help create the new principal department and refocus the organisation on the new Government’s priorities.
The department delivered five priorities within the Government’s 100 Day Action Plan, and worked with central agencies to provide considerable input to the development of NSW 2021 – A Plan to Make NSW Number One.
Land use planning and managing land use conflict continued to be key challenges. The department will contribute to implementing the Government’s Strategic Regional Land Use Policy, triple bottom line assessment to protect our regions and participate on the Strategic Land Use Working Group and Mining Affected Communities Committee.
We supported a number of communications campaigns and events aimed at boosting investment across NSW that could ultimately result in increased jobs. These included initiatives aimed at ensuring that NSW industries are competitive nationally and internationally by supporting business opportunities to showcase local industries.
The department continued to review NSW legislation affecting primary industries with a view to reducing red tape. This led to one Regulation being allowed to lapse. Amendments were made to six Acts, 12 new Regulations subject to staged repeal in 2010 were remade and 17 Regulations were amended.
Staff and Executive BoardIn closing, I acknowledge and thank all staff for their efforts and achievements over the past year. Transformational change inevitably has its challenges but staff are rising to the occasion, helping to create a new department while retaining their unique focus and function.
I am looking forward to working with all to develop and implement a clear direction for the Department, supported by a structure that builds linkages between the parts that form NSW Trade & Investment and maximises our ability to provide quality services to the NSW public.
I would also like to thank the members of the Executive for their flexibility and energy in delivering so many major achievements in the past year against the backdrop of ongoing change.
Mark I Paterson AODirector General

ABOUT USThe Department of Trade and Investment, Regional Infrastructure and Services (NSW Trade & Investment) drives sustainable economic growth in NSW. We do this by working with and supporting the vast range of businesses and industries across New South Wales to advance investment, innovation, activity and business improvement across all sectors.Formed in April 2011, NSW Trade & Investment is designed to focus and strengthen NSW government services to provide maximum benefit to the state and to provide a strong customer focus in all areas of service delivery.
The department’s work includes: n promoting trade and investment within the state and key international marketsn providing business support, technical knowledge and science and research capabilities to industriesn developing and sustaining profitable food and fibre industries, and best practice natural resource managementn securing and regulating energy and mineral resources for the staten supporting tourism, hospitality, racing and cultural sectors
The department and divisions that form NSW Trade & Investment for the purposes of this annual report are:
n Department of Primary Industries (DPI) The department supports the development of profitable primary industries that create a more prosperous New South Wales and contribute to a better environment through the sustainable use of natural resources. DPI maintains close links with industry and has industry competitiveness and front-line service delivery as priorities.
DPI operates in a range of business areas including agriculture, fisheries and biosecurity, as well as the following areas:
NSW Office of Water - leads policy and reform in sustainable water management and assists water utilities to provide urban water and sewerage services that benefit all NSW.
Crown Lands Division - leverages state-owned Crown land, linking with other agencies, local government, the private sector and local communities to provide social and economic outcomes for the people of NSW.
Soil Conservation Service - is a soil conservation and environmental consulting business that specialises in environmental protection, rehabilitation and land management services to both rural and urban clients.
n Industry, Innovation & Investment Industry, Innovation & Investment Division - supports innovative sustainable businesses and industries that will increase productivity, employment and investment growth in NSW. It works with business to strengthen the State’s global competitiveness, promote investment and job creation and build business capability.
Arts NSW - is the Government’s arts policy and funding body, responsible for supporting and growing the arts and culture in NSW.
Office of Liquor, Gaming and Racing - supports community safety and wellbeing by regulating and promoting responsible liquor, gaming, racing and charitable industry practice and the responsible management of events.
n Resources and Energy Division, Office of Biofuels Mineral Resources Branch - is responsible for facilitating profitable and sustainable mineral resources development, effective environmental management and safe and responsible mining.
Energy Branch - is responsible for promoting secure, affordable and clean energy supplies and competitive energy markets for the benefit of all NSW consumers.
Office of Biofuels - is responsible for implementing the biofuels legislation and supporting further development of the biofuels strategy.
n Policy, Governance and Communications DivisionThe division plays a lead role in translating Government priorities and industry needs into the department’s policy and corporate agendas. The division coordinates whole-of-government approaches and manages strategic and contentious issues. It facilitates department-wide planning, performance improvement and strategic communications and promotes NSW industry and the work of the department.
n Corporate Services DivisionThe division develops, manages and advises on systems, infrastructure, policies and standards to provide services to the department in the areas of finance and administration, human resources, asset management, information and communication technology and legal services.
Other entities within NSW Trade & Investment are required under the Act to produce their own annual reports.
5NSW TRADE & INVESTMENT ANNUAL REPORT 2010 -11 ABOUT US

Wendy StampExecutive Director
Policy, Governance & Communications
Barry BuffierDeputy Director GeneralIndustry, Innovation &
Investment
Richard Sheldrake Director General
Department of Primary Industries
Mark DuffyDeputy Director General
Resources & Energy
Jeannine BivianoExecutive DirectorCorporate Services
Corporate Policy & Government Relations
Economic Policy & Research
Natural Resources Policy
Corporate Affairs & Media
Corporate Strategy & Communications
Industry, Innovation & Investment
Communications
Investment Attraction
Small Business & Regional Development
International Markets & Trade
Innovation, Science & Industry Analysis
Agriculture, Science & Research
Biosecurity
Industry Development Agriculture & Forestry
Fisheries
Science Strategy
Energy & Legal
Energy Strategy & Reform
Mineral Resources
Corporate Operations
Legal
People, Learning & Culture
Information & Communications
Technology
Strategic Business & Knowledge Management
Arts NSW
Office Liquor Gaming & Racing
Catchment Management
NSW Office of Water
Crown Lands
Soil Conservation
Marine Parks Authority
Office of Biofuels
NSW Trade & Investment - Statutory Agencies
Screen NSW l Forests NSW l NSW Food Authority l NSW Rural Assistance Authority l Game Council NSWRegional Catchment Management Authorities l Responsible Gaming Fund l Casino, Liquor, Gaming Control AuthorityState Library of NSW l Opera House l Art Gallery NSW l Australian Museum l Museum of Applied Arts and Science
NSW Trade & Investment
The Hon. Andrew Stoner, MP
The Hon. Katrina Hodgkinson, MP
The Hon. George Souris, MP
The Hon. Chris Hartcher, MP
Deputy Premier
Minister for Trade and Investment
Minister for Regional Infrastructure and Services
Minister for Primary Industries
Minister for Small Business
Minister for Tourism, Major Events, Hospitality and
Racing
Minister for the Arts
Minister for Resources and Energy
Special Minister of State
Minister for the Central Coast
Mark PatersonDirector GeneralProf. Mary O’Kane
Chief Scientist & Scientific Engineer
6 ORGANISATIONAL STRUCTURE NSW TRADE & INVESTMENT ANNUAL REPORT 2010 -11
as at 30 June 2011

7NSW TRADE & INVESTMENT ANNUAL REPORT 2010 -11 OUR RESULTS
OUR RESULTSKEY RESULT RESULT INDICATORS 2008-09
Actual2009-10
Actual2010-11 Forecast
# 2010-11 Est. Actual
Business investment, export revenue and jobs growth are supported across the State
Business investment In NSW ($b) 49.3 50.1 52.6 50.9
NSW’s GSP per capita ($000’s) 55.8 55.9 57.6 56.6
Growth in employment (% pa) 0.6 1.2 1.75 3.11
Jobs created in NSW (000’s) 21.8 39.9 na 107.12
Jobs created/lost in regional NSW (000’s)
-2.9 15.0 na 49.53
KEY RESULT RESULT INDICATORS 2008-09 Actual
2009-10 Actual
2010-11 Forecast
# 2010-11 Est. Actual
Industries are domestically and globally competitive
Value of primary industries Production ($m)
31 778 24 988 30 107 31 138
Mining royalties collected ($m) 1 279 985 1 768 1 2404
Industry capital expenditure investment (mining) ($m)
2 400 3 272 2 500 4 200
Value of targeted primary industries exports: Coal ($m) Agriculture ($m)
17 100
5 289
11 200
6 053
16 000
5 778
14 100
5 421Proportion of people employed in knowledge-intensive industries in New South Wales compared to the national average
> national > national na > national
KEY RESULT RESULT INDICATORS 2008-09 Actual
2009-10 Actual
2010-11Forecast
# 2010-11 Est. Actual
Energy frameworks support secure and reliable energy supplies and a competitive market
Unplanned electricity outages (mins) 135 107 126 125
GreenPower Sales - NSW (GWh) 564 537 640 5475
KEY RESULT RESULT INDICATORS 2008-09 Actual
2009-10 Actual
2010-11Forecast
# 2010-11 Est. Actual
Industries and communities have appropriate access to natural resources and manage them sustainably
Mines operating to agreed operation plans and subsidence plans (%)
97 97 97 97
Primary/target and secondary fish species harvested at biologically sustainable levels (%)
90 90 90 90
Proportion of water extraction covered by commenced water sharing plans (%)
90 90 95 95
Reduction in over-allocation of groundwater systems (%)
74 84 87 87
Soil treated by conservation earthworks (ha)
14 860 11 493 14 000 7 2076

8 OUR RESULTS NSW TRADE & INVESTMENT ANNUAL REPORT 2010 -11
KEY RESULT RESULT INDICATORS 2008-09 Actual
2009-10 Actual
2010-11Forecast
# 2010-11 Est. Actual
Industries are safe, healthy and biosecure
Value of primary industries production protected from market failure ($m)
9.6 4.9 10.5 10.5
Fatal injuries per million hours in the mining industry: Coal (injury/m hrs) Non-coal (injury/m hrs)
0.02 0.04
0.02 0.02
0.03 0.03
0.03 0.02
Compliance of energy network businesses with NSW statutory reporting Requirements (%)
100 100 100 100
KEY RESULT RESULT INDICATORS 2008-09 Actual
2009-10 Actual
2010-11Forecast
# 2010-11 Est. Actual
Rural and regional water supplies are reliable and sustainable and services across New South Wales are well managed and efficient
Proportion of requirements of Best Practice Management Guidelines for Water Supply and Sewerage met by local water utilities (%)
82 85 85 85
Proportion of regional population having access to water that complies with drinking water standards (%)
99 99 99 99
KEY RESULT RESULT INDICATORS 2008-09 Actual
2009-10 Actual
2010-11Forecast
# 2010-11 Est. Actual
Crown lands estate is managed to meet economic and community needs
Gross revenue collected from leases and licences compared to budget (%)
95 98 100 97.6
Performance against crown road closure and disposal targets met (%)
92 105 100 112
Crown reserves managed through trust arrangements (%)
20 21 21 21
Days the Tweed River entrance in navigable (no)
365 365 365 365
KEY RESULT RESULT INDICATORS 2008-09 Actual
2009-10 Actual
2010-11Forecast
# 2010-11 Est. Actual
Arts and charities sectors are strong and sustainable, and the hospitality and racing industries are responsible
Cultural businesses actively trading in NSW (000’s)
27.3 27.3 27.3 27.3
Employment in cultural occupation and/or the cultural industry (000’s)
171.4 171.4 170.0 170.0
Non-government support for Arts in NSW ($m)
89.7 82.6 80.0 80.0
People attending selected cultural venues and events (million)
4.5 4.8 4.6 4.8
Reduction in assaults on licensed premises (%)
13.8 7.1 3.1 5.7
# Current estimates as at 30 June 20111. The economy recovered better than expected in 2010-11 from the downturn in the previous financial year which was largely due to the GFC.2. Not reported last year, no forecast3. Not reported last year, no forecast4. Shortfall in the 2010 -11 royalty is due to the higher than anticipated strength of the Australian Dollar. Coal export sales are transacted in US dollars and therefore a strong Australian
Dollar reduce the sale price, which in turn reduces the royalty paid to the State. In addition, the forward estimates were based on higher exports from Newcastle, but delays in the dredging of the channel near the NCIG coal loader has meant that it will not reach optimum levels until 2011-12.
5. GreenPower is purchased on a voluntary basis, economic factors and price sensitivity affect sales.6. The heavy rains and floods experienced in October and December 2010, significantly reduced revenue opportunities for the SCS Works division. In the first half of the financial year
SCS bulldozers were under utilised and could not operate due to the excessively wet soil conditions. This is reflected in SCS Works’ financial result. In the medium term the breaking of the drought, the floods erosion damage and the now increased soil moisture levels are creating an increase in demand for Soil Conservation Services.
OUR RESULTS (continued)
9NSW TRADE & INVESTMENT ANNUAL REPORT 2010 -11 FINANCIAL OVERVIEW
FINANCIAL OVERVIEW 2010 -11
Budget StructureThe NSW Trade & Investment is an entity (for the purpose of financial reporting) which was created on 4 April 2011. The the former Department of Industry & Investment was renamed NSW Trade & Investment and also includes staff transferred from the former Department of Environment, Climate Change & Water, Land and Property Management
Authority and Communities NSW. This summary represents the financial performance for the year ended 30 June 2011 for the renamed department and from 1 April 2011 for the transferred functions and the financial position as at 30 June 2011.
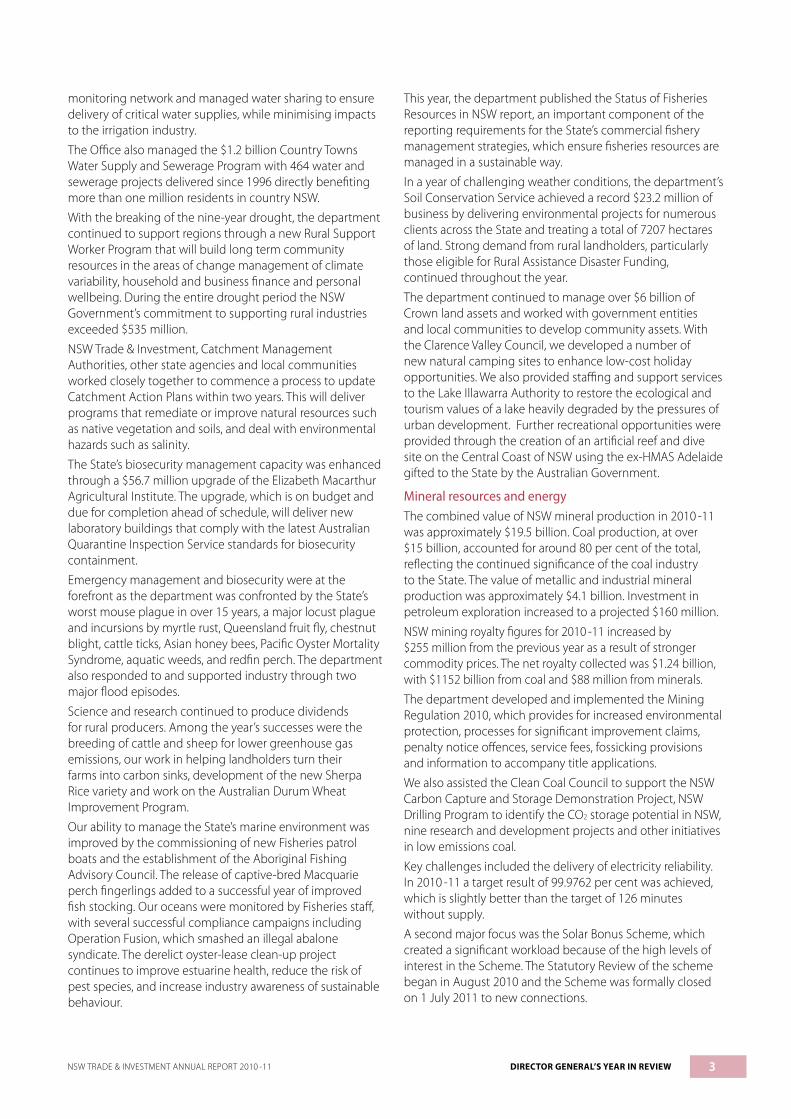
Source of Funds ($1201 million)
Total revenue for the NSW Trade & Investment for the year ending 30 June 2011 was $1201 million. The main sources of revenue were NSW Treasury funding $806 million, sale of goods and services $96 million, personnel services income $145 million and $97 million in grants and contributions received from external parties.
Application of Funds ($1192 million)Operating expenditure for the year ending 30 June 2011 was $1192 million. Of this total $478 million was for employee related costs including personnel services provided to entities within the NSW Trade & Investment cluster.
Grants and subsidies of $382 million included payments:
- $104.4 million for the Pensioner Energy Rebate Scheme - $39.9 million River Redgum Structural Adjustment payments - $32.5 million for Science and Medical Research - $30.1 million for Country Towns Water Supply and Sewerage Scheme - $21.6 million grant to State Water Corporation - $17.9 million for the Payroll Tax Incentive Scheme
Other operating expenditure of $331.3 million includes:
- $32.0 million for Tourism related marketing and program activities - $29.0 million for Regional Development Assistance - $21.0 million from the Major Investment Attraction Scheme - $16.3 million for assistance to industry - $35.8 million for depreciation on the department’s fixed assets
Sale of Goods and Services
Grants & Contributions
Personnel Services
Other Revenue
NSW Government Funding
67%12%
8%8%
5%
SOURCES OF FUNDS
Grants & Contributions
Other Operating Expenditure
Employee Related
40%
28%
32%
OPERATING EXPENDITURE

10 FINANCIAL OVERVIEW NSW TRADE & INVESTMENT ANNUAL REPORT 2010 -11
FINANCIAL OVERVIEW 2010 -11 (continued)
Assets ($8338 million) and liabilities ($981 million)The department’s net assets at 30 June 2011 were $7.4 billion comprised of total assets of $8.3 billion and total liabilities of $981 million. The largest component of the asset base relates to the value of Crown lands and infrastructure.
Crown revenuesNSW Trade & Investment collected revenues on behalf of the Crown entity totalling $1338 million in 2010 -11, the majority of which relate to mineral royalties, mining and exploration leases and coal lease concessions.
Current Assets
Non-Current Assets
Property, Plant & Equipment
89%5%
6%
TOTAL ASSETS
Non-Current Assets
Current Assets
Equity
88% 3%
9%
TOTAL LIABILITIES AND EQUITY
0
200
400
600
800
1000
1200
1400
OTHER MINERAL
2010-112009-102008-092007-08
CROWN REVENUES ($million)
11NSW TRADE & INVESTMENT ANNUAL REPORT 2010 -11 OPERATIONS
REVIEW OF NSW TRADE & INVESTMENT OPERATIONS
Department of Primary industries 12NSW Office of Water 28
Crown Lands Division 42
Soil Conservation Service 49
Industry, Innovation and Investment Division 53Arts NSW 68
Office of Liquor, Gaming and Racing 80
Resources and Energy Division (incl. Office of Biofuels) 87Policy, Governance and Communications Division 103Corporate Services Division 110Statutory Agencies 114
Screen NSW 115
Forests NSW 116
NSW Food Authority 117
NSW Rural Assistance Authority 117
Game Council NSW 118
Art Gallery of NSW 119
Australian Museum 119
Museum of Applied Arts and Sciences 120
State Library of NSW 120
Sydney Opera House 120
Responsible Gambling Fund 121
Casino, Liquor and Gaming Control Authority 121
Catchment Management Authorities 122

12 DEPARTMENT OF PRIMARY INDUSTRIES NSW TRADE & INVESTMENT ANNUAL REPORT 2010 -11
DEPARTMENT OF PRIMARY INDUSTRIES
Nature and scope of activitiesThe Department of Primary Industries (DPI) supports the development of profitable primary industries that create a more prosperous New South Wales and contribute to a better environment through the sustainable use of natural resources. DPI maintains close links with industry and has industry competitiveness and front-line service delivery as priorities. DPI also includes the NSW Office of Water, Crown Lands Division and the Soil Conservation Service.
The department comprises five branches:
– Agriculture, Science & Research
– Biosecurity
– Industry Development, Agriculture & Forestry
– Fisheries
– Science Strategy
This chapter also includes information from the Marine Parks Authority, Catchment Management and the Office of Rural Affairs.
Key challengesThe Productivity Commission estimates that the annual rate of return on investment from agricultural, forestry and fisheries research and development is 24 per cent. Almost half of the value of the State’s agricultural output can be attributed to new technology generated by domestic
research. Key challenges we face include:
• access to key resources, particularly water and land
• increasing costs and/or decreasing availability of agricultural inputs
• the need to assess the impacts of, and adapt to, climate change
• food security and biosecurity concerns
• globalisation of agricultural markets
• competition for funding on all levels.
While agricultural production across NSW benefited greatly from much improved seasonal conditions following long periods of drought in previous years, extreme rain events in 2010 and early 2011 brought significant challenges for farmers harvesting crops and for sheep producers. Fly strike was the major challenge to survival and production of both lambs and adult sheep. Farmers also faced the significant challenge of restoring drought and flood damaged pastures. Increasing mice numbers also continue to be a major concern in central, western and southern cropping areas of the State.
Land use conflict issues underpin current community concerns about food security, including the potential loss of productive agricultural land to mining development and urban expansion.
In implementing the NSW Government’s $51.5 million

13NSW TRADE & INVESTMENT ANNUAL REPORT 2010 -11 DEPARTMENT OF PRIMARY INDUSTRIES
red gum structural adjustment package, the department worked closely with a number of other key Government agencies to manage the voluntary exit of sufficient red gum businesses to achieve a balance between the remaining industry and the available timber supplies.
The Draft Guide to the Basin Plan caused significant concern in Murray Darling Basin communities. The Regional Communities Consultative Council, an independent community advisory body to the Premier and the NSW Minister for Rural Affairs, undertook the challenging yet vital role in ensuring that rural communities were able to voice their views on the Draft Guide.
In late November 2010, oyster farmers observed dead and dying farmed and wild Pacific oysters in the Georges River, though Sydney rock oysters showed no signs of being affected. Investigations indicated that the event, called Pacific Oyster Mortality Syndrome (POMS), is linked to a virus. The department worked with the Shellfish Industry Council of Australia and biosecurity and aquaculture staff to better understand and manage the disease. A national surveillance program was developed to determine the spread of POMS and the department worked with the NSW oyster industry to build capacity to respond to this new risk.
Protecting the competitiveness of agricultural industries and our unique environment from the degrading effects of exotic pests and diseases and natural disasters remained a challenge for the department during 2010 -11. Ironically, the improving conditions following seven years of drought provided ideal conditions for significant outbreaks of a number of pests. As a result, response plans were activated to:
• manage record outbreaks of Queensland fruit fly in the southern exclusion zones
• coordinate the air and ground treatment of more than 240 000 ha of productive agricultural land under threat from one of the biggest locust plagues on record
• coordinate control programs for the worst mouse plague in over 15 years.
Major outcomes achieved
Competitive and productive industries
Improving flock bloodlines and reproduction The department is involved in the national research project Information Nucleus Flock, a sheep genetics service that allows breeders to accurately select individual rams based on their breeding value. The department released an updated information booklet in 2010 on the performance of merino ram sources from across Australia, allowing breeders to identify the rams that best match their breeding objective. The booklet was distributed nationally with the assistance of Australian Wool Innovation.
Australia’s national sheep flock has fallen to its lowest in over 100 years and the industry is concerned that export and domestic markets for lamb, mutton and wool will not be maintained with current flock numbers. The department, in
conjunction with the Sheep Cooperative Research Centre, developed a program working with sheep pregnancy scanning contractors and their clients to raise lamb survival rates. Identifying ewes that rear twins and selecting their progeny back into the breeding flock significantly improves a flock’s overall net reproduction rate. Nineteen Managing Scanned Ewes workshops were run for 475 sheep producers and their scanning contractors, who collectively run 640 000 sheep. Producers gained skills in fat scoring and meeting ewe nutritional needs and gained a better understanding of how to improve flock conception rates and strategies to improve lamb survival.
Private Native Forestry workshops A highly successful Private Native Forestry Field Day program was delivered via 24 field days to 353 landholders. A total of 42 field days have been held since the program commenced. The field days introduce landholders and contractors to the Private Native Forestry codes and demonstrate the improved biodiversity and commercial benefits of undertaking effective management practices. They were delivered under the departments PROfarm brand and were held in key Private Native Forestry locations around the State. This project was funded by the Office of Environment & Heritage under the NSW Government’s training and accreditation package for Private Native Forestry.
A full series of Private Native Forestry-related Primefacts and Paddock Plants publications are now available online at www.dpi.nsw.gov.au
New crop variety information now available to growers The department was successful in gaining the tender to provide services to the National Variety Trial (NVT) project managed by the Grains Research & Development Corporation for NSW for the 2010 -14 seasons.
The project provides varietal information to growers and advisers on a range of traits, including yield, grain quality, wheat coleoptile length and acid soils tolerance. The NVT is pivotal in providing growers with high-quality independent information on new crop varieties for NSW from national breeding programs.
Making better fertiliser decisions for Australian cropping systems The department leads a national project aimed at helping farmers and agricultural advisers make better fertiliser decisions for cropping systems based on soil test data. The project is supported by the Grains Research & Development Corporation and involves collaboration between more than 20 agricultural agencies, fertiliser companies, agribusiness, and universities from across Australia.
The project is developing an online database of 5000 nutrient response trials for nitrogen, phosphorus, potassium and sulfur use in cereal, pulse and oilseed crops and specific training resources to enable agricultural advisers and students to use the database.

14
Agricultural education and achievements Tocal College continues to attract high enrolments from young people preparing for careers in agriculture and the horse industry. Course completion rates are over 92 per cent and there is a continued strong demand for graduates. The emphasis on practical training on Tocal’s commercial farms has ensured the courses continue to meet the needs of employers.
The college also delivered short courses to over 4000 participants across NSW. An integrated program that allows for targeted training in industry skills sets, full qualifications and recognition for prior learning has enabled 297 people to complete national industry-based qualifications, mainly in agriculture.
Tocal students gain practical hands-on training
Research and extension that supports growers The department is involved in several projects that improve growers’ success rates. In February 2011 we launched the interactive website CropMate™ in conjunction with the Grains Research and Development Corporation. The site provides grain producers and other industry stakeholders a ‘one-stop-shop‘ to access decision-support tools from the Bureau of Meteorology and Queensland Climate Change Centre of Excellence.
CropMate™ incorporates cutting edge research and includes crop-sowing advice, nitrogen-budgeting tools, spraying condition reports and more. These tools interact with climate, weather, soil, crop and economic data to produce recommendations for each user defined locality.
CropMate™ had 1096 hits in the first two months of operation. A pilot mobile phone application is being developed for in-paddock use for the 2012 cropping season.
The Northern Grains Region Trial Results is a valuable resource for grain growers and advisers in the region, keeping them abreast of current research and potential management options for the season ahead. Published in May 2011, it brings together the collective results of the department’s grains research into pathology, weeds, and cereal agronomy and summer crops.
Sherpa rice was released at the Rice Field Day on 2 March 2011. Sherpa (YRM 69) has a 2°C improved tolerance to low temperatures which, at the critical stage of pollen
development, can reduce yields by up to half every four years. Sherpa produces 2-4 tonnes per hectare (t/ha) more than the current commercial varieties. As Australian commercial rice production yields around 10 t/ha, Sherpa offers the industry the ability to more accurately predict production levels, even in years of low water allocation. The variety is the result of collaboration between the department, the Rural Industries Research and Development Corporation and SunRice.
Finally, the internationally competitive Australian durum wheat industry experiences demand that far outstrips supply. DPI researchers have worked to address this, with the release of strains (Caparoi, Jandaroi and Bellaroi) that are all setting industry benchmarks for yield and quality.
Resilient chickpea varieties prove themselvesIn spite of the worst chickpea season on record, recent results indicate a bright future for the chickpea industry. New varieties developed by the department’s chickpea breeding team stood up exceptionally well to extreme disease pressure in trials at the Tamworth site, while at the same time older varieties succumbed to wet weather, disease, water-logging and a wet harvest. The trial results mean that growers who take on these new varieties will not need to spend money on fungicides, representing significant savings and crop protection.
Guidelines for nutrient management of Asian vegetables The Asian vegetable sector has grown rapidly since the 1990s and is now worth an estimated $204 million. It is largely based in the peri-urban agricultural areas of the Sydney Basin, and production is largely hydroponic. This can be highly efficient in use of water and nutrients but only if managed according to the needs of each crop which, until recently, were yet to be determined for leafy Asian vegetables. Over the past two years, researchers have provided growers with these guidelines and assisted in their implementation.
SmartStretch meat: Try a little tenderness SmartStretch is a new technology developed by the department in collaboration with Meat & Livestock Australia. It allows beef and lamb cuts to be stretched and packaged in pre-rigour state and, in doing so, improve tenderness and consistency. Over the past year it was established that SmartStretch can be used to improve tenderness of hot-boned lamb cuts by up to 45 per cent. This technology’s ability to shape and portion the meat easily gives the industry the tools to deliver not only a more tender but also a more consistent product.
Modelling and genetics for better beef and ‘easy care‘ sheepHow do animals grow and lay down fat, and how does this influence meat quality and yield? These questions are being addressed right now by the department’s Animal Production researchers. The team created models for fat deposition and distribution and, from this research, developed BeefSpecs,
DEPARTMENT OF PRIMARY INDUSTRIES NSW TRADE & INVESTMENT ANNUAL REPORT 2010 -11

15
a fat calculator to assist the beef industry meet exact specifications.
Breech strike, the major form of flystrike, is traditionally addressed by surgical mulesing; however, increasing animal welfare considerations have provided the impetus for development of alternatives, in this case, using genetics to improve resistance to breech strike. Results from initial studies indicate that ‘easy care‘ traits can be improved by breeding selection, and that this selection does not compromise wool production and quality.
Sydney rock oyster breeding program (1990-2015) The department’s selective breeding program has lines of oysters that have been shown to grow more than 35 per cent faster than normal oysters and reach market size a year earlier. Some of these lines are capable of resisting a single exposure to QX disease, while others are showing significantly improved survival in the face of winter mortality. There are now more than 90 different lines of Sydney rock oyster. Many are used to select oysters for marketability characteristics (shape and condition) while others are used to assess the capacity for breeding to face challenges posed by climate change.
Animal Biosecurity Symposium An Animal Biosecurity Symposium was held at the Elizabeth Macarthur Agricultural Institute to showcase research solutions for animal health and biosecurity. Topics included on-farm biosecurity projects (such as controlling Lawsonia infections in pigs), assessing the disease risks from wild animals, and zoonotic diseases in pigs.
Sustainable management and use of natural resources
Responding to climate variability The Climate Smart Agriculture initiative is helping farmers to increase productivity and reduce greenhouse gas emissions while at the same time responding to the vagaries of our climate. One of the methods to reduce greenhouse gas emissions is by sequestering carbon in either plants or the soil. The Soil Carbon Project is a multi-agency project that has improved our understanding of soil carbon and how agricultural management practices can influence it. The project also implemented a pilot soil carbon market-based instrument to encourage producers to increase the carbon that is stored in the soil.
Life cycle assessments, developed in the manufacturing sector, are now being applied by the department to agriculture where they are used to assess the environmental impacts of production systems. Since July 2010 the department has developed an assessment for greenhouse gas emissions from wheat production, considering both pre-farm and on-farm emissions, and has also commenced development of assessments for livestock enterprises.
Support for the poultry industry We continued to support intensive agricultural sectors by developing guidelines that help local planning consent
authorities make better planning decisions. The department produced the new guideline Better Site Selection for Poultry Farms, which sets out key factors for growers to consider when buying a property or considering expanding their existing operations. The guideline also helps growers identify potential odour impacts.
Plantations and forestry industriesMore than 165 000 hectares (ha) of new plantations have been authorised under the Plantations and Reafforestation Act 1999, administered by DPI. In addition to the new plantations a further 50 000 ha of existing plantations have also been authorised. This represents an investment of almost $620 million in plantation development in NSW. All new plantations greater than 30 ha in size must be authorised under the Act and comply with best practice environmental standards under the Plantations and Reafforestation (Code) Regulation 2001.
The department also managed three forest industry restructure programs during 2010 -11.
• The Brigalow Assistance Fund included Business Exit, Worker Assistance and Industry Development Assistance to a total of $48.762 million. An independent report on the implementation of the Brigalow package concluded that the Fund’s objectives had been achieved.
• The Private Native Forestry Industry Assistance program was completed in 2010 -11 and included the provision of $1.22 million to private native forestry businesses and workers who were adversely affected by the introduction of the Private Native Forestry Codes.
• The River Red Gum Structural Adjustment Program is a $51.5 million fund to assist red gum businesses and workers adjust to the reduction in timber supply after the conversion of 105 000 ha of State forest to national park.
To date, $25.389 million has been paid to exiting timber mills and contractors, $13.752 million has been paid to 173 workers and $1.173 million has been paid to other businesses impacted by the forest decision. Additional payments will be made during 2011-12 to assist in mill site clean up and worker retraining costs.
Smart Farms projectsThe department was funded through the Australian Government’s Water for the Future Fund to deliver the Water Smart Farms and Nutrient Smart Farms projects. These projects are part of the Hawkesbury Nepean River Recovery group of projects that aim to improve water quality and increase water available for the environment.
The Nutrient Smart Farms Project has engaged with over 900 landholders since 2009 and, in partnership with the Hawkesbury Nepean Catchment Management Authority, developed 188 on-ground works projects valued at over $6.8 million. On-ground works will reduce off-farm movement of 78 tonnes of nitrogen and 17.5 tonnes of phosphorous, greatly improving water quality of the Hawkesbury Nepean River system. Compost has been applied to 380 ha of farmland to further reduce erosion and nutrient movement.
NSW TRADE & INVESTMENT ANNUAL REPORT 2010 -11 DEPARTMENT OF PRIMARY INDUSTRIES

16
The Water Smart Farms Project worked with irrigators to improve water use efficiency and reduce water contamination. Seventy-six training events have been held since 2009 and over 6 gigalitres (GL) of water savings have been identified through on-farm irrigation system audits. The $10.6 million irrigation infrastructure upgrade grants program is on track to deliver 5.9 GL of total water savings, with 4.5 GL contributing environmental benefits for the river system. The potable water program funded by the NSW Climate Change Fund identified over 300 ML of potable water savings and is working with irrigators to fund recycling and water harvest projects.
Natural resource managementCatchment Management Authorities (CMAs) deliver programs that remediate or improve natural resources such as native vegetation and soils, and deal with environmental hazards such as salinity. The department provides the 13 CMAs in NSW with state-level administration and grant funding.
The department supports CMAs by administering board, chair and general manager appointments, and developing financial and corporate governance frameworks. We also support the Natural Resources Advisory Council, the peak stakeholder body for natural resource management.
CMAs are commencing to update their Catchment Action Plans (10-year strategic Plans) to reflect shifts in community knowledge, expectations and attitudes towards Natural Resource Management issues. Two CMAs have completed a pilot Catchment Action Plan upgrade process. The pilots will help streamline the process for the remaining 11 CMAs. The Catchment Action Plan update process is a collaborative effort between CMAs, the department, other State agencies and local communities.
Border Rivers–Gwydir Sustaining the Basin Farm Modernisation project This pilot project, which was the first activity funded under the Australian Government’s seven-year $300 million Water for the Future initiative, successfully trialled a process for incentive-based on-farm infrastructure delivery. The department was the lead agency, with administrative and operational support provided by the Border Rivers–Gwydir Catchment Management Authority.
Total value of the on-farm works was $5 802 067, of which $4 612 445 came from project funds and $1 189 622 was contributed by entitlement holders. A total of 2.264 GL of water savings were achieved, with 1.274 GL of entitlement transferred to the Commonwealth Environmental Water Holder.
Communities in Landscapes project This project developed cross-property plans with six groups of 10 landholders situated in the Murrumbidgee, Lachlan and Central West catchments. These plans are set to produce significant outcomes within and between properties in terms of farm production and conservation of Box Gum Grassy Woodlands.
Aboriginal Fishing Advisory Council The spiritual, social and customary significance of Aboriginal cultural fishing, as well as the need for protection, promotion and continuation of Aboriginal cultural fishing, is now formally recognised in the Fisheries Management Act 1994. Aboriginal cultural fishing is a defined fishing activity that is separate from recreational and commercial fishing.
The Aboriginal Fishing Advisory Council was established under the Act as the peak advisory group to the Minister for Primary Industries on issues affecting Aboriginal fishing interests. In March 2011 the Council held its inaugural meeting. It will play an important part in the development of cultural fishing policy as well as exploring commercial opportunities associated with fish resource activities for Aboriginal communities.
Recreational fisheries enhancement program The Recreational Fisheries Enhancement Program is funded by the NSW Recreational Fishing Trust and includes the deployment of fish aggregating devices in ocean waters and the creation of artificial reefs for the benefit of recreational fishing.
The most recent project completed as part of this program was the Botany Bay reef in May 2011. This is the fifth artificial reef to be built since the project began in 2005 and creates a new fishing hotspot of over 2000 m2 (a total increase of hard reef volume in the Yarra Bay region of almost 400m3).
The natural evolution of the artificial reefs project is its expansion into open ocean waters. Following a lengthy environmental assessment process, the department received approval to construct the State’s first purpose-built recreational fishing artificial reef in ocean waters. Located in 38m of water, approximately 1.2 km off the entrance to Sydney Harbour, the artificial reef will be constructed of steel, weigh in excess of 40 tonnes, stand 12 m high and provide a complex internal reef volume of over 700m3. Construction and deployment of the structure is scheduled for late 2011.
Fish stocking Fish stocking helps maintain natural populations and helps to boost existing stocks for recreational fishers. It is also an important conservation tool for endangered species. The NSW Government runs a comprehensive and sustainable fish-stocking program based on the Fish Stocking Fisheries Management Strategy.
Four Government-owned hatcheries produce fish species for public release, including Narrandera Fisheries Centre (Murray cod, golden perch, silver perch, trout cod, Macquarie perch, olive perchlet and southern pygmy perch), Port Stephens Fisheries Centre (Australian bass), Dutton Trout Hatchery (rainbow trout and brown trout) and Gaden Trout Hatchery (rainbow trout, brown trout, brook trout and Atlantic salmon). A total of 4 017 730 fish were stocked in 2010 -11 by the NSW government.
More than $645 000 was allocated in 2010 -11 by the Government to support this highly successful program, with
DEPARTMENT OF PRIMARY INDUSTRIES NSW TRADE & INVESTMENT ANNUAL REPORT 2010 -11

17
an additional $848 000 from the Recreational Fishing Trust. The Recreational Fishing Trust also contributed $200 000 for the community-based dollar-for-dollar fish-stocking program; 753 761 native fish were released by fishing clubs and councils as part of this program in addition to those released by the NSW Government.
IIlegal trapping and fishing A syndicate believed responsible for trafficking illegal abalone worth millions of dollars was smashed by a joint department and NSW Police operation in February 2011. Two men were arrested and more that 1300 abalone were seized. Operation Fusion examined the activities of the syndicate since late 2010, but investigators believe it could have been trafficking illegal abalone for over a decade. The investigation uncovered an allegedly intricate system of dive locations, abalone theft, surveillance techniques, storage and transport operations.
During the year over 1000 crab traps were seized following crackdowns on illegal trapping. A commercial fisher was apprehended with more than 20 commercial fish traps, a grappling device and a monofilament meshing net during Operation Echo 11, which targeted unlawful trapping at Port Stephens. The man faces a maximum penalty of a $22 000 fine and/or six months imprisonment.
In another raid more than 70 unlawfully set fish and crab traps were seized by fisheries officers during an operation in the Wallis Lake district. A man also faced charges for unlawfully setting fish traps and interfering with set fishing gear.
Court outcomes and seizures Proceedings for 274 fisheries offences were completed in court in 2010 -11. After allowing for matters withdrawn (30), 97.1 per cent of prosecutions were successful. The average fine (for the 159 matters for which fines were ordered) was $789 or $1472 when court and professional costs are included.
Some significant court decisions included:
• A person was convicted in Grafton Local Court of illegal eel trapping. He was fined over $4000 and his boat and eel traps forfeited.
• One offender convicted at Liverpool Local Court for offences relating to eastern rock lobsters was ordered to pay $2992 professional costs and received a 13 - month intensive correctional order.
• An offender convicted at Campbelltown Local Court for saltwater nipper offences was fined $8100, $158 in court costs and $9580 in professional costs.
• Two offenders convicted at Moruya Local Court for rock lobster and abalone offences were fined $8000 and $4400 in professional costs and each ordered to perform 100 hours community service.
• One offender convicted at Batemans Bay Local Court for abalone offences received fines totalling $1000 and 12 months imprisonment.
• A commercial fisher apprehended trawling in waters closed to that method, and possessing undersized and mutilated fish, was convicted at Bega Local Court and fined $1000 and ordered to pay $5000 in professional costs.
• Three men convicted in Nowra Local Court for digging and collecting pipis were fined $9000, court costs of $237 and ordered to pay $7584 in professional costs.
Nearly 40 000 fish, molluscs and crustaceans of various species were seized during 2010 -11, including 9511 saltwater nippers, 9711 cockles, 7756 abalone (758 in one seizure), 872 tailor, 344 crabs and 76 bonito. Nearly 3000 items of fishing gear and equipment were seized, including 616 nets, 1579 traps and two boats.
Reducing greenhouse gas emissions and adapting to climate changeMethane emissions from cattle and sheep account for two-thirds of greenhouse gas emissions from Australian agriculture. The department is addressing this challenge through an extensive research program, with initial trial results finding that methane production appears to be heritable. This opens the possibility that farmers may be able to use animal breeding to reduce levels of methane emissions while simultaneously boosting productivity. Our scientists are also evaluating a range of nutrition management and rumen manipulation techniques to reduce emissions.
Research is helping wheat farmers adapt to climate change. It will guide the development of the State’s cereal breeding and agronomy programs and provide practical information to help farmers adapt to climate change on a paddock-by-paddock basis. After downscaling global climate models for 509 sites across the NSW wheat belt, impacts of climate change on wheat development can be addressed.
Biochar to the rescue Biochar refers to the carbon-rich output of a process in which an organic material (‘biomass’) is heat treated to between 450-600° C in an oxygen-deprived environment. Biochar has the potential to increase long-term carbon storage in soil and enhance agricultural productivity. A long-term laboratory experiment revealed that the stability of biochar in soil varies according to the feedstock and conditions under which it is produced. However, in all cases, a large proportion of the carbon in biochars will remain in soil for more than 100 years. This is the commonly required timeframe for acceptance under emissions trading and carbon offset schemes.
Converting eucalypt forestry waste residues into biofuelsEucalypt wood residues from subtropical plantations could produce about 10 million tonnes of feedstock over the next 15 years in the Grafton catchment. This represents a unique opportunity to develop a biofuels industry whilst mitigating greenhouse gas emissions. Our research is developing methods to convert this wood residue into ethanol. Work is
NSW TRADE & INVESTMENT ANNUAL REPORT 2010 -11 DEPARTMENT OF PRIMARY INDUSTRIES

18
assessing biochemical pretreatment options to improve the efficiency of sugar extraction from cellulose.
Improving basin irrigation systems in southern NSWBasin irrigation systems, used on very low permeability soils in rice farming systems, are surface-irrigated areas that have complete perimeter banks to pond water and prevent run-off. The project sets out to improve the design and performance of these systems, delivering higher yields with reduced operating and environmental costs. It established that efficiency of slow-draining basin irrigation systems in southern NSW may be improved by up to 0.3 ML/ha for each irrigation if layouts are modified to reduce drainage times.
Helping farmers turn their farms into carbon sinksThe department released The Farmers’ Guidebook on Soil Carbon, which looks at a range of options for increasing soil carbon under pasture. With around 80 per cent of the State’s agricultural land being pasture, this publication could help farmers turn pasture soils into an important carbon sink. We also held free soil carbon workshops developed by our leading soil scientists. These workshops help farmers recognise the fundamental importance of soil carbon and cover various methods and their effectiveness for manipulating soil carbon levels.
Captive-bred Macquarie perch fingerlings successfully released A group effort by researchers from the Aquatic Ecosystems unit and staff from the Fisheries Resource Management and Fish Conservation & Aquaculture branches achieved what has eluded fish hatcheries for several decades: captive breeding of the endangered Macquarie perch, an endangered freshwater fish native to the Murray-Darling Basin. Using an artificial stream at the Narrandera Fisheries Centre, the project team coaxed captive perch into thinking they were in a natural environment. Having developed the capacity to establish a captive breeding and reintroduction program for the species, the possibility of large-scale recovery of Macquarie perch is now a step closer.
Annual Fisheries Resource Assessment WorkshopThe annual Resource Assessment Workshop was held in April 2011. The status of the stock for a total of 70 marine or estuarine fish species or species groups was assessed at the workshop.
Sydney Basin joins UNESCO Hydrology for Environment, Life and Policy eco-hydrology program The Sydney Basin is now part of the UNESCO Hydrology for Environment, Life and Policy eco-hydrology program. A result of collaboration between the department and the University of Western Sydney, this recognition builds on activities that commenced under the Cooperative Research Centre for Irrigation Futures and helps to increase the research input to peri-urban water management. The UNESCO listing will also see the Western Sydney area develop as a demonstration site for eco-hydrology investigations, including improving the understanding of
balancing economic growth and hydrologic function of rivers and waterways.
Monitoring the biology of bull sharks in NSW Understanding the biology of sharks and where they move and live is essential to help protect them and their habitats – and to keep people safe. Since March 2009, department researchers have tagged over 50 bull sharks in Sydney Harbour and the Clarence River.
Monitoring forest biodiversityThis project is helping the conceptual development of, and providing support for, the scientific foundation for a comprehensive biodiversity monitoring program in NSW forests. Opportunities for automatic recording of species occurrences have been investigated, as well as the potential of remotely sensed data to record changes in forest structure and to serve as a habitat surrogate for a wide range of species.
Safe, healthy and biosecure industries
Oyster projects The derelict oyster lease clean-up has been underway since July 2009 and will continue for another year. A total of 185 oyster leases (approximately 260 ha) have been removed through a mixture of:
• departmental clean-ups, funded by Catchment Management Authorities
• grower-initiated clean-ups in line with Environmental Management System targets (Clyde River Community Coast Care Grant)
• the re-leasing of derelict areas to current farmers (through derelict lease offer and other incentives)
• compliance action to recover the costs of clean-up from former lessees.
In 2011, approximately 26 ha of derelict oyster lease material was removed from the Port Stephens-Great Lakes Marine Park as a result of a $45 000 Caring for Country grant from the Hunter–Central Rivers Catchment Management Authority.
Local farmers started work in December 2010 and have cleaned up leases in the Karuah River, Big Swan Bay, Pindimar and Tea Gardens areas. Three wetland sites where material had been illegally dumped were also cleaned up. The work undertaken in the Singing Bridge area at Tea Gardens removed a major eyesore and opened up an area that is popular with recreational boaters and tourists.
The aim of the project was to improve estuarine health, reduce the risk of pest species, and to increase awareness within industry of the skills and expertise that they can contribute to community environmental action.
The NSW Oyster Industry ‘Sustainable Aquaculture Strategy’ and ‘State Environmental Planning Policy 62 – Sustainable Aquaculture’ work together to improve safeguards for water quality in NSW oyster harvest estuaries. Central to these safeguards is the referral of new development to the
DEPARTMENT OF PRIMARY INDUSTRIES NSW TRADE & INVESTMENT ANNUAL REPORT 2010 -11

19
department so that potential impacts on estuarine water quality can be identified before they become a problem. This year Aquaculture Management staff responded to 27 referrals, mainly for development that includes on-site sewerage management systems. In most cases a satisfactory outcome was negotiated, but in several instances the identified impacts could not be ameliorated and the project was refused.
Shark Meshing (Bather Protection) Program The Shark Meshing (Bather Protection) Program is a public safety measure introduced in 1937 to reduce the risk of shark attack at the State’s most popular public bathing beaches. Fifty-one beaches are netted by contractors using specially designed meshing nets. The program has been effective in helping to provide a safer environment for swimmers, with no fatalities on a meshed beach in over 50 years, and only one fatality since the program commenced.
In 2010 -11, following the recommendations of a 2009 report into the environmental impact of the program, beach-meshing contracts were revised so that the program would operate in accordance with Joint Management Agreements and an associated management plan under the Fisheries Management Act 1994 and the Threatened Species Conservation Act 1995.
As of September 2010, six regions are meshed by contractors (Hunter, Central Coast, Sydney North, Sydney Central, Sydney South and Illawarra), with the original Sydney North region split into two smaller regions in accordance with the recommendations of the review.
A trial using a mixture of fixed wing and helicopter flights to complement the program was undertaken during the peak swimming times on every weekend, public holiday and every Wednesday from 22 December 2010 to 30 January 2011. The effectiveness of the aerial trials is being evaluated and it is expected to continue into the 2011-12 swimming season.
A busy time for fish-kill response across the StateOngoing flooding of the Murray, Murrumbidgee and Edward-Wakool rivers resulted in unprecedented black-water events, as floodwaters in floodplain forests receded and low dissolved oxygen water poured back into the river systems. Reports of dying fish, particularly large Murray cod, occurred from Barmah on the Murray River all the way to South Australia. Kills were also reported in the Edward and Murrumbidgee river systems. We worked with the relevant authorities to undertake fish rescues where appropriate, to aerate water in locations where it was feasible to do so and to look at options for dilution flows.
A major fish kill involving thousands of fish of all species and sizes occurred in Jervis Bay in early January 2011. The kill was investigated by the department, with the Office of Environment and Heritage. Fish and water testing found that a natural microalgae that is toxic to fish, but not humans, was the cause.
A fish kill occurred in the Clarence River following flooding
in early January. The kill affected thousands of gudgeon, eels and millions of blood worms. Low dissolved oxygen conditions associated with receding flood waters were identified as the cause, with almost no oxygen detected in the water in the main river channel and inflowing creeks and drains. Water quality has improved in the river following the event and the kill did not require any targeted fishery management responses as commercial and recreationally targeted species were largely unaffected.
Small hive beetle control The APITHOR™ device was developed in response to the small hive beetle, a potentially devastating threat to Australia’s honeybee industry and one that has already caused significant losses to America’s multi-million dollar industry. The device is designed to allow adult beetles to be exposed to a lethal dose of insecticide while preventing bee access. Trials proved the device to be highly effective without compromising hive health and productivity, no insecticide residues are detected in honey. The device has been patented and is being marketed internationally.
Elizabeth Macarthur Agricultural Insititute (EMAI)The team in the Virology Laboratory at the Elizabeth Macarthur Agricultural Institute secured funding for an important serological survey of horses in NSW. This survey will monitor for infection with Kunjin and Murray Valley encephalitis viruses. It is a follow up to a large number of diagnostic submissions to the Virology Laboratory which identified a Flavivirus as being responsible for an outbreak of neurological diseases in horses in NSW, Victoria and South Australia. Cases of the disease were widely distributed across NSW and involve a range of clinical signs related to encephalitis. Most horses recover, but the case fatality rate is approximately 10 per cent.
A major trial is also underway at EMAI to test a new vaccine against Mycoplasma pneumonia in pigs. This condition is common throughout Australian pig herds, costing producers an estimated $5 to $7 per pig weaned. The vaccine aims to prevent colonisation of the respiratory tract by Mycoplasma organisms, thereby preventing development of disease.
The EMAI also identified a sudden increase in nervous disease in horses across NSW as being a mutated strain of the Kunjin virus, a strain of West Nile virus. Characterisation of the virus showed that an Australian strain of Kunjin virus has mutated to a more virulent form than the West Nile virus – a cause of deaths of horses, birds and humans in the USA. However, no disease has been confirmed in either birds or people in Australia during this outbreak.
Fox and wild dog management Wild dogs cause an estimated $16 million in damage every year in NSW. The department’s work to address this problem ranges from monitoring wild dog populations to tracking them with a new $1.33 million GPS collar program, as well as trapping and aerial baiting. With the sign-off on two key local wild dog management plans in October 2010
NSW TRADE & INVESTMENT ANNUAL REPORT 2010 -11 DEPARTMENT OF PRIMARY INDUSTRIES
20
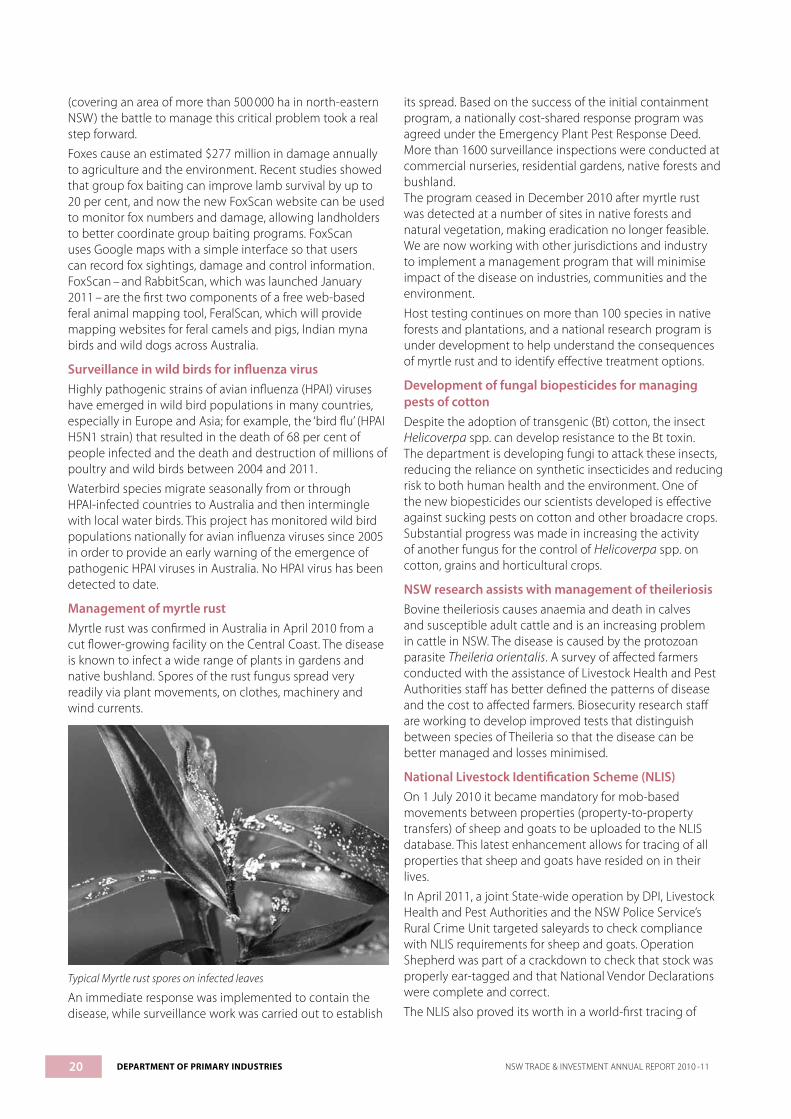
(covering an area of more than 500 000 ha in north-eastern NSW) the battle to manage this critical problem took a real step forward.
Foxes cause an estimated $277 million in damage annually to agriculture and the environment. Recent studies showed that group fox baiting can improve lamb survival by up to 20 per cent, and now the new FoxScan website can be used to monitor fox numbers and damage, allowing landholders to better coordinate group baiting programs. FoxScan uses Google maps with a simple interface so that users can record fox sightings, damage and control information. FoxScan – and RabbitScan, which was launched January 2011 – are the first two components of a free web-based feral animal mapping tool, FeralScan, which will provide mapping websites for feral camels and pigs, Indian myna birds and wild dogs across Australia.
Surveillance in wild birds for influenza virusHighly pathogenic strains of avian influenza (HPAI) viruses have emerged in wild bird populations in many countries, especially in Europe and Asia; for example, the ‘bird flu’ (HPAI H5N1 strain) that resulted in the death of 68 per cent of people infected and the death and destruction of millions of poultry and wild birds between 2004 and 2011.
Waterbird species migrate seasonally from or through HPAI-infected countries to Australia and then intermingle with local water birds. This project has monitored wild bird populations nationally for avian influenza viruses since 2005 in order to provide an early warning of the emergence of pathogenic HPAI viruses in Australia. No HPAI virus has been detected to date.
Management of myrtle rust Myrtle rust was confirmed in Australia in April 2010 from a cut flower-growing facility on the Central Coast. The disease is known to infect a wide range of plants in gardens and native bushland. Spores of the rust fungus spread very readily via plant movements, on clothes, machinery and wind currents.
Typical Myrtle rust spores on infected leaves
An immediate response was implemented to contain the disease, while surveillance work was carried out to establish
its spread. Based on the success of the initial containment program, a nationally cost-shared response program was agreed under the Emergency Plant Pest Response Deed. More than 1600 surveillance inspections were conducted at commercial nurseries, residential gardens, native forests and bushland. The program ceased in December 2010 after myrtle rust was detected at a number of sites in native forests and natural vegetation, making eradication no longer feasible. We are now working with other jurisdictions and industry to implement a management program that will minimise impact of the disease on industries, communities and the environment.
Host testing continues on more than 100 species in native forests and plantations, and a national research program is under development to help understand the consequences of myrtle rust and to identify effective treatment options.
Development of fungal biopesticides for managing pests of cotton Despite the adoption of transgenic (Bt) cotton, the insect Helicoverpa spp. can develop resistance to the Bt toxin. The department is developing fungi to attack these insects, reducing the reliance on synthetic insecticides and reducing risk to both human health and the environment. One of the new biopesticides our scientists developed is effective against sucking pests on cotton and other broadacre crops. Substantial progress was made in increasing the activity of another fungus for the control of Helicoverpa spp. on cotton, grains and horticultural crops.
NSW research assists with management of theileriosis Bovine theileriosis causes anaemia and death in calves and susceptible adult cattle and is an increasing problem in cattle in NSW. The disease is caused by the protozoan parasite Theileria orientalis. A survey of affected farmers conducted with the assistance of Livestock Health and Pest Authorities staff has better defined the patterns of disease and the cost to affected farmers. Biosecurity research staff are working to develop improved tests that distinguish between species of Theileria so that the disease can be better managed and losses minimised.
National Livestock Identification Scheme (NLIS)On 1 July 2010 it became mandatory for mob-based movements between properties (property-to-property transfers) of sheep and goats to be uploaded to the NLIS database. This latest enhancement allows for tracing of all properties that sheep and goats have resided on in their lives.
In April 2011, a joint State-wide operation by DPI, Livestock Health and Pest Authorities and the NSW Police Service’s Rural Crime Unit targeted saleyards to check compliance with NLIS requirements for sheep and goats. Operation Shepherd was part of a crackdown to check that stock was properly ear-tagged and that National Vendor Declarations were complete and correct.
The NLIS also proved its worth in a world-first tracing of
DEPARTMENT OF PRIMARY INDUSTRIES NSW TRADE & INVESTMENT ANNUAL REPORT 2010 -11
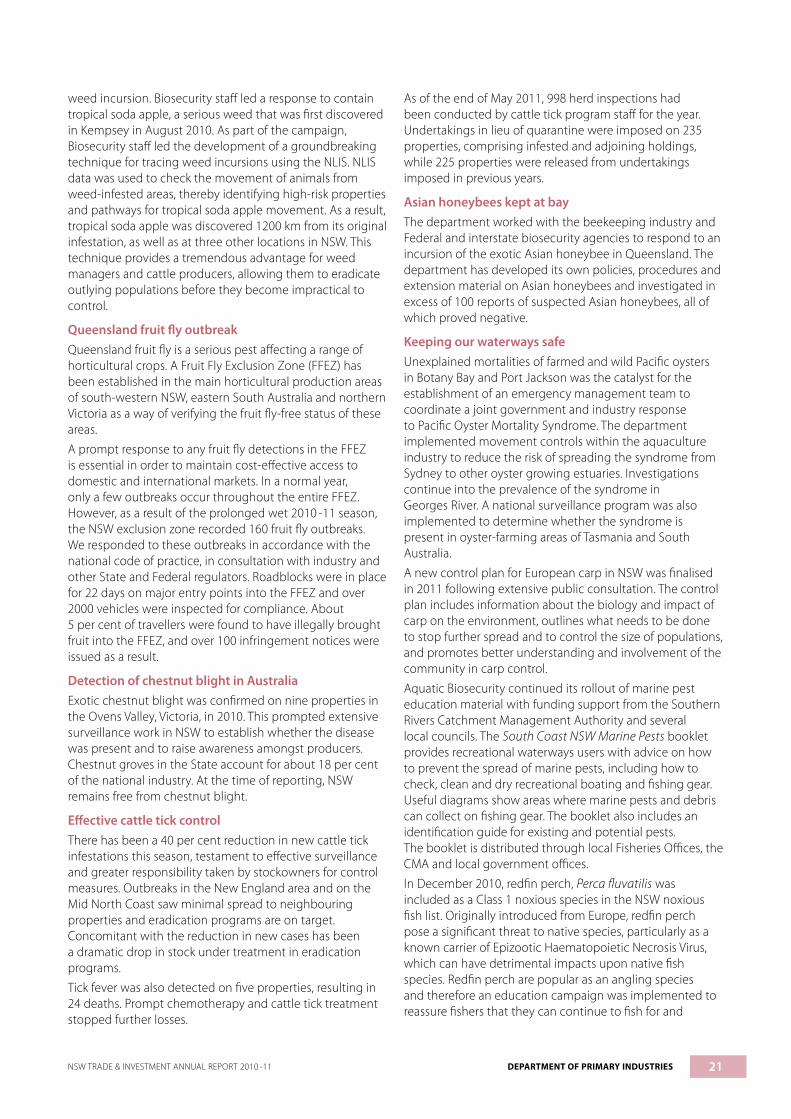
21
weed incursion. Biosecurity staff led a response to contain tropical soda apple, a serious weed that was first discovered in Kempsey in August 2010. As part of the campaign, Biosecurity staff led the development of a groundbreaking technique for tracing weed incursions using the NLIS. NLIS data was used to check the movement of animals from weed-infested areas, thereby identifying high-risk properties and pathways for tropical soda apple movement. As a result, tropical soda apple was discovered 1200 km from its original infestation, as well as at three other locations in NSW. This technique provides a tremendous advantage for weed managers and cattle producers, allowing them to eradicate outlying populations before they become impractical to control.
Queensland fruit fly outbreakQueensland fruit fly is a serious pest affecting a range of horticultural crops. A Fruit Fly Exclusion Zone (FFEZ) has been established in the main horticultural production areas of south-western NSW, eastern South Australia and northern Victoria as a way of verifying the fruit fly-free status of these areas.
A prompt response to any fruit fly detections in the FFEZ is essential in order to maintain cost-effective access to domestic and international markets. In a normal year, only a few outbreaks occur throughout the entire FFEZ. However, as a result of the prolonged wet 2010 -11 season, the NSW exclusion zone recorded 160 fruit fly outbreaks. We responded to these outbreaks in accordance with the national code of practice, in consultation with industry and other State and Federal regulators. Roadblocks were in place for 22 days on major entry points into the FFEZ and over 2000 vehicles were inspected for compliance. About 5 per cent of travellers were found to have illegally brought fruit into the FFEZ, and over 100 infringement notices were issued as a result.
Detection of chestnut blight in Australia Exotic chestnut blight was confirmed on nine properties in the Ovens Valley, Victoria, in 2010. This prompted extensive surveillance work in NSW to establish whether the disease was present and to raise awareness amongst producers. Chestnut groves in the State account for about 18 per cent of the national industry. At the time of reporting, NSW remains free from chestnut blight.
Effective cattle tick controlThere has been a 40 per cent reduction in new cattle tick infestations this season, testament to effective surveillance and greater responsibility taken by stockowners for control measures. Outbreaks in the New England area and on the Mid North Coast saw minimal spread to neighbouring properties and eradication programs are on target. Concomitant with the reduction in new cases has been a dramatic drop in stock under treatment in eradication programs.
Tick fever was also detected on five properties, resulting in 24 deaths. Prompt chemotherapy and cattle tick treatment stopped further losses.
As of the end of May 2011, 998 herd inspections had been conducted by cattle tick program staff for the year. Undertakings in lieu of quarantine were imposed on 235 properties, comprising infested and adjoining holdings, while 225 properties were released from undertakings imposed in previous years.
Asian honeybees kept at bay The department worked with the beekeeping industry and Federal and interstate biosecurity agencies to respond to an incursion of the exotic Asian honeybee in Queensland. The department has developed its own policies, procedures and extension material on Asian honeybees and investigated in excess of 100 reports of suspected Asian honeybees, all of which proved negative.
Keeping our waterways safe Unexplained mortalities of farmed and wild Pacific oysters in Botany Bay and Port Jackson was the catalyst for the establishment of an emergency management team to coordinate a joint government and industry response to Pacific Oyster Mortality Syndrome. The department implemented movement controls within the aquaculture industry to reduce the risk of spreading the syndrome from Sydney to other oyster growing estuaries. Investigations continue into the prevalence of the syndrome in Georges River. A national surveillance program was also implemented to determine whether the syndrome is present in oyster-farming areas of Tasmania and South Australia.
A new control plan for European carp in NSW was finalised in 2011 following extensive public consultation. The control plan includes information about the biology and impact of carp on the environment, outlines what needs to be done to stop further spread and to control the size of populations, and promotes better understanding and involvement of the community in carp control.
Aquatic Biosecurity continued its rollout of marine pest education material with funding support from the Southern Rivers Catchment Management Authority and several local councils. The South Coast NSW Marine Pests booklet provides recreational waterways users with advice on how to prevent the spread of marine pests, including how to check, clean and dry recreational boating and fishing gear. Useful diagrams show areas where marine pests and debris can collect on fishing gear. The booklet also includes an identification guide for existing and potential pests. The booklet is distributed through local Fisheries Offices, the CMA and local government offices.
In December 2010, redfin perch, Perca fluvatilis was included as a Class 1 noxious species in the NSW noxious fish list. Originally introduced from Europe, redfin perch pose a significant threat to native species, particularly as a known carrier of Epizootic Haematopoietic Necrosis Virus, which can have detrimental impacts upon native fish species. Redfin perch are popular as an angling species and therefore an education campaign was implemented to reassure fishers that they can continue to fish for and
NSW TRADE & INVESTMENT ANNUAL REPORT 2010 -11 DEPARTMENT OF PRIMARY INDUSTRIES
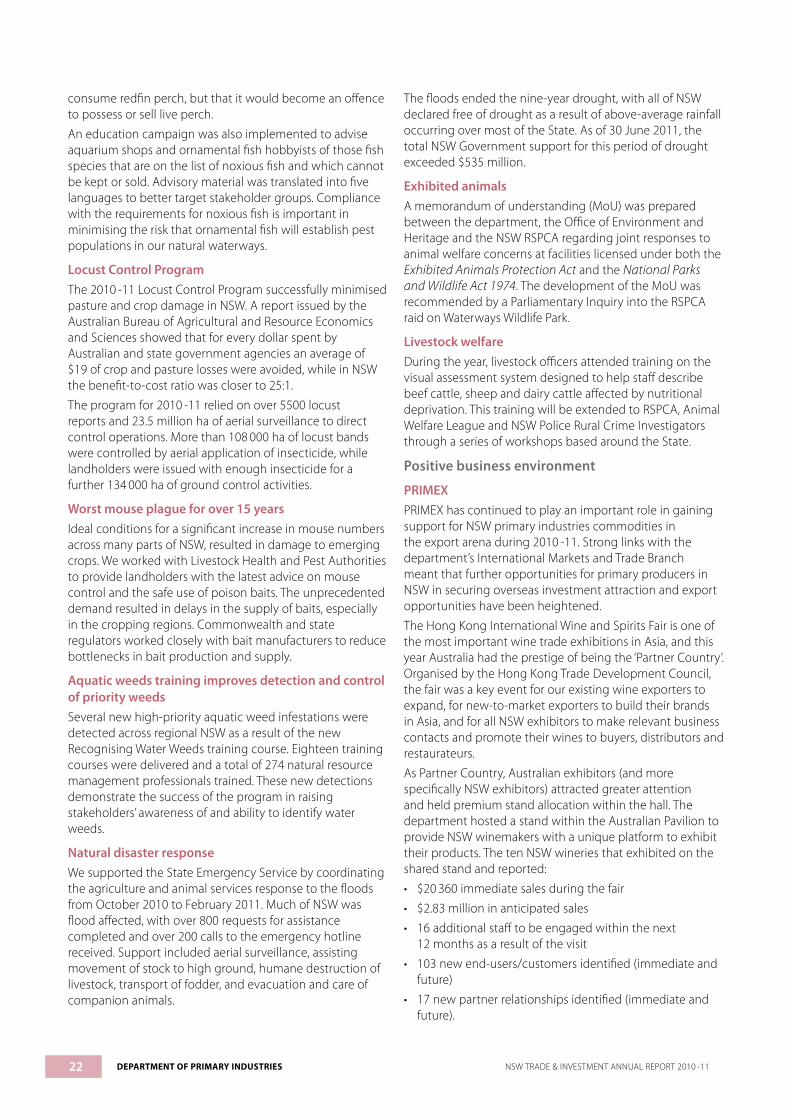
22
consume redfin perch, but that it would become an offence to possess or sell live perch.
An education campaign was also implemented to advise aquarium shops and ornamental fish hobbyists of those fish species that are on the list of noxious fish and which cannot be kept or sold. Advisory material was translated into five languages to better target stakeholder groups. Compliance with the requirements for noxious fish is important in minimising the risk that ornamental fish will establish pest populations in our natural waterways.
Locust Control Program The 2010 -11 Locust Control Program successfully minimised pasture and crop damage in NSW. A report issued by the Australian Bureau of Agricultural and Resource Economics and Sciences showed that for every dollar spent by Australian and state government agencies an average of $19 of crop and pasture losses were avoided, while in NSW the benefit-to-cost ratio was closer to 25:1.
The program for 2010 -11 relied on over 5500 locust reports and 23.5 million ha of aerial surveillance to direct control operations. More than 108 000 ha of locust bands were controlled by aerial application of insecticide, while landholders were issued with enough insecticide for a further 134 000 ha of ground control activities.
Worst mouse plague for over 15 years Ideal conditions for a significant increase in mouse numbers across many parts of NSW, resulted in damage to emerging crops. We worked with Livestock Health and Pest Authorities to provide landholders with the latest advice on mouse control and the safe use of poison baits. The unprecedented demand resulted in delays in the supply of baits, especially in the cropping regions. Commonwealth and state regulators worked closely with bait manufacturers to reduce bottlenecks in bait production and supply.
Aquatic weeds training improves detection and control of priority weedsSeveral new high-priority aquatic weed infestations were detected across regional NSW as a result of the new Recognising Water Weeds training course. Eighteen training courses were delivered and a total of 274 natural resource management professionals trained. These new detections demonstrate the success of the program in raising stakeholders’ awareness of and ability to identify water weeds.
Natural disaster responseWe supported the State Emergency Service by coordinating the agriculture and animal services response to the floods from October 2010 to February 2011. Much of NSW was flood affected, with over 800 requests for assistance completed and over 200 calls to the emergency hotline received. Support included aerial surveillance, assisting movement of stock to high ground, humane destruction of livestock, transport of fodder, and evacuation and care of companion animals.
The floods ended the nine-year drought, with all of NSW declared free of drought as a result of above-average rainfall occurring over most of the State. As of 30 June 2011, the total NSW Government support for this period of drought exceeded $535 million.
Exhibited animals A memorandum of understanding (MoU) was prepared between the department, the Office of Environment and Heritage and the NSW RSPCA regarding joint responses to animal welfare concerns at facilities licensed under both the Exhibited Animals Protection Act and the National Parks and Wildlife Act 1974. The development of the MoU was recommended by a Parliamentary Inquiry into the RSPCA raid on Waterways Wildlife Park.
Livestock welfare During the year, livestock officers attended training on the visual assessment system designed to help staff describe beef cattle, sheep and dairy cattle affected by nutritional deprivation. This training will be extended to RSPCA, Animal Welfare League and NSW Police Rural Crime Investigators through a series of workshops based around the State.
Positive business environment
PRIMEX PRIMEX has continued to play an important role in gaining support for NSW primary industries commodities in the export arena during 2010 -11. Strong links with the department’s International Markets and Trade Branch meant that further opportunities for primary producers in NSW in securing overseas investment attraction and export opportunities have been heightened.
The Hong Kong International Wine and Spirits Fair is one of the most important wine trade exhibitions in Asia, and this year Australia had the prestige of being the ‘Partner Country’. Organised by the Hong Kong Trade Development Council, the fair was a key event for our existing wine exporters to expand, for new-to-market exporters to build their brands in Asia, and for all NSW exhibitors to make relevant business contacts and promote their wines to buyers, distributors and restaurateurs.
As Partner Country, Australian exhibitors (and more specifically NSW exhibitors) attracted greater attention and held premium stand allocation within the hall. The department hosted a stand within the Australian Pavilion to provide NSW winemakers with a unique platform to exhibit their products. The ten NSW wineries that exhibited on the shared stand and reported:
• $20 360 immediate sales during the fair
• $2.83 million in anticipated sales
• 16 additional staff to be engaged within the next 12 months as a result of the visit
• 103 new end-users/customers identified (immediate and future)
• 17 new partner relationships identified (immediate and future).
DEPARTMENT OF PRIMARY INDUSTRIES NSW TRADE & INVESTMENT ANNUAL REPORT 2010 -11
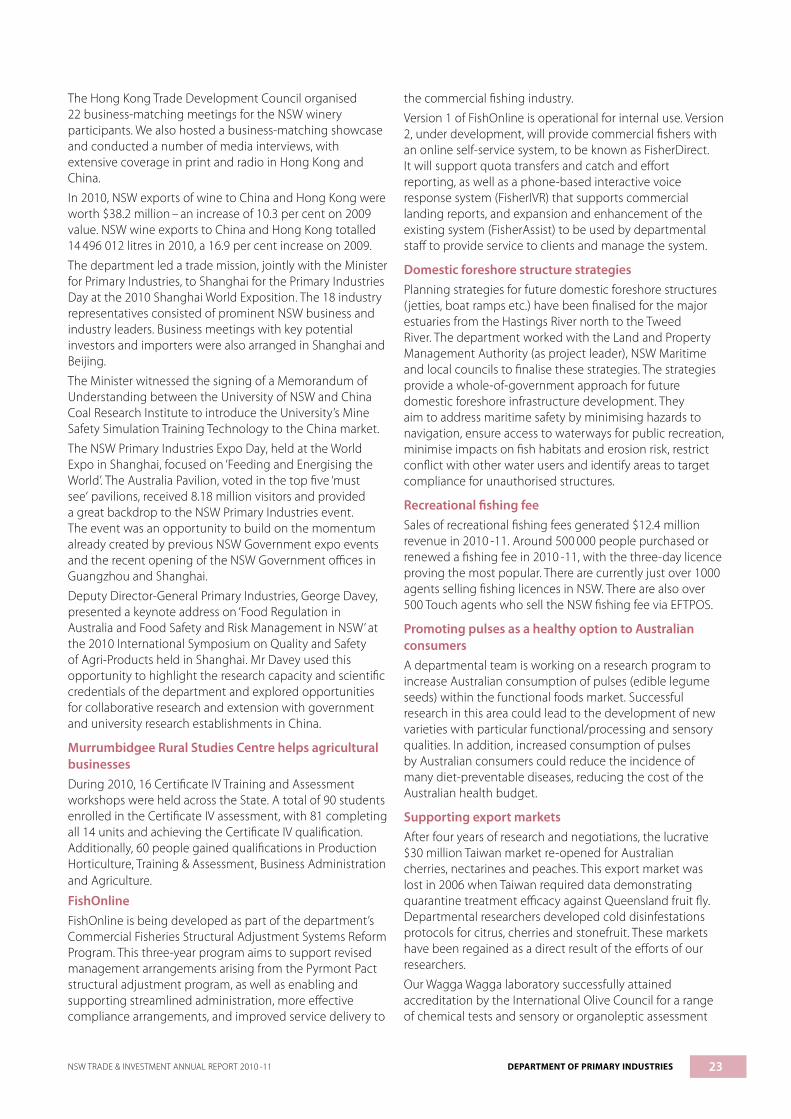
23
The Hong Kong Trade Development Council organised 22 business-matching meetings for the NSW winery participants. We also hosted a business-matching showcase and conducted a number of media interviews, with extensive coverage in print and radio in Hong Kong and China.
In 2010, NSW exports of wine to China and Hong Kong were worth $38.2 million – an increase of 10.3 per cent on 2009 value. NSW wine exports to China and Hong Kong totalled 14 496 012 litres in 2010, a 16.9 per cent increase on 2009.
The department led a trade mission, jointly with the Minister for Primary Industries, to Shanghai for the Primary Industries Day at the 2010 Shanghai World Exposition. The 18 industry representatives consisted of prominent NSW business and industry leaders. Business meetings with key potential investors and importers were also arranged in Shanghai and Beijing.
The Minister witnessed the signing of a Memorandum of Understanding between the University of NSW and China Coal Research Institute to introduce the University’s Mine Safety Simulation Training Technology to the China market.
The NSW Primary Industries Expo Day, held at the World Expo in Shanghai, focused on ‘Feeding and Energising the World’. The Australia Pavilion, voted in the top five ‘must see‘ pavilions, received 8.18 million visitors and provided a great backdrop to the NSW Primary Industries event. The event was an opportunity to build on the momentum already created by previous NSW Government expo events and the recent opening of the NSW Government offices in Guangzhou and Shanghai.
Deputy Director-General Primary Industries, George Davey, presented a keynote address on ‘Food Regulation in Australia and Food Safety and Risk Management in NSW’ at the 2010 International Symposium on Quality and Safety of Agri-Products held in Shanghai. Mr Davey used this opportunity to highlight the research capacity and scientific credentials of the department and explored opportunities for collaborative research and extension with government and university research establishments in China.
Murrumbidgee Rural Studies Centre helps agricultural businesses During 2010, 16 Certificate IV Training and Assessment workshops were held across the State. A total of 90 students enrolled in the Certificate IV assessment, with 81 completing all 14 units and achieving the Certificate IV qualification. Additionally, 60 people gained qualifications in Production Horticulture, Training & Assessment, Business Administration and Agriculture.
FishOnline FishOnline is being developed as part of the department’s Commercial Fisheries Structural Adjustment Systems Reform Program. This three-year program aims to support revised management arrangements arising from the Pyrmont Pact structural adjustment program, as well as enabling and supporting streamlined administration, more effective compliance arrangements, and improved service delivery to
the commercial fishing industry.
Version 1 of FishOnline is operational for internal use. Version 2, under development, will provide commercial fishers with an online self-service system, to be known as FisherDirect. It will support quota transfers and catch and effort reporting, as well as a phone-based interactive voice response system (FisherIVR) that supports commercial landing reports, and expansion and enhancement of the existing system (FisherAssist) to be used by departmental staff to provide service to clients and manage the system.
Domestic foreshore structure strategies Planning strategies for future domestic foreshore structures (jetties, boat ramps etc.) have been finalised for the major estuaries from the Hastings River north to the Tweed River. The department worked with the Land and Property Management Authority (as project leader), NSW Maritime and local councils to finalise these strategies. The strategies provide a whole-of-government approach for future domestic foreshore infrastructure development. They aim to address maritime safety by minimising hazards to navigation, ensure access to waterways for public recreation, minimise impacts on fish habitats and erosion risk, restrict conflict with other water users and identify areas to target compliance for unauthorised structures.
Recreational fishing fee Sales of recreational fishing fees generated $12.4 million revenue in 2010 -11. Around 500 000 people purchased or renewed a fishing fee in 2010 -11, with the three-day licence proving the most popular. There are currently just over 1000 agents selling fishing licences in NSW. There are also over 500 Touch agents who sell the NSW fishing fee via EFTPOS.
Promoting pulses as a healthy option to Australian consumers A departmental team is working on a research program to increase Australian consumption of pulses (edible legume seeds) within the functional foods market. Successful research in this area could lead to the development of new varieties with particular functional/processing and sensory qualities. In addition, increased consumption of pulses by Australian consumers could reduce the incidence of many diet-preventable diseases, reducing the cost of the Australian health budget.
Supporting export markets After four years of research and negotiations, the lucrative $30 million Taiwan market re-opened for Australian cherries, nectarines and peaches. This export market was lost in 2006 when Taiwan required data demonstrating quarantine treatment efficacy against Queensland fruit fly. Departmental researchers developed cold disinfestations protocols for citrus, cherries and stonefruit. These markets have been regained as a direct result of the efforts of our researchers.
Our Wagga Wagga laboratory successfully attained accreditation by the International Olive Council for a range of chemical tests and sensory or organoleptic assessment
NSW TRADE & INVESTMENT ANNUAL REPORT 2010 -11 DEPARTMENT OF PRIMARY INDUSTRIES

24
of oils. Few laboratories in the world have attained this standard, and the Wagga Wagga laboratory is the only one in Australia to do so.
Supporting livestock industries by improving genetic testing Our laboratories continue to develop cutting edge tests to support livestock industries by identifying genetic flaws and providing industries with the tools to manage the prevalence of these flaws in the national herds and flocks. This is of particular value in the case of some of the newer breeds to this country, which usually have smaller flocks. Because of these narrow genetic bases they may have greater prevalence of flaws than in their home countries. This has included a fatal (though rare) flaw in sheep and a number of problems with beef herds.
Biosecurity upgrade The $56.7 million biosecurity upgrade of the Elizabeth Macarthur Agricultural Institute (EMAI) is on budget and due for completion 18 months ahead of schedule. Installation of a temporary laboratory complex early in the year allowed construction of new laboratory buildings and refurbishment of existing laboratories to occur concurrently. The EMAI is the premier biosecurity facility in NSW and provides frontline diagnostic and response capability for animal, plant and aquatic pests and diseases. The upgrade will deliver new laboratory buildings that comply with the latest Australian Quarantine and Inspection Service standards for biosecurity containment.
Service delivery excellence
EverTrain EverTrain is an online training platform, developed in partnership with the Future Farm Industries Cooperative Research Centre, allowing key client groups to complete workshops online. While many department workshops are highly valued by participants, many people undertaking such training cannot afford the time to attend workshops when they are conducted on set days or are held over several days.
EverTrain Workshops now include Salinity Concepts, Salinity Management, Climate Risk, Farming for Carbon and Soil Life/Soil Management. These workshops will be available as blended (online and face-to-face) or fully online.
Building the CountryThe Office of Rural Affairs administers three funding programs under the Building the Country package:
• Community Broadband Development Program provides $11.6 million to build high-speed wireless broadband to smaller towns and villages across rural NSW.
• Country Halls Renewal Fund is a $4.5 million fund offering grants of up to $50 000 for each eligible project to upgrade and repair community halls in towns with populations under 10 000.
• Small Communities Awareness Fund is a $450 000 grant program providing up to $5000 per application for
• communities to establish websites that promote their local businesses and tourism assets.
Roll out of fish-kill response kitsWe produced 30 fish-kill response kits in portable form that can be used by Fisheries and Marine Parks Officers to respond to and investigate the cause of fish kills. Staff were provided with training on how to use the kits and to report and investigate fish kills, including water and fish sampling and lodgement of samples with relevant laboratories. The production of the kits coincided with the final development and testing of a revamped fish-kill reporting database, which will allow internal on-line reporting of fish kills in 2011.
New fisheries patrol boatsThe department’s Fisheries Compliance Unit increased its operations capacity by acquiring two new custom offshore-capable fisheries patrol boats, one 6.3 m rigid-hull inflatable boat (RHIB) for the Tweed Heads District and another 6.8 m RHIB at Coffs Harbour.
The boats are designed to work in offshore waters, improving rapid response in all weather conditions while providing improved safety for operational staff. They will play an important role in ensuring compliance with Fisheries rules on the north coast, where commercial and recreational fisheries make significant contributions to the State’s economy and way of life.
The new fisheries patrol vessel ‘FPV Peter Angel‘ located at Coffs Harbour was named in honour of a recently deceased Fisheries Officer of 42 years, Mr Peter Angel
Fishers’ Watch The Fishers’ Watch line receives around 3000 calls annually on the 1800 043 536 number. This year the Fisheries Compliance Unit launched a page on the department’s website that includes an online function to report illegal activity and the ability to send information anonymously. Some high-quality information was received, leading to a number of ongoing investigations and immediate detections.
Wollongbar labs ranked among the world’s top 20 per cent The Inorganic Chemistry section of the department’s laboratories at Wollongbar recently participated in an international proficiency study organised by the Asia Pacific Laboratory Accreditation Council. The Wollongbar laboratory
DEPARTMENT OF PRIMARY INDUSTRIES NSW TRADE & INVESTMENT ANNUAL REPORT 2010 -11
25
ranked in the top 20 per cent of all labs. The study included 38 laboratories from 23 countries, ranging from Israel to Mexico, USA, China, Finland and Sri Lanka.
The spring vine health field days This nationally coordinated extension program provided approximately 300 growers with pre-season practical updates and advice on improving all areas of vine health. The field day proved pivotal and excellent timing, taking place on the eve of the challenging 2010 harvest.
Research and training days Eighty casual frontline staff from Lake Macquarie, Tuross Lake, St Georges Basin and other nearby areas participated in local training workshops on recreational fishing surveys. Between March and May 2011, these staff members worked on an important research survey aimed at quantifying changes in the characteristics of Lake Macquarie, Tuross Lake and St Georges Basin since the establishment of these estuaries as Recreational Fishing Havens.
The National Centre for Groundwater Research and Training NSW node at Wellington opened in November 2010. The centre houses a valuable set of data from key sites, and feedback from partners has revealed that data with this spatial and temporal resolution is rare if not unattainable in the Murray Darling Basin.
Recognition of our expertiseIn 2010 -11 departmental researchers were again recognised as national and international leaders in their fields.
• Dr Colin Wellings, Principal Research Scientist with the Biosecurity Research Unit, received the 2011 Seed of Light award from the Grains Research and Development Corporation.
• Departmental scientists were major contributors to the New International Compendium of Chickpea and Lentil Diseases and Pests.
• Dr Robin Dobos was awarded an overseas travel fellowship through AgriFood Skills Australia. He will travel to France to meet with researchers in the fields of animal movement analysis and modelling.
• Dr Peter Kirkland was awarded the Public Service Medal in August 2010 as announced in the Queens Birthday Honours list.
• Departmental researchers Kevin Moore and Ted Knights were awarded the 2010 Brownhill Cup in recognition of their research into chickpea breeding and pathology.
• Paul Greenwood and Garry Griffith won the 2010 Australian Research Council Eureka Prize for Excellence in Research by an Interdisciplinary Team as part of the Meat Standards Australia Pathways Team.
• Trainee Research Agronomist Matt Gardner won the $5000 AW Howard Memorial Trust Research Fellowship.
Future directionsIn 2011-12 the department will:
• continue to promote water smart infrastructure investment in NSW to improve the irrigation industry’s capacity to adopt best management practice and improve water and energy efficiency
• develop a NSW Poultry Meat Industry Development Plan, which will aid development applications and assist in reducing land-use conflict, ensure the growth of the poultry sector and address environmental concerns for this industry in NSW
• through its Rural Support Program focus on building rural community resources in relation to the management of climate variability, household and business finance and personal wellbeing
• continue to identify and produce maps of important agricultural lands for future food, fibre and bio-energy production
• contribute to development of Strategic Regional Land Use Plans for priority areas such as the Upper Hunter and the New England North West regions that will identify priority areas for land uses, such as agriculture and mining, including strategic agricultural land
• continue to review the information available on key commercial and recreational overfished species and develop resource recovery programs to identify a range of potential management options to proportionately reduce the fishing mortality from those sectors
• continue to engage in a national R&D framework that ensures the activities of all major players are well coordinated, and also continue to work closely with all major NSW universities
• continue to identify opportunities to adopt and develop new technologies in our R&D programs by using biotechnology to unravel the genetic code of pests and diseases that threaten our plant and animal industries and to design better ways to detect and manage those threats
• work closely with Catchment Management Authorities in the roll-out of the remaining Catchment Action Plan update process
• support Landcare through the implementation of the Government’s election commitment of $500 000 per year for four years for Landcare administration.
NSW TRADE & INVESTMENT ANNUAL REPORT 2010 -11 DEPARTMENT OF PRIMARY INDUSTRIES
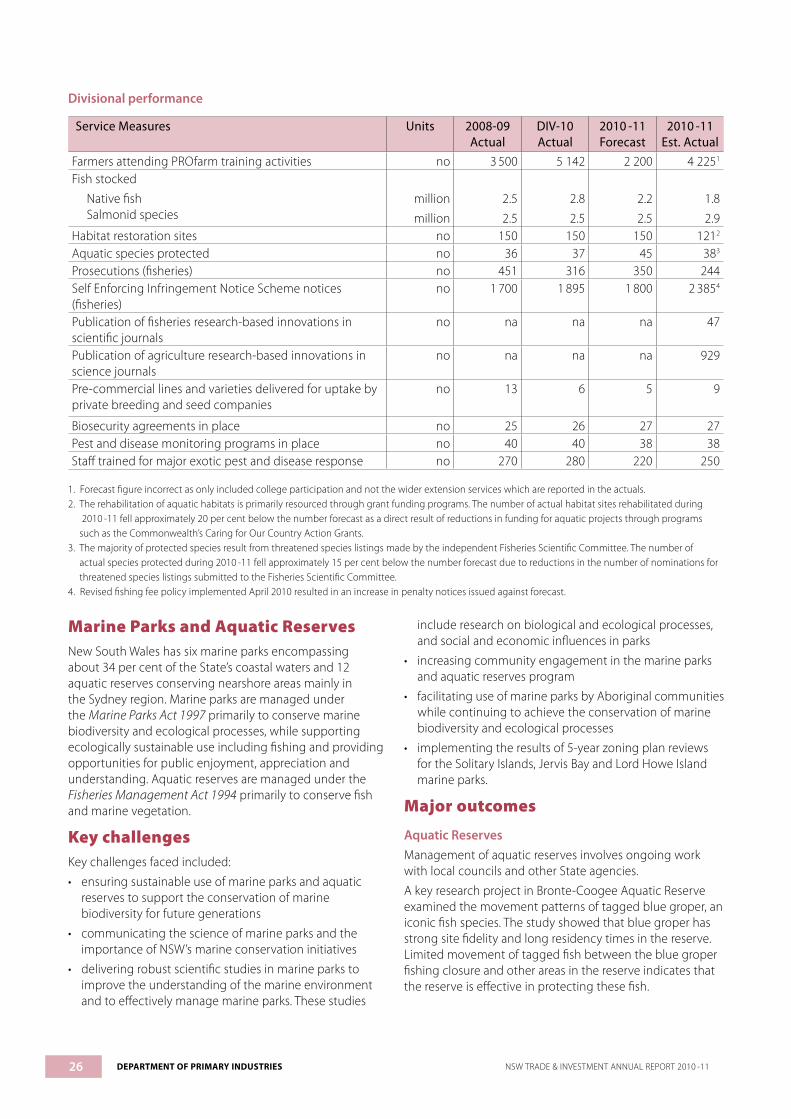
26
Divisional performance
Service Measures Units 2008-09 Actual
DIV-10 Actual
2010 -11 Forecast
2010 -11 Est. Actual
Farmers attending PROfarm training activities no 3 500 5 142 2 200 4 2251
Fish stocked
Native fish Salmonid species
million
million
2.5
2.5
2.8
2.5
2.2
2.5
1.8
2.9Habitat restoration sites no 150 150 150 1212
Aquatic species protected no 36 37 45 383
Prosecutions (fisheries) no 451 316 350 244Self Enforcing Infringement Notice Scheme notices (fisheries)
no 1 700 1 895 1 800 2 3854
Publication of fisheries research-based innovations in scientific journals
no na na na 47
Publication of agriculture research-based innovations in science journals
no na na na 929
Pre-commercial lines and varieties delivered for uptake by private breeding and seed companies
no 13 6 5 9
Biosecurity agreements in place no 25 26 27 27Pest and disease monitoring programs in place no 40 40 38 38Staff trained for major exotic pest and disease response no 270 280 220 250
1. Forecast figure incorrect as only included college participation and not the wider extension services which are reported in the actuals.2. The rehabilitation of aquatic habitats is primarily resourced through grant funding programs. The number of actual habitat sites rehabilitated during
2010 -11 fell approximately 20 per cent below the number forecast as a direct result of reductions in funding for aquatic projects through programs such as the Commonwealth’s Caring for Our Country Action Grants.
3. The majority of protected species result from threatened species listings made by the independent Fisheries Scientific Committee. The number of actual species protected during 2010 -11 fell approximately 15 per cent below the number forecast due to reductions in the number of nominations for threatened species listings submitted to the Fisheries Scientific Committee.
4. Revised fishing fee policy implemented April 2010 resulted in an increase in penalty notices issued against forecast.
Marine Parks and Aquatic ReservesNew South Wales has six marine parks encompassing about 34 per cent of the State’s coastal waters and 12 aquatic reserves conserving nearshore areas mainly in the Sydney region. Marine parks are managed under the Marine Parks Act 1997 primarily to conserve marine biodiversity and ecological processes, while supporting ecologically sustainable use including fishing and providing opportunities for public enjoyment, appreciation and understanding. Aquatic reserves are managed under the Fisheries Management Act 1994 primarily to conserve fish and marine vegetation.
Key challengesKey challenges faced included:
• ensuring sustainable use of marine parks and aquatic reserves to support the conservation of marine biodiversity for future generations
• communicating the science of marine parks and the importance of NSW’s marine conservation initiatives
• delivering robust scientific studies in marine parks to improve the understanding of the marine environment and to effectively manage marine parks. These studies
include research on biological and ecological processes, and social and economic influences in parks
• increasing community engagement in the marine parks and aquatic reserves program
• facilitating use of marine parks by Aboriginal communities while continuing to achieve the conservation of marine biodiversity and ecological processes
• implementing the results of 5-year zoning plan reviews for the Solitary Islands, Jervis Bay and Lord Howe Island marine parks.
Major outcomes
Aquatic ReservesManagement of aquatic reserves involves ongoing work with local councils and other State agencies.
A key research project in Bronte-Coogee Aquatic Reserve examined the movement patterns of tagged blue groper, an iconic fish species. The study showed that blue groper has strong site fidelity and long residency times in the reserve. Limited movement of tagged fish between the blue groper fishing closure and other areas in the reserve indicates that the reserve is effective in protecting these fish.
DEPARTMENT OF PRIMARY INDUSTRIES NSW TRADE & INVESTMENT ANNUAL REPORT 2010 -11
27
Marine Parks AuthorityThe Marine Parks Authority operates according to an annual work program. This work program is not a comprehensive list of all work undertaken in marine parks but instead reflects key existing and emerging priorities that requires active consideration by the authority. The authority met four times in 2010 -11.
The authority delivered the key items on its work program for 2010 -11, including:
• zoning plan review for Lord Howe Island, Jervis Bay and Solitary Islands Marine Parks
• Strategic Research Framework 2010 -15 in response to the Independent Review of Marine Parks Science completed in December 2009. Under the ‘Framework’ the marine parks are delivering 69 research projects and, of these, 12 were completed in the 2010 -11 period
• operational plans for Batemans and Port Stephens–Great Lakes Marine Parks
• implementation of annual compliance plans (developed under the NSW Marine Parks Statewide Compliance Plan)
• launching the NSW Primary Schools Education Kit, with a detailed package for each marine park
• progressed review of the marine parks permit system, the use of GPS navigation systems to display marine park zoning information, and an updated marine parks website
• ongoing input into the NSW Parliamentary Select Committee into Recreational Fishing, following on from extensive input across the marine parks system in 2009 -10.
Other notable achievements included:
• An Aboriginal Advisory Group was established for Jervis Bay Marine Park.
• Management of a large fish kill that occurred in the northern sector of Jervis Bay, caused by a naturally occurring dinoflagellate Karlodinium micrum which is not harmful to humans.
• Achievement of new research grants valued at $1.55 million for research in Batemans Marine Park.
• Publication of key marine park research paper by Dr Melinda Coleman et al (2011) ‘Connectivity within and among a network of temperate marine reserves’.
Marine Parks Advisory CouncilThe Marine Parks Advisory Council operates according to an annual work program. This work program is not a comprehensive list of all work undertaken in marine parks but instead reflects key existing and emerging priorities that requires active consideration by the council. The council met twice in 2010 -11.
The council provided advice on key items on its work program for 2010 -11, namely:
• draft zoning plans for Jervis Bay and Solitary Islands Marine Parks from a statewide perspective
• linkages with NSW marine parks and the National Representative System of Marine Protected Areas
(NRSMPA) including through the development of the East Marine Bioregional Plan
• the Strategic Research Framework 2010 -15 in response to the Independent Review of Marine Parks Science completed in December 2009
• the NSW Marine Parks Permit Policy, Recreational Fishing Competition policy and Vessel Speed Policy
• input into the NSW Parliamentary Select Committee into Recreational Fishing, following on from extensive input across the marine parks system in 2009 -10.
Future directions In 2011 -12 the Authority will:
• utilise the outcomes of the scientific audit to optimise input into reviews of the marine park zoning plans
• take a risk-based approach to documenting, minimising and regulation of land-based impacts to marine parks
• deliver effective cultural resource use agreements with local traditional owners
• complete and implement new communication, operational and business plans
• deliver an improved strategy to managing aquatic reserves aligned with the review of the Fisheries Management Act 1994 and the remake of the Fisheries Management (Aquatic Reserve) Regulation 2002.
NSW TRADE & INVESTMENT ANNUAL REPORT 2010 -11 DEPARTMENT OF PRIMARY INDUSTRIES

28 NSW OFFICE OF WATER NSW TRADE & INVESTMENT ANNUAL REPORT 2010 -11
NSW OFFICE OF WATER
Nature and scope of activitiesThe department’s NSW Office of Water leads policy and reform in sustainable water management and assists water utilities to provide urban water and sewerage services that benefit all NSW.
Key challengesA major challenge for the NSW Government is to balance the water needs of farms, towns, industries and the environment. In recent years this challenge has been exacerbated by the worst drought on record, which has caused significant problems for agriculture and regional communities. In the future the prospect of climate change and population growth in metropolitan, coastal and some regional centres will further increase challenges for water management in NSW.
The Australian Government’s National Water Initiative also has significant implications for water management in NSW. There are potential changes to some existing water sharing plans, resource management in the Murray–Darling Basin, the management and operation of rivers, metering and monitoring, and compliance and enforcement. In the Murray–Darling Basin, the Australian Government is making an assessment of what the national approach should be and preparing a Basin-wide plan.
The provision of reliable, sustainable, efficient and well-managed urban water supply and sewerage services across the State is a key strategy to underpin the sustainable development of regional NSW. The department provides targeted assistance to more than 100 local water utilities for funding infrastructure as well as expert advice on strategic planning and management, and monitors and reports utility performance.
In April 2011, most of the branches of the NSW Office of Water were transferred from the former Department of Environment, Climate Change and Water to the new Department of Primary Industries. The exception was the Metropolitan Water Branch, which was transferred to the new Department of Finance and Services.
This section reports only on those functions that are now part of the Department of Primary Industries, but reports the full year’s activities; that is, 1 July 2010 to 30 June 2011. For a report on Metropolitan Water outcomes for the year 2010 -11 the reader is referred to the annual report of the Department of Finance and Services.
Major outcomes achievedThe outcomes are reported under our two key result areas, Water Management and Water Utilities

29NSW TRADE & INVESTMENT ANNUAL REPORT 2010 -11 NSW OFFICE OF WATER
WATER MANAGEMENTWater Management Framework
The National Water InitiativeThe National Water Initiative (the Initiative) is a comprehensive strategy being implemented by the Australian Government to improve water management nationwide. The NSW Government is a partner in the Initiative, which was endorsed by the Council of Australian Governments (COAG) in 2004. The key aims of the Initiative are to:
• expand the permanent trade in water to enable its more efficient use and recovery in order to achieve improved environmental outcomes
• encourage investment in the water industry through more secure water access entitlements and improved access to information
• make water planning more transparent and comprehensive to deal with the interaction between surface water and groundwater systems and the provision of water to meet specific environmental outcomes
• address over-allocated river systems as quickly as possible, in consultation with affected stakeholders, and manage adjustment.
In 2010 -11 the department provided input to the Initiative’s policy guidelines for water planning and management developed by an inter-jurisdictional working group led by the Commonwealth. These guidelines have been approved by the COAG senior officials and are awaiting COAG approval. They will help water planners across Australia implement principles for best practice water planning affecting a range of important activities, such as intercepting and storing overland flows, constructing farm dams and bores, planning large-scale plantation forestry and mining, and developing further water sharing plans across Australian states and territories that are consistent with the Initiative. A number of the Initiative’s actions are being accelerated under the COAG work program for the National Water Reform Committee.
The department has also been engaged in the further development of water accounting, including a national stocktake report (the Water Accounting Development Project, sponsored by the National Water Commission, see www.nwc.gov.au/www/html/243-water-accounting.asp?intSiteID=1) and helping the Bureau of Meteorology to develop national water accounts each year (see National Water Accounting later in this report).
Murray–Darling Basin governance arrangementsThe Murray–Darling Basin is one of Australia’s major water catchment and drainage regions, extending over much of NSW and Victoria, all the ACT, and parts of South Australia and Queensland. About 75 per cent of NSW – including nearly all NSW land west of the Great Dividing Range – lies within the Basin.
NSW accounts for 57 per cent of the land area of the Basin, 40 per cent of its population and 53 per cent of the average
surface water extractions. NSW alone produces all of the Basin’s rice crop (a significant local export crop), almost 70 per cent of cotton and 77 per cent of wheat.
The Murray–Darling Basin Authority (the Authority) is responsible for developing a Basin-wide plan that will set sustainable diversion limits for both surface water and groundwater sources. During 2010 -11, the department coordinated the NSW Government response to the Guide to the Basin Plan (the Plan) released by the Authority in October 2010. The NSW response highlighted the need for the Plan to balance environmental, social and economic outcomes.
The new Chair of the Authority undertook to provide a more balanced approach in the proposed Plan and to work more closely with the Basin jurisdictions. As a result, Basin states have been asked to advise on and provide technical information to future proposals.
Water for the FutureTo support the national water reforms, and particularly the expected water management changes in the Murray–Darling Basin, the Australian Government committed $12.9 billion to its Water for the Future program to take action on climate change, use water wisely, secure future water supplies and support healthy river systems, of which $3.1 billion will be used to buy back water licences and $5.8 billion will be used for rural water use and infrastructure projects in the Basin.
Infrastructure projectsUnder the Murray–Darling Basin Agreement the Australian Government approved the allocation of $708 million (out of $1.358 billion) to the NSW Government for a wide range of infrastructure projects. Components of this funding are for proposed projects that will be managed by the department, including the following proposals:
• The Basin Pipe Project provides up to $137 million for projects that reduce river losses by converting open domestic and stock supply systems to pipes.
• The NSW Metering Project provides up to $221 million to upgrade the accuracy of water metering (jointly with State Water Corporation).
• The Healthy Floodplains Project provides $50 million to license floodplain extractions and improve the management of water on floodplains, including through modifications to floodplain structures.
• The Irrigated Farm Modernisation Project provides $300 million to invest in farm water-use efficiency infrastructure and build resilience of irrigation communities.
Detailed business cases for all NSW Government projects were submitted to the Australian Government in June 2010.
The Australian Government provided a final due diligence assessment in May 2011, in which the:
• Basin Pipe Project was approved
• NSW Metering Project was approved, with conditions
• Healthy Floodplains Project was unsuccessful

30
• Irrigated Farm Modernisation Project was unsuccessful.
The NSW Government responded to the Commonwealth’s assessment in June 2011, to:
• accept the Basin Pipe Project
• propose alternate conditions for the NSW Metering Project
• propose re-scoping of the Healthy Floodplains and Irrigated Farm Modernisation projects.
Water shepherding in NSWThe NSW and Commonwealth governments are developing a framework for water shepherding –the delivery of a calculated volume of water (created by the non-activation/reduced extraction at a nominated licence location) to a more downstream location, at which point it is made available for extraction or use for the environment.
The Australian Government is keen to investigate the potential for water shepherding to provide water to high-priority environmental assets. Three trials were conducted in 2009 and 2010, shepherding Commonwealth-licensed water from Toorale Station in the Darling and Warrego river system, in north-west NSW, to the Menindee Lakes, and thence to the Murray River (a total distance of over 1300 km) and to the Great Darling Anabranch.
In July 2010 the NSW and Australian governments signed a Memorandum of Understanding (MoU) on shepherding of water for the environment. The objective of the MoU is to optimise the use of all water for the environment, to provide the capacity to deliver water to high-priority environmental assets and, in the case of in-stream environmental watering, to provide protection for the environmental flows to pass through the system as far as transmission losses allow.
The Commonwealth committed $1.95 million to develop an implementation plan (Stage 2) for water shepherding by 2012. As at 30 June 2011 the project has scoped the issues in developing a shepherding framework and considered options around a shepherding methodology. Detailed analysis is being conducted on a preferred shepherding methodology for consideration in development of the implementation plan.
The Plan is being developed with oversight by the NSW Commissioner for Water and the Commonwealth Deputy Secretary of the Department of Sustainability, Environment, Water, Population and Communities (SEWPAC) Water Group. The Plan will identify mechanisms for legal recognition of licences and shepherded water, as well as any legislative amendments or amendments to inter-governmental agreements required.
Water Sharing Plans
Developing water sharing plansDuring the first quarter of 2010 -11 the Peel (regulated, unregulated and groundwater) water sharing plan commenced. A further four such plans commenced in December 2010: Tweed (unregulated and alluvial); Richmond (regulated, unregulated and alluvial); Murrah (unregulated and alluvial); and Towamba (unregulated
and alluvial). The Bega (regulated, unregulated and alluvial), Greater Metropolitan (groundwater) and Greater Metropolitan (unregulated) water sharing plans were made in March 2011, with commencement scheduled for April 2011 (Bega) and July 2011 (Metropolitan unregulated and groundwater) respectively. At 30 June 2011, 95 per cent of water extraction in NSW was covered by commenced water sharing plans.
In total there will be 83 water sharing plans developed to cover the entire State, although this number may change as planning progresses. The intention to have all the inland plans completed by early 2012 at the commencement of the Commonwealth’s Basin Plan (in order to ensure all areas of the Murray–Darling Basin are established on the same footing) is progressing well. The aim is for all NSW plans to be completed by early 2013. This will bring all water users within the licensing system of the Water Management Act 2000 (NSW), providing benefits of greater security of water entitlements, specific rules to provide for the environment and more opportunities for water trading.
To complete water sharing plans for most of the remaining areas of the State the macro-planning process – a broader river catchment or groundwater system approach – has been adopted. Expert regional panels assess the environmental and socio-economic values of the system and develop the draft rules for these areas of the State. These are then discussed with key stakeholders before the draft plan is finalised for public exhibition. Eight inland water sharing plans were placed on public exhibition in December 2010 with these now being finalised for approval to commence progressively within the first and second quarters of 2011-12. A further nine inland water sharing plans have been significantly progressed during 2010 -11 for public exhibition during the first and second quarters of 2011-12.
Work recommenced (as of June 2011) on the final coastal water sharing plans for State-wide coverage. These are due for completion by early 2013.
Implementing water sharing plans: timely information of water availability and outlookThe year 2010 -11 saw a break in the drought, with good rainfall and a return to near full dams. By late 2010, full water allocations had been announced for water users across most regulated river catchments in NSW. Regular rainfall events, especially over summer in southern NSW, reduced the demand for irrigation water. This meant healthy balances in water accounts which prompted significant interstate trade activity, as well as record levels of private carryover into 2011-12.
Resource assessments and the timely announcement of Available Water Determinations and access to Supplementary flows ensured maximum opportunity for water users to plan and implement their production schedules. In all, around 50 Available Water Determinations were published in 2010 -11, along with over 120 Supplementary water access announcements.
NSW OFFICE OF WATER NSW TRADE & INVESTMENT ANNUAL REPORT 2010 -11

31
Communiqués were prepared and published for all regulated river catchments, outlining resource conditions and what might be expected on 1 July, when the new water year commenced. They reminded water users about the imminent recommencement of the water sharing plans and highlighted any significant changes that could be expected from operations in recent years.
A standout feature of resource management during the year was the extensive flooding in the Barwon–Darling river system and the flood operations at Menindee Lakes. The department, in collaboration with State Water, safely steered about 5000 gigalitres (GL) of water through the Menindee Lakes system, whilst ensuring infrastructure security, minimised social and economic impacts of flooding, providing positive environmental outcomes, and maximising resource availability.
The key to the success of the operation was the comprehensive communication strategy used to keep agencies, the community, stakeholders and landowners informed about the flooding and what to expect. The Office convened a multi-agency technical working group of flood practitioners as well as a community advisory group. A total of nine community information bulletins were published and distributed to local stakeholders and local and regional media outlets. The bulletins provided information on Darling River flood flows and outlook, including predicted operation of the Menindee Lakes Scheme. They also enabled the broader community to monitor the passage of floodwaters through the system and understand and anticipate potential downstream impacts.
The extensive inundation of floodplains and forests, some for the first time in a decade, produced high organic loads in receding floodwaters and presented conditions favourable for the de-oxygenation of water. This ‘blackwater‘ causes asphyxiation and death in fish. The largest blackwater event occurred in the Murray River, but one in the Murrumbidgee was also extensive. The Office, in collaboration with State Water, arranged the urgent delivery of dilution flows to affected areas to facilitate the re-oxygenation of water and the recovery of fish.
Modelling and advice to support planning, monitoring and assessmentThe department is continually updating and upgrading surface water and groundwater models to reflect changing climatic conditions, such as the recent severe drought and possible climate change considerations. Models also need to include any new data that provides a better understanding of the processes being modelled and their interaction (e.g. between surface and groundwater) and reduce uncertainty around results.
Environmental and socio-economic changes from water sharing plansUnder the Water Management Act 2000 all water sharing plans are required to have performance indicators to assess whether the plans have been effective in meeting their objectives. The department is preparing a series of reports
to provide an update of ecological and socio-economic performance monitoring and evaluation. The department published five reports on environmental and socio-economic monitoring for water sharing, for the Namoi, Border Rivers, Macquarie, Gwydir and Northern Rivers. These reports provide an interim assessment of outcomes of the investigations and identify priority needs for future monitoring and evaluation activities in the respective river valleys.
It is important to know whether the water sharing plans are meeting their environmental objectives so that their effectiveness can be reviewed at the end of their 10-year period of operation. To achieve this, the department undertakes ecological monitoring and evaluation activities focused on specific clauses and performance indicators within the water sharing plans.
For instance, in the Border Rivers the flow rules have been monitored and evaluated since 2006. The data from those programs are still being processed and will be available for the review of the water sharing plan in 2014. In addition the department undertook a fish monitoring project downstream of Pindari Dam which suggests that flow management can have significant implications for fish spawning. This work, and the results of sampling during a stimulus flow trial, revealed that fish recruitment is enhanced by larger summer flows, especially for carp gudgeon (Hypseleotris spp.).
Assessing socio-economic changes in the irrigation industryThe department’s Irrigator Survey project commenced in 2005. This is a staged project to monitor the social and economic changes in the irrigation industry within water sharing plan areas. Stage 1 established a baseline data set, and collecting data. Stage 2 involves the follow-up survey and two further surveys, planned for 2012 and 2114.
In 2010 -11 the department undertook the first of the planned follow-up surveys of irrigation licence holders in areas where the first 31 water sharing plans, covering 70 per cent of water use in NSW, were implemented. Around 11 000 irrigators were contacted, of whom over 1700 responded. From these, 1245 were contacted for phone interviews during which information was collected on water use, production and irrigator attitudes.
The interim report detailing results from the 2010 survey, and comparing data to the 2006 baseline, will be published on the department’s website in the latter half of 2011.
Priority Policy Initiatives
Aquifer Interference Regulation and PolicyThe Strategic Regional Land Use Policy requires the development of an Aquifer Interference Regulation that will tighten the regulation of mining and petroleum exploration activities. The first stage of the regulation will amend the Water Management (General) Regulation 2004 and will commence on 1 July 2011. The second stage of the Aquifer Interference Regulation will give effect to the final Aquifer Interference Policy, and is expected to commence in 2012.
NSW TRADE & INVESTMENT ANNUAL REPORT 2010 -11 NSW OFFICE OF WATER

32
In broad terms, the policy applies to any activity that affects groundwater, not just mining. It will outline the volumetric licensing and aquifer interference approval requirements under the Water Management Act 2000. The policy will also define appropriate exemptions from the need to hold a water licence and obtain an aquifer interference approval.
The department has developed a draft Aquifer Interference Policy for targeted stakeholder consultation. This consultation will initially be run through the peak stakeholder reference group; full public consultation on the draft policy will occur after that.
Cold water pollution strategyCold water pollution (CWP) is an artificial decrease in the temperature of water in a natural river. It commonly occurs downstream of large dams due to thermal stratification within the dam, coupled with the release of the lower cold water layer through outlets located towards the base of the wall. The effect on native fish spawning and recruitment is of particular concern as the lifecycles of fish are finely tuned to natural daily and seasonal variations in temperature.
The NSW Government adopted the Cold Water Pollution Strategy in 2004, in recognition that CWP is the second most significant impact arising from the operation of the State’s dams (the primary issue being flow regulation). The Strategy noted that unless CWP was addressed the improvements expected in river health as a result of water sharing plans may not be realised.
The Strategy outlined a number of actions to address CWP, to be undertaken in stages, with each stage operating over a five-year period. The initial stage comprises improvements at priority dams, coordinating actions already in train, and establishing the Strategy’s regulatory and governance structure.
The department coordinates the State’s response to the Strategy and chairs an inter-agency group to manage its implementation. In 2010 -11 the inter-agency group formalised operating protocols, developed by State Water, for priority dams. The protocols outline how State Water will operationalise CWP issues whilst ensuring its requirements for blue-green algal management are met. The department expanded the temperature-monitoring network in NSW so that critical data can be obtained to develop temperature targets for priority rivers and published Guidelines for managing cold water releases from high priority dams. State Water is finalising investigations to guide capital works aimed at managing CWP at Burrendong Dam.
Review of the Water Management Act 2000An evaluation was undertaken and report prepared in order to meet the requirements of Section 10 of the Water Management Act 2000 (the Act), which states:
1. The Minister is to ensure that the work and activities of the department are reviewed at intervals of not more than 5 years for the purpose of determining whether they have been effective in giving effect to the water management principles of this Act and the State Water Management Outcomes Plan.
2. The results of each review under this section are to be included in the relevant annual report for the department under the Annual Reports (Departments) Act 1985.
The scope of this second review was from December 2006 until December 2010. The State Water Management Outcomes Plan (SWMOP) lapsed in December 2007 and so the report only covered the SWMOP up to this period. The review included all the water functions of the former Department of Environment, Climate Change and Water (DECCW) and its predecessors, the majority of which were undertaken by the NSW Office of Water which was a part of the DECCW at the time.
The review identified that DECCW was involved in strategic and regulatory activities that contribute to and are consistent with the principles of the Act. The reasons that DECCW focused on water sharing plans being completed and implemented across the whole of NSW by the end of 2012 included the points that:
• all water users must operate under the Act
• a consistent planning framework is needed for equity reasons prior to the commencement of the Murray–Darling Basin Plan
• it will represent fulfillment of commitments under the accredited NSW National Water Initiative Implementation Plan.
The report concluded that the process of how the principles are considered varied across DECCW, from informal discussion to formal systems that demonstrate consideration of principles and a consistent approach. For example, policy processes had an informal approach to how the principles were considered while approval and compliance processes had embedded processes that refered to the principles within their State-wide systems.
The report concluded that the activities of DECCW were consistent with the principles of the Act but recommended that they develop a formal process for considering how significant activities, such as State-wide policy development, align with the principles. The new department through NSW Office of Water will progress this recommendation and report back at the next review.
Legislative changesSignificant amendments were made to the Water Management Act 2000 in 2010 to respond to emerging issues, such as the need for reform of joint privately owned water infrastructure, to facilitate government investment in environmental water and ensure appropriate accounting for that water, and ensure that water lost from mines is licensed.
As a result of these amendments:
• Licences held by private irrigation boards and private water trusts can now be transformed into licences held by their individual members. The amendments also contained significant reforms to private irrigation boards and trust governance structures which will, when commenced, significantly reduce red tape and provide these bodies with greater flexibility to undertake their irrigation businesses in the interests of their members.
NSW OFFICE OF WATER NSW TRADE & INVESTMENT ANNUAL REPORT 2010 -11

33
• Licences can be granted for environmental purposes arising out of agreements entered into by or on behalf of the State.
• Environmental water held in licences can be properly accounted for, ensuring that growth in use provisions in water sharing plans are not triggered.
• It is clear that taking water for mining activities requires a water licence if the activities drain water from an aquifer or river.
The bulk of these amendments have commenced. The remaining amendments are expected to be commenced in the second half of 2011.
Staged repeal of the Water Act 1912From 28 February 2011 all applications to construct a bore to take groundwater for domestic and stock purposes under a basic landholder right are regulated under the Water Management Act 2000. Previously, applicants needed to determine which legislation applied to their groundwater source in order to identify whether they should apply for an approval under the Water Act 1912 or the Water Management Act 2000. The repeal of the provisions under the Water Act 1912 means there is now only one set of rules applying to the same type of water extraction and use.
Remake of the Water Management (General) RegulationThe Water Management Act 2000 establishes a framework for sustainable water management in NSW. Two current regulations, the Water Management (General) Regulation 2004 and the Water Management (Water Supply Authorities) Regulation 2004 are due to be repealed on 1 September 2011 in accordance with the Subordinate Legislation Act 1989.
The department invited the public to make written submissions on the proposed Water Management (General) Regulation 2011. The submissions will be considered in the preparation of the final regulation(s).
Cost recovery for water planning and management servicesIn December 2009 the department lodged a submission with the Independent Pricing and Regulatory Tribunal (IPART) on proposed water management fees and charges to take effect on expiry of IPART’s 2006 determination.
Following an extended inquiry process, IPART released its final 2010 determination and report in February 2011, providing for new fees and charges to take affect for the three years from 1 July 2011 to 30 June 2014. The Minister for Primary Industries approved the implementation of the new determination on 20 May 2011.
Although the new determination will allow the department to increase its charges for bulk water by up to 73 per cent, prices remain relatively modest as:
• 51 per cent of bulk water users will receive a minimum bill of $101.13 in 2011-12, indexed by the CPI thereafter
• 71 per cent of bulk water users will receive a minimum annual bill of $300 or less by 2013-14
• 84 per cent of bulk water users will receive a minimum annual bill increase of less than $100 pa by 2013-14.
Prices for licensing consent transactions were increased substantially with the intention of allowing the department to fully recover the cost of processing these transactions. A meter service charge and a meter reading charge will also be introduced as part of the new determination.
IPART also published an agreed list of activities that form key performance indicators and targets for the department over the next three years. IPART is of the view that the proposed prices allow for the efficient cost of full operations and that the department should have sufficient funding to meet the targets set.
Licensing and Compliance
Water licensing and approvalsWater licensing is managed under two Acts. Where a water sharing plan has commenced, licences and approvals are managed under the Water Management Act 2000. Licences to extract water outside these areas are still managed under the Water Act 1912.
Licensing under the Water Act 1912Licences issued under the Water Act 1912 are generally tied to the land, as the licence covers both the right to take a specific volume of water as well as the works to be constructed and operated to use that water. There were 7198 surface water licences and 71 016 groundwater (bore) licences managed under the Water Act 1912 at 30 June 2011.
Licensing and approvals under the Water Management Act 2000In water sources where water sharing plans have commenced, Water Act 1912 licences are converted to access licences, which are then listed on a Water Access Licence Register administered by the NSW Land and Property Information.
Water access licences issued under the Water Management Act 2000 provide a clearly defined share of the available water from a particular water source that can be sustainably extracted. They also provide a clearly defined entitlement that is separate from land ownership and that can be bought or sold or used as collateral when seeking finance. As of 30 June 2011, in areas where water sharing plans have commenced, there were 24 100 water access licences listed on the Water Access Licence Register.
Although fewer licences are administered under the Water Management Act 2000 than under the Water Act 1912, the newer licences cover most of the large areas of extraction. About 95 per cent of water extraction in NSW is now managed under this Act. At 30 June 2011, 58 per cent of Water Act 1912 licences had been converted to tradeable Water Access Licences under the Water Management Act 2000.
NSW TRADE & INVESTMENT ANNUAL REPORT 2010 -11 NSW OFFICE OF WATER
34
A controlled activity approval under the Water Management Act 2000 is required for certain types of developments and activities that are carried out in or near a river, lake or estuary. The department is required to assess the impact of works within 40m of a lake, river or estuary to ensure that the environmental impacts can be mitigated.
In the majority of cases the implementation of the controlled activity provisions results in improved environmental outcomes. Security deposits are collected for significant works adjacent to watercourses. These deposits are aimed at ensuring compliance with approvals issued.
Summary of applications processedDuring the year under both Acts the department assessed and determined 7503 applications including:
• 2110 under the Water Management Act 2000 • 5149 under the Water Act 1912 • 244 controlled activity applications
• the collection of $4.3 million in security deposits for controlled activity approvals.
Corporate licensingThe department manages the licences and approvals issued to irrigation corporations and a number of major power and water utilities (see table below). The total water entitlement for these licence and approval holders is more than 5300 GL per annum.
In managing these licences and approvals the department sets conditions for the release of nearly 10 000 GL per annum of planned environmental water. This is a key mechanism for implementing the environmental aims and objectives in the water sharing plans for the State.
Irrigation corporations and major utilities
Irrigation corporations
Murrumbidgee Irrigation Ltd. Murray Irrigation Ltd. Western Murray Irrigation Ltd. Jemalong Irrigation Ltd. Coleambally Irrigation Cooperative Ltd.
Major utilities Power utilities
Delta Electricity Macquarie Generation Eraring Energy Snowy Hydro Ltd.
Water utilities
Sydney Water Corporation Sydney Catchment Authority Hunter Water Corporation
River operator
State Water Corporation
Water tradingThe market for tradeable water entitlements promotes more productive and efficient use of water and assists entitlement holders to adjust to changes in product markets and water availability.
The Water Management Act 2000 provides for water trading (i.e. the buying and selling of licences or annual water allocations) and changes to water access licences (e.g. changing category, subdividing, or nominating work under the licence).
A permanent trade occurs when the licence holder trades the ongoing share of available water. This may involve the transfer of a whole water access licence to another party or the sale of a part of the licence share. Temporary water trading can occur when the licence holder buys or sells a volume of the year’s allocation.
In 2010 -11 there were 1034 permanent transfers undertaken under the Act, totalling 1 263 517 share units. This does not include trades within irrigation corporations, private irrigation districts and irrigation trusts.
The total number of temporary trading activities for water sources subject to water sharing plans was 2018 trades totalling 1 537 720 megalitres (ML). Under the Water Act 1912 there were no permanent transfers recorded during 2010 -11. There were 16 temporary transfers of surface water involving 1023 ML and no temporary transfers of groundwater.
The department provides information for water users and members of the public about water access licences and approvals managed under the Water Management Act 2000. During 2010 -11 there were 28 345 online searches of the register. There were 2934 dealings lodged, including 848 permanent transfers of holder and 11 term transfers.
We continued to represent NSW agencies in the Commonwealth-funded National Water Market System (NWMS). The NWMS aims to substantially enhance the performance of water registers and water trading across Australia. The project includes the development of a Common Registry System that will replace the State’s existing Water Access Licence Register, water transactions systems and retail water accounting systems. The NWMS project commenced in 2009 and has a completion target of December 2014.
Water compliance monitoringThe department is responsible for regulating surface and river water and groundwater in NSW, which includes monitoring, encouraging and maintaining community compliance. The department works with other agencies, such as the State Water Corporation and the Australian Government, to ensure compliance. Compliance activities include:
• community and industry education to promote voluntary compliance
• monitoring water resource activities and deploying proactive programs to identify potential breaches in a timely manner
• investigating alleged breaches and taking appropriate action when a breach occurs.
Drought and climate change increased competition for water and made it an increasingly scarce and valuable natural resource. The department improved its investigatory and enforcement powers to help deter would-be offenders and ensure authorised officers are more effective in detecting, investigating and stopping illegal activities.
In 2010 -11 we received and assessed 507 alleged breach
NSW OFFICE OF WATER NSW TRADE & INVESTMENT ANNUAL REPORT 2010 -11

35
reports, allocated 418 for investigation and finalised 475 investigation reports. These figures represent substantial increases on the previous year.
Investigations and their associated outcomes under water legislation are shown below.
Reports received and assessed
2008-09 2009 -10 2010 -11
Reports received 566 383 507
Reports allocated and finalised
2008-09 2009 -10 2010 -11
Reports allocated for investigation
230 231 418
Allocated reports at year end not finalised
143 188 229
Reports finalised 101 205 475
Compliance actions 2008-09 2009 -10 2010 -11
Notices issued requiring information and records
Not previously reported 27
Culled at risk assessment stage
175
Site visit – no breach detected
118
Advisory letter na 46 132Warning letter 19 109 74Penalty notice 4 40 27Stop work order 6 9 5Remediation notice 16 30 23Licence Suspension 1 2 0Debit Water Account 1 2 0Prosecution commenced Not previously reported 3Prosecution finalised 1
National Framework for Compliance and EnforcementSubject to the provisions of the National Partnership Agreement on Water for the Future, the department obtained Commonwealth funding of $16.7 million to implement the National Framework for Compliance and Enforcement Systems for Water Resource Management.
The Framework aims to provide a nationally consistent approach by strengthening compliance and enforcement within each jurisdiction. This includes:
• robust compliance standards and enforcement strategies
• consistent offences, penalties and evidentiary provisions
• regular and consistent public reporting
• raised public awareness
• increased monitoring and compliance action.
The department has finalised its structure and commenced recruitment to implement the framework and is on track to deliver the first milestone report to the Commonwealth by October 2011.
Office of the Hawkesbury–Nepean
Improving Sydney’s river and catchment healthThe Hawkesbury–Nepean River plays a critical role in delivering economic, social and environmental benefits to NSW and the greater Sydney region. The Hawkesbury–Nepean river system covers an area of 22 000 km2 (2.2 million ha) and stretches 470 km. The river and its catchment provide the majority of the drinking water for over four million people living in greater metropolitan Sydney.
The management of the Hawkesbury–Nepean is complex: numerous agencies and 23 local government areas are involved, all of which have significant roles in its management and its catchment. In recognition of these complex issues the Office of the Hawkesbury–Nepean (OHN) was established in 2009 to:
• improve coordination and implementation of river management strategies
• provide a single point of access to information and advice about the river and its management
• provide opportunities for greater involvement of river users and stakeholders in the management of the river
• promote more effective management of in-stream development, such as jetties and other waterfront structures.
The OHN has continued to meet key milestones with the $77.4 million Commonwealth-funded Hawkesbury–Nepean River Recovery Program, in partnership with other agencies and local government. This program comprises seven projects that aim to improve river health by securing more than seven billion litres of water each year for additional environmental flows, increasing Sydney’s water supply and stopping over 48 tonnes of nutrient pollution from entering the river each year. The program is due for completion in September 2011.
The Hawkesbury–Nepean river system has proven to be particularly susceptible to excessive outbreaks of aquatic weeds. The OHN undertook a review of arrangements for aquatic weed management; it also worked closely with the Hawkesbury River County Council to remove aquatic weeds from the Penrith Rowing Course and other high recreational areas.
In-stream developments in the Hawkesbury–Nepean River have been identified by government and community as an area in need of improved management. The OHN facilitated a multi-agency pilot study, which identified opportunities for streamlining processes and potential options and further work required to deal with issues such as proliferation of non-compliant riverbank works (jetties and walls). The overall aim is to develop a consistent framework for the 18 local government areas involved.
A key function of the OHN is to provide information and assistance to the public in connection with in-stream development, including facilitating the progress of any development application. OHN worked with a number of development applicants to assist with requirements
NSW TRADE & INVESTMENT ANNUAL REPORT 2010 -11 NSW OFFICE OF WATER
36
for integrated developments. The results of these case management studies will assist in identifying current barriers in the application process and potential options for its streamlining.
The OHN also worked on improving information on river health and management. Councils and agencies undertake monitoring and reporting of river health but these are not aligned or consistent. In order to improve the consistency, transparency and rigour of river monitoring, evaluation and reporting (MER) the OHN worked with a number of councils to assist in the development of an MER framework.
The OHN established a stakeholder committee to provide opportunities for greater involvement of river users and stakeholders in the management of the river. The committee provided advice on management strategies in relation to the health of the Hawkesbury–Nepean river system and on community views on river health management issues.
New environmental flows for the Hawkesbury–Nepean were part of a broader plan that includes a range of river health initiatives for the river. The OHN is performing a lead role in the development of new environmental flows from Warragamba Dam by 2014.
Water Savings and Management Programs
Cap and Pipe the Bores programThe Great Artesian Basin is one of the largest underground water resources in the world and underlies 25 per cent of NSW and 22 per cent of Australia.
The Cap and Pipe the Bores program, begun in 1999, is a partnership between the NSW and Australian governments and landholders to reduce water wasted from free-flowing artesian bores and bore drains, replacing them with capped bores and efficient reticulated pipelines. Grants are provided to landholders to assist with new infrastructure costs.
Ongoing benefits of the program include artesian pressure recovery, the re-activation of springs, reduced salinity, reduced greenhouse gas emissions, better water quality, feral animal control, increased primary production and improved land management. Landholders also report a significantly reduced impact of drought.
From 1999 to 2009, $57 million of combined NSW and Commonwealth funds were provided to the program. Under an agreement between the NSW and Commonwealth governments, funding for the Great Artesian Basin Sustainability Initiative will continue until June 2014.
During 2010 -11 construction commenced on seven projects, with estimated annual water savings of 4000 ML and eliminating 462 km of bore drains, though construction on many projects was delayed by wet weather and flooding from Queensland. The completion of all projects is expected by December 2011.
Significant work was undertaken by departmental staff to streamline internal systems and processes to achieve improved delivery and management of Cap and Pipe the Bores projects. These systems and processes have been developed with the flexibility to be transferable to any
similar water infrastructure programs in the future.
Environmental works and measures and cultural heritageThe department administers a number of environmental and river works programs on behalf of the Murray–Darling Basin Authority (the Authority), Snowy Hydro Limited and Catchment Management Authorities.
The two NSW priorities for the Authority’s Works and Measures Program are:
• The Koondrook Perricoota Forest Flood Enhancement project. This project commenced construction in late 2010 but was delayed due to floods in the Murray River. Construction is scheduled to be completed in late 2011.
• Fishways at the Edward River Offtake and Stevens Weir on the Edward River were under construction as at June 2011.
The $2.7 million annual Authority-accelerated River Works and Maintenance Program is reaching conclusion. A reduced program continues to rehabilitate the bed and banks of the Murray River by replacing willows with native species, by including sediment management techniques, and by stabilising the riverbank using groynes and tree stumps harvested during construction of the Koondrook Perricoota Forest Flood Enhancement project. Similar works are also being undertaken in the upper Murray and Tumut rivers.
The department manages the implementation of the Lake Victoria Cultural Landscape Plan of Management on behalf of the Authority’s partner governments. Lake Victoria is vital to the water supply of South Australia and has an extremely rich Aboriginal cultural landscape. The Plan of Management ensures that the operations of the lake are managed to protect burial sites, cultural artefacts and areas of cultural significance. This is done with the integral involvement of the Barkindji Maurara Elders Council who oversee the Cultural Heritage Management program. In 2010 -11 significant progress was made in the protection of burial sites, and new techniques for protection were implemented that included utilising the natural vegetation available at the lake itself.
NSW also manages properties that are adjacent to the lake for conservation purposes. Along with the NSW section of the Chowilla Floodplain Icon Site – Kulcurna – this comprises approximately 70 000 ha of land that links closely with the water environments of the Murray River. In 2010 -11 much of the Murray was in flood and the Kulcurna site saw significant environmental rejuvenation.
Salt interception schemesSalt interception schemes are large-scale groundwater pumping and drainage projects that intercept saline water flows and dispose of them, generally by evaporation. Since 1988, NSW, Victoria and South Australia, together with the Australian Government, funded the construction of salt interception works along the Murray River that have resulted in a reduction of 80 electrical conductivity
NSW OFFICE OF WATER NSW TRADE & INVESTMENT ANNUAL REPORT 2010 -11

37
(EC) units (electrical conductivity is a measure of salinity concentration) at Morgan, South Australia.
To achieve this reduction, salt interception works across the three states pumped about 55 000 ML of saline water from water tables, resulting in about 550 000 tonnes of salt being kept out of the Murray River each year.
As part of the 2001-15 Basin Salinity Management Strategy, adopted by the partner governments in 2001, the department manages a number of salt interception schemes and salinity monitoring infrastructure on behalf of the Authority:
• Billabong Creek Salt Interception Scheme is funded under the Billabong Creek Green Offsets Project. An agreement was reached between the NSW Government through the department and the former Department of Environment, Climate Change and Water, and the Norske Skog Paper Mill at Albury. The Billabong Creek Green Offsets Project will allow Norske Skog to discharge a limited volume of moderately low-strength saline process water into the Murray River, in return for funding the operation and maintenance of the Billabong Creek Salt Interception Scheme. This joint initiative allows Norske Skog to maintain and develop its current operation, injecting over $100 million each year into the local economy, whilst maintaining a 0.1 EC benefit at Morgan. This allows for the creation and maintenance of jobs in a rural economy ravaged by over 10 years of drought.
• Buronga Groundwater Interception Scheme, commissioned in 1979, continues to be effective in mitigating the impacts of saline groundwater accession to the river, reducing the average salinity at Morgan by an estimated 33 EC.
• Mallee Cliffs Groundwater Interception Scheme, commissioned in 1994, reduces the average salinity at Morgan by an estimated 13 EC. The scheme continued to operate successfully during recent flooding events.
• Upper Darling Salt Interception Scheme, located on the Glen Villa reach of the Darling River, is a new scheme which has been under construction as part of the 2001 Basin Salinity Management Strategy. This is the first scheme to be constructed on the Darling River. The
scheme was expected to be completed by July 2011 but the flooding events in the Upper Darling delayed its completion. It is now scheduled to become operational by August 2011. When completed, the scheme will provide improved water quality for downstream water users as well as aquatic ecosystems.
Water Monitoring
National water accountingWater accounting across Australia is undergoing major reform resulting from agreements under the National Water Initiative. A national standard has been drafted to ensure a more cohesive national approach to the way Australia manages, measures, plans for, prices and trades water.
The draft standard defines the structure to be adopted for production of a General Purpose Water Accounting Report (GPWAR). In support of the Initiative, and as a means of testing the effectiveness of this style of reporting in NSW, we produced and published GPWARs for the regulated components of the Murrumbidgee, Namoi–Peel and Macquarie catchments.
These GPWARs provided a consolidated and detailed account of the water resources available and the management of those resources for 2009 -10. By producing these GPWARs, and with the anticipated future expansion of water accounting in NSW, the department is streamlining and enhancing its systems to efficiently and accurately deliver on a wide range of internal and external reporting obligations.
Water monitoring networksThe department holds most NSW information on water resources, with records of river flows and groundwater levels across the State extending back more than 100 years. A comprehensive network of monitoring stations is maintained throughout the State and is upgraded as required.
In 2010 -11, 65 surface water and 30 groundwater monitoring sites were installed to better monitor the State’s water resources and meet the needs of the new water sharing plans. The following table shows total operational monitoring sites.
Total operational monitoring sites2006-07 2007-08 2008-09 2009 -10 2010 -11
Surface water – continuous sites* 933 949 1 040 1 031 1 080Groundwater – continuous sites 650 677 669 723 789Grab sample water quality sites 427 359 317 309 617Groundwater – manual sites 3 913 3 162 2 958 3 014 2 510
*Includes continuous water quality sites
Real-time data collectionThe department operates a telemetry system for receiving and downloading data from over 726 river gauging sites, 241 groundwater sites and 674 metering facilities around NSW. This enables the previous 24 hours data to be collected from the whole State in about 20 minutes. It also
assists in providing data for flood warnings.
Information is collected, processed and automatically sent to key clients, including State Water, the Murray–Darling Basin Authority and the Bureau of Meteorology. It is also available online, where it is accessed by the State Emergency Service and other agencies, irrigators and the
NSW TRADE & INVESTMENT ANNUAL REPORT 2010 -11 NSW OFFICE OF WATER

38
general public.
The surface water telemetry network is undergoing a major upgrade – currently 73 per cent complete – through which sites will transmit data hourly directly to the Internet, giving water managers and the public the most up-to-date information. The system is meeting or exceeding the target of having 95 per cent of data available on the Internet by 9 am daily.
All the groundwater monitoring sites are also providing data for groundwater sharing plans.
Water metering and extraction monitoringIn December 2009, COAG endorsed a National Framework for Non-urban Water Metering to improve the accuracy of water metering. After 30 June 2010, meters installed must comply with national standards. The department has developed a Metering Implementation Plan that describes ways in which NSW will implement the national standards.
The department is installing new water meters under the Hawkesbury–Nepean River Recovery program, funded by the Australian Government. At 30 June 2011, new water meters had been installed on approximately 93 per cent of the extractive capacity in the Hawkesbury–Nepean River. Installation will continue until September 2011.
Water resource information onlineThe information from the NSW Government’s water website is managed by the department and includes data from a range of state agencies, particularly the Manly Hydraulics Laboratory (operated by the NSW Department of Finance and Services) and State Water Corporation. The website receives over eight million visits each year, providing real-time and near real-time water data, as well as information from the department’s monitoring programs.
Monitoring, evaluation and reporting for water resourcesThe department is the lead agency responsible for the monitoring, evaluation and reporting against the NSW Government’s State-wide resource condition targets for Riverine Condition and Groundwater.
The department coordinates this work via the Riverine and Groundwater Theme Teams. Their role is to provide technical advice and review of the programs and assist in the compilation of State of the Catchment report cards – the means by which progress in meeting the targets is formally reported to the public and Government. For the Riverine and Groundwater Themes, data for the report cards was based on work under taken for the Murray–Darling Basin Sustainable Rivers Audit and a hydro-geological expert panel. This work is recognised in the NSW Natural Resources Monitoring Evaluation & Reporting Strategy 2010 -2015 as the Resource Condition Strand.
State of the Catchment reports have been published for each of the 13 catchment management authority areas showing riverine health and groundwater condition. In addition, two technical reports have been published which detail how these reports were developed and how river
health and groundwater condition were assessed.
NSW Algal Management StrategyMost algae are safe and are a natural part of aquatic ecosystems. However, some can produce toxins that are damaging to humans, domestic animals and livestock. These algae can be found in freshwater as well as brackish and marine waters.
Blue-green algae (also known as cyanobacteria) are the only group of algae to be toxic in fresh water. Though microscopic, when they form colonies they can become visible to the naked eye and can produce potent liver and neuro toxins and skin irritants. Toxic marine and estuarine algae can also affect recreational water use. Some of these algae can cause illness if ingested and others can cause skin irritations. These algae often cannot be seen, but some cause red coloration to water, a phenomenon known as ‘red tides‘.
The NSW Algal Management Strategy outlines a whole-of-government approach to managing algal blooms. The strategy is administered by the department and supported by a State Algal Advisory Group, which sets the policy and framework, and nine regional coordinating committees. These committees minimise impacts, provide warnings and advice to the public, and maintain an extensive network of algal monitoring sites throughout NSW.
The Strategy also includes a framework for managing marine algal blooms. Various marine blooms occurred along the NSW coast during the past summer, causing the closure of some beaches by local councils or warnings against recreational collection of shellfish.
A total of 43 algal red alert media releases were issued in 2010 -11. There were also four locations where marine algal alerts for shellfish gathering were issued by NSW Fisheries or by the NSW Food Authority. One of these locations had two separate blooms.
Groundwater drillingThe department provides specialist services to Government agencies and communities for water-well drilling, particularly for very deep bores. Significant projects this year included:
• drilling six new artesian bores as part of the Cap and Pipe the Bores program
• construction of one deep production bore in the Koondrook Perricoota Forest to provide water for the Living Murray project
• construction of five production bores for three Piping NSW schemes for Barwon Channel, Lower Gwydir and Noonoomah scheme on the Lower Lachlan
• construction of four production bores for the Upper Darling Salt Interception Scheme west of Bourke
• installation of monitoring bores in the Murrumbidgee, Lachlan and Namoi valleys for groundwater, and monitoring the interaction between groundwater and river levels
NSW OFFICE OF WATER NSW TRADE & INVESTMENT ANNUAL REPORT 2010 -11

39
• establishment of a test production bore and monitoring bores for the University of NSW at Maules Creek to allow research into groundwater and surface water interactions
• undertaking coring through aquiclude in the Liverpool Plains for the University of NSW to determine hydraulic properties of the clays.
Water utilities
Country Towns Water Supply and Sewerage ProgramThis program supports the provision of effective, sustainable and safe water supply and sewerage services by the 106 non-metropolitan local water utilities in NSW.
The department develops strategic policy and provides leadership, guidance and technical expertise to assist water supply and sewerage services in non-metropolitan urban areas of NSW, as well as planning and procuring infrastructure. Key services include:
• leading, guiding and providing technical assistance in best-practice management, operation and maintenance for 106 non-metropolitan utilities
• overseeing and monitoring utility performance
• managing local water and sewage treatment activities, and dam safety programs, to ensure the safe and effective management of the 580 water and sewage treatment works and 116 dams and weirs
• administering funding for backlog water and sewerage infrastructure and emergency drought assistance.
Strategic business and financial planningTo assist the delivery of effective and efficient water supply and sewerage services in non-metropolitan NSW, the 106 local water utilities are required to prepare and implement sound strategic business plans to demonstrate their financial sustainability. This includes a 30-year asset management plan to address future infrastructure needs. Through these plans, utilities can fund all future commitments for capital and recurrent expenditure, and dividend and tax-equivalent payments.
In the most recent monitoring report for 2009 -10, 91 per cent of local water utilities completed a sound strategic business plan and long-term financial plan, compared to only 31 per cent 11 years earlier. This includes all utilities with over 3000 connected properties and covers over 98 per cent of the connected properties in non-metropolitan NSW.
Responsible and equitable pricing of water supply, sewerage and liquid trade waste services is a key responsibility of each utility. Such pricing enables customers to balance the benefits and costs of their use of water services, and promotes efficient use of water resources. The introduction of such pricing is a key aspect of the National Water Initiative, the COAG’s Framework for Water Reform and the National Competition Policy.
The strong pricing signals provided have enabled NSW local water utilities to avoid more than $1 billion in water and sewerage capital expenditure over the past decade, while also avoiding the need to increase overall costs to users.
Trade waste regulationOne hundred local water utilities in NSW are responsible for regulating liquid trade waste discharges to their sewerage systems. Responsibilities include approving and monitoring discharges and levying appropriate fees and charges. To assist utilities, the Office released Liquid trade waste regulation guidelines in 2009.
In order to comply with the best practice guidelines, local water utilities are also required to adopt and implement an appropriate liquid trade waste policy. To assist them, the Office provided a model policy, reviews utilities’ policies, and provides consent to soundly based policies. As at 30 June 2010, 76 per cent of utilities had an appropriate trade waste policy, 73 per cent had complying liquid trade waste fees and charges, and 75 per cent had complying non-residential sewerage charges.
Utility performanceThe department monitors the performance of each of the local water utilities and discloses the results in its annual NSW water supply and sewerage performance monitoring report. The department has published this annual report since 1986.
The 2009 -10 report (the most recent available) presents key performance indicators for all utilities, together with the State-wide performance of the combined non-metropolitan water utilities and interstate comparisons. The report was provided to various government agencies and IPART.
Summary performance reports are provided by the department for each utility, showing its performance and its ranking relative to other utilities on over 50 key performance indicators. Each utility is required to annually review its performance using this report and to prepare an action plan to its parent council to address any areas of under-performance.
Overall compliance with the 19 requirements of the NSW Best-Practice Management of Water Supply and Sewerage Guidelines by local water utilities is now 85 per cent, compared to 46 per cent five years ago.
National performance frameworkThe department is a member of the roundtable group that developed and maintains the National Performance Framework for annually reporting the performance of the larger urban water utilities (those with more than 10 000 connected properties) under the National Water Initiative.
Under this criterion, 32 NSW utilities are eligible for reporting in the National performance report 2009 -2010 for urban water utilities. This report shows that:
• of the eight Australian states and territories, NSW is one of the three that have complied with the economic regulation and pricing requirements of the National Water Initiative
• while real water and sewerage prices have been increasing in recent years to fund increases in operating and capital expenditure, non-metropolitan NSW was an exception to this national trend, with a total real increase
NSW TRADE & INVESTMENT ANNUAL REPORT 2010 -11 NSW OFFICE OF WATER
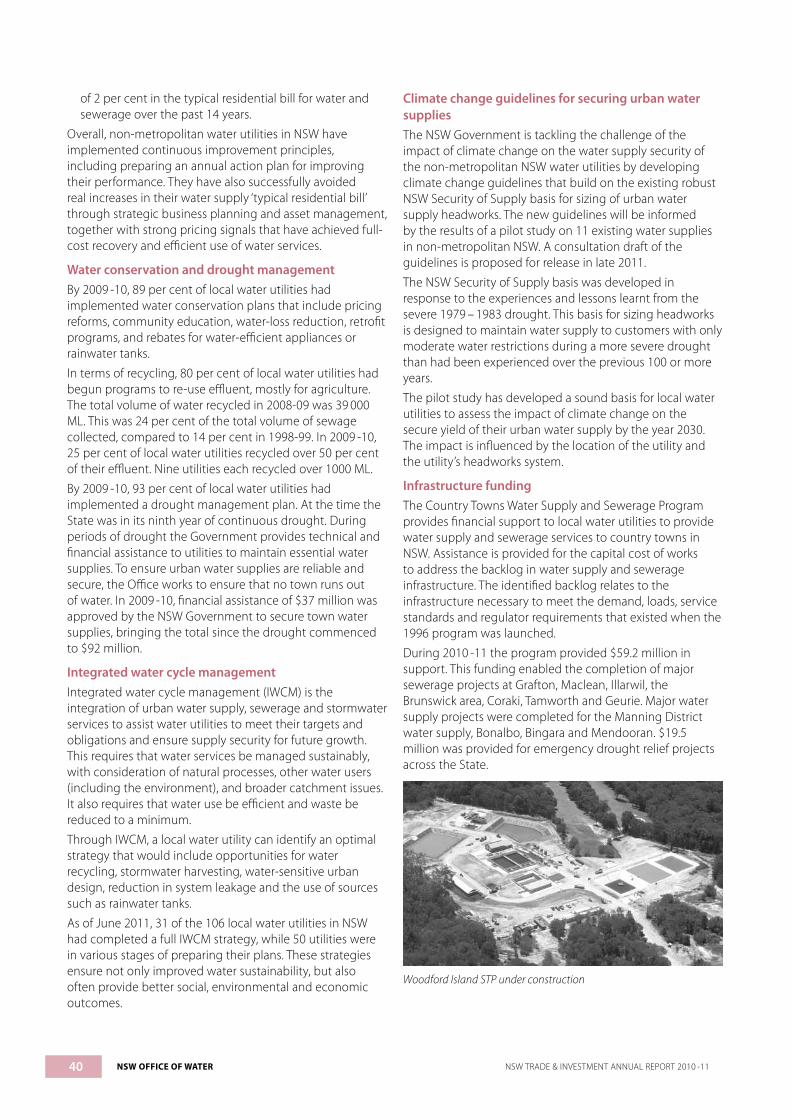
40
of 2 per cent in the typical residential bill for water and sewerage over the past 14 years.
Overall, non-metropolitan water utilities in NSW have implemented continuous improvement principles, including preparing an annual action plan for improving their performance. They have also successfully avoided real increases in their water supply ‘typical residential bill’ through strategic business planning and asset management, together with strong pricing signals that have achieved full-cost recovery and efficient use of water services.
Water conservation and drought managementBy 2009 -10, 89 per cent of local water utilities had implemented water conservation plans that include pricing reforms, community education, water-loss reduction, retrofit programs, and rebates for water-efficient appliances or rainwater tanks.
In terms of recycling, 80 per cent of local water utilities had begun programs to re-use effluent, mostly for agriculture. The total volume of water recycled in 2008-09 was 39 000 ML. This was 24 per cent of the total volume of sewage collected, compared to 14 per cent in 1998-99. In 2009 -10, 25 per cent of local water utilities recycled over 50 per cent of their effluent. Nine utilities each recycled over 1000 ML.
By 2009 -10, 93 per cent of local water utilities had implemented a drought management plan. At the time the State was in its ninth year of continuous drought. During periods of drought the Government provides technical and financial assistance to utilities to maintain essential water supplies. To ensure urban water supplies are reliable and secure, the Office works to ensure that no town runs out of water. In 2009 -10, financial assistance of $37 million was approved by the NSW Government to secure town water supplies, bringing the total since the drought commenced to $92 million.
Integrated water cycle managementIntegrated water cycle management (IWCM) is the integration of urban water supply, sewerage and stormwater services to assist water utilities to meet their targets and obligations and ensure supply security for future growth. This requires that water services be managed sustainably, with consideration of natural processes, other water users (including the environment), and broader catchment issues. It also requires that water use be efficient and waste be reduced to a minimum.
Through IWCM, a local water utility can identify an optimal strategy that would include opportunities for water recycling, stormwater harvesting, water-sensitive urban design, reduction in system leakage and the use of sources such as rainwater tanks.
As of June 2011, 31 of the 106 local water utilities in NSW had completed a full IWCM strategy, while 50 utilities were in various stages of preparing their plans. These strategies ensure not only improved water sustainability, but also often provide better social, environmental and economic outcomes.
Climate change guidelines for securing urban water suppliesThe NSW Government is tackling the challenge of the impact of climate change on the water supply security of the non-metropolitan NSW water utilities by developing climate change guidelines that build on the existing robust NSW Security of Supply basis for sizing of urban water supply headworks. The new guidelines will be informed by the results of a pilot study on 11 existing water supplies in non-metropolitan NSW. A consultation draft of the guidelines is proposed for release in late 2011.
The NSW Security of Supply basis was developed in response to the experiences and lessons learnt from the severe 1979 – 1983 drought. This basis for sizing headworks is designed to maintain water supply to customers with only moderate water restrictions during a more severe drought than had been experienced over the previous 100 or more years.
The pilot study has developed a sound basis for local water utilities to assess the impact of climate change on the secure yield of their urban water supply by the year 2030. The impact is influenced by the location of the utility and the utility’s headworks system.
Infrastructure fundingThe Country Towns Water Supply and Sewerage Program provides financial support to local water utilities to provide water supply and sewerage services to country towns in NSW. Assistance is provided for the capital cost of works to address the backlog in water supply and sewerage infrastructure. The identified backlog relates to the infrastructure necessary to meet the demand, loads, service standards and regulator requirements that existed when the 1996 program was launched.
During 2010 -11 the program provided $59.2 million in support. This funding enabled the completion of major sewerage projects at Grafton, Maclean, Illarwil, the Brunswick area, Coraki, Tamworth and Geurie. Major water supply projects were completed for the Manning District water supply, Bonalbo, Bingara and Mendooran. $19.5 million was provided for emergency drought relief projects across the State.
Woodford Island STP under construction
NSW OFFICE OF WATER NSW TRADE & INVESTMENT ANNUAL REPORT 2010 -11

41
The total expenditure on the program since 1996 exceeds $935 million. This has enabled the completion of 464 water supply and sewerage projects that have delivered enhanced public health, environment and security of services, directly benefiting more than one million residents in country NSW. The NSW Government’s total commitment to this program is now more than $1.2 billion, and the program is scheduled to run until 2016 -17.
Aboriginal Communities Water and Sewerage ProgramAccess to clean drinking water and the ability to safely dispose of waste water are critical to improving the health of Aboriginal communities, and makes an important contribution to closing the gap between Aboriginal and non-Aboriginal people in NSW.
The NSW Aboriginal Land Council and the NSW Government are working in partnership to improve water and sewerage services to discrete Aboriginal communities across NSW. Together, more than $200 million will be invested over 25 years on maintenance, operation, monitoring and capital works for water and sewerage infrastructure in these communities. The program commenced in July 2008. The Office manages the program, with implementation overseen by a steering committee.
Risk-based management plans are being developed to identify risks to the continued safe operation of the water supply and sewerage systems in order to improve the reliability of the systems. To date, 54 management plans have been completed and there are plans to complete the remaining seven early in the new financial year.
The department consults with local Aboriginal land councils and local water utilities to develop agreements through which the utilities, or other service providers, take responsibility for day-to-day operation and maintenance of water and sewerage systems. Four long-term agreements have been executed so far, and 26 interim agreements are in place.
As a result of the program, more than 3000 Aboriginal people are now receiving a better water supply or sewerage service, or both of these.
Future directions • Supporting the State’s $3 billion per annum irrigation
industry, the environment and its rivers and groundwater systems.
• Ensuring the long-term sustainability of our freshwater resources for consumptive and environmental needs.
• Responding to the Murray–Darling Basin Authority’s Basin Plan by ensuring NSW’s interests are represented and supported.
• Working to maximise the benefits to NSW from the Australian Government’s Water for Our Future Program, the National Water Initiative, the Australian Government Water Fund and implementation of interstate agreements.
• Continuing to implement water management reforms by developing strategic water management policies and amending water management legislation.
• Expanding and improving the efficiency of the water market system.
• Securing Commonwealth investment in regional infrastructure such as:
– water saving projects to maximise the efficiency of water distribution systems and water use
– river health initiatives including riparian vegetation, cold water pollution mitigation and fishways.
• Continuing to address water supply security, regional demand growth and integrated water-cycle management to enable the provision of a secure and sustainable potable water supply, supported by effective effluent management, for all communities served by non-metropolitan urban water utilities in NSW.
• Managing the Aboriginal Communities Water and Sewerage Program, contributing to closing the gap between the health of Aboriginal and non-Aboriginal people in NSW.
Divisional performance
Service Measures Units 2008-09Actual
2009 -10Actual
2010 -11Forecast
2010 -11Est. Actual
Water sharing arrangements in place or commenced % 47 54 84 641
Water Act 1912 licences with volumetric entitlements converted to water access licences under Water Management Act 2000
% 40 45 59 58
Free flowing bores remaining to be controlled in the Great Artesian Basin
no 295 282 255 272
Volume of sewerage effluent recycled in non-metropolitan New South Wales
GL 38 39 40 40
Water supply and sewerage projects completed no 368 385 411 4642
1. Increase in the number of water sharing plans required to be developed, as well as the increasing complexity of the issues for remaining WSPs and associated community consultation requirements.
2. With the drought breaking rains a number of drought projects were able to be ceased at their current stage.
NSW TRADE & INVESTMENT ANNUAL REPORT 2010 -11 NSW OFFICE OF WATER

42 CROWN LANDS DIVISION NSW TRADE & INVESTMENT ANNUAL REPORT 2010 -11
The department’s Crown Lands Division (CLD) leverages state-owned Crown land, linking with other agencies, local government, the private sector and local communities to provide social and economic outcomes for the people of NSW.
Crown lands make up nearly half of all land in NSW with an estimated value of $6.1 billion including:
• 35 000 reserves, 17 State Parks, 8 major recreational trails, 70 000 leases and licences, 270 caravan parks, 25 coastal harbours and the Tweed River Entrance Sand Bypassing Project.
Many of the most iconic sites in NSW are situated on Crown land including Hyde Park, Bondi Bathers, Living Desert State Park Broken Hill, Coffs Harbour foreshore and the heritage listed Wollongong Harbour. These important public assets are managed by CLD, a regionally-based agency that focuses on people and their many and varied needs for the use of Crown land to live better and enjoy more.
Key challengesCrown Lands division was required to meet an $18 million revenue target generated through the roads and perpetual lease programs. The division undertook business process re-engineering and the establishment of a centralised high-processing business centre to assist in meeting the targets.
Delays in the sinking of the ex-HMAS Adelaide, due to legal action, posed significant challenges to Crown Lands, including the cancellation of the initial scuttling event in March 2010, the requirement to service legal proceedings, to carry out additional works on the ship, and to house the ship until its eventual scuttling in April 2011. The division’s close working relationship with other NSW Government agencies – including Sydney Ports, NSW Police and NSW Maritime – as well as its relationship with the contractor, all assisted in ensuring the ship was safe and secure and well prepared for its eventual scuttling.
Major outcomes
Rebuilding a strong economyAs the landowner of 47 per cent of the State, Crown Lands realises the tremendous potential it has to directly influence the revitalisation of regional towns through partnerships with local government and local communities, creating opportunities for employment, tourism and growth.
Over the past decade, Crown Lands has embarked on an ambitious program of revitalisation projects in towns including Coffs Harbour, Forster/Tuncurry, Gosford, Newcastle, Port Stephens, Tweed Heads, Wagga Wagga and Wollongong, lifting the profile of the importance of Crown land in the process.
CROWN LANDS DIVISION

43NSW TRADE & INVESTMENT ANNUAL REPORT 2010 -11 CROWN LANDS DIVISION
Riverside Wagga Wagga: the redevelopment of Wagga CBDThe inland city of Wagga Wagga is a vibrant regional hub located on the Murrumbidgee River but, like many regional centres, it needed a vision for revitalisation of its riverside reserve area.
As the majority landowner in the precinct, Crown Lands entered into a memorandum of understanding (MoU) with Wagga Wagga City Council to embark on an exciting project to bring the riverside area to life with community, recreational and tourism facilities.
Following extensive community and stakeholder consultation, a strategic master plan was developed. Investigations, including a comprehensive flood study, were completed to establish the suitability of a new caravan park site, which will culminate in the lodgement of a development application. In late 2011 it is planned to call for expressions of interest for the lease, development and operation of the caravan park.
Once fully realised, this project will enhance the economic and social health of this important regional centre by better integrating the natural beauty of the river with the CBD.
Albury: environmental landsIn March 2008 a deed of transfer was executed for the transfer of approximately 615 ha of land from Albury Wodonga Corporation (AWC) to Crown Lands. The deed provided for the funding from the AWC for capital expenditure and maintenance of the environmental lands for a period of 10 years. The lands had been identified in the Thurgoona and Albury Ranges Threatened Species Conservation Strategies. To date, approximately 85 per cent of the identified land has been transferred.
Crown Lands established a management structure, including a full-time senior project officer and an advisory committee consisting of representatives of government agencies and community representatives.
The key objects of the project are to enhance and maintain habitats for threatened species. Programs are being developed involving on-ground works to meet the objectives, as well as liaison with neighbouring landowners to ensure their developments do not adversely affect the habitats.
Newcastle: revitalising the city centre and coastlineCrown Lands led a number of revitalisation projects for the city of Newcastle.
The Newcastle Beaches Coastal Reserves project is setting the foundation for the future management and revitalisation of Newcastle’s iconic beaches, from Stockton in the north to Merewether in the south. The Newcastle Coastline Revitalisation Masterplan provides a strategic framework for more detailed planning, resource allocation and decision making for the future use of this 11 km stretch of coastline. It will assist with managing the coastal resources in a coordinated way and ensure the coastline meets the current
and future community expectations. An MoU was signed between Crown Lands, Newcastle City Council, Hunter Surf Life Saving Incorporated and Newcastle’s six surf clubs, committing all parties to a cooperative and integrated approach to the planning and development of the city’s beaches.
The handing over of Nobby’s Headland to Crown Lands was a major achievement, with work underway to activate the site up for public use. As a first step, Crown Lands held a number of public open days during February and March, with over 7500 people visiting this historic site. Crown Lands will establish a community access plan that will enable the community to safely access the site whilst ensuring that critical port operational equipment and heritage assets are protected.
The redevelopment of the former Newcastle Bowling Club site at King Edward Headland Reserve was finalised. The derelict bowling club buildings were demolished and will be replaced by a modern function centre, which will be used for a range of activities such as weddings and conferences. A public kiosk will be provided, enabling Newcastle residents and visitors to enjoy a meal or coffee while taking in the panoramic views. Importantly, the remainder of the King Edward Headland Reserve will be upgraded for public recreational use and will include landscaping, viewing platforms, pathways, seating and lighting. Stronach Property Pty Ltd was selected for the project after a public expression of interest process.
The former Newcastle Post Office is an iconic heritage building which has been identified as playing an important role in achieving the objectives of the NSW Government’s future revitalisation plans for Newcastle, particularly in relation to creating a more active and vibrant town centre. The building is a Newcastle landmark and has the potential to become a hub for the CBD. Crown Lands is undertaking a range of repair and maintenance works to protect and conserve the building in preparation for redevelopment.
Tweed River Entrance Sand Bypassing ProjectThe Tweed River Entrance Sand Bypassing Project is a joint initiative of the NSW and Queensland governments. Its aim is to ensure the continued economic and social viability of the Tweed and Gold coast precincts, albeit for differing reasons.
For the Tweed, the bypass ensures the river entrance remains navigable for the many thousands of commercial, recreational and marine rescue boats that use the entrance every year. The project has been so successful that the entrance has been transformed from one of the most treacherous entrances in the State to one of the safest. As a result, usage of the entrance has doubled since the project started in 2001, ensuring the local economy benefits from the increase in visitor numbers. Another bonus for the Tweed is that its world-renowned surfing beach Duranbah, or D-bah as it’s known locally, is also a focal point for the project, being part of an active management regime of sand placement (in consultation with the local community)
44
to maintain its status as one of the best breaks on the east coast.
For the Gold Coast, the project ensures beaches are nourished with a regular supply of sand as a storm-proofing measure, stopping erosion and helping to maintain the natural iconic environment that encourages millions of visitors to the region every year to enjoy attractions such as its world-class surfing breaks. As a result of the project, the region benefits as a whole from the injection of tourism, encouraging economic growth in this major international destination. During 2010 -11 a total of about 435 000 m3 of sand was transported. The total NSW Government contribution to the project during that year was $4.3 million.
DredgingThe dredging of waterways in regional coastal towns ensures continued access to local ports. They are often the economic hub of the communities they serve, supporting local fishing and tourism industries and providing recreational opportunities for locals and visitors alike.
This financial year, Crown Lands contributed $480 000 from the Waterways program to completed projects across the State, including the Myall River entrance, Wallis Lake, Brisbane Water, Summerland Point and Swallow Rock channel.
Under its Minor Ports and River Entrance program, Crown Lands funded $105 000 for restoration works to the navigation channel at Evans Head, where a fishermen’s cooperative has operated for more than 50 years. Today there are approximately 10 trawlers and a similar number of charter boats operating out of the harbour. Depths in the Evans River recently became a problem, making access to the ocean from the harbour extremely difficult. The program has now been successfully completed, with the removed sand used for beach renourishment nearby. The improvement works will benefit boaters, users of the local caravan park opposite to the works, and the broader community in general.
Restoring quality services.Restructure to focus on frontline services
Throughout 2010 -11, Crown Lands undertook a major reform to improve its service delivery, including a restructure of its operations to a frontline service focus on managing Crown land. This included the establishment of a business centre in February 2011 to centralise high-volume processing of Crown road applications, telecommunications licensing, domestic waterfront licensing and Crown reserve annual reporting.
The focus of the business centre is to improve client servicing through a one-point-of-contact approach and through increased efficiency in application handling and processing.
As high-volume processing is removed from local offices, regional staff can focus on more proactive land management practices in partnership with their communities.
Holiday opportunities and natural camping sitesCaravanning and camping is an integral part of the Australian way of life, with many Australians having stayed in a park at least once in their lives. The demand for parks has increased dramatically over the past 15 years as more and more caravanning and camping products have become available and ‘baby boomers‘ take to the roads in great numbers as part of the ‘grey nomad‘ movement.
Over one-third of the NSW caravan and camping sites are on land managed by Crown Lands. Covering areas from the beach to the bush and everywhere in-between, Crown Lands is the largest landowner for caravan and camping parks in the State. Local management of these parks can be via a local government trust arrangement, a commercial lease to a private operator, or through an administrator.
Over the last five years, Crown Lands has developed processes and systems to improve the quality of Crown caravan parks. The return to the State from this valuable social and commercial asset is enhanced through improved practices, benchmarking, and increased involvement of Crown Lands.
The division is also considering opportunities to develop a self-sustaining natural camping network on Crown reserve land consistent with health and public park usage initiatives. As part of this focus, Crown Lands has worked with Clarence Valley Council to enhance low-cost holiday opportunities by establishing four new natural camping grounds in the Upper Clarence River area. Clarence Valley Council granted approvals to operate the four new camping grounds, which will provide a total of 116 campsites.
The camping sites are planned to be operational by the spring 2011 school holiday period. A joint application by Clarence Valley Council and Crown Lands was successful in obtaining around $270 000 funding from the Australian Government through its TQUAL (Tourism Quality) grants program, which is aimed at stimulating sustainable growth in the Australian tourism industry.
Holiday park upgradesThe Urunga Holiday Park is a great example of what a Crown land park can offer. The park has enjoyed capital improvement works with a $1.2 million investment, which has not only improved the park itself, with new amenities and upgraded facilities, but has also contributed to the beautification of the adjacent Urunga Morgo Street Crown foreshore reserve. Following these works, the reserve has become the centrepiece of the town with a new outdoor amphitheatre, new pathways, landscaping and better access for the entire community to the beach and waterways. The entire Crown reserve precinct in Urunga now takes pride of place in this wonderful community.
The redevelopment of Clarkes Beach Holiday Park at Byron Bay is another example of the success of Crown land management. In the past three years Clarkes Beach has seen a $3.5 million refurbishment, providing improved facilities and extensive landscaping. One of the many positive outcomes of this program was that in July 2010 the park
CROWN LANDS DIVISION NSW TRADE & INVESTMENT ANNUAL REPORT 2010 -11

45
won the Environmental Excellence Award for Holiday Parks at the Caravan and Camping Industry Association of NSW Awards of Excellence. The park benefited from a significant growth in occupancy and a 60 per cent increase in income.
Canoe trails and kayak trailsRivers are often described as the lifeblood of the country. They are the centrepiece of the history and legend of the building of our nation – reminders of times gone by, and places of peace, tranquillity and reflection. Rivers also form a major part of the portfolio managed by Crown Lands.
In order to encourage a greater interaction with the State’s river system and surrounding Crown reserves, Crown Lands expanded its popular portfolio of recreational walking tracks and applied the concept to four major river systems: the Hawkesbury-Nepean, the Tumut River, the Murrumbidgee River and the Macquarie River. The result is a network of canoe trails that enable public access and enjoyment of a significant component of the State’s Crown land portfolio.
In this reporting year the Clarence River community finalised details for its own canoe and kayak trail, which will soon be added to the series. These canoe trails provide low-cost activities for enthusiasts and campers, families and friends to enjoy the outdoors, be active, connect with nature and experience the historic identity of the nation. They also provide a boost to regional economies through tourism and related opportunities.
This initiative has had grassroots support from local canoe clubs, local councils and local community and council reserve trusts, along with peak support via Paddle NSW, the State-wide body for recreational canoeing. At the invitation of Parks and Leisure Australia the trails were presented at its conference in Dubbo this year.
The canoe trails are supported by map kits that show river access and camping locations. The kits can be purchased as durable booklets, downloaded as PDFs or as a Google file and customised to the users preference.
National surfing reservesCrown Lands is the lead agency on the National Surfing Reserve (NSR) initiative in NSW. Crown land along the NSW coast has some of the best surfing breaks in the world. Crown Lands division formed a winning partnership with the NSR movement, promoting the initiative as a way to work with local communities to promote the importance of Crown land to the history and culture of Australian surfing.
This year, Manly was dedicated as a National Surfing Reserve. Manly is the birthplace of surfing in Australia, with a surfing heritage of 100 years. The NSR stretches over four kilometers, extending from Harbord Point south to Fairy Bower and including Freshwater Beach, Queenscliff, North Steyne and Manly beaches together with the smaller Shelly Beach around to the Bower. It is the site of the first legal bathing (1902), the first surf club (1903), first body surfing and first surf boat (1907), Duke Kahanamoku’s famous board surfing demonstration (1915), first world surfing championships
(1964) and home to two world surfing champions, Barton Lynch and Layne Beachley.
Ex-HMAS Adelaide dive siteThe Australian Government gifted the ex-HMAS Adelaide to the State of NSW to create an artificial reef and dive site on the Central Coast of NSW. Over the past 10 years a process of investigation, consultation and environmental assessment has taken place. A final resting place for the ship was selected and the gazettal of the HMAS Adelaide as a Crown reserve was completed. The ship was scuttled in April 2011 and is already a feature for the local Central Coast economy, creating tourism growth and job opportunities.
Ex-HMAS Adelaide as it stands on the ocean floor today, already home to a variety of marine life.
Improved environmental managementThe principles of Crown land management ensure environmental values are well considered in the allocation and use of the Crown lands estate. In discharging its responsibilities, Crown Lands division:
• considers the multi-purpose suitability of Crown land prior to its allocation, acknowledging appropriate environmental management stewardship
• assesses environmental values (biodiversity, soil, water quality etc.) of perpetual leases, protecting them in perpetuity prior to conversion to freehold
• strategically supports noxious weeds and feral animal control programs on Crown lands, of trusts, Landcare, livestock pest and health authorities, weed county councils and local government
• facilitates partnerships with other organisations, such as trusts, catchment management authorities, State agencies and local government, to ensure well-coordinated and supported programs, to achieve optimal environmental management within catchments that include Crown lands
• addresses baseline environmental outcomes on tenured Crown land through appropriate conditions, supported by an active compliance program.
NSW TRADE & INVESTMENT ANNUAL REPORT 2010 -11 CROWN LANDS DIVISION
46
Weed, pest and bushfire managementAs part of sustainable management of Crown land, the Crown Lands division provided funds for weed and pest control programs on Crown land. A total of $857 000 was allocated for such programs in 2010 -11. Of this total, $585 000 was allocated for weed control and $152 000 for pest control. A further $120 000 was allocated for minor weed and pest/feral programs as part of a good neighbour approach to land management.
Crown Lands also has a statutory responsibility under the Rural Fires Act 1997 for bushfire protection on land under its control. The division is responsible for organising mechanical hazard and fire trail works in Crown land.
Crown Lands is represented on the Bushfire Coordinating Committee, its standing committee and on most local bushfire management committees. The division also works with a number of committees to develop new bushfire risk management plans.
During 2010 -11 there were no major bush fires on Crown land. However, heavy rains across the State resulted in damage to many fire trails and reduced the opportunity for hazard reduction burns. Just under $4 million was spent on hazard reduction and fire trail works on Crown lands this year.
Crown roads disposalIn 2004, major legislative reform created a simple, less expensive process to close Crown roads which are now deemed unnecessary for public access.
This year, the Crown roads program closed and disposed of $11.5 million worth of Crown roads.
Telecommunications licensingCrown Lands is responsible for the implementation of Independent Pricing and Regulatory Tribunal (IPART) recommendations made in relation to the licensing of communications infrastructure on Crown land. The licensing service includes new builds, as well as consolidating the licensing of all existing communications equipment on Crown land. Implementation of the recommendations is planned for completion by December 2011.
Crown Reserve Reporting System (CRRS)In 2009 the CRRS was introduced to assist Reserve Trust Managers to meet their reporting requirements under the Crown Lands Act. In the 2009 -10 reporting period, 84.5 per cent of Reserve Trust Managers reported. There are 4855 trusts in this reporting system, managed by 1102 Managers.
Crown Land Conversion ProjectCrown Lands undertook a number of projects to upgrade the quality, reliability, availability and strategic value of Crown land information. The $11 million Crown Land Conversion Project is one such project. It was successfully completed in June 2011, creating titles for Crown land in NSW. The improved integrity of the division’s spatial and textual data will provide the foundation to streamline and improve performance into the future.
Perpetual lease conversionsIn recognition of the very limited equity still held by the Crown in perpetual leases, reforms were introduced in 2004 to simplify their administration and to encourage holders of these leases to purchase the remaining equity. This offer applies only to perpetual leases which are not subject to redetermination of rent and where the rent is based on the statutory minimum (generally $100 plus consumer price index) increases from 1 May 1990.The benefit to landowners is that they will be able to convert to freehold at a lower-than-market price. The aim of the reform process is to place ownership of the land into the hands of those who already control it.
As at 30 June 2011, applications received totalled 98 per cent of all eligible leases, with 84 per cent converted to freehold. The area of converted leases is 2.12 million ha, of which 882 000 hectares is protected by land management covenants. The value of these converted leases to the State totals $32.5 million.
Renovating essential infrastructureCrown Lands is responsible for a $6.1 billion State-wide portfolio of assets, including maritime infrastructure (e.g. coastal harbours, lighthouses, break walls), social and community infrastructure (e.g. heritage buildings, assets, showgrounds, recreational facilities) and natural infrastructure (e.g. beaches, rivers and coastal foreshores). The division has invested in this infrastructure over the last financial year to ensure its continued availability for community use.
Public Reserves Management Fund (PRMF)$7.8 million was spent on improving Crown reserves this year through the PRMF. This included $94 000 for operations and facilities at Wee Jasper Reserve, south-west of Yass; $265 000 to reinstate safe public access to the Newcastle Bogey Hole; and over $700 000 on Showgrounds for country NSW.
Coastal assetsCrown Lands provides and maintains infrastructure as well as safe, secure port access to 25 coastal harbours along the NSW coast, including Nelson Bay, Wollongong, Coffs Harbour, Batemans Bay and Tweed Heads. It also maintains 21 breakwaters, playing a pivotal role in the safe navigation of marine vessels, including commercial fishing fleets, recreational boats and marine rescue operations.
In addition to providing safe navigation, coastal harbours and breakwaters provide an extremely popular recreational activity for the community, often the focus of tourism, walking and fishing for local towns. Crown Lands worked with local governments along the eastern seaboard to establish shared access ways, including pedestrian and cycle paths, providing linkages between town centres and the ocean. These types of activities promote increased tourism and help underpin economic growth in regional areas.
CROWN LANDS DIVISION NSW TRADE & INVESTMENT ANNUAL REPORT 2010 -11
47
Highlights for 2010 -11 include:
• Maintaining historical Wollongong Harbour, the oldest of the 25 coastal harbours managed by Crown Lands. Ship repairs are first recorded as occurring there in 1829. Convicts built early harbour structures and much of their work remains to this day, providing a focal point for tourism in the region.
In 2010 -11, with an awareness of the historical significance of the area and the great importance placed on the site by the local community, Crown Lands finalised a conservation management strategy for the harbour in partnership with expert heritage architect Jean Rice. This extensive study of the historic development of the harbour is now used to inform all future development and maintenance activities. The document supports decisions about where Crown Lands best spends maintenance dollars as well as guiding decisions about structure, form, materials type and colour.
This financial year, the strategy assisted in decisions about structural retaining wall repairs, maintenance of the historic Breakwater Lighthouse (1871) and in the design of new timber baulk seating. Complementing this significant maintenance program, improvements to electrical services were also undertaken, with new switchboards and metering at a total cost of $49 000. These improvements help service the local fleet of 33 vessels, including six commercial fishing boats and a mix of charter boats and recreational craft that are integral to the local economy.
• Restoration of Lake Illawarra. Crown Lands provides staffing and support services to the Lake Illawarra Authority, which was established by the NSW Government to restore the ecological and tourism values of a lake heavily degraded by the pressures of urban development.
In 2010 -11 some $3 million was spent on an extensive program of site rehabilitation projects. Works included the dredging of urban sedimentation from Koonawarra Bay and Berkeley harbour, the construction of extensive foreshore shareways around the lake perimeter, the rehabilitation of various foreshore parklands, and the construction of major stormwater control devices at Hooka and Oakey creeks.
With the support of Crown Lands the Authority now manages extensive parklands and the lake has once again become an important regional tourist attraction.
Significantly, in November 2010 the Authority was acknowledged at the National River Symposium in Perth as one of the top four most-successful waterway rehabilitation projects in Australia.
• This financial year, Crown Lands allocated some $750 000 towards repairs to breakwaters due to ocean storm damage on the north and south coasts, including Tweed Heads, Kingscliff, Brunswick Heads, Evans Head, Iluka, Wooli, South West Rocks, Laurieton, Batemans Bay, Moruya, Narooma and Bermagui.
Implementation of a robust governance regimeAs part of a major reform agenda to improve its service delivery, Crown Lands implemented a new governance framework, including the implementation of a new Divisional Board and reporting system designed to optimise the future direction and reporting of Crown Lands to meet best practice standards.
Sustainable burial practicesThe Crown Lands Cemetery Policy Group was established in 2008 to work with cemetery management, other government agencies and the public to implement sustainable cemetery management policies.
The Rookwood Necropolis Repeal Bill 2009, passed in Parliament, brings all aspects of Rookwood under the provisions of the Crown Lands Act 1989. The newly established Rookwood Necropolis Trust will focus on managing Rookwood as one integrated dedicated reserve and undertake a new plan of management in conjunction with the existing denominational trusts.
Reserve trustsThe Crown Reserve System is the oldest and most diverse system of land management in NSW. It promotes the cooperative care, control, and management of Crown reserves by the community, with assistance from Crown Lands division, other government agencies and reserve users.
Crown land has been reserved for public purposes in NSW since colonial times. Crown reserves are land set aside on behalf of the community for a wide range of public purposes, including environmental and heritage protection, recreation and sport, open space, community halls and special events.
This year, 407 volunteers from the community were appointed to reserve trusts throughout NSW, providing critical local knowledge and expertise in the management of these important local assets and bringing the total over 3000 trust members.
Future directionsSome of the major projects over the coming year are listed below.
• The redevelopment of the Port Macquarie foreshore, combining freehold land (held by Woolworths) with Crown lands into an integrated development, will provide an opportunity to revitalise this iconic part of the Port Macquarie CBD. An opportunity exists to integrate a renewed retail experience with the current city centre, whilst at the same time providing rehabilitation and improvement of the public space along the riverfront.
Sensitive development of the space will require planning and comprehensive consultation with stakeholders. In 2011-12, this will mean detailed planning and consideration by the Port Macquarie Hastings Council to ensure community involvement prior to any approval.
NSW TRADE & INVESTMENT ANNUAL REPORT 2010 -11 CROWN LANDS DIVISION
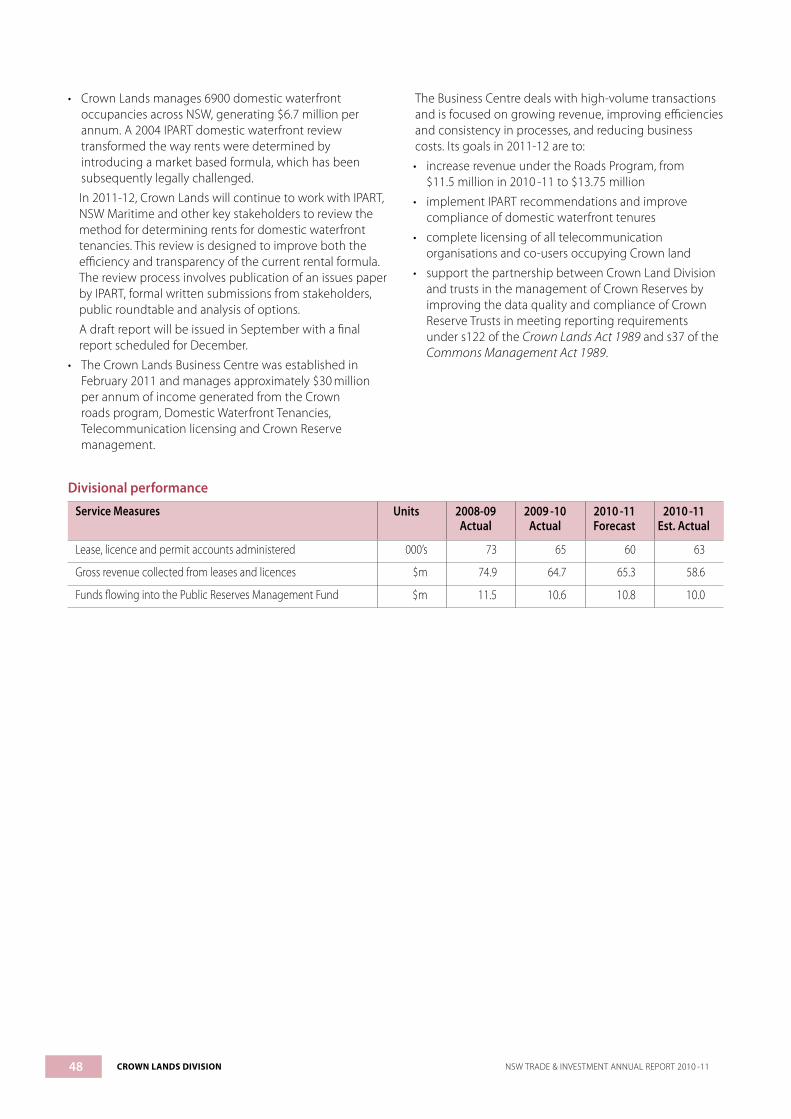
48
• Crown Lands manages 6900 domestic waterfront occupancies across NSW, generating $6.7 million per annum. A 2004 IPART domestic waterfront review transformed the way rents were determined by introducing a market based formula, which has been subsequently legally challenged.
In 2011-12, Crown Lands will continue to work with IPART, NSW Maritime and other key stakeholders to review the method for determining rents for domestic waterfront tenancies. This review is designed to improve both the efficiency and transparency of the current rental formula. The review process involves publication of an issues paper by IPART, formal written submissions from stakeholders, public roundtable and analysis of options.
A draft report will be issued in September with a final report scheduled for December.
• The Crown Lands Business Centre was established in February 2011 and manages approximately $30 million per annum of income generated from the Crown roads program, Domestic Waterfront Tenancies, Telecommunication licensing and Crown Reserve management.
The Business Centre deals with high-volume transactions and is focused on growing revenue, improving efficiencies and consistency in processes, and reducing business costs. Its goals in 2011-12 are to:
• increase revenue under the Roads Program, from $11.5 million in 2010 -11 to $13.75 million
• implement IPART recommendations and improve compliance of domestic waterfront tenures
• complete licensing of all telecommunication organisations and co-users occupying Crown land
• support the partnership between Crown Land Division and trusts in the management of Crown Reserves by improving the data quality and compliance of Crown Reserve Trusts in meeting reporting requirements under s122 of the Crown Lands Act 1989 and s37 of the Commons Management Act 1989.
Divisional performance
Service Measures Units 2008-09Actual
2009 -10Actual
2010 - 11Forecast
2010 -11Est. Actual
Lease, licence and permit accounts administered 000’s 73 65 60 63
Gross revenue collected from leases and licences $m 74.9 64.7 65.3 58.6
Funds flowing into the Public Reserves Management Fund $m 11.5 10.6 10.8 10.0
CROWN LANDS DIVISION NSW TRADE & INVESTMENT ANNUAL REPORT 2010 -11
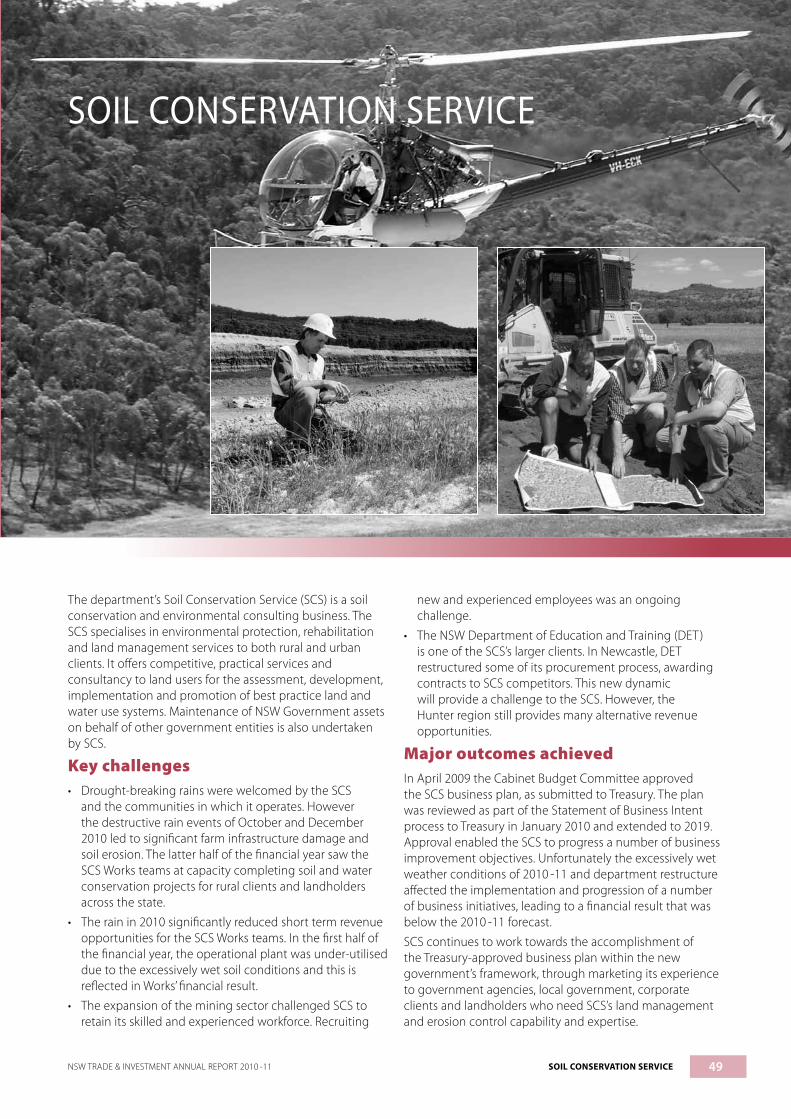
49
SOIL CONSERVATION SERVICE
The department’s Soil Conservation Service (SCS) is a soil conservation and environmental consulting business. The SCS specialises in environmental protection, rehabilitation and land management services to both rural and urban clients. It offers competitive, practical services and consultancy to land users for the assessment, development, implementation and promotion of best practice land and water use systems. Maintenance of NSW Government assets on behalf of other government entities is also undertaken by SCS.
Key challenges • Drought-breaking rains were welcomed by the SCS
and the communities in which it operates. However the destructive rain events of October and December 2010 led to significant farm infrastructure damage and soil erosion. The latter half of the financial year saw the SCS Works teams at capacity completing soil and water conservation projects for rural clients and landholders across the state.
• The rain in 2010 significantly reduced short term revenue opportunities for the SCS Works teams. In the first half of the financial year, the operational plant was under-utilised due to the excessively wet soil conditions and this is reflected in Works’ financial result.
• The expansion of the mining sector challenged SCS to retain its skilled and experienced workforce. Recruiting
new and experienced employees was an ongoing challenge.
• The NSW Department of Education and Training (DET) is one of the SCS’s larger clients. In Newcastle, DET restructured some of its procurement process, awarding contracts to SCS competitors. This new dynamic will provide a challenge to the SCS. However, the Hunter region still provides many alternative revenue opportunities.
Major outcomes achievedIn April 2009 the Cabinet Budget Committee approved the SCS business plan, as submitted to Treasury. The plan was reviewed as part of the Statement of Business Intent process to Treasury in January 2010 and extended to 2019. Approval enabled the SCS to progress a number of business improvement objectives. Unfortunately the excessively wet weather conditions of 2010 -11 and department restructure affected the implementation and progression of a number of business initiatives, leading to a financial result that was below the 2010 -11 forecast.
SCS continues to work towards the accomplishment of the Treasury-approved business plan within the new government’s framework, through marketing its experience to government agencies, local government, corporate clients and landholders who need SCS’s land management and erosion control capability and expertise.
NSW TRADE & INVESTMENT ANNUAL REPORT 2010 -11 SOIL CONSERVATION SERVICE
50 SOIL CONSERVATION SERVICE NSW TRADE & INVESTMENT ANNUAL REPORT 2010 -11
The implementation of SCS’s externally accredited integrated management system for safety, environment and quality and its internal cost control continue to support its financial result.
SCS was awarded significant contracts from councils, private enterprise, and state government agencies and statutory authorities. Many of these were won in a competitive open tender environment.
Soil Consulting (Consult)Consultancy and contracting services are offered on a fully commercial basis in a broad range of areas associated with environmental protection, rehabilitation and education. Many of the consultancies undertaken involve the Works teams and enable SCS to offer clients a complete package, from planning, design and layout through to final construction and implementation. The work is founded on a thorough understanding of what is practical and cost-effective and at all times is concerned with the protection of the environment. These practical skills and knowledge have also been packaged to provide widely recognised training programs to the construction industry.
Total Consult income (billings, plus accrued, less prepaid income) for the year was $17.8 million –11.8 per cent below the budgeted income of $20.6 million. This is due to wet conditions delaying project finalisation and project commencement, as well as the record level of unearned revenue.
Consult acceptances totalled $23.2 million, up 10.4 per cent on the previous year’s sales of $21 million. This is an outstanding result. SCS successfully bid for a number of preferred contractor and project tenders, including work for Country Energy, Resources & Energy, Sutherland Shire Council, NSW National Parks & Wildlife Service, Transgrid, Sydney Catchment Authority, Murray Catchment Management Authority, Integral Energy, RTA, Newcastle City Council, Xstrata. DET in Sydney and Newcastle areas contributed significantly to this strong consult result. New staff positions were filled in Parramatta and Windsor, and recruitment action is current in a further two positions in the Hunter region. Continued strong growth in Consult is an important component of the division’s business plan for 2008 -19.
Services offered and realised in 2010 -11 included:
• project management, land rehabilitation and revegetation of degraded areas
• resource planning and assessment
• environmental assessment and environmental auditing
• soil and water testing and analysis
• erosion control design and works
• erosion and sediment control on infrastructure developments
• design and construction of soil and water conservation works
• flood detention basins, drainage works and artificial wetlands
• training in erosion and sediment control
• access track construction and rehabilitation techniques
• coastal dune stabilisation and beach reclamation.
SCS Consult will continue to build on its financial achievements by further targeting of clients’ needs for environmental projects.
SCS met the increased demand for bush fire mitigation work in the Sydney area with a significant investment in plant and a new team based at Windsor. The team comprises additional new employees with managerial, operational and environmental expertise.
Conservation Earthworks (Works)Through its plant hire scheme, SCS Works offers a cost competitive earthmoving service to design and implement soil and water conservation earthworks, setting the industry standard for quality. Works maintains 32 operational bulldozers and two excavators.
Largely utilised by private landholders in the agricultural sector, Works income (billings, plus accrued, less prepaid income), at $4.6 million, was a 14 per cent decrease on last year’s income and failed to meet the budgeted income of $5.9 million. This was a disappointing result, due to the excessively wet conditions experienced in the first half of the financial year. The conditions made the SCS Works bulldozers inoperable.
Operational costs came in slightly below forecast by one per cent. Chargeable hours (at 649 hours per unit) dropped on 2009 -10 (766 hours) and was well below the annual target of 1300 hours. Billings from private landholders was $2.219 million, as shown in Table 2.
Approximately 7207 hectares of land were treated with conservation earthworks, including broadacre banks/waterways, dams and sediment detention structures. No new equipment was added to the fleet during the year. The breaking of the drought, the 2010 -11 flood, and erosion damage – as well as the now increased soil moisture levels – all created an increase in demand for Works’ services.
SCS Works carried out the following during the year:
• Construction of extensive soil conservation broadacre banking and waterway systems used to contain and divert runoff to stable disposal areas. These works complement conservation farming practices, such as reduced and no-tillage, to provide effective control of sheet, rill and gully erosion to achieve stable and productive landscapes. In 2011 some of the areas of major activity included the Gwydir, Southern Tablelands and Burrinjuck areas.
• Conservation earthworks, including dams, catch banks, waterways, contour banks and integrated watershed soil and water conservation schemes. These earthworks harvest and store water for domestic and agricultural use. Following the destructive rains of October and December 2010, SCS Works was particularly active in the Riverina and Central West of NSW.

51NSW TRADE & INVESTMENT ANNUAL REPORT 2010 -11 SOIL CONSERVATION SERVICE
• Design and construction of grade-reducing structures, gully head control, and shaping and filling to stabilise actively eroding flow lines. Projects have included works in the Central West, Monaro, Southern Highlands and Riverina.
SCS Works had strong demand for its services from rural landholders eligible for the Rural Assistance Disaster Funding. SCS has made a significant contribution to repairing farm dams damaged by the October and December 2010 floods; many of these damaged farm dams were not designed and built to SCS’s best practice for farm dam construction. SCS continues to promote best practice for farm dam construction as dams are a significant investment for rural landholders.
Field days at Mudgee, Orange and Agquip (Gunnedah) were attended to promote SCS services and local operations. New SCS fact sheets were prepared on a range of topics promoting the SCS and its positioning statement, ‘Experienced people protecting your resources‘.
OperationsHunter Valley flood mitigation works and the Great North Walk programs, to the value of $3.8 million, which includes $1.173 million of unearned revenue were programmed during the year. These services relate to maintenance of NSW Government assets on behalf of other government entities on a full-cost-recovery basis.
Operations team surveying SCS’s erosion control works at Maitland, Hunter Valley NSW.
Riverworks achievements included the continued maintenance of assets constructed for flood mitigation and prevention under the Hunter Valley Flood Mitigation Act 1956. Under memorandums of understanding, SCS is offered the work in this program as well as that involved in the construction of new flood mitigation works funded from the Natural Disasters Relief Fund, for repairs to assets damaged by flooding. These assets proved highly effective in the June 2011 rain events. Riverworks teams successfully sourced additional projects to ensure full operational costs were met and were successful. In April 2011, they were awarded a $700 000 contract for erosion-control works on the Hunter River at Maitland for the Office of Environment and Heritage.
The Great North Walk was established in 1988, Australia’s bicentennial year, as a 250-kilometre walking track between Sydney and Newcastle. The route includes Sydney Harbour, Lake Macquarie and the Newcastle coastline. The walk is managed by SCS with cooperation and assistance of Forests NSW, Office of Environment and Heritage and 14 local councils. On-ground maintenance works are undertaken by SCS divisional staff.
Future directions In 2011-12 the SCS will focus on the following:
• Continue its lead role in the implementation of the NSW Soil Policy with actions and strategy.
• Protect and conserve the soil and water resources of NSW. SCS will continue to support NSW rural communities with its conservation earthworks service. Demand for these services has increased with the end of the drought. SCS plans to continue its investment in operational plant and people to provide a best practice and cost-effective conservation earthmoving service.
• Through the business planning process, SCS will demonstrate to Treasury the viability and need of an ongoing plant replacement program. Decreased operational costs and increased revenues will improve financial viability and demonstrate SCS’s commitment to its stated business plan financial targets.
• Provide a specialist consulting service in environmental protection, resource planning and assessment, environmental engineering and training in soil and water conservation.
• Set the industry standard for conservation earthworks design and construction and contribute to the objective of managing the State’s natural resources in a sustainable manner.
• SCS has approval to recruit more environmental consultants. This will contribute to achieving its business targets by meeting new demand for SCS’s experience and capability.
• SCS’s direction is to increase its revenue from the existing client base and to actively seek new clients who require its skills and expertise. These will include government agencies, local government, infrastructure providers, landholders and natural resource organisations.
• Develop strong working relationships with Catchment Management Authorities to assist in their catchment plans, particularly in the area of degraded land management and rehabilitation.
• Work closely with Crown Lands in the program areas of fire-trail maintenance and bushfire hazard reduction.

52
Performance highlight
Table 1: Percentage of customers by group
Customer Group
Works - % of customers Consult - % of customers Operations - % of customers Total
2007-08 2008-09 2009-10 2010 -11 2007-08 2008-09 2009-10 2010 -11 2007-08 2008-09 2009-10 2010 -11 2010 -11
Corporate 15.20 20.20 8.81 14.23 20.60 22.04 22.09 31.98 4.20 0.00 0.00 0.79 25.13
Landholders 56.60 51.84 50.77 48.36 1.10 1.45 0.34 0.34 10.90 1.34 1.08 0.92 8.37
Local Government
3.80 2.22 5.35 5.15 5.10 13.32 6.97 10.18 5.40 0.01 0.00 0.00 8.07
State Government
23.20 22.84 26.63 30.90 72.6 61.53 69.11 55.30 79.40 98.62 98.86 98.25 56.63
Other 1.20 2.90 8.44 1.36 0.70 1.67 1.49 2.21 0.10 0.03 0.06 0.03 1.79
Total 100 100 100 100 100 100 100 100 100 100 100 100 100
Table 2: Billings by customer group
Customer Group
Works – sales $000 Consult - sales $000 Operations - sales $000 Total
2007-08 2008-09 2009-10 2010 -11 2007-08 2008-09 2009-10 2010 -11 2007-08 2008-09 2009-10 2010 -11 2010 -11
Corporate 1 147 1 282 493 653 3 389 2 858 4 497 6 280 170 0 0 27 6 961
Landholders 4 270 3 290 2 842 2 219 178 187 69 67 447 53 33 32 2 317
Local Government
285 140 299 236 833 1 727 1 419 1 999 221 0 0 0 2 235
State Government
1 751 1 499 1 490 1 418 11 962 7 979 14 066 10 859 3 248 3 894 2 978 3 407 15 684
Other 89 184 473 62 113 217 302 434 3 1 1 1 497
Total 7 542 6 345 5 597 4 588 16 475 12 968 20 353 19 639 4 089 3 948 3 012 3 467 27 694
SOIL CONSERVATION SERVICE NSW TRADE & INVESTMENT ANNUAL REPORT 2010 -11

53
INDUSTRY, INNOVATION & INVESTMENT DIVISION
Nature and scope of activitiesThe department’s Industry, Innovation and Investment division supports businesses and industries to increase productivity, employment and investment growth in NSW.
The division competes nationally and internationally to win business and research and development (R&D) investment for NSW, bringing new technologies and skills to the State. It also facilitates the relocation, consolidation and expansion of major and strategic businesses and R&D facilities within NSW.
The division also encourages proponents to locate projects in regional areas through a mix of financial assistance programs and services directed to regional businesses and communities.
The division has a strong focus on nurturing the competitiveness and growth of the 650 000 small businesses that operate in NSW, through small business-specific programs, workshops and the Smallbiz website.
The division comprises four branches:
– Investment Attraction
– Small Business and Regional Development
– International Markets and Trade
– Innovation, Science and Industry Analysis
Key challenges2010 -11 saw fluctuating business and consumer confidence and strong Australian dollar. The department provided strong support for the NSW industry, helping to bring investment and jobs to NSW. The department attracted over 15 000 jobs to NSW and $2.6 billion in investment across NSW, including major information and communications technology (ICT) projects and significant financial and insurance projects.
Innovation and productivity initiatives were given strong priority and the division continued to address the impediments to the growth of key industry sectors including helping secure a prestigious international research partnership between National Information and Communication Technologies Australia (NICTA) and Germany’s Fraunhofer Institute for Experimental Software Engineering.
The department also began implementing the new government’s reform agenda with the passing of the Destination NSW Act 2011 and the establishment of the Visitor Economic Taskforce to enhance Sydney and NSW as a major tourist and event destination. During the reporting period, work also commenced on the establishment of the NSW Export and Investment Board, the Multicultural Business Advisory Panel and the Office of the Small Business Commissioner. Implementation of the reform agenda will continue during the upcoming year.
NSW TRADE & INVESTMENT ANNUAL REPORT 2010 -11 INDUSTRY, INNOVATION & INVESTMENT DIVISION

54 INDUSTRY, INNOVATION & INVESTMENT DIVISION NSW TRADE & INVESTMENT ANNUAL REPORT 2010 -11
Major outcomes achieved
Increased jobs and investment across NSWThe department attracts major investment projects using financial and non financial support. In 2010 -11, 56 per cent of the major investment projects that were attracted to NSW occurred through departmental facilitation related to site selection, regulatory advice, provision of links to suppliers or service providers and access to State or Commonwealth programs.
In 2010 -11, 30 per cent of projects attracted to NSW came from companies with no existing NSW presence.
Information and communications technologyThe department attracted a number of major ICT projects to NSW. These include:
• a $200 million investment by Global Switch for a six-storey data storage centre in Ultimo, which will create around 400 construction jobs and 50 full-time equivalent (FTE) jobs
• a new Global Service Centre for information technology company Dimension Data, which will create 300 digital economy jobs in North Ryde
• China Telecommunications Corporation, a state-owned corporation with Beijing headquarters, chose Sydney to establish its Australian presence and its expansion into Oceania
• MphasiS, a subsidiary of Hewlett-Packard and India’s sixth largest ICT company, is establishing a centre of excellence in Wollongong, investing $1.5 million and creating 256 highly skilled jobs over five years.
Future Logistics Living Lab
Over 100 representatives of research and industry attended the February launch of the Future Logistics Living Lab. This is the first major project of the Fraunhofer Project Group (in collaboration with the company Systems, Applications and Products, or SAP) in data processing. Other industry partners include Linfox, Casella Wines, Hamburg Sud, Tradegate and Google.
Creative industriesThe department helped attract a number of film projects to NSW:
• The Great Gatsby is the first live-action 3D film to be shot in NSW. The film will create over 825 jobs and inject $120 million into the NSW economy.
• Tomorrow, When the War Began 2 is based on the second in the popular series by John Marsden. The film will support 450 jobs and inject $40 million into the NSW economy.
• Walking with Dinosaurs 3D, the $65 million 3D feature film based on the BBC series Walking with Dinosaurs, will support 140 jobs, with some location filming in NSW.
• Harry Potter and the Deathly Hallows, Part 2 (Harry Potter 7). Animal Logic undertook 3D conversion work for the film, employing up to 75 people.
Sydney’s successful bid to become a UNESCO City of Film
under the UNESCO Creative Cities Network was announced in November 2010. This will build on Sydney’s reputation as a world-class centre for film production, promotion and exhibition. Development of the bid was supported jointly by the department and the City of Sydney.
The department assisted Broken Hill City Council to refurbish Broken Hill’s Central Power Station into a state-of-the-art, multi-use film studio with a view to attracting film production to the region.
More than 60 microbusinesses in the creative industries in regional NSW showcased their work to metropolitan and regional buyers and industry representatives in a series of events designed to provide access to key industry players.
EducationThe department assisted SP Jain Centre of Management, a leading Indian provider of business management programs, to set up a business-focused higher education institution in Western Sydney. When completed, this will represent an investment of $45 million and create up to 50 full-time jobs, 100 part-time jobs and about 200 construction jobs.
Finance and insuranceThe department helped attract major investment projects in the financial services sector to NSW:
• Virgin Money Australia expanded its operations in NSW, creating 150 new jobs in Sydney and Wollongong.
• China Construction Bank, one of China’s ‘big four‘ banks, gained Australian regulatory approval to establish a branch in Sydney. The branch will have 30 full-time employees with an investment of $70 million.
• Carbon Trade Exchange, the world’s first online platform for businesses to trade carbon credits, moved its headquarters from London to Sydney. This will create 85 jobs.
• Ventura Carbon, provider of corporate advisory services for clean technology projects, moved to Sydney, creating 21 jobs.
In July the department developed the Shanghai–Sydney Financial Services Memorandum of Understanding (MoU). The MoU is between Sydney and the Shanghai Municipal Government providing a platform for the two groups to work together to become major international financial service centres.
ManufacturingThe department attracted a number of projects to NSW:
• Midal Cables will establish a $30 million aluminium products manufacturing facility adjacent to the Tomago aluminium smelter in the Hunter Valley. This new operation will replace current imports of aluminium cable and rods and is expected to create 290 direct jobs.
• ETP Electron Multipliers makes components for mass spectrometers. With department support, the company will relocate and expand its manufacturing facilities in NSW, securing 131 jobs in Western Sydney (60 existing and 71 new).
• Nepean Conveyor Group will consolidate its mining

55NSW TRADE & INVESTMENT ANNUAL REPORT 2010 -11 INDUSTRY, INNOVATION & INVESTMENT DIVISION
conveyor businesses into a new state-of-the-art manufacturing facility in Western Sydney, investing $16 million to secure over 100 jobs.
• A $500 million upgrade to the Botany Paper Mill by Amcor Packaging (Australia) Pty Ltd against strong overseas competition. The upgraded mill will support 138 direct jobs and up to 800 jobs during the construction and commissioning phase.
• Heibei Jikai International Trading Co Ltd (Jikai) is engaging in production and development of coalmine equipment. Jikai is committed to retaining 175 existing jobs and investing in $4.2 million and 100 full-time jobs over the next five years.
The department also worked with administrators to help save jobs in companies at risk of closing, including Broens Industries’ acquisition of Intercast and Forge’s manufacturing operation at Seven Hills. This helped secure 150 local jobs, retained the local supply chain and positioned the company to create new jobs in the future.
RetailThe department helped to expedite a number of major projects in metropolitan and regional NSW including:
• Bunnings Pty Ltd warehouses to create 977 new jobs and $219 million in investment
• Woolworths Ltd new operations to create 1032 new jobs and resulting in $103 million in investment
• Woolworths’ rollout of their new hardware offering, Masters, in 10 locations, with plans to establish 150 new stores across NSW in coming months.
Defence and aerospaceThe department secured a range of investment projects in this sector including:
• Quickstep Technologies Limited, which will locate its new $15 million advanced composites manufacturing facility at Bankstown Airport in Western Sydney. The company signed a $700 million MoU with global defence primes Lockheed Martin, Northrop Grumman Systems and BAE Systems and will employ up to 400 people at its new facilities.
• AgustaWestland and BAE Systems will locate a new $40 million helicopter transmission-testing facility in Nowra. The world-class test facility will support the Australian Defence Force’s helicopter fleets, with capacity to attract work from outside Australia.
• BAE Systems secured the Interim Basic Flying Training Services contract for the Department of Defence, delivering flight screening and basic training at Tamworth through to at least 2017. The training school supports 135 full-time jobs in Tamworth, trains about 425 students a year, and injects around $9 million a year directly into the local economy.
• Virgin Blue will establish a new aircraft maintenance facility at Sydney Airport with assistance from the department. The project is expected to create up to
320 jobs and generate $40 million in new investment.
Food and agricultureThe department helped to secure the following major food processing investment projects:
• Viterra will establish a $110 million malthouse and container packing facility at Minto in Western Sydney, which will create at least 40 jobs.
• Beak and Johnston will establish a new $15 million food processing facility at Greenacre in Western Sydney, which will create 400 jobs.
ConstructionThe department helped to secure a $36 million consolidation by electrical manufacturer HPM Legrand for Western Sydney. The project supports 328 jobs. The company is establishing a 23 000 m2 purpose-built facility at Prestons to consolidate its manufacturing, R&D, supply chain, warehousing, and head office functions.
Tourism and recreationThe department supported a number of tourism-related developments, including:
• a $40 million redevelopment of the historic Hydro Majestic Hotel in the Blue Mountains that will create 50 construction jobs and 125 FTE jobs over the next five years
• construction of the Blue Mountains Cultural Centre, part of a $20 million commitment by the NSW Government to revitalise the Katoomba – Echo Point area. The development will create 350 new FTE jobs over the next five years and around 1000 construction jobs in Katoomba.
The department played a key role in securing a decision by the Australian Football League (AFL) to grant a licence to a new Sydney club to compete in the AFL national competition from 2012. The AFL committed to creating 90 new FTE jobs in Western Sydney and investing more than $200 million into the new Greater Western Sydney Giants team. The AFL’s decision is a direct result of a $45 million contribution to upgrade the Sydney Showground Main Arena at Sydney Olympic Park, which was facilitated by the department.
Transport, logistics and storageThe department helped to secure the following investment projects:
• Macarthur Intermodal Shipping Terminal (MIST) announced a 1600-metre rail spur line extension at its Minto site. The expansion will deliver $6.5 million in new investment and will create 40 new full-time positions. MIST forecasts the project will also create 70 construction jobs.
• Goodman Group will develop an 82 000 m2 warehouse and office facility to be developed for Metcash Ltd at Bungarribee Industrial Estate in Western Sydney. Commencing in 2011, it is anticipated that 600 employees

56
will work at the new facility on completion.
In May 2011, the department sponsored the Award for Excellence in Supply Chain Innovation in NSW at the SMART Conference & Expo 2011, Australia’s leading supply chain event. Westfield and the Bestrane Group won the award for their successful implementation of a computerised delivery dock management system, which has helped ease congestion in the CBD. The department also hosted a SMART Conference Research Forum to help promote innovation in transport and logistics; the forum attracted over 500 delegates.
The Southern Hemisphere Chartered Institute of Logistics & Transport’s International Convention (CILT) was co-hosted by the department and the Australian branch of CILT in May 2011. Eighty-six delegates from 17 countries took part in the convention, which contributed to raising the standards of logistics and transport practitioners in Australia and overseas.
Renewable energyThe department assisted Goldwind Science & Technology, one of the world’s largest wind turbine manufacturers, to set up an Australian subsidiary and establish its head office in Sydney.
The department continued to leverage business opportunities in a low carbon economy through its sponsorship of the Eco Investor Annual Forum in Sydney. The forum brought together Australia’s leading environmental companies, investors, advisers and entrepreneurs to focus on opportunities in the environmental investment sector.
At the Australian Institute of Energy, the department hosted a half-day symposium to examine the role of natural gas in meeting the State’s future energy requirements.
Resources and miningThe department convened and hosted two of its regular ‘Miners Meet Investors’ events. These events are a joint initiative of the Industry, Innovation & Investment division and the Resources & Energy division and they enable NSW mineral explorers with investment-ready projects to present and discuss their projects with investors and investment facilitators. Thirteen explorers presented their projects to a select group.
In April 2011 the department hosted India’s International Coal Venture Limited’s visit to NSW. The department arranged meetings with the Minister of Resources and Energy, as well as nine business meetings.
The department helped secure investment from Shandong Jinshunda Group Co. Ltd (Jinshunda). Jinshunda is a company based in China whose business interests are in iron ore, coal and other non-ferrous metal mining, biotech, real estate, thermal power generation and restaurants. Jinshunda, through its wholly owned Australian subsidiary Sunstar Capital Pty Ltd, is expected to create 15 new full-time jobs and 10 part-time jobs over the next five years.
InfrastructureThe department hosted 16 major infrastructure firms from Spain that were conducting an investment mission to Sydney. The department coordinated a whole-of-government briefing for the investors. Business opportunities were showcased in the road, rail, water and energy sectors.
Business migration servicesThe department sponsored 243 potential business migrants for provisional visas. It is anticipated that these business migrants will invest more than $67 million and create more than 820 jobs during their first five years in NSW.
The department sponsored 85 business migrants (formerly on provisional visas) for permanent residence in NSW. In their first two years these business migrants have invested over $5 million and created more than 110 new jobs.
Regional business investmentThe department’s regional business investment programs help secure new investment in NSW by assisting businesses to establish and/or relocate to regional NSW. In all of its programs, the department seeks to harness genuine business opportunities and develop solutions to overcome investment impediments with an emphasis on non-financial solutions.
During the year, the department provided help with site identification and selection, negotiations with infrastructure and finance providers, and liaison with training providers and relevant government agencies.
The business investment programs include the Regional Business Development Scheme and the Illawarra Advantage Fund.
Competitive and productive industries
NSW Innovation CouncilThe Innovation Council advises the Government on policies and strategies that can help create an environment in which it is easier for businesses to innovate, increasing investment opportunities and productivity and competitiveness and building stronger rural and regional economies. The department provides the Secretariat to the NSW Innovation Council. Major outcomes achieved during 2010 -11 included:
• The NSW Economy in 2020: A Foresighting Study, overseen by the Council and prepared by Access Economics. The study provides analysis of the NSW economy to 2020. The study informs the development of strategies for industry development, planning and other strategic documents. The study informed the development of the NSW Business Sector Growth Plan, which outlines initiatives across NSW Government agencies to support the long-term growth of the NSW economy, and to achieve specific objectives across key industry sectors.
• Commencement of the development of Industry Action Plans (IAPs) in partnership with industry. Building on the work of the 2020 Foresighting Study, the IAPs will set out mechanisms to position NSW industry for strong
INDUSTRY, INNOVATION & INVESTMENT DIVISION NSW TRADE & INVESTMENT ANNUAL REPORT 2010 -11

57
growth, improved innovation and productivity, global competitiveness and new investment opportunities over the next decade. Four industry sectors have been identified for IAP development. These are professional services, manufacturing, the digital economy and international education.
• Business Opportunities in a Low Carbon Economy, a supply chain analysis that identifies specific growth opportunities and barriers in select sectors for NSW businesses during the transition to a low carbon economy.
The Innovation Council was also involved in reviewing proposals for the development of:
• the Australian Centre for Broadband Innovation, a joint initiative between the NSW Government and research organisations, to work with industry to create breakthrough broadband applications
• the NSW Government’s Collaborative Solutions Program to help business consortiums develop ICT-enabled solutions for various sectors of the growing digital economy
• Digital Sydney, a business initiative supported by the NSW Government, which encourages collaborations between the ICT and digital sectors, expanding the digital marketplace, and promoting the investment and uptake of emerging digital technology.
Digital Economy StrategyIn 2010 the department established the Digital Economy Strategy, to drive growth in the NSW ICT and creative industries and to reinforce Sydney’s status as the ICT capital of Australia. Initiatives under the Strategy include the following:
• The provision of $7.5 million funding for the establishment of the Australian Centre for Broadband Innovation at Marsfield, a research collaboration between NICTA, CSIRO and industry partners to develop new broadband applications focused on exploiting the potential of high-speed broadband.
• A $2 million Collaborative Solutions Program, which awards incentive grants for the development and piloting of innovative and compelling ICT-enabled solutions in key sectors that demonstrate the benefits of the digital economy. Thirty-two applications were received and 11 submissions were selected for funding. These projects have the potential to collectively generate over 400 jobs, $170 million in revenue, and over $90 million in exports over the next three years.
• The Digital Media Initiative offers $1.5 million to support the creation of digital content. The Initiative provides support for projects, from early stage development up to completion of a functioning prototype, or taking a market-ready project into production. Twenty projects were supported by the fund, from games to digital motion comics, mobile apps and transmedia projects.
• Increased support for CeBIT Australia over three years.
In 2011 the first Partner Country Program outside of Germany was initiated. As part of this Program, the German Foreign Minister led a high-level business delegation to Australia to participate in the exhibition. Additionally, 12 innovative NSW companies exhibited at the NSW Government stand at CeBIT Australia.
• Nine million dollars in addition to the current commitment of $25 million, to support NICTA in specific project areas, including Co-operative Intelligent Transport Systems, Digital Services, and Implant System Acceleration.
• Sponsorship of the For Inspiration and Recognition of Science and Technology (FIRST) robotics competition at Macquarie University and the National Computer Science School at the University of Sydney.
NSW Government stand at CEBIT Australia 2011
Small business servicesThe department offers programs and services designed to help small and medium-sized enterprises (SMEs) in areas such as entrepreneurship and managerial and technical innovation. The department also supports educational and mentoring activities that focus on improving key areas of business performance, such as sales, employment and growth.
The department’s small business website www.smallbiz.nsw.gov.au continued to show its strength as a resource to SMEs. In 2010 -11 the website received over 213 000 unique visitors and over 928 000 page views. New tools introduced to the website in 2010 -11 include IDEAS Online and the Business Loan Finder. IDEAS Online is a commercial viability assessment tool that helps a user identify strengths and weaknesses in a business idea. The Business Loan Finder is a tool that assists businesses to identify which loan provider is right for their requirements.
An important feature of the small business website is the Small Business Tool Kit, an interactive learning tool for those looking to start, run and grow their enterprise. This year the Tool Kit introduced a tourism business module, its first industry-specific module. The Tool Kit attracted more than 124 000 visitors during 2010 -11.
NSW TRADE & INVESTMENT ANNUAL REPORT 2010 -11 INDUSTRY, INNOVATION & INVESTMENT DIVISION

58
The department continued to support SMEs with Smallbiz Assist. This State-wide information service improves accessibility of information, programs and services by a central customer contact centre. The service handled approximately 950 website enquiries, 400 email enquiries and 3600 telephone enquiries. A range of services and programs are also offered to start-up and microbusiness operators.
Aboriginal Business Development Program
The Aboriginal Business Development Program assists Aboriginal people plan for the successful growth and development of their commercial enterprises. Support is delivered by a team of Aboriginal Business Development Managers and Aboriginal Economic Development Officers based in metropolitan and regional centres. This year, 295 Aboriginal business clients accessed the service, and more than 370 attended 23 business workshops.
Over 100 Aboriginal enterprises registered on the NSW online Aboriginal Business Directory, which helps Aboriginal businesses promote their goods and services. Government and private sector users can gain information on NSW Aboriginal businesses by industry sector and location.
Beyond the Concept – Manufacturing your Design
This event was for Aboriginal people in the creative design industry seeking information on how to transform an idea into a commercial product. Fifty-eight participants attended the workshop. Industry specialists presented a range of information to help equip the designers with the necessary skills to better connect with manufacturers and learn how to develop successful products for the Australian and global marketplace.
Business Mentoring Program
This program provides group workshops and specialised mentoring for owners of established, innovative businesses and companies undergoing growth or expansion.
In total, 425 participants completed 27 programs with 288 mentors across the year. Five Young Entrepreneur mentoring programs were delivered, with 58 mentors equipping 75 young business people with the knowledge and skills necessary to win new clients and make sales.
Two major young entrepreneur business events were held during the financial year during Small Business September 2010 and MicroBiz Week 2010, attracting over 400 young business owners. Nine small business programs were held across the State, in topics from social media to manufacturing.
The Women in Business stream of the Business Mentoring Program assists female business owners in the early stages of business development. In 2010 -11 the department delivered 11 mentoring programs, including a Women in Film mentoring program, with 357 attendees in total.
Business advisory services
The department provides advisory services to help intending and start-up business owners plan the growth and development of their business. In 2010 -11 the program
provided 384 396 information and business services to clients in Sydney and regional NSW. More than 20 000 of these services were one-to-one guidance sessions for individuals. It is estimated that these potential business clients could generate up to 6780 new jobs.
The Innovation Advisory Service assists clients in the early stage of commercialising their inventions, innovative products or processes. A total of 1212 services were provided in 2010 -11, including technical and market assessments and workshops.
Business Growth Program
This program provided targeted assistance to 250 SMEs in NSW to grow and improve their competitiveness.
Sixteen of these firms exhibited at the Fine Food Australia September 2010 trade show in Melbourne and, as a result of their participation, the businesses attracted over $75 000 in initial sales, with scope for further sales in the medium term.
Business Networks and Clusters Program
During 2010 -11 this program supported 66 industry clusters in Sydney and regional NSW, with 4182 member companies. The program provided financial and other assistance to industry clusters from the areas of high-value manufacturing, boating, retailing, poultry, animation, tourism, export and fashion. Two workshops for cluster facilitators were held during the year, attracting 87 participants.
The department also supported a number of women’s networks and clusters, including the Women in Manufacturing Strategic Business Cluster, Sydney Women’s Network, Broken Hill Women in Business network, Great Lakes Women Business Buddies, Business Women Connect Central Coast, Business Women in the Hastings and the Sutherland Women’s Business Acceleration Forum.
Business development events
The department’s business development events for small business owners and operators attracted over 50 000 attendees across the State. MicroBiz Week enjoyed growth for the solo, home-based and microbusiness sector and provided practical ‘how to’ events over the week of activities. The week held 111 events attracting over 3200 participants.
The department marked International Women’s Day by holding a food industry event to celebrate the role of women in the food industry. The event attracted over 130 participants.
Australian Technology Showcase (ATS) and Innovation Pathways Program (IPP)The ATS is a national networking program that promotes Australian technologies and develops export markets for innovative technology-based products. The ATS and IPP supported innovative SMEs with high growth potential through an integrated range of assistance designed to accelerate their technology commercialisation strategies.
Thirty NSW companies were approved into the ATS. More than 700 entrepreneurs and managers attended 17 ATS and IPP seminars and capability-building workshops. To increase
INDUSTRY, INNOVATION & INVESTMENT DIVISION NSW TRADE & INVESTMENT ANNUAL REPORT 2010 -11
59
the access to workshop and seminar content, four seminars were videoed and were made available for viewing online. In 2010 -11:
• ATS member Marathon Robotics was awarded a US$50 million contract to provide the US Marine Corps with the US military’s first ever ‘smart’ targets. Marathon Robotics used the IPP to customise its product to meet the requirement of the US Marine Corps. Marathon Robotics also won the major prize at Tech23, receiving $50 000 sponsored by the NSW Government, and was able to use the prize money to move to its own premises in Marrickville.
• ATS Alumni company OEM Technology Solutions received IPP support for the development of a Train Management System Protocol called Multi Vehicle Bus card to help control a host of subsystems that are used in modern passenger trains. OEM was then able secure a Chinese rail contract with this product and is aiming to bid for other international rail projects.
• ATS company Taggle Systems used an IPP grant to engage Mackay Council in a trial using the company’s tags to act as devices for water telemetry. Taggle’s technology allows a cost-effective automated water-metering solution that can deliver daily readings at or below the current cost of quarterly manual readings.
• ATS member NeuClone, with assistance from the ATS and IPP, signed a strategic licence agreement with Indian Pharma Major Lupin Limited for their cell-line technology. Under the terms of the agreement, NeuClone will provide an exclusive proprietary mammalian Chinese Hampster Ovary (CHO) cell line, which is used in medical research, and will express a specific recombinant protein of interest in oncology to its partner.
• ATS member TTG, with assistance from the ATS and IPP, secured a multimillion dollar international deal to make UK trains run more efficiently with First Great Western. First Great Western is fitting TTG’s EnergyMiser system to 119 high-speed passenger trains. The system can reduce train fuel consumption by up to 16 per cent, equating to millions of dollars in annual fuel savings.
Science Leveraging FundThe NSW Science Leveraging Fund is an important innovation tool, allowing the NSW Government to invest to provide research infrastructure, skills development, education and training in line with the State’s policy priorities.
In 2010 -11, the Fund supported over 30 scientific research and infrastructure projects, including:
• $4.29 million to support nine Australian Research Council Centres of Excellence and their research capabilities across fields, including geotechnical science and engineering, astronomy, and cognitive science
• $150 000 to the University of New South Wales to support joint research with the Commonwealth Government’s Australian Solar Institute into improved energy efficiency
of third generation photovoltaic cells
• $150 000 to the University of Sydney to support a solar energy conversion project jointly funded by the Australian Solar Institute
• $200 000 to the CRC for Pork to support research in innovation in the Australian Pork industry
• $1 million to INTERSECT Australia Ltd to support eResearch infrastructure development and implementation
• $1.6 million to Bioplatforms to enhance the high-quality services and collaborative expertise in proteomics, systems biology and genomics
• $2.1 million for other scientific research and infrastructure support in NSW.
TechVouchers program
The pilot program was established to test the effectiveness of a voucher system in driving a culture of research collaboration between SMEs and public sector research organisations (PSROs). Its primary aim is to grow innovation in industry, particularly small business, to encourage SMEs’ use of technical infrastructure and capabilities in PSROs located in NSW, and seed research collaborations between these two groups.
To date, 29 TechVoucher projects have been completed with an estimated $765 277 reported in actual sales, $13.3 million in projected sales within a 12-month period and approximately 49 new jobs created as a direct result of the TechVoucher project. The project will be reviewed in the third quarter of 2011.
China–NSW Cooperation in Science, Technology and Innovation
His Excellency, Dr Wan Gang, Minister for Science and Technology from the People’s Republic of China, led a high-level delegation to Sydney in March 2011. The visit continued the dialogue between the delegation and the NSW Government. Research and industry leaders provided Minister Wan Gang with a better understanding of NSW science and technology capabilities and commercial applications. The China–NSW MoU for Cooperation in Science, Technology and Innovation, which helps to foster science and technology partnerships, was also renewed during this visit, with commitments by both governments to develop collaborative research platforms.
Nanotechnology
The NSW Nanotechnology Policy Coordination Committee met in November 2010 to discuss Commonwealth regulatory reform activities around the assessment of industrial chemicals and NSW Government agency activity around nanotechnology.
To assist both the research community and industry, the department is undertaking a mapping exercise of state, national and Asia-Pacific nanometrology and nanotoxicology capabilities to ascertain the infrastructure requirements of industry and the research sector.
NSW TRADE & INVESTMENT ANNUAL REPORT 2010 -11 INDUSTRY, INNOVATION & INVESTMENT DIVISION
60
The department also:
• sponsored the International Nanomedicine Conference in Sydney
• supported a NSW delegation of speakers, researchers and companies to Nanotech 2011 in February in Japan
• provided grants to the Australian Institute of Nanoscience at the University of Sydney, the ARC Centre of Excellence in Quantum Computing and Communication at UNSW, the NSW Node of the ARC Centre of Excellence in Quantum Systems at Macquarie University, and the ARC Centre of Excellence in Ultra High Bandwidth for Optical Systems at Sydney University.
Medical Research Support ProgramThe NSW Medical Research Support Program is a key source of funding for high-quality medical research institutes. The complete range of projects funded under this program is outlined in Appendix 17 of this report.
In June 2011, in line with the new government’s commitment to establish an Office for Medical Research in the Health portfolio, the program was moved to NSW Health.
Neuroscience research grant program
In 2010 -11, fund expenditure was $2 million, including $1.3 million to support the Spinal Cord Injury Network to address issues such as clinical trials coordination, data linkages and investing in research and development projects. This program also moved to NSW Health in June 2011.
Traditional Chinese medicine
The department continued several programs and initiatives during the year with the aim of growing the evidence base around traditional Chinese medicine (TCM) and collaboration with Chinese government, industry and research partners, including:
• support for the Joint Chair in Traditional Chinese Medicine (the University of Sydney and the University of Western Sydney). The chair focuses on research into key issues relating to quality control of TCM, clinical trials in areas of major disease burden and issues relating to patients and practitioners
• a study tour led by the Chief Scientist and Engineer to Beijing to advance discussions on developing Centre of Excellence in Integrative Medicine in Chatswood, and to develop research and business collaborative opportunities, specifically in clinical trials, pilot herb-crop trials and TCM internationalisation business platform
• support for the establishment of an 18-month trial of a Traditional Medicine Internationalisation Platform. Under the program, the University of Western Sydney’s Centre for Complementary Medicine Research will address an impediment to growth in the high-value end of the herbal medicines industry. It will link teams of researchers, regulatory and intellectual property professionals with specialist expertise to NSW and Chinese companies. It will also develop comprehensive programs to support
products for which therapeutic claims are made to navigate regulatory requirements to reach Australian and international markets. The platform will also support the growth of the NSW clinical trials industry, building on the internationally recognised strengths NSW has in complementary medicine research and strong regulatory framework.
Global competitivenessExport facilitation promotion
The department helps NSW exporters to build their export capabilities and identify new international markets by providing professional export advice, up-to-date market intelligence and direct logistic and operational assistance.
NSW Export Lab
The NSW Export Lab was launched in January 2011. The NSW Export Lab consists of a series of 12 events, run over the course of the calendar year in Sydney’s CBD, alternating between the two themes of market knowledge and export skills. The NSW Export Lab name was chosen specifically to reflect the unique hands-on active learning format being used at the workshop sessions. A total of 219 company representatives participated in the Lab.
Export Advisers
In 2010 -11 the Export Advisers assisted a total of 656 NSW companies with detailed export advice. A total of 6150 company representatives attended 148 Skills, Getting Started and Small Business Month events.
TradeStart
The department was successful in winning six four-year TradeStart contracts with Austrade in December 2010. These contracts realised $655 000 in revenue for the department in recognition for the export achievements and successes reported by NSW exporters receiving TradeStart services.
Global Growth program
Launched on 1 July 2010, the Global Growth program offers eligible NSW exporters access to a dedicated export adviser for up to 12 months to work with a company on their export plan and its implementation. Some clients may also receive a single financial payment of up to $10 000, to be used against any export-related activity nominated in the company’s business plan.
In the first year, 133 exporters were accepted into the program, achieving immediate export sales of $44.41 million, with a further $233.5 million anticipated. A total of 231 jobs were created and a further 394 are expected in the next year.
Missions and Exhibitions program
The department’s annual program of missions and exhibitions provides support to NSW businesses seeking to compete internationally. In 2010 -11, export-ready NSW companies with tradeable goods or services promoted their capabilities and/or products to key buyers, investors, distributors and media via 14 NSW Trade & Investment events. The events were spread across markets including
INDUSTRY, INNOVATION & INVESTMENT DIVISION NSW TRADE & INVESTMENT ANNUAL REPORT 2010 -11
61
Brazil, China, Japan, United Arab Emirates (UAE), United Kingdom (UK) and United States of America (USA). The key sectors covered included the business and financial services, creative industries, environmental, food and beverage, health, ICT, infrastructure and construction, and manufacturing sectors.
The department also coordinates and leads missions for research and technology organisation developing new products and markets. For example, the NSW mission to BIO USA in June 2011 saw 13 companies and research institutes from NSW’s biotechnology and life science fields travel to the USA, and in November 2010, 18 NSW companies attended MEDICA 2010/CompaMed 2010 in Germany. As a direct result of Medica/CompaMed, NSW companies reported $64.5 million in actual and projected sales.
International Tourism Industry Incentive Fund
The four-year $1.48 million International Tourism Industry Incentive Fund, currently in its third year, helped 44 export-ready NSW tourism businesses and destination representatives participate in overseas trade missions in the UK, Europe, USA and China. This enabled attendees to establish strategic, in-market relationships and to leverage business opportunities. Support was also given to 29 representatives from NSW tourism business operators attending Tourism Australia missions in China, India, South-East Asia and Japan. A total of 36 attendees were supported to attend new product workshops in Europe, New Zealand and the World Youth and Student Travel Conference.
Premier’s NSW Export Awards 2010
In 2010 a total of 85 companies were chosen as NSW finalists. They generated more than $4 billion in export earnings and employed 22 805 people. Nine of these finalists made it through to the Australian Export Awards, and three won their category. The three NSW winners were: Laservision, for the Arts and Entertainment Award; Ansarada, for the Emerging Exporter Award; and Atlassian, for the ICT Award. NSW companies have won Australian Exporter of the Year seven times in the last 10 years of the Australian Export Awards.
Sport infrastructure and services
The department promotes the expertise of NSW companies and specialists delivering major international sporting and business events, including the Olympic, Asian and Commonwealth games and international expositions. Activities also promote Sydney’s pre-eminence as an events location, supporting other agencies to attract international conferences and events. The department also develops business-leveraging programs associated with major events staged in NSW.
The Australian International Sporting Events Secretariat, a partnership between the NSW, Queensland and Victorian governments, assists Australian specialists to engage commercially with international events organisers, host governments and bidding agencies. The Secretariat promoted NSW and Australian expertise in Brazil, for the 2014 Football World Cup and the Rio 2016 Olympic and
Paralympic Games; maintained a focus on opportunities arising from the London 2012 Olympic and Paralympic Games and the Glasgow 2014 Commonwealth Games; and strongly promoted NSW expertise at the SportAccord Convention in London.
The Secretariat and the department jointly service more than 170 specialists in NSW. Many of these are included in the Winning Edge directory of capability. Events bidding, events management, sustainability and events legacy have emerged as important specialist areas in which NSW-based specialists have leading-edge knowledge.
Sydney and NSW highly valued for tourism and investment
Destination NSWIn 2011, the department delivered a key initiative under the new government’s 100 day plan, helping to establish Destination NSW. The Destination NSW Act 2011 was passed in late June 2011. It establishes Destination NSW as a statutory authority with a Board of Management and a CEO. Destination NSW will be responsible for selling NSW as a world class tourism and events location and for driving visitation to this State to double overnight visitor expenditure by 2020.
The Visitor Economy Taskforce (VET)The department also commenced establishment of the Visitor Economy Taskforce. The Taskforce will comprise tourism and events experts and will develop a strategy covering supply and demand side initiatives for tourism and events. The strategy developed by the VET will be cross government in nature and will guide the work and priorities of Destination NSW.
Oprah’s Ultimate Australian AdventureThe department worked in partnership with Tourism Australia and Harpo Productions to bring 300 of the Oprah Winfrey Show’s audience members and 200 crew to Australia, and Sydney in particular, where two live show episodes were filmed at the Opera House. The publicity provided a unique opportunity to showcase Sydney and NSW, especially to the USA - our fourth largest market for international visitors and one that is worth more than $500 million to the NSW economy. A total of 179 Australian tourism partners and suppliers participated, as well as numerous non-tourism suppliers. The department leveraged the opportunity by conducting marketing campaigns during the showing of the episodes in the USA.
Shanghai World ExpoThe 2010 World Expo was held in Shanghai, China, in October 2010. NSW participation leveraged the Australian Government’s investment and national profile and encouraged business to the State. During the six-month period, Sydney and NSW were marketed to the 70-80 million Chinese and global business visitors who attended the Expo.
NSW TRADE & INVESTMENT ANNUAL REPORT 2010 -11 INDUSTRY, INNOVATION & INVESTMENT DIVISION
62
2010 Forbes Global CEO ConferenceNSW hosted and co-sponsored (with the Australian Government) the 2010 Forbes Global CEO Conference in Sydney. The conference attracted 380 leading senior business delegates, including 298 international chairmen, presidents, CEOs, philanthropists and thought-leaders.
Principal conference themes included: the outlook for the global economy, including investor strategies during recovery; prospects for China’s economy, the green economy and the outlook for commodities; new technologies, including ICT, creative digital and biotech, innovative business models and human capital; corporate social responsibility and philanthropy; and leadership.
Australialive 2010The Australialive 2010 promotion, held in London during January 2011, showcased Australia for trade and investment, ICT, environmental sustainability, life sciences, biomedical sciences and tourism. The annual event provided several unique opportunities to illustrate the State’s core industry capabilities to key UK decision makers and assisted participating NSW companies to gain market profile in the UK. A total of 34 NSW organisations participated in Australialive 2010 events.
The department also sponsored six representatives of NSW technology firms to travel the UK for a technology and sustainability program. NSW companies reported $2.17 million in expected export sales and $100 000 in expected investment as a result of participation.
G’day USA: Australia Week 2011The G’day USA: Australia Week 2011 promotion, held in the USA during January 2011, showcased Australia for trade and investment, tourism, food and wine, film, fashion, lifestyle and the arts. Australia Week provides NSW Government agencies with a unique opportunity to demonstrate the State’s industry capabilities to targeted US decision makers and is a valuable platform for NSW companies to showcase their products and services in the US market and to American investors.
The event involved over 50 NSW organisations – the highest participation rate in the eight-year history of the event. The 13 NSW companies that the department sponsored financially reported forecasted sales of $3.17 million.
Increased awareness of Sydney and NSW capabilities was achieved through several targeted business events including the NSW Government’s annual NSW Innovation Showcase: FastPitch event held in Alta Dena, Los Angeles. Seven NSW technology companies presented to an audience of California-based investors and venture capitalists.
The department’s work at G’day USA also profiled four NSW fashion and four NSW jewellery exporters at a major fashion event managed by Austrade in New York, and six NSW-based food and beverage exporters in a four-week supermarket promotion at the Rice Epicurean Markets in Houston, with over US$12 000 in direct sales. A further four
NSW food and beverage exporters were featured on Martha Stewart’s Taste of Australia show.
Building tourism destination appealThe department builds tourism destination appeal by keeping Sydney and regional NSW high on the list of preferred holiday and short-break destinations, showcasing experiences across NSW, and working with partners to provide holiday offers to convert interest into bookings. In 2010 -11 we partnered with more than 316 organisations, who collectively invested $4.817 million into tourism marketing and promotional activities for Sydney and regional NSW.
Continual investment in the department’s digital channels allowed use of digital marketing (web, mobile and social media) to extend Sydney and regional NSW marketing campaigns. This included a creative update to consumer websites (www.visitnsw.com and www.sydney.com); an interactive map of Sydney’s experiences, an iPhone application and a Sydney digital magazine for the iPad; and Sydney and NSW-branded social media channels on facebook, Twitter and YouTube. A new online booking platform was also implemented.
Domestic tourism marketingThe department delivered 73 domestic marketing campaigns to promote holidays in NSW, with industry partners and non-traditional partners, such as retail entities.
Television advertising reached an estimated 9.4 million people across Sydney, Melbourne and Brisbane, and a further 2.07 million people across regional NSW. Magazine and newspaper advertising reached more than 13.7 million people nationally (80.3 per cent of people aged 18 years plus), on average 9.5 times. There were more than 7.11 million visits and more than 2.18 million leads to our industry websites (www.visitnsw.com and www.sydney.com), exceeding the targeted 6 million visits and 1.2 million leads.
The department also launched a new domestic youth initiative in a bid to encourage young people to holiday at home.
International tourism marketingSydney and NSW are promoted across 16 key international tourism markets. International offices exist in Auckland, London (covering the UK, Ireland and Europe), Los Angeles (covering the USA, Canada and Latin America), Tokyo, Singapore (covering South Asia) and Shanghai (covering North Asia). Achievements include:
• 90 promotional campaigns delivered in partnership with several major airlines
• NSW being represented at 47 international trade and consumer shows to promote NSW tourism products in key overseas markets
• public relations activity achieving a combined total of over $294.5 million in publicity: $273.8 million for international, $16.3 million for regional NSW and $4.4 million for Sydney.
INDUSTRY, INNOVATION & INVESTMENT DIVISION NSW TRADE & INVESTMENT ANNUAL REPORT 2010 -11
63
Tourism NSW and Tourism Australia co-hosted the Australian Tourism Exchange (ATE) at the Sydney Convention and Exhibition Centre. Around 700 key international travel trade representatives from 40 countries, and more than 1700 Australian tourism operators attended ATE. Eighty-five Sydney and NSW tourism products were showcased.
Tourism NSW designed an extensive familiarisation tour program in which a total of 327 international and domestic travel buyers participated, and hosted media familiarisations with 15 media representatives participating in tours of the Grand Pacific Drive.
Tourism cooperative funding and partnershipsThe department extended the reach of its marketing activities by working with its industry, airline and government partners. This included:
• engaging with more than 316 industry partners in domestic and international campaign activities, leveraging more than $4.7 million in direct cooperative funding
• developing partnerships with 12 major international airlines and two domestic airlines, worth a total campaign value of more than $9 million
• continuing to deliver activities under the $8.8 million three-year strategic partnership with the Queensland Government to attract international visitors to NSW and Queensland.
Digital marketingThe tourism industry witnessed a dramatic increase in online travel research and bookings. The department’s www.visitnsw.com and www.sydney.com websites provide consumers with information on over 8500 tourism businesses and events each month. More than 7.1 million consumers visited the websites during the year, an increase of almost 2 million visitors on 2009 -10. These website visits generated over 2.18 million leads to tourism businesses.
A monthly consumer e-newsletter features the very latest tourist destination information, new places to visit, special accommodation offers, events and competitions for Sydney and regional NSW. With the significant expansion of social media channels, three Sydney and three NSW branded sites were created: Sydney Australia on facebook (61 450 ‘fans’ at 30 June 2011); SeeSydney on YouTube (viewed more than 97 000 times); Sydney Sider on Twitter (over 13 000 followers); VisitNSW on facebook (launched May 2011, 4000 fans); VisitNSW on YouTube (launched May 2011, viewed more than 10 000 times); and NSWTips on Twitter (launched May 2011, over 300 followers).
The www.tourism.nsw.gov.au website received 189 453 visits. It provides current research data, business resources to help industry grow and manage business, and information on partnership and incentive opportunities. Our online tourism image library allowed industry to access more than 10 000 images, with more than 36 000 images downloaded this year.
Get Connected, our website membership program, was
enhanced during the year. Membership is free for tourism business operators within NSW.
www.sydneyaustralia.comThe department’s portal for international web users, www.sydneyaustralia.com, received contact from most countries, with the USA, UK, Canada, Brazil and Asia dominating the visitors’ list. The site provides market-specific information for China, India and the UAE and is available in both English and simplified Chinese and directs users to information on NSW business, education and tourism.
Events marketing, promotion and fundingIn 2010 -11 almost $3.8 million was invested in marketing campaigns, including advertising, public relations and cooperative marketing, to support the Vivid, Crave and Vivacity festivals in the domestic and international markets.
The Regional Flagship Events Program funded 21 events to increase visitors to regional and rural NSW. A series of regional event workshops were also held throughout regional NSW to help regional communities develop and grow sustainable events that maximise their tourism potential and provide economic benefit to their community.
Forty NSW exhibitors were promoted in the NSW branded area of the Caravan, Camping, RV and holiday Supershow in Melbourne, Sydney and Brisbane.
V8 Supercars at Sydney Olympic Park
The 2010 Sydney Telstra 500, staged at Sydney Olympic Park, was awarded the V8 Supercar Event of the Year. The award capped off the success of the second V8 Supercar event, which attracted over 166 000 attendees over the three days. V8 Supercars Australia reported that interstate and overseas visitors totalled more than 19 000.
Regional tourism partnershipsGrowing regional tourism is a key component of the department’s activities. The department works closely with the Forum of Regional Tourism Organisations and the state’s 13 regional tourism organisations (RTOs). Through the Regional Tourism Partnership Program, the department provides the RTOs with $5.1 million annually over 2009 to 2011. This year the department received and processed 54 demand-building applications to generate and build demand for tourism products and destinations in various RTO regions. Funds provided under demand-building are matched dollar-for-dollar by participating industry stakeholders.
Visitor servicesIn partnership with the City of Sydney and Sydney Harbour Foreshore Authority the department produced and distributed almost one million copies of the Sydney Official Guide in English, Japanese, Chinese and Korean.
The department continued to manage the Visitor Information Centre Network Accreditation Program across NSW. The network consists of 179 accredited centres and is marketed through a range of initiatives aimed to raise consumer awareness of the italicised yellow ‘i’ on a blue
NSW TRADE & INVESTMENT ANNUAL REPORT 2010 -11 INDUSTRY, INNOVATION & INVESTMENT DIVISION
64
background with the slogan of ‘i … will take you there’.
NSW Trade and Investment CentreThe NSW Trade and Investment Centre and Country Embassy is a premier business venue in Sydney dedicated to conferences, workshops, seminars and industry meetings that drive economic growth in metropolitan and regional NSW.
Events held at the Centre support the programs offered by the department, act as a platform for stakeholder engagement, build industry collaboration, support small and regional business, and promote international trade and investment links. This year, 3400 events were held and the number of visitors to venue totalled 44 500.
Positive business environment
Building the CountryThe department manages the $85 million Building the Country initiative, which comprises seven programs targeted at invigorating the economies of country and regional communities. Projects offered assistance included:
• the development of Port Macquarie’s Sancrox Enterprise Zone. This is expected to create more than 250 jobs in the next five years
• a desalination plant in Moree to extract saline streams from artesian bores and refine those streams to produce biodiesel.
Regional and community economic developmentThe State’s 13 Regional Business Growth Plans provide a collaborative blueprint for NSW Government agencies, local government, Regional Development Australia committees and other business stakeholders to pursue specific industry opportunities and address barriers to new regional investment.
In 2010 -11 the department administered project funding to 73 communities. In addition, a total of 126 projects funded in previous years under the program were completed during the year, leveraging up to $4.3 million in funds and creating 33 jobs. Funded projects include:
• supporting Lithgow City Council to develop an investment prospectus and economic profile to assist in promoting Lithgow to prospective investors
• funding a Project Officer position for Regional Development Australia – Hunter to assist with implementing the recommendations set out in the ‘Blueprint for a Low Carbon Future for the NSW Hunter Valley’
• supporting Bega Valley Shire Council and the NSW Land and Property Management Authority in their work to revise the 2006 Snug Cove Masterplan and include designs for a wharf extension and precinct investment plans
• providing funds for a Performing Arts Touring Coordinator/Industry Development Officer to be employed by Arts North West to build awareness of and capacity in performing arts touring opportunities and the
performing arts industry in the Northern Inland Region
• supporting Regional Development Australia – Central Coast to develop the region’s manufacturing sector capacity through the establishment of Central Coast Manufacturing Connect as the peak organisation responsible for improving the sector’s competitiveness
• assisting the Newcastle Living City Program by enabling the development of a marketing strategy to encourage greater participation from property owners/real estate agents in providing additional floor space for creative industries and to promote increased patronage of the city centre as a cultural hub.
Economic analysis and evaluationThe department researched markets, competitive strengths and business factors affecting business locations to underpin the development of a range of industry planning documents produced by the department. Research analysis covered a range of industries, with evaluations focused on quantifying the levels of new investment and employment, taking into account industry skills issues, economic flow-on benefits and industry clustering. The department also undertook:
• economic evaluations of over 50 projects to assess their potential benefit and value for NSW and inform decisions on government support
• a review of methodology, in collaboration with Treasury and the Department of Premier and Cabinet, to consider alternative cost-benefit analysis techniques as they relate to the assessment of major events and other investment projects
• the development of a framework of economic development indicators to inform the development of industry action plans in the coming year
• provision of information regarding economic conditions in the State, including employment, regional labour force and business investment.
Contributing to policy developmentThe department provides policy advice to its portfolio of Ministers and across government on economic, investment and business development issues to enable informed decisions on advancing NSW as a competitive business location. The department supported the Director General in his role as Chair of the NSW Government’s Business & Economic Development Cluster and the Deputy Director General in his role as a member of the State Contracts Control Board.
Industry and economic policy
Major areas of industry strategy and economic policy development and advice in 2010 -11 included:
• Land-use planning: The department worked closely with the Department of Planning and Infrastructure in the development of the Sydney Metropolitan Plan to ensure that economic development considerations were incorporated into the final plan.
INDUSTRY, INNOVATION & INVESTMENT DIVISION NSW TRADE & INVESTMENT ANNUAL REPORT 2010 -11

65
• Long-term demographic change: The department worked with the Department of Premier and Cabinet (DPC) and the Department of Education and Communities to implement initiatives to increase workforce participation and to take measures to prepare for longer-term changes in the profile of the working population and internal migration trends.
• The Local Jobs First Plan: The Plan aims to boost industry capability and support local employment growth by enhancing opportunities for SMEs to supply goods and services to the NSW Government either as a lead participant or subcontractor.
• Climate change: The department developed initiatives to assist industry to respond to emerging business opportunities. This included broad support for development of scientific approaches to address long-term adaptation, identification of trends that business could take advantage of, and addressing regulatory barriers to industry investment in clean energy generation.
• International education: We provide advice in relation to reforms undertaken by the Commonwealth in the management of education providers as well as the student visa scheme. The department also provided advice on issues impacting students through the Premier’s Council on International Education.
Research policy
• The department developed a submission to a Department of Innovation, Industry Science and Research (DIISR) discussion paper, ‘A Strategic Framework for Research Infrastructure Investment’, in consultation with a range of stakeholders, as an input into the 2011 Roadmap.
• The department developed a submission to DIISR to inform the development of a national Research Workforce Strategy. The department’s submission highlighted the importance of the research workforce to Australia’s future economic, health and innovation system, and outlined key principles that should underlie an effective national Research Workforce Strategy.
• The department hosted a roundtable to discuss how research in public hospitals will be defined and funded in the context of funding commitments made through National Health and Hospitals Reform. The roundtable provided a forum for key state and territory representatives to communicate issues and share work undertaken in their jurisdictions to define, capture and cost research activity in public hospitals. Research directors and health executives from all states and the ACT attended.
• The department provided a submission to the Commonwealth Legal and Constitutional Affairs Committee’s Inquiry into the Patent Amendment (Human Genes and Biological Materials) Bill 2010. This Private Senator’s Bill was introduced to amend the Patents Act 1990 to prevent the patenting of human genes and biological materials existing in nature.
Stakeholder engagementThe department has supported a range of mechanisms and initiatives to actively engage stakeholders on key issues affecting the State’s business and industry sectors. This includes providing secretariat and project support for major stakeholder forums for business, industry and regional communities. Highlights of these forums’ activities for 2010 -11 are given below.
Regional Development Advisory Council
The Regional Development Advisory (RDA) Council provides a forum for information exchange and strategic advice on regional development opportunities and challenges. It comprises the chairs of NSW’s 14 RDA committees. In 2010 -11 the Council focused on common issues of concern across all the RDAs, which included:
• climate change and the implications for land use, especially along the coastal fringe, as well as water policy for inland NSW
• demographic change
• infrastructure
• education, training and employment, with a focus on Aboriginal education and employment, State-wide skills requirements, and shortages.
A key recommendation from the Council was to ensure that the Australian Government considered the economic viability of communities within the Murray Darling Basin in the Murray Darling Basin Authority Draft Plan.
Export and Investment Advisory Board and Multicultural Business Advisory Panel
Work commenced on the establishment of the new Export and Investment Advisory Board (EIAB) and the Multicultural Business Advisory Panel (MBAP). The EIAB will provide advice to help increase the international competitiveness of NSW industry, to promote investment into NSW and to encourage growth in NSW business activity in overseas markets. The MBAP will help harness the State’s cultural diversity, language skills and overseas contacts to assist the Board to grow the NSW economy.
Manufacturing Council
The NSW Manufacturing Council advised the Government on a range of manufacturing issues, including:
• The Rail Supplier Advocate’s ‘national rail technology roadmap’ project for the Australian rail industry, including developing a ‘capability map’ to highlight gaps and opportunities and inform investment attraction activities and ‘innovation roadmap’.
• A joint pilot program between the Commonwealth, NSW and South Australian governments entitled the Design Integration Program for SME manufacturers.
The NSW Manufacturing Council’s term expired in January 2011. Manufacturing industry development will be taken up by the NSW Export and Investment Advisory Board, once it is established.
NSW TRADE & INVESTMENT ANNUAL REPORT 2010 -11 INDUSTRY, INNOVATION & INVESTMENT DIVISION

66
Retail Tenancy Unit
The Retail Tenancy Unit (RTU) carries out the functions of the Registrar of Retail Tenancy Disputes contained in the Retail Leases Act 1994.
The RTU provides advice, informal and formal mediation services to retailers, landlords, real estate agents, solicitors and industry advisors with a dispute relating to retail leases or bonds.
In the year 2010 -11 the RTU received 1079 applications for resolution of informal disputes, and 217 applications for mediation of retail lease disputes making a total of 1296 matters.
In addition the RTU received 6576 telephone calls on the RTU hotline.
Small Business Development Corporation
The Small Business Development Corporation advised on issues affecting the small business sector. In 2010 -11 the Corporation made a number of recommendations, including that the department:
• work with the Office of Environment and Heritage to specifically target SME operators in the transport and logistics industry through its green skills program
• work with the Department of Education & Communities to develop and deliver specifically designed training in sustainable business practices for transport and logistics SMEs
• seek to adopt a range of communication media and channels to improve the effectiveness of communication with the State’s small business sector.
Business University Government Forum
The 2010 Business University Government Forum included 135 leaders from business, universities and government who met to discuss Workforce for the Future, with outcomes informing workforce strategies required to assist NSW economic development, providing strategic input to other activities such as the development of the Business Sector Growth Plan.
Creating Value from Excellence Forum
The Creating Value from Excellence Forum attracted over 130 senior level representatives from a range of centres of excellence, cooperative research centres, NSW-based NCRIS and Superscience-funded initiatives, Commonwealth research organisations, media, peak industry bodies and state and federal governments.
The forum examined the growth and commercialisation plans of major publicly funded research organisations in NSW, and the collaboration platforms required to support increased linkages. The event also informed internal and external stakeholders about the research strengths and opportunities in NSW.
Partnerships for Public Value Forum
The Partnerships for Public Value Forum was jointly organised through NSW Trade & Investment, the Department of Premier and Cabinet, and the Centre for
Social Impact at the University of NSW. The Forum, attended by over 100 participants, provided an opportunity to communicate directions in relation to research philanthropy and social investment, including a trial of a social finance initiative, the Social Impact Bond.
Science communications/outreachThe department seeks to enhance competition and productivity in NSW by encouraging a skilled and educated workforce, with particular focus on encouraging students into mathematics, science and engineering. Key programs include the following:
• The NSW Scientist of the Year Awards, administered and funded by the department. The awards recognise and reward the State’s leading researchers for work that generates economic, health, environmental or technological benefits for NSW. The awards also recognise leadership in science and mathematics teaching. The 2010 NSW Scientist of the Year was Prof. Hugh Durrant-Whyte, former head of the Australian Centre for Field Robotics at the University of Sydney and now Director of NICTA.
• The Science Exposed program is a leading science education event for Year 8 and Year 9 students across NSW. The event, funded by the department with support from the Department of Education & Communities, was delivered by the Australian Museum and the Powerhouse Museum.
Future directionsIn 2011-12, the division will have lead responsibility for:
• developing Industry Action Plans which focus on specific high-performance and high-potential industry sectors to help increase global competitiveness and productivity (Digital Economy, Professional Services, Manufacturing and International Education will be the first 4 sector covered by the plans)
• supporting the work of the Visitor Economy Taskforce (VET) to develop a plan to double overnight visitor expenditure by 2020. The work of the VET will form the Industry Action Plan for the tourism and events sector
• increasing our facilitation efforts to help grow businesses, and attract major investment projects and jobs growth for NSW
• prioritising regional industry and business infrastructure needs to feed into Regional Industry Action Plans and Industry Action Plans to ensure a stronger focus on linking industry and infrastructure priorities across regions
• championing regional development by maintaining a portfolio of regional investment projects in identified priority industry sectors
• the NSW Export and Investment Advisory Board (EIAB) to provide advice to grow the NSW economy through measures to increase the international competitiveness of NSW industry, to promote investment into NSW and to
INDUSTRY, INNOVATION & INVESTMENT DIVISION NSW TRADE & INVESTMENT ANNUAL REPORT 2010 -11

67
• encourage growth in NSW business activity in overseas markets
• the Multicultural Business Advisory Panel, which aims to harness cultural diversity, language skills and overseas contacts to assist the EIAB to grow the NSW economy
• enhancing on-line services and webinars available to industry. The initiatives will improve the reach of information services to the State’s 650 000 small businesses.
The Department will also undertake prepatory work to establish the Office of the Small Business Commissioner who will provide a single point of access for small business to resolve complaints against other businesses and government agencies.
Divisional performance
Service Measures Units 2008-09Actual
2009 -10Actual
2010 -11Forecast
2010 -11Est Actual
Major investment projects supported by the department: Metropolitan Regional Jobs impact
nonono
25260
7 566
50200
11 059
50200
8 000
891
1362
15 3793
Clients assisted to visit export markets no na na 150 143
Clients assisted through small business programs no 54 800 33 146 50 000 73 3354
Services provided to micro and start-up business clients no 135 000 225 521 200 000 384 3965
Investment in science leveraged through the Science Leveraging Fund
$m 46 155 207 7386
Business leads generated for tourism operators million 0.6 1.0 1.2 2.27
Industry investment in tourism marketing $m 5.7 6.6 4.0 4.78
1. Footloose investment projects may consider both metropolitan and regional areas with the ultimate location difficult to forecast. In 2010 -11 more projects than went to metropolitan areas.
2. The number of projects in regions is less the projected as a result of the Payroll Tax Incentive Scheme closing. It is noted that the number of jobs exceeded the target which is the key parameter.
3. It is difficult to project the timing of investment projects. A number of large projects came online during the year and a stronger than expected recovery of the NSW economy resulted in a higher than forecast jobs impact.
4. The number used reflects inclusion of events targeted at small businesses not previously counted across the broader Division or where the Division contracts out services (eg, Business Advisory Services).
5. The figure used has been refined to capture a broader range of service interactions with businesses.6. NSW was successful in attracting considerable funding under the Australian Research Council Centres of Excellence Program which resulted in a large
increase in the amount leveraged.7. The leads to tourism businesses forecast for 2010 -11 was set to increase by 20 per cent on the previous year which achieved almost one million. The Marketing and Communications group refined search traffic driving strategies to ensure the use of key media more likely to deliver business leads.
Accordingly, the leads target was exceeded by almost one million leads.8. The Tourism NSW revenue target for 2010 -11 was $4 million. This target is comprised of direct and in-kind cooperative contributions. Direct revenue
(cash) was approximately $3.23 million. In kind contributions significantly exceeded expectations increasing the revenue achieved to $4.718 million.
NSW TRADE & INVESTMENT ANNUAL REPORT 2010 -11 INDUSTRY, INNOVATION & INVESTMENT DIVISION
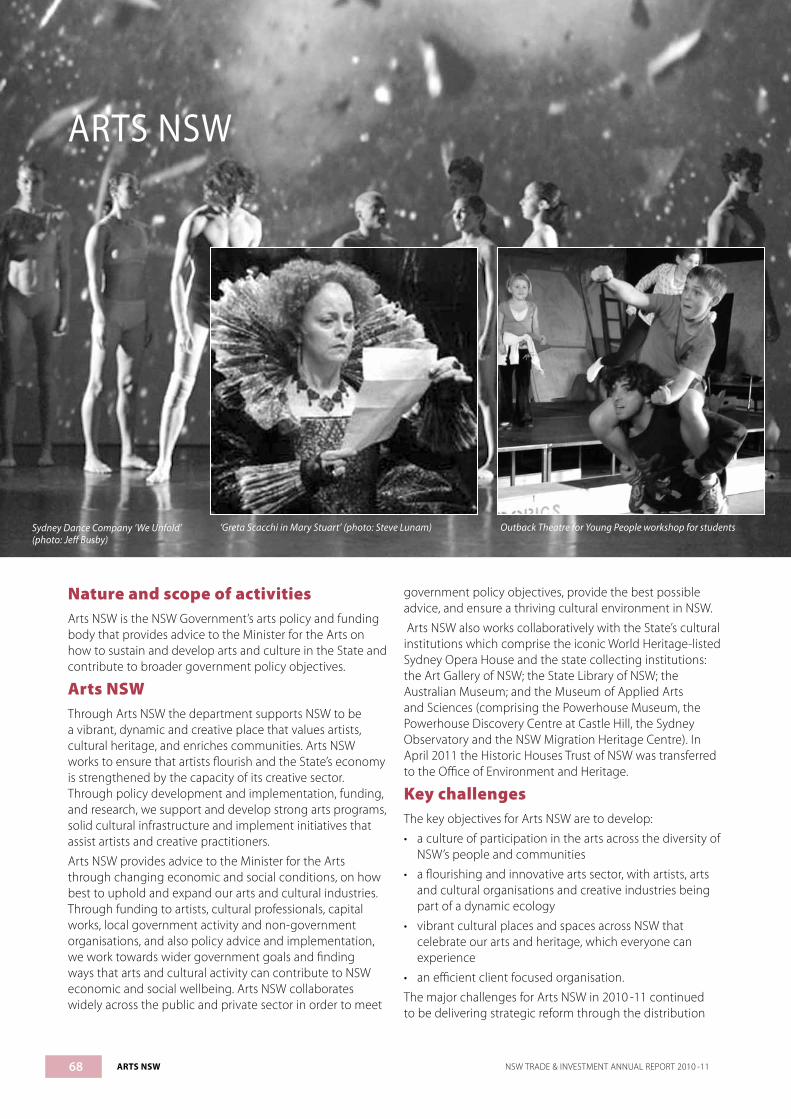
68 ARTS NSW NSW TRADE & INVESTMENT ANNUAL REPORT 2010 -11
ARTS NSW
Nature and scope of activitiesArts NSW is the NSW Government’s arts policy and funding body that provides advice to the Minister for the Arts on how to sustain and develop arts and culture in the State and contribute to broader government policy objectives.
Arts NSWThrough Arts NSW the department supports NSW to be a vibrant, dynamic and creative place that values artists, cultural heritage, and enriches communities. Arts NSW works to ensure that artists flourish and the State’s economy is strengthened by the capacity of its creative sector. Through policy development and implementation, funding, and research, we support and develop strong arts programs, solid cultural infrastructure and implement initiatives that assist artists and creative practitioners.
Arts NSW provides advice to the Minister for the Arts through changing economic and social conditions, on how best to uphold and expand our arts and cultural industries. Through funding to artists, cultural professionals, capital works, local government activity and non-government organisations, and also policy advice and implementation, we work towards wider government goals and finding ways that arts and cultural activity can contribute to NSW economic and social wellbeing. Arts NSW collaborates widely across the public and private sector in order to meet
government policy objectives, provide the best possible advice, and ensure a thriving cultural environment in NSW.
Arts NSW also works collaboratively with the State’s cultural institutions which comprise the iconic World Heritage-listed Sydney Opera House and the state collecting institutions: the Art Gallery of NSW; the State Library of NSW; the Australian Museum; and the Museum of Applied Arts and Sciences (comprising the Powerhouse Museum, the Powerhouse Discovery Centre at Castle Hill, the Sydney Observatory and the NSW Migration Heritage Centre). In April 2011 the Historic Houses Trust of NSW was transferred to the Office of Environment and Heritage.
Key challengesThe key objectives for Arts NSW are to develop:
• a culture of participation in the arts across the diversity of NSW’s people and communities
• a flourishing and innovative arts sector, with artists, arts and cultural organisations and creative industries being part of a dynamic ecology
• vibrant cultural places and spaces across NSW that celebrate our arts and heritage, which everyone can experience
• an efficient client focused organisation.
The major challenges for Arts NSW in 2010 -11 continued to be delivering strategic reform through the distribution
Outback Theatre for Young People workshop for studentsSydney Dance Company ‘We Unfold’ (photo: Jeff Busby)
‘Greta Scacchi in Mary Stuart’ (photo: Steve Lunam)

69NSW TRADE & INVESTMENT ANNUAL REPORT 2010 -11 ARTS NSW
of arts funding, improving services, the management of the Arts NSW property portfolio, working with the state’s cultural institutions and increasing cultural tourism in NSW.
A key aim for the portfolio is to develop a resilient arts and cultural sector - maximising return on Government investment, growth in self-generated revenue and philanthropy.
Distribution of arts fundingArts NSW continues to work towards shifting the traditional funding profile of the Arts Funding Program to support important new strategic directions. In 2010 -11 Arts NSW worked with the Aboriginal arts and cultural sector to
develop the NSW Aboriginal Arts and Cultural Strategy which, for the first time, saw strategic and targeted support for the sector. To implement the Strategy’s actions $2 million in funding was allocated in 2011 to Aboriginal artists and arts and cultural activities in Aboriginal communities.
Arts capacity in regional NSW was also increased through allocation of existing funding to create a new Regional Arts Board - Western Riverina. Two reviews were also undertaken to determine how to more effectively support regional arts delivery, a review into performing arts touring in regional NSW and work towards a strategic direction for the visual arts and museum sectors.
Arts portfolio: key facts Arts portfolio assets at 30 June 2011 are valued at approximately $7.37 billion. This is made up of Arts NSW properties ($220 million), cultural institutions’ properties ($2616.98 billion) and cultural institutions collections ($4555.49 billion). The 2010 -11 Arts portfolio budget was:
• Total Recurrent allocation: $239.2 million.
• Total Capital allocation: $39.5 million.
The 2010 -11 Arts Funding Program provided $48.815 million to over 346 arts organisations and 80 individuals and 616 projects across NSW including:
• Over $25 million for State-wide arts activities and over $12 million for activities in Sydney (including $3.529 million in Western Sydney)
• Over $10.4 million was approved to local governments, community and cultural organisations in regional NSW (including funding to peak bodies, regional conservatoriums, regional galleries and museums and regional arts boards) to support 222 programs/projects.
• $6.7 million investment in 4 major festivals (Sydney Festival, Biennale of Sydney, Sydney Writer’s Festival and the Sydney Film Festival) which attracted over 1.3 million people.
• 11 major performing arts companies in NSW attracted over 1.86 million people (NSW investment of $12 million leverages $38.1 from the Commonwealth)
• An $889 400 investment in the ConnectEd Arts program to provide opportunities for school students across the State to have a range of arts experiences. The Australia Council contributes $200 000 per year towards this program.
• 11 individual fellowships, scholarships (5 of which are biennial) and awards (encompassing 19 award categories) which support individual artists and creative professionals. Almost $600 000 is disseminated annually across the areas of literature, history, visual arts, dance, Indigenous arts and culture, music and design.
• The Arts NSW property portfolio comprises nine properties which provides subsidised support to 29 separate arts and cultural organisations.
• In 2010 -11, the Public Libraries Grants and Subsidies totalled $25.538 million (including $2 million under the Country Libraries Fund). 32 councils received project funding under the Library Development Grants/Country Libraries Fund.
• In 2010 -11, the State’s major cultural institutions exhibitions and performance: attracted 4.583 million visitors; toured exhibitions/performances that attracted audiences of over 200 000; had almost 250 000 members and 1194 volunteers; and self-generated revenue and donations that exceeded $159.42 million.
Improving servicesReducing red tape and responding to the needs of communities and arts organisations continues to be a priority. In 2010 -11 new application forms were introduced along with an online application system for the first time. Arts NSW staff also increased the number of briefing sessions to introduce the 2012 Arts Funding Program, offering 13 briefings across NSW. A small grant Quick Response Program was introduced, offering a faster
turnaround time and the opportunity for individual artists and the small to medium organisations to seek support.
Management of the Arts NSW property portfolioIn 2010 -11, Arts NSW began to develop a strategic approach to its investment and support of cultural infrastructure. This was in recognition of the importance of working more closely with relevant local governments and developing clear criteria for the housing of arts organisations in Arts NSW property. An audit of Sydney’s arts and cultural
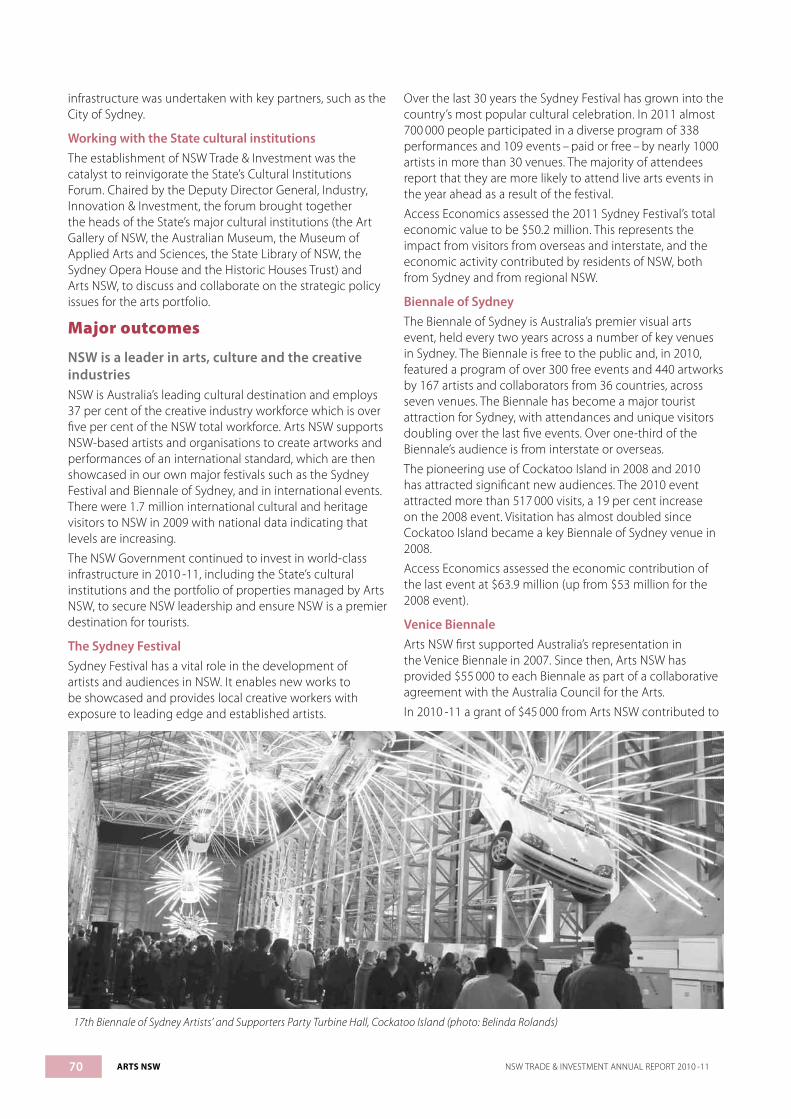
70
infrastructure was undertaken with key partners, such as the City of Sydney.
Working with the State cultural institutions The establishment of NSW Trade & Investment was the catalyst to reinvigorate the State’s Cultural Institutions Forum. Chaired by the Deputy Director General, Industry, Innovation & Investment, the forum brought together the heads of the State’s major cultural institutions (the Art Gallery of NSW, the Australian Museum, the Museum of Applied Arts and Sciences, the State Library of NSW, the Sydney Opera House and the Historic Houses Trust) and Arts NSW, to discuss and collaborate on the strategic policy issues for the arts portfolio.
Major outcomes
NSW is a leader in arts, culture and the creative industriesNSW is Australia’s leading cultural destination and employs 37 per cent of the creative industry workforce which is over five per cent of the NSW total workforce. Arts NSW supports NSW-based artists and organisations to create artworks and performances of an international standard, which are then showcased in our own major festivals such as the Sydney Festival and Biennale of Sydney, and in international events. There were 1.7 million international cultural and heritage visitors to NSW in 2009 with national data indicating that levels are increasing.
The NSW Government continued to invest in world-class infrastructure in 2010 -11, including the State’s cultural institutions and the portfolio of properties managed by Arts NSW, to secure NSW leadership and ensure NSW is a premier destination for tourists.
The Sydney FestivalSydney Festival has a vital role in the development of artists and audiences in NSW. It enables new works to be showcased and provides local creative workers with exposure to leading edge and established artists.
Over the last 30 years the Sydney Festival has grown into the country’s most popular cultural celebration. In 2011 almost 700 000 people participated in a diverse program of 338 performances and 109 events – paid or free – by nearly 1000 artists in more than 30 venues. The majority of attendees report that they are more likely to attend live arts events in the year ahead as a result of the festival.
Access Economics assessed the 2011 Sydney Festival’s total economic value to be $50.2 million. This represents the impact from visitors from overseas and interstate, and the economic activity contributed by residents of NSW, both from Sydney and from regional NSW.
Biennale of SydneyThe Biennale of Sydney is Australia’s premier visual arts event, held every two years across a number of key venues in Sydney. The Biennale is free to the public and, in 2010, featured a program of over 300 free events and 440 artworks by 167 artists and collaborators from 36 countries, across seven venues. The Biennale has become a major tourist attraction for Sydney, with attendances and unique visitors doubling over the last five events. Over one-third of the Biennale’s audience is from interstate or overseas.
The pioneering use of Cockatoo Island in 2008 and 2010 has attracted significant new audiences. The 2010 event attracted more than 517 000 visits, a 19 per cent increase on the 2008 event. Visitation has almost doubled since Cockatoo Island became a key Biennale of Sydney venue in 2008.
Access Economics assessed the economic contribution of the last event at $63.9 million (up from $53 million for the 2008 event).
Venice Biennale Arts NSW first supported Australia’s representation in the Venice Biennale in 2007. Since then, Arts NSW has provided $55 000 to each Biennale as part of a collaborative agreement with the Australia Council for the Arts.
In 2010 -11 a grant of $45 000 from Arts NSW contributed to
ARTS NSW NSW TRADE & INVESTMENT ANNUAL REPORT 2010 -11
17th Biennale of Sydney Artists’ and Supporters Party Turbine Hall, Cockatoo Island (photo: Belinda Rolands)
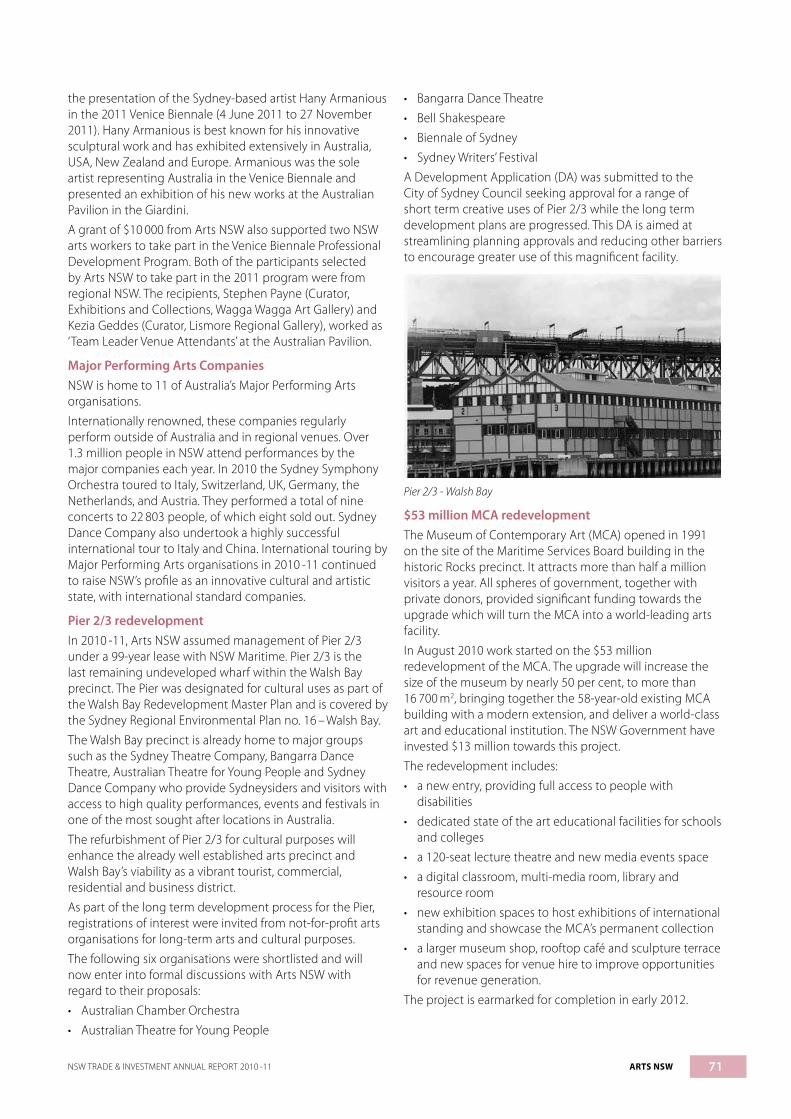
71
the presentation of the Sydney-based artist Hany Armanious in the 2011 Venice Biennale (4 June 2011 to 27 November 2011). Hany Armanious is best known for his innovative sculptural work and has exhibited extensively in Australia, USA, New Zealand and Europe. Armanious was the sole artist representing Australia in the Venice Biennale and presented an exhibition of his new works at the Australian Pavilion in the Giardini.
A grant of $10 000 from Arts NSW also supported two NSW arts workers to take part in the Venice Biennale Professional Development Program. Both of the participants selected by Arts NSW to take part in the 2011 program were from regional NSW. The recipients, Stephen Payne (Curator, Exhibitions and Collections, Wagga Wagga Art Gallery) and Kezia Geddes (Curator, Lismore Regional Gallery), worked as ‘Team Leader Venue Attendants’ at the Australian Pavilion.
Major Performing Arts Companies NSW is home to 11 of Australia’s Major Performing Arts organisations.
Internationally renowned, these companies regularly perform outside of Australia and in regional venues. Over 1.3 million people in NSW attend performances by the major companies each year. In 2010 the Sydney Symphony Orchestra toured to Italy, Switzerland, UK, Germany, the Netherlands, and Austria. They performed a total of nine concerts to 22 803 people, of which eight sold out. Sydney Dance Company also undertook a highly successful international tour to Italy and China. International touring by Major Performing Arts organisations in 2010 -11 continued to raise NSW’s profile as an innovative cultural and artistic state, with international standard companies.
Pier 2/3 redevelopmentIn 2010 -11, Arts NSW assumed management of Pier 2/3 under a 99-year lease with NSW Maritime. Pier 2/3 is the last remaining undeveloped wharf within the Walsh Bay precinct. The Pier was designated for cultural uses as part of the Walsh Bay Redevelopment Master Plan and is covered by the Sydney Regional Environmental Plan no. 16 – Walsh Bay.
The Walsh Bay precinct is already home to major groups such as the Sydney Theatre Company, Bangarra Dance Theatre, Australian Theatre for Young People and Sydney Dance Company who provide Sydneysiders and visitors with access to high quality performances, events and festivals in one of the most sought after locations in Australia.
The refurbishment of Pier 2/3 for cultural purposes will enhance the already well established arts precinct and Walsh Bay’s viability as a vibrant tourist, commercial, residential and business district.
As part of the long term development process for the Pier, registrations of interest were invited from not-for-profit arts organisations for long-term arts and cultural purposes.
The following six organisations were shortlisted and will now enter into formal discussions with Arts NSW with regard to their proposals:
• Australian Chamber Orchestra
• Australian Theatre for Young People
• Bangarra Dance Theatre
• Bell Shakespeare
• Biennale of Sydney
• Sydney Writers’ Festival
A Development Application (DA) was submitted to the City of Sydney Council seeking approval for a range of short term creative uses of Pier 2/3 while the long term development plans are progressed. This DA is aimed at streamlining planning approvals and reducing other barriers to encourage greater use of this magnificent facility.
Pier 2/3 - Walsh Bay
$53 million MCA redevelopmentThe Museum of Contemporary Art (MCA) opened in 1991 on the site of the Maritime Services Board building in the historic Rocks precinct. It attracts more than half a million visitors a year. All spheres of government, together with private donors, provided significant funding towards the upgrade which will turn the MCA into a world-leading arts facility.
In August 2010 work started on the $53 million redevelopment of the MCA. The upgrade will increase the size of the museum by nearly 50 per cent, to more than 16 700 m2, bringing together the 58-year-old existing MCA building with a modern extension, and deliver a world-class art and educational institution. The NSW Government have invested $13 million towards this project.
The redevelopment includes:
• a new entry, providing full access to people with disabilities
• dedicated state of the art educational facilities for schools and colleges
• a 120-seat lecture theatre and new media events space
• a digital classroom, multi-media room, library and resource room
• new exhibition spaces to host exhibitions of international standing and showcase the MCA’s permanent collection
• a larger museum shop, rooftop café and sculpture terrace and new spaces for venue hire to improve opportunities for revenue generation.
The project is earmarked for completion in early 2012.
NSW TRADE & INVESTMENT ANNUAL REPORT 2010 -11 ARTS NSW
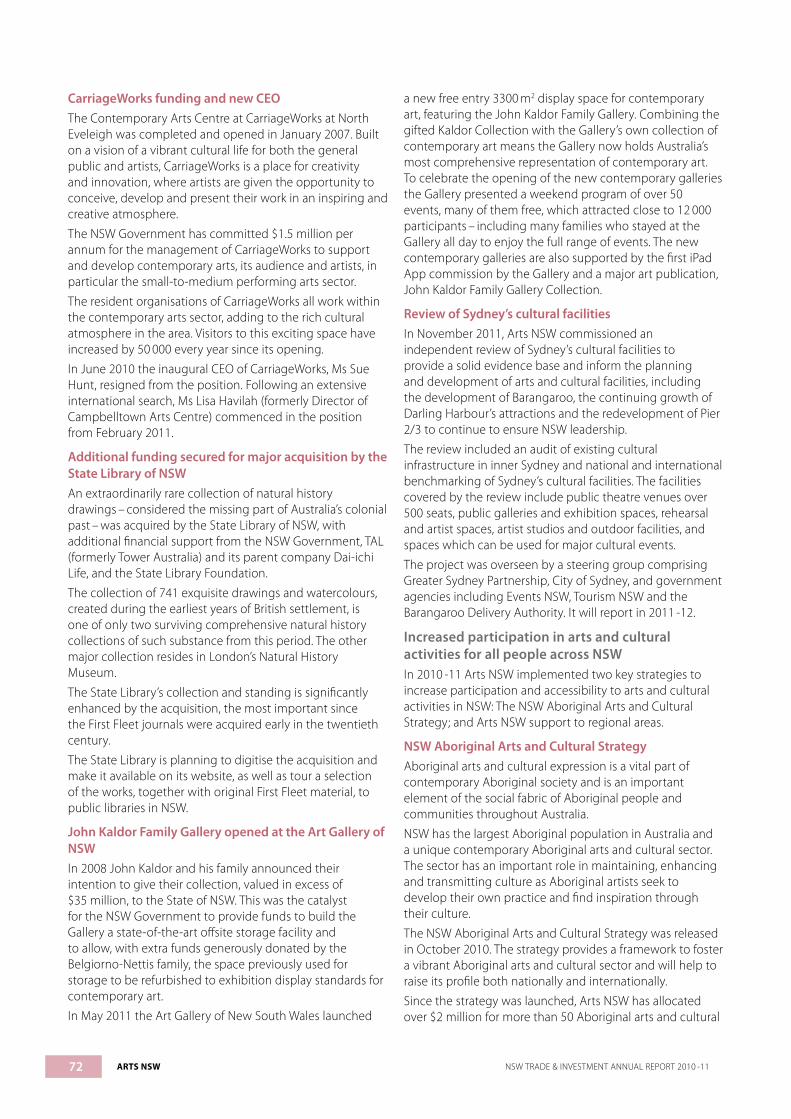
72
CarriageWorks funding and new CEOThe Contemporary Arts Centre at CarriageWorks at North Eveleigh was completed and opened in January 2007. Built on a vision of a vibrant cultural life for both the general public and artists, CarriageWorks is a place for creativity and innovation, where artists are given the opportunity to conceive, develop and present their work in an inspiring and creative atmosphere.
The NSW Government has committed $1.5 million per annum for the management of CarriageWorks to support and develop contemporary arts, its audience and artists, in particular the small-to-medium performing arts sector.
The resident organisations of CarriageWorks all work within the contemporary arts sector, adding to the rich cultural atmosphere in the area. Visitors to this exciting space have increased by 50 000 every year since its opening.
In June 2010 the inaugural CEO of CarriageWorks, Ms Sue Hunt, resigned from the position. Following an extensive international search, Ms Lisa Havilah (formerly Director of Campbelltown Arts Centre) commenced in the position from February 2011.
Additional funding secured for major acquisition by the State Library of NSW An extraordinarily rare collection of natural history drawings – considered the missing part of Australia’s colonial past – was acquired by the State Library of NSW, with additional financial support from the NSW Government, TAL (formerly Tower Australia) and its parent company Dai-ichi Life, and the State Library Foundation.
The collection of 741 exquisite drawings and watercolours, created during the earliest years of British settlement, is one of only two surviving comprehensive natural history collections of such substance from this period. The other major collection resides in London’s Natural History Museum.
The State Library’s collection and standing is significantly enhanced by the acquisition, the most important since the First Fleet journals were acquired early in the twentieth century.
The State Library is planning to digitise the acquisition and make it available on its website, as well as tour a selection of the works, together with original First Fleet material, to public libraries in NSW.
John Kaldor Family Gallery opened at the Art Gallery of NSWIn 2008 John Kaldor and his family announced their intention to give their collection, valued in excess of $35 million, to the State of NSW. This was the catalyst for the NSW Government to provide funds to build the Gallery a state-of-the-art offsite storage facility and to allow, with extra funds generously donated by the Belgiorno-Nettis family, the space previously used for storage to be refurbished to exhibition display standards for contemporary art.
In May 2011 the Art Gallery of New South Wales launched
a new free entry 3300 m2 display space for contemporary art, featuring the John Kaldor Family Gallery. Combining the gifted Kaldor Collection with the Gallery’s own collection of contemporary art means the Gallery now holds Australia’s most comprehensive representation of contemporary art. To celebrate the opening of the new contemporary galleries the Gallery presented a weekend program of over 50 events, many of them free, which attracted close to 12 000 participants – including many families who stayed at the Gallery all day to enjoy the full range of events. The new contemporary galleries are also supported by the first iPad App commission by the Gallery and a major art publication, John Kaldor Family Gallery Collection.
Review of Sydney’s cultural facilitiesIn November 2011, Arts NSW commissioned an independent review of Sydney’s cultural facilities to provide a solid evidence base and inform the planning and development of arts and cultural facilities, including the development of Barangaroo, the continuing growth of Darling Harbour’s attractions and the redevelopment of Pier 2/3 to continue to ensure NSW leadership.
The review included an audit of existing cultural infrastructure in inner Sydney and national and international benchmarking of Sydney’s cultural facilities. The facilities covered by the review include public theatre venues over 500 seats, public galleries and exhibition spaces, rehearsal and artist spaces, artist studios and outdoor facilities, and spaces which can be used for major cultural events.
The project was overseen by a steering group comprising Greater Sydney Partnership, City of Sydney, and government agencies including Events NSW, Tourism NSW and the Barangaroo Delivery Authority. It will report in 2011 -12.
Increased participation in arts and cultural activities for all people across NSWIn 2010 -11 Arts NSW implemented two key strategies to increase participation and accessibility to arts and cultural activities in NSW: The NSW Aboriginal Arts and Cultural Strategy; and Arts NSW support to regional areas.
NSW Aboriginal Arts and Cultural Strategy Aboriginal arts and cultural expression is a vital part of contemporary Aboriginal society and is an important element of the social fabric of Aboriginal people and communities throughout Australia.
NSW has the largest Aboriginal population in Australia and a unique contemporary Aboriginal arts and cultural sector. The sector has an important role in maintaining, enhancing and transmitting culture as Aboriginal artists seek to develop their own practice and find inspiration through their culture.
The NSW Aboriginal Arts and Cultural Strategy was released in October 2010. The strategy provides a framework to foster a vibrant Aboriginal arts and cultural sector and will help to raise its profile both nationally and internationally.
Since the strategy was launched, Arts NSW has allocated over $2 million for more than 50 Aboriginal arts and cultural
ARTS NSW NSW TRADE & INVESTMENT ANNUAL REPORT 2010 -11
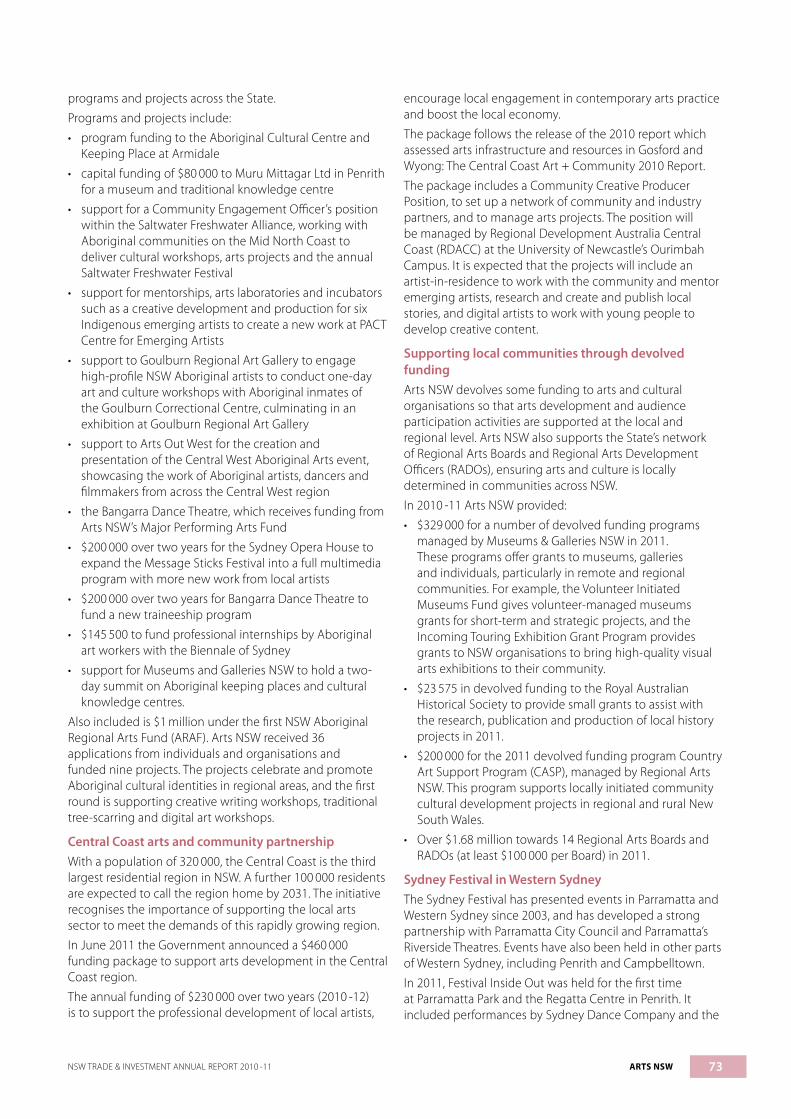
73
programs and projects across the State.
Programs and projects include:
• program funding to the Aboriginal Cultural Centre and Keeping Place at Armidale
• capital funding of $80 000 to Muru Mittagar Ltd in Penrith for a museum and traditional knowledge centre
• support for a Community Engagement Officer’s position within the Saltwater Freshwater Alliance, working with Aboriginal communities on the Mid North Coast to deliver cultural workshops, arts projects and the annual Saltwater Freshwater Festival
• support for mentorships, arts laboratories and incubators such as a creative development and production for six Indigenous emerging artists to create a new work at PACT Centre for Emerging Artists
• support to Goulburn Regional Art Gallery to engage high-profile NSW Aboriginal artists to conduct one-day art and culture workshops with Aboriginal inmates of the Goulburn Correctional Centre, culminating in an exhibition at Goulburn Regional Art Gallery
• support to Arts Out West for the creation and presentation of the Central West Aboriginal Arts event, showcasing the work of Aboriginal artists, dancers and filmmakers from across the Central West region
• the Bangarra Dance Theatre, which receives funding from Arts NSW’s Major Performing Arts Fund
• $200 000 over two years for the Sydney Opera House to expand the Message Sticks Festival into a full multimedia program with more new work from local artists
• $200 000 over two years for Bangarra Dance Theatre to fund a new traineeship program
• $145 500 to fund professional internships by Aboriginal art workers with the Biennale of Sydney
• support for Museums and Galleries NSW to hold a two-day summit on Aboriginal keeping places and cultural knowledge centres.
Also included is $1 million under the first NSW Aboriginal Regional Arts Fund (ARAF). Arts NSW received 36 applications from individuals and organisations and funded nine projects. The projects celebrate and promote Aboriginal cultural identities in regional areas, and the first round is supporting creative writing workshops, traditional tree-scarring and digital art workshops.
Central Coast arts and community partnership With a population of 320 000, the Central Coast is the third largest residential region in NSW. A further 100 000 residents are expected to call the region home by 2031. The initiative recognises the importance of supporting the local arts sector to meet the demands of this rapidly growing region.
In June 2011 the Government announced a $460 000 funding package to support arts development in the Central Coast region.
The annual funding of $230 000 over two years (2010 -12) is to support the professional development of local artists,
encourage local engagement in contemporary arts practice and boost the local economy.
The package follows the release of the 2010 report which assessed arts infrastructure and resources in Gosford and Wyong: The Central Coast Art + Community 2010 Report.
The package includes a Community Creative Producer Position, to set up a network of community and industry partners, and to manage arts projects. The position will be managed by Regional Development Australia Central Coast (RDACC) at the University of Newcastle’s Ourimbah Campus. It is expected that the projects will include an artist-in-residence to work with the community and mentor emerging artists, research and create and publish local stories, and digital artists to work with young people to develop creative content.
Supporting local communities through devolved fundingArts NSW devolves some funding to arts and cultural organisations so that arts development and audience participation activities are supported at the local and regional level. Arts NSW also supports the State’s network of Regional Arts Boards and Regional Arts Development Officers (RADOs), ensuring arts and culture is locally determined in communities across NSW.
In 2010 -11 Arts NSW provided:
• $329 000 for a number of devolved funding programs managed by Museums & Galleries NSW in 2011. These programs offer grants to museums, galleries and individuals, particularly in remote and regional communities. For example, the Volunteer Initiated Museums Fund gives volunteer-managed museums grants for short-term and strategic projects, and the Incoming Touring Exhibition Grant Program provides grants to NSW organisations to bring high-quality visual arts exhibitions to their community.
• $23 575 in devolved funding to the Royal Australian Historical Society to provide small grants to assist with the research, publication and production of local history projects in 2011.
• $200 000 for the 2011 devolved funding program Country Art Support Program (CASP), managed by Regional Arts NSW. This program supports locally initiated community cultural development projects in regional and rural New South Wales.
• Over $1.68 million towards 14 Regional Arts Boards and RADOs (at least $100 000 per Board) in 2011.
Sydney Festival in Western SydneyThe Sydney Festival has presented events in Parramatta and Western Sydney since 2003, and has developed a strong partnership with Parramatta City Council and Parramatta’s Riverside Theatres. Events have also been held in other parts of Western Sydney, including Penrith and Campbelltown.
In 2011, Festival Inside Out was held for the first time at Parramatta Park and the Regatta Centre in Penrith. It included performances by Sydney Dance Company and the
NSW TRADE & INVESTMENT ANNUAL REPORT 2010 -11 ARTS NSW

74
Australian Chamber Orchestra and was attended by more than 7000 people – an outstanding success. The Festival will continue to develop program initiatives for Western Sydney in 2012, in partnership with NSW Government and Parramatta City Council.
Supporting arts and cultural development in regional NSW Arts NSW and the State cultural institutions are committed to supporting arts and cultural development in regional NSW through policy development, funding, partnerships and outreach.
New Western Riverina Arts Board - Regional arts development in NSW is decentralised through a network of regional organisations known as the Regional Arts Boards. Boards include representatives from local government, tourism, education, arts councils and other community arts organisations, and community members. Each employs a Regional Arts Development Officer (RADO) and, in most instances, other staff who coordinate a cultural development program across the contributing local government areas in their region.
The Regional Arts Network services more than 100 local government areas covering more than 662 000 km2, 1.7 million people and approximately 1200 local arts and cultural groups.
In July 2010, $200 000 was provided to establish a new Regional Arts Board in the Western Riverina. With the addition of the Western Riverina, there are now 14 Regional Arts Boards in NSW. The Western Riverina Regional Arts Board will serve the communities of Griffith City Council, Narrandera Shire Council and Leeton Shire Council. The board will provide strategic direction for sustainable arts and cultural development across region.
The new board will play a vital role in providing a renewed focus on arts and cultural life in the region. The creative industries are one of the fastest growing sectors in NSW and the new board will be dedicated to developing new opportunities and jobs for artists living in the area.
Supporting regional libraries - Library and local government stakeholders have had longstanding concerns about the constraints on the nature of the management arrangements for regional libraries under Section 12 of the Library Act 1939. In particular, the requirement for councils participating in a regional library arrangement to adopt an executive council model, whereby one council is responsible for the management and provision of the library, (or an aspect of the library service) on behalf of the other council or councils.
This issue was addressed by an amendment of the Library Act 1939 to provide additional flexibility. A new provision, Section 12A, was inserted to enable the approval of alternative management arrangements for regional libraries when proposals for alternative arrangements from two or more councils are made. The Library Council will advise the Government on all proposals, and the State Library will continue to provide advice and support to councils
regarding regional library agreements. A new template for a collective management model is available from the State Library.
Touring program: review completed - Arts NSW currently supports performing arts touring by NSW companies in a number of ways, including through Performing Arts Touring project funding under its Arts Funding Program, devolved grants to Arts on Tour, ConnectEd program grants, negotiated funding and program funding to tour facilitators (e.g. Critical Stages, Arts on Tour). In 2010 Arts NSW announced plans to conduct a review aimed at ensuring that support for touring was effective at reaching audiences not otherwise able to access performances. The touring review was completed in May 2011 and its recommendations are currently being assessed.
Berlin Philharmonic - In November 2010, members of the Berlin Philharmonic hosted a master class with Central Coast Conservatorium students in Gosford. It was a unique experience for the 35 students in the Conservatorium’s Youth Orchestra to be trained by internationally renowned musicians. The students selected two works for intensive study from the Berlin Philharmonic’s Australian tour program: the final movement of Brahm’s 2nd Symphony and the first two movements of Haydn’s Symphony No. 99. The visiting tutors used their direct experience of the works to guide the young musicians through the master classes, which formed part of the 2010 Sydney Opera House World Orchestras Education Program. The visit was facilitated by a $53 000 grant from Arts NSW to the Central Coast Conservatorium towards its Annual Concert Series.
Wrapped in a Possum Skin Cloak - The Wrapped in a Possum Skin Cloak by the Lake project at Lake Macquarie City Art Gallery brought together Indigenous community members in the Hunter region to revive the local traditional practice of designing and making a possum skin cloak. The aim of the project was for the community to make a cloak for community use that can be borrowed for appropriate Aboriginal ceremonies, funerals and other occasions.
The Gallery’s Aboriginal Reference Group managed a series of workshops on constructing a cloak and on the historical and cultural significance of possum skin cloaks in the region. The finished cloak, along with working drawings and a DVD of the process, was displayed at the Gallery. The display then toured to the Australian Museum.
Arts NSW, through ConnectEd Arts, supported a range of education programs associated with the project. Two travelling suitcases for use by schools and community groups were developed containing examples of pelts at different stages of the cloak-making process to foster discussion around the history and use of possum skin cloaks. Artist-in-schools sessions were also conducted with Aboriginal students to develop their cultural skills.
The education/resource kit and research from the program is now part of an online resource managed by libraries in the Lake Macquarie district.
ARTS NSW NSW TRADE & INVESTMENT ANNUAL REPORT 2010 -11

75
Image credit: artist Doug Archibald in ‘The Lake Cloak’ from ‘Wrapped in a Possum by the Lake’, Lake Macquarie City Art Gallery 2011
Regional tours
Arts portfolio: regional presenceArts NSW funds:
• 14 Regional Arts Boards, which employ Regional Arts Development Officers (RADOs) to promote arts development across the State
• peak bodies, such as Regional Arts NSW (the peak advocacy and support organisation for arts in the regions) and Museums and Galleries NSW (the leading agency to develop, support and promote regional, community and public museums across NSW)
• regional conservatoriums ($2.1 million in 2010 -11) in partnership with Department of Education and Communities
• around 222 projects/programs across all art forms in the regions, including regional music festivals, regional galleries, regional writers centres, educational programs and performing arts tours (over $10.4 million, or 46 per cent of the Arts Funding Program, was allocated to support regional projects in 2010 -11).
The State’s cultural institutions:
• curate touring exhibitions, including to regional areas (12 exhibitions in 2010 -11 at 29 locations)
• loan objects from their collections for inclusion in local exhibitions
• develop exhibitions in conjunctions with and provide advisory curatorial services to regional organisations
• host websites aimed at increasing access to services to off-site visitors
• provide development opportunities for staff and volunteers of regional cultural organisations and specific cultural communities (such as internships and mentorship programs and offering skill development workshops in regional areas).
The State Library of NSW has a significant regional impact through:
• investment in public libraries (99 central libraries plus 275 branch libraries) and 23 mobile libraries ($25.538 million in grants and subsidies in 2010 -11, including $2 million under the Country Library Fund). 32 councils received project funding under the Library Development Grants/Country Libraries Fund
• consultancy services assisting with strategic planning, library building advice and professional development
• State-wide specialist library services
• a significant online presence, including online access to parts of the collection.
The arts and cultural sector is strong and innovative and the creative industries continue to growThrough the Arts Funding Program and strategic projects, Arts NSW creates opportunities for people to connect with and enjoy a diverse artistic and cultural life. By sharing resources and promoting collaboration Arts NSW is committed to promoting a strong and innovative cultural sector.
Peak and service organisations play important roles in the areas of advocacy, capacity building, communications and support. $6.04 million was distributed by 29 peak and service organisations over 2010 -11. Arts NSW provides significant funding to peak bodies and service organisations to provide these specialist services in NSW. These include: Accessible Arts; Arts Law Centre of Australia; Arts on Tour NSW Ltd; Ausdance NSW; Australian Music Centre; Australian Writers Guild; History Council of NSW; Museums & Galleries NSW; MusicNSW; National Association for the Visual Arts (NAVA); PlayWriting Australia; Regional Arts NSW; Royal Australian Historical Society (RAHS); Local Government & Shires Association of NSW.
Artsupport ManagerIn 2010, Arts NSW partnered with the Australia Council (through Artsupport Australia) to develop private giving and philanthropic support for arts and cultural activities in NSW. Artsupport Australia works closely with government, cultural, corporate, financial and philanthropic sectors to develop effective strategies for giving. It has facilitated more than $55 million in philanthropic income for more than 200 artists and 600 cultural organisations since its launch in 2003.
The NSW Government and the Australia Council jointly funded Artsupport Australia’s NSW manager position, each providing $80 000 a year for two years from 2010 -11. The focus of the funding is to support two growing sectors of the NSW arts scene: Western Sydney-based artists and organisations; and Aboriginal arts and culture in regional NSW.
The position provides free one-on-one mentoring to the arts sector to develop and grow philanthropic funding; for example, through developing donor programs and
NSW TRADE & INVESTMENT ANNUAL REPORT 2010 -11 ARTS NSW
76
accessing grants from family and corporate foundations. The NSW manager is also an adviser, information source and broker for the philanthropic sector, encouraging donors to become more strategic and structured with their philanthropy, taking briefs from donors and foundations, and matching cultural organisations and projects to their specific criteria.
The NSW manager, Caroline Vu, joined Artsupport Australia in October 2010 and is based in Parramatta.
Development of the Visual Arts and Museums SectorOne of the key recommendations of a review of Museums and Galleries NSW (M&G NSW) in 2009 was the development of a long-term strategic plan for the development of the sector. Arts NSW commenced work in 2010 on the development of its Strategic Plan for the Visual Arts and Museum Sector in NSW. The focus of this work is on the small-to-medium sector throughout NSW.
Residencies/fellowships and scholarshipsInternational residencies The international residency program continued in 2011, with four NSW artists supported to work with arts organisations in Montreal, New York, Washington DC and Dublin. These residencies are delivered in partnership between the NSW Government and four arts organisations in Sydney. These opportunities enable artists to build their international connections and creates opportunities to share their skills, knowledge and experience.
The NSW organisations who are involved in the 2011 international residency program include:
• Artspace Visual Arts Centre, with the Canada Council for the Arts’ Darling Foundry, Montreal
• Inscription, with the Albee Foundation in Long Island, New York
• Play Writing Australia, with the National New Play Network, Washington DC
Fellowships and scholarships Arts NSW fellowships and scholarships are designed to support and promote the outstanding artistic and/or cultural endeavours of individuals in New South Wales and nationally.
The following fellowships and scholarships, valued at $306 000, were offered over 2010 -11:
• The NSW Premier’s Literary Awards ($315 000)
• The Premier’s History Awards ($75 000)
• The Rex Cramphorn Theatre Scholarship ($30 000)
• The Philip Parsons Young Playwright’s Award and Memorial Lecture ($9 000)
• The Design NSW: Travelling Scholarship ($18 000)
• The Helen Lempriere Travelling Art Scholarship ($60 000)
• The Indigenous Arts Fellowship ($30 000)
• The NSW Archival Research Fellowship ($15 000)
• The NSW History Fellowship ($20 000)
• The NSW Writer’s Fellowship – 2 recipients ($20 000 per recipient)
• The Women and Arts Fellowship ($30 000)
Vibrant places across the State
Infrastructure and capital grants To support vibrant cultural places across the State, Arts NSW funds and supports the development of arts and cultural infrastructure through the Arts Funding Program’s capital project funding. In 2010 -11, Arts NSW allocated nearly $4 million in capital funding to 10 organisations, including $3 million towards the redevelopment of the Museum of Contemporary Art.
During 2010, Arts NSW completed an audit of cultural infrastructure outside the Sydney CBD. A cultural facilities directory containing the information collected through this audit was launched on the Arts NSW website in November 2010.
Winners of the Premiers Literary Awards and Western Sydney Fellowships 2011 with the Premier Barry O’Farrell and the Hon George Souris MP, Minister for the Arts
ARTS NSW NSW TRADE & INVESTMENT ANNUAL REPORT 2010 -11

77
The directory is available at: www.facilities.arts.nsw.gov.au. The online database contains details of 261 publicly owned NSW performance and exhibition spaces and includes an interactive map of cultural facilities. It can be used to access information such as capacity, technical resources, hospitality and backstage facilities for organisations planning touring productions or one-off events.
Creative Enterprise Hubs and pop-up projectsThe Creative Enterprise Hubs project is supported by Arts NSW and encourages commercial property owners and local government to recognise that the creative industries can drive economic and urban renewal. Hubs operate in temporarily vacant and low-cost or free premises, providing artists and arts groups with creative space. The rise of Creative Enterprise Hubs coincides with strong and growing interest in creative industries in many regions and has grown out of the success of the Renew Newcastle Project. This is an innovative urban renewal project which has transformed part of the Newcastle CBD into a series of galleries and studios where artists can create, exhibit and sell their work.
Arts NSW has provided funding to the following hubs in 2010 -11:
• Renew Newcastle $150 000 for year three of three years
• Parramatta City Council for Pop up Parramatta $100 000 for year one of two years
• Lismore City Council for Art in the Heart Lismore $100 000 for year one of two years
• Gosford City Chamber of Commerce for Create Innovate Gosford $37 990 for one year
• Sydney Harbour Foreshore Authority for The Rocks Pop-Up project $15 000 for a six-month pilot from May to October 2011.
The Empty Spaces project is funded by Arts NSW and promotes ‘pop-up’, short-term re-uses of empty shops and other spaces for creative and community uses via a website located at: http://emptyspaces.culturemap.org.au/page/about-empty-spaces The project is managed through the University of Technology, Sydney (UTS) Shopfront Community Program as part of the Cultural Asset Mapping in Regional Australia (CAMRA) project and links community and cultural organisations to the university’s knowledge, skills and resources to undertake community engagement projects and research.
The website provides tools that will assist community leaders, entrepreneurs and creative thinkers to set up an ‘empty space’ initiative in their local community and encourages landlords and local governments to support local creative enterprises and community activities.
Greening the WharfA significant greening project was undertaken at Wharf 4/5 involving the installation of 1906 solar panels on the roof, a 98 000 L rainwater harvesting system, and more efficient lighting and water fixtures. The project was funded by the Commonwealth and State governments (Department
of Environment Climate Change and Water through Arts NSW), as well as substantial private donor contributions.The solar panel system is the second largest rooftop solar array in Australia and is capable of providing 70 per cent of the Sydney Theatre Company’s energy needs. The rainwater harvesting system collects the water from the roof for re-use throughout the wharf amenities. This system will provide around 95 per cent of the toilet flushing water demand.
Theatre Walk The Theatre Walk at Pier 2/3 Walsh Bay commemorates and celebrates the lives of 21 leaders of Australian theatre, with a particular focus on those with a NSW connection, who have been recognised by peer awards and both nationally and internationally for their artistic excellence. The walk is permanent acknowledgement of the immense contribution they have made as directors, actors, designers, teachers, producers and playwrights to our national identity and Australia’s international reputation as a creative nation.
Arts NSW coordinated the selection of the 21 recipients, in consultation with Sydney Festival Artistic Director Lindy Hume and the then Sydney Opera House Director of Performing Arts Rachel Healy.
The 21 plaque recipients are (in alphabetical order): Neil Armfield, John Bell, Wendy Blacklock, Cate Blanchett, Ruth Cracknell, Gale Edwards, Nick Enright, Hayes Gordon, Reg Livermore, Bob Mazza, John McCallum, Robyn Nevin, Barry Otto, Geoffrey Rush, Jim Sharman, Brian Thomson, Jacki Weaver, Hugo Weaving, Richard Wherrett, J C Williamson and Googie Withers.
Property PortfolioThe Arts NSW accommodation program is a key integrated component of the Government’s program of support to the arts.
The program provides subsidised accommodation to a range of key arts and cultural organisations (subsidies estimated at $8.1m). The portfolio currently houses 29 arts organisations (54 separate leases) across nine sites. The properties within the portfolio are generally significant heritage buildings that have been adapted for arts and cultural uses. Many of the properties provide specialist arts and cultural infrastructure such as theatres, galleries, rehearsal studios and creative spaces.
Arts NSW is an efficient, responsive and client focused organisation
Launch of new Arts NSW websiteArts NSW began an update into its new website in early 2010, incorporating sector feedback into a functional new site design. The aim was to provide clearer information on the role of Arts NSW and the activities of the agency in promoting and supporting the development of the arts and cultural sector in NSW.
The new website went live in November 2010, including information on the Arts NSW property portfolio, current projects and initiatives of Arts NSW, the State’s cultural
NSW TRADE & INVESTMENT ANNUAL REPORT 2010 -11 ARTS NSW

78
institutions, Aboriginal arts and culture in NSW, arts in regional NSW, major performing arts companies and festivals, and small-to-medium organisations.
The new site incorporates simplified navigation features and contains advice for artists on developing and exhibiting work, improved information on the arts and cultural sector in NSW and profiled news and media functionality.
Information on creative spaces, including the new Cultural Facilities Directory and updated news, media releases, information and links on current research in the arts in NSW and the wider sector, are now all available online.
Improved contact and feedback features were incorporated into the site. Comments or requests submitted via the new website are received directly by Arts NSW staff, allowing timely electronic responses. An electronic newsletter associated with the website has also been developed. It will be distributed quarterly, with content developed by Arts NSW. Reporting tools will allow the newsletter to be adapted to best fit the requirements of the sector.
The new site supports Google analytics so that Arts NSW is able to assess all traffic and evaluate business information and customer/visitor insights. Further, embedded Google functionality provides faster and more accurate search results for visitors. Improved analytics will inform future website development.
AFP online applications Arts NSW launched its online funding application system in February 2011 with the aim of streamlining the grant application process and creating a user-friendly system for artists and arts organisations.
Users can select, complete and submit an application for funding through a step-by-step process which includes facilities to attach support material, save an application, and provide applicants with email notification that their application has been received along with a copy of their completed application.
Future phases of development include client login registration to enable artists and arts organisations to create an account on the system and manage their contact details and online acquittals and nominations for the NSW Premier’s Literary and History Awards.
AFP roadshowIn March and April 2011Arts NSW presented thirteen funding information sessions in partnership with the Australia Council for the Arts. Sessions were held in Armidale, Broken Hill, Cessnock, Dubbo, Gosford, Nowra, Penrith, Sydney and Wagga Wagga engaging with almost 500 artists and representatives from arts organizations. The funding information sessions covered the following topics:
• what we do/who we are
• types of grants available
• examples of successful projects
• tips for a successful application
• further resources
• questions and answers.
Client satisfaction surveyDuring December 2010 and January 2011, Arts NSW conducted the 2010 Client Satisfaction Survey. The study collected comments from our clients on the services they received from Arts NSW, and will serve to inform how we can improve and better meet client’s needs in the future.
People who completed the survey included the Arts Funding Program’s recipients and those who had been in contact and/or working with Arts NSW staff for the period between January 2010 and December 2010.
By the end of January 2011, a total of 93 people had responded to the survey. Of these, 34.8 per cent had been in contact with Arts NSW from one to five years, followed by 32.6 per cent who were long-term clients and had been in contact with Arts NSW for more than 10 years. Most of the respondents (45%) had communicated with Arts NSW staff more than 10 times in the last year.
The vast majority (95.7%) of respondents were in contact with Arts NSW regarding the Arts Funding Program, with 87.8 per cent having applied for funding in 2010 and 69.9 per cent of respondents successful in their funding application.
The survey’s key points were that:
• 59.8 per cent of respondents said that the information/advice provided by Arts NSW staff was ‘well presented and understandable’ or ‘extremely well presented and understandable’, and sufficient to solve the problem
• 47.8 per cent of respondents got the information they were looking for and 75 per cent said that they were ‘very satisfied’ or ‘somewhat satisfied that my problem was understood’
• 49.5 per cent agreed that ‘Arts NSW staff communicated with me clearly and effectively, also kept me informed of progress about the issue/request I made’
• in general, Arts NSW staff were considered ‘professional or very professional’ (93.4%) ‘helpful’ (71.1%) ‘courteous’ (63.7%) ‘friendly’ (53.8%) ‘accessible’ (51.6%) and ‘well informed’ (41.8%).
Future directionsPier 2/3 short-term use/long-term development Historic Pier 2/3 is the last remaining undeveloped wharf within the Walsh Bay precinct. During 2011-12, Arts NSW will continue to progress the long-term development of the Pier, following the assessment of registrations of interest from not-for-profit arts organisations for long-term use.
While the development work is underway, Arts NSW will open up Pier 2/3 in its current ‘raw’ state for greater use by arts, cultural and creative organisations. Planning approvals will be streamlined and other barriers to use will be reduced in order to bring the historic facility to life.
ARTS NSW NSW TRADE & INVESTMENT ANNUAL REPORT 2010 -11

79
Divisional performance
Service Measures Units 2008-09Actual
2009 -10Actual
2010 -11Forecast
2010 -11Est. Actual
Investment in Aboriginal arts programs/projects through Arts Funding Program (AFP)
$m 1.5 1.0 2.0 2.0
Occupancy rate for Arts NSW properties % 79 91 91 811
1. The decrease in occupancy rates in 2010 -11 is due to the addition of Pier 2/3 at Walsh Bay to property portfolio which is currently undeveloped.
NSW TRADE & INVESTMENT ANNUAL REPORT 2010 -11 ARTS NSW
Major cultural festivalsThe NSW Government will continue to support the State’s major cultural festivals, including an additional $1.7 million for the Sydney Festival, of which $500 000 will support the first dedicated program for Western Sydney in 2012. The new 10 day program (to run within the Festival’s dates) builds on Sydney Festival’s commitment to presenting work in Western Sydney since 2003. The $500 000 will enable Sydney Festival to further expand these activities, working collaboratively with Parramatta City Council and partners in Western Sydney.
Arts NSW will progress plans to transform the Arts Exchange, The Rocks into a hub for the State’s four premiere festivals: Biennale of Sydney, Sydney Festival, Sydney Film Festival and the Sydney Writers’ Festival.
The collocation these major festivals will support collaboration, build cultural tourism and address critical accommodation needs that have emerged following significant growth in the festivals success over the past decade.
These nationally significant festivals attract more than 1.5 million visitors combined which confirms NSW as Australia’s leading festival destination.
Making the arts a key plank of the state’s tourism strategyThe arts will be a key plank of the State’s Tourism Strategy to double tourism by 2020. As national data indicates cultural and heritage visitors spend more, there is a clear economic benefit in targeting cultural and heritage tourists and encouraging them to stay longer in the State. A focus on the arts will also highlight one of our State’s major strengths and drive growth in the sector.
Arts and Cultural Policy development Arts NSW will work to respond to the Australian Government National Cultural Policy Discussion paper and commence work to develop an Arts and Cultural Policy to secure New South Wales’ position as a leader in the arts, culture and creative industries and to set the future direction for the support of arts and cultural initiatives across the State.

80 OFFICE OF LIQUOR, GAMING AND RACING NSW TRADE & INVESTMENT ANNUAL REPORT 2010 -11
Nature and scope of activitiesThe department’s Office of Liquor, Gaming and Racing supports community safety and wellbeing by regulating and promoting responsible liquor, gaming, racing and charitable industry practice and the responsible management of events.
The office comprises four units:
– Policy & Strategy
– Compliance
– Licensing
– Strategic Engagement & Development
Key challengesResponsible service of alcohol and responsible conduct of gambling photo identity competency cardUnder NSW liquor laws it is mandatory that all licensees, serving staff and security officers undergo Responsible Service of Alcohol (RSA) training, or Responsible Conduct of Gambling (RCG) training where gaming duties are involved. Training must be provided by a registered training organisation.
The photo identity competency card project is a direct result of a 2009 Independent Commission Against Corruption (ICAC) investigation into allegations of students purchasing fraudulent RSA and RCG certification without any training or assessment.
Approximately 115 000 RSA and 35 000 RCG paper certificates are issued each year. The current certificate does not expire and the number of valid certificates in existence is unknown. The new competency card in NSW will be the first of its kind in Australia and will provide a leading and innovative way of managing evidence of RSA and RCG competency. Unlike paper-based systems, the photo identity competency card will allow the exact number of currently accredited people to be determined and will improve regulation and marketplace monitoring.
The project has presented the Office of Liquor, Gaming and Racing (the Office) with some key challenges to overcome, including:
• the requirement for registered training organisations to input student and course data through an online portal linked to the Government Licensing System – the NSW Government licensing database which is used for liquor licensing in NSW
• the development of a rollout strategy to manage the operation of the two accreditation systems until paper certificates are fully phased out
• community education – the competency card will need to be renewed every five years.
In overcoming these challenges to deliver the new competency card, the Office will provide the following benefits to industry and the community:
OFFICE OF LIQUOR, GAMING AND RACING

81NSW TRADE & INVESTMENT ANNUAL REPORT 2010 -11 OFFICE OF LIQUOR, GAMING AND RACING
• the RSA and RCG training industry, the liquor industry, and patrons of licensed venues will benefit through standardised delivery of training
• for licensed venues the competency card will remove the need to keep copies of certificates for every employee and will reduce the possibility of using fraudulent certificates
• for cardholders, the new competency card combines RSA and RCG competencies onto one card that is portable, less likely to get lost and replaceable
• for regulators, the competency card will reduce the opportunity for fraud. The card is easily produced for compliance checking, even during peak trading hours and cardholder details can be verified against the central database. As course and student details are entered into the licensing system by registered training organisations the new system will also allow for better auditing of course delivery.
The photo identity competency card will be mandatory from 22 August 2011. At this time the phasing out of paper certificates will begin and a communication strategy will commence to ensure that the card is broadly advertised, trainers, sufficiently trained and allowing accredited people to benefit from the efficiencies brought about by a portable card.
Violent Venues SchemeUnder schedule 4 of the Liquor Act 2007 special licence conditions and restrictions can be applied to licensed venues that record high levels of alcohol-related violent incidents (as reported by the NSW Bureau of Crime Statistics and Research). The Government requested a review of the violent venues scheme to ensure venue size and other relevant factors are taken into account.
Two rounds of the scheme were implemented in 2010 -11: one on 1 December 2010 and a second on 1 June 2011. Each round of the scheme presented significant challenges to the Office and tight timeframes:
• significant consultation with venues and police
• analysis of extensive amounts of data and individual violent incidents
• preparation of detailed reports and correspondence to inform decision making
• preparation and approval of a Regulation under schedule 4 of the Liquor Act 2007 listing the licensed premises captured under the scheme.
The scheme has been associated with a reduction in the number of violent incidents in targeted licensed premises, increasing safety for patrons and the local community. The number of incidents in the most violent venues (Level 1) decreased by 1011 (80%) since Round 1 of the scheme. However, the number of incidents increased slightly in Round 5 compared with Round 4. Only two of the most violent (Level 1) venues appeared in all five rounds at the highest level.
Commonwealth involvement in gaming machine regulation and the select council on gambling reformThe Commonwealth Government proposed to introduce legislation which will override State and Territory gaming laws. The legislation will require a mandatory pre-commitment system and dynamic warning messaging for all gaming machines in Australia, and enforce a daily withdrawal limit on automatic teller machines in hotels and clubs where gaming machines are located. This poses a significant regulatory challenge for the Office, and is an issue that commanded considerable national attention.
The Office played a significant role in developing the NSW negotiating positions advanced at the Council of Australian Government’s (COAG) Select Council on Gambling Reform. The deliberations related to mandatory pre-commitment, dynamic warning messages for gaming machines and automatic teller machine withdrawal limits.
The Office also participated in working groups underpinning the COAG Select Council and will continue to provide support to the NSW Government ahead of further national discussions.
The NSW Government’s negotiating position took into account the range of gambling harm minimisation measures already in place in NSW, which include:
• the mandatory availability of self-exclusion schemes to support people at risk of problem gambling
• problem gambling counselling and support services located in NSW, as well as 24/7 help via telephone and online services
• provision for a mandatory six hour daily shutdown of gaming machines in all hotels and clubs
• a ban on credit card cash withdrawals from ATMs in gaming venues
• a prohibition on ATMs in gaming areas of venues and a prohibition on gaming machine advertising
• a requirement for Gambling Helpline information to be placed on every gaming machine
• a requirement for gaming venues to install accurate clocks
• a requirement for all people working in gaming venues to be RCG accredited.
The level of problem gambling in NSW currently sits at 0.4 per cent of the adult population – the lowest in Australia.
Legal challenges to NSW Race Fields legislationIn July 2008, legislation was commenced to provide for the introduction of a Race Fields scheme to enable the controlling bodies of racing to impose a fee on wagering operators betting on NSW races.
Legal challenges of the legislation were made by two interstate wagering operators. These were ultimately dismissed by the Full Court of the Federal Court in November 2010. However, the wagering operators have been granted leave to appeal in the High Court, with the matter expected to be heard early in the new reporting year.

82
The State defended the validity of the legislation as the Government recognises the considerable contribution that a viable racing industry makes to the State, both economically and socially. The Race Fields legislation provides a mechanism for the NSW racing industry to receive fair payment from wagering operators who bet on NSW races. If the appeal is denied then this important revenue stream for the racing industry will be confirmed and in excess of $130 million in fees already collected and currently held in trust can be distributed throughout the industry.
Future action by the Office will depend on the decision of the High Court.
Major outcomesSafer communities
Responsible Service of Alcohol on the Front Line workshopsThe responsible service of alcohol training is the cornerstone of the Liquor Act 2007, and accords with current NSW Government policy direction.
The Responsible Service of Alcohol (RSA) on the Front Line program is a foundation education program that is strategic in nature and designed to influence frontline liquor and gaming industry personnel. The initiative has been successful with minimum resource impact, and feedback from industry is very positive.
Since July 2008, 171 RSA on the Front Line workshops have been delivered to more than 7000 frontline bar and security staff from 1388 venues. In 2010 -11, 59 workshops were delivered to 1700 front line bar and security staff from 299 venues.
The workshops are valued by industry, peak bodies and police as a tool to raise awareness of the risks posed and remedial measures available to reduce the instance of alcohol-related harm in and near licensed premises.
In the future the Office will refine the RSA on the Front Line workshops so they can be delivered in module form to better reflect compliance trends and issues affecting industry and provide stakeholders with the flexibility to tailor industry training to better fit their local area or circumstance.
Charitable fundraising licence enforcementThe Office is committed to assisting charity industry responsibility and sustainability, including regulatory issues relating to improved service and improved function.
The charitable fundraising laws promote proper and efficient management and administration of fundraising appeals for charitable purposes and ensure the maintenance of proper records and accountability. They also prevent deception of members of the public who wish to support worthy causes. Failure to comply with the legislative requirements may result in an organisation losing its ability to conduct public fundraising appeals.
Following a full compliance investigation, officers identified a number of breaches and revoked the Charitable
Fundraising Licence for an operator for poor accountability and record keeping.
Most organisations do comply with charitable fundraising laws. Out of approximately 5200 licensed fundraisers only two organisations had their licences revoked during the year. However, the Office will continue to scrutinise charitable fundraising activities during the year through licensing, education and compliance programs to ensure they comply with strict governance and accountability requirements relating to how funds are raised and spent.
‘Three strikes and you’re out’ system Under the ‘100 Days Action Plan’ the NSW Government committed to introduce a ’three strikes and you’re out’ system. This is a high-profile initiative targeting problem premises with the aim of reducing alcohol-related violence and anti-social behaviour and improving licensed venue operations and management.
A range of options to implement the three-strikes system was developed and a Cabinet Minute was subsequently prepared. This resulted in the drafting of the Liquor Amendment (3 Strikes) Bill 2011, which was introduced into the Parliament in June. The Bill amends the Liquor Act 2007 to implement the three strikes election commitment.
The three-strikes system represents a strong deterrent which will help to improve compliance with the Liquor Act 2007, leading to more responsible operation of licensed venues, safer premises and reduced alcohol-related harm. Three strikes will be implemented in consultation with industry and other stakeholders.
Protecting the integrity of the liquor licensing systemIn January 2011, the Casino, Liquor and Gaming Control Authority (CLGCA) formally refused a second removal application for an on-premises licence to move to a new premise because it was not satisfied that the application met the adverse social impact test under section 48(5) of the Liquor Act 2007, given the density of late-trading premises and recent history of alcohol-related disturbance in the area involved.
However, the owners subsequently commenced trading, using a caterer to sell liquor on the premises at organised functions.
The department quickly moved to close down this loophole by introducing a regulation which imposes a condition on an authorisation used by caterers to sell liquor away from their permanent licensed premises (known as a ‘sale on other premises authorisation’). This means that a licensee cannot sell or supply on any premises for which an application for a liquor licence or an extended trading authorisation has been refused within the previous two years.
The new legislation also protects the local community from an increase in alcohol-related harm.
The outcomes of this action will be monitored and the tools available to prevent the use of a caterer’s licence at functions in circumstances where there are significant
OFFICE OF LIQUOR, GAMING AND RACING NSW TRADE & INVESTMENT ANNUAL REPORT 2010 -11
83
concerns about the impact of the function on the local community will be reviewed.
Gaming Machines Regulation 2010A draft Gaming Machines Regulation 2010, and accompanying Regulatory Impact Statement were prepared and submitted for public and gaming machine industry comment. The submissions received will help inform future policy development across key areas including the operation of self-exclusion provisions.
The regulation will ensure the continuation of the detailed regulatory framework needed to support the objectives of the Gaming Machines Act 2001.
Maintaining and enforcing the provisions of the Gaming Machines Act 2001 and Regulations are core functions of the Office. The new legislation assists the NSW Government to effectively regulate the operation of gaming machines in NSW, benefiting the NSW community through gambling harm minimisation, player fairness measures and a viable industry.
Review of totalizator compliance measuresFollowing the decision by Tabcorp to expand its racing coverage in association with the introduction of two new pay TV channels in March 2010, it became necessary to review the departments racing compliance reporting.
Totalizator betting must be conducted in accordance with the rules and must protect the interests of the betting public. In August 2010 new reports were devised to provide faster recovery of information relating to critical operational issues and to identify changes in final totalizator pool totals and the late receipt of collation messages.
Totalizator racing betting in 2010 -11 saw a turnover of $4566.2 million. The turnover for sports totalizator betting for this period was $16.1 million.
Enterprising Communities
Liquor licensing freezeThe NSW Government is committed to evidence based policy development and any extension of the liquor licensing freeze (established under Part 4A of the Liquor Act 2007) will be subject to the findings of research into liquor licence sustainability and density levels.
The liquor licensing freeze provides a benefit for the community as it prevents the grant of liquor licences for potentially high-impact venues (including venues with extended trading hours) in the freeze precinct areas where there is already a significant number of such venues. Approval of additional venues in the freeze precincts could have a negative impact on the community where existing problems associated with the high density of venues – which led to the freeze in the first place – are exacerbated. These include problems such as pedestrian movement, the availability of transport away from the area, and alcohol-related violence and anti-social behaviour. This can have a particular impact on the amenity of the neighbourhood for local residents, and on police and
emergency workers who deal with large numbers of patrons in these precincts.
The freeze precincts are situated in the City of Sydney Council local government area. The Council is supportive of the freeze as it prevents the grant of development consent under the Environmental Planning and Assessment Act 1979 for development on premises that are subject to the liquor licensing freeze. The problems set out above are not exacerbated to the Council’s detriment as no additional high-impact venues can be established.
In June 2011, the NSW Government approved a 12-month extension of the liquor licensing freeze until 24 June 2012 under the Liquor Amendment (Freeze on Certain Liquor Licences) Regulation 2011 on the basis that it will ensure liquor licences captured by the freeze are not issued while new research into the relationship between liquor licence density and alcohol-related issues is being carried out. This research will identify relevant factors that may significantly impact on community safety and wellbeing. It will have a broad scope, looking at both the positive and negative cumulative impacts of liquor licence density. It will also build on Bureau of Crime Statistics and Research data released in March 2011.
Merger of the Australian Jockey Club and Sydney Turf ClubA strong single metropolitan race club is pivotal for the future of the State’s racing industry. The historic Australian Jockey Club and Sydney Turf Club merger initiative is designed to provide for the future viability of Sydney racing and to protect jobs in the sector by introducing efficiencies and modern corporate governance.
A viable racing industry makes a considerable contribution that to the State, both economically and socially, and a strong metropolitan racing sector will have flow-on benefits for the regional and country sectors. The merger, facilitated by legislation passed in Parliament in November 2010, underpinned a $174 million funding package for capital works at Rosehill ($24 million) and Randwick Racecourses ($150 million).
The 2011-12 year will see the ongoing development of the Randwick and Rosehill racecourses as two of the world’s premier thoroughbred racing and entertainment venues, as well as the continued delivery of high-quality metropolitan racing and flow-on benefits for regional and country participants.
Approval of Trackside as a betting activityLegislation to designate Trackside as a betting activity was associated with the merger of the Australian Jockey Club and Sydney Turf Club and is integral to the funding package to ensure the future viability of the State’s racing industry.
The passing of legislation to amend the Totalizator Act 1997 allowed the Minister to approve computer-simulated horseracing, harness racing or greyhound racing events as betting activities. TAB’s Trackside computer-simulated racing game was subsequently approved and commenced operation in NSW TAB outlets in January 2011.
NSW TRADE & INVESTMENT ANNUAL REPORT 2010 -11 OFFICE OF LIQUOR, GAMING AND RACING

84
The turnover for Trackside betting from its commencement to 30 June 2011 was $49 million. A proportion of the revenue will contribute to the $150 million pledged by Tabcorp for major capital improvements at Randwick Racecourse. This includes the forgoing of Government wagering tax on Trackside for the first $255 million of Trackside betting turnover per annum (up to approximately $5 million per annum).
Additional revenue generated by Trackside will also flow through to regional and country thoroughbred racing and to the greyhound racing and harness racing industries.
The Office will continue to monitor the operation of Trackside as a betting activity.
Wagering reform packageThe Wagering Legislation Amendment Act 2010 implemented initiatives to assist NSW licensed bookmakers and the TAB, which will benefit the NSW racing industry and protect the jobs of the thousands employed in the industry. The amendment:
• provides for a premium customer tax rebate
• allows betting on new events approved by the Minister responsible for racing in addition to racing and sporting events (e.g. entertainment awards)
• permits licensed bookmakers to accept internet and telephone bets from account customers at any time while operating at racecourse offices and at non-racecourse premises approved by the relevant controlling body of racing
• prohibits the operation of betting kiosks in public places, particularly in hotels and clubs.
The package of amendments enable NSW licensed wagering operators to conduct their operations more efficiently and provide better service to customers. The new arrangements also enable NSW licensed wagering operators to compete on a level footing with their counterparts in other jurisdictions.
The prohibition of betting kiosks in pubs and clubs strengthens existing gambling harm minimisation provisions and the abolition of the bookmaker’s revision committee reduces red tape.
In addition to the wagering legislation package, TAB Limited was given approval to expand its fixed odds betting operations in its retail network. Fixed odds racing betting saw an increase in 2010 -11, with a turnover of $726.8 million as at 30 June 2011.
The Office will continue to monitor the operation of licensed bookmakers and the TAB under the new arrangements.
Co-mingling of overseas totalizator poolsCo-mingling of overseas totalizator pools with NSW totalizator pools will commence in July 2011, with certain overseas jurisdictions now exempted from paying NSW betting tax on bets transferred into the NSW pools.
The NSW Government derives considerable revenue from
wagering, which is used to fund initiatives in areas such as health, education and law enforcement. The increased size of the NSW pools through co-mingling will be more attractive to punters.
The Office will closely monitor the wagering systems and operational and regulatory practices of the relevant overseas totalizator licensees to ensure that bets placed by punters through the NSW totalizator system are protected.
Business enhancement and corporate services improvement strategies
Realignment of the Office of Liquor, Gaming and RacingThe Office will implement a realigned structure to provide better service delivery, improve work practices, better inform and motivate the workforce, and to achieve efficiencies consistent with general Government directions.
The Office has already replaced the old structure with four new branches created along functional lines. This realigned the accountabilities and implemented work arrangements that reflect best practice in a regulatory environment.
As part of the realignment the Office created a new business unit dedicated to strategic industry consultation, program evaluation, program planning and regulatory design initiatives. The branch will facilitate informed, efficient and effective regulatory interventions, develop strategic direction, and improve business processes. It will also plan, implement and evaluate governance measures to promote optimal business performance and best practice in the Office’s regulatory environment.
The realigned structure will benefit clients through the implementation of:
• proactive industry engagement and stakeholder communication
• proven efficiencies and enhanced customer service, including turnaround times
• a strategic compliance program
• a more strategic approach to consultation and service delivery.
Future directionsOnline Service Delivery
Last year the Office granted over 2300 new liquor licences and approved 600 approved manager applications. However, a limited number of applications are currently available to be made online.
The Office’s Online Service Delivery project will allow more applications to be submitted online. Increased online applications will:
• reduce processing times and costs
• allow for greater tracking and accountability of applications
• raise customer awareness of the need for all corporate licensees (except registered clubs) to appoint an approved manager and allow updating of details to be completed online
OFFICE OF LIQUOR, GAMING AND RACING NSW TRADE & INVESTMENT ANNUAL REPORT 2010 -11

85
• provide increased customer satisfaction.
The new site for online liquor applications will undergo testing in 2011-12 prior to ‘going live’.
Memorandum of Understanding with ClubsNSWThe Office commenced work on implementing memorandum of understanding commitments which will help to strengthen the club industry and ensure its continued viability. Commitments will be implemented as detailed below:
• The Office will support the progression of the Gaming Machine Tax Amendment Bill 2011 in spring session 2011, implement the amended gaming machine taxation regime and implement the new ClubGRANTS scheme including the development of new guidelines to assist clubs and decision makers under the scheme.
• Work is underway to change the planning system to encourage the establishment of clubs on greenfield sites reserving central locations for club purposes and to facilitate club amalgamations (and de-amalgamations), streamline processes and encourage proactive club mergers.
• Gambling Policy commitments include:
– seek to properly regulate online gambling
– maintain existing State-wide and venue caps and not allow additional casinos
– support a system of pre-commitment that is voluntary for the player, venue-based and cost-effective
– maintain existing conditions for maximum bets, reel spin speeds, cash insertion, ATM placement and withdrawal limits, and payment of prizes by cheque
– remove limitations on installing multi-terminal gaming machines in clubs
– facilitate the introduction of new technology and games, while upholding strict harm minimisation controls
– committing to review and further extend the existing licence arrangement for KENO, providing certainty in relation to regulatory and approval processes and facilitate the introduction of new technology and games.
• Work is underway for spring session 2011 to introduce a licensing and compliance regime that directs enforcement activity and applies special licence conditions to troublesome venues, including:
– greater focus on personal responsibility
– using the extensive powers and penalties available under the Liquor Act 2007 against violent venues
– severely penalising venues that are persistently violent (including possible loss of licence)
– introducing a defence against prosecution for club managers where reasonable steps have been taken to comply with the Liquor Act 2007 and special conditions.
• Work is underway for spring session 2011 to implement key recommendations of the IPART Report on NSW Registered Clubs, including the establishment of a Club Viability Panel, introducing appropriate training for club directors and managers, and improvements to club corporate governance structures.
• Remove the ability of Government to hold royal commission style investigations into clubs and immediately rescind section 41X of the Registered Clubs Act 1976, conduct a review of the accountability provisions of the Registered Clubs Act 1976 and take action to prevent clubs and community assets falling into the hands of private interests and entrepreneurs.
Enhancements to Responsible Service of Alcohol trainingIn 2011-12 the Office will engage a consultant to develop a new RSA course. The new program, expected to be implemented in the first half of 2012, will:
• include a bridging program for people with interstate RSA qualifications
• include both a face-to-face and an online option
• include a refresher program to improve skills and update knowledge of relevant new laws, research and strategies
• focus on practical strategies that better reflect industry and Government needs and provide training that is relevant to different industry sectors
• work towards introducing a training scheme accepted in all Australian jurisdictions.
Gaming Machine Regulation: Change to business systemsThe Government Licensing System has been identified as a suitable database to hold and manage information relating to gaming machine entitlements, thresholds and associated elements. The Office has requested funding of $440 000 to develop a software solution on the Government Licensing System platform. The project is anticipated for inclusion in spring session 2011.
The project is expected to be completed in the first quarter of 2012 to:
• assist the development of online applications to improve service delivery and processing times
• facilitate better reporting and management of gaming-related data
• provide significant efficiencies for the gaming industry and regulators
• improve information management.
Streamlining the Australian/New Zealand Gaming Machine National StandardNSW is leading, with support from Queensland, a piece of work directed towards streamlining the national standards. In 2011-12, a review existing national standards and the jurisdictional appendices will be undertaken in order to establish a national baseline to facilitate national discussions
NSW TRADE & INVESTMENT ANNUAL REPORT 2010 -11 OFFICE OF LIQUOR, GAMING AND RACING
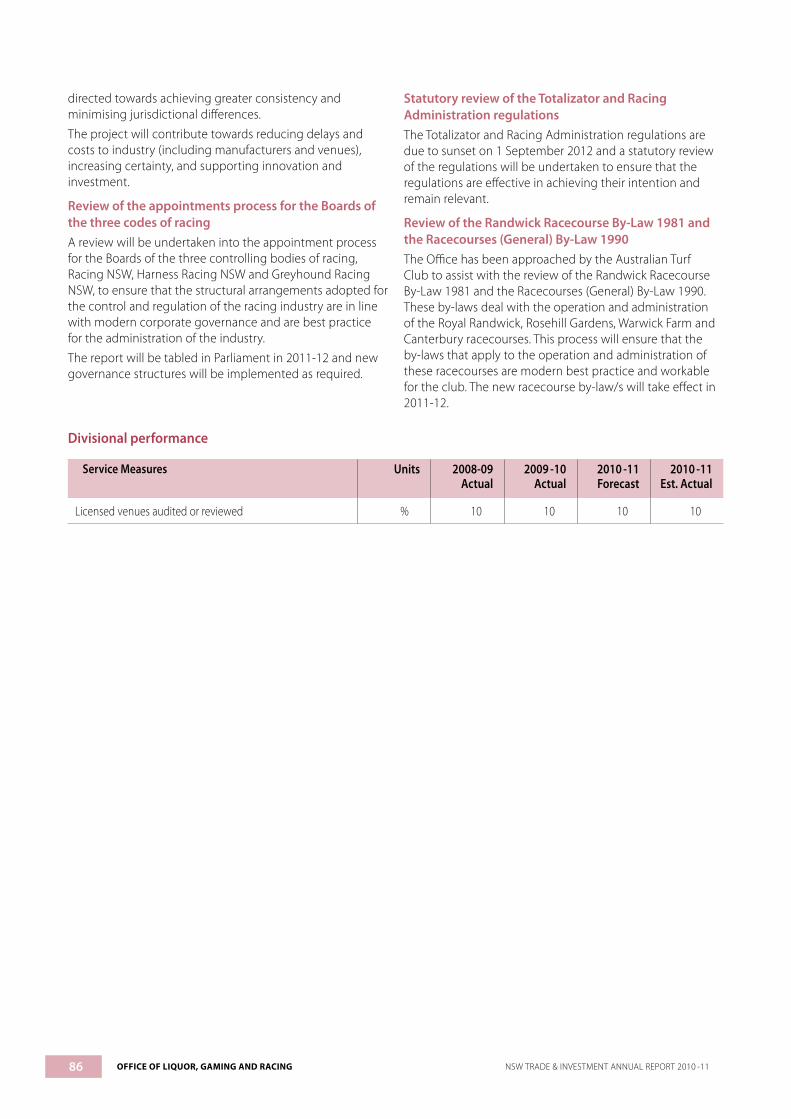
86
directed towards achieving greater consistency and minimising jurisdictional differences.
The project will contribute towards reducing delays and costs to industry (including manufacturers and venues), increasing certainty, and supporting innovation and investment.
Review of the appointments process for the Boards of the three codes of racingA review will be undertaken into the appointment process for the Boards of the three controlling bodies of racing, Racing NSW, Harness Racing NSW and Greyhound Racing NSW, to ensure that the structural arrangements adopted for the control and regulation of the racing industry are in line with modern corporate governance and are best practice for the administration of the industry.
The report will be tabled in Parliament in 2011-12 and new governance structures will be implemented as required.
Statutory review of the Totalizator and Racing Administration regulationsThe Totalizator and Racing Administration regulations are due to sunset on 1 September 2012 and a statutory review of the regulations will be undertaken to ensure that the regulations are effective in achieving their intention and remain relevant.
Review of the Randwick Racecourse By-Law 1981 and the Racecourses (General) By-Law 1990The Office has been approached by the Australian Turf Club to assist with the review of the Randwick Racecourse By-Law 1981 and the Racecourses (General) By-Law 1990. These by-laws deal with the operation and administration of the Royal Randwick, Rosehill Gardens, Warwick Farm and Canterbury racecourses. This process will ensure that the by-laws that apply to the operation and administration of these racecourses are modern best practice and workable for the club. The new racecourse by-law/s will take effect in 2011-12.
Divisional performance
Service Measures Units 2008-09Actual
2009 -10Actual
2010 -11Forecast
2010 -11Est. Actual
Licensed venues audited or reviewed % 10 10 10 10
OFFICE OF LIQUOR, GAMING AND RACING NSW TRADE & INVESTMENT ANNUAL REPORT 2010 -11
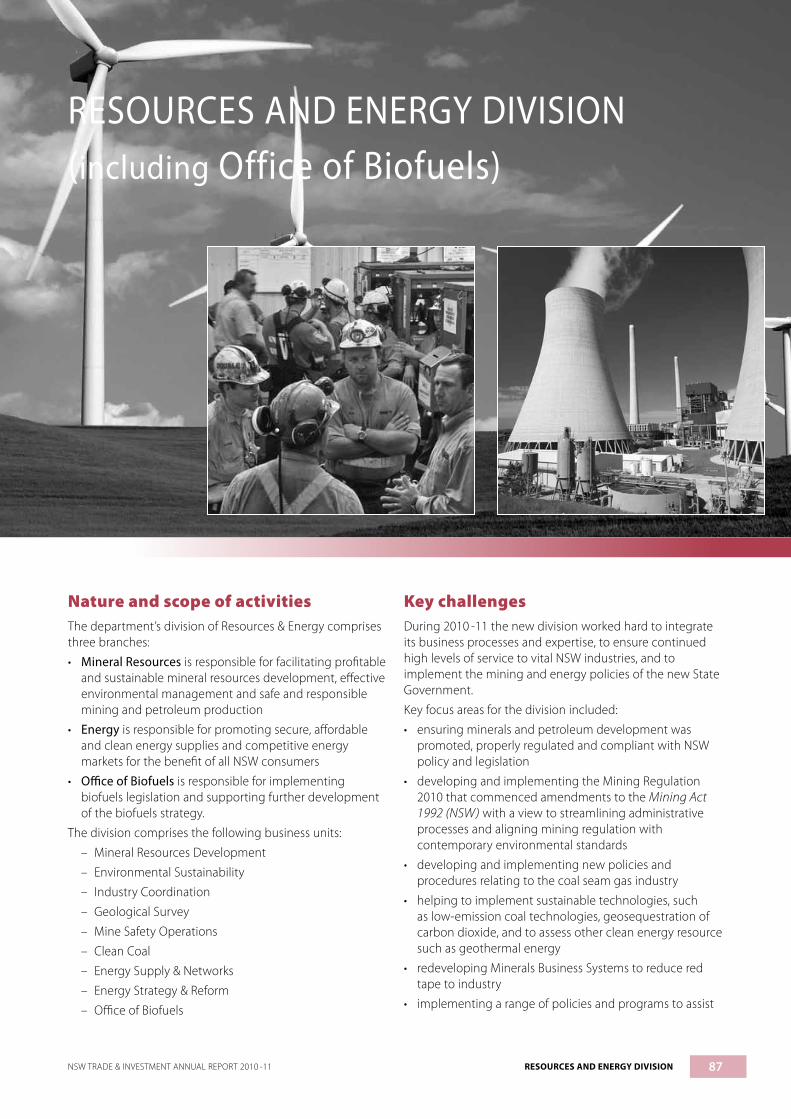
87
RESOURCES AND ENERGY DIVISION(including Office of Biofuels)
Nature and scope of activitiesThe department’s division of Resources & Energy comprises three branches:
• Mineral Resources is responsible for facilitating profitable and sustainable mineral resources development, effective environmental management and safe and responsible mining and petroleum production
• Energy is responsible for promoting secure, affordable and clean energy supplies and competitive energy markets for the benefit of all NSW consumers
• Office of Biofuels is responsible for implementing biofuels legislation and supporting further development of the biofuels strategy.
The division comprises the following business units:
– Mineral Resources Development
– Environmental Sustainability
– Industry Coordination
– Geological Survey
– Mine Safety Operations
– Clean Coal
– Energy Supply & Networks
– Energy Strategy & Reform
– Office of Biofuels
Key challengesDuring 2010 -11 the new division worked hard to integrate its business processes and expertise, to ensure continued high levels of service to vital NSW industries, and to implement the mining and energy policies of the new State Government.
Key focus areas for the division included:
• ensuring minerals and petroleum development was promoted, properly regulated and compliant with NSW policy and legislation
• developing and implementing the Mining Regulation 2010 that commenced amendments to the Mining Act 1992 (NSW) with a view to streamlining administrative processes and aligning mining regulation with contemporary environmental standards
• developing and implementing new policies and procedures relating to the coal seam gas industry
• helping to implement sustainable technologies, such as low-emission coal technologies, geosequestration of carbon dioxide, and to assess other clean energy resource such as geothermal energy
• redeveloping Minerals Business Systems to reduce red tape to industry
• implementing a range of policies and programs to assist
NSW TRADE & INVESTMENT ANNUAL REPORT 2010 -11 RESOURCES AND ENERGY DIVISION

88 RESOURCES AND ENERGY DIVISION NSW TRADE & INVESTMENT ANNUAL REPORT 2010 -11
customers facing financial difficulty to pay their bills in a time of upward pressure on electricity and gas prices
• managing the mass volume of workload generated from high levels of interest in the Solar Bonus Scheme, and closing the scheme
• commencing a review of the merger of three electricity distributors into two, with the savings generated from the merger to be used to pay for the cost of energy rebates
• implementing the second stage of the biofuels program, embodied in the Biofuel (Ethanol Content) Amendment Act 2009.
Mineral Resources
Major outcomes achieved
Increased jobs and investment across NSW
Continued strong production and royaltiesThe combined value of NSW mineral production in 2010 -11 was approximately $19.5 billion. Coal production, at over $15 billion, accounted for around 80 per cent of the total, reflecting the continued significance of the coal industry to the State. The value of metallic and industrial mineral production was approximately $4.1 billion.
NSW mining royalty figures for 2010 -11 increased by $255 million from the previous year as a result of stronger commodity prices. The net royalty collected was $1.24 billion, with $1152 million from coal and $88 million from minerals.
The graph below shows the value of mineral royalties over the period 2005 - 06 to 2010 -11
Mineral royalties
0
200
400
600
800
1000
1200
1400
2010-112009-102008-092007-082006-07
$ m
illio
n
Other Coal
Coal mine developmentWith input from the department, the NSW Government approved a number of new and expansion projects during the year:
• A mining lease for the development of the Mount Pleasant open-cut mine was granted. The deposit has reserves of 394 million tonnes of run-of-mine (ROM) thermal coal for export markets.
• The continuation of mining at Awaba Colliery was approved, increasing annual production to 880 000
tonnes of ROM coal, extending the mine life to 2015 and continued employment of 100 employees.
• Enhance Places ’ Yarraboldy extension to Pine Dale mine, extracting a further 350 000 tonnes per annum (tpa) of ROM coal and extending mine life for three years was approved in February 2011.
• The Baal Bone Colliery Continued Operations Project, approved in January 2011, involves underground mining in previously approved and remnant areas within existing mining leases, extracting up to 2.8 million tpa ROM coal.
• Extension of longwall panels and new surface infrastructure was approved in January 2011 at Ravensworth mining complex to increase ROM production to 7 million tpa.
• Development consent for Ashton Coal Mine’s Bowman’s Creek modification project was granted in December 2010. The project involves the extraction of 2.7 million tonnes of ROM coal.
• The Bowens Road North Coal Mine allows an additional 1.4 million tonnes of ROM coal to be accessed, increasing ROM coal production to 1 million tpa.
• Ulan Mine Continued Operations Project includes longwall and open-cut mining methods to produce up to 20 million tonnes of product coal a year for up to 21 years.
• Mt Arthur Mining Complex Open Cut Expansion Project involves the consolidation of all open-cut mining operations on site and increasing ROM production to up to 36 million tpa.
• Approval was granted in July 2010 for the Narrabri Coal Project Stage 2 Development for the introduction of longwall mining operations and increasing ROM coal production to 8 million tpa.
The department is undertaking a regional exploration to identify coal resources east of Mudgee/Ulan. The program commenced in February 2010 and is expected to be completed in August 2011.
Coal-seam gas developmentThe NSW coal-seam gas (CSG) industry experienced rapid growth during the year. There were a number of new development applications and exploration and production projects, some of which are listed below.
• Eastern Star Gas Ltd completed and put on line two pilots in the Gunnedah Basin. The Bibblewindi West trilateral pilot achieved ~ 2 MMscf/d (million standard cubic feet of gas per day) gas production after one month. This pilot production gas under a Petroleum Assessment Lease (PAL) is being utilised at the Wilga Park Power Station.
• AGL production-tested two exploration wells near the town of Broke the results of which, combined with the recent drilling, will form the basis for the first certified reserves in the northern Sydney Basin.
• Exploration in AGL’s Camden Gas Project led to a 52 per cent increase of the project 2P reserves to 153 PJ (petajoules), with further upgrades expected this year.

89NSW TRADE & INVESTMENT ANNUAL REPORT 2010 -11 RESOURCES AND ENERGY DIVISION
Metallic mineral developmentThe NSW metallic mineral industry experienced strong growth during the year. With input from the department, there were a number of new development applications and approvals along with assistance to many advanced exploration projects, some of which are listed below:
• Approval was granted in January 2011 for CBH Resource’s Rasp mine project for production of 750 000 tpa of zinc, lead and silver ore.
• Approval was granted in May 2011 for Cobar Consolidated Resources’ Wonawinta Silver project near Cobar. The mine is expected to produce 2.5 million oz of silver per annum over an initial project life of 5 years.
TitlesThe department processed 371 exploration licence applications and 305 renewal applications in 2010 -11. In addition, 16 new mining leases were granted and 36 were renewed. There were 3694 dealings processed for exploration and mining titles over the year. Of these, over 83 per cent were completed within the targeted timeframe.
Four new coal exploration licences were granted. Despite continuing interest in petroleum exploration, particularly coal seam gas, there was a 19 per cent decrease in the number of petroleum exploration licences compared to the previous year. Petroleum titles current in NSW include one petroleum assessment lease, 49 petroleum exploration licences, one petroleum exploration permit and six petroleum production leases.
We received and checked mine working plans for 73 operating coal mines and six metalliferous mines during the year.
Petroleum exploration investmentThe cumulative onshore exploration expenditure for conventional petroleum exploration and exploration for coal seam gas for 2010 -11 is expected to reach a projected record of $160 million. The acreage take-up, as mentioned in the preceding Titles section, is down from a record 53 petroleum exploration licences due to recent title relinquishments.
There are 19 companies exploring in the State. This record investment level demonstrates industry’s sustained confidence in the State’s coal seam gas resource potential and foreshadows continued speculation for oil and gas in frontier and unexplored areas.
New Frontiers, new dimensions, new energyThe NSW Government’s New Frontiers initiative focuses on attracting petroleum and mineral exploration investment in underexplored areas of NSW. The three-year program extends until 30 June 2011, funded at a level of $5.5 million per year. During 2010 -11, NSW Trade & Investment had the following significant results funded by the initiative:
• acquisition and release of the 120 000 km airborne geophysical survey over south-east NSW, covering the Eden, Bombala, Delegate, Cooma, Adaminaby and Brindabella regions
• commencement of acquisition of 100 000 km of airborne geophysical surveying covering part of the mineral-prospective New England Orogen and the energy-prospective Clarence-Moreton Basin. The survey covers the Glen Innes, Tenterfield, Lismore and Yetman regions
• publication and release of the 1:250 000 scale State-wide geophysical series, which includes images and gridded data sets
• publication and release of four 1:25 000 and six 1:100 000 scale maps, as well as the Explanatory Notes related to the Koonenberry Belt mapping program in far north-west NSW
• publication and release of the second Thomson Orogen geoscience DVD with a revised basement interpretation, improved depth-to-bedrock model, new age dating and new imagery
• acquisition and report on State-wide geochemical ‘overbank’ sampling of 147 catchments in NSW
• ongoing quality control and incorporation of data into the COGENT II database (see below) from approximately 50 000 fossils, 94 000 rock thin-sections, 25 000 geochemical analyses and age dates from more than 4000 rock samples
• publication and release of two DVDs containing data both from the Sydney Basin Deep Regional Seismic Survey – Phase 1, which was conducted over the Western Hunter Region, and from the Oaklands Basin Seismic Survey in the State’s Riverina district
• study results and report release of the Darling-Murray-Oaklands Basin Geothermal Assessment
• evaluation results and report release of the Bowen-Gunnedah SEEBASE study to assess the petroleum geothermal and geological storage potential for carbon dioxide
• publication and release of DVDs on the updated and latest Petroleum Data Packages on Clarence-Moreton Basin, Hunter-Mooki ‘Moratorium’ Area and Oaklands Basins Moratorium Area‘
• a pilot study of hydro-geochemistry in the Cobar region was conducted and showed that mineralisation signatures at depth can be detected with this new technique.
During 2010 -11, mineral explorers continued to make a substantial number of exploration licence applications.
Information and promotionDuring 2010 -11 extensive work was carried out to improve the information systems which provide the fundamental building blocks for mineral exploration and investment activities in NSW. The COGENT II (Common Geoscientific ENvironmenT) project – funded under the New Frontiers initiative – continued, with drill-hole information for minerals, petroleum and coal becoming the first data to be stored and delivered from the new data management system.

90
Drill-hole data from COGENT II is now published online as layers in the department’s MinView map-based information system. Many other new data layers were added to MinView in 2010 -11, including major operating mines, historical coal titles, separate mineral occurrence layers for nine important commodities, updated State-wide geology, native title layers and Indigenous land use agreements.
A new online service was implemented to enable local government to use MinView to receive notification whenever exploration title applications are submitted in local government areas. This new service will improve service delivery levels both by the department and local government.
The emphasis during 2010 -11 for the department’s online document archive, DIGS, was to increase completeness, particularly of the coal and petroleum collections. Quality control was undertaken to improve the spatial information and metadata held in DIGS.
The core libraries at Londonderry and Broken Hill continued in full operation during 2010 - 11, with a total of more than 650 visitors and 31 000 metres of core and cuttings received. Plans for the future extension of both facilities are being developed.
NSW Trade & Investment actively promoted mineral and exploration investment opportunities in NSW during the year at international industry events, including the Prospectors and Developers Association of Canada Convention in Toronto and the China Mining Conference in Beijing. The branch also hosted the annual industry seminar Exploration in the House at Parliament House, attended the Resources and Energy Symposium 2011 in Broken Hill, and co-sponsored the biannual Mines and Wines conference in Mudgee. Booth exhibition was also undertaken at the annual (Australian Petroleum Production and Exploration Association) APPEA conference in Perth.
Mineral SystemsThe Minerals Systems program (MinSys) identifies and documents the key mineral systems across NSW. The program builds on the metallogenic mapping program which documents a total of approximately 28 000 mineral deposits and occurrences covering all of the State’s major basement outcrop areas.
MinSys produced the first State-wide metallogenic map of NSW at 1:3 000 000 scale and shows all deposits and known resources with a contained metal value of $10 million or greater. This is the first in a series of synthesis products that aim to bring together knowledge about the State’s mineral resources and potential into products useful for land-use planning and the exploration industry.
The program commenced the ‘Metals in Time’ project, dating the age of major mineralisation events in NSW and the related rocks. This work is conducted with world-class researchers in several Australian universities to produce high-quality age dates as a basis for ongoing modelling of the State’s considerable mineral endowment.
National Virtual Core Library (NVCL)The department continued to work on improving knowledge of important mineral systems. During 2010 -11, hyperspectral scanning of 115 drill holes (25 000 m) of representative deposits throughout NSW was completed using the CSIRO-developed hyperspectral drill-core scanning system HyLogger IITM at our Londonderry facility. A new thermal sensor was successfully installed in the HyLogger IITM during 2010 - 11.
The HyLogger IITM is funded under the NVCL program, which is a national initiative of the Australian Government conducted as part of the National Collaborative Research Infrastructure Project and managed by AuScope Ltd.
During 2010 -11, an NVCL data management and delivery system was implemented. Data generated by the HyLogger IITM is sent daily across the web into a data storage and delivery system in Maitland. The NVCL database residing in Maitland can then be easily accessed by department geologists for analysis or online by industry and the public using AuScope-developed web service technologies via the AuScope Discovery Portal.
Sustainable management and use of natural resources
Environmental managementDuring the year, we continued to work to improve the standard of environmental management in NSW and promote sustainable mining and exploration practices.
Significant changes to the approval process for coal seam gas exploration were introduced, including interagency consultation in relation to applications for coal seam gas drilling and hydraulic fracturing. Further changes have been proposed by the Government and these will be implemented in accordance with the Government’s Strategic Regional Land Use Policy.
The long-term future of mining depends on high-quality environmental management and effective rehabilitation. The department has procedures and extensive controls in place to regulate rehabilitation and ensure that land used for mining can be effectively returned to productive future land uses. Upon commencement of relevant provisions in the Mining Amendment Act 2008, companies must submit and comply with an approved Rehabilitation and Environmental Management Plan (REMP). This will be the primary document for recording the rehabilitation methodology and monitoring rehabilitation progress. The department is currently developing new REMP guidelines in consultation with key agencies and industry.
The department continues to improve its rehabilitation security deposit process to meet Government requirements for rehabilitation security deposits to cover the full cost of rehabilitation. As at 30 June 2011, the total security held for current mining, petroleum and exploration titles in NSW exceeded $1.31 billion. This represents a substantial increase from the previous year ($1.18 billion as at 30 June 2010) and reflects the current strong mining activity in
RESOURCES AND ENERGY DIVISION NSW TRADE & INVESTMENT ANNUAL REPORT 2010 -11
91
NSW. The security deposit ensures the Government’s ability to rehabilitate sites to leading practice standards where a titleholder defaults on their rehabilitation obligations. It reinforces the Government’s commitment to the public and local communities that they are not left with a legacy of environmental and safety liabilities once mining ceases.
Derelict mines rehabilitationDuring the year, we rehabilitated 30 derelict mine sites across NSW under our Derelict Mines Program on behalf of the Government, with funding of $1.95 million. Major projects included:
• Cobbadah Clay Mine: The rehabilitation works completed this year included reshaping, topsoiling and seeding exposed and eroded areas, along with constructing drainage banks, rock-lined drains and sediment dams. These works reduced erosion and improved water quality in the downstream watercourse.
• Diggers Creek Cangai: This project involved drainage control earthworks followed by biological remediation to facilitate the establishment of ground cover. The biological remediation comprised the application of soil ameliorants, pasture seed, woodchip and controlled rotational grazing of cattle feeding on hay. Excess hay was trampled into the ground with manure to decompose and provide a growth medium. Pasture grass has established on the site, reducing the potential for future erosion.
• Cordillera: This project involved diverting clean water from above the site away from the base of heavy-metal contaminated mullock heaps by constructing diversion banks and rock-lined channels. In addition, a limestone sediment basin constructed below the site will reduce the volume of sediment leaving the site.
This year the Government provided supplement funding of $6.3 million over three financial years for major rehabilitation works at the derelict Woodsreef Mine. The Woodsreef Rehabilitation Project includes installation of a comprehensive air monitoring program, health risk assessment, a public awareness campaign to highlight the dangers of asbestos, demolition of the asbestos-contaminated eight-storey Mill House and silos, and management of Mine Road.
Subsidence managementThe Government continues to improve the quality of environmental assessment, impact prediction and management so that companies can minimise and better respond to any environmental impacts resulting from longwall coal mining.
A stringent regulatory system applies to subsidence management in NSW. All new coal mining projects are subject to approval by the Minister for Planning & Infrastructure, under the Environmental Planning and Assessment Act 1979. The planning approvals process sets the parameters of acceptable subsidence impacts for underground coalmining projects. It involves a
comprehensive merit-based assessment. Where the potential impacts of proposed mining are considered unacceptable, particularly with regard to rivers and other natural features, approval is refused or the proposal modified to reduce potential impacts.
For existing mines not yet subject to an integrated planning process, the existing Subsidence Management Plan process continues to apply. This extensive process, administered by the department, is being reviewed to better reflect the improvements and advances in technology relating to subsidence predictions and management. Prior to approval for mining activities to commence, Subsidence Management Plans are assessed by representatives of the responsible dam safety, environment, planning, subsidence and water Departments and Boards.
In 2010 -11, five extraction approvals, nine first-working approvals, and 31 variations were approved.
In 2010 -11 the department’s Mine Subsidence engineering group:
• completed assessment of 63 mining applications
• contributed significant regulatory management and technical leadership for successful management of risks of longwall mining under the Sydney to Melbourne Railway and Hume Highway
• published of three groundbreaking research papers in the field of mine subsidence engineering
• was awarded a $500 000 Australian Coal Association Research Program grant to undertake research in mine subsidence engineering.
Land-use planningThe department’s Mineral Resources Land Use team maintained its critically important role of providing advice to local councils and the Department of Planning and Infrastructure.
New comprehensive local environmental plans (LEPs) are being prepared for all 152 local government areas in the State using the new standard LEP template. During the past 12 months, they provided input into 28 comprehensive LEPs. Input was also provided into the development of local and regional planning strategies, including the NSW Government’s Strategic Regional Land Use Policy.
The team continued to assess the potential impacts of proposed National Parks and other conservation reserves on mineral resources, and to provide advice on these proposals to the NSW Office of Environment & Heritage (OEH).
An important Memorandum of Understanding between NSW Trade & Investment and OEH was revised and updated this year. The MoU covers a number of operational issues including consultation, dispute resolution, data management and exchange, access to reserves for research purposes and referencing of reserve proposals.
NSW resource auditIn 2007, the department commenced a resources audit of the entire State to provide data on the location of mineral
NSW TRADE & INVESTMENT ANNUAL REPORT 2010 -11 RESOURCES AND ENERGY DIVISION
92
and extractive resources to councils and the Department of Planning and Infrastructure. The information will help councils in preparing their new comprehensive LEPs and in assessing development applications and rezoning proposals. It is being progressively supplied to councils and the Department of Planning and Infrastructure as data packages. The audit is scheduled for completion by mid 2012.
Data packages for a further 15 Local Government Area’s (LGA’s) were completed in 2010 -11, bringing the total number released to date to 22. An additional 14 data packages will be released shortly. Work on the remaining LGAs is well advanced, and mapping and draft reports have been completed for approximately 90 per cent of these.
Greenhouse gas researchAs a member of the Carbon Storage Taskforce and the Global Carbon Capture and Storage Institute, the department played an integral role in national greenhouse gas research initiatives. During the year we continued our support for the Cooperative Research Centre for Greenhouse Gas Technologies, which has now demonstrated storage capacity of over 65 000 tonnes of carbon dioxide in a deep rock formation in the Otway Basin.
Low emission coal technologies (clean coal)The Clean Coal Administration Act 2008 is administered by the Minister Resources and Energy. The Act established:
• a Clean Coal Fund to provide funding for low-emission, clean coal technologies. The NSW 2010 -11 Budget allocated funds of $21.5 million to the Clean Coal Fund
• the Clean Coal Council, which receives secretariat and administrative support from Mineral Resources branch. The council makes recommendations to the Minister concerning funding of projects and policies to encourage development of clean coal technologies.
During 2010 -11, NSW Trade & Investment assisted the Clean Coal Council whose work has been centred on the following:
• Delta Carbon Capture and Storage Demonstration Project: Stage 1 commenced in March 2010 and received $28.3 million in funding, provided equally by the Australian Government, NSW Government and Australian Coal Association Low Emissions Technology (ACALET). It comprises planning approvals, storage assessment and initial planning and design. The project aims to demonstrate successful capture, transport and storage of 100 000 tonnes of carbon dioxide annually.
• A $54 million business plan developed by NSW Trade & Investment for State-wide assessment of carbon dioxide storage capacity. The Regional Stratigraphic Drilling Program aims to identify and model the carbon storage potential of deep rock units in NSW. NSW is currently finalising funding agreements with the Commonwealth and ACALET for equal funding with NSW.
Stage 1 of the drilling program included:
• Rehabilitation of the first two drill sites, at Munmorah and Vales Point on the Central Coast (in conjunction with Delta Electricity).
• Completion of the third borehole at Merriwa in the north-west of the Sydney Basin in June 2010. Core analysis results have been examined and injection modelling work for CO2 storage capacity is being carried out. Initial site rehabilitation has been completed.
• The fourth borehole in the Sydney–Gunnedah Basin at Cattle Creek, west of the Liverpool Ranges, was completed in the second quarter of 2011. Core analysis and testing is progressing and injectivity modelling will develop in concert with the Merriwa work.
Planning of Stage 2 of the program, exploring the regional stratigraphy in the Darling Basin, has commenced.
The Clean Coal Fund currently supports nine research and development programs in the field of low-emission coal technologies:
Fugitive emissions – Centennial Mandalong Pty Ltd: $2.2 million to trial
an exciting new technology termed a VAM-RAB (Ventilation Air Methane Regenerative After Burner) that promises to mitigate fugitive methane emissions escaping from underground coalmines.
– CSIRO: $1 million to undertake a world-first trial to confirm whether the volume of methane gas drained from a NSW coalmine can be dramatically increased before open-cut mining commences. This is, in essence, a step towards creating a ‘greenhouse gasless mine‘.
Combustion efficiency – University of Newcastle: $0.56 million to research
and develop a Direct Carbon Fuel Cell with very high thermal efficiencies.
– University of Newcastle: $0.85 million to undertake research into a novel way of producing pure oxygen for use in the efficient burning of coal to generate electricity.
– UCC Energy Pty Ltd: up to $2.5 million to further develop their process of producing ultra-clean coal and assessing its use as a coal-water fuel for firing in diesel engines to generate electricity, after the completion of a ‘Life Cycles Assessment’.
Post-combustion capture technology – CSIRO: $1.58 million to support a research and
development program dedicated to the chemical capture of CO2 emitted in the flue gas from NSW coal-fired power stations.
– CSIRO: $0.6 million to investigate the ability of a novel, patented carbon-fibre composite honeycomb-structured technology to physically separate out the CO2 from the flue gas emitted from NSW coal-fired power stations.
RESOURCES AND ENERGY DIVISION NSW TRADE & INVESTMENT ANNUAL REPORT 2010 -11

93
Storage efficiency – University of Newcastle and GreenMag Group: $3.04
million to develop and optimise a mineral carbonation process that takes advantage of a natural process whereby CO2 is captured in mineral deposits resulting in it being stored in rocks. A key advantage of this process is that the CO2 is permanently stored in the rocks.
Public consultation and community awareness – University of Newcastle: $0.66 million to use an
innovative approach to understand the network of relations between industry, society and government that impact on public acceptance of low-emission coal technologies.
Safe, healthy and biosecure industriesMine safety within the department is comprised of two business units: Mine Safety Operations (MSO) and Mine Safety Performance (MSP).
Mining industry operates to best practice health and safety standardsIn 2010 -11 our Mine Safety Operations Branch continued to enforce the Occupational Health and Safety Act 2000, Coal Mine Health and Safety Act 2002, Mine Health and Safety Act 2004 and the Petroleum (Onshore) Act 1991 for:
• 84 coalmines and preparation plants
• 2289 metalliferous and extractive mines and 148 other mines
• 4 coal and 496 metalliferous exploration licences
• 82 petroleum and geothermal titles.
This work involved:
• assessing and enforcing standards and compliance
• investigating incidents and complaints
• undertaking campaigns to educate stakeholders and communicate requirements
• authorising activities, equipment, materials and substances for use.
A number of recommendations arising from the 2004 Wran Mine Safety Review were completed for metalliferous mines and quarries this financial year. Recommendations 4,17,18 and 25 required, among other things, that audits be carried out to test the legislative compliance of the metalliferous and extractive industry with regard to safety management plans and contractor management plans. Over 400 audits were conducted across a number of mine sites in NSW.
The Safety Audit Report: ‘Metalliferous and Extractive Mines 2011’ provides tangible evidence of areas where compliance with the legislation could be improved. However, the audit also showed that many in the industry are committed to improving health and safety management systems. Feedback has been provided to all participants and guidance and assistance is being provided where necessary.
MSO had major input into the National Mine Safety Framework drafting instructions for both Workplace
Health and Safety core mining Regulations and the NSW/Queensland/Western Australia non-core Mining Regulations.
During the year MSO held over 30 safety and legislation workshops, attended by over 300 people.
The department’s 20th annual Mechanical and Electrical Engineering Safety Seminars were held at Sydney Olympic Park in 2010 and attracted approximately 500 industry stakeholders. These seminars are a valuable source of information for the industry and attract participants and keynote speakers from around the world.
The department’s Mine Safety Technology Centre (MSTC) continued to provide analytical services, mobile gas laboratories, mining occupational hygiene, equipment compliance testing and certification, and electrical safety evaluations. During the year MSTC commissioned new apparatus to test equipment for electromagnetic compatibility – a new field of growing importance for the safe operation of mines.
Mine Safety PerformanceOur Mine Safety Performance branch works closely with employers, mine workers, other Government agencies and the community to promote world’s best practice in the area of mine health and safety, to manage risks through consultation and safe systems and work toward the Government’s goal of zero fatalities and serious injuries.
The branch provides a regulatory framework and standards, training and assistance, and communication and performance reporting, all with the aim of significantly improving the safety culture and performance of the mining and extractives industry. The branch also has a Mine Safety Investigation Unit, which carries out high-level investigations into major incidents.
Mine Safety Advisory CouncilThe Mine Safety Advisory Council, supported by its secretariat within the Mine Safety Performance branch, completed actions to address the recommendations of the Wran Mine Safety Review.
Important information on associated non-technical skills, health management and mine-site health indices have been developed and endorsed by the Council. The Council also oversees the implementation of targeted State-wide education and assistance programs for the industry. Programs on the risk management of fatigue, health and musculoskeletal disorders are run by the department’s Mining Industry Assistance Unit.
The industry has now agreed to the collection of lead health indices from mines to develop a health measurement baseline. In time this will allow the Council to monitor the effect of various initiatives proposed by the Health Management Advisory Committee.
The Council, through its OHS Culture Working Party, is implementing a major project to promote occupational health and safety culture change and the usefulness of associated non-technical skills. As part of its communication strategy the Council has successfully piloted a young drivers
NSW TRADE & INVESTMENT ANNUAL REPORT 2010 -11 RESOURCES AND ENERGY DIVISION

94
safety program in Cobar and a community health and safety grants scheme in the Mudgee area.
Mining Industry Assistance UnitThe department’s Mining Industry Assistance Unit (IAU) continued its delivery of a series of workshops for the mining and extractives industry throughout NSW on developing and implementing health and fatigue management plans and managing musculoskeletal disorders. These workshops promoted the industry-agreed desirable approaches to managing occupational health issues arising from hazards such as exposures to dust, noise, diesel particulate, and manual tasks and fatigue. In excess of 650 people attended the workshops held throughout the year.
The IAU produced a suite of fact sheets on health indices to provide guidance to industry on how to develop and implement a proactive approach to the management of the priority health issues.
The world-leading OHS culture pilot project was completed in 2011. The pilot produced an OHS culture data collection and assessment kit and a site-based workshop program aimed at addressing and improving OHS culture. In May 2011, 15 industry representatives from companies, unions and the regulator participated in a four-day workshop to review the above products and consider how these may be promoted to benchmark and monitor industry progress towards a world-leading OHS culture.
Mining competency standardsThe Coal Competence Board met twice with the Queensland Board of Examiners to discuss issues of mutual interest. The boards have established a joint working group to help achieve greater consistency between the two states. Agreement was reached on a work experience logbook template for prospective applicants for a certificate of competence.
Industry feedback on proposed changes to the requirements for certificates of competence was sought by the Coal Competence Board and the Metalliferous Mines and Extractive Industries Competence Board.
The Metalliferous Mines and Extractive Industries Competence Board undertook the development of a training course for site check inspectors and health and safety representatives.
Mining industry safety performanceThere was one fatality in the NSW mining and extractives industry in 2010 -11. This tragic event occurred in an underground coal mine in June 2011. Despite this fatality the industry has continued its decade-long downward trend in the fatal injury frequency rate. There have been 13 mining workplace fatalities in the past decade, eight of them in the coal sector. This compares to 71 fatalities, 43 of them in coal, in the decade to June 2001.
Serious bodily injury numbers in the coal sector fell from 32 to 28, while in metalliferous and extractives rose from 8 to 9 compared to last year. Both these results remain in the
record low range achieved in the previous three years.
At the time of reporting, five-year average rates for all three key measures appear to continue their long-term downward trend. Coal worker numbers appear to have risen slightly in 2010 -11, while metalliferous employment increased sharply and extractives employment declined slightly. The number of hours worked increased by less than 10 per cent in coal, by more than 10 per in metalliferous and was static in the extractives sector.
Mining industry safety performance statisticsReporting thresholds for many hazards and injury outcomes were changed in the Coal Mine Health and Safety Regulation 2006 and Mine Health and Safety Regulation 2007. The changes were detailed in the NSW Mine Safety Performance Report 1 July 2007 to 30 June 2009.
More detailed injury statistics for the financial year, including mechanisms, agencies and nature of injury, bodily locations, numbers of hospital admissions, loss of consciousness or seven days off normal duties will be published in December 2011 after final notifications and data quality reviews.
Other incident trends included a rise in notifications of underground coal gas detection, a 10 per cent fall in high-pressure fluid escapes, and an increase of 10 per cent in unintended activations, movements or rollovers of vehicles or machinery.
Mine Safety LevyThe State Government’s Mine Safety Levy funds the mine safety regulatory functions. The levy reflects the costs associated with regulating mine safety in NSW. It is based on the wages of employees in the mining and extractive industry and is collected through WorkCover NSW and Coal Mines Insurance Pty Limited.
In February 2011 the levy was set at $27.590 million for 2011-12, representing 0.899 per cent of industry wages; this was a small increase from the 0.847 per cent set in 2010 -11.
National model occupational health and safety laws and National Mine Safety FrameworkThe NSW Government committed to developing and implementing nationally uniform work health and safety (WHS) laws and nationally consistent mine health and safety legislation.
WorkCover NSW will administer the nationally harmonised WHS legislation for general industry in NSW while the department will continue to regulate the legislation at mining workplaces. In addition, the department will administer the mine-specific legislation being developed under the National Mine Safety Framework (NMSF).
The department’s Mine Safety Performance branch played a key role in the development of nationally consistent mine health and safety legislation. The branch’s input will ensure that mine safety legislation protects NSW mineworkers, who often work in the most dangerous circumstances.
The development of consistent mine safety legislation will also assist mine operators by coordinating legislative
RESOURCES AND ENERGY DIVISION NSW TRADE & INVESTMENT ANNUAL REPORT 2010 -11

95
provisions in relation to worker skills and competencies across Australia’s three largest mining states. This will enable workers to have their competencies assessed in one State and recognised by the other jurisdictions. It will provide direct benefits to mining companies who will have a greater pool of experienced workers to draw upon and have greater certainty that these workers will ably undertake their safety related functions.
Mining accident/incident investigationThe department’s Investigation Unit continued its efforts to improve mine safety during the year. Where death or serious injury occurred, investigators led formal investigations into the system failures and causes contributing to the incident, and made recommendations for mine safety improvement.
Investigation reports were published on the Mine Safety website to assist with the available body of knowledge about accident causation. Investigation findings were
referred for consideration for legal proceedings where appropriate.
In 2010 -11, investigators completed two investigations, and legal proceedings were commenced in relation to a number of previously concluded investigations.
Performance statistics 2008-09 2009 -10 2010 -11Investigations commenced 8 3 5Investigations completed 5 2 7Investigations in field stage at the end of year
7 8 6
Investigation reports submitted to the Coroner
1 1 2
Coronial inquests commenced 0 0 0Prosecutions commenced 10 5 8Successful prosecutions 5 10 3Unsuccessful prosecutions 0 0 0
Safety performance statistics
2008-09 2009 -10 2010 -11Fatalities Coal 3 - 1
Petroleum (Onshore) - 1 -Serious bodily Injuries Coal2 28 32 28
Non-coal2 15 8 9Petroleum (onshore)4 1 4 -
Lost-time injury frequency rate (per million hours worked)3
All coal 8.19 7.11 6.08All metalliferous and extractives 6.91 6.36 4.08Coal underground 13.52 11.86 11.50Metalliferous underground 4.10 6.00 3.69
Notified incidents, coal All 2 568 2 742 2 752Accumulation of gas - Cl 56(1)(g) 806 796 925Unintended activation of plant - Cl 56(1)(p) 247 300 332Escape of fluid under pressure - Cl 56(1)(o) 282 210 190Non-specific incidents resulting in a notifiable injury or outcome - including Cl 55(b), Cl 56(1)(a)
437 434 417
In-service failure of explosion protection features - Cl 56(1)(m) 322 477 344Notified incidents, non-coal
All 220 267 266Uncontrolled explosion or fire - Cl 145(e) 42 49 45Loss of control of vehicle or machinery - Cl 145(j) 17 21 16Overturning of vehicle or machinery – Cl 145(k) 14 17 25Unplanned fall of ground – Cl 145(n) 8 19 20Non-specific incidents resulting in a notifiable injury or outcome - including Cl 145(b), Cl 146(1)(a)
22 31 42
Notified incidents, petroleum (onshore)4
All 3 10 2
The table above reflects notifications under the following legislation:Coal: CMHSA 2002 and CMHSR 2006 Non-Coal: To 31/08/2008 -MIA 1901, MIGR 2000 From 01/09/2008 – MHSA 2004, MHSR 2007Petroleum: Petroleum (Onshore) Act 1992 ScheduleNotes:1. All recent workforce and injury data should be considered preliminary and therefore subject to change.2. Injuries formerly identified as serious (bodily) injury under previous legislation are directly comparable to those now counted based upon notifiable
nature of injury definitions in CMHSR 2006 and MHSR 2007.3. Lost-time injury frequency rates are now reported from the quarterly reports directly received from mine operators. Non-Coal 2008 - 09 rates are based
on nine months of data. Extracted from COMET database as at 5 September 2011. Lost-time injuries to non-mine employees such as contractors and tradespersons could be underreported unless the date they resumed work (i.e. with their external employer) was reported back to the mine.
4. Improved contact with onshore petroleum operators is retrospectively identifying past incidents and injuries not captured previously. Since this is an ongoing trend, all petroleum numbers should be considered preliminary and subject to change.
NSW TRADE & INVESTMENT ANNUAL REPORT 2010 -11 RESOURCES AND ENERGY DIVISION
96
Positive business environment
Strategic Regional Land Use Policy implementation In May 2011, the incoming NSW Government introduced the Strategic Regional Land Use Policy with the aim of striking the balance between the agriculture, mining and energy sectors, while ensuring the protection of high value conservation lands. The department has carriage of some elements of this policy, and has progressed these responsibilities through three specific projects focusing on:
• an audit of exploration licences
• regulation of coal seam gas industry activities
• community input before the grant of new exploration licences.
We also implemented the new Government’s commitments to:
• place an immediate 60-day moratorium on the granting of new coal, coal seam gas and petroleum exploration licences in NSW
• extend the moratorium on hydraulic fracturing (fraccing) approvals until 31 December 2011.
Mining Regulation 2010Following detailed review by the NSW Government of the mining regulatory framework, substantial amendments to the Mining Act 1992 (NSW) were enacted in May 2008. The amendments streamline administrative processes and align mining regulation with contemporary environmental standards and legislation. To fully implement the amendments, the Mining Regulation 2003 was updated and replaced with the Mining Regulation 2010. The regulation provides for increased environmental protection, processes for significant improvement claims, penalty notice offences, service fees, fossicking provisions and information to accompany title applications.
Also, on 15 November 2010 most un-commenced provisions of the Mining Amendment Act 2008 were proclaimed, except for the amendments to some provisions that will require further review. The department is completing a number of guidelines, forms and delegations required under the legislation and is developing a range of support processes for the new regulatory framework under the Mining Act 1992 and the Mining Regulation 2010, including new procedures and education and communication materials for staff and industry.
Addressing community concernsDuring 2010 -11 the NSW Government maintained a number of community consultative committees representing industry, community, local government and NSW Trade & Investment. These committees provide an effective channel of communication between project proponents and the local community, allowing for community involvement in the ongoing exploration process.
The Namoi Catchment Water Study A Ministerial Oversight Committee to monitor the progress
of the study was established. The purpose of this study is to assist the Government to evaluate potential impacts of coal and gas exploration and mining activities or developments on water resources within the Namoi catchment.
Abandoned Mines Working GroupThe Abandoned Mines Working Group was established as a working group of the Ministerial Council on Mining and Petroleum Resources (MCMPR) and includes representatives from the Queensland, Western Australian, Tasmanina, South Australian and Commonwealth governments, the Minerals Council of Australia, and the SMI Knowledge Transfer (formerly the Australian Centre for Minerals Extension and Research).
The Strategic Framework for Managing Abandoned Mines (the Framework) was published and is available on the Commonwealth’s Department of Resources, Energy and Tourism website. The framework will form part of the MCMPR Strategic Framework Series. The Framework addresses valuing abandoned mines, data, risk assessment and management, resourcing and partnership opportunities, information sharing, and leading practice. It also provides case studies that highlight leading practice management that have resulted in both environmental and social benefits, as well as innovative and sustainable re-use of abandoned sites.
No further priorities for the Abandoned Mines Working Group have been assessed or approved by the MCMPR. The Working Group has proposed to continue its activities, such as developing further technical material on an informal basis outside of MCMPR.
Public engagement and educationDuring the year, we continued to educate both industry and the community regarding rehabilitation management, mine closure and improved environmental standards for exploration.
Our Environmental Sustainability unit presented on the subject of mine rehabilitation and changes to the regulatory processes for mining and exploration at a number of forums, including the:
• NSW Minerals Council Environment and Community Conference in September 2010
• Mines and Extractive Environment Team meeting in Mudgee in April 2011 and May 2011 in Cobar
• Hunter Coal Environmental Group at Singleton, an informal association for mine-based environmental professionals in the Hunter Valley.
Energy
Major outcomes achieved
Secure, efficient and affordable energy supplies
Energy supply and networks performance Electricity reliability achieved a target result of 99.9762 per
RESOURCES AND ENERGY DIVISION NSW TRADE & INVESTMENT ANNUAL REPORT 2010 -11

97
cent (or an average of 125.2 minutes without supply per customer), marginally better than the State Plan target for 2010 -11 of 126 minutes without supply. This performance reflects the more normal weather patterns that persisted through 2010 - 11.
Two new projects were completed to enhance the supply of natural gas in NSW:
• a new compressor on the Marsden to Dubbo pipeline
• a 60 km looping of the interconnect pipeline north of Bowman.
Approval was granted to enable the Sydney to Newcastle gas pipeline to be relocated over a short distance to enable construction of the Hunter Expressway Project to commence.
Reducing greenhouse gas emissions and supporting energy savingsDuring 2010 -11 the department oversaw the following programs to reduce greenhouse gas emissions, support energy savings and encourage the uptake of renewable energy:
• NSW Solar Bonus Scheme
• NSW Energy Savings Scheme
• NSW Greenhouse Gas Reduction Scheme
• GreenPower
• National Minimum Energy Performance Standards and labelling.
One of the department’s primary focuses was on the Solar Bonus Scheme, which created significant workload, reflecting the high levels of interest in the Scheme. The Statutory Review of the Scheme commenced in August 2010 once formal reports had been received from the network businesses in July indicating that the 50 MW review trigger had been reached.
The review assessed whether the policy objectives of the Scheme were still valid and whether the terms of the Electricity Supply Act 1995 were still appropriate for securing those objectives. These objectives were and are to:
• encourage and support persons who want to generate renewable energy as a response to climate change
• develop jobs in the renewable energy sector by assisting renewable energy generation to compete with non-renewable energy generation
• increase public exposure to renewable energy technology in order to encourage the whole community to respond.
The review found that the Scheme had met the first and third objectives, but at substantial cost.
In October 2010 the Parliament legislated changes to the scheme to reduce the tariff payment from 60 cents to 20 cents and provide for a 300 MW cap.
The Scheme was formally closed on 1 July 2011 to new connections and regulatory amendments were made to allow all customers who had submitted applications by midnight 28 April 2011 to join the Scheme. We also
undertook a range of compliance and risk management activities in regards to the Scheme, including working with NSW Fair Trading and appointing RSM Bird Cameron to undertake a compliance audit.
Other activities undertaken in support of the above programs include:
• a review of the inclusion of showerheads in the Energy Savings Scheme. The review recommended a number of amendments to the Energy Savings Rule to strengthen the requirements around the crediting of showerhead activities. These changes took effect on 24 December 2010
• introduction of new energy performance standards and energy labelling for televisions, new standards for lighting products, revised energy labelling for refrigerators, freezers and room air conditioners, and more stringent standards for room air conditioners. The energy performance standards program saves around 3600 GWh of electricity each year
• ongoing development of a national legislative framework for mandatory energy performance standards and labelling
• amendments to the Greenhouse Gas Reduction Scheme (GGAS) to allow existing accredited certificate providers to continue to create certificates following a change in company name.
National energy markets: efficient and affordable energy suppliesNSW Trade & Investment continued to support the Minister for Resources and Energy in representing NSW on the Council on Australian Government’s (COAG) Ministerial Council on Energy (MCE). The Ministerial Council oversees and coordinates national policy development to address the opportunities and challenges facing Australia’s energy sector. Its 2010 -11 work program involved major reform initiatives for continued development of the gas market and a national energy consumer protection framework. We also played a key role in the policy development and implementation of these initiatives.
As part of a larger and ongoing energy reform strategy, the branch continued to work towards national harmonisation of energy retail consumer protection regulation through the National Energy Customer Framework (NECF). A key milestone in this project was achieved in March 2011 when the NECF legislation was passed by the South Australian parliament (as the lead legislature for the NECF). The department is currently undertaking the significant tasks associated with implementation of the NECF in NSW as six jurisdictions work cooperatively towards a target commencement date of 1 July 2012.
On 1 September 2010 the Short Term Trading Market (STTM) for wholesale gas trading commenced operating in NSW and South Australia. The STTM was introduced to improve market and pricing signals for wholesale trading of natural gas supplies through the establishment of trading hubs at Sydney and Adelaide. The department coordinated advice
NSW TRADE & INVESTMENT ANNUAL REPORT 2010 -11 RESOURCES AND ENERGY DIVISION

98
to the Minister on STTM commencement and also on the development of plans to extend the market to include the establishment of a Brisbane STTM hub towards the end of 2011.
We also provided advice and support to the Minister in relation to the Ministerial Council and COAG decisions on:
• appointments to key positions to the Australian Energy Regulator and the Australian Energy Market Operator
• identification and management of factors affecting secure, reliable and affordable energy supplies
• reform of the Ministerial Council system, which will involve amalgamation of the Ministerial Council on Energy and the Ministerial Council on Mineral and Petroleum Resources to form a new body, the Standing Council on Energy and Resources.
Affordable energy supplies for consumersNSW has a robust regulatory framework that safeguards a reliable, safe, low-cost and environmentally sustainable energy supply for the community. Its strong consumer protection framework recognises electricity as an essential service. Over 2010 -11, the department implemented a range of policies and programs to assist customers facing financial difficulty to pay their bills in a time of upward pressure on electricity and gas prices. Significant energy consumer programs were undertaken during the year including:
• In conjunction with IPART, the department introduced a Price Comparison Service (myenergyoffers.com) in October 2010 to provide information to customers to allow them to shop around for competitive energy deals in their area. As part of the implementation of the Service, the Government Contact Centre was engaged to accept phone calls from customers through the Energy Information Line. This service was established to provide equality of access for customers to energy price comparison activities where customers may not have had access to, or the ability to use the Service independently. This includes provisions for the hearing impaired as well as the use of interpreter services.
• Development and launch (16 December 2010) of an Energy Assistance Guide and accompanying fact sheets, available on the NSW Trade & Investment website. These resources are designed to make it easier for community sector employees to provide information and assistance to households seeking help managing energy costs and dealing with retailers. The guide outlines customer rights, billing information, and details what rebates and programs are available to help people identify and tap into support services more easily. The department distributed over 5000 printed copies of the guide and fact sheets to a wide range of organisations. We are also in the process of updating the guide to take account of new developments in 2011, including new rebates.
• The department prepared for the implementation of the new Low Income Household Rebate, replacing the former Energy Rebate. The new rebate commenced 1 July 2011
and increased the rebate available to eligible customers from $145 per year to $200 per year. The Medical Energy Rebate will also be increased to remain in line with the Low Income Household Rebate.
Departmental staff delivered presentations on energy assistance measures at community sector forums organised by a variety of stakeholders, and provided energy-specific training at workshops organised by the Financial Counsellors Association of NSW (FCAN). Locations for these presentations and training sessions included Sydney, Albury, Lismore, Dubbo, Rutherford, Broken Hill, Tamworth, Wagga Wagga, Newcastle, Campbelltown and Tumbi Umbi. They also presented at the Energy and Water Ombudsman NSW’s Anti-Poverty Week forum in Coffs Harbour in October 2010.
During the latter half of 2010, FCAN conducted training in Forbes, Lismore, Sydney and Newcastle under the terms of a funding agreement with the department. Participants came from welfare organisations servicing a wide range of communities, including Broken Hill, Wilcannia, Wagga Wagga, Lismore, Wollongong, Sydney and the Central Coast. Training for financial counsellors will continue during 2011, with a course in Tamworth completed and more planned for Bathurst, Sydney, Wollongong, and Moree.
The department’s Energy Information Line (1300 136 888), provides assistance to NSW households and businesses on a range of energy matters. Approximately 12 000 calls were made to the line over the course of the year, with queries predominantly from households about energy financial assistance measures and the Solar Bonus Scheme. The 2010 -11 year marked the first full year of the service being outsourced to NSW Fair Trading’s Government Contact Centre. The department was active in providing training and undertaking other quality control activities to ensure a high quality of service and accuracy of information is provided to those calling the line. The average wait time for customers calling the line was just over 30 seconds, and the average call handling time was approximately five minutes.
A review of the Energy Accounts Payment Assistance Scheme was conducted. The scheme is designed to assist those who are financially disadvantaged and who experience difficulty in making energy account payments.
Energy supply and networks policyDuring the year, NSW Trade & Investment continued its work with other jurisdictions as part of the MCE national energy reform agenda in relation to energy networks. This work included developing market procedures and consumer protection policies to support smart-metering technology. The national agenda also covers electricity distribution planning, with particular focus on measures to support non-network alternatives to network expansion and demand management options.
In parallel with the National Energy Customer Framework development, Energy branch engaged with other jurisdictions and stakeholders to develop a National Connections Framework. The Framework, contained in new chapters 5A of the National Electricity Rules and 12A of the
RESOURCES AND ENERGY DIVISION NSW TRADE & INVESTMENT ANNUAL REPORT 2010 -11

99
National Gas Rules, will provide retail energy customers and non-market embedded generators with a clearly defined national regime for connecting to gas and electricity distribution systems.
This work complements the existing contestable works regime in NSW, through which customers can select who will install their electricity connections. Policy development in relation to national connection contestability options and potential pioneer customer reimbursement schemes for natural gas networks was also undertaken.
The department continued its review of the arrangements for public lighting in NSW, which has involved an18-month consultation program with three rounds of public submissions.
In the area of safety and technical regulation the branch was involved with the development of an Intergovernmental Agreement on Energy Supply Industry Safety. When commenced, the Agreement will establish a reform program leading to harmonisation of the regulation of the gas and electricity transmission and distribution industries in relation to safety and technical matters related to safety. The Agreement will also establish the Energy Supply Industry Safety Committee as a permanent national committee with the role of advising governments on the development and implementation of a nationally harmonised framework for energy supply industry safety.
Work commenced on an Australian Standard for Energy Network Safety Systems. The department was involved with development of safety managements system in the gas distribution and transmission pipeline standards which will form the basis of the new Standard.
Energy modelling and analysis The department’s Modelling and Analysis Business Unit provides ongoing advice and data to NSW Trade & Investment and to several other NSW Government agencies. It provides data collection, analysis and modelling services to help underpin sound policy development, implementation and review. It undertakes extensive analysis and modelling in areas related to energy supply–demand, energy markets, renewable energies, energy prices, energy efficiency and greenhouse gas emissions.
Government target to achieve 20 per cent renewable energy consumption by 2020 Electricity from renewables represents a small but growing proportion of NSW consumption. The share of renewable electricity consumption in 2010 was 12 per cent of the total NSW electricity consumption, a substantial improvement on the 7 per cent 2009 share. The remainder of the electricity supply comes from coal, at 82.6 per cent, and natural gas, at 5.5 per cent.
Total renewable energy consumption in NSW fluctuates from year to year, reflecting variations in output from the Snowy Mountains Hydro Electricity Scheme based on the availability of water. However, electricity consumption from renewable energy sources other than the Snowy Hydro has
increased sevenfold from 1 per cent in 2001 to 7.3 per cent in 2010.
Contestable services in electricityOver 1400 electrical contractors are accredited, under the NSW Accredited Service Provider scheme, to provide a range of services to customers related to connection to the electricity distribution network. These services have a total value of over $300 million per year. Following a public review, the scheme was transferred from NSW Fair Trading to NSW Trade & Investment in September 2010.
An industry-based advisory group was established, comprised of key external stakeholders. The department undertook consultation with this group on the detailed implementation of other reforms arising from the review. Particular attention was paid to accreditation criteria, compliance performance, accreditation for individuals and increased resources to support these new functions.
Regulatory and administrative framework projectsA major joint review of the corrosion protection systems regulation was conducted in conjunction with the Better Regulation Office. The review considered a range of regulatory and industry-led models for the regulation of these systems. Corrosion protection systems are installed to provide corrosion protection to over $18 billion worth of underground energy and other infrastructure, and are regulated under the Electricity Supply (Corrosion Protection) Regulation 2008. If these systems are not tested and maintained properly they can damage nearby third-party assets, causing potential risk to energy supply and public safety.
The review’s final report was released in January 2011. The review made a number of recommendations to strengthen the Regulation and the associated administrative framework. These recommendations will be implemented during 2011-12.
In order to provide timely and whole-of-organisation input into environmental assessment of major energy projects – such as new wind farms, solar and gas power plants – internal processes were set up and input coordinated from relevant branches of the department. Input was coordinated for planning approvals of approximately 15 energy infrastructure projects.
As part of the implementation of the Price Comparison Service, the Government Contact Centre was engaged to accept phone calls from customers through the Energy Information Line. This service was established to provide equality of access for customers to energy price comparison activities where customers may not have had access to, or the ability to use, the Price Comparison Service independently. This includes provisions for the hearing impaired as well as the use of interpreter services.
The department also worked on implementation of a range of additional consumer protection measures that will commence on 1 July 2011. These include:
• the introduction of the new Low Income Household
NSW TRADE & INVESTMENT ANNUAL REPORT 2010 -11 RESOURCES AND ENERGY DIVISION

100
Rebate (available from 1 July 2011), which will commence at $200 per year, and the development of a Family Energy Rebate, which could see some families receive rebates of up to $250 per year
• the Medical Energy Rebate, which will increase to $200 per year on 1 July 2011, to remain in line with the Low Income Household Rebate.
Energy supply and networks performanceDuring 2010 -11 the department continued to monitor both worker and public safety outcomes in the energy supply and networks industries. There has been an upwards trend in accidents to network operator employees involving electricity during the year. In addition there was a fatal electrocution of a civil contractor working in a high-voltage substation.
The Industry Safety Steering Committee, chaired by the Director Energy Supply and Networks, brought this trend to the attention of the Network Businesses who are reviewing internal policies and proceeding in response. In the rural sector a large number of incidents of rural workers and machinery coming into contact with electricity infrastructure resulted in a review of public safety awareness programs. Initially these incidents were made up of crop dusters bringing down power lines. Later in the year, harvesters, grain transport and other machinery contributed to the upswing.
We also contributed to the electricity supply industry annual field days in May 2011, conducted under the auspices of the Industry Safety Steering Committee, and hosted by Essential Energy at the Wagga Wagga Showground.
Energy and utilities emergency managementNSW Trade & Investment has responsibility under the State Emergency and Rescue Management Act 1989 (the SERM Act) for supporting the participation by energy and utility businesses in NSW in the planning, preparation, response to and recovery from an emergency in NSW, or in any other jurisdiction or country under mutual assistance agreements.
Under the SERM Act, the energy and utility businesses are grouped into a ‘functional area‘ and their participation is coordinated by the Energy and Utility Services Functional Area Coordinator (EUSFAC); this is a Cabinet appointment and a member of the State Emergency Management Committee (SEMC). The department provides the EUSFAC and response team, which in turn provide an on-call 24/7 response capability for utilities emergencies and threats to utilities infrastructure.
The SEMC constantly reviews emergency management capabilities, engaging the EUSFAC in the review of legislation, disaster plans, natural disaster subplans, specific hazard plans and other agency plans, all of which assign roles and responsibilities to EUSFAC and response expectations of utility service businesses.
Consistent with the outcomes of SEMC-led reviews, the EUSFAC reviewed plans within the functional area that include support to emergency service organisations and other functional areas and include coordinating
the continuity of supply of electricity, water, natural gas, petroleum fuels and sewerage services. The revised plans are expected to be completed in 2011.
In an emergency, the EUSFAC coordinates the continued supply of electrical power, natural gas, petroleum fuels, and water and sewerage services with the service providers and other agencies, including specific requests for action or advice from the State Emergency Operations Controller. The EUSFAC also provides functional area support to recovery operations.
During the year, the EUSFAC coordinated multi-agency responses by energy and utilities businesses to emergencies and significant events, including:
• floods in the Murray, North West, Far West and Illawarra regions
• recovery support to Energex following flooding in Brisbane and the Lockyer Valley
• recovery support to Ergon Energy following Tropical Cyclone Yasi
• water industry support to Christchurch NZ to restore earthquake-damaged sewer services
• water main breaks in Paddington, Sutherland, Yagoona and Alexandria
• power outages in Sydney North, Drummoyne, Northern Beaches, Blacktown and Enfield
• loss of gas supply in Cooma
• new year’s eve and festival first-night events.
The EUSFAC is the NSW jurisdictional representative on the National Oil Supplies Emergency Committee and the National Gas Emergency Response Advisory Committee and participated in meetings, exercises and response plan development.
The EUSFAC team also participates in inter-agency working groups, such as the Sydney DownUnder project, managed by the Emergency Information Coordination Unit. This project is developing a spatial view of the underground infrastructure assets and services of the City of Sydney, with concurrent projects to develop an Australian standard for spatial recording of underground utilities and an update of the Emergency Services Spatial Information Layer. This will enable greater reduction in third-party damage to utility infrastructure and better management of emergency incidents involving energy, utility and communication networks.
Biofuels In response to increasing global use of fossil fuels for transport and lower levels of domestic oil self-suffiency, our transport future depends on finding new renewable sources of energy.
Many new vehicle propulsion technologies, such as electric vehicles and hydrogen fuel cells, are being developed but only biofuels are useable in the current vehicle fleet without modification, and many of our existing motor vehicles are going to be on the road for another 20 or more years.
RESOURCES AND ENERGY DIVISION NSW TRADE & INVESTMENT ANNUAL REPORT 2010 -11
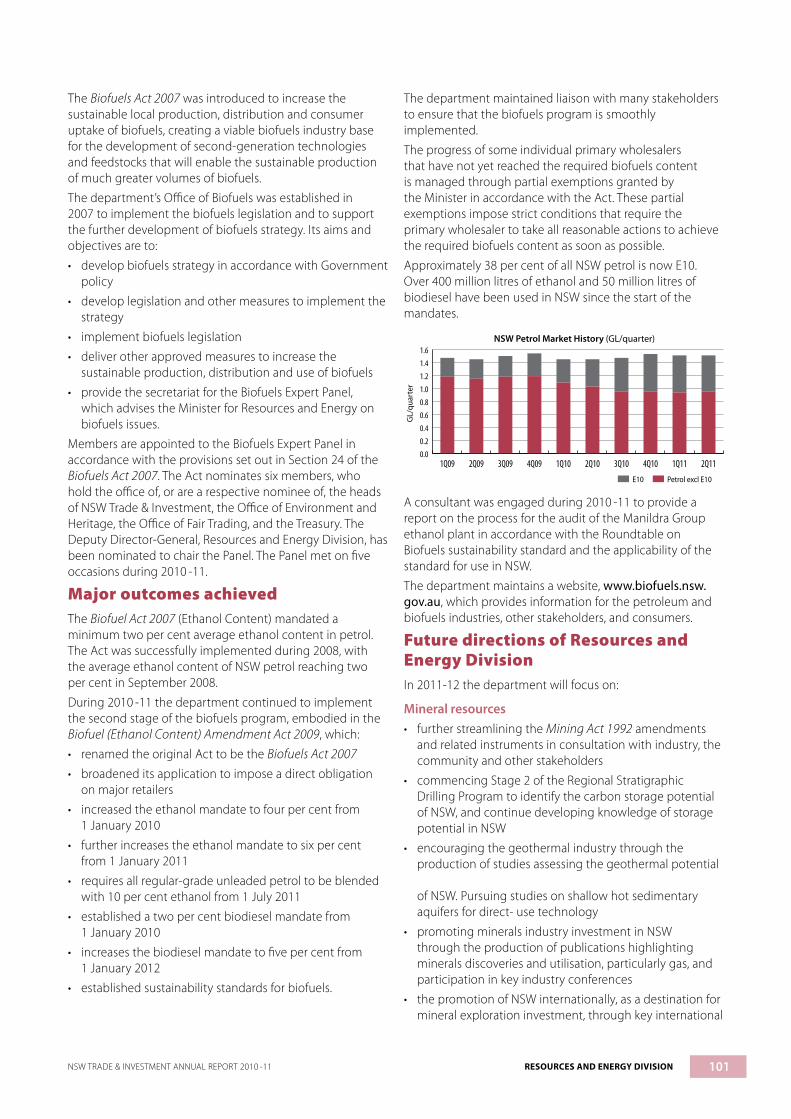
101
The Biofuels Act 2007 was introduced to increase the sustainable local production, distribution and consumer uptake of biofuels, creating a viable biofuels industry base for the development of second-generation technologies and feedstocks that will enable the sustainable production of much greater volumes of biofuels.
The department’s Office of Biofuels was established in 2007 to implement the biofuels legislation and to support the further development of biofuels strategy. Its aims and objectives are to:
• develop biofuels strategy in accordance with Government policy
• develop legislation and other measures to implement the strategy
• implement biofuels legislation
• deliver other approved measures to increase the sustainable production, distribution and use of biofuels
• provide the secretariat for the Biofuels Expert Panel, which advises the Minister for Resources and Energy on biofuels issues.
Members are appointed to the Biofuels Expert Panel in accordance with the provisions set out in Section 24 of the Biofuels Act 2007. The Act nominates six members, who hold the office of, or are a respective nominee of, the heads of NSW Trade & Investment, the Office of Environment and Heritage, the Office of Fair Trading, and the Treasury. The Deputy Director-General, Resources and Energy Division, has been nominated to chair the Panel. The Panel met on five occasions during 2010 -11.
Major outcomes achievedThe Biofuel Act 2007 (Ethanol Content) mandated a minimum two per cent average ethanol content in petrol. The Act was successfully implemented during 2008, with the average ethanol content of NSW petrol reaching two per cent in September 2008.
During 2010 -11 the department continued to implement the second stage of the biofuels program, embodied in the Biofuel (Ethanol Content) Amendment Act 2009, which:
• renamed the original Act to be the Biofuels Act 2007 • broadened its application to impose a direct obligation
on major retailers
• increased the ethanol mandate to four per cent from 1 January 2010
• further increases the ethanol mandate to six per cent from 1 January 2011
• requires all regular-grade unleaded petrol to be blended with 10 per cent ethanol from 1 July 2011
• established a two per cent biodiesel mandate from 1 January 2010
• increases the biodiesel mandate to five per cent from 1 January 2012
• established sustainability standards for biofuels.
The department maintained liaison with many stakeholders to ensure that the biofuels program is smoothly implemented.
The progress of some individual primary wholesalers that have not yet reached the required biofuels content is managed through partial exemptions granted by the Minister in accordance with the Act. These partial exemptions impose strict conditions that require the primary wholesaler to take all reasonable actions to achieve the required biofuels content as soon as possible.
Approximately 38 per cent of all NSW petrol is now E10. Over 400 million litres of ethanol and 50 million litres of biodiesel have been used in NSW since the start of the mandates.
0.0
0.2
0.4
0.6
0.8
1.0
1.2
1.4
1.6
2Q111Q114Q103Q102Q101Q104Q093Q092Q091Q09
GL/
quar
ter
NSW Petrol Market History (GL/quarter)
E10 Petrol excl E10
A consultant was engaged during 2010 -11 to provide a report on the process for the audit of the Manildra Group ethanol plant in accordance with the Roundtable on Biofuels sustainability standard and the applicability of the standard for use in NSW.
The department maintains a website, www.biofuels.nsw.gov.au, which provides information for the petroleum and biofuels industries, other stakeholders, and consumers.
Future directions of Resources and Energy DivisionIn 2011-12 the department will focus on:
Mineral resources • further streamlining the Mining Act 1992 amendments
and related instruments in consultation with industry, the community and other stakeholders
• commencing Stage 2 of the Regional Stratigraphic Drilling Program to identify the carbon storage potential of NSW, and continue developing knowledge of storage potential in NSW
• encouraging the geothermal industry through the production of studies assessing the geothermal potential of NSW. Pursuing studies on shallow hot sedimentary aquifers for direct- use technology
• promoting minerals industry investment in NSW through the production of publications highlighting minerals discoveries and utilisation, particularly gas, and participation in key industry conferences
• the promotion of NSW internationally, as a destination for mineral exploration investment, through key international
NSW TRADE & INVESTMENT ANNUAL REPORT 2010 -11 RESOURCES AND ENERGY DIVISION

102
Divisional performance
Service measures Units 2008-09actual
2009 -10actual
2010 -11forecast
2010 -11est. actual*
Safety regulation: • Investigations of operational safety • Enforcement actions
nono
450881
5171 345
450950
4751 4741
Environmental regulation: • Audits, assessments, investigations and enforcements no 940 855 950 905Rehabilitation of derelict mine sites no 30 24 25 302
Regulatory administration:
• Total number of licences granted under the NSW pipeline Act 1967
no 34 34 38 35
Conveyance searches no 4 027 3 536 4 000 3 5473
Energy labelling registrations no 1 081 2 306 2 100 2 133
*Current estimates at 30 June 20111. Enforcement actions increased as legislation now requires all advice to be provided in writing. Verbal advice was not always counted as separate
enforcement action.2. A number of small mines were rehabilitated under the available budget which increased the total.3. Searches directly proportional to activity in the property market. Market downturn in 2010 -11 directly impacted the level of searches.
events including the Prospectors and Developers Association of Canada annual convention, the China Mining event and the International Geological Congress
• actively supporting low-emissions coal technologies to promote innovative and practical solutions to greenhouse gas emissions resulting from the utilisation of coal
• providing a legislative framework for the exploration and development of greenhouse gas storage in NSW
• participating in the development of the National OHS Framework and National Mine Safety Framework, to be implemented on 1 January 2012
• continuing to implement the the Strategic Regional Land Use Policy to meet the Government’s goal of striking the right balance between the agricultural, mining and energy sectors
• implementing the Government’s new framework for coal and coal seam gas exploration and production.
Energy • working towards transition to the National Energy
Customer Framework (NECF) by 1 July 2012
• the transition Greehouse Gas Reduction Scheme to a national carbon tax by 1 July 2012
• preparing for the development of a national energy savings (white certificate) scheme
• leading the participation in national energy reform and low emissions energy policy
• rolling out education programs to assist consumers to manage energy usage and access hardship assistance. Through these programs the department works closely with service providers and community welfare organisations through outreach activities
• continuing to implement changes to corrosion protection regulation framework in line with Better Regulation
• continuing to implement changes to the Accredited Service Provider scheme in line with the recommendations of the final report by the Better Regulation Office, including expanded coverage of the scheme
• finalising the review of the NSW Public Lighting Code
• reforming the energy network business authorisation framework
• progressing land use planning and access reforms with regard to energy infrastructure planning
• revising State-level energy supply chain disruption plans for gas, electricity and petroleum, under the State’s Energy and Utility Services Functional Area (EUSFA)
• revising the EUSFA plan for emergencies and significant incidents, to ensure better coordination of planning, preparation, response and recovery.
BiofuelsThe Biofuels Act 2007 is currently under review. The future focus of the department will be confirmed following the completion of the review.
RESOURCES AND ENERGY DIVISION NSW TRADE & INVESTMENT ANNUAL REPORT 2010 -11

103
Nature and scope of activitiesThe department’s Policy, Governance and Communications Division plays a lead role in translating Government priorities and industry needs into the department’s policy and corporate agendas. The division coordinates whole-of-government approaches and manages strategic and contentious issues. It facilitates department-wide planning, performance improvement and strategic communications and promotes NSW industry and the work of the department.
The division comprises six branches:
– Corporate Policy and Government Relations
– Economic Policy and Research
– Natural Resources Policy
– Corporate Affairs and Media
– Corporate Strategy and Communications
– Industry, Innovation and Investment Communications
Key challengesThe most significant challenge for the division in 2010 -11 was to support the establishment of the NSW Trade & Investment and its new Ministers.
The division also established preliminary internal and external communication systems for the new department.
A number of working groups were established to facilitate
the change process and the division led the Planning, Change Management and Communications Working Group.
Since the establishment of the department a number of key milestones have been achieved, including the establishment of the department’s website, an intranet, and interim governance processes.
Major outcomes achievedIncreased jobs and investment across NSW
Successful campaignsDuring the year the department supported a number of initiatives aimed at boosting investment across NSW, investment that could ultimately result in increased jobs. Among these initiatives were those aimed at ensuring that the State’s industries are competitive nationally and internationally, by supporting business opportunities that showcase our local industries.
• A fully integrated marketing and communications campaign was developed for Small Business September 2010, which featured over 500 events. The month-long campaign celebrated small businesses and was designed to help their business grow. The month attracted 11 sponsors, over 100 partners and an estimated 20 000 business owner participants.
• The NSW Government is committed to securing 30 per cent of Australia’s in-country defence spend by 2019 and
POLICY, GOVERNANCE AND COMMUNICATIONS DIVISION
NSW TRADE & INVESTMENT ANNUAL REPORT 2010 -11 POLICY, GOVERNANCE AND COMMUNICATIONS DIVISION
104 POLICY, GOVERNANCE AND COMMUNICATIONS DIVISION NSW TRADE & INVESTMENT ANNUAL REPORT 2010 -11
to creating more than 1500 new jobs in defence-related industries by 2013. The 2010 -11 NSW Budget included a $75 million commitment to our defence effort. An advertising campaign was developed to encourage the defence industry, potential investors and relevant high technology-based industries to contact the new NSW Office of Defence and its support services.
• A Business Assist campaign was implemented for small and medium businesses to increase calls to the 1300 Business Assist number and visits to the SmallBiz website. The campaign involved print advertisements within 22 regional publications and within Dynamic Business. The campaign, which also involved online advertisement with Adconion, LinkedIn and MREC and hotlinks in the Dynamic Business newsletter, was positively received.
• The Business Mentoring Program, which involves business mentoring and workshop programs across NSW, was promoted through email distribution, online advertising and print advertising in regional newspapers. Over 800 participants benefited from the program.
Sector profiles The department delivers programs and services that support the NSW Government’s commitment to win new business activity and to develop the capacity and productivity of the State’s economy. To help promote our industries around the world, six of the department’s 22 sector-specific profiles have been transformed into the new dynamic ‘Brand Sydney’ look and feel. These profiles provide a detailed overview of what these sectors look like in NSW, including their strengths, statistical information and reasons for establishing a business in that particular sector in NSW.The profiles provide a wealth of information for prospective new businesses in NSW.
Media supportThe department provided media support for the Premier’s announcement of a $45 million Indian investment in a campus in Sydney. The announcement received widespread news coverage in Australia and India.
Media support was also provided for the Finance Minister’s announcement of the official opening of the first Australian branch in Sydney of the world’s largest bank, the China Construction Bank. The China Construction Bank’s investment in Sydney is expected to create 30 jobs and generate $70 million in investment for NSW over the next five years.
Competitive and productive industries
EventsThe division supported the department’s participation in numerous targeted community, business and industry events throughout the year. These events are an important mechanism for promoting the State’s capacity, building skills, networking and engaging with stakeholders. Some highlights appear below.
• Forum for European Australian Science and Technology
(FEAST): FEAST is an organisation established by the Australian Government and the European Union to highlight, promote and facilitate research collaboration between their respective communities. During the year, NSW and Sydney were promoted as leading centres for research capabilities in smart technologies.
• Australia Live – Technology Shoot Out: The New South Wales Technology Shoot Out at Australia Live showcased some of the many innovative technologies, services and opportunities developed in the State. Six of Australia’s most promising innovators in information and communications technology took to the stage for the NSW Technology Shoot Out and their business stories and contact details were collated and distributed in the Technology Shoot Out Exhibitors Guide.
• AusBiotech: The department assisted 10 NSW biotechnology organisations and educational institutions to participate in the AusBiotech Conference, Australia’s largest international biotechnology event. Assistance was provided in the form of stand design, which incorporated overarching departmental branding, and individual exhibitor branding. The department also assisted the exhibitors with the preparation of their company profiles and information on the relevant NSW industry in the exhibitor guides.
• Nanotech: Nanotech 2011 is a platform to advance dialogue and commercial opportunities between NSW nanotechnology-related businesses, institutions and researchers. An event information flyer was produced outlining details on the trade mission to Japan and Nanotech, as well as artwork for the NSW stand.
• Premier’s Business University Government Forum: The Premier’s Business University Government Forum is part of a broader suite of initiatives that aim to increase alignment between State Government activities, the capabilities of our university and public research sector, and the needs of industry and business. This engagement is designed to help drive economic growth, social wellbeing and environmental sustainability. This year’s topic was ‘Building a workforce competitively positioned for growth’.
• CeBIT Australia: CeBIT Australia is the leading business event in the Asia Pacific region for information and communications technology (ICT) driving business strategy. The department participated in the 2011 CeBIT exhibition, promoting the State’s strengths and capabilities in the ICT sector and showcasing 12 NSW-based ICT organisations.
• Manufacturing Week 2011: NSW Manufacturing Week promoted and celebrated the key role that manufacturing plays in the social and economic wellbeing of the State. Events during the week addressed many issues relevant to the future success of the industry and provided an opportunity for the department to assist manufacturers across the State to compete in a global market by highlighting best-practice techniques, strategies and case studies.
105NSW TRADE & INVESTMENT ANNUAL REPORT 2010 -11 POLICY, GOVERNANCE AND COMMUNICATIONS DIVISION
• MicroBiz Week 2011: MicroBiz Week is now in its sixth year and continues to provide a useful platform for businesses in the start-up phase. The event concentrates not only on home-based businesses but also sole traders, consultants, mobile businesses and micro-enterprises (i.e. those with under four employees).
• Hong Kong International Wine & Spirits Fair: The department assisted 10 export-ready NSW wineries to participate in the Hong Kong International Wine & Spirits Fair. The department assisted companies exhibiting at this event with stand design, branding and preparing company profiles and information.
• Medica – World Forum for Medicine: The 2010 Medica – World Forum for Medicine was held in Dusseldorf, Germany from 17 to 20 November 2010 and included 18 NSW companies. MEDICA is the world’s premier and largest health and medical trade exhibition. NSW has been the only Australian State Government consistently represented at the Australian Pavilion at MEDICA since 2003 and this has provided a unique and unchallenged opportunity to position NSW at the forefront of medical device development and manufacturing in Australia. The companies reported a high level of satisfaction with the amount of traffic to the stand. The department also had a stand to promote the medical device industry in NSW.
• G’Day USA: G’Day USA is an annual program designed to showcase Australian business capabilities in the USA. As part of G’day USA, the NSW Government hosted a NSW Innovation Showcase, ‘Fast Pitch’, involving a small number of stand-out and cutting edge NSW technology companies. The sustainable cities conference was also part of G’day USA. A clean technology sector video was produced for the conference and can be viewed at www.business.nsw.gov.au/doing-business-in-nsw/industry-sectors/environment.
• Avalon Airshow, Victoria: The department co-ordinated a NSW pavilion at the Australian International Airshow at Avalon, Victoria. The show was an excellent opportunity to promote NSW-based organisations and capabilities to both domestic and international markets. To support the event various marketing materials were created, including a promotional email, an invitation, exhibitor guide, Aerospace directory CD and a stand.
• Royal Easter Show: Australia’s largest annual primary industries event provided an opportunity to introduce the new department to the community under the theme of ‘transforming our (primary) industries’. The stand engaged with visitors in an entertaining and interactive way to help them become aware of the research and production behind primary industries in NSW, how this impacts on them as consumers and how the department supports the industries.
• NSW Farmer’s Association Annual Conference: The event provided an opportunity to promote the department’s research and science initiatives, the services available to farmers, and the extensive team of highly trained staff across the State.
PublicationsCorporate brochure: A corporate brochure was developed as the positioning piece for the department in the international marketplace. It incorporates international rebranding and works to position Sydney and NSW as the leading global hub for business and tells our business capability story. The target audience includes offshore investors, major offshore importers (existing and potential), industry partners and professional associations, and government and local authorities in international markets.
Corporate promotional film: A corporate promotional film was created to promote Sydney as the place to do business. This film incorporates Sydney and regional footage.
Australia–India. A Growing Partnership: This publication provides Indian and Australian decision makers with the essential information and contacts they need to find products and services, business partners and locations for investment in Australia and India.
Schools education LandLearn NSW, the department’s collaborative schools education program, continued its success story. The LandLearn NSW website provides an introductory overview of primary industries and natural resource management in NSW. It provides access to information on the production, consumption and management of primary products and natural resources in NSW, and links to national and global information.
The website showcases current practices, and highlights the science and research projects yielding new practices in primary industries and natural resource management. It serves as a portal for accessing NSW-based primary-industries-focused schools education programs, products and services and is delivered in partnership with the industry.
The LandLearn NSW team now has an ongoing and fruitful presence in the social media. Sites such as Facebook, Flickr, SlideShare and YouTube maintain a steady flow of visitors and help raise awareness about primary industries into schools and the community.
LandLearn NSW also ran Speech Spectacular, a speaking competition run in conjunction with the NSW Beef Spectacular. This year’s winner, Callum Hislop from Leeton Public School, delivered a thoroughly researched, thought-provoking and entertaining speech entitled ‘Why agriculture is destined to stay on the front page’.
Support for women in rural areasThe Rural Women’s Network continued partnerships with individuals, groups, non-government and government agencies to promote information exchange and to identify and progress rural women’s issues. This past year, the Network:
• continued to provide support and information for women and families who struggled with drought
• wrote and published new stories of rural women sharing their achievements in a broad range of areas in Daring to

106
Dream 2, launched by the Minister for Primary Industries during the Royal Easter Show
• provided support to the annual NSW Women’s Gathering, held in Wentworth
• coordinated the Rural Women’s Award for NSW, sponsored by the Rural Industries Research and Development Corporation. The 2011 award winner is irrigator Karen Hutchison, who converted her farm at Griffith from wine grapes to sultana production.
Sydney and NSW highly valued for tourism and investment
Sydney tourism campaignThe Premier successfully launched the new Sydney tourism marketing campaign at the Shanghai World Expo during NSW Week. The department managed the widespread media coverage in NSW and in China generated by the launch.
Forbes Global CEO Conference The Forbes Global CEO Conference was held in Sydney at the Four Seasons Hotel. The department advertised, as part of a feature on Australia, in the September issue of Forbes Asia to position Sydney as a global city for the world of business. The joint Austrade/NSW Government Forbes campaign theme was further built with the overarching message ‘Where business is a pleasure’, and the online campaign concept played on this positioning statement. To encourage delegates and their accompanying persons to extend their stay and to provide touring options while in Sydney, a program was developed in consultation with Business Events Sydney and Tourism NSW.
Bright Foods MoU: NSW Food and Wine FestivalThe NSW Government signed a memorandum of understanding with China’s Bright Food Group and the China Development Bank in June 2010 which acknowledged the potential for up to $3 billion in investment in NSW by the group. Following the MoU, the NSW Food and Wine Festival in Shanghai ran across two weeks in five of Bright Food’s retails stores. For the festival, and for use as a sales tool and display at future trade shows, a short film promoting the NSW food and beverage sector was produced. As the film will be displayed to consumers in Bright Food stores, the film also promoted NSW tourism.
Tourism NSW highlights Tourism NSW played a leading role in the highly successful visit to Australia by chat-show host Oprah Winfrey, which achieved world wide media coverage. During her visit, several media opportunities were facilitated by the division for the Premier and Minister in Sydney and the Hunter Valley. Further media coverage was achieved once the shows were broadcast in the USA and Australia in January 2011.
Other tourism media announcements managed by the division included:
• NSW chefs appearing on the Martha Stewart Show in New York
• $1.5 million marketing campaign launched in the USA
• $1 million tourism marketing campaign to help the flood-affected Northern Rivers region
• launch of a Tourism NSW $3.2 million global marketing blitz
• Tourism NSW and Jetstar co-partnered a $500 000 promotion of Sydney in other capital cities
• Sydney hosted the Australian Tourism Exchange for the first time in 11 years, with more than 700 international travel trade representatives taking part. The exchange included presentations by the Premier and the Minister for Tourism
• the CountryLink Inland Tourism Awards, attended by the Minister for Tourism, received widespread regional media coverage.
Regional business growth plans The department helped design and publish the Regional Business Growth Plans, which outline actions designed to address barriers to business investment and to stimulate economic growth across the State. They focus on strategies for sustainable growth in the region covered by the plan, identifying infrastructure, land use and planning needs as well as skills, industry and business development issues.
Regional NSW wine tour The department conducted a trade wine tour showcasing the wine of Australia’s newest wine region to a range of buyers and industry decision makers. Public relation activities achieved coverage in local and trade media.
Sustainable management and use of natural resources
Strategic policy and legislative adviceDuring the year we provided high-level strategic policy and legislative advice for the key areas of water, climate change, biodiversity and land use planning. We coordinated and directed the department’s collective efforts in natural resource management at both a State and national level, working with key internal and external stakeholders to develop whole-of-agency positions on important issues.
We also carried responsibility for providing strategic policy advice to keep the focus of the department’s activities (regulatory, research and development, and advisory) on public benefit outcomes. We undertook significant legislative reviews, coordinated the department’s submissions to external policy reviews, and provided information to allow key strategic decisions by the Executive and the Minister.
We again played a significant role in the development of drought and environmental policies, and welcomed the opportunity to assist other divisions with the provision of strategic public policy advice and analysis. This year an interagency biodiversity seminar was convened, that provided a forum for staff involved in biodiversity science and management to present their findings and encourage debate with other interested parties.
POLICY, GOVERNANCE AND COMMUNICATIONS DIVISION NSW TRADE & INVESTMENT ANNUAL REPORT 2010 -11
107
Another emerging area of importance over the last 12 months has been land use planning and managing land use conflict. A workshop was held in February 2011 to examine departmental capabilities for the spatial analysis of competing rural land use. The department has also been developing a range of policies to coordinate and ensure a consistent approach for land use issues.
During the year, the division also led the department’s contribution to a variety of natural resources policy issues, including the following:
• the Greater Metropolitan Surface and Groundwater Sharing Plans
• the 2010 Metropolitan Water Plan
• the Sydney Metropolitan Planning Strategy
• the Guide to the Basin Plan and two Senate inquiries into the Guide to the Basin Plan
• the Government Strategic Regional Land Use Policy, including the immediate transition period
• submission on the Carbon Farming Initiative, draft legislation and interim guidelines
• the draft NSW Biodiversity Strategy 2010 -2015, a joint responsibility with the Office of Environment and Heritage
• the flying fox licensing review, which resulted in the Government's decision to phase out a licensing scheme permitting fruit growers to shoot flying foxes as a crop protection measure
• Commonwealth House of Representatives Standing Committee on Agriculture Resources, Fisheries and Forestry Inquiry into current and future prospects of the Australian forest industry
• the commissioning and oversight to completion of a study by ACIL Tasman on an assessment of environmental watering options in the Murray–Darling Basin which minimises negative socio-economic effects while still achieving environmental objectives
• the development of protocols to underpin action, outcome and hybrid-based farmer contracts for a soil carbon market-based instrument as part of a pilot project in the Lachlan catchment
• published a technical report on Target 12 of the NSW Natural Resource Management Monitoring, Evaluation and Reporting Strategy.
Safe, healthy and biosecure industries
Biosecure media campaignsThe department delivered important outcomes for this key result area, including hosting a workshop in Chandigarh, India, on ’Policy Instruments to address air pollution issues in agriculture’ as part of the Happy Seeder ACIAR project and presenting associated research papers to the Annual Conference of the Australian Agricultural and Resource Economics Society.
It also played an important role in responding to critical biosecurity and emergency issues such as:
• the delivery of a major media and communications campaign to support the $18.5 million plague locust control program
• public information and media campaigns to support various emergency response initiatives, including a State-wide myrtle rust outbreak, locust plaque, major flood events across NSW and a significant mouse plague.
Positive business environment
Strategic communicationsThe division delivers strategic communications and public affairs solutions to enhance the profile of the department and to support its corporate initiatives and goals. Through its media teams, the division plays an important role in State-wide media and public affairs issues, including:
• high-profile media coverage for a number of fisheries issues, including identifying an illegal abalone operation, shark research and inland fisheries management
• media support for the ongoing development of Forests NSW, including expansion of the Tumut nursery, the new Sealy Lookout at Coffs Harbour and the upgrade of a number of recreation areas
• response to media inquiries and the ongoing community debate on coal seam methane gas exploration.
The department supported Government policy making by providing socio-economic data and robust advice to key government, industry and community forums, including national councils of Ministers and state level advisory councils. These activities supported national and State policy deliberations in areas such as drought policy, the role of agriculture in carbon pollution reduction, biosecurity, water management in the Murray–Darling Basin, and water pricing.
The department also managed the NSW Government’s $840 000 commitment to the national Rural Financial Counselling Program, including the disbursement of grants to service providers.
Service delivery excellence
Legislative frameworkBy ensuring that regulatory processes are streamlined and efficient, the division contributes to the corporate plan goal of ensuring a positive business environment.
Prior to the NSW State election the division continued to review NSW legislation affecting primary industries with a view to reducing red tape. This led to one Regulation being allowed to lapse. Amendments were made to six Acts, while 12 new Regulations subject to staged repeal in 2010 were remade and 17 Regulations were amended. These included:
• Mining Regulation 2010 and Mining Amendment Act 2008: making the new regulation, which introduced significant changes, including streamlining administrative processes, and commencing many of the provisions of the Mining Amendment Act
• Veterinary Practice Act 2003: making amendments, mainly in relation to the complaints procedures and the powers
NSW TRADE & INVESTMENT ANNUAL REPORT 2010 -11 POLICY, GOVERNANCE AND COMMUNICATIONS DIVISION

108
and functions of the Veterinary Practitioners Board, following a statutory review of the Act
• Plantations and Reafforestation Act 1999 and Plantations and Reafforestation (Code) Regulation 2001: making amendments following a comprehensive review of the Act and the Code, including the introduction of fire standards and improved environmental protection provisions
• Gene Technology (GM Crop Moratorium) Act 2003: extending the operation of the Act for a further 10 years to prevent it expiring on 1 July 2011
• Fisheries Management (General) Regulation 2010: making the new Regulation, including significant changes and streamlining measures.
Three regulations are subject to staged repeal in 2011, one of which has already been remade. The draft Non-Indigenous Animals Regulation 2011 and Regulatory Impact Statement is now on public exhibition. Four statutory reviews of Acts were finalised, including a review of the Fisheries Management Act 1994 and the Noxious Weeds Act 1993. A review was also undertaken of NSW Petroleum Legislation.
The division also provided assistance with the drafting of regulation impact statements, in particular cost-benefit analysis. The division also was the driver of the review of the Rice Marketing Act 1983.
Following the election, the division has provided ongoing assistance to the Department of Primary Industries while the new structure for keeping the NSW Trade & Investment legal framework up to date was being worked through.
A full list of amendments can be found in Appendix three.
Change managementThe division was instrumental in the change process to create the new Department of Trade and Investment, Regional Infrastructure and Services. As part of the change process the division led the Planning, Change Management and Communications working group, which was made up of planning and communications representatives from across the department. The Working Group liaised to facilitate changes to urgent issues, systems for internal communications, stakeholder interaction and communication, planning, reporting, governance, policy and ministerial support.
Change communicationsImportant communication milestones included the development of a departmental website, Organisational Change – Communications and Transition Plan, a common intranet, branding advice for the new department, senior management networking meetings, and monthly achievement reports to Ministers.
Sound corporate governance, planning and reportingThe division coordinated, facilitated and led a number of important planning and reporting processes, both prior to and following the establishment of the new department.
These included:
• establishing a quarterly divisional reporting process against the former Industry & Investment NSW (I&I NSW) Corporate Plan 2010 -13
• coordinating a report on I&I NSW actions against the State Plan and Local Action Plans for 2009 -10 for the State Plan Annual Report
• coordinating reports on the department’s actions against whole-of-NSW Government plans (Multicultural Plan 2010 -12, Youth Action Plan, Women’s Action Plan)
• implementing a new policy and procedure framework for I&I NSW and developing key internal policies, including the gifts and benefits policy, a sponsorship policy, social media policy and the Code of Conduct
• implementing the enterprise risk management framework, including finalisation of divisional risk management plans, to meet Treasury requirements
• coordinating departmental input into the preparation of the new NSW 2021 Plan, which will set the NSW Government’s agenda for the community and provide direction to the public sector
• assisting the department to identify actions to be implemented to achieve government targets and measures
• coordinating the development of a preliminary implementation plan to guide the work of the department to deliver key portfolio commitments.
External information services and communicationsThe department distributed over 611 publications during the year, including:
• 84 new or revised factsheets
• 58 comprehensive technical guides and manuals
• 51 different types of information magazines – such as DELVE, Bush Telegraph and Country Web – were distributed at events and/or to relevant stakeholders. This includes Facts & Figures, exhibitors’ guides, programs and newsletters
• 9 regional growth business plans, 23 profiles (industry, regional, country)
• 112 brochures/flyers, 74 displays/posters, 36 signs, 5 electronic/multi media productions.
We also managed the content of over 35 different websites, intranets and divisional websites for parts of the department, adding up to over 32 000 pages and documents. The suite of external websites activity exceeded 15 million page views in 2010 -11. Another important output during the 2010 -11 year was a model for communication strategies to assist with emergency disease/pest outbreaks; this model was used successfully to support the 2010 locust campaign.
The department also developed a range of self-service publication and event management tools, empowering employees to organise external communications in relation
POLICY, GOVERNANCE AND COMMUNICATIONS DIVISION NSW TRADE & INVESTMENT ANNUAL REPORT 2010 -11

109
to their area of the department. A stakeholder engagement plan for the department was also developed.
Staff developmentEffective organisational development continued to be a priority for the department, particularly in this time of change. The Young Employees Syndicate (YES!) continued to work on its three strategic priorities (attracting and retaining talent; professional development; and using technology to build better networks) and developed a practical action plan to work across the department to deliver on these themes.
We also continued work on other strategies aimed at specific target groups including updating the Women’s Employment Strategy and the Aboriginal Employment Strategy.
Future plans and directions In 2010 -11 the department will continue new development of the internal processes and key initiatives, including:
• development of a strategic planning framework for the department to ensure NSW 2021 Plan priorities are integrated into the department’s business
• continued change management strategies to consolidate the new department, including further work on the intranet, internet, governance and reporting frameworks and policies
• coordinating the department’s legal program including:
– urgent amendments to improve biosecurity provisions to a number of Acts as part of the ongoing process to strengthen the State’s Biosecurity Strategy through alignment with national requirements
– new legislation and regulations to replace the Mine Health and Safety Act 2004 and Coal Mine Health and Safety Act 2002 and Regulations in line with the National Mine Safety Framework
– amendments to the Veterinary Practice Act 2003 in order to implement the National Recognition of Veterinary Registration model.
Amendments may be required to mining and petroleum legislation to implement the Government’s Strategic Regional Land Use Policy.
NSW TRADE & INVESTMENT ANNUAL REPORT 2010 -11 POLICY, GOVERNANCE AND COMMUNICATIONS DIVISION

110 CORPORATE SERVICES DIVISION NSW TRADE & INVESTMENT ANNUAL REPORT 2010 -11
Nature and scope of activitiesThe department’s Corporate Services Division develops, manages and advises on systems, infrastructure, policies and standards to provide services to the department in the areas of finance and administration, human resources, asset management, information and communication technology and legal services.
The division comprises five branches:
– Corporate Operations
– Legal
– People, Learning and Culture
– Information and Communications Technology
– Strategic Business and Knowledge Management
Key challenges The key challenge for the corporate services divsion was providing continued technical and desktop integration, shared corporate services and access to shared information to the new NSW Trade & Investment. We continued to maintain these services while meeting efficiency targets set by Treasury. An ongoing challenge was the integration of corporate services functions across a heterogeneous department. Balancing the expectations of new divisions with the levels of service they might expect, and the
services that could be delivered within resourcing constraints, was another ongoing challenge.
The department supported the growing demand for mobile access to information, and fostered a culture of good knowledge and information management.
Major outcomes achieved
Service delivery excellence
A safe, satisfying and fair work environmentThe primary efforts of the department were in the areas of safety, workforce planning, talent management and development of our future leaders and managers.
This year saw the embedding of the three-year safety strategy, with our target of having all of our senior managers attend Safety Leadership Training by 30 June 2011 being achieved. The approach of educating our leaders on safety culture and how they influence behaviours is key to achieving cultural shift in the organisation. This, coupled with more-detailed reporting and discussion on safety performance, led to some excellent results in the engagement of staff with safety initiatives. The focus is now on taking a risk-management approach to high-risk activities, and putting effort into areas of high necessity.
There was a strong focus on risk-management activity around ‘people’. This year saw the launch of a succession-
CORPORATE SERVICES DIVISION
111NSW TRADE & INVESTMENT ANNUAL REPORT 2010 -11 CORPORATE SERVICES DIVISION
planning process, with early data-gathering workshops proving to be a very worthwhile exercise for managers. The process provided an opportunity for the managers to analyse their business continuity risks and plan accordingly to ensure ongoing service delivery. Coupled with this was the launch of the departments inaugural Leadership Program. The program is designed specifically around organisational need, and targets those we believe are our high-potential employees and future leaders. It is delivered over a year-long period with three residential workshops and a corporate project that has participants working on cross-divisional projects, each with Executive sponsors. The projects, as well as the participants, are hand-selected by the Executive and the projects are aimed at delivering a business outcome as well as being a learning exercise.
As always there was a strong focus on operational training to ensure our technical skills were kept up to date. There were also a number of management and supervisor development programs. As with all technically based organisations, management skills are not necessarily needed in more operational roles but, as employees progress through the ranks, these skills – which are completely different to technical skills – are a necessity. The aim is to equip our managers with the necessary people and business management skills, taking a ‘just in time’ approach so that they can apply what they learn as soon as they leave the program.
All of the initiatives around succession planning, leadership, management and supervisor development gave the department an opportunity to identify the high performers in our organisation, enabling us to take a talent management approach by targeting key individuals for future development and assistance with career management.
During the year a Performance Development Scheme was implemented in a phased approach. The scheme focuses on setting key performance indicators (KPIs) for a 12-month period, including two KPIs around safety leadership, thereby identifying the developmental needs to assist employees in meeting those KPIs, and provides a framework for managers to have a conversation with their employees about their career goals. Further tools and guidelines will be developed in the upcoming 12 months to further assist managers to achieve high-performing teams.
Financial servicesA new organisational structure for the department’s financial services was implemented during 2010 -11. New positions were evaluated, internally advertised and permanently filled.
Processing of financial transactions for the division of Industry, Innovation & Investment and Screen NSW commenced this year. Monthly meetings were held with finance services representatives from Industry, Innovation & Investment and Screen NSW to ensure that service delivery was appropriate to successfully integrate these bodies.
Quarterly meetings were held with a representative from the Rural Assistance Authority, in line with the requirements of the new Service Level Agreement that began on 1 July 2010.
The department’s Finance Helpdesk was successfully established at the Processing Centre in Orange and transitioned to an automated enquiry management system in March 2011. This allowed a more efficient service to be provided for both internal and external clients. In excess of 13 000 enquiries were received during the 2010 -11 financial year.
LegalThe department administers 182 Acts of Parliament.
During the year the division provided legal advice and drafting services across a wide range of matters covering most functions of the department. This included the preparation and signing of 179 Primary Industries contracts and the gazettal of 470 legislative instruments. A total of 282 prosecutions were finalised under the Fisheries legislation, 18 serious mining accidentals are being investigated and prosecuted under the Occupational Health and Safety Act 2000 (OHS Act), and 21 OHS prosecution matters were pending as at 30 June 2011.
The High Court decision in the matter of Kirk v NSW Industrial Relations Commission on 13 February 2010 led to the delay of finalising many matters under the OHS Act through related appeals lodged by defendants and legal arguments based on the clarification of the law in the Kirk decision.
Under the Legislation Program three Acts were passed in Spring Session 2010 and two Acts in Budget Session 2011. There were six Regulations remade under the Subordinate Legislation Program for 1 September 2010. Eight direct amendments were made to regulations during the year.
Two Legal Responsibility Courses were run for department staff. This course covered basic legal issues relevant to the day-to-day functions of the department as the course is a risk management strategy used to minimise error by staff and heighten awareness of legal processes.
Legal advice was provided to assist the staff undertaking the Hendra virus control program.
Managing physical assetsMeasures to assist in aligning assets with current and future business priorities included the following:
• Three surplus residences in Trangie and Cobar were disposed of, realising a net return of $323 000.
• Control of the Crown lands (comprising Temora Agricultural Research and Advisory Station) was surrendered to the Minister for Lands in October 2010 and subsequently transferred to the trusteeship of Temora Shire Council. The department no longer conducts research on this site and is assisting the council in its transition to a community managed research facility.
• Construction of new and refurbished biosecurity facilities at Elizabeth Macarthur Agricultural Institute is well ahead of schedule and should be completed in December 2011. This project, costing $56.7 million, will cement the Institute’s position as the focus for animal and plant biosecurity in NSW.
112
• Stage I of new facilities to house staff and operations relocating from Gosford Horticultural Institute to the Newcastle University Campus at Ourimbah will be completed by June 2011 at a cost of $6.1 million. Stage I comprises office and laboratory facilities which will house more than 60 staff. Stage II, comprising greenhouse, car parking and storage facilities, will be completed during 2011-12.
• The State Property Authority is managing the preparation for sale of the Gosford Horticultural Institute site, which will be progressively vacated as facilities at Ourimbah come on line.
• Refurbished facilities at Wollongbar now accommodate Tropical Horticulture Research staff transferring from Alstonville. These facilities were upgraded at a cost of $500 000 to replace the non-compliant buildings at Alstonville.
• The design and project management of the upgrade of the Far South Coast Fisheries Office at Eden on behalf of the State Property Authority was commenced. This refurbished facility, which the department leases from the Authority, will provide a long-awaited improvement in amenity, response and service delivery for staff and clients.
Human resources Industrial relations was effectively managed throughout the year, with no lost-time disputes impacting on departmental operations. Work commenced on developing an amalgamated flexible work-hours agreement and the consolidation of industrial instruments within the department. The Joint Consultative Committee forum continued to provide an appropriate and effective vehicle for consultation with those unions that represent staff within the department.
The department provided effective and efficient payroll and employee services functions to 4205 employees during the year across the four payroll entities. In addition we provided remuneration services for over 260 members of boards and committees. We processed over 2000 employment approvals and managed several hundred recruitment actions, involving approximately 1000 applicants. The Employee Self-Service system was also upgraded as a result of the migration of the Aurion Human Resources Management Information System to version 10.
Electronic Service DeliveryThe major focus of the department’s Information and Communications Technology (ICT) branch during the year was the integration of agencies into a single departmental infrastructure, leading to operational cost savings. Wide-area networks and internet facilities for Forests NSW and the NSW Food Authority were moved into the central network, thereby improving their capacity and management as well as reducing costs. Around 300 staff in the department’s Industry, Innovation & Investment division working across 20 sites in NSW were migrated onto the new department’s network to provide centralised corporate services.
The department continued to upgrade its ICT infrastructure with new data storage facilities commissioned at its Orange and Maitland data centres. New file servers and telephone systems continue to be deployed as existing systems reach end of life. The e-mail system was also upgraded and new collaboration features introduced. The ICT Helpdesk continued to enhance its service management platform to cope with the increased workload from centralised services and to provide enhanced reporting and change management capabilities.
Assistance was provided to business units for the development and deployment of new line-of-business systems designed to improve productivity or provide the delivery of new electronic services to the public. A number of these systems involved exchanging secure information with other agencies to improve the accuracy of data and deliver enhanced geospatial services to the public.
The ICT branch continued to provide services as required to emergency and disease management centres established for the control and mitigation of events such as the locust plague, floods and the outbreak of myrtle rust. All the branch’s activities were carried out with a view to continuing to meet ICT security standards as established with the assistance of the department’s auditors.
Strategic business and knowledge managementWork commenced on a Knowledge and Information Management Strategy, including strategy mapping, formation of a business-focused steering committee, structured interviews with key stakeholders and development of a survey tool. The development of the strategy was placed on hold in March to allow inclusion of new members from the broader Department of NSW Trade & Investment prior to the release of a draft strategy for consultation.
The NSW Trade & Investment Program Management Office was formed to deliver and embed standardised best practice project management methods and processes. The Office will allow greater efficiency, transparency and consistency in relation to project and program management and delivery, and coordinate our Corporate Services integration activities and participation in whole-of-government Corporate & Shared Services Reform initiatives.
A new Internal Business Intelligence capability was built, leveraging the department’s investments in Business Objects and Data Warehousing, to enable timely, repeatable reporting and analysis with reduced impact on data processing staff. Proof of concept financial reports were delivered and work commenced on Human Resources/payroll reporting.
Several websites within the division of Industry, Innovation and Investment were consolidated into one concise Business NSW portal (launched December 2010), further supported by merging a range of disparate publishing processes into one web content-management platform, in line with departmental platform standards. The department also continued to develop and maintain its corporate
CORPORATE SERVICES DIVISION NSW TRADE & INVESTMENT ANNUAL REPORT 2010 -11

113
database of 20 000 clients from within the NSW business community. Redevelopment of the sydneyaustralia.com website, as the NSW Government’s marketing portal for Sydney as a business migration study and lifestyle destination, took place.
Substantial work was undertaken on the development of a platform for electronic service delivery, allowing clients to interact with the agency on a 24/7 basis. Testing is underway and ‘smart’ electronic forms are being piloted. Clients will be able to maintain their own online profile with the department, through which they may lodge grant applications, submit online forms, apply for sponsorship, register for events, and tailor the means by which they receive electronic marketing material. These measures will, in turn, allow the department to achieve reductions in red tape and administrative processing times and costs.
Development of the High Growth Diagnostic Tool for the Australian Technology Showcase was completed. The diagnostic tool comprises a hybrid online video/seminar presentation model designed to assist entrepreneurs and high-growth businesses to benchmark their level of innovation within the market place.
Corporate Services integration work continued, including finalisation of finance migration for the division of Industry, Innovation and Investment and integration of its networks and the conversion desktops to NSW Trade & Investment standard configurations. This integration should be completed in the first quarter of 2011-12, and planning is underway for NSW Trade & Investment integration requirements.
Use of the Industry, Innovation and Investment divisions Project Collaboration system was extended to all Corporate Services integration work to ensure better communication and efficiency.
A pilot of the secure corporate social networking tool Yammer was undertaken in NSW Trade & Investment to explore uses of these tools and the value brought to the department via better communication and collaboration between staff. Approximately 10 per cent of the NSW Trade & Investment workforce had joined the pilot by year’s end.
Future plans The department has a number of challenges for the coming year, including:
• continuation of electronic service delivery, with integration activity focusing on the new department and development of infrastructure and support to meet continuing demand for mobile solutions such as smartphones and tablet devices
• training and rollout of the Internal Business Intelligence platform for management reporting and analysis of financial, payroll and HR information, to empower cost centre and program managers
• development and implementation of standard project/program methods and processes via Program Management Office and enhanced transparency through
better project reporting, prioritisation, benefits realisation and reviews. The Office will participate in whole-of-government initiatives relating to Program Management and Corporate & Shared Services reform
• complete development of the Knowledge and Information Management Strategy and commence implementation, including development of ICT Strategic plan as a result of requirements identified
• updating the department’s project and team collaboration tools as an enabler of efficient and effective interactions, projects and programs
• completion of the NSW Trade & Investment corporate services integration and commence migration of the six different finance, human resources and payroll services onto one platform for new areas of the department, including the formation of Destination NSW
• participation in whole-of-government Corporate and Shared Services reform, including benchmarking and standardisation of business processes.
NSW TRADE & INVESTMENT ANNUAL REPORT 2010 -11 CORPORATE SERVICES DIVISION

114 STATUTORY AGENCIES NSW TRADE & INVESTMENT ANNUAL REPORT 2010 -11
NSW TRADE & INVESTMENT STATUTORY AGENCIES
Screen NSW 115
Forests NSW 116
NSW Food Authority 117
NSW Rural Assistance Authority 117
Game Council NSW 118
Art Gallery of NSW 119
Australian Museum 119
Museum of Applied Arts and Sciences 120
State Library of NSW 120
Sydney Opera House 120
Responsible Gambling Fund 121
Casino, Liquor and Gaming Control Authority 121
Catchment Management Authorities 122
115NSW TRADE & INVESTMENT ANNUAL REPORT 2010 -11 STATUTORY AGENCIES
SCREEN NSWScreen NSW is the NSW Government’s dedicated agency to foster and facilitate creative excellence and commercial growth in the NSW screen industry. Screen NSW programs seek to stimulate investment and jobs through new creative and business opportunities, promote innovation in screen content and technology, and champion the contribution the NSW screen industry makes to our culture, economy and society.
Screen NSW works to make NSW the most attractive State for international and local screen production by developing and investing in screen content and talent, minimizing red tape and providing expert advice on all aspects of filming in NSW.
Screen NSW is required to produce its own annual report, which will be available at: www.screen.nsw.gov.au
Key ChallengesScreen NSW faced a number of challenges in 2010 -11 including:
• The strength of the Australian dollar against the US dollar, the effects of the global financial crisis and competitive financial incentives in other jurisdictions (including US states, Canada and New Zealand) increased the importance of sustained investment in the domestic industry. Screen NSW focused on supporting the local industry’s skills base and infrastructure through project and professional development, to position NSW for a recovery in Australian dollar export competitiveness.
• Tax incentives announced by the Federal Government in 2008, and increased Federal allocations to ABC and SBS for domestic content production created greater national competition for private and direct Federal screen investment. Screen NSW focused on enterprise development and positioned its Development and Production Funds to strengthen NSW screen businesses and projects, in order to leverage these opportunities.
Major results for 2010 -11
Increased jobs and investment across NSW In 2010 -11, Screen NSW invested $7.9 million in 43 screen projects, generating $125 million in expenditure in NSW. It approved development funding of $1.25 million, which included development of 106 screen projects, 14 festival travel approvals, eight above-the-line attachments, two Producer Extension Scheme placements and three special development initiatives. Screen NSW also provided $160 000 to four projects through the Aurora Script Workshop, Screen NSW’s intensive script development program.
Screen NSW provided $455 000 to 14 organisations for industry and professional development initiatives.
Screen NSW ensured regional NSW shared in the economic and cultural benefits of screen production by providing
$442 028 to five screen projects through the Regional Film Fund, which leveraged over $1.9 million expenditure in the Blue Mountains, Trundle, Yarramundi, Windsor, Wilberforce and Ballina.
An amount of $303 000 was provided for 15 short film projects across three initiatives for emerging screen practitioners, namely:
• Screen NSW’s Emerging Filmmakers Fund
• Metro Screen’s ‘Breaks’ program
• ‘Out There and Deadly’ - a joint initiative between Screen NSW and Metro Screen for emerging Aboriginal and Torres Strait Islander Filmmakers.
An amount of $92 500 was also provided through the VFX Placement Scheme to support five emerging visual effects (VFX) artists with placements in top Sydney-based post, digital and VFX companies.
Sydney and NSW highly valued for tourism and investment Screen NSW marketed the strengths of the NSW screen industry globally. It provided location pitches for 273 international and local screen projects, including feature films, factual productions, TV series, short films and television commercials. Nine inbound scouts were hosted for international companies such as Fox International Pictures (China) and Evergreen Films.
Screen NSW funded projects achieved critical and commercial success, showcasing NSW locations, communities and lifestyle to national and international audiences and key tourism markets. The ABC children’s drama Dance Academy aired across Germany, France, Italy, Ireland and New Zealand, while the SBS TV series East West 101 screened in 97 countries globally. The first China/NSW co-production, 33 Postcards, which stars Guy Pearce and Claudia Karvan, screened at the Sydney Film Festival and Shanghai International Film Festival.
Sydney was also named a UNESCO City of Film, which recognises Sydney’s international reputation as a world-class centre for screen production, promotion and exhibition.
Positive business environment Screen NSW continued to work with local and state government authorities and the screen industry to implement Film Friendly policies. A survey of the first year’s operation of the protocol was undertaken in August 2010, with 86 responses received from Local Government and industry. A report with recommendations following a period of consultation will be presented to the Department of Local Government in the second half of 2011.

116
Future directionsIn 2011-12, Screen NSW plans to:
• increase investment and jobs in NSW through new screen activity (local and international), and develop, nurture and inspire local creative talent
• assist production enterprises to be more robust, by considering new market opportunities and emerging production and distribution platforms
• aggressively market NSW as Australia’s screen production capital.
FORESTS NSWForests NSW is a public trading enterprise within the Department of Primary Industries, part of NSW Trade & Investment, and is the registered business name of the Forestry Commission of NSW. It operates to internationally recognised standards to sustainably manage around two million hectares of native and planted State forests for a wide range of economic, environmental and social values.
Forests NSW develops a yearly Corporate Business Strategy with performance goals and targets to guide its business operations.
For more information, see the separate annual report prepared by Forests NSW which contains detail on its social, environmental and economic performance – www.dpi.nsw.gov.au/forests
Major results for 2010 -11
Financial PerformanceA trading profit of $33.7million was recorded for 2010 -11. Considering wet weather hindered timber harvesting operations in many regions, impacting on revenues, this is a strong financial performance being some $17 million above budget.
Continuing focus by Forests NSW on business improvement strategies, together with higher than anticipated timber sales in planted forests and sales of NSW Greenhouse Abatement Certificates has resulted in Forests NSW generating strong cash flows. Forests NSW was able to pay down $10 million of debt, with savings in interest payments of $550 000.
Upgrade of Blowering Nursery CompletedStage 2 of the expansion program at Blowering Nursery near Tumut was completed, allowing for the nursery to plant five million additional containerised seedlings. This stage of the three year expansion program included a new mechanised sowing line and associated infrastructure, fully automating a large number of manual tasks.
Many benefits flow from growing containerised stock including a safer work environment for employees, water efficiencies using irrigation booms, flexibility with delivery of growing stock, improved seedling survival rates by planting
direct from trays, efficient return on seed resources and reduced establishment costs.
These benefits are now a reality for Forests NSW with Blowering Nursery established as a best practice commercial nursery facility.
Sustainable forest managementAFS Certification Maintained
Forests NSW certification to the Environmental Management System (ISO 14001:2004) and Australian Forestry Standard (AS 4708:2007) were reconfirmed following independent third party audits.
Safety performanceThe total number of lost time and recordable injuries were 41 compared to 57 for 2009 -10, resulting in a recordable incident rate of 5.6 in 2010 -11. Although a 20 per cent reduction on the previous year, it did not reach the yearly target of 4.7. This was a disappointing result, but it is pleasing to note that other performance indicators such as the Lost Time Injury Frequency Rate was 2.6 compared to 3.6 last year, with the average number of days lost also reduced from 17.5 days last year to 11.1 this year.
Forests NSW implemented a number of safety initiatives during 2010 -11 all of which were aimed at increasing employee awareness and engagement in workplace safety matters. A ‘safe work card’ was issued to every employee with the intent to empower employees to approach staff, contractors or visitors when they are observed doing an unsafe act.
An organisation-wide self assessment process was also introduced where each functional area conducts a safety gap analysis prior to their annual planning cycle.
Forests NSW continued to work with its business partners to improve the safety performance of contractors engaged in harvesting and delivering timber to customers. A partnership agreement entered into with WorkCover NSW aims at improving safety performance across the entire forest industry.
Forests NSW Performance
Key result area 2010 -11 Budget 2010 -11 ActualTrading Profit ($million) 16.5 33.7
Timber sales by value ($million) 151.8 151.3Timber sales by volume (m³) 5 056 000 5 123 000
STATUTORY AGENCIES NSW TRADE & INVESTMENT ANNUAL REPORT 2010 -11

117
NSW FOOD AUTHORITYThe NSW Food Authority is a government agency that works to ensure food sold in the State is safe and correctly labelled and that consumers are able to make informed choices about the food they eat.
Responsible to the NSW Minister for Primary Industries, we provide a single point of contact on food safety for industry, local government and consumers. We are Australia’s first and only through-chain food regulatory agency, regulating and monitoring food safety across NSW from primary production through to point-of-sale.
The Authority provides the regulatory framework for the NSW food industry by administering and enforcing state and national food legislation. This includes the national Food Standards Code and the NSW Food Act 2003, as well a range of food safety schemes, which regulate key industry sectors of the food industry.
The NSW Food Authority is required to produce its own annual report, which will be available at: www.foodauthority.nsw.gov.au
Major results for 2010 -11
Foodborne illness investigationsThe NSW Department of Health and the Authority are jointly responsible for investigating outbreaks of foodborne illness.
Our Foodborne Illness Investigation (FBI) Unit is responsible for managing food related incidents and outbreaks. We do so in accordance with the National Food Incident Response Protocol and the Food Industry Emergency sub-plan.
During 2010 -11, we investigated 701 individual cases and 514 incidents affecting two or more people. These reports involved inadequately handled raw egg based products such as pork rolls and fried ice cream, undercooked chicken, and incidents where ill chefs contaminated food through poor hygiene.
AuditsOne of the Authority’s most important roles is to audit businesses operating under an approved Food Safety Program (FSP) - to ensure that they comply with food safety requirements.
Our officers regularly check the overall effectiveness of food safety schemes in the meat, dairy, seafood, plant products and vulnerable persons sectors.
During 2010 -11, this resulted in 5187 audits being conducted.
ProsecutionsThe Authority is responsible for investigating breaches of the NSW Food Act 2003.
We have in place tough enforcement strategies that ensure food sold in New South Wales is safe and correctly labelled.
During 2010 -11, the Authority pursued 86 charges prosecutions against eight defendants in the Local Court, achieving a 100 per cent prosecution success rate.
NSW RURAL ASSISTANCE AUTHORITYThe New South Wales Rural Assistance Authority was constituted pursuant to the Rural Assistance Act 1989.
In broad terms the function of the Authority is to administer a wide range of assistance measures to the rural sector. These assistance measures are both Commonwealth and State funded. Whilst the rural sector is its core client, the Authority is also responsible for small businesses that have suffered loss or damage due to natural disaster.
The Authority’s three corporate objectives relate to administration of assistance under the Natural Disaster Relief Assistance, Rural Adjustment Scheme and Special Conservation Scheme.
They are to ensure that:
• NSW farmers, agricultural industries and the general public are aware of and have access to the assistance available when dealing with extreme events
• NSW farmers and farming-related small businesses increase their ability to resist and overcome financial challenges
• NSW farmers and agricultural industries utilise improved natural resource management techniques.
The Authority is also responsible for the administration of the Farm Debt Mediation Act 1994 which commenced in February 1995. The object of this Act is to provide for the efficient and equitable resolution of farm debt disputes. Mediation is required before a creditor can take possession of property or other enforcement action under a farm mortgage.
The NSW Rural Assistance Authority is required to produce its own annual report, which will be available at: www.raa.nsw.gov.au/about/publications
Major results for 2010 -11Throughout 2010 -11, the Authority has continued to provide support and information throughout regional NSW.
NSW Primary Producers and Small Rural Business, while initially anticipating a turnaround in their fortunes once the drought broke, were faced in 2010 -11 with some of the worst flooding this state has experienced. These flood events resulted in loss of income and damage to
NSW TRADE & INVESTMENT ANNUAL REPORT 2010 -11 STATUTORY AGENCIES

118
Performance at a glance – 2010 -11
Scheme Applications Received Applications Approved Assistance $
Natural Disaster Relief Assistance - loans 664 263 28 093 400Natural Disaster Relief Assistance - grants 6 384 4 351 64 472 961Special Conservation Scheme 117 74 5 154 615Rural Adjustment Scheme – Primary Producer 2 977 3 335 153 507 280Rural Adjustment Scheme – Small Business 335 314 10 123 790
A total of 109 new cases commenced under the Farm Debt Mediation Act 1994.
infrastructure, plant and equipment. In total there were 77 Local Government Areas declared as having experienced a natural disaster (flood) event in November/December 2010 – January 2011 period.
The Authority processed 490 loan applications under the Natural Disaster Relief Assistance (NDRA) scheme and 4728 Recovery Grant applications.
The Special Conservation Scheme saw a major decline in receipt of applications in the 2010 -11 financial year. It is probable that this decline can be attributed to the natural disaster events experienced throughout the State.
The majority of Exceptional Circumstances (EC) declarations have expired due to improved conditions across the state. There are now only two areas in NSW (Bundarra and
Eurobodalla) eligible for Exceptional Circumstances Interest Rate Subsidy ( ECIRS) assistance. During 2010 -11 the Authority processed 4041 applications to the value of $163.6 million. Over 55 000 applications have been assessed since the initial 2002 declaration with over 47 000 approved to the value of $1.57 billion.
The Authority has continued to focus on improving community awareness of its role during the 2011 financial year. In addition to the efficient assessment of applications, staff have participated in rural activities providing information and clarification on available assistance measures.
GAME COUNCIL NSWGame Council NSW is the statutory body responsible for implementing the functions of the Game and Feral Animal Control Act 2002 (the Act).Game Council NSW provides a licensing system for game hunting licence holders to harvest:
• game and feral animals in declared NSW State forests
• wild deer and gamebirds on private property in NSW.
A total public land area of more than two million hectares, covering several hundred declared State forests, was available to game hunting licence holders in 2010 -11. Game Council also provides strategic field management through a network of professional Game Managers, and is the lead agency for the provision of hunter education initiatives in New South Wales.
Game Council NSW is required to produce its own annual report, which will be available at: www.gamecouncil.nsw.gov.au
Major results for 2010 -11In 2010 -11, Game Council NSW enabled the department to improve its performance by continuing to maintain a strong base of game hunting licence holders. A strong licence holder base provides a corresponding income stream, through sales of game hunting licences, that reduces the burden on taxpayers for the cost of removing game and
feral animals from both State forests and private farmland in New South Wales.
In terms of game and feral animal harvests, Game Council NSW licensed hunters continued to record impressive results. An estimated 780 000 game and feral animals were removed from private property in New South Wales by game hunting licence holders during 2010 -11.
The total game and feral animal numbers taken in State forests for 2010 -11 was 14 161. This brings the total to 55 440 since March 2006, when hunting in declared State forests first commenced.
STATUTORY AGENCIES NSW TRADE & INVESTMENT ANNUAL REPORT 2010 -11
119
ART GALLERY OF NSWThe Art Gallery of NSW collects, conserves, interprets and displays works of art, with a special emphasis on the artistic traditions of Australia and its neighboring regions.
The Art Gallery of NSW is required to produce its own annual report, which will be available at: www.artgallery.nsw.gov.au
Major results for 2010 -11During 2010 -11, the major highlights included the Gallery’s senior curator of Aboriginal and Torres Strait Islander art, Hetti Perkins working in partnership with Hibiscus Films, to write and narrate the art + soul television documentary series which screens on ABC TV. This project was supplemented by the Gallery’s presentation of the art+soul exhibition which drew on key works from our collection that explored the diversity of Indigenous culture and featured the work of artists from the groundbreaking series.The Gallery also published a lavishly illustrated companion book art+soul featuring over 150 artworks and staged a wonderfully popular open weekend of 60 plus free activities held over the October 2010 long weekend which attracted over 19 000 participants including many family groups.
In December 2010 the Gallery opened ‘The First Emperor: China’s Entombed Warriors’ which brought to Sydney one of the greatest archaeological discoveries of our time. This major exhibition presented over 120 objects, 10 of the
world-renowned warriors and horses, significant recent finds from the first Emperor’s mausoleum and explored the period of Chinese history preceding the Qin dynasty. This blockbuster show, the first of three major Gallery shows in the Sydney International Art Series, attracted the Gallery’s second highest ever audience with final attendance numbers exceeding 306 000.
In May 2011, the NSW Premier Barry O’Farrell, officially opened our new floor for contemporary art, featuring the John Kaldor Family Gallery. With the inclusion of the Kaldor Collection, the Gallery now holds Australia’s most comprehensive representation of contemporary art from the 1960s to the present day. In 2008 John Kaldor and his family announced their intention to give the John Kaldor Family Collection to the State of NSW. This was the catalyst for the government to provide funds to the Gallery to build a state-of-the-art offsite storage facility to allow space within the Gallery to display the collection. The Kaldor Family gift, valued in excess of $35 million, is the largest single art donation to an Australian public gallery and includes over 200 works of art. The open weekend held in conjunction with the launch of this new free entry public space also proved to be popular attracting over 12 000 participants to the 50 plus free events.
AUSTRALIAN MUSEUMThe Australian Museum is Australia’s leading museum of nature and culture. It has a strong regional presence through partnerships and outreach programs, providing greater access to its collections, research and programs.
The Australian Museum is required to produce its own annual report, which will be available at: www.australianmusuem.net.au
Major results for 2010 -11 In 2010 -11, the Museum’s Video Conferencing reached 8300 students across NSW. Of these 3000 participated in the Museum’s Country Areas Program (CAP).
The ever popular Museum in a Box program delivered 540 Boxes to schools and community groups, reaching 60 000 students. In addition 31 000, students visited the Museum (12 000 participating in Museum Educator-led lessons). School group activities offsite reached another 1000 students.
The Museum’s Jurassic Lounge pilot program was a huge success, and will recommence in August 2011. The Tuesday night openings combined entertainment, refreshments and Museum insights to a total of 12 400 visitors in just 12 weeks.
‘Rituals of Seduction: Birds of Paradise’ opened in April to an enthusiastic reception, and runs to August 2011. Combining
research expertise in biology and the cultural significance of the birds, with the natural science and cultural collections, the Museum created a visually spectacular exhibition. It was combined with a community engagement program of events, including dance performances and talks by representatives of Goroka University and the Huli people of the Western Highlands.
In May 2011 Museum staff took part in a bio-discovery expedition to the remote Kermadec Islands (between New Zealand’s North Island and Tonga). It was a collaboration between the Auckland Museum, Australian Museum, Museum of New Zealand Te Papa Tongarewa, and the New Zealand Department of Conservation. Numerous new fish distribution records were documented, and as research progresses on the marine invertebrates collected we are assured that new species will be identified.
Museum staff also developed a mobile phone application for a ‘Field Guide to Frogs of Australasia’, and are working on an iphone/ipad application for ‘Dangerous Australians’.
The Museum’s Lizard Island Research Station switched to solar power in February 2011, achieving reduced carbon emissions of more than 50 per cent. Much of the $550 000 cost was funded by the Lizard Island Reef Research Foundation 30th Anniversary Development Fund.
NSW TRADE & INVESTMENT ANNUAL REPORT 2010 -11 STATUTORY AGENCIES
120
MUSEUM OF APPLIED ARTS AND SCIENCEThe Museum of Applied Arts and Sciences comprises the Powerhouse Museum, the Powerhouse Discovery Centre at Castle Hill, the Sydney Observatory and the NSW Migration Heritage Centre. The Museum adopts innovative approaches to exhibition and program development, promoting an understanding of the relationship between human ingenuity and the development of technology, and focusing on people whose ideas have changed the way we live.
The Museum of Applied Arts and Science is required to produce its own annual report, which will be available at: www.powerhousemuseum.com
Major results for 2010 -11During 2010 -11, the Museum commenced a revitalisation project to create an exhibition space capable of presenting
major international exhibitions, along with changes to the entrance and forecourt of the Powerhouse Museum. The works will be completed in the fourth quarter of 2011.
Major exhibitions included ‘Creating the look: Benini and fashion photography’ which celebrated the work of the celebrated Melbourne photographer; ‘Frock stars: inside Australian Fashion Week’ to mark the 15th anniversary of this event, and the ‘Tinytoreum’, a playful interpretation of the Museum’s collection by author Jackie French and illustrator Bruce Whatley.
STATE LIBRARY OF NSWThe State Library of NSW collects and provides reference and research information services. Its collection is valued at over $2 billion and includes books, maps, manuscripts, pictures, photographs, ephemera, journals and rare objects. The State Library provides advice, research and professional development for the network of NSW public libraries, including administration of the State’s public libraries grants and subsidies.
The State Library of NSW is required to produce its own annual report, which will be available at: www.sl.nsw.gov.au
Major results for 2010 -11In 2010 -11 the State Library of NSW launched the Glasshouse Learning Space which will use the latest technologies to connect all NSW students and teachers with the Library’s premier cultural collection on the discovery and exploration of Australia and the Pacific.
The Library’s eRecords project has continued to exceed the annual targets in creating electronic records and increasing access to the collection. In June 2011 the Library added to the collection with one of its most important acquisitions to date, an extraordinarily rare collection of natural history drawings – the TAL & Dai-ichi Life Collection—created during the earliest years of British settlement.
SYDNEY OPERA HOUSEThe Sydney Opera House is one of the world’s busiest performing arts centres and tourism destinations with 8.2 million visitors stepping on site each year.
The Sydney Opera House is required to produce its own annual report, which will be available at: www.sydneyoperahouse.com
Major results for 2010 -11 Last year, the Sydney Opera House staged 1600 performances and events to audiences of 1.3 million people across seven venues over 362 days. Some 280 000 people took a guided tour in one of seven languages.
Highlights at the House include the Summer at the House Festival which welcomed 160 000 people and families to 31
programs. Sydney Opera House threw open its doors to the public on October Open Day and invited 18 000 people in for a free visit.
On the digital stage, the YouTube Symphony Orchestra performed live in the Concert Hall with a live concert featuring 101 musicians from 33 countries live streamed to a global audience of some 33 million.
Vivid LIVE lit up the city as part of Vivid Sydney attracting an audience of 35 000 with 58 per cent of people visiting the House for the first time. In May 2011, the Opera House launched its Reconciliation Action Plan setting targets for education, employment and increased participation in performing arts programs.
STATUTORY AGENCIES NSW TRADE & INVESTMENT ANNUAL REPORT 2010 -11
121
RESPONSIBLE GAMBLING FUNDThe Responsible Gambling Fund draws its income from a two per cent levy on the Sydney Star City casino’s gaming revenue, as required by the Casino Control Act 1992. Money from the Fund is spent predominantly on the development and implementation of programs that aim to reduce and prevent the harms associated with problem gambling.
The program is overseen by a board of Trustees who make recommendations to the Minister for Tourism, Major Events, Hospitality and Racing. The Trustees are supported in their work by officers of the Office of Liquor, Gaming and Racing.
Major results for 2010 -11During the 2010 -11 financial year, income to the Fund was $13.682 million and expenditure from the fund was $14.299 million .
$11.243 million was spent on the counselling and support program to assist people with gambling-related problems. The program includes Gambling Help services (face-to-face services, 24-hour helpline service and the 24-hour online service) and the service and workforce development programs such as accreditation, minimum qualification, clinical supervision, code of ethics and training.
$0.349 million was spent on research to better inform the development of responsible gambling-related policy. This includes the review of Responsible Conduct of Gambling training and the national Gambling Research Australia program.
$1.628 million was spent on communication activities to raise awareness about problem gambling and the availability of Government-funded resources and counselling services. Activities include the Gambling Hangover campaign, Responsible Gambling Awareness week, the Early Intervention, Prevention and Community Engagement Strategy for Aboriginal and culturally and linguistically diverse communities as well as the Gambling Help website, social media and mobile phone applications.
For further information, refer to the Responsible Gambling Fund Annual Report 2010 -11 which will be available shortly at: www.olgr.nsw.gov.au/gaming_rgf.asp
CASINO, LIQUOR, GAMING CONTROL AUTHORITYThe Objects of the Casino, Liquor and Gaming Control Authority, as set out in Section 140 of the Casino Control Act 1992, are to maintain and administer systems for the licensing, supervision and control of a casino, for the purpose of:
• ensuring that the management and operation of the casino remains free from criminal influence or exploitation
• ensuring that gaming in the casino is conducted honestly
• containing and controlling the potential of a casino to cause harm to the public interest and to individuals and families.
Section 141 of the Casino Control Act 1992 provides that the Authority has such functions as are necessary or convenient to enable the Authority to achieve its objects.
Liquor licensing: • to regulate and control the sale, supply and consumption
of liquor in a way that is consistent with the expectations, needs and aspirations of the community
• to facilitate the balanced development, in the public interest, of the liquor industry, through a flexible and practical regulatory system with minimal formality and technicality
• to contribute to the responsible development of related industries such as the live music, entertainment, tourism and hospitality industries.
To secure the objects of the Liquor Act 2007, each person
who exercises functions under this Act (including a licensee) is required to have due regard to the following:
• the need to minimise harm associated with misuse and abuse of liquor (including harm arising from violence and other anti-social behaviour)
• the need to encourage responsible attitudes and practices towards the promotion, sale, supply, service and consumption of liquor
• the need to ensure that the sale, supply and consumption of liquor contributes to, and does not detract from, the amenity of community life.
Gaming Machine Regulation: • to minimise harm associated with the misuse and abuse
of gambling activities
• to foster responsible conduct in relation to gambling
• to facilitate the balanced development, in the public interest, of the gaming industry
• to ensure the integrity of the gaming industry
• to provide for an on-going reduction in the number of gaming machines in the State by means of the tradeable poker machine entitlement scheme.
The Authority, Director General, Director, Commissioner of Police, and all other persons having functions under the Casino Control Act 1992 are required to have due regard to the need for gambling harm minimisation and the fostering of responsible conduct in relation to gambling when exercising functions under the Act.
NSW TRADE & INVESTMENT ANNUAL REPORT 2010 -11 STATUTORY AGENCIES

122
In particular, due regard is to be had to the need for gambling harm minimisation when considering for the purposes of the Casino Control Act 1992 what is or is not in the public interest.
For further information, refer to the Casino, Liquor and Gaming Control Authority Annual Report 2010 -11 which will be available at: www.olgr.nsw.gov.au/liquor_CLAGCA.asp
CATCHMENT MANAGEMENT AUTHORITIES
Thirteen Catchment Management Authorities (CMA’s) are working with farmers, Landcare and other ‘carer’ groups, Aboriginal communities, local government, industry and state agencies to respond to the key natural resource management (NRM) issues facing their catchments. The specific functions of CMAs are described in the Catchment Management Authorities Act 2003.
Border Rivers/Gwydir CMAThe Border Rivers-Gwydir CMA covers an area of 50 000 square kilometres in Northern NSW. It is bounded by the Queensland border to the north, the Great Dividing Range in the east, runs south to Uralla and west to the Barwon River at Collarenebri.
The Border Rivers-Gwydir CMA is required to produce its own annual report, which will be available at: www.brg.cma.nsw.gov.au
Major results for 2010 -11 • Local Inverell Aboriginal Elders together with the Chair
of the Border Rivers-Gwydir CMA Board, Dr Bob Crouch, launched the Indigenous Cultural Heritage Oral History DVD and booklet. The DVD and accompanying booklet share a selection of stories told by Aboriginal community members from around the catchment about Indigenous culture and traditional natural resource management practices.
• The Border Rivers-Gwydir CMA funded the building of the new Parthenium Weed Washdown Bay on the Carnarvon Highway at Mungindi. This project was in collaboration with the former Industry & Investment NSW, Northern Inland Weeds Advisory Council and Moree Plains Shire Council. The facility was officially opened on 19 October 2010, in preparation for the 2010 grain harvest.
• The Bridge to Bridge project is a collaboration between the Border Rivers-Gwydir CMA and Inverell Shire Council to improve water quality in an intensive urban and peri-urban landscape. The project is a combination of demonstration sites and educational learning activities. The project has completed a number of activities on a six kilometre stretch of the Macintyre River at Inverell. $82 000 of the $200 000 budget, has been invested in the reach of river to date.
Central West CMAThe Central West CMA covers approximately 185 000 square kilometres and is home to more than 183 000 people. This region contains the major catchments of the Castlereagh,
Bogan and Macquarie Rivers, as well as the internationally recognised Macquarie Marshes.
The Central West CMA is required to produce its own annual report, which will be available at: www.cw.cma.nsw.gov.au
Major results for 2010 -11 • This year the Central West CMA undertook a major
community based review of our Catchment Action Plan (CAP). Twelve community workshops, as well as workshops conducted with Landcare, local government and State agencies identified over 500 valued natural assets. We then used ‘resilience’ thinking (again in a community based workshop environment) to identify the systems most in danger of irreversible decline and developed state and transition models to determine priority actions to address degradation. The new CAP, currently awaiting approval from the Minister, outlines targets and actions to address the identified threats.
• In 2010 -11 the Central West CMA hosted more than 140 demonstrations and field days with over 6500 people attending. We delivered over 110 training sessions to more than 500 of our customers and stakeholders.
• In 2010 -11 the Central West CMA invested over $2.6m in on-ground natural resource management projects. Around 340 community and landholder projects were implemented.
Hawkesbury Nepean CMAThe Hawkesbury-Nepean CMA covers 22 000 square kilometres (2.2 million hectares) with a river system which flows 470 kilometres from near Lake Bathurst (near Goulburn) to Broken Bay. The catchment supports a population of 1 million people and generates over $1 billion each year in agriculture and horticulture (12 per cent of all NSW’s agriculture production). Twenty-three per cent of NSW’s electricity is generated within the catchment.
The Hawkesbury-Nepean CMA is required to produce its own annual report, which will be available at: www.hn.cma.nsw.gov.au
Major results for 2010 -11 • The Hawkesbury-Nepean Catchment Management
Authority (HNCMA) delivered a record $24.8 million (including partner contributions) in on ground improvements during the year.
• The HNCMA multiplied NSW and Australian government investment by a factor of $1:$1.96 during 2010 -11 by leveraging partner contributions. Looking ahead to
STATUTORY AGENCIES NSW TRADE & INVESTMENT ANNUAL REPORT 2010 -11

123
2011-12, the HNCMA will achieve a 12- per cent growth in revenue.
• The HNCMA continued its partnership with DPI to complete the $7 million Nutrient Smart Farms Project and the $20.7 million Water Smart Farms Project which has run for two years. In 2010 -11 the project developed:
– 127 Water Smart Farms projects with landholders to improve farm water use efficiency
– 140 Nutrient Smart Farms projects with landholders to improve nutrient management on farms for the benefit of water quality
Hunter/Central Rivers CMAThe Hunter-Central Rivers region covers 37 000 square kilometres from Gosford to Taree and inland to Merriwa and 1500 square kilometres offshore. The region is home to 1.25 million people, and covers 21 Local Government Areas and 15 Local Aboriginal Land Councils.
The Hunter-Central Rivers CMA is required to produce its own annual report, which will be available at: www.hcr.cma.nsw.gov.au
Major results for 2010 -11 • Invested $17 234 000 into improving the health of the
Hunter-Central Rivers region including on-ground works, education and capacity building activities.
• Introduced the CMA’s first Aboriginal scholarship program, awarding scholarships to Aboriginal students undertaking studies in Natural Resources Management.
• Developed Aboriginal Cultural Heritage displays.
• Partnered with the Aboriginal community at Tocal Field Days (an event attracting 23 000 visitors) to promote the importance of protecting Aboriginal culturally significant landscapes.
• Invested $3.5 million into the Hunter Estuary including $1.47 million through the Australian Government’s Caring for Our Country program.
More than 50 hectares of estuarine wetlands have been cleared of invasive weeds, 100 metres of shorebird roost on dyke walls have been repaired and raised, 30 hectares of wetlands now have improved water management and water quality, tidal flows have been improved through 1500 metres of creek, 1000 metres of riverbank has been protected from erosion with fish friendly rock work, and two hectares of river bank areas have been revegetated. All these activities would not have been achieved without the help of various project partners and countless local and international volunteers.
Lachlan CMALocated in Central Western New South Wales and extending westwards from the Great Dividing Range, the Lachlan catchment is part of the Murray-Darling Basin and represents 8 per cent of the basin system. The catchment covers an area of approximately 84 700 square kilometres and has a recorded population of over 100 000.
The Lachlan CMA is required to produce its own annual report, which will be available at: www.lachlan.cma.nsw.gov.au
Major results for 2010 -11 • The inaugural Inter CMA Forum was successfully hosted
by the Lachlan CMA in Forbes from the 6th to the 8th September 2010 adopting the motto ‘Share, Collaborate and Grow’. The Forum encompassed presentations, workshops and question sessions designed to share information, knowledge, challenges and best practice amongst CMA staff; collaborate with other CMA staff to improve operation and business, and encourage working across CMA boundaries; and improve and grow as a professional in the field of NRM.
• We facilitated the development of the annual Environmental Watering Plan. Consultation was conducted with the community on issues relating to Lachlan Environmental Water Management Plan through feedback and three community forums. Agencies were coordinated for the development of the plan, building on the longer term relationships established through the Riverine Working Group.
Lower Murray Darling CMAThe Lower Murray Darling Catchment covers an area of 6.3 million hectares. The catchment extends from Broken Hill in the north to the Murray River in the south and from the Murray/Murrumbidgee junction to the South Australian border in the west.
The Lower Murray Darling CMA is required to produce its own annual report, which will be available at: www.lmd.cma.nsw.gov.au
Major results for 2010 -11All milestones were delivered in 2010 -11 including:
• the LMD CMA commenced community consultation toward the development of a revised Catchment Action Plan
• one Fish Habitat Management Plan was completed for the Darling River (upstream of Pooncarie)
• fish releases and the establishment of the 18km Karoola Reach Aquatic Threatened Species Habitat Management Zone
• 10km River Frontage works
• 2462ha wetland connectivity re-established
• 5748ha of Improved Land Management Practices cropping completed
• completion of the final of five Aboriginal Cultural Knowledge booklets for the main tribal groups
• aboriginal land managers’ forum 42 people attended; Aboriginal groups manage or co-manage 317 050 ha of the catchment
• 198 people attended Community and Youth Forums
• 328 people attended Capacity building workshops, field days and visited industry leaders
• one community survey undertaken
NSW TRADE & INVESTMENT ANNUAL REPORT 2010 -11 STATUTORY AGENCIES
124
Murray CMAThe Murray Catchment covers an area of 35 170 square kilometres. The catchment is bounded by the Murray River to the south, the Murrumbidgee River catchment divide to the north, the Australian Alps to the east and the confluence of the Murray and Murrumbidgee Rivers to the west.
The Murray CMA is required to produce its own annual report, which will be available at: www.murray.cma.nsw.gov.au
Major results for 2010 -11 • Edward-Wakool River Environmental Water Management -
The Murray CMA is the key delivery partner of a project to improve flows in the Edward-Wakool river system in order to enhance native fish populations. Over the past two years, the CMA has invested $527 000 (with an additional $68 000 provided by CEWH and in-kind support from DPI Fisheries) to design and implement experimental flow regimes for the Edward-Wakool system, and monitor changes to water quality, fish populations and fish movement patterns in response to flow. This work is contributing to the development of an environmental watering plan for the Edward-Wakool system, and providing feedback over a range of time scales to inform management over different time frames.
• Threatened Grassy Box Woodland project - This Cross-border collaboration with two Victorian CMAs (North East and Goulburn-Broken) was funded by the Commonwealth’s Caring for our Country program for $3 million over two years and was completed in 2010 -11. Murray CMAs individual contribution secured 1773 ha of threatened grassy woodlands (Box-Gum woodlands, Myall/Boree woodlands and Buloke woodlands). 605 ha are to be managed by in-perpetuity contracts. 126 land managers were involved. A ‘Noisy Miner Summit’ was hosted by Murray CMA in March 2011 to raise awareness of the impact of this bird in woodlands.
• Rigorous long term monitoring has been established in partnership with Australian National University and Charles Sturt University has conducted social research to assess the motivations of participating and non-participating landholders.
• Biodiversity retention and restoration on Travelling Stock Reserves - Travelling Stock Reserves (TSRs) are recognised for their high conservation significance, but are threatened by weeds and pest animals. The Murray CMA has collaborated with the Livestock Health and Pest Authorities (LHPA) in Hume and Riverina, with funding from Caring for our Country, to allow more than 6200 ha of TSRs on 76 reserves, to be actively managed for their conservation values, reducing the reliance of LHPA on limited income from annual grazing permits and local rate-payers.
• Murray Landcare and Producer Group/Landcare Facilitator project - Holbrook Landcare Network continued to show their innovation by bringing together three other delivery partners into their Regional Landcare Facilitator program (Corowa Landcare, Ricegrowers Association of Australia,
and the Western Murray Land Improvement Group). Murray CMA financially supports this program that, for the first time, establishes a catchment-wide forum that supports farming innovation and experimentation.
Murrumbidgee CMAThe Murrumbidgee Catchment is bounded by Cooma in the east, Balranald in the west, Temora to the north and Henty to the south. The catchment covers an area of about 84 000 square kilometres (8.4 million hectares). The Murrumbidgee River is the main stream running through the Murrumbidgee catchment.
The Murrumbidgee CMA is required to produce its own annual report, which will be available at: www. murrumbidgee.cma.nsw.gov.au
Major results for 2010 -11 • The Climate Change Corridors Project drew a good
response from landholders with 76 expressions of interest received. These expressions of interest were prioritised through the use of SCaRPA (Site and Catchment Resource Planning and Assessment), a spatially based decision support tool. SCaRPA is a business system that enables the user to develop assessment projects by utilising the full adaptive management approach guiding the projects through a robust, auditable and transferable reporting process.
• In 2010 -11, the Murrumbidgee CMA has achieved a commitment from landholders to improve management of 21 434 ha of grazing country, maintaining groundcover at high levels in pasture paddocks (both native and exotic). This has a large effect on the improvement of soil health, biodiversity, erosion and water quality in the catchment.
• The Murrumbidgee Wetland and Riparian Restoration project created opportunities for the local Aboriginal community to develop a better understanding of cultural heritage and natural resource management by providing training and on-ground experience in riparian areas.
Namoi CMAThe Namoi Catchment in north west NSW is bounded by the Great Dividing Range in the east, the Liverpool Ranges and Warrumbungle Ranges in the south, and the Nandewar Ranges and Mt. Kaputar to the north. Major tributaries of the Namoi River include Coxs Creek and the Mooki, Peel, Cockburn, Manilla, and Macdonald Rivers, all of which join the Namoi upstream of Boggabri. Stretching from Woolbrook in the east to Walgett on the western boundary the catchment is over 350 kilometres long.
The Namoi CMA is required to produce its own annual report, which will be available at: www.namoi.cma.nsw.gov.au
Major results for 2010 -11 • Developed a new Catchment Action Plan based on
‘resilience’ principles. Currently awaiting approval by the NRC.
• In the last financial year, Namoi CMA invested $5.56m
STATUTORY AGENCIES NSW TRADE & INVESTMENT ANNUAL REPORT 2010 -11

125
(which included $1.324m ASGE CDF monies) throughout the Namoi Catchment designed to achieve significant landscape change.
• In the past financial year, almost 8000 people participated in field days, forums, events, and educational opportunities run by Namoi CMA.
Northern Rivers CMAThe Northern Rivers region covers 50 000 square kilometres of which 60 per cent is freehold tenure and 21 500 square kilometres is managed as Crown land, national park or State forest. It includes Lord Howe Island, 600 kilometres east of Port Macquarie.
Detail of the Northern Rivers CMA 2010 -11 Annual Investment Program is provided in the Northern Rivers CMA Annual Report, available at: www.northern.cma.nsw.gov.au
Major results for 2010 -11 • The Clarence River Fishtrack project continued in 2010 -11
providing world class information by successfully track the movements of five fish species fitted with acoustic transmitter tags. More than 300 individual fish have been tagged since 2008, and their movements tracked using an array of 80 acoustic receiver (listening) stations covering over 600 kilometres of stream length. The Clarence array, the largest river system array in the southern hemisphere, together with ‘sister’ projects in other NSW CMA regions, is improving our knowledge of the seasonal movements and distribution of key fish species in relation to barriers, flows and spawning.
• During 2010 -11, 18 local organisations around the northern rivers region were contracted to provide Community Support Officers (CSO) and Aboriginal Extension Project Officers (AEPO) to represent the Northern Rivers CMA to stakeholder groups and the wider community at a local level. Based in the community, the CSO and AEPO roles have proven to be an effective way to engage the community in natural resource management and help deliver Northern Rivers CMA projects and incentive funding programs.
• The Mapping Cultural Landscapes project saw Aboriginal communities mapping areas of cultural heritage significance across almost 9500 hectares of identified urban growth areas in the Clarence, Nambucca and Bellingen local government areas. Through a culturally-appropriate engagement process, a total of 1695 hectares were mapped as have ‘significant’ cultural heritage value. The survey results were documented so individual councils can integrate the information into their planning systems to better protect Aboriginal cultural heritage.
Southern Rivers CMAThe Southern Rivers region covers a 32 000 square kilometre area of south-east NSW—from Stanwell Park in the north to the Victorian border in the south and three nautical miles out to sea. It extends westward to include the catchments of the Snowy, Genoa and Shoalhaven Rivers.
The Southern Rivers CMA is required to produce its own annual report, which will be available at: www.southern.cma.nsw.gov.au
Major results for 2010 -11Over the past 12 months, Southern Rivers CMA’s projects and programs have delivered almost $11.1 million in on-ground investment including:
• $2.5 m in community and partnerships programs
• $3.5 m in biodiversity programs
• $1.7 m in soils and land programs
• $3.4 m in water programs (including coastal and marine).
As a consequence of this investment the following has been achieved:
• 2976 ha of native vegetation has been rehabilitated or enhanced
• 4115 ha of native vegetation has been protected by voluntary agreements
• 39 274 ha have been controlled for animal pests
• 3710 ha have been treated for plant pests
• 5760 ha of pastures have been managed to improve soil health
• 304 groups and 527 individuals were supported throughout the year.
Southern Rivers CMA provided South East Queensland Catchments with staff assistance to assess and plan the restoration of catchments, following the Queensland flood disaster in early 2011.
An important milestone in South East NSW was reached in April 2011, with the official launch of the Eden Land and Sea Country Plan. The Plan was developed in collaboration with Aboriginal people who have traditional, historical and contemporary connections to land and sea country in the region. Work to further develop plans specific to Traditional Owners and Elders will be undertaken in the coming year.
Sydney Metropolitan CMAThe Sydney Metropolitan region is home to over three million people. Despite this intensity, more than 80 per cent of Sydneysiders live within 800 metres of some kind of open space. Surprisingly to many people, the Sydney Basin is the 5th most biodiverse region of Australia. The SMCMA is the only one of the 13 NSW CMAs with a specific focus on delivering natural resource management in an urban context.
The Sydney Metropolitan CMA is required to produce its own annual report, which will be available at: www.sydney.cma.nsw.gov.au
Major results for 2010 -11 • In October 2010 the SMCMA Botany Bay Water Quality
Improvement Plan received the prestigious Award for Excellence from the Environment Institute of Australia and New Zealand.The judging panel stated the project ‘provided a great range of environmental services to the key stakeholders of the Botany Bay catchment’. Also: ‘The
NSW TRADE & INVESTMENT ANNUAL REPORT 2010 -11 STATUTORY AGENCIES

126
SMCMA has worked with councils, universities, private consultants, NGOs and the local community to gain a better understanding of the ways water quality impacts on the ecological systems and environmental values of this catchment.’
• The SMCMA project ‘Environmentally-friendly’ Seawalls won the Innovation Category at the NSW Coastal Management Awards held in conjunction with the 19th NSW Coastal Conference at Batemans Bay in November. Seawalls are now a dominant feature of urban estuaries. This project took a fresh look at seawalls, developing a set of best-practice guidelines which have now have been incorporated into planning documents such as Estuary Management Plans and Development Control Plans at a number of councils. The Guidelines are also now routinely referred to in the assessment process for developments along estuary foreshores. As part of the project included a brochure was produced targeting private foreshore owners to encourage them to adopt environmentally friendly seawall designs.
• In what remains a world first, the SMCMA Water Sensitive Urban Design Program facilitates a NSW consortium in an innovative multi-disciplinary five-year research program ‘Cities as Water Supply Catchments’. Researchers from Monash, Melbourne and Queensland universities have collaborated for the last 12 months with more than 40 industry and government partners around Australia. The focus is to provide practical tangible solutions to harvesting stormwater by improving existing infrastructure, implementing new environment-friendly systems, and progressing policies to support how we build, operate and maintain more liveable Australian cities.
• The inaugural ‘Green Award’ for ‘innovative thinking and the most environmentally sustainable display or product’ at the Sydney Royal Easter Show was presented to the Bushcare and Biodiversity Stall and Garden. The stall is a partnership between Willoughby Council, the SMCMA and other local Councils who are all members of the Volunteer Coordinators Network (Sydney Region). Volunteers at the stall are drawn from 12 Sydney councils, 7 community nurseries and other organisations. The SMCMA provides administrative management to the Volunteer Coordinators Network. This comprises officers from local government, national parks and other organisations. The network represents 850 bushcare groups with more than 5000 regular environmental volunteers participating in events from tree planting to on-going maintenance and stewardship of open spaces across Sydney.
Western CMAThe Western Catchment is the largest in NSW, covering 230 000 square km or 29 per cent of the state. A significant portion of the Catchment makes up 20 per cent of the Murray-Darling Basin, with the remaining area falling within the Lake Eyre and Bulloo Basins.
The Western CMA is required to produce its own annual report, which will be available at: www.western.cma.nsw.gov.au
Major results for 2010 -11 • During 2010 -11, the Western CMA has continued to
work with local groups, organisations and individuals to ensure a healthier catchment in the longer term. In 2009 a decision was made to combine government funding for both 2009 -10 and 2010 -11 years into a two year program. This has meant that $8.9 million was invested over the two years to improve natural resources in the Western Catchment.
• During the 2009 -11 combined funding period, a total of $1.5 million was committed to 20 landholders who are managing 16 185 hectares for conservation. Land managers are protecting the endangered plant Showy Indigo, regenerating Lancewood at one of only two known occurrences of the trees in NSW and protecting areas of great cultural significance to Aboriginal people of the Western Catchment.
• A series of 19 documentaries were produced as part of the Aboriginal Cultural Knowledge System project under the guidance of the Western Catchment Aboriginal Reference Advisory Group (ARAG). The series features Elders and knowledge-holders from the Ngemba, Kamillaroi and Euahlayi language groups. It documents the land management practices and social, spiritual and cultural knowledge that enabled their people to care for the country for tens of thousands of years. Since its launch in October 2010, more than 1000 copies of the DVD have been requested by groups and individuals from every Australian state and territory and from six overseas countries.
• Western CMA invested $420 000 in Lake Woytchugga, which is an ephemeral overflow lake on the north-west of the Darling River near Wilcannia. It is an important wetland and of great cultural significance to the Baarkindji people. A narrow retention culvert was replaced with a larger and more effective structure, 2000 hectares of the Lake was fenced and educational signage about the Lake was erected. The area is used to educate Wilcannia children and three short documentaries about Lake Woytchugga have been produced and are available via the internet.
STATUTORY AGENCIES NSW TRADE & INVESTMENT ANNUAL REPORT 2010 -11
APPENDICES
127NSW TRADE & INVESTMENT ANNUAL REPORT 2010 -11 APPENDICES
Governance and management 1. Executive performance 1282. Principal officers 1413. Legislation and legal change 1424. Significant judicial decisions 1465. Evaluation and improvement 1476. Risk management and insurance 1477. Occupational health and safety 149
Human resources 8. Staff statistics 1519. Equal employment opportunity 15510. Overseas travel 162
Financial management 11. Credit card certification 17212. Consultants 17313. Payment of accounts 17414. Land disposal 17715. Capital works 17816. Disclosure of controlled entities 17917. Funds granted to non-government community organisations 18018. Fisheries trust fund report 22119. Cost of production of the 2010 -11 annual report 227
Operational 20. Research and development 22721. Waste reduction, recycling and energy management 22922. Implementation of recovery and threat abatement plans 232
Stakeholder relationships 23. Multicultural policies & service 23224. Customer service 23625. Volunteer program 23626. Freedom of information 23727. Privacy management 239
The process of integrating the statutory information of the department and divisions that form NSW Trade & Investment is on-going. In such cases the information is listed under the individual NSW Trade & Investment department and divisions.

128 APPENDICES NSW TRADE & INVESTMENT ANNUAL REPORT 2010 -11
1. Executive Performance
Mark Paterson AO B.Bus, FAIM, FRMIA, FAICDDirector General, Trade and Investment, Regional Infrastructure and ServicesSES Level 8Total remuneration package: $453 250 plus allowances $43 000 Period in position: 1 June 2011 to 30 June 2011
Mark I Paterson AO commenced his appointment as Director General of the Department of Trade and Investment, Regional Infrastructure and Services on 1 June 2011.
Mr Paterson previously held the position of Secretary of the Commonwealth Department of Innovation, Industry, Science and Research from 2007 to 2011 and Secretary of the Department of Industry, Tourism and Resources from 2002 to 2007.
Outside Government Mr Paterson has held a number of prominent positions including the Chief Executive roles of the Australian Chamber of Commerce and Industry, the Retailers Council of Australia and the Retail Traders Association of NSW. Mr Paterson was until recently on the Board of CSIRO, and has formerly held Board positions with AusTrade, the Australian Tourism Commission and the Australian Export Finance Insurance Corporation.
He is a Fellow of the Australian Institute of Company Directors, the Australian Institute of Management and the Retail Management Institute of Australia and was appointed as an Officer of the Order of Australia in 2007 for service to business and industry through policy development and economic research.
The Director General took a lead role in:
• leading transformational change within the principal department and its portfolio agencies to shift organisational focus towards clear, accountable delivery of Government priorities
• delivering key Government commitments identified in the 100 Day Action Plan, including the establishment of Destination NSW and the Visitor Economy Taskforce to promote tourism and secure major events
• participating in the development of the new NSW 2021 Plan which will articulate Government goals, targets and actions to rebuild the economy, return quality services, renovate infrastructure, strengthen our local environment and restore accountability
• leading cultural change of improved productivity, customer service and accountability by proactively engaging with the Executive and staff across the breadth of the department through regular communication and site visits
• commencing development of a new management structure for the department including progress towards a robust budget framework to ensure budget targets will be achieved into the future
• delivering programs to support jobs and investment in NSW worth $2.6 billion in investments to the State with an employment impact of over 15 000 jobs
• assisting NSW industries to become more globally competitive through direct support to 656 companies in generating $484.86 million in export sales
• attracting investment that contributed to mineral production of around $19.5 billion
• successfully responding to a number of natural disasters and emergencies, including incursions by myrtle rust, Queensland fruit fly, mice, aquatic weeds, unprecedented plague locusts and two major flood episodes.

129NSW TRADE & INVESTMENT ANNUAL REPORT 2010 -11 APPENDICES
Dr Richard Sheldrake MScAgr PhD FASM FAICD FTSESES Level 8Total remuneration package: $453 250 plus allowances $10 000
Director-General, Industry & Investment NSW Period in position: 1 July 2010 to 3 April 2011
Director General, NSW Trade & Investment Period in position: 4 April 2011 to 31 May 2011
Director General, Department of Primary Industries Period in position: 1 June 2011 to 30 June 2011
Commissioner of Forests Period in position: 1 July 2010 to 30 June 2011
Following the election of a new Government in March 2011, Dr Sheldrake was appointed as the Director General of the Department of NSW Trade and Investment, Regional Infrastructure and Services effective from 4 April 2011.
Consistent with a commitment made by the new Government, the Department of Primary Industries (DPI) was re-established and Dr Sheldrake was appointed Director General of DPI on 1 June 2011.
Dr Sheldrake has met all performance criteria for the positions held in 2010 -11.
Highlights include:
• setting the strategic direction of I&I NSW prior to the establishment of NSW Trade and Investment, in line with NSW State Plan. This included delivering, monitoring and reporting on the I&I NSW Corporate Plan 2010 -13 and meeting commitments under the State Plan
• continuing structural reform within I&I NSW to ensure further integration, management and budget efficiencies
• ensuring effective corporate governance through the implementation of an enterprise risk management framework, internal audit processes, performance reporting systems and policy development standards
• positioning the department as a public sector and industry leader in safety by creating a safe work environment and building a strong safety culture through implementation of a Staff Welfare and Safety Strategy
• developing and implementing staff attraction, retention and development programs such as the young employees syndicate
• leading delivery of a range of programs to support creation of jobs in urban and regional NSW and generate an increase in total investment in NSW of $2.6 billion
• driving science-based innovation capability across NSW through the work of the Office of Medical Research and through delivery of approximately 900 in-house Primary Industries research projects
• participating in the scoping and development of the Government’s Strategic Regional Land Use Policy and Aquifer Interference regulation
• demonstrating progress towards State Plan targets for renewable energy consumption, electricity reliability and energy savings and maintaining energy consumer protection frameworks
• continuing to deliver practical measures to maintain healthy, safe and biosecure industries, including driving the $56.7 million biosecurity facility upgrade at the Elizabeth Macarthur Agricultural Institute
• fostering sustainable management and use of natural resources in NSW. This included managing the Sustaining the Basin Farm Modernisation Project for Border Rivers-Gwydir funded under the Australian Government’s Water for the Future initiative, publishing the Status of Fisheries Resources in NSW report and conducting research to ensure farm productivity and sustainability, including projects to breed livestock to reduce greenhouse gas emissions, develop the new Sherpa Rice variety and improve basin irrigation systems
• overseeing the NSW Food Authority to ensure food in NSW is safe and is correctly labelled so that consumers can make informed choices
• supporting the strong economic performance of Forests NSW
• successfully responding to a number of natural disasters and emergencies including a myrtle rust outbreak, major flood events, Pacific Oyster Mortality Syndrome disease, a locust outbreak and a significant mouse plague.
1. Executive Performance (cont’d)

130 APPENDICES NSW TRADE & INVESTMENT ANNUAL REPORT 2010 -11
George Davey MSc FAIFST MASMDeputy Director-General, Primary Industries; Chief Executive, NSW Rural Assistance AuthoritySES Level 6Total remuneration package: $312 850 plus allowances $40 000 Period in position: 1 July 2010 to 30 June 2011
Mr Davey previously held the position of Deputy Director General, Primary Industries with the Department of Industry & Investment until 3 April 2011 and continued in this role for NSW Trade & Investment following that date.
I am satisfied that Mr Davey met the performance criteria established for the position. Key tasks have been undertaken to achieve operational requirements and leadership has been provided to deliver outcomes consistent with government policy.
As Deputy Director General, Department of Primary Industries Mr Davey was responsible for:
• supporting the Director-General in the leadership of Industry & Investment NSW and more recently NSW Department of Primary Industries as a member of its Executive Management Team and in the role of Deputy Director General
• providing oversight, as a member of the Budget Committee, of effective financial management of Primary Industries, to achieve the required and agreed financial responsibilities and to promote sustainable financial management
• leading, directing and implementing reviews of the functions and operations of the Primary Industries division and more recently NSW Department of Primary industries with a view to securing reform and continuous improvement in line with the broader aims and objectives of NSW Trade & Investment, and the new government. Including the transfer and integration of Catchment Management Authorities, NSW Marine Parks, Office of Water, Crown Lands and the Office of Small Business to the department in April 2011
• managing critical stakeholder relationships and championing a performance-based, stakeholder focused culture across the division and promoting this approach across the department
• providing leadership as the Chief Executive and Board Member of NSW Rural Assistance Authority
• ensuring the continued delivery of world class science and innovation in the fields of primary industries and natural resource disciplines. Strategic research and industry alliances have been strengthened to deliver productive, sustainable and cost effective solutions, particularly through the running of an internal business development capability to ensure the division is positioned to identify and maximise commercial, partnering and collaborative opportunities
• progressing critical biosecurity infrastructure and capital investments at the Elizabeth Macarthur Agricultural Institute (EMAI) to secure EMAI as a premier biosecurity facility in NSW providing frontline diagnostic and response capability for animal, plant and aquatic pests and diseases. Additionally purpose built facilities at Ourimbah and new laboratories at Wollongbar contribute to providing world class science and research facilities
• ensuring effective responses and provision of support to industry and staff during a larger than normal number of emergency situations in 2010 -11 including incursions from myrtle rust, Queensland fruit fly, unprecedented locusts plagues, mice plagues and flooding from October to February and again in June 2011
• leading the implementation of the ‘Pyrmont Pact’, including the announcement of the Exit Grant program for commercial fishers and attendance at coastal port meetings to provide information about the program and opportunities for changing to share management arrangements. The development of FISHOnline also aims to support revised management arrangements arising from the Pyrmont Pact structural adjustment program, as well as enable and support streamlined administrative arrangements, implement more effective compliance arrangements, provide improved service delivery to the commercial fishing industry
• successfully trialling the Border Rivers-Gwydir Sustaining the Basin Farm Modernisation pilot project for incentive based on-farm infrastructure delivery and setting new standards of participation for government led on-farm infrastructure programs
• providing oversight of the department’s primary industries export development initiatives including attending a DPI led NSW Trade Mission, jointly with the Minister for Primary Industries, to Shanghai for the Primary Industries Day at the 2010 Shanghai World and presenting a keynote address on ‘Food Regulation in Australia and Food Safety and Risk Management in NSW’ at the 2010 International Symposium on Quality and Safety of Agri-Products held in Shanghai
• providing a leadership role with key professional bodies such as the International Dairy Federation, Dairy Industry
1. Executive Performance (cont’d)

131NSW TRADE & INVESTMENT ANNUAL REPORT 2010 -11 APPENDICES
Association of Australia, Seafood Industry Advisory Council, NSW Wine Industry Research and Development Council, Agricultural Ministerial Advisory Council and the Australian Institute of Food Science and Technology. Recognition of the key ongoing role in the Dairy Industry was recognised by the University of Sydney at the Dairy Research Foundation’s annual Symposium, when awarded the 2011 Dairy Science Award for having significantly contributed to the Australian Dairy Industry and its future.
Ms Renata Brooks, BVSc (Hons), Grad Cert Bioethics MAICD Executive Director, Agriculture & Primary Industries Science & ResearchSES Level 6Total remuneration package: $312 850 Period in position: 1 July 2010 to 30 June 2011
Ms Brooks previously held the position of Executive Director Agriculture & Primary Industries Science & Research with the Department of Industry & Investment until 3 April 2011 and continued in this role for NSW Trade & Investment following that date.
I am satisfied that Ms Brooks met the performance criteria established for the position. Key tasks have been undertaken to achieve operational requirements and leadership has been provided to deliver outcomes consistent with government policy.
As Executive Director, Agriculture & Primary Industries Science & Research, Ms Brooks was responsible for:
• supporting the Deputy Director-General, Department of Primary Industries in the leadership and management of primary industries, particularly in relation to agriculture
• leading, implementing internal management and governance for primary industries
• initiating strategic positioning for primary industries to meet the future needs of agriculture
• providing strategic and responsive advice on key issues relevant to primary industries to the Director General and Minister, particularly in the areas of science and research and agriculture
• driving coordinated initiatives across primary industries and in collaboration with other divisions of NSW Trade & Investment
• leading development of a draft Whole-of-Government Statement on Food Security and a coordinated position on food across Industry and Investment NSW
• leadership of the Science and Research Division
• providing strategic direction to NSW Department of Primary Industries’ scientists to enhance the growth sustainability and biosecurity of NSW primary industries, including initiating a Review of Animal Biosecurity Research
• coordinating research investments with funding partners developing and fostering alliances and cooperative ventures with other organisations and bodes such as 11 Cooperative Research Centres and 13 Universities, including commissioning - reviews of the Primary Industries Innovation Centre and Animal Genetics and Breeding Unit
• developing innovative solutions and technologies
• underpinning creative solutions to enhance public policy
• contributing to national leadership of a network of coordinated primary industries research, development and extension
• leveraging $46.5million in external funding to enhance the NSW Government’s investment in science and research
• meeting milestones for the rollout of the project management system, Clarity, to improve accountability and reporting functionality for Primary Industries
• from 28 January 2011 to 24 June 2011 Ms Brooks was seconded to the Department of Finance and Services to lead the development of new governance arrangements and strategy for the Government’s use of ICT and that department’s contribution to the Government’s Simpler Services Plans.
1. Executive Performance (cont’d)

132 APPENDICES NSW TRADE & INVESTMENT ANNUAL REPORT 2010 -11
Mr David Harriss B App. Sc. Grad Dip (Res Mgt)Commissioner, NSW Office of WaterSES Level 6Total Remuneration: $311 950 Period: 1 July 2010 to 30 June 2011
Mr David Harriss was appointed Commissioner for Water (and Deputy Director General) 1 July 2009 when the NSW Office of Water was established as a separate office within the Department of Environment, Climate Change and Water (DECCW). He continued in that role until April 2011 when most of the branches of the Office were transferred from DECCW to the new Department of Primary Industries. Mr Harriss has continued as Commissioner for Water through to 30 June 2011.
I am satisfied that Mr Harriss met the performance criteria established for the position. Key tasks have been undertaken to achieve operational requirements and leadership has been provided to deliver outcomes consistent with government policy.
As Commissioner NSW Office of Water Mr Harriss was responsible for:
• representing NSW interests in national water reforms under the Murray-Darling Basin Inter-Government Agreements and through the Basin Officials forums; oversaw the preparation of the NSW response to the Guide to the Basin Plan and finalised business cases and negotiations for funding of water projects under Australian Government programs
• significantly progressing the development, implementation and assessment of water sharing plans, expanded the water monitoring network and the availability of information and provided responsive management of water sharing to ensure delivery of critical supplies, while minimising impacts to the irrigation industry through both severe drought and subsequent significant flooding
• driving the development of systems to enhance water trading, including lodgement of online applications; water monitoring networks, flood prediction and management; online real-time water data reporting; and further streamlining of water licence assessments
• overseeing the preparation and lodging with IPART of the NSW Office of Water’s submissions and responses on future water management charges to ensure an appropriate contribution by water users to the state’s water management services
• ensuring the strategic coordination and finalization of the Metropolitan Water Plan and the Greater Metropolitan water sharing plan to secure Sydney’s water supply to at least 2025, and to help protect river health through environmental flows
• overseeing the ongoing management of the Country Towns Water Supply and Sewerage Program that delivered $59.2 million in assistance in 2010 -11 to country towns including $19.5 million for emergency drought relief projects throughout regional NSW, and improved water supply and sewerage services to Aboriginal communities
• directing the continuous improvement of occupational health and safety programs to maintain safe working conditions, and implemented targeted staff programs to ensure and expand the NSW Office of Water’s specialised water expertise.
1. Executive Performance (cont’d)
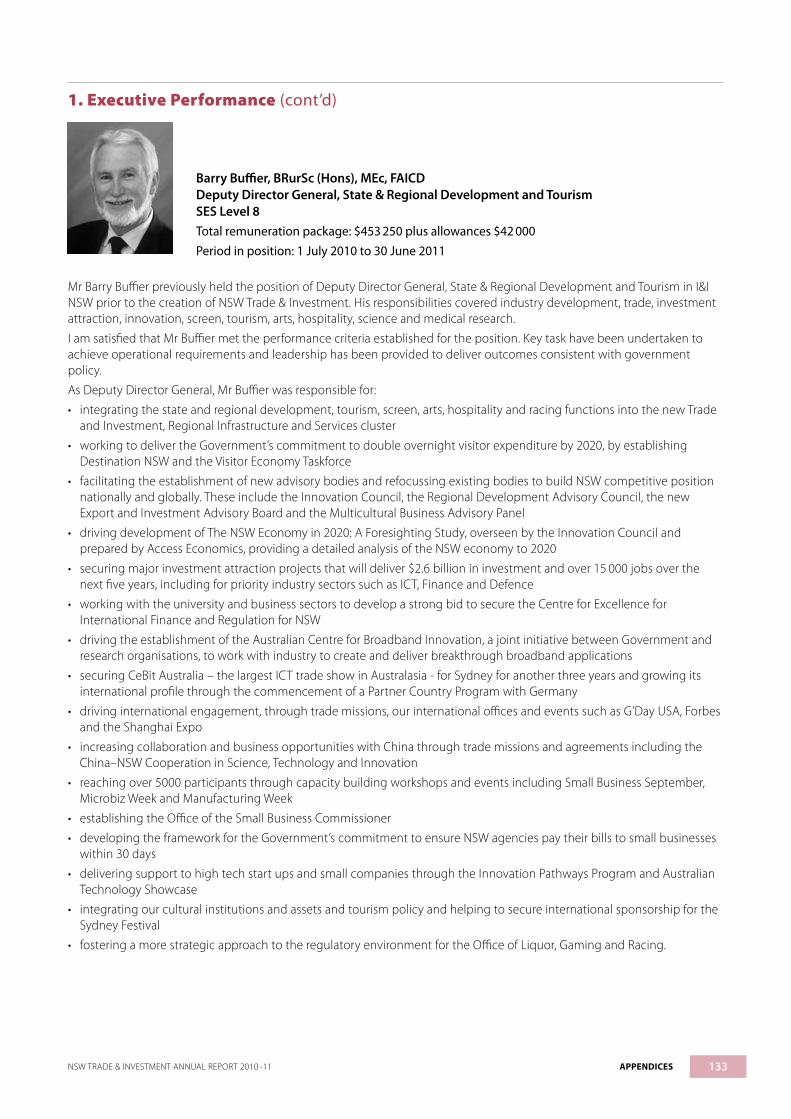
133NSW TRADE & INVESTMENT ANNUAL REPORT 2010 -11 APPENDICES
Barry Buffier, BRurSc (Hons), MEc, FAICDDeputy Director General, State & Regional Development and TourismSES Level 8Total remuneration package: $453 250 plus allowances $42 000
Period in position: 1 July 2010 to 30 June 2011
Mr Barry Buffier previously held the position of Deputy Director General, State & Regional Development and Tourism in I&I NSW prior to the creation of NSW Trade & Investment. His responsibilities covered industry development, trade, investment attraction, innovation, screen, tourism, arts, hospitality, science and medical research.
I am satisfied that Mr Buffier met the performance criteria established for the position. Key task have been undertaken to achieve operational requirements and leadership has been provided to deliver outcomes consistent with government policy.
As Deputy Director General, Mr Buffier was responsible for:
• integrating the state and regional development, tourism, screen, arts, hospitality and racing functions into the new Trade and Investment, Regional Infrastructure and Services cluster
• working to deliver the Government’s commitment to double overnight visitor expenditure by 2020, by establishing Destination NSW and the Visitor Economy Taskforce
• facilitating the establishment of new advisory bodies and refocussing existing bodies to build NSW competitive position nationally and globally. These include the Innovation Council, the Regional Development Advisory Council, the new Export and Investment Advisory Board and the Multicultural Business Advisory Panel
• driving development of The NSW Economy in 2020: A Foresighting Study, overseen by the Innovation Council and prepared by Access Economics, providing a detailed analysis of the NSW economy to 2020
• securing major investment attraction projects that will deliver $2.6 billion in investment and over 15 000 jobs over the next five years, including for priority industry sectors such as ICT, Finance and Defence
• working with the university and business sectors to develop a strong bid to secure the Centre for Excellence for International Finance and Regulation for NSW
• driving the establishment of the Australian Centre for Broadband Innovation, a joint initiative between Government and research organisations, to work with industry to create and deliver breakthrough broadband applications
• securing CeBit Australia – the largest ICT trade show in Australasia - for Sydney for another three years and growing its international profile through the commencement of a Partner Country Program with Germany
• driving international engagement, through trade missions, our international offices and events such as G’Day USA, Forbes and the Shanghai Expo
• increasing collaboration and business opportunities with China through trade missions and agreements including the China–NSW Cooperation in Science, Technology and Innovation
• reaching over 5000 participants through capacity building workshops and events including Small Business September, Microbiz Week and Manufacturing Week
• establishing the Office of the Small Business Commissioner
• developing the framework for the Government’s commitment to ensure NSW agencies pay their bills to small businesses within 30 days
• delivering support to high tech start ups and small companies through the Innovation Pathways Program and Australian Technology Showcase
• integrating our cultural institutions and assets and tourism policy and helping to secure international sponsorship for the Sydney Festival
• fostering a more strategic approach to the regulatory environment for the Office of Liquor, Gaming and Racing.
1. Executive Performance (cont’d)

134 APPENDICES NSW TRADE & INVESTMENT ANNUAL REPORT 2010 -11
Michael Cullen, BCom (Ec)Executive Director Enterprise, Small Business and Regional DevelopmentSES Level 5Total remuneration package: $276 000 Period in position: 1 July 2010 to 30 June 2011
Mr Michael Cullen previously held the position of Executive Director Enterprise, Small Business and Regional Development with the Department of Industry & Investment until 3 April 2011 and continued in this role for NSW Trade & Investment following that date.
I am satisfied that Mr Cullen met the performance criteria established for the position. Key tasks have been undertaken to achieve operational requirements and leadership has been provided to deliver outcomes consistent with government policy.
As Executive Director Enterprise, Small Business and Regional Development Mr Cullen was responsible for:
• meeting and exceeding targets for regional business jobs outcomes assisted through regional programs and services (over 5000 jobs created/retained and $407m capital investment from projects assisted)
• reaching over 50 000 participants at workshops and seminar on topics to helping businesses grow through events such as Small Business September, Microbiz Week and Manufacturing Week
• establishing the Office of the Small Business Commissioner and recruitment of the NSW Small Business Commissioner.
• working with local councils and other stakeholders to establish their interest in participating in the Regional Relocation Grant initiative to assist families move to regional NSW
• working closely with the Office of State Revenue to provide input to the implementation of the Government’s Jobs Action Plan
• ongoing improvements to the Smallbiz website and Smallbiz Assistance hot-line service to cater to the ongoing information needs of small business
• working with the Department of Premier & Cabinet to mobilise quick response strategies to closures or major downsizing of businesses in regional locations
• improvements to the presentation and simplicity of access for client to programs and services delivered by the department’s regional office network
• maintenance of strong stakeholder relationships with Regional Development Australia Committees in conjunction with the Commonwealth Department of Regional Australia, Regional Development and Local Government
• providing a liaison role between Primary Industries activities and Trade and Investment activities managed by Regional Directors, including mobilisation of emergency responses.
Warwick Glenn, BSc (Eng)Executive Director, Investment AttractionSES Level 5Total remuneration package: $276 000 Period in position: 1 July 2010 to 30 June 2011
Mr Warwick Glenn previously held the position of Executive Director, Investment Attraction with the Department of Industry & Investment until 3 April 2011 and continued in this role for NSW Trade & Investment following that date.
I am satisfied that Mr Glenn met the performance criteria established for the position. Key tasks have been undertaken to achieve operational requirements and leadership has been provided to deliver outcomes consistent with government policy.
1. Executive Performance (cont’d)

135NSW TRADE & INVESTMENT ANNUAL REPORT 2010 -11 APPENDICES
As Executive Director Investment Attraction, Mr Glenn was responsible for:
• working with business to strengthen the State’s global competitiveness, promote investment and job creation and build business capability
• delivering 56 projects that will involve over the next five years investment of $2112 billion and the creation and retention of 8694 jobs
• an additional 19 film digital media projects were also secured for NSW, with a total investment value of $250 million. These film projects created 2303 new FTE jobs for NSW
• identifying and monitoring key industry sectors to leverage opportunities and respond to pressures
• promoting NSW market opportunities, including government contracts and projects, to new investors and established businesses
• identifying opportunities and provide case management for major employment-generating projects, including ‘Go To’ industry experts
• maximising job retention through rapid response to major business closures and cross-government services to employers and employees
• working through the Industry Capability Network to win more business for NSW firms in major projects
• promoting business opportunities from nation building programs by Commonwealth and State Governments
• identifying investors and projects which fit areas of NSW competitive advantage
• implementing investment attraction schemes to expand existing industry and bring new investment to NSW
• generating new investment prospects through partnerships with multiplier agencies and existing investors
• developing knowledge about and provide information on natural resource potential to assist investment decision-making
• implementing and communicating 2020 Sector Growth Plans
• advocating improvements in planning and approval processes for major projects.
Lyndel Gray, GAICID Executive Director, Tourism and General Manager, Tourism NSWSES Level 5Total remuneration package: $276 000 Period in position: 1 July 2010 to 30 June 2011
Ms Lyndel Gray previously held the position of Executive Director, Tourism and General Manager, Tourism NSW with the Department of Industry & Investment until 3 April 2011 and continued in this role for NSW Trade & Investment following that date.
I am satisfied that Ms Gray met the performance criteria established for the position. Key tasks have been undertaken to achieve operational requirements and leadership has been provided to deliver outcomes consistent with government policy.
As General Manager, Tourism NSW Ms Gray was responsible for:
• delivering 73 domestic marketing campaigns and 90 international marketing campaigns for Sydney and Regional NSW
• securing over $4.7 million in cooperative investment in marketing programs from 316 partners and increase of more than 100 partners on 2009 -10
• partnering with Tourism Australia to co-host the Australian Tourism Exchange (ATE) at the Sydney Convention and Exhibition Centre at Darling Harbour. 700 key international travel trade representatives from 40 countries, and more than 1700 tourism operators from all over Australia, attended ATE; 85 Sydney and NSW tourism products were showcased. 327 international and domestic travel buyers participated in hosted familiarisation programs throughout the State
• partnering with Tourism Australia and Harpo Productions to bring 300 of the Oprah Winfrey Show’s audience members to Sydney. A total of 179 Australian tourism partners and suppliers participated in the project, as well as numerous non-tourism suppliers. The TV shows produced delivered extensive global publicity for Sydney and NSW destinations and tourism experiences
1. Executive Performance (cont’d)

136 APPENDICES NSW TRADE & INVESTMENT ANNUAL REPORT 2010 -11
• securing 12 marketing partnerships with major domestic and international airline partners with a collective campaign value of more than $9 million
• partnering with Greater Sydney precincts to deliver four cooperative marketing campaigns and seven events marketing campaigns
• increasing traffic to Tourism NSW web sites significantly – delivering 7.11 million visits to www.visitnsw.com and www.sydney.com, exceeding previous year by 2.0 million visits
• generating 2.18 million e-business leads to tourism industry partners across the State – up by 1.2 million on 2009 -10
• partnering with Caravan and Camping Industry Association on a major campaign to promote caravan and camping holidays, and coordinated regional tourism presence at Caravan and Camping Shows in Sydney, Melbourne and Brisbane
• continuation of the successful Destination Dining partnership with Sydney’s top chefs and restaurants to position Sydney as Australia’s pre-eminent dining destination both in Australia and key overseas markets
• generating more than $294 million in equivalent advertising value from destination publicity activities, domestically and internationally
• conducting more than 165 domestic and international media familiarisations with more than 350 participants
• assisting 44 tourism businesses and destinations to participate in travel trade missions led by Tourism NSW to UK, Europe, USA and China
• coordinating 95 international travel trade group familiarisations of NSW products and destinations with 1020 participants
• delivering the Regional Tourism Partnership Program which provides funding to Regional Tourism Organisations (RTOs) through out the State
• delivering the Regional Flagship Events Program which provided marketing funding to 21 events to increase visitors to regional and rural NSW
• conducting and finalizing three Joint Ministerial taskforces on Tourism and Education, Planning and Investment and Local Government
• producing 127 research and fact sheets to inform and advise stakeholders on trends and issues
• chairing the Digital Distribution Working Group of the National Long Term Tourism Strategy, and Worked in partnership with the Commonwealth government to implement the National Long Term Tourism Strategy.
Mark Duffy, LL.B, BEc, MADeputy Director-General, Resources & EnergySES Level 7Total Remuneration Package: $387 000 plus allowances $42 000 Period in position: 1 July 2010 to 30 June 2011
Mr Mark Duffy previously held the position of Deputy Director General, Minerals and Energy with the Department of Industry & Investment until 3 April 2011 and continued in this role for NSW Trade & Investment following that date.
I am satisfied that Mr Duffy met the performance criteria established for the position. Key tasks have been undertaken to achieve operational requirements and leadership has been provided to deliver outcomes consistent with government policy.
As Deputy Director General Resources & Energy, Mr Duffy was responsible for:
• providing leadership to the Resources and Energy Division
• driving a change program to align the Minerals, Energy and Biofuels branches and deliver on DTIRIS priorities
• leading substantial changes to the national energy legislative framework
• significant policy improvements for the technical regulation of electricity, gas and pipeline infrastructure
• delivering enhanced energy consumer assistance provisions including increasing and expanding the eligibility criteria for energy rebates to enable more households to access financial assistance
• oversight of a five year $800 million consumer assistance package
1. Executive Performance (cont’d)

137NSW TRADE & INVESTMENT ANNUAL REPORT 2010 -11 APPENDICES
• overseeing the department’s participation in coordinated state-wide responses to energy and utilities’ emergencies
• implementing changes to the NSW Solar Bonus Scheme, saving an estimated $2.45 billion for energy consumers
• completing the Parry-Duffy NSW Electricity Network and Prices Inquiry, examining and identifying the major drivers of electricity price increases and developing proposals to reduce future increases
• supporting the Mining Industry resulting with a collection of $1.24 billion in Mining royalties
• providing strategic direction to facilitate profitable and sustainable development, effective environmental management and safe and responsible mining
• completing Stage 1 of the stratigraphical drilling program to develop data to inform on the petroleum, CSM, geothermal and geosequestration potential in the upper Hunter region
• driving the identification of coal resources in regional NSW
• supporting the development of clean coal technologies
• supporting the implementation of the Mine Health and Safety Act and Regulations.
Brad Mullard BSc (Geology) Executive Director, Mineral ResourcesSES Level 5Total remuneration package: $266 250 Period in position: 1 July 2010 to 30 June 2011
Mr Brad Mullard previously held the position of Executive Director, Mineral Resources with the Department of Industry & Investment until 3 April 2011 and continued in this role for NSW Trade & Investment following that date.
I am satisfied that Mr Mullard met the performance criteria established for the position. Key tasks have been undertaken to achieve operational requirements and leadership has been provided to deliver outcomes consistent with government policy.
As Executive Director, Mineral Resources Mr Mullard was responsible for:
• leadership of the Mineral Resources Branch
• providing strategic direction to the Directors of the Branch to facilitate profitable and sustainable development, effective environmental management and safe and responsible mining
• advising on minerals development across NSW to Commonwealth, State and industry bodies
• advising on the implementation of sustainable technologies, such as low-emission coal technologies, geosequestration of carbon dioxide and geothermal energy in NSW
• developing and fostering alliances and cooperative ventures with industry and research bodies such as universities, the Australian Coal Association, the NSW Minerals Council and the Cooperative Research Centre for Greenhouse Gas Technologies
• leading the department’s support to the NSW minerals industry resulting in the expected collection of royalties of $1.24 billion in 2010 -11
• providing strategic direction that resulted in increased growth in the coal seam methane gas industry and petroleum exploration industry in NSW
• actively promoting mineral and exploration investment opportunities in NSW at international industry events and an annual industry seminar at Parliament House
• providing strategic direction in developing and implementing the Mining Regulation 2010 that commenced amendments to the Mining Act 1992 (NSW) with a view to streamline administrative processes and align mining regulation with contemporary environmental standards
• providing strategic direction and advice in developing and implementing new policies and procedures relating to the coal seam gas industry and in the Government’s Strategic Land Use Policy
• providing strategic direction for the promotion of investment opportunities in the NSW minerals and petroleum industries.
1. Executive Performance (cont’d)

138 APPENDICES NSW TRADE & INVESTMENT ANNUAL REPORT 2010 -11
Wendy Stamp BA (Hons), MAdminExecutive Director Policy, Governance & CommunicationsSES Level 5Total remuneration package: $278 350 Period in position: 1 July 2010 to 30 June 2011
Ms Wendy Stamp previously has held the position of Executive Director Policy, Governance & Communications with the Department of Industry & Investment until 3 April 2011 and continued in this role for NSW Trade & Investment following that date.
I am satisfied that Ms Wendy Stamp met the performance criteria established for the position. Key tasks have been undertaken to achieve operational requirements and leadership has been provided to deliver outcomes consistent with government policy.
As Executive Director Policy, Governance & Communications, Ms Stamp was responsible for:
• leading the development of policy proposals outlining the department’s positions on strategic and contentious issues and developing options for management and appropriate integration of policy development processes across the department to maximise the department’s influence in whole of government decision making. This included work in the areas of natural resource management, water, climate change, biodiversity and land use planning
• managing the department’s legislative program to reflect stakeholder and client needs, including amendment to six Acts and 17 Regulations and remaking of a further 12 regulations
• coordinating the department’s input into Department of Premier and Cabinet’s processes relating to the previous Government’s State Plan and other high level reporting mechanisms, such as coordinating reports against the Multicultural Plan 2010 -12, the Youth Action Plan and the Women’s Action plan and coordinating NSW Trade & Investment input into the preparation of the new NSW 2021 Plan, which will set the Government’s agenda for the community and provide direction to the public sector
• managing the implementation of the department’s corporate planning framework, including the implementation of the risk management plan and framework in line with a new Australian standard. Assistance also was provided to divisions in preparing and finalising their divisional risk management plans
• coordinating initial options for service delivery integration across Industry & Investment NSW (prior to the establishment of NSW Trade & Investment). This included looking at the area of compliance throughout the department and investigating options for how the different parts of the organisation could either work together in relation to certain compliance issues, or learn from each other
• leading change management communication, service delivery integration and planning and reporting activities to support the department. This has included internal and external communications and the development of the NSW Trade & Investment intranet and internet
• coordinating the department’s efforts to influence climate change policies and programs at the state and federal levels, particularly in relation to the resolution of the CPRS. This includes efforts to influence water policies and programs and efforts to influence land use planning processes, biodiversity and native vegetation policies
• developing a Stakeholder Engagement and Customer Satisfaction Action Plan to assist in designing a more systematic approach for obtaining customer feedback over coming years while maintaining the focus on specific key services or programs. Ultimately this will result in continuous improvement of our services
• designing and delivery of more efficient policy settings and assistance programs for primary industries and rural communities. This included designing and publishing the Regional Business Growth Plans, focusing on strategies for sustainable growth in the region and identifying infrastructure, land use and planning needs as well as skills, industry and business development issues
• developing and implementing a proactive media and events program to increase jobs and investment across NSW and to high light the department programs, including emergency response. Examples of this include the marketing campaign around Small Business September, the presence at CeBIT and the Royal Easter Show, the new Corporate Brochure, the Sydney Tourism campaign launch during the World Expo in Shanghai and the locust plague campaign.
1. Executive Performance (cont’d)
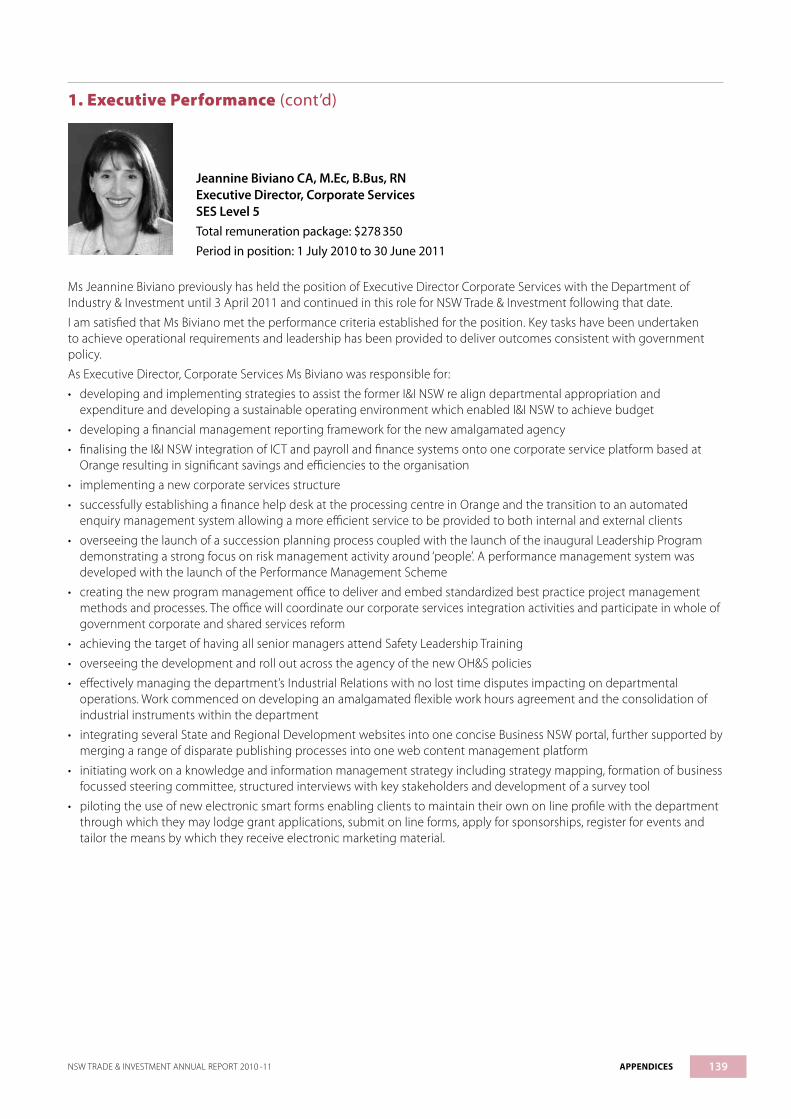
139NSW TRADE & INVESTMENT ANNUAL REPORT 2010 -11 APPENDICES
Jeannine Biviano CA, M.Ec, B.Bus, RNExecutive Director, Corporate ServicesSES Level 5Total remuneration package: $278 350
Period in position: 1 July 2010 to 30 June 2011
Ms Jeannine Biviano previously has held the position of Executive Director Corporate Services with the Department of Industry & Investment until 3 April 2011 and continued in this role for NSW Trade & Investment following that date.
I am satisfied that Ms Biviano met the performance criteria established for the position. Key tasks have been undertaken to achieve operational requirements and leadership has been provided to deliver outcomes consistent with government policy.
As Executive Director, Corporate Services Ms Biviano was responsible for:
• developing and implementing strategies to assist the former I&I NSW re align departmental appropriation and expenditure and developing a sustainable operating environment which enabled I&I NSW to achieve budget
• developing a financial management reporting framework for the new amalgamated agency
• finalising the I&I NSW integration of ICT and payroll and finance systems onto one corporate service platform based at Orange resulting in significant savings and efficiencies to the organisation
• implementing a new corporate services structure
• successfully establishing a finance help desk at the processing centre in Orange and the transition to an automated enquiry management system allowing a more efficient service to be provided to both internal and external clients
• overseeing the launch of a succession planning process coupled with the launch of the inaugural Leadership Program demonstrating a strong focus on risk management activity around ‘people’. A performance management system was developed with the launch of the Performance Management Scheme
• creating the new program management office to deliver and embed standardized best practice project management methods and processes. The office will coordinate our corporate services integration activities and participate in whole of government corporate and shared services reform
• achieving the target of having all senior managers attend Safety Leadership Training
• overseeing the development and roll out across the agency of the new OH&S policies
• effectively managing the department’s Industrial Relations with no lost time disputes impacting on departmental operations. Work commenced on developing an amalgamated flexible work hours agreement and the consolidation of industrial instruments within the department
• integrating several State and Regional Development websites into one concise Business NSW portal, further supported by merging a range of disparate publishing processes into one web content management platform
• initiating work on a knowledge and information management strategy including strategy mapping, formation of business focussed steering committee, structured interviews with key stakeholders and development of a survey tool
• piloting the use of new electronic smart forms enabling clients to maintain their own on line profile with the department through which they may lodge grant applications, submit on line forms, apply for sponsorships, register for events and tailor the means by which they receive electronic marketing material.
1. Executive Performance (cont’d)

140 APPENDICES NSW TRADE & INVESTMENT ANNUAL REPORT 2010 -11
Elizabeth Marcelle Tydd, LLMExecutive Director, Office of Liquor, Gaming and RacingSES Level 5Total remuneration package: $233 820 Period in position: 1 July 2010 to 30 June 2011
Ms Elizabeth Tydd previously held the position of Executive Director, Office of Liquor, Gaming and Racing as part of Communities NSW and continued in this role for NSW Trade & Investment.
I am satisfied that Ms Tydd met the performance criteria established for the position. Key tasks have been undertaken to achieve operation requirements and leadership has been provided to deliver outcomes consistent with government policy.
As Executive Director, Officer of Liquor, Gaming and Racing (OLGR), Ms Tydd was responsible for:
• driving the realignment of OLGR to ensure that a strategic risk based regulatory model is operating effectively
• driving the development and introduction of business reporting
• facilitating legal advice regarding the grant process and compliance activities for the regulation of NSW Lotteries
• providing direction on the introduction of an RSA and RCG Competency Card and RSA Online Training
• implementing a robust, consistent and sound process for statutory decision making
• driving an IT solution to measure compliance activities
• providing timely advice, effective support and liaison to central agencies and government on the Select Council on Gaming
• representing NSW on the Senior Officers Working Group of the Select Council on Gaming
• guiding legislative reform process and overseeing the implementation of agency actions relating to the Hassle Free Nights initiative
• providing direction and advice in the development of an MoU with the Casino, Liquor and Gaming Control Authority
• introducing processes to enhance the effectiveness of delegated decision making process
• facilitating the successful transition of OLGR into NSW Trade & Investment.
1. Executive Performance (cont’d)

141NSW TRADE & INVESTMENT ANNUAL REPORT 2010 -11 APPENDICES
2. Principal OfficersMark Paterson AO B.Bus, FAIM, FRMIA, FAICDDirector General, Trade and Investment, Regional Infrastructure and Services
Emeritus Professor Mary O’Kane, BSc (Qld), PhD (ANU), Hon DUniv (CQU), Hon DSc (Macq), FTSE, Hon FIEAustChief Scientist & Scientific Engineer
Gary Offner, Dip. Law (BAB), MBA, GAICDOffice of the Director General
Department of Primary IndustriesRichard Sheldrake, MScAgr PhD FASM FAICDDirector-General
George Davey, MSc FAIFST MASMDeputy Director-General Primary Industries & Chief Executive, NSW Rural Assistance Authority
Renata Brooks, BVSc (Hons), Grad Cert Bioethics MAICDExecutive Director, Agriculture, Science & Research
Bruce Christie, BVSc, MACVScPrincipal Director Biosecurity
Regina Fogarty, BVSc, PhDPrincipal Director, Industry Development, Agriculture & Forestry
Geoff Allan, B.Sc (Hons), PhD.A/Principal Director. Fisheries
Philip Wright, B.Sc. Agric, M.Sc Agric, PhD. EMPAPrincipal Director, Science Strategy
NSW Office of WaterMr David Harriss B App. Sc. Grad Dip (Res Mgt)Commissioner
Crown Lands DivisionGraham HardingGeneral Manager
Soil Conservation ServicePaul Jones, B.EngGeneral Manager and Deputy Commissioner
Industry, Innovation & Investment DivisionBarry Buffier, BRurSc (Hons), MEc, Churchill Fellow, FAICDDeputy Director General State & Regional Development and Tourism
Warwick Glenn, BSc (Eng)Executive Director, Investment Attraction
Michael Cullen, BCom (Ec)Executive Director, Enterprise Small Business and Regional Development
Kylie HargreavesExecutive Director, International Markets and Trade
Kerry Doyle PSM, BA (Hons) Executive Director, Innovation Research and Policy
Lyndel Gray, GAICIDExecutive Director and General Manager, Tourism NSW
Arts NSWMary Darwell, LL.M, LL.B, B.A. (Hons)Executive Director
Office of Liquor, Gaming and RacingElizabeth Marcelle Tydd, LLMExecutive Director
Resources & Energy DivisionMark Duffy, LL.B, BEc, MADeputy Director General, Minerals & Energy
Andrew Lewis, BA (Hons), MAExecutive Director, Energy & Legal
Karathine Hole, BA (Asian Studies), BEc, MCom, MEMDirector Energy Strategy & Reform
Brad Mullard, BScExecutive Director Mineral Resources
Greg McDowall, BSc, MEngSc, MSc, GDip Mgt, MIE Aust
Policy, Governance and Communications DivisionWendy Stamp, BA (Hons), MAdminExecutive Director, Policy, Governance and Communications
Austin Whitehead, BSc (Forestry)Director, Corporate Policy & Government Relations
Scott Davenport, B. Ag, EcDirector, Economic Policy & Research & Chief Economist
Rebekah Gomez-Fort, MSc, BAppSc, Dip Govt (Mgmt)Director, Natural Resources Policy
Brett Fifield, BA (Journalism)Director, Corporate Affairs & Media
Vera Fiala, Grad Dip BA, MEngDirector, Corporate Strategy & Communications
Peter CrippsDirector, State & Regional Development and Tourism Communications
Corporate Services DivisionJeannine Biviano, CA, MEc, BBus, RNExecutive Director, Corporate Services
Tony HeffernanDirector, Corporate Operations
Barbara Jones, BA LLBDirector, Legal
Della Farthing, Graduate Certificate ManagementDirector, People Learning & Culture
Boyd Wymer, BE, BA(Hons)Director, Information & Communications Technology
Chris MartinDirector, Strategic Business & Knowledge Management
David Kennedy, MBAChief Information Officer
142 APPENDICES NSW TRADE & INVESTMENT ANNUAL REPORT 2010 -11
3. Legislation and legal change
Acts passed in spring session 2010 • Plantations and Reafforestation Amendment Act 2010
• Veterinary Practice Amendment Act 2010
• Plant Diseases Amendment Act 2010
Acts passed in autumn session 2011Gene Technology (GM Crop Moratorium) Amendment (Postponement of Expiry) Act 2011
Staged repeal regulations (made on or before 1 September 2010) • Agricultural & Veterinary Chemicals (NSW) Regulation 2010
• Animal Research Regulation 2010
• Exhibited Animals Protection Regulation 2010
• Fisheries Management (General) Regulations 2010
• Rice Marketing Regulation 2010
• Rural Lands Protection Regulation 2010
• Stock (Chemical Residues) Regulation 2010
• Stock Foods Regulation 2010
• Stock Medicines Regulation 2010
Miscellaneous amendments to Regulations (made up to 30 June 2011) • Animal Diseases (Emergency Outbreaks) Amendment
(Prescribed Persons) Regulation 2011
• Apiaries Amendment Regulation 2010
• Fisheries Management Amendment (Noxious Fish) Regulation 2011
• Fisheries Management Legislation Amendment (Fees, Charges and Contributions) Regulation 2011
• Fisheries Management Legislation Amendment (Management Plans) Regulation 2010
• Fisheries Management Legislation Amendment Regulation 2011
• Non-Indigenous Animals Amendment (Licensing) Regulation 2010
• Plantations and Reafforestation (Code) Amendment Regulation 2010
• Prevention of Cruelty to Animals (General) Amendment (Offences) Regulation 2010
• Rural Lands Protection Amendment (Stock Transportation Particulars) Regulation 2011
• Veterinary Practice Amendment (Annual Returns) Regulation 2010
Statutory InstrumentsIn complying with legislative obligations the following instruments were prepared for gazettal:
Orders - 275 Fishing closures - 28 Quarantines - 5 Delegations -20 Proclamations - 8 Notifications – 12 Interim orders - 2 Appointments - 81
Electricity Supply Act 1995Electricity and Gas Supply Legislation Amendment (Retail Price Disclosures and Comparisons) Act 2010
Electricity Supply Amendment (Solar Bonus Scheme) Act 2010. Assented to 1.11.2010
Gas Supply Act 1996Gas Supply Amendment Act 2010 Electricity and Gas Supply Legislation Amendment (Retail Price Disclosures and Comparisons) Act 2010
Electricity (Consumer Safety) Regulation 2006Electricity (Consumer Safety) Amendment (Fees) Regulation 2010
Electricity Supply (General) Regulation 2001
Electricity Supply (General) Amendment (Infrastructure Protection) Regulation 2010
Electricity Supply (General) Amendment (Marketing Code of Conduct) Regulation 2010
Electricity Supply (General) Further Amendment (Solar Bonus Scheme) Regulation 2010
Electricity Supply (General) Amendment Regulation 2011
Gas Supply (Consumer Safety) Regulation 2004Gas Supply Amendment Regulation 2010
Gas Supply (Natural Gas Retail Competition) Regulation 2001Gas Supply (Natural Gas Retail Competition) Amendment (Marketing Code of Conduct) Regulation 2010
Gas Supply (Safety and Network Management) Regulation 2008Gas Supply (Safety and Network Management) Amendment (Safe Gas Supply) Regulation 2011
Arts NSW
Legislative Changes
Library Amendment Act 2011The Library Amendment Act 2011 enables two or more local authorities to agree to seek Government approval of new arrangements for public library services. It makes the mutual provision of library and related services, by two or more councils, possible.
Historic Houses Amendment (Throsby Park Historic Site) Act 2010This amendment to the Historic Houses Act 1980 revoked the reservation of the Throsby Park Historic Site under the National Parks and Wildlife Act 1974 and provided for the vesting of the Site in the Historic Houses Trust of New South Wales.
Statute Law (Miscellaneous Provisions) Act 2010Commencing on 9 July 2010, this Act made minor amendments to the Australian Museum Trust Act 1975 and the Sydney Opera House Act 1961.
The Australian Museum Trust Act was amended to remove any doubt regarding the scope of the trust’s powers to enter into commercial arrangements and/or to engage in operations outside NSW.
143NSW TRADE & INVESTMENT ANNUAL REPORT 2010 -11 APPENDICES
The Sydney Opera House Trust Act was amended to provide that a by-law has no effect unless approved by the Governor. Also the outdated requirement for the Sydney Opera House Trust to seal every by-law it makes with a common seal was removed.
Changes to subordinate legislationThe Library Regulation 2010 and Sydney Opera House By-law 2010 both commenced on 1 September 2010.
Office of Water
New and Amending ActsWater Management Amendment Act 2010Significant amendments were made to the Water Management Act 2000 in 2010 to respond to emerging issues such as the need for reform of joint privately owned water infrastructure, to facilitate government investment in environmental water and ensure appropriate accounting for that water and ensure that water lost from mines is licensed.
As a result of these amendments:
• licences held by private irrigation boards and private water trusts can now be transformed into licences held by their individual members. The amendments also contained significant reforms to PIB and Trust governance structures which will, when commenced, significantly reduce red tape and provide these bodies with greater flexibility to undertake their irrigation businesses in the interests of their members
• licences can be granted for environmental purposes arising out of agreements entered into by or on behalf of the State
• environmental water held in licences can be properly accounted for, ensuring that growth in use provisions in water sharing plans are not triggered
• a new offence has been created to make explicit the current position that mining companies need a water licence if their activities drain water from an aquifer or river.
The bulk of these amendments have been commenced. The remaining amendments are expected to be commenced in the second half of 2011.
New and amending regulationsWater Management (General) Amendment (Cane Drains and Replacement Access Licences) Regulation 2010The Water Management (General) Amendment (Cane Drains and Replacement Access Licences) Regulation 2010 commenced on 17 December 2010. The regulation created a new exemption from the need for a water access licence for a person taking water through a cane drain used only for the purposes of establishing plantings of sugar cane in an area to which the Water Sharing Plan for the Richmond River Area Unregulated, Regulated and Alluvial Water Sources 2010 and Water Sharing Plan for the Tweed River Area Unregulated and Alluvial Water Sources 2010. It a provided for the creation of new access licences that authorise the taking of tidal pool water from certain tidal pool water sources covered by the Water Sharing Plan for the Murrah-Wallaga Area Unregulated and Alluvial Water Sources 2010, the Water Sharing Plan for the Richmond River Area Unregulated, Regulated and Alluvial Water Sources 2010, the Water Sharing Plan for the Towamba River Unregulated and Alluvial Water Sources 2010 and the Water Sharing Plan for the Tweed River Area Unregulated and Alluvial
Water Sources 2010. The Regulation also contained other minor amendments required in conjunction with the commencement of the water sharing plans referred to above.
Water Management (General) Amendment (Bega and Brogo Rivers Water Sharing Plan) Regulation 2011The Water Management (General) Amendment (Bega and Brogo Rivers Water Sharing Plan) Regulation 2011 commenced on 1 April 2011. This regulation provided that a Ministerial order with respect to supplementary water is to be published on the website of the NSW Office of Water. It a provided for the creation of new access licences that authorise the taking of tidal pool water from certain tidal pool water sources covered by Water Sharing Plan for the Bega and Brogo Rivers Area Regulated, Unregulated and Alluvial Water Sources 2011. The Regulation also contained other minor amendments required in conjunction with the commencement of the water sharing plans referred to above and a transitional provision in relation to commencement of parts of the Water Management Amendment Act 2010.
Water Management (General) Amendment (Greater Metropolitan Region Water Sharing Plans) Regulation 2011The Water Management (General) Amendment (Greater Metropolitan Region Water Sharing Plans) Regulation 2011 was made in March 2011 and commenced on 1 July 2011. This regulation provided for the creation of new access licences authorising the taking of tidal pool water from certain areas covered by the Water Sharing Plan for the Greater Metropolitan Region Unregulated River Water Sources 2011. The Regulation also contained other minor amendments required in conjunction with the commencement of the water sharing plans referred to above.
Water Management (General) Amendment (Metering Equipment) Regulation 2011The Water Management (General) Amendment (Metering Equipment) Regulation 2011 commenced on 4 March 2011. This regulation made the Water Administration Ministerial Corporation (WAMC) the owner of metering equipment installed or replaced by it on or after 4 March 2011, conferred on the WAMC the function of modifying metering equipment, and exclusively conferred on the WAMC the functions of maintaining, repairing, modifying, replacing and operating metering equipment installed, modified or replaced by the Corporation after 4 March 2011 or as part of the Hawkesbury Nepean River Recovery Project.
Water Management (General) Amendment (Poon Boon Water Trust) Regulation 2011The Water Management (General) Amendment (Poon Boon Water Trust) Regulation 2011 commenced on 18 February 2011. This regulation provided for the winding up of the Poon Boon Water Trust, as well as the transfer of the Trust’s assets, rights and liabilities to the Water Administration Ministerial Corporation and for the pro rata distribution of money held by the Trust to its ratepayers.
Water Management (General) Amendment (Transformation) Regulation 2010The Water Management (General) Amendment (Transformation) Regulation 2011 commenced on 17 December 2011. This regulation proscribes matters to be included in a determination by a private irrigation board, or the members of a private water trust, of the water entitlement of a landholder who wishes to transform
3. Legislation and legal change (cont’d)
144 APPENDICES NSW TRADE & INVESTMENT ANNUAL REPORT 2010 -11
his or her water entitlements under a private irrigation scheme conducted by the board or trust to an individual access licence holding, and to prescribe what is meant by member of a person’s immediate family for the purposes of provisions that prevent a person from participating in the determination of the water entitlement of a landholder who is a member of their immediate family.
Water Management (Water Supply Authorities) Amendment (Cobar Water Board) Regulation 2010The Water Management (Water Supply Authorities) Amendment (Cobar Water Board) Regulation 2010 commenced on 1 October 2011. This regulation proscribed Peak Gold Mines Pty Ltd as a mining company that is able to nominate a member of the Cobar Water Board in place of Goldcorp Asia Pacific Pty Ltd.
Water Management (General) Amendment (Miscellaneous) Regulation 2010The Water Management (General) Amendment (Miscellaneous) Regulation 2010 commenced on 1 July 2010. This regulation made provision for the conversion of specified entitlements as a consequence of the commencement of the Water Sharing Plan for the Peel Valley Regulated, Unregulated, Alluvium and Fractured Rock Water Sources 2010 on 1 July 2010, made other minor amendments required in conjunction with the commencement of this plan and prescribed certain matters that may be dealt with under the water sharing planning provisions of a management plan for a water management area or water source.
Water Management (General) Amendment (Aquifer Interference) Regulation 2011The Water Management (General) Amendment (Aquifer Interference) Regulation 2011 commenced on 30 June 2011. This regulation is the first stage of a new Aquifer Interference Regulation which is part of the implementation of the Government’s Strategic Regional Land Use Policy. The Amending Regulation requires new mineral or petroleum exploration activities (including new coal seam gas exploration activities) to hold a water access licence where the volume of water taken exceeds a threshold volume of 3ML. It also clarifies that a water access licence is required for the taking of water from an aquifer even if an aquifer interference approval is held. The threshold volume of 3ML is an interim volume that will apply until the final exemption is specified in the final Aquifer Interference Policy, which is expected to be finalised after public consultation later this year.
The Amending Regulation also provides that entitlements under the Water Act 1912 issued for the purpose of prospecting or fossicking for minerals or petroleum under the Mining Act 1992 or the Petroleum (Onshore) Act 1991 will not convert to access licences and approvals under the Water Management Act 2000 upon the commencement of the Water Sharing Plan for the Greater Metropolitan Region Groundwater Sources 2011 and the commencement of a number of other impending water sharing plans. This is to ensure that such entitlements will not lapse prior to the implementation of the final volumetric threshold. These entitlements will remain under the Water Act 1912 until the final exemption has been specified in the final Aquifer Interference Policy.
Water Sharing PlansThe following Water Sharing Plans were made this year:
• the Water Sharing Plan for the Bega and Brogo Rivers Area Regulated, Unregulated and Alluvial Water Sources 2011
• the Water Sharing Plan for the Greater Metropolitan Region Groundwater Sources 2011
• the Water Sharing Plan for the Greater Metropolitan Region Unregulated River Water Sources
• the Water Sharing Plan for the Murrah-Wallaga Area Unregulated and Alluvial Water Sources 2010
• the Water Sharing Plan for the Richmond River Area Unregulated, Regulated and Alluvial Water Sources 2010
• the Water Sharing Plan for the Towamba River Unregulated and Alluvial Water Sources 2010
• the Water Sharing Plan for the Tweed River Area Unregulated and Alluvial Water Sources 2010
The following Water Sharing Plans were amended this year:
• the Water Sharing Plan for the Coopers Creek Water Source 2003
• the Water Sharing Plan for the New South Wales Murray and Lower Darling Regulated Rivers Water Sources 2003
• Water Sharing Plan for the Murrumbidgee Regulated River Water Source Amendment Order 2011
Acts administeredMinister for Trade And InvestmentInnovation Council Act 1996 No 77
Minister for Regional Infrastructure and ServicesThe Minister for Regional Infrastructure and Services has joint administration of all Acts listed for the Minister for Primary Industries (which are not listed again below), and the following Acts: Albury-Wodonga Development Repeal Act 2000 No 18 New South Wales Investment Corporation (Sale) Act 1988 No 50 Regional Development Act 2004 No 58 State Development and Industries Assistance Act 1966 No 10 Very Fast Train (Route Investigation) Act 1989 No 44
Minister for Resources and EnergyAberdare County Council (Dissolution) Act 1982 No 74 AGL Corporate Conversion Act 2002 No 16 Biofuels Act 2007 No 23 Clean Coal Administration Act 2008 No 50 Coal Acquisition Act 1981 No 109 Coal Industry Act 2001 No 107 Coal Mine Health and Safety Act 2002 No 129 Coal Ownership (Restitution) Act 1990 No 19 Eastern Gas Pipeline (Special Provisions) Act 1996 No 126 Electricity Supply Act 1995 No 94 Energy and Utilities Administration Act 1987 No 103 (except parts, the Minister for the Environment) Energy Services Corporations Act 1995 No 95 Eraring Power Station Act 1981 No 107 Gas Industry Restructuring Act 1986 No 213 Gas Supply Act 1996 No 38 (except part, jointly the Minister for Finance and Services and the Minister for Fair Trading) Gosford–Wyong Electricity Supply (Special Provisions) Act 1985 No 182 Mine Health and Safety Act 2004 No 74 Mine Safety (Cost Recovery) Act 2005 No 116
3. Legislation and legal change (cont’d)

145NSW TRADE & INVESTMENT ANNUAL REPORT 2010 -11 APPENDICES
Mine Subsidence Compensation Act 1961 No 22 Mining Act 1992 No 29 (except part, the Attorney General) National Electricity (New South Wales) Act 1997 No 20 National Gas (New South Wales) Act 2008 No 31 Northern Rivers County Council (Undertaking Acquisition) Act 1981 No 95 Occupational Health and Safety Act 2000 No 40, in so far as it relates to a coal workplace or a mining workplace within the meaning of that Act (remainder, the Minister for Finance and Services) Offshore Minerals Act 1999 No 42 Petroleum (Offshore) Act 1982 No 23 Petroleum (Onshore) Act 1991 No 84 Pipelines Act 1967 No 90 (jointly with the Minister for Primary Industries) Snowy Hydro Corporatisation Act 1997 No 99 Uranium Mining and Nuclear Facilities (Prohibitions) Act 1986 No 194
Minister for Tourism, Major Events, Hospitality and RacingAustralian Jockey and Sydney Turf Clubs Merger Act 2010 No 93 Australian Jockey Club Act 2008 No 52 Casino Control Act 1992 No 15 Casino, Liquor and Gaming Control Authority Act 2007 No 91 Charitable Fundraising Act 1991 No 69 Gambling (Two-up) Act 1998 No 115 Gaming Machine Tax Act 2001 No 72, Part 4 and Schedule 1 (remainder, jointly with the Minister for Finance and Services, except Part 3, the Minister for Finance and Services) Gaming Machines Act 2001 No 127 Greyhound Racing Act 2009 No 19 Harness Racing Act 2009 No 20 Hawkesbury Racecourse Act 1996 No 74 Homebush Motor Racing (Sydney 400) Act 2008 No 106 Innkeepers Act 1968 No 24 Liquor Act 2007 No 90 Lotteries and Art Unions Act 1901 No 34 Motor Sports (World Rally Championship) Act 2009 No 55 Public Lotteries Act 1996 No 86 Racing Administration Act 1998 No 114 Racing Appeals Tribunal Act 1983 No 199 Registered Clubs Act 1976 No 31 Sydney Turf Club Act 1943 No 22 Thoroughbred Racing Act 1996 No 37 Totalizator Act 1997 No 45 (except section 76, the Treasurer) Tourism New South Wales Act 1984 No 46 Unlawful Gambling Act 1998 No 113 Wagga Wagga Racecourse Act 1993 No 109 (except sections 4 and 5, the Minister for Primary Industries)
Minister for the ArtsArt Gallery of New South Wales Act 1980 No 65 Australian Museum Trust Act 1975 No 95 Copyright Act 1879 42 Vic No 20 Film and Television Office Act 1988 No 18 Library Act 1939 No 40 Museum of Applied Arts and Sciences Act 1945 No 31 Sydney Opera House Trust Act 1961 No 9
Minister for Primary IndustriesThe Minister for Primary Industries has joint administration of the following Acts with the Minister for Regional Infrastructure and Services: Agricultural and Veterinary Chemicals (New South Wales) Act 1994 No 53 Agricultural Industry Services Act 1998 No 45 Agricultural Livestock (Disease Control Funding) Act 1998 No 139 Agricultural Scientific Collections Trust Act 1983 No 148 Animal Diseases (Emergency Outbreaks) Act 1991 No 73 Animal Research Act 1985 No 123 Apiaries Act 1985 No 16 Australian Lubricating Oil Refinery Limited Agreement Ratification Act 1962 No 16 Australian Oil Refining Limited Agreement Ratification Act 1954 No 34 Biological Control Act 1985 No 199 Botany Bay National Park (Helicopter Base Relocation) Act 2004 No 27 Botany Cemetery and Crematorium Act 1972 No 6 C.B. Alexander Foundation Incorporation Act 1969 No 61 Camperdown Cemetery Act 1948 No 14 Catchment Management Authorities Act 2003 No 104 Central Coast Water Corporation Act 2006 No 105 Chipping Norton Lake Authority Act 1977 No 38 Christ Church Cathedral, Newcastle, Cemetery Act 1966 No 20 Commons Management Act 1989 No 13 Conversion of Cemeteries Act 1974 No 17 Crown Lands Act 1989 No 6 (except parts, the Minister for the Environment, parts, the Minister for Planning and Infrastructure, and parts, the Minister for Sport and Recreation) Crown Lands (Continued Tenures) Act 1989 No 7 Dairy Industry Act 2000 No 54 Dams Safety Act 1978 No 96 Deer Act 2006 No 113 Dividing Fences Act 1991 No 72 Exhibited Animals Protection Act 1986 No 123 Farm Debt Mediation Act 1994 No 91 Farm Water Supplies Act 1946 No 22 Farrer Memorial Research Scholarship Fund Act 1930 No 38 Fertilisers Act 1985 No 5 Fish Marketing Act 1994 No 37 Fisheries Act 1935 No 58 Fisheries Management Act 1994 No 38 Food Act 2003 No 43 Forestry Act 1916 No 55 Forestry (Darling Mills State Forest Revocation) Act 2005 No 2 Game and Feral Animal Control Act 2002 No 64 Gene Technology (GM Crop Moratorium) Act 2003 No 12 Gene Technology (New South Wales) Act 2003 No 11 Googong Dam Catchment Area Act 1975 No 4 Gore Hill Memorial Cemetery Act 1986 No 116 Gosford Cemeteries Act 1970 No 84 Hawkesbury-Nepean River Act 2009 No 14 Hay Irrigation Act 1902 No 57 Hemp Industry Act 2008 No 58 Irrigation Areas (Reduction of Rents) Act 1974 No 83 Lake Illawarra Authority Act 1987 No 285 Marine Parks Act 1997 No 64, jointly with the Minister for the Environment Meat Industry Act 1978 No 54 Menindee Lakes Storage Agreement Act 1964 No 4 Mudgee Cemeteries Act 1963 No 2 Murrumbidgee Irrigation Areas Occupiers Relief Act 1934 No 52
3. Legislation and legal change (cont’d)
146 APPENDICES NSW TRADE & INVESTMENT ANNUAL REPORT 2010 -11
Native Title (New South Wales) Act 1994 No 45 New South Wales—Queensland Border Rivers Act 1947 No 10 Non-Indigenous Animals Act 1987 No 166 Noxious Weeds Act 1993 No 11 Old Balmain (Leichhardt) Cemetery Act 1941 No 12 Old Liverpool Cemetery Act 1970 No 49 Old Roman Catholic Cemetery, Crown Street, Wollongong, Act 1969 No 56 Old Wallsend Cemetery Act 1953 No 5 Parramatta Methodist Cemetery Act 1961 No 44 Pipelines Act 1967 No 90 (jointly with the Minister for Resources and Energy) Plant Diseases Act 1924 No 38 Plantations and Reafforestation Act 1999 No 97 Poultry Meat Industry Act 1986 No 101 Prevention of Cruelty to Animals Act 1979 No 200 Public Reserves Management Fund Act 1987 No 179 Public Works Act 1912 No 45, section 34 (3) and (4) (remainder, the Minister for Finance and Services) Queanbeyan Showground (Variation of Purposes) Act 1995 No 14 Rice Marketing Act 1983 No 176 Roads Act 1993 No 33, Parts 2, 4 and 12 (section 178 (2) excepted) and section 148; and the remaining provisions of the Act so far as they relate to Crown roads (remainder, parts, the Minister for Roads and Ports, parts, the Minister for the Environment, and parts, the Minister for Local Government) Rural Adjustment Scheme Agreement Act 1993 No 107 Rural Assistance Act 1989 No 97 Rural Lands Protection Act 1998 No 143 St. Andrew’s Church of England, Mayfield, Cemetery Act 1957 No 39 St. Andrew’s Presbyterian Church, Woonona, Cemetery Act 1966 No 6 St. Anne’s Church of England, Ryde, Act 1968 No 47 St. George’s Church of England, Hurstville, Cemetery Act 1961 No 63 St. Peter’s Church of England, Cook’s River, Cemetery Act 1968 No 48 St. Thomas’ Church of England, North Sydney, Cemetery Act 1967 No 22 Snowy Mountains Cloud Seeding Trial Act 2004 No 19
Soil Conservation Act 1938 No 10 (except Parts 2A, 3 and 4, and sections 15 and 30A in so far as they relate to Parts 2A, 3 or 4, jointly with the Minister for the Environment) State Water Corporation Act 2004 No 40 States and Northern Territory Grants (Rural Adjustment) Agreement Ratification Act 1985 No 113 States and Northern Territory Grants (Rural Adjustment) Agreement Ratification Act 1989 No 168 States Grants (Rural Adjustment) Agreement Ratification Act 1977 No 104 States Grants (Rural Reconstruction) Agreement Ratification Act 1971 No 37 Stock (Chemical Residues) Act 1975 No 26 Stock Diseases Act 1923 No 34 Stock Foods Act 1940 No 19 Stock Medicines Act 1989 No 182 Sydney Water Catchment Management Act 1998 No 171 Sydney Market Authority (Dissolution) Act 1997 No 62 Timber Marketing Act 1977 No 72 Trustees of Schools of Arts Enabling Act 1902 No 68 Tweed River Entrance Sand Bypassing Act 1995 No 55 Veterinary Practice Act 2003 No 87 Wagga Wagga Racecourse Act 1993 No 109, sections 4 and 5 (remainder, the Minister for Tourism, Major Events, Hospitality and Racing) Water Act 1912 No 44 Water (Commonwealth Powers) Act 2008 No 69 Water Management Act 2000 No 92 (except parts, the Minister for Finance and Services) Wentworth Irrigation Act 1890 54 Vic No 7 Western Lands Act 1901 No 70 Wild Dog Destruction Act 1921 No 17 Wine Grapes Marketing Board (Reconstitution) Act 2003 No 100
Minister for Small BusinessRetail Leases Act 1994 No 46 Small Business Development Corporation Act 1984 No 119
4. Significant Judicial Authorities
DPI and Resources & Energy Division
Full Court of Federal Court of Australia Heli-Aust Pty Ltd v Cahill [2011] FCAFC 62).On 21 May 2011 the Full Court found that there is a direct inconsistency between the Occupational Safety Act 2000 (NSW) and the regime established by the Civil Aviation Act 1988 (Cth) and related legislation and regulations, as the Commonwealth regime covers the field of the safety of civil aviation in flight in Australia (see paras 83-84, Moore and Stone JJ; paras 165, 195-196, Flick J).
The effect of this judgment was to render charges laid by the John Joseph Cahill on behalf of the Public Service Association invalid for want of jurisdiction as they purported to prosecute the defendant under the NSW Occupational Health and Safety Act 2000 in respect of matters that were fully covered by the Civil Aviation Act 1988 (Cwlth).Short minutes of order were subsequently filed whereby John Joseph Cahill consented to orders in favour of Heli-Aust Pty Limited, including costs.
John Joseph Cahill v State of New South Wales (Department of Industry and Investment) No IRC 1926 of 2009Consent Orders were made on 15 August 2011 in the Industrial Relations Commission dismissing charges against the State of NSW and ordering the prosecutor to pay the costs of the defendant. These orders were consequential upon the decision of the Federal Court of Australia in Heli-Aust Pty Limited v Cahill. The charges laid against the State of NSW were in the same terms as those against Heli-Aust Pty Limited. The Prosecutor agreed that these charges, too, lacked jurisdiction as Commonwealth regime under the Civil Aviation Act 1988 covers the field with regard to civil aviation in flight in Australia.
NSW Office of WaterThroughout 2010-11 the Office provided advice and representation in criminal and civil cases before a range of courts and tribunals.
A case of significance was Snowy River Alliance Inc v Water Administration Ministerial Corporation [2011] NSWSC 652. In that case the plaintiff argued that the Water Administration Ministerial Corporation’s five year report on and review of Snowy
3. Legislation and legal change (cont’d)

147NSW TRADE & INVESTMENT ANNUAL REPORT 2010 -11 APPENDICES
Hydro Limited’s water licence was contrary to the Snowy Hydro Corporation Act 1997 and sought to set aside the resulting variation of Snowy Hydro Limited’s water licence. As part of the claim the plaintiff argued the licence could not be reviewed and varied as no state of the environment report of the Snowy Scientific Committee had been produced as required by the Snowy Hydro
Corporation Act 1997. The Supreme Court held the lack of a state of the environment report had not affected the validity of the licence review and variation and dismissed the plaintiff’s claim.
5. Evaluation and improvementInternal audit and risk management systems are a critical part of NSW Trade & Investment’s, corporate governance and internal control systems and are a requirement of Treasury Policy Paper TPP 09-05 Internal Audit and Risk Management for the NSW Public Sector.
These processes and systems provide a level of assurance that enables senior management of the department to understand, manage and satisfactorily control risk exposures.
NSW Trade & Investment is committed to continuous improvement of programs and services to both internal and external stakeholders. The department contracted RSM Bird Cameron to undertake the internal audit function for NSW Trade and Investment. Reports containing findings and recommendations were provided to the Audit and Risk Committee (ARC). The implementation of all recommendations is monitored and particular emphasis given to those rated as high to very high risk.
The ARC has three members including an independent chair and independent member.
The ARC met on four occasions and the following internal reviews were undertaken during the 2010 -11:
• AURION Upgrade Post Implementation
• Observations – Final Review of State & Regional Development, Tourism and Screen NSW Transition
• Forests NSW Major Incidents Management
• External Funding of Science and Innovation
• Agency Migration for AURION and SAP for NSW Food Authority
• State & Regional Development Transition to SAP, AURION Payroll and the SAP Copy Task
• Management of the Research Database
• Management of the Minerals Division Databases
• Bushfire Management Processes
• Information Security
• SAP Basis Module Configuration and Security
• Management of the Commercial Fishing Licences Database
• NSW Food Authority Name and Shame Program
• Screen NSW Industry Development Fund
• Lightning Ridge Crown Trust Accounts
Office of Liquor, Gaming & Racing (OLGR)Three internal audits on the functions of OLGR were undertaken by Deloitte during 2010-11. These were:
Keno Taxation ComplianceEvaluation of the design and operating effectiveness of the internal controls utilised for generating data, calculations and assessments that are relied upon by the Office of State Revenue in relation to Keno Taxation, and to make recommendations for improvement where opportunities for improvement in controls are identified.
This report has been finalised with no findings identified.
Gaming Machine Taxation ComplianceEvaluation of the design and operating effectiveness of the internal controls utilised for generating data, calculations and assessments that are relied upon by the Office of State Revenue in relation to Gaming Machine Taxation, and to make recommendations for improvement where opportunities for improvement in controls are identified.
This report has been finalised, with agreed management actions in place for all findings.
Wagering Taxation ComplianceEvaluate the design and operating effectiveness of the internal controls utilised for generating data, calculations and assessments that are relied upon by the Office of State Revenue in relation to Wagering Taxation, and to make recommendations for improvement where opportunities for improvement in controls are identified.
This report has been issued as a draft and is currently with management for management responses.
6. Risk management and insurance
Risk managementThe department’s enterprise risk management framework has been developed in accordance with NSW Treasury Internal Audit and Risk Management Policy for the NSW Public Sector (TTP 09-5). It provides a systematic approach for implementing, monitoring, reviewing and continually improving our risk management processes.
Implementation of the framework has involved the department’s divisions completing Divisional Risk Registers. Each division has identified and evaluated its risks, and documented the current controls and proposed mitigation strategies the division is
implementing or will implement to minimise negative risks or enhance positive opportunities.
Importantly, divisional risk registers are linked to the department achieving its corporate outcomes. The high level corporate risk register provides the framework for doing this, as the risks at the divisional level are linked to the corporate risks with all the corporate level mitigation strategies accounted for and managed within the various divisional risk registers.
Under the framework, each division has appointed a Divisional Risk Coordinator who is responsible for guiding the implementation by managers and staff of risk management.
4. Significant Judicial Authorities (cont’d)
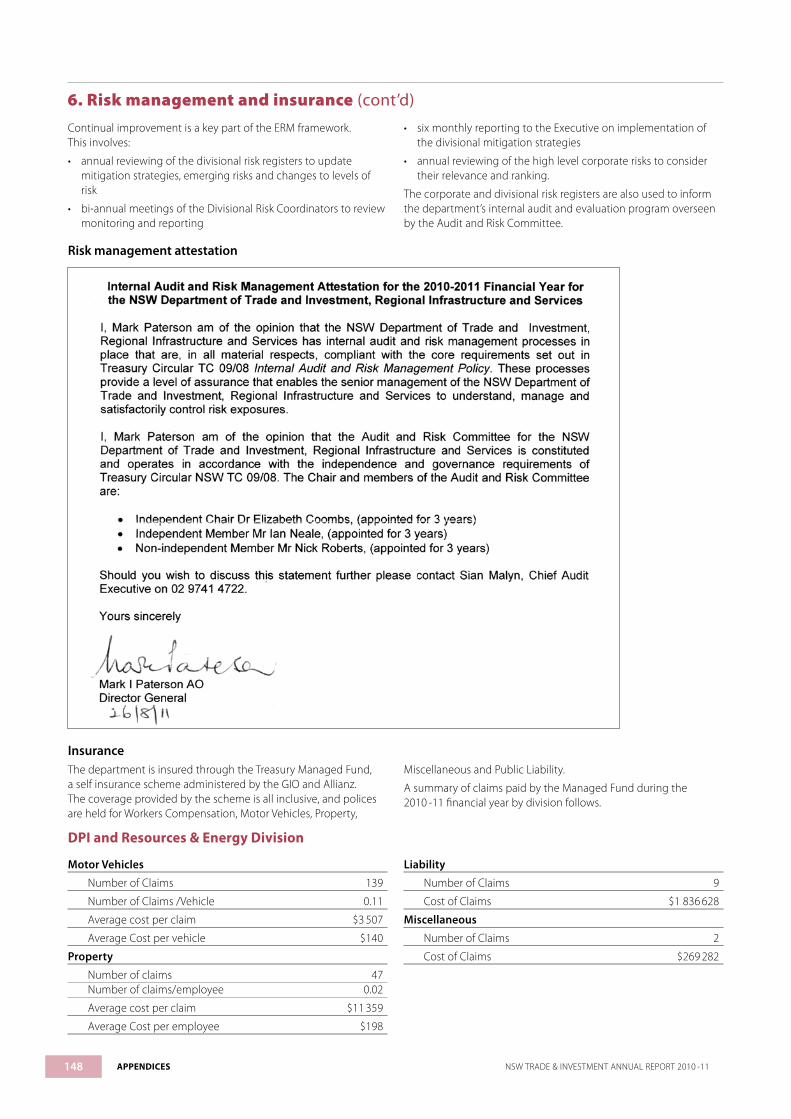
148 APPENDICES NSW TRADE & INVESTMENT ANNUAL REPORT 2010 -11
Continual improvement is a key part of the ERM framework. This involves:
• annual reviewing of the divisional risk registers to update mitigation strategies, emerging risks and changes to levels of risk
• bi-annual meetings of the Divisional Risk Coordinators to review monitoring and reporting
• six monthly reporting to the Executive on implementation of the divisional mitigation strategies
• annual reviewing of the high level corporate risks to consider their relevance and ranking.
The corporate and divisional risk registers are also used to inform the department’s internal audit and evaluation program overseen by the Audit and Risk Committee.
Risk management attestation
InsuranceThe department is insured through the Treasury Managed Fund, a self insurance scheme administered by the GIO and Allianz. The coverage provided by the scheme is all inclusive, and polices are held for Workers Compensation, Motor Vehicles, Property,
Miscellaneous and Public Liability.
A summary of claims paid by the Managed Fund during the 2010 -11 financial year by division follows.
DPI and Resources & Energy Division
Motor Vehicles
Number of Claims 139
Number of Claims /Vehicle 0.11
Average cost per claim $3 507
Average Cost per vehicle $140
Property
Number of claims 47 Number of claims/employee 0.02
Average cost per claim $11 359
Average Cost per employee $198
Liability
Number of Claims 9
Cost of Claims $1 836 628
Miscellaneous
Number of Claims 2
Cost of Claims $269 282
6. Risk management and insurance (cont’d)

7. Occupational health & safety
Workplace Incident Statistics – Performance Indicators
DPI and Resources & Energy and Industry and Innovation & Investment Divisions The Health & Safety unit have successfully implemented scheduled components of the Health & Safety strategy. Tasks which have been successfully completed include: Level 1- 4 managers participating in Safety Leadership workshops, roll out of Performance Development system, risk management training developed and piloted with a target group.
A new Health & Safety framework, policies and procedures has also been established in 2011 with ongoing consultation. Further development, implementation and education for all staff will be provided throughout the next year.
149NSW TRADE & INVESTMENT ANNUAL REPORT 2010 -11 APPENDICES
Industry Innovation & Investment Division
Policy No of Claims
Amount Paid $
Reserve Balance $
Recovered to date $
Net Incurred $
Workers Compensation 8 38 887 - - 38 887Motor vehicles 10 34 204 6 097 - 40 301Property 3 48 049 19 000 - 67 049Public Liability - - - - -Miscellaneous - - - - -Total 21 121 140 25 097 - 146 237
NSW Office of Water
Policy No of Claims
Amount Paid $
Reserve Balance $
Recovered to date $
Net Incurred $
Workers CompensationMotor Vehicles 18 19 524 42 174 - 61 698Property 14 34 791 448 124 - 4 82 9 151 Public Liability - - - - -Miscellaneous - - - - -Total 32 54 315 490 298 - 544 613
1: The property claims value is skewed by one extraordinary claim of $340 320 for damage to infrastructure at Burrinjuck Dam due to flooding.
Arts NSW
Policy No of Claims
Amount Paid $
Reserve Balance $
Recovered to date $
Net Incurred $
Workers Compensation 3 9 090 - - 9 090Motor vehicles - - - - -Property 2 139 427 - - 139 427Public Liability 1 3 000 - - 3 000Miscellaneous - - - - -Total 6 151 517 - - 151 517
Office of Liquor, Gaming & Racing
Policy No of Claims
Amount Paid $
Reserve Balance $
Recovered to date $
Net Incurred $
Workers Compensation 5 35 485 - - 35 485Motor vehicles 5 9 991 61 2 156 7 896Property - - - - -Public Liability - - - - -Miscellaneous - - - - -Total 10 45 476 61 2 156 43 381
6. Risk management and insurance (cont’d)
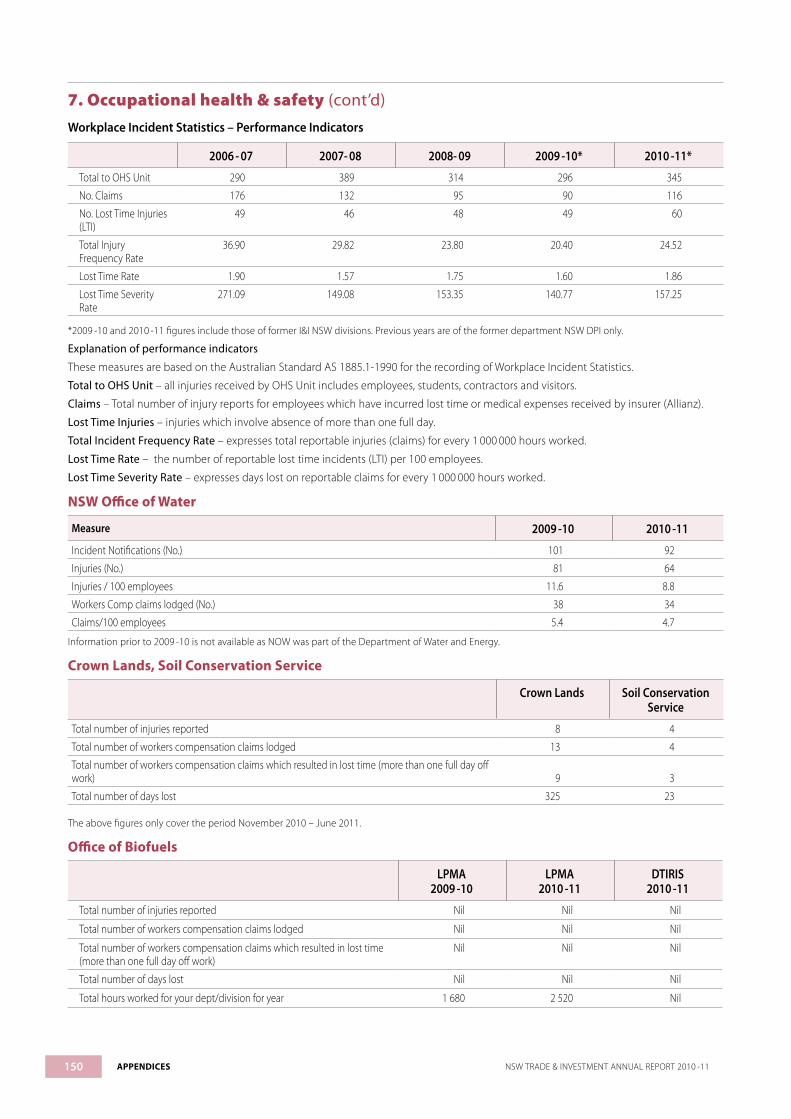
Workplace Incident Statistics – Performance Indicators
2006 - 07 2007- 08 2008- 09 2009 -10* 2010 -11*
Total to OHS Unit 290 389 314 296 345
No. Claims 176 132 95 90 116
No. Lost Time Injuries (LTI)
49 46 48 49 60
Total Injury Frequency Rate
36.90 29.82 23.80 20.40 24.52
Lost Time Rate 1.90 1.57 1.75 1.60 1.86
Lost Time Severity Rate
271.09 149.08 153.35 140.77 157.25
*2009 -10 and 2010 -11 figures include those of former I&I NSW divisions. Previous years are of the former department NSW DPI only.
Explanation of performance indicators
These measures are based on the Australian Standard AS 1885.1-1990 for the recording of Workplace Incident Statistics.
Total to OHS Unit – all injuries received by OHS Unit includes employees, students, contractors and visitors.
Claims – Total number of injury reports for employees which have incurred lost time or medical expenses received by insurer (Allianz).
Lost Time Injuries – injuries which involve absence of more than one full day.
Total Incident Frequency Rate – expresses total reportable injuries (claims) for every 1 000 000 hours worked.
Lost Time Rate – the number of reportable lost time incidents (LTI) per 100 employees.
Lost Time Severity Rate – expresses days lost on reportable claims for every 1 000 000 hours worked.
NSW Office of Water
Measure 2009 -10 2010 -11
Incident Notifications (No.) 101 92
Injuries (No.) 81 64
Injuries / 100 employees 11.6 8.8
Workers Comp claims lodged (No.) 38 34
Claims/100 employees 5.4 4.7
Information prior to 2009 -10 is not available as NOW was part of the Department of Water and Energy.
Crown Lands, Soil Conservation Service
Crown Lands Soil Conservation Service
Total number of injuries reported 8 4
Total number of workers compensation claims lodged 13 4
Total number of workers compensation claims which resulted in lost time (more than one full day off work) 9 3
Total number of days lost 325 23
The above figures only cover the period November 2010 – June 2011.
Office of Biofuels
LPMA2009 -10
LPMA2010 -11
DTIRIS2010 -11
Total number of injuries reported Nil Nil Nil
Total number of workers compensation claims lodged Nil Nil Nil
Total number of workers compensation claims which resulted in lost time (more than one full day off work)
Nil Nil Nil
Total number of days lost Nil Nil Nil
Total hours worked for your dept/division for year 1 680 2 520 Nil
150 APPENDICES NSW TRADE & INVESTMENT ANNUAL REPORT 2010 -11
7. Occupational health & safety (cont’d)

Arts NSW, Office Liquor Gaming & RacingAs part of the NSW government commitment to staff health, safety and wellbeing, a new component was included in the Learning and Development program for 2010 -11 called ‘Health & Well-Being’. This program offered a range of seminars and workshops to support employees with their health, safety and well-being in the workplace and recognises that personnel development workshops strongly influence the physical, mental, social, emotional and occupational health of employees, and impact positively on life satisfaction and personal growth.
The Health and Well being program also addressed a number of key initiatives coming out of the Government’s ‘Working Together: Public Sector Workplace Health and Safety and Injury Management Strategy 2010 -12’ and Leading Well: the Role of Leadership in Improving the Prevention and Management of Psychological Injury’ programs. Some of the workshops that addressed these initiatives included:
• Navigating Change • Essential Skills for managers • OHS training for Managers & Supervisors • Job Seeking Skills • OHS awareness training for staff • Effective Workplace communication
Arts NSW
2009 -10 2010 -11
Total number of injuries reported 0 2
Total number of workers compensation claims lodged 0 3
Total number of workers compensation claims which resulted in lost time (more than one full day off work) 0 1
Total number of days lost 0 10
Office Liquor Gaming & Racing
2009 -10 2010-11
Total number of injuries reported 9 9
Total number of workers compensation claims lodged 5 5
Total number of workers compensation claims which resulted in lost time (more than one full day off work) 2 4
Total number of days lost 26 30
8. Staff Statistics
DPI and Resources & Energy and Industry and Innovation & Investment DivisionsAll statistics shown in the following tables are expressed as equivalent full time (EFT) unless otherwise stated.
Staff numbers (EFT)
2007- 08 2008 - 09 2009 -10 2010 -11
Permanent 1 900 1 791 2 100 2 177
Other 725 622 700 813
Totals 2 625 2 413 2 800 2 990
EFT number of female and male staff within salary levels
Salary Level $0 -$39 670
$39 670 -$52 104
$52 104 -$58 249
$58 249 - $73 709
$73 709 - $95 319
$95 319 - $119 149
Greaterthan
$119 149(Non-SES)
Greater than$119 149
(SES)
Total
Female 4 142 160 271 383 314 79 11 1 365
Male 10 175 175 266 495 379 115 10 1 625
Totals 14 317 335 537 878 693 194 21 2 990
151NSW TRADE & INVESTMENT ANNUAL REPORT 2010 -11 APPENDICES
7. Occupational health & safety (cont’d)

Numbers and levels of SES staff
2007- 08 2008 - 09 2009 -10 2010 -11
Level 1 1 0 0 0
Level 2 9 5 4 4
Level 3 12 8 5 3
Level 4 1 1 3* 4
Level 5 5 6 6 6
Level 6 5 4 3 3
Level 7 2 1 1 1
Level 8 2 2 2 3
Total 37 27 24 24
* Includes one vacant position
Numbers and levels of female SES staff
2007- 08 2008 - 09 2009 -10 2010 -11
Level 2 3 2 1
Level 3 5 3 1 2
Level 4 0 0 1 2
Level 5 1 3 3 3
Level 6 2 2 2 1
Total 11 10 8 8
NSW Office of Water
Staff numbers as at 30 June 2011. The numbers include Metropolitan Water Branch staff who had been transferred to Department of Finance and Services at 30 June 2011. All statistics shown in the following tables are expressed as equivalent full time (EFT) unless otherwise stated.
2009 -10 2010 -11
Permanent 561.2 600.4
Other 102.1 94.6
Total 663.3 695.0
EFT numbers of female and male staff within salary levels (headcount as at 23 June 2011 – census date)
Salary level >$0 – < $39 670
$39 670 - < $52 104
$52 104 - < $58 249
$58 249 - < $73 709
$73 709 - < $95 319
$95 319 - < =$119 149
>$119 149 (Non SES)
>$119 149 (SES)
Total
Female 1 8 20 89 85 56 8 1 268Male - 24 14 65 184 152 21 1 461Totals 1 32 34 154 269 208 29 2 729
Numbers and level of SES staff
2009 -10 2010 -11
Level 4 1 1
Level 6 1 1
Total 2 2
152 APPENDICES NSW TRADE & INVESTMENT ANNUAL REPORT 2010 -11
8. Staff Statistics (cont’d)

Female executive officers
2009 -10 2010 -11
Level 4 1 1
Total 1 1
Crown Lands Division
2010 -11
Permanent 380
Other 11
Total 391
EFT numbers of female and male staff within salary levels
Salary Level $0-$38 143
$38 144- $50 099
$50 100- $56 008
$56 009- $70 873
$70 874- $91 652
$91 653-$11 466
Greater than $114 566 (Non-SES)
Greater than $114 566
(SES)
Total
Female 9 9 6 43 87 18 6 0 178Male 4 6 4 12 112 45 27 3 213Totals 13 15 10 55 199 63 33 3 391
Numbers and level of SES staff
Level 2007- 08 2008 - 09 2009 -10 2010 -11
1 1 1 1 1
2 1 2 2 1
4 1 1 1 1
Total 3 4 4 3
Note: No female SES Officers
Soil Conservation Service
2010 -11
Permanent 129
Other 18
Total 147
EFT numbers of female and male staff within salary levels
Salary Level $0-$38 143 $38 144 - $50 099
$50 100 - $56 008
$56 009 - $70 873
$70 874 - $91 652
$91 653 - $114 566
Greater than $114 566 (Non-SES)
Greater than $114 566
(SES)
Total
Female 8 1 0 11 4 0 0 0 24Male 11 43 4 12 46 3 3 1 123
Totals 19 44 4 23 50 3 3 1 147
Numbers and level of SES staff
Level 2007- 08 2008 - 09 2009 -10 2010 -11
2 1 1 1 1
Total 1 1 1 1
Note: No female SES Officers
153NSW TRADE & INVESTMENT ANNUAL REPORT 2010 -11 APPENDICES
8. Staff Statistics (cont’d)

Arts NSWStaff numbers (as at 30 June 2011). All statistics shown in the following tables are expressed as equivalent full time (EFT) unless otherwise stated.
2010-11
Permanent 30
Other 4
Total 34
Numbers of female and male staff within salary levels (headcount as at 23 June 2011 – census date)
Salary level >$0 – < $39 670
$39 670 - < $52 104
$52 104 - < $58 249
$58 249 - < $73 709
$73 709 - < $95 319
$95 319 - < =$119 149
>$119 149 (Non SES)
>$119 149 (SES)
Total
Female - - - 8 13 9 2 1 33
Male - - - - 1 5 1 0 8
Totals - - 1 8 14 14 3 1 41
Numbers and level of SES staff
2009 -10 2010 -11
Level 4 1 1
Total 1 1
Female executive officers
2009 -10 2010 -11
Level 5 1 1
Total 1 1
Office of Liquor, Gaming and Racing
2010 -11
Permanent 182
Other 19
Total 201
Numbers of female and male staff within salary levels (headcount as at 23 June 2011 – census date)
Salary Level >$0 – < $39 670
$39 670 - < $52 104
$52 104 - < $58 249
$58 249 - < $73 709
$73 709 - < $95 319
$95 319 - < =$119 149
>$119 149 (Non SES)
>$119 149 (SES)
Total
Female - 7 8 33 25 14 3 1 91
Male - 5 3 20 61 23 8 1 121
Totals - 12 11 53 86 37 11 2 212
Numbers and level of SES staff
2009 -10 2010 -11
Level 3 1 1
Level 5 1 1
Total 2 2
Female executive officers
2009 -10 2010 -11
Level 5 1 1
Total 1 1
154 APPENDICES NSW TRADE & INVESTMENT ANNUAL REPORT 2010 -11
8. Staff Statistics (cont’d)

9. Equal employment opportunity
DPI and Resources & Energy and Industry and Innovation & Investment Divisions
Table 1. Trends in the representation of EEO target groups
Trends in the Representation of EEO Groups
EEO Group Benchmark/Target Percentage of Total Staff
2009 2010 2011
Women 50.0% 41.3% 43.2% 44.0%
Aboriginal people and Torres Strait Islanders 2.6% 1.5% 2.1% 2.2%
People whose first language was not English 19.0% 15.4% 15.0% 18.8%
People with a disability N/A 7.4% 5.8% 6.1%
People with a disability requiring work-related adjustment 1.5% 1.1% 1.3% 1.3%
Table 2. Trends in the distribution of EEO Groups
Trends in the Distribution of EEO Groups
EEO Group Benchmark 2009 2010 2011
Women 100 92 94 94
Aboriginal people and Torres Strait Islanders 100 81 83 80
People whose first language was not English 100 97 97 102
People with a disability 100 92 90 92
People with a disability requiring work-related adjustment 100 87 84 87
Note 1. A Distribution Index of 100 indicates that the centre of the distribution of the EEO group across salary levels is equivalent to that of other staff. Values less than 100 mean that the EEO group tends to be more concentrated at lower salary levels than is the case for other staff. The more pronounced this tendency is, the lower the index will be. In some cases the index may be more than 100, indicating that the EEO group is less concentrated at lower salary levels.Note 2. The Distribution Index is not calculated where EEO group or non-EEO group numbers are less than 20.
Table 3. Percent of total NSW DPI staff by level
Remuneration Level of Substantive Position
2011
Actual Estimated
Total Staff (Men &
Women)
Respondents Men Women Aboriginal People & Torres Strait Islanders
People from Racial, Ethnic,
Ethno-Religious Minority Groups
People whose Language First
Spoken as a Child was not
English
People with a Disability
People with a Disability Requiring
Work-related Adjustment
>$0 - < $39 670 171 86.0% 30.4% 69.6% 3.4% 9.5% 10.2% 6.8% 0.7%
$39 670 - < $52 104 859 54.4% 66.0% 34.0% 4.9% 16.7% 15.6% 9.9% 3.2%
$52 104 - < $58 249 693 63.5% 45.9% 54.1% 3.0% 12.3% 16.4% 6.1% 0.7%
$58 249 - < $73 709 1609 66.4% 43.9% 56.1% 3.3% 14.4% 21.4% 6.1% 1.2%
$73 709 - < $95 319 2384 69.8% 56.4% 43.6% 1.6% 13.9% 20.2% 6.4% 1.3%
$95 319 - < =$119 149 1404 74.6% 65.7% 34.3% 0.3% 11.8% 19.4% 3.6% 0.5%
>$119 149 (Non SES) 340 72.4% 77.6% 22.4% 0.0% 6.9% 14.2% 4.5% 0.4%
>$119 149 (SES) 44 72.7% 61.4% 38.6% 3.1% 0.0% 3.1% 6.3% 3.1%
Total 7504 68.1% 56.0% 44.0% 2.2% 13.3% 18.8% 6.1% 1.3%
Note: Figures in the above tables included NSW Trade & Investment statutory and cultural agencies numbers excluding those shown in the tables following.
155NSW TRADE & INVESTMENT ANNUAL REPORT 2010 -11 APPENDICES

Crown Lands Division
Table 1. Trends in the representation of EEO target groups
EEO Group % of Total Staff
Benchmark or Target 2011
Women N/A 46%
Aboriginal or TSI N/A 3%
People whose first language was not English N/A 5%
Disability Adjustment N/A 2%
Long-term Impairment N/A 5%
Table 2. Trends in the distribution of EEO Groups
EEO Group Distribution Index
Benchmark or Target 2011
Women 82% 89%
Aboriginal or TSI 82% 74%
People whose first language was not English 82% 95%
Disability Adjustment 82% 93%
Long-term Impairment 82% 95%
Table 3. Percent of total Crown Lands staff by level
Level Total Staff Respondents Men Women Aboriginal or TSI
Racial/Ethnic Minority
People whose first language
was not English
Disability Adjustment
Long-term Impairment
< $38 144 13 3% 1% 2% 1% 0% 0% 0% 0%
$38 144 - $50 099 15 4% 2% 2% 0% 0% 0% 0% 0%
$50 100 - $56 008 10 3% 1% 2% 1% 1% 1% 0% 1%
$56 009 - $70 873 55 14% 3% 11% 1% 0% 0% 0% 0%
$70 874 - $91 652 199 50% 29% 22% 2% 5% 3% 1% 3%
$91 653 - $114 566 63 16% 12% 5% 0% 1% 1% 0% 0%
> $114 566 (non SES) 33 8% 7% 2% 0% 0% 0% 0% 0%
> $114 566 (SES) 3 1% 1% 0% 0% 0% 0% 0% 0%
Total 391 98% 54% 46% 3% 6% 5% 2% 5%Total Staff Numbers 391 384 213 178 13 25 18 7 19
*Staff numbers are as at 30 June 2011*Excludes contractors and board members
156 APPENDICES NSW TRADE & INVESTMENT ANNUAL REPORT 2010 -11
9. Equal employment opportunity (cont’d)

Table 4. Percent of total Crown Lands staff by Employment Basis
Employment basis Total Staff Respondents Men Women Aboriginal or TSI
Racial/Ethnic Minority
People whose first language
was not English
Disability Adjustment
Long-term Impairment
Perm FT 347 87% 52% 37% 3% 6% 5% 2% 4%
Perm PT 33 8% 1% 8% 1% 0% 0% 0% 1%
Temp FT 6 1% 1% 1% 0% 0% 0% 0% 0%
Temp PT 4 1% 1% 0% 0% 0% 0% 0% 0%
Casual 1 0% 0% 0% 0% 0% 0% 0% 0%
TOTAL 391 98% 54% 46% 3% 6% 5% 2% 5%Total Staff Numbers 391 384 213 178 13 25 18 7 19
Soil Conservation Service
Table 1. Trends in the representation of EEO target groups
EEO Group % of Total Staff
Benchmark or Target 2011
Women N/A 46%
Aboriginal or TSI N/A 3%
People whose first language was not English N/A 5%
Disability Adjustment N/A 2%
Long-term Impairment N/A 5%
Table 2. Trends in the distribution of EEO Groups
EEO Group Distribution Index
Benchmark or Target 2011
Women 82% 89%
Aboriginal or TSI 82% 74%
People whose first language was not English 82% 95%
Disability Adjustment 82% 93%
Long-term Impairment 82% 95%
Table 3. Percent of total Soil Conservation staff by level
Level Total Staff Respondents Men Women Aboriginal or TSI
Racial/Ethnic
Minority
People whose first language was not English
Disability Adjustment
Long-term Impairment
< $38 144 13 3% 1% 2% 1% 0% 0% 0% 0%
$38 144 - $50 099 15 4% 2% 2% 0% 0% 0% 0% 0%
$50 100 - $56 008 10 3% 1% 2% 1% 1% 1% 0% 1%
$56 009 - $70 873 55 14% 3% 11% 1% 0% 0% 0% 0%
$70 874 - $91 652 199 50% 29% 22% 2% 5% 3% 1% 3%
$91 653 - $114 566 63 16% 12% 5% 0% 1% 1% 0% 0%
> $114 566 (non SES) 33 8% 7% 2% 0% 0% 0% 0% 0%
> $114 566 (SES) 3 1% 1% 0% 0% 0% 0% 0% 0%
Total 391 98% 54% 46% 3% 6% 5% 2% 5%Total Staff Numbers 391 384 213 178 13 25 18 7 19
*Staff numbers are as at 30 June 2011 *Excludes contractors and board members
157NSW TRADE & INVESTMENT ANNUAL REPORT 2010 -11 APPENDICES
9. Equal employment opportunity (cont’d)

Table 4. Percent of total Soil Conservation staff by Employment Basis
Employment basis Total Staff Respondents Men Women Aboriginal or TSI
Racial/Ethnic
Minority
People whose first language was not English
Disability Adjustment
Long-term Impairment
Perm FT 347 87% 52% 37% 3% 6% 5% 2% 4%
Perm PT 33 8% 1% 8% 1% 0% 0% 0% 1%
Temp FT 6 1% 1% 1% 0% 0% 0% 0% 0%
Temp PT 4 1% 1% 0% 0% 0% 0% 0% 0%
Casual 1 0% 0% 0% 0% 0% 0% 0% 0%
TOTAL 391 98% 54% 46% 3% 6% 5% 2% 5%Total Staff Numbers 391 384 213 178 13 25 18 7 19
Arts NSW
Table 1. Trends in the representation of EEO target groups
EEO Group Benchmark / Target Trends in the Representation of EEO Groups
Percentage of Total Staff
2010 2011
Women 50.0% 73.7% 80.5%
Aboriginal people and Torres Strait Isanders 2.6% 9.9% 8.4%
People whose first language was not English 19.0% 9.7% 4.9%
People with a disability N/A 9.0% 8.1%
People with a disability requiring work-related adjustment 1.5% 5.9% 5.2%
Table 2. Trends in the distribution of EEO Groups
EEO Group Benchmark Trends in the Distribution of EEO Groups
2010 2011
Women 100 n/a n/a
Aboriginal people and Torres Strait Isanders 100 n/a n/a
People whose first language was not English 100 n/a n/a
People with a disability 100 n/a n/a
People with a disability requiring work-related adjustment 100 n/a n/a
Note 1. A Distribution Index of 100 indicates that the centre of the distribution of the EEO group across salary levels is equivalent to that of other staff. Values less than 100 mean that the EEO group tends to be more concentrated at lower salary levels than is the case for other staff. The more pronounced this tendency is, the lower the index will be. In some cases the index may be more than 100, indicating that the EEO group is less concentrated at lower salary levels.Note 2. The Distribution Index is not calculated where EEO group or non-EEO group numbers are less than 20.
158 APPENDICES NSW TRADE & INVESTMENT ANNUAL REPORT 2010 -11
9. Equal employment opportunity (cont’d)

Table 3. Percent of total Arts NSW staff by level
Remuneration Level of Substantive Position
2011
Actual Estimated
Total Staff (Men &
Women)
Respondents Men Women Aboriginal People & Torres Strait Islanders
People from Racial, Ethnic,
Ethno-Religious Minority Groups
People whose Language First
Spoken as a Child was not
English
People with a Disability
People with a Disability Requiring
Work-related Adjustment
>$0 - < $39,670 - 0.0% 0.0% 0.0% 0.0% 0.0% 0.0% 0.0% 0.0%
$39 670 - < $52 104 - 0.0% 0.0% 0.0% 0.0% 0.0% 0.0% 0.0% 0.0%
$52 104 - < $58 249 1 100.0% 100.0% 0.0% 0.0% 0.0% 100.0% 0.0% 0.0%
$58 249 - < $73 709 8 87.5% 0.0% 100.0% 28.6% 28.6% 100.0% 14.3% 14.3%
$73 709 - < $95 319 14 85.7% 7.1% 92.9% 8.3% 0.0% 100.0% 8.3% 0.0%
$95 319 - < =$119 149 14 85.7% 35.7% 64.3% 0.0% 8.3% 100.0% 0.0% 0.0%
>$119 149 (Non SES) 3 100.0% 33.3% 66.7% 0.0% 0.0% 100.0% 0.0% 0.0%
>$119 149 (SES) 1 100.0% 0.0% 100.0% 0.0% 0.0% 100.0% 100.0% 100.0%
Total 41 87.8% 19.5% 80.5% 8.4% 8.4% 100.0% 8.1% 5.2%
Office Liquor Gaming & Racing
Table 1. Trends in the representation of EEO target groups
EEO Group Benchmark / Target Trends in the Representation of EEO Groups
Percentage of Total Staff
2010 2011
Women 50.0% 40.4% 42.9%
Aboriginal people and Torres Strait Isanders 2.6% 2.2% 2.0%
People whose first language was not English 19.0% 23.7% 17.1%
People with a disability N/A 9.3% 10.6%
People with a disability requiring work-related adjustment 1.5% 3.0% 4.6%
Table 2. Trends in the distribution of EEO Groups
EEO Group Benchmark Trends in the Distribution of EEO Groups
2010 2011
Women 100 87 89
Aboriginal people and Torres Strait Isanders 100 n/a n/a
People whose first language was not English 100 88 87
People with a disability 100 n/a 81
People with a disability requiring work-related adjustment 100 n/a n/a
Note 1. A Distribution Index of 100 indicates that the centre of the distribution of the EEO group across salary levels is equivalent to that of other staff. Values less than 100 mean that the EEO group tends to be more concentrated at lower salary levels than is the case for other staff. The more pronounced this tendency is, the lower the index will be. In some cases the index may be more than 100, indicating that the EEO group is less concentrated at lower salary levels.Note 2. The Distribution Index is not calculated where EEO group or non-EEO group numbers are less than 20.
159NSW TRADE & INVESTMENT ANNUAL REPORT 2010 -11 APPENDICES
9. Equal employment opportunity (cont’d)

Table 3.Percent of total OLGR staff by level
Remuneration Level of Substantive Position
2011
Actual Estimated
Total Staff (Men &
Women)
Respondents Men Women Aboriginal People & Torres Strait Islanders
People from Racial, Ethnic,
Ethno-Religious Minority Groups
People whose Language First
Spoken as a Child was not
English
People with a Disability
People with a Disability Requiring
Work-related Adjustment
>$0 - < $39 670 - 0.0% 0.0% 0.0% 0.0% 0.0% 0.0% 0.0% 0.0%
$39 670 - < $52 104 12 91.7% 41.7% 58.3% 9.1% 36.4% 100.0% 45.5% 36.4%
$52 104 - < $58 249 11 100.0% 27.3% 72.7% 0.0% 45.5% 100.0% 9.1% 0.0%
$58 249 - < $73 709 53 90.6% 37.7% 62.3% 2.1% 56.3% 95.8% 12.5% 4.2%
$73 709 - < $95 319 86 95.3% 70.9% 29.1% 1.2% 20.7% 98.8% 9.8% 3.7%
$95 319 - < =$119 149 37 94.6% 62.2% 37.8% 2.9% 22.9% 97.1% 2.9% 0.0%
>$119 149 (Non SES) 11 72.7% 72.7% 27.3% 0.0% 0.0% 100.0% 0.0% 0.0%
>$119 149 (SES) 2 0.0% 50.0% 50.0% 0.0% 0.0% 0.0% 0.0% 0.0%
Total 212 92.0% 57.1% 42.9% 2.0% 30.9% 97.0% 10.6% 4.6%
Women’s employmentNSW Trade & Investment continues to work to develop an organisational environment where women can maximise their opportunities and talents, and achieve career goals. In September 2010 the former I&I NSW Executive endorsed the development of an integrated I&I NSW Women’s Employment Strategy, building on successful programs within the former agencies and aligned to broader NSW Government priorities in attracting, retaining and developing women employees. Wendy Stamp, Executive Director Policy Governance & Communications was nominated as the Executive sponsor to drive this program.
The department’s wider workforce management programs provided the context within which I&I NSW sought to position itself as an attractive and supportive workplace for women, and to retain and better manage talented female employees for senior and leadership roles.
Aboriginal employmentThe department continues to make progress towards strengthening employment opportunities for Aboriginal people and fostering community partnerships.
The former department, Industry & Investment NSW (I&I NSW) launched an Aboriginal Employment Strategy in late 2010, focussing on recruiting and retaining Aboriginal staff. NSW Trade & Investment is continuing to work to achieve the following key outcomes of the strategy:
• increased Aboriginal employment to a minimum of 2.6 per cent in 2015, to meet the NSW Government commitment under the Council of Australian Governments (COAG) National Partnership on Indigenous Economic Participation
• increased professional and career development opportunities for Aboriginal staff
• NSW Trade & Investment established as a workplace that is supportive, flexible and respectful of Aboriginal culture.
Implementation of the strategy and determination of priorities is being overseen by a Steering Committee, and informed by an Aboriginal Employee Network. The inaugural meeting of the Aboriginal Employee Network was held in April 2010 to consider the strategy, discuss issues and validate priorities identified by the steering committee. All Aboriginal staff were invited to attend and participate this meeting.
Formalising a structured approach to Aboriginal recruitment was confirmed to be the highest priority action for the department, to achieve the goal of minimum 2.6 per cent Aboriginal employment by 2015. The former department I&I NSW had 1.2 per cent Aboriginal employment and although data is not yet available for NSW Trade & Investment as a whole, it is anticipated to present a similar profile. The structured approach to Aboriginal recruitment requires identification of suitable new or existing positions, targeted bulk recruitment of Aboriginal people on an annual basis, and provision of ongoing support and resources to Aboriginal employees and their managers, eg. Mentoring program. NSW Trade & Investment will continue to progress this approach into 2011-12.
Disability Action Plan It is planned that the department will develop an overarching organisation-wide Disability Action Plan next year and will have a number of specific Disability Action Plans for agencies and for cultural institutions within the department which interface directly with the broader community. The plans will contain internal strategies targeted at employment and retention of people with disability, while externally focussed strategies will be aimed at increasing accessibility to services and information provided by the department.
DPI
Fishing workshops for special needs peopleTwenty two fishing workshops were conducted throughout NSW for over 500 children and adults with disabilities, people with
160 APPENDICES NSW TRADE & INVESTMENT ANNUAL REPORT 2010 -11
9. Equal employment opportunity (cont’d)

brain injury, children from Aboriginal and non English speaking background and children with special needs. The workshops are part of a state-wide program run by the department and funded by the NSW Recreational Fishing Trust. These fishing workshops were carried out together with the support of:
Department of Family & Community Services Ageing, Disability and Home Care Baptist Community Services Interchange Disability Support Services Youth Connections Kurrajong Waratah Narrandera Central Coast Family Support East Gosford Lions Club Camp Quality Casino Real Group Illawarra Retirement Trust Brain Injury Rehabilitation Unit, Liverpool Hospital Warrawong School Bernados Warrawong School Bernados Access Community Group Police Community Youth Club Haven Education Centre Australian League of Immigration Volunteers
In October 2010, the department hosted two unique fishing workshops, one for people who have suffered brain injuries and the other for adults with a disability. Held at Georges River National Park, Revesby, the workshops focused on helping people who have had injuries reconnect with recreational activities.
Arts NSW
Identifying and removing barriers to services for people with a disability Organisations funded under Arts NSW’s competitively-assessed Arts Funding Program are expected to consider the needs of people with a disability as creators, participants and audiences.
In 2010 -11 the Arts Funding Program funded 31 programs and projects to increase participation in the arts and cultural sectors by people with a disability. 14 of the programs and projects are in regional NSW. They included:
• $240 875 as year three of triennial funding to Accessible Arts, the state-wide peak body for art and disability in New South Wales. Accessible Arts provides advice and assistance to Arts NSW and arts organisations on meeting the needs of people with disabilities, to encourage their full participation in the cultural life of New South Wales. Accessible Arts delivers four main specialist services: arts development, audience development, training and information
• funding for the Australian Theatre for Young People to commission a new work, Dark Tales, with a cast of sighted and visually impaired young artists
• $25 000 a year for three years, commencing in 2010 -11, to Parramatta City Council for a part time Creative Director/Coordinator at Parramatta Riverside Theatres, to expand its Workshops in the Arts for People with a Disability
• $30 000 to Arts OutWest for the Arts, Health and Wellbeing Strategic Development project, for artists and arts workers to
work with patients at the redeveloped Bloomfield Hospital Campus and develop site-specific work in multi-disciplinary teams
• $25 000 to the Sylvanvale Foundation for a 12 month pilot project, for artists with an intellectual disability to work alongside professional artists in a studio environment at Campbelltown Arts Centre.
Information from Arts NSW’s Cultural Facilities Audit in 2010 is now available on Arts NSW’s website as a Cultural Facilities Directory, with details of publicly owned NSW performance and exhibition spaces outside the Sydney CBD. It includes searchable information on access for people with a disability to these facilities – http://facilities.arts.nsw.gov.au/.
Details of the National Relay Service are provided on the Arts NSW website.
This ensures that people with hearing and speech impairments have access to information about Arts NSW services.
Arts NSW’s website has a range of features to increase accessibility, such as being able to re-size the display font and change the background colour.
Accessible Arts, which receives triennial funding from Arts NSW advocates on behalf of artists and people with disabilities to improve accessibility to cultural opportunities and activities.
Accessible Arts conducted a 2010 Survey of Arts Programs and Projects for People with a Disability in NSW. 177 respondents, including arts organisations, arts venues, peak disability organisations, disability program providers and local councils provided information on programs for people with a disability and what forms of support would assist organisations to expand programs (e.g., funding, information, networks, access to arts workers). Accessible Arts’ survey is published on its website – http://www.aarts.net.au/policy-research/.
Arts NSW is working with Ageing, Disability and Home Care (ADHC) in the NSW Department of Family and Community Services to build capacity in the arts sector that will improve participation in the arts by people with a disability.
Arts NSW and ADHC are also using Accessible Arts’ survey results (see page 78) to inform their work to build capacity in the arts and disability sectors.
161NSW TRADE & INVESTMENT ANNUAL REPORT 2010 -11 APPENDICES
9. Equal employment opportunity (cont’d)
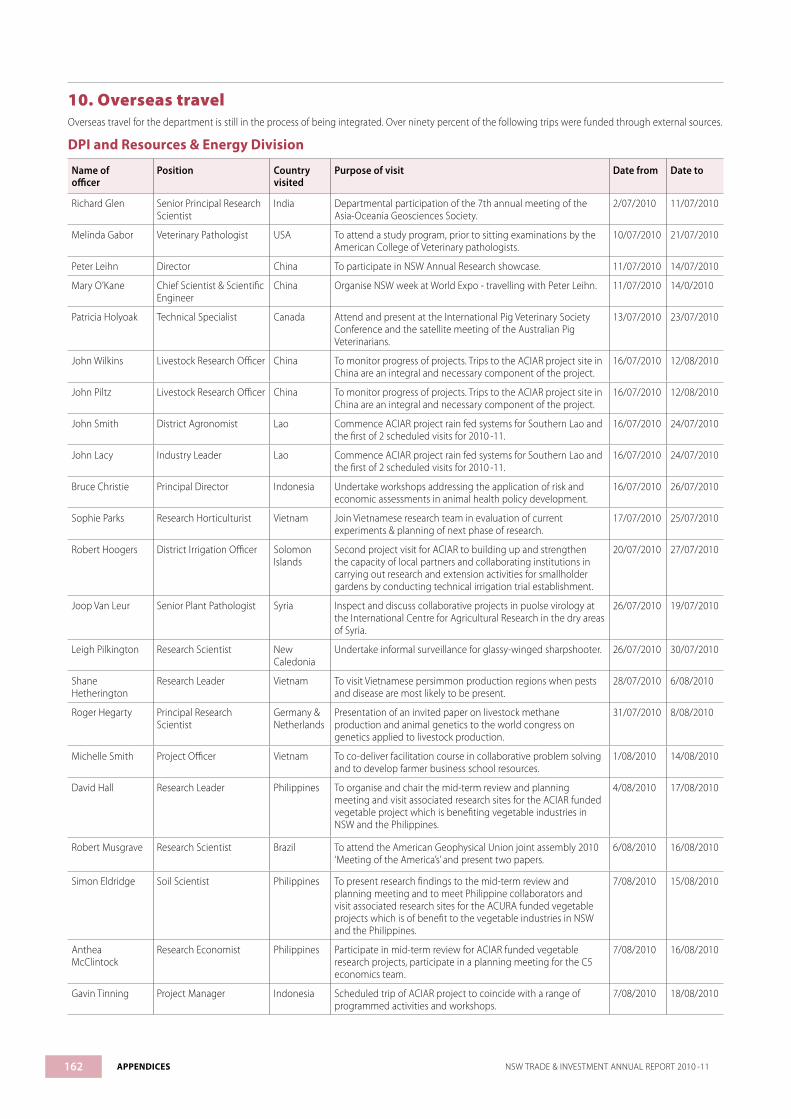
162 APPENDICES NSW TRADE & INVESTMENT ANNUAL REPORT 2010 -11
10. Overseas travelOverseas travel for the department is still in the process of being integrated. Over ninety percent of the following trips were funded through external sources.
DPI and Resources & Energy Division
Name of officer
Position Country visited
Purpose of visit Date from Date to
Richard Glen Senior Principal Research Scientist
India Departmental participation of the 7th annual meeting of the Asia-Oceania Geosciences Society.
2/07/2010 11/07/2010
Melinda Gabor Veterinary Pathologist USA To attend a study program, prior to sitting examinations by the American College of Veterinary pathologists.
10/07/2010 21/07/2010
Peter Leihn Director China To participate in NSW Annual Research showcase. 11/07/2010 14/07/2010
Mary O’Kane Chief Scientist & Scientific Engineer
China Organise NSW week at World Expo - travelling with Peter Leihn. 11/07/2010 14/0/2010
Patricia Holyoak Technical Specialist Canada Attend and present at the International Pig Veterinary Society Conference and the satellite meeting of the Australian Pig Veterinarians.
13/07/2010 23/07/2010
John Wilkins Livestock Research Officer China To monitor progress of projects. Trips to the ACIAR project site in China are an integral and necessary component of the project.
16/07/2010 12/08/2010
John Piltz Livestock Research Officer China To monitor progress of projects. Trips to the ACIAR project site in China are an integral and necessary component of the project.
16/07/2010 12/08/2010
John Smith District Agronomist Lao Commence ACIAR project rain fed systems for Southern Lao and the first of 2 scheduled visits for 2010 -11.
16/07/2010 24/07/2010
John Lacy Industry Leader Lao Commence ACIAR project rain fed systems for Southern Lao and the first of 2 scheduled visits for 2010 -11.
16/07/2010 24/07/2010
Bruce Christie Principal Director Indonesia Undertake workshops addressing the application of risk and economic assessments in animal health policy development.
16/07/2010 26/07/2010
Sophie Parks Research Horticulturist Vietnam Join Vietnamese research team in evaluation of current experiments & planning of next phase of research.
17/07/2010 25/07/2010
Robert Hoogers District Irrigation Officer Solomon Islands
Second project visit for ACIAR to building up and strengthen the capacity of local partners and collaborating institutions in carrying out research and extension activities for smallholder gardens by conducting technical irrigation trial establishment.
20/07/2010 27/07/2010
Joop Van Leur Senior Plant Pathologist Syria Inspect and discuss collaborative projects in puolse virology at the International Centre for Agricultural Research in the dry areas of Syria.
26/07/2010 19/07/2010
Leigh Pilkington Research Scientist New Caledonia
Undertake informal surveillance for glassy-winged sharpshooter. 26/07/2010 30/07/2010
Shane Hetherington
Research Leader Vietnam To visit Vietnamese persimmon production regions when pests and disease are most likely to be present.
28/07/2010 6/08/2010
Roger Hegarty Principal Research Scientist
Germany & Netherlands
Presentation of an invited paper on livestock methane production and animal genetics to the world congress on genetics applied to livestock production.
31/07/2010 8/08/2010
Michelle Smith Project Officer Vietnam To co-deliver facilitation course in collaborative problem solving and to develop farmer business school resources.
1/08/2010 14/08/2010
David Hall Research Leader Philippines To organise and chair the mid-term review and planning meeting and visit associated research sites for the ACIAR funded vegetable project which is benefiting vegetable industries in NSW and the Philippines.
4/08/2010 17/08/2010
Robert Musgrave Research Scientist Brazil To attend the American Geophysical Union joint assembly 2010 ‘Meeting of the America’s’ and present two papers.
6/08/2010 16/08/2010
Simon Eldridge Soil Scientist Philippines To present research findings to the mid-term review and planning meeting and to meet Philippine collaborators and visit associated research sites for the ACURA funded vegetable projects which is of benefit to the vegetable industries in NSW and the Philippines.
7/08/2010 15/08/2010
Anthea McClintock
Research Economist Philippines Participate in mid-term review for ACIAR funded vegetable research projects, participate in a planning meeting for the C5 economics team.
7/08/2010 16/08/2010
Gavin Tinning Project Manager Indonesia Scheduled trip of ACIAR project to coincide with a range of programmed activities and workshops.
7/08/2010 18/08/2010
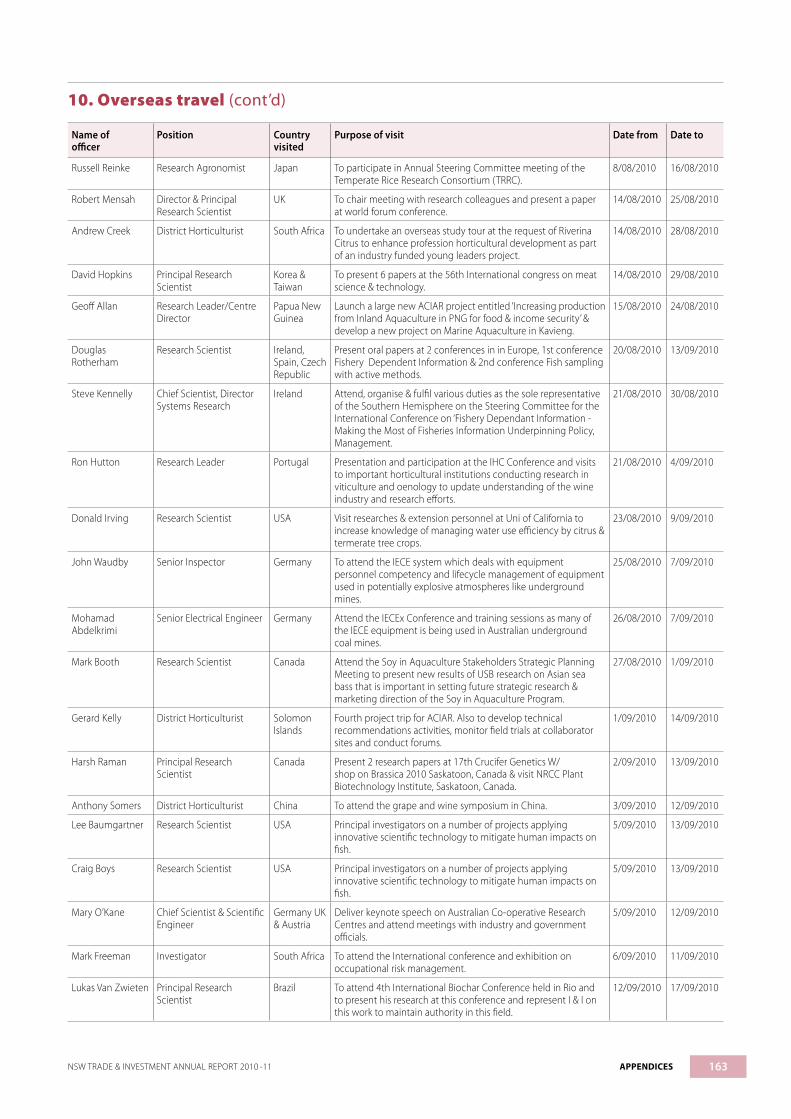
163NSW TRADE & INVESTMENT ANNUAL REPORT 2010 -11 APPENDICES
Name of officer
Position Country visited
Purpose of visit Date from Date to
Russell Reinke Research Agronomist Japan To participate in Annual Steering Committee meeting of the Temperate Rice Research Consortium (TRRC).
8/08/2010 16/08/2010
Robert Mensah Director & Principal Research Scientist
UK To chair meeting with research colleagues and present a paper at world forum conference.
14/08/2010 25/08/2010
Andrew Creek District Horticulturist South Africa To undertake an overseas study tour at the request of Riverina Citrus to enhance profession horticultural development as part of an industry funded young leaders project.
14/08/2010 28/08/2010
David Hopkins Principal Research Scientist
Korea & Taiwan
To present 6 papers at the 56th International congress on meat science & technology.
14/08/2010 29/08/2010
Geoff Allan Research Leader/Centre Director
Papua New Guinea
Launch a large new ACIAR project entitled ‘Increasing production from Inland Aquaculture in PNG for food & income security’ & develop a new project on Marine Aquaculture in Kavieng.
15/08/2010 24/08/2010
Douglas Rotherham
Research Scientist Ireland, Spain, Czech Republic
Present oral papers at 2 conferences in in Europe, 1st conference Fishery Dependent Information & 2nd conference Fish sampling with active methods.
20/08/2010 13/09/2010
Steve Kennelly Chief Scientist, Director Systems Research
Ireland Attend, organise & fulfil various duties as the sole representative of the Southern Hemisphere on the Steering Committee for the International Conference on ‘Fishery Dependant Information - Making the Most of Fisheries Information Underpinning Policy, Management.
21/08/2010 30/08/2010
Ron Hutton Research Leader Portugal Presentation and participation at the IHC Conference and visits to important horticultural institutions conducting research in viticulture and oenology to update understanding of the wine industry and research efforts.
21/08/2010 4/09/2010
Donald Irving Research Scientist USA Visit researches & extension personnel at Uni of California to increase knowledge of managing water use efficiency by citrus & termerate tree crops.
23/08/2010 9/09/2010
John Waudby Senior Inspector Germany To attend the IECE system which deals with equipment personnel competency and lifecycle management of equipment used in potentially explosive atmospheres like underground mines.
25/08/2010 7/09/2010
Mohamad Abdelkrimi
Senior Electrical Engineer Germany Attend the IECEx Conference and training sessions as many of the IECE equipment is being used in Australian underground coal mines.
26/08/2010 7/09/2010
Mark Booth Research Scientist Canada Attend the Soy in Aquaculture Stakeholders Strategic Planning Meeting to present new results of USB research on Asian sea bass that is important in setting future strategic research & marketing direction of the Soy in Aquaculture Program.
27/08/2010 1/09/2010
Gerard Kelly District Horticulturist Solomon Islands
Fourth project trip for ACIAR. Also to develop technical recommendations activities, monitor field trials at collaborator sites and conduct forums.
1/09/2010 14/09/2010
Harsh Raman Principal Research Scientist
Canada Present 2 research papers at 17th Crucifer Genetics W/shop on Brassica 2010 Saskatoon, Canada & visit NRCC Plant Biotechnology Institute, Saskatoon, Canada.
2/09/2010 13/09/2010
Anthony Somers District Horticulturist China To attend the grape and wine symposium in China. 3/09/2010 12/09/2010
Lee Baumgartner Research Scientist USA Principal investigators on a number of projects applying innovative scientific technology to mitigate human impacts on fish.
5/09/2010 13/09/2010
Craig Boys Research Scientist USA Principal investigators on a number of projects applying innovative scientific technology to mitigate human impacts on fish.
5/09/2010 13/09/2010
Mary O’Kane Chief Scientist & Scientific Engineer
Germany UK & Austria
Deliver keynote speech on Australian Co-operative Research Centres and attend meetings with industry and government officials.
5/09/2010 12/09/2010
Mark Freeman Investigator South Africa To attend the International conference and exhibition on occupational risk management.
6/09/2010 11/09/2010
Lukas Van Zwieten Principal Research Scientist
Brazil To attend 4th International Biochar Conference held in Rio and to present his research at this conference and represent I & I on this work to maintain authority in this field.
12/09/2010 17/09/2010
10. Overseas travel (cont’d)
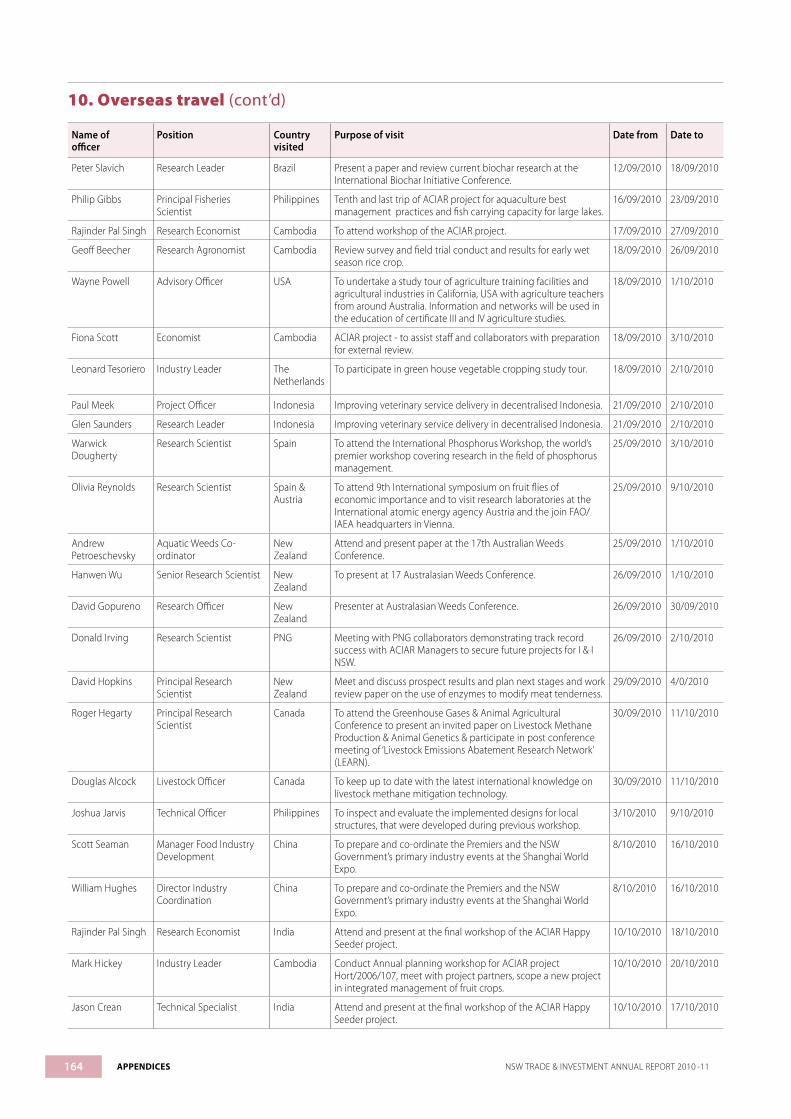
164 APPENDICES NSW TRADE & INVESTMENT ANNUAL REPORT 2010 -11
Name of officer
Position Country visited
Purpose of visit Date from Date to
Peter Slavich Research Leader Brazil Present a paper and review current biochar research at the International Biochar Initiative Conference.
12/09/2010 18/09/2010
Philip Gibbs Principal Fisheries Scientist
Philippines Tenth and last trip of ACIAR project for aquaculture best management practices and fish carrying capacity for large lakes.
16/09/2010 23/09/2010
Rajinder Pal Singh Research Economist Cambodia To attend workshop of the ACIAR project. 17/09/2010 27/09/2010
Geoff Beecher Research Agronomist Cambodia Review survey and field trial conduct and results for early wet season rice crop.
18/09/2010 26/09/2010
Wayne Powell Advisory Officer USA To undertake a study tour of agriculture training facilities and agricultural industries in California, USA with agriculture teachers from around Australia. Information and networks will be used in the education of certificate III and IV agriculture studies.
18/09/2010 1/10/2010
Fiona Scott Economist Cambodia ACIAR project - to assist staff and collaborators with preparation for external review.
18/09/2010 3/10/2010
Leonard Tesoriero Industry Leader The Netherlands
To participate in green house vegetable cropping study tour. 18/09/2010 2/10/2010
Paul Meek Project Officer Indonesia Improving veterinary service delivery in decentralised Indonesia. 21/09/2010 2/10/2010
Glen Saunders Research Leader Indonesia Improving veterinary service delivery in decentralised Indonesia. 21/09/2010 2/10/2010
Warwick Dougherty
Research Scientist Spain To attend the International Phosphorus Workshop, the world’s premier workshop covering research in the field of phosphorus management.
25/09/2010 3/10/2010
Olivia Reynolds Research Scientist Spain & Austria
To attend 9th International symposium on fruit flies of economic importance and to visit research laboratories at the International atomic energy agency Austria and the join FAO/IAEA headquarters in Vienna.
25/09/2010 9/10/2010
Andrew Petroeschevsky
Aquatic Weeds Co-ordinator
New Zealand
Attend and present paper at the 17th Australian Weeds Conference.
25/09/2010 1/10/2010
Hanwen Wu Senior Research Scientist New Zealand
To present at 17 Australasian Weeds Conference. 26/09/2010 1/10/2010
David Gopureno Research Officer New Zealand
Presenter at Australasian Weeds Conference. 26/09/2010 30/09/2010
Donald Irving Research Scientist PNG Meeting with PNG collaborators demonstrating track record success with ACIAR Managers to secure future projects for I & I NSW.
26/09/2010 2/10/2010
David Hopkins Principal Research Scientist
New Zealand
Meet and discuss prospect results and plan next stages and work review paper on the use of enzymes to modify meat tenderness.
29/09/2010 4/0/2010
Roger Hegarty Principal Research Scientist
Canada To attend the Greenhouse Gases & Animal Agricultural Conference to present an invited paper on Livestock Methane Production & Animal Genetics & participate in post conference meeting of ‘Livestock Emissions Abatement Research Network’ (LEARN).
30/09/2010 11/10/2010
Douglas Alcock Livestock Officer Canada To keep up to date with the latest international knowledge on livestock methane mitigation technology.
30/09/2010 11/10/2010
Joshua Jarvis Technical Officer Philippines To inspect and evaluate the implemented designs for local structures, that were developed during previous workshop.
3/10/2010 9/10/2010
Scott Seaman Manager Food Industry Development
China To prepare and co-ordinate the Premiers and the NSW Government’s primary industry events at the Shanghai World Expo.
8/10/2010 16/10/2010
William Hughes Director Industry Coordination
China To prepare and co-ordinate the Premiers and the NSW Government’s primary industry events at the Shanghai World Expo.
8/10/2010 16/10/2010
Rajinder Pal Singh Research Economist India Attend and present at the final workshop of the ACIAR Happy Seeder project.
10/10/2010 18/10/2010
Mark Hickey Industry Leader Cambodia Conduct Annual planning workshop for ACIAR project Hort/2006/107, meet with project partners, scope a new project in integrated management of fruit crops.
10/10/2010 20/10/2010
Jason Crean Technical Specialist India Attend and present at the final workshop of the ACIAR Happy Seeder project.
10/10/2010 17/10/2010
10. Overseas travel (cont’d)

165NSW TRADE & INVESTMENT ANNUAL REPORT 2010 -11 APPENDICES
Name of officer
Position Country visited
Purpose of visit Date from Date to
Nick Milham Director, Socio-Economic Evaluation
India Attend and present at the final workshop of the ACIAR Happy Seeder project.
10/10/2010 17/10/2010
George Davey Deputy Director General China To accompany Minister on his official visit to China. 10/10/2010 21/10/2010
John Smith District Agronomist LAO PDR Continuation of consultancy on adoption of direct rice seeding in LAOS.
11/10/2010 23/10/2010
Mary O’Kane NSW Chief Scientist USA Meet with senior officials from the Australian Embassy US Government departments and multilateral organisations including the World Bank.
12/10/2010 23/10/2010
Rodney Reece Senior Veterinary Research Officer
New Zealand
Departmental participation of the 7th annual meeting of the Asia-Oceania Geosciences Society.
13/10/2010 15/10/2010
Anne Mooney Extension Horticulturist South Africa Attend International Prune Assoc Congress and investigate production practices in the SA prune, cherry and pome fruit industries.
18/10/2010 2/11/2010
Geoff Allan Research Leader Malaysia, Vietnam and China
Present Invited keynote presentation on ‘Sustainable Aquaculture Feeds’ Conference, meet with Vice-Minister in Hanoi and present at conferences in Beijing China.
18/10/2010 30/10/2010
Fabiano Ximenes A/Program Leader Switzerland Attend IPCC(Intergovernmental Panel on Climate Change) meeting as an invited expert on harvested wood products.
18/10/2010 23/10/2010
Mary O’Kane Chief Scientist & Scientific Engineer
USA To meet with senior officials from the Australian embassy, US Government Departments and multilateral organisations, including the World Bank.
19/10/2010 22/10/2010
Wayne O’Connor Senior Research Officer Vietnam ACIAR program review. 20/10/2010 24/10/2010
Richard Sheldrake Director General Mumbai & USE
Overseas Trades Mission. 28/10/2010 4/11/2010
Sally Ware Livestock Officer South Africa Visit dorper breeding regions of Sth Africa to obtain evidence on the rangeland management and grazing habits of this breed.
29/10/2010 14/11/2010
Peter Slavich Research Leader Vietnam & Indonesia
Review progress on project activities. 30/10/2010 14/11/2010
Gavin Tinning Project Manager Indonesia Review of ACIAR project. 30/10/2010 12/11/2010
Rebecca Lines-Kelly
Communications Specialist
Indonesia Review of ACIAR project. 30/10/2010 12/11/2010
Malem McLeod Hydrologist Indonesia Review of ACIAR project. 30/10/2010 12/11/2010
Mary O’Kane NSW Chief Scientist USA Representing the Minister for Science & Medical Research as part of a study tour relating to the establishment of the Centre of Excellence on Integrative Medicine.
31/10/2010 2/11/2010
Suzie Newman Research Horticulturist Vietnam, Cambodia, PNG
Complete contractual obligations for ACIAR. 1/11/2010 28/02/2012
David Michalk Senior Principal Research Scientist
China ACIAR program review. 1/11/2010 21/11/2010
George Davey Deputy Director General Hong Kong Lead NSW government’s wine promotion trade mission to Hong Kong. To attend 2010 International Dairy Platform and to Chair the Marketing Conference at the IDF Summit in NZ.
3/11/2010 11/11/2010
Tim Burfitt Manager Intensive Livestock
New Zealand
To attend the International Dairy Federation World Dairy Summit in Auckland New Zealand with members of the NSW Dairy Industry Conference.
6/11/2010 12/11/2010
Rachelle Ward Professional Officer Vietnam To attend and present 3rd International Rice congress and participate in the 2nd International Network for Quality Rice Symposium.
6/11/2010 14/11/2010
Margrit Martin Technical Officer Vietnam Attend and present 3rd International Rice congress and participate in the 2nd International Network for Quality Rice Symposium.
6/11/2010 14/11/2010
William Hughes Director Industry Coordination
China Join with other States and Geoscience Australia in a coordinated promotion of mineral exploration and development opportunities in NSW and Australia.
10/11/2010 18/11/2010
Brad Mullard Executive Director, Mineral Resources
China Join with other States and Geoscience Australia in a coordinated promotion of mineral exploration and development opportunities in NSW and Australia.
10/11/2010 18/11/2010
10. Overseas travel (cont’d)

166 APPENDICES NSW TRADE & INVESTMENT ANNUAL REPORT 2010 -11
Name of officer
Position Country visited
Purpose of visit Date from Date to
Mark Norton Research Scientist New Zealand
To participate in the 15th Australian Society of Agronomy Conference.
11/11/2010 20/11/2010
Guangdi Li Research Scientist New Zealand
To participate in the 15th Australian Society of Agronomy Conference.
11/11/2010 20/11/2010
Richard Hayes Research Agronomist New Zealand
To participate in the 15th Australian Society of Agronomy Conference.
11/11/2010 20/11/2010
Simon Spiers Project Leader New Zealand
To participate in the 15th Australian Society of Agronomy Conference.
11/11/2010 20/11/2010
Matt Newell Technical Officer New Zealand
To participate in the 15th Australian Society of Agronomy Conference.
11/11/2010 20/11/2010
Deb Slinger Manager New Zealand
To participate in the 15th Australian Society of Agronomy Conference.
11/11/2010 20/11/2010
Graeme Sanderson
Research Horticulturist Bhutan Official ACIAR project review and sixth scheduled visit. 19/11/2010 5/12/2010
Sandra Hardy Industry Leader Bhutan Official ACIAR project review and sixth scheduled visit. 19/11/2010 5/12/2010
Myles Parker District Agronomist Eritrea To Implement an extension strategy. This will be done on behalf of the Australian Government’s Department of Agriculture, Fisheries and Forestry who have funded the Forage Options Project since 2005.
27/11/2010 12/12/2010
Paul Williams Maintenance Supervisor France To commission a new continuous flow heat treatment plant that will treat contaminated liquid wastes.
3/12/2010 13/12/2011
Peter Smith Irrigation Officer Brazil Invited speaker at the Irrigated Agriculture In Brazil - Challengers and Opportunities and particupate in a field day launch.
7/12/2010 14/12/2010
Tahir Khurshid Research Horticulturist Pakistan To participate in project meeting and discuss work plan for new project starting in 2011.
4/01/2011 16/01/2011
Fiona Scott Economist Cambodia Reporting, planning for final project. 12/01/2011 29/01/2011
Kevin Ruming Mgr Coal Advice India To present at the 6th International Global Steel Conference 2011. 14/01/2011 19/01/2011
Michelle Smith Project Officer Vietnam To conduct meeting with partner institutions and to format the training program for March 2011.
15/01/2011 26/01/2011
Wayne O’Connor Senior Research Scientist India To attend World Aquaculture Society Conference. 16/01/2011 21/01/2010
Jennifer Wood Chemist Brussels Invited to be included on the reserve list of expert evaluators of funding applications for REA in connection with 7th Framework Programme and an opportunity to meet International scientists working in pulses, food science and foster networking.
7/02/2011 15/02/2010
Matthew Crane A/Director Animal Welfare New Zealand
Attend meeting of Animal Welfare Committee under the umbrella of the Primary Industries Ministerial Council.
9/02/2011 13/2/2011
Scott Davenport Chief Economist India Attend scheduled meeting major end of project International workshop in Delhi. ACIAR arranged for a series of project workshops.
12/02/2011 21/02/2011
Geoff Allan Research Leader New Caledonia
Invited by ACIAR to Chair the Asia-Pacific Tropical Sea Cucumber Aquaculture Symposium.
14/02/2011 18/02/2011
Russell Reinke Research Agronomist Vietnam To participate in ACIAR project to address problems associated with salinity. To minimise greenhouse gas emissions.
19/02/2011 25/02/2011
Brad Keen Technical Officer Vietnam Participate in annual assessment and planning workshops held for all projects in ACIAR’S program.
19/02/2011 2/03/2011
Grant Chambers Technical Officer Indonesia Attend Crawford Fund Master class on surveillance, identification and management of the citrus disease huanglongbing.
20/02/2011 5/03/2011
Alison Seyb Diagnostic Pathologist Indonesia Attend Crawford Master class on surveillance, identification and management of the citrus disease huanglongbing.
20/02/2011 5/03/2011
Mark Hickey Industry Leader Cambodia ACIAR project strengthening adoption of improved production and postharvest practices. Meet with project partners and review information resource development and review insect collection progress.
20/02/2011 3/03/2011
Sandra McDougall Industry Leader Cambodia ACIAR project strengthening adoption of improved production and postharvest practices.
20/02/2011 3/03/2011
10. Overseas travel (cont’d)
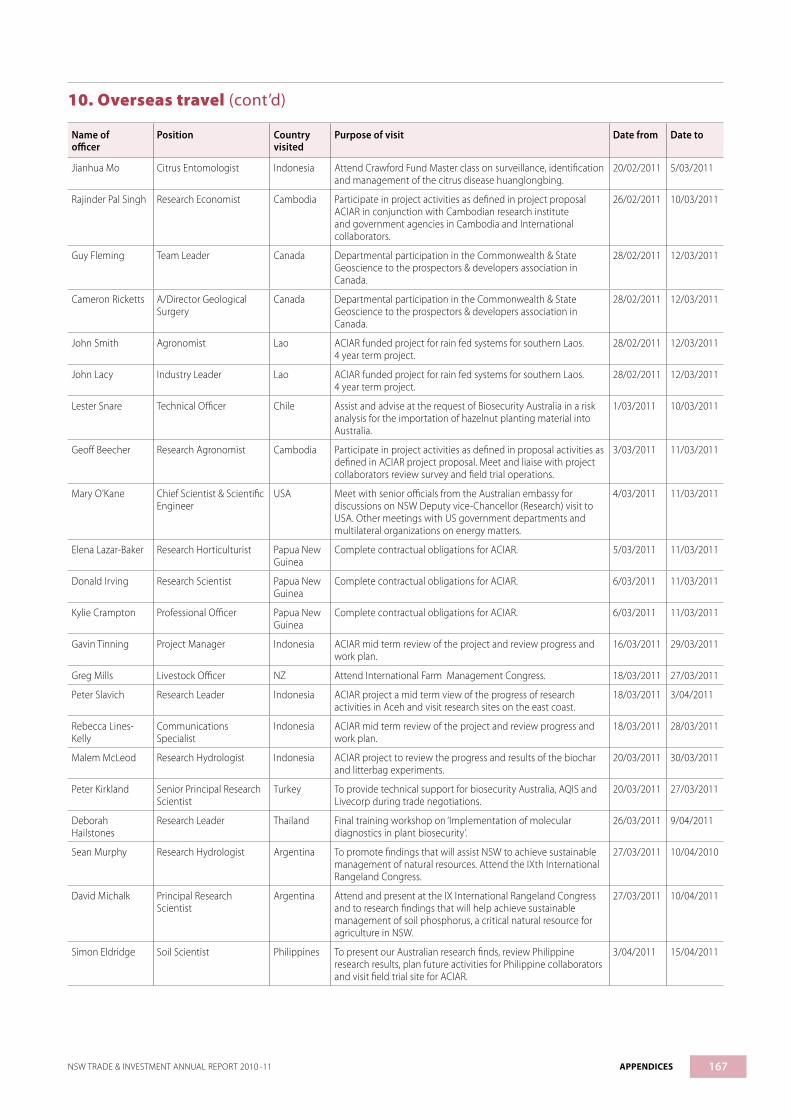
167NSW TRADE & INVESTMENT ANNUAL REPORT 2010 -11 APPENDICES
Name of officer
Position Country visited
Purpose of visit Date from Date to
Jianhua Mo Citrus Entomologist Indonesia Attend Crawford Fund Master class on surveillance, identification and management of the citrus disease huanglongbing.
20/02/2011 5/03/2011
Rajinder Pal Singh Research Economist Cambodia Participate in project activities as defined in project proposal ACIAR in conjunction with Cambodian research institute and government agencies in Cambodia and International collaborators.
26/02/2011 10/03/2011
Guy Fleming Team Leader Canada Departmental participation in the Commonwealth & State Geoscience to the prospectors & developers association in Canada.
28/02/2011 12/03/2011
Cameron Ricketts A/Director Geological Surgery
Canada Departmental participation in the Commonwealth & State Geoscience to the prospectors & developers association in Canada.
28/02/2011 12/03/2011
John Smith Agronomist Lao ACIAR funded project for rain fed systems for southern Laos. 4 year term project.
28/02/2011 12/03/2011
John Lacy Industry Leader Lao ACIAR funded project for rain fed systems for southern Laos. 4 year term project.
28/02/2011 12/03/2011
Lester Snare Technical Officer Chile Assist and advise at the request of Biosecurity Australia in a risk analysis for the importation of hazelnut planting material into Australia.
1/03/2011 10/03/2011
Geoff Beecher Research Agronomist Cambodia Participate in project activities as defined in proposal activities as defined in ACIAR project proposal. Meet and liaise with project collaborators review survey and field trial operations.
3/03/2011 11/03/2011
Mary O’Kane Chief Scientist & Scientific Engineer
USA Meet with senior officials from the Australian embassy for discussions on NSW Deputy vice-Chancellor (Research) visit to USA. Other meetings with US government departments and multilateral organizations on energy matters.
4/03/2011 11/03/2011
Elena Lazar-Baker Research Horticulturist Papua New Guinea
Complete contractual obligations for ACIAR. 5/03/2011 11/03/2011
Donald Irving Research Scientist Papua New Guinea
Complete contractual obligations for ACIAR. 6/03/2011 11/03/2011
Kylie Crampton Professional Officer Papua New Guinea
Complete contractual obligations for ACIAR. 6/03/2011 11/03/2011
Gavin Tinning Project Manager Indonesia ACIAR mid term review of the project and review progress and work plan.
16/03/2011 29/03/2011
Greg Mills Livestock Officer NZ Attend International Farm Management Congress. 18/03/2011 27/03/2011
Peter Slavich Research Leader Indonesia ACIAR project a mid term view of the progress of research activities in Aceh and visit research sites on the east coast.
18/03/2011 3/04/2011
Rebecca Lines-Kelly
Communications Specialist
Indonesia ACIAR mid term review of the project and review progress and work plan.
18/03/2011 28/03/2011
Malem McLeod Research Hydrologist Indonesia ACIAR project to review the progress and results of the biochar and litterbag experiments.
20/03/2011 30/03/2011
Peter Kirkland Senior Principal Research Scientist
Turkey To provide technical support for biosecurity Australia, AQIS and Livecorp during trade negotiations.
20/03/2011 27/03/2011
Deborah Hailstones
Research Leader Thailand Final training workshop on ‘Implementation of molecular diagnostics in plant biosecurity’.
26/03/2011 9/04/2011
Sean Murphy Research Hydrologist Argentina To promote findings that will assist NSW to achieve sustainable management of natural resources. Attend the IXth International Rangeland Congress.
27/03/2011 10/04/2010
David Michalk Principal Research Scientist
Argentina Attend and present at the IX International Rangeland Congress and to research findings that will help achieve sustainable management of soil phosphorus, a critical natural resource for agriculture in NSW.
27/03/2011 10/04/2011
Simon Eldridge Soil Scientist Philippines To present our Australian research finds, review Philippine research results, plan future activities for Philippine collaborators and visit field trial site for ACIAR.
3/04/2011 15/04/2011
10. Overseas travel (cont’d)

168 APPENDICES NSW TRADE & INVESTMENT ANNUAL REPORT 2010 -11
Name of officer
Position Country visited
Purpose of visit Date from Date to
Anthea McClintock
Research Economist Philippines ACIAR funded trip to meet contractual obligations to help inform economic analysis of disease management to improve greenhouse vegetable production systems in NSW.
4/04/2011 12/04/2011
Mary O’Kane Chief Scientist & Scientific Engineer
Abu Dhabi Attend second Clean Energy Ministerial (CEM2) in delegation supporting Federal Minister for Resources and Energy. Speak at public forum on role of women in t he clean energy revolution.
5/04/2011 8/04/2011
Steve Kennelly Chief Scientist, Director Systems Research
USA Invitation to speak at a session on ‘Finding Common Ground in Fisheries Management’ to be held in association with the 31st annual symposium on sea turtle biology and conservation.
9/04/2011 18/04/2011
Gerard Kelly District Horticulturist Solomon Islands
ACIAR project to improve socio-economic conditions and vegetable farming practices of smallholder gardeners and strengthen the research capacity of local project partners in the Solomon Islands.
20/04/2011 9/05/2011
Robert Herd Principal Research Scientist
China Accept invitation to co-chair and to present a lecture to the 4th World Congress on Industrial Biotechnology.
23/04/2011 12/05/2011
Paul Milham Chemist New Zealand
Conduct an assessment of the proficiency of a laboratory on behalf of international accreditation NZ.
25/04/2011 30/04/2011
Adrian Nicholas Snr Research Entomologist
USA Undertake diagnostic training for Russian wheat aphid. To produce a national diagnostic protocol for Russian wheat aphid.
29/04/2011 15/05/2011
Ian Percival Principal Research Scientist
Spain To attend 11th International Symposium on the Ordovician system, presenting two papers, chairing sessions and participating in associated field excursions.
1/05/2011 18/05/2011
Geoff Beecher Research Agronomist Cambodia ACIAR project to access progress and confirm requirements for replicated field experiments.
2/05/2011 7/05/2011
Mark Hickey Industry Leader Solomon Islands
ACIAR project for integrated crop management package for sustainable smallholder gardens in the Solomon Islands.
2/05/2011 6/05/2011
Jarrod McPherson Fisheries Technician Lao PDR ACIAR project started in 2008 and to continue until October 2011.
3/05/2011 4/05/2012
Dorothy Robinson Senior Research Scientist New Zealand
Attend International meeting to foster collaboration of scientist working on research to reduce methane emissions as well as discussing data collection protocols and arrangements to share data.
15/05/2011 19/05/2011
Melinda Gabor Veterinary Pathologist USA Study Program followed by examination for certification as a qualified specialist veterinary pathologist.
20/05/2011 29/05/2011
Peter Sunol Senior Inspector Mechanical Engineering
Italy Attend the IEC Technical Committee No. 31 - Equipment for Explosive Atmospheres Subcommittee 31M: Non-electrical Equipment and Protective Systems for Explosive Atmospheres.
20/05/2011 30/05/2011
Geoff Allan Research Leader USA To deliver an invited paper at Alltechs 27th International Animal Health & Nutrition Industry Symposium.
21/05/2011 29/05/2011
Mary O’Kane Chief Scientist & Scientific Engineer
USA As part of the drive to increase international competitive research grant funding to NSW and lead a delegation to meet major USA funding agencies.
30/05/2011 5/06/2011
Myles Parker Manager IDBC Eritrea Second stage of the forage options project. This will be done on behalf of the DAFF who have funded the forage options project since 2005.
3/06/2011 14/06/2011
Hash Ramon Principal Research Scientist
Czech Republic
Attend and present papers at the 13th International Rapeseed Congress 2011. Develop new collaborative research links with researchers leading canola genetics research.
3/06/2011 12/06/2011
Anthony Tyler Senior Analytical Chemist China To attend the 10th FAO/WHO meeting on pesticide specifications and 55th CIPAC meeting as an invited expert on pesticide evaluation programs.
6/06/2011 18/06/2011
Charles Gray Research Leader Japan Attend and give an oral presentation at the 1st International Conference on Fish telemetry in Sapporo, Japan and secure a bid for NSW hosting the 2nd International Conference in 2013.
10/06/2011 19/06/2011
Gavin Butler Research Scientist Japan Attend and give oral presentation at the 1st International Conference on fish telemetry in Sapporo.
10/06/2011 19/06/2011
10. Overseas travel (cont’d)

169NSW TRADE & INVESTMENT ANNUAL REPORT 2010 -11 APPENDICES
Name of officer
Position Country visited
Purpose of visit Date from Date to
Suzanne Robinson Manager General Emergencies
New Zealand
Participate in DTIRIS sponsored & Dept of Premiers & Cabinet funded Executive Master of Public administration compulsory week-long residential in NZ for core subject designing public policies.
12/06/2011 17/06/2011
Steven Montgomery
Principal Research Scientist
Norway Present the opening lecture and attend the 9th International Workshop on Lobster Biology & Management Conference.
16/06/2011 28/06/2011
Geoff Liggins Supervising Scientist Norway Present a conference paper at the 9th International Workshop on Lobster Biology and Management conference.
17/06/2011 26/06/2011
Wayne O’Connor Principal Research Scientist
Vietnam ACIAR program review. 20/06/2011 24/06/2011
Lee Baumgartner Research Scientist Lao ACIAR project - annual visit to assist with field experiments to develop design criteria for fish passes in Lao and Australia.
21/06/2011 1/07/2011
Brad Law Principal Research Scientist
USA Presentation of research on eastern pygmy possums and logging at a joint conference of the Australian and American Mammal Society.
22/06/2011 1/07/2011
Andrew Jessup Research Horticulturist USA Assist biosecurity officers as a technical expert in meetings on research technologies required for market access of fresh Australian horticultural produce to the USA.
28/06/2011 3/07/2011
Industry, Innovation & Investment Division
Name of officer Title Country visited
Purpose Date from Date to
Cheryl Nicholas A/Manager China Shanghai World Expo. 8/7/2010 16/7/2010
Paul De Carvalho Director, Production Attraction
China Chinese Animation Market. 10/7/2010 10/7/2010
Peter Leihn Director, Office of NSW Chief Scientist & Engineer
China Co-ordinate and attend NSW Scientific Research Showcase event at Shanghai World Expo.
11/7/2010 14/7/2010
Professor Mary O’Kane
NSW Chief Scientist & Engineer
China Chair NSW Scientific Research Showcase event at Shanghai World Expo.
11/7/2010 14/7/2010
Barry Buffier Deputy Director General China Attend Shanghai Expo with Premier & trade meetings in Beijing & Guangzhou.
11/7/2010 17/7/2010
Christopher Gough
Director, Visit Sydney China Represent Tourism NSW at Tourism NSW hosted event in Shanghai to promote holiday, education and business travel to 70 senior China Travel Trade representatives.
13/7/2010 16/7/2010
Kylie Hargreaves Executive Director USA G’Day USA 2011 Steering Committee Meeting. 19/7/2010 23/7/2010
Barry Buffier Deputy Director General Japan/China/Hong Kong/India/UAE
Attend Business & Trade meetings with Treasurer, Eric Roozendaal and Chief of Staff, Patrick Muhlen-Schulte and attend Shanghai Expo.
7/8/2010 19/7/2010
Sue McCreadie Senior Manager USA To market Film Fund to major studios and production companies in Los Angeles.
7/8/2010 15/8/2010
Paul De Carvalho Director, Production Attraction
USA Meet with studios and producers in Los Angeles with Sue McCreadie to attract productions to NSW.
7/8/2010 14/8/2010
Susan Saretzki Senior Manager China Takeover arrangements at Guangzhou Office. 22/8/2010 28/8/2010
Kyoto Kanehira Regional Manager, Japan Australia Attend Japan Australia Mission (JAM) Downunder on the Gold Coast and familiarisation tour.
5/9/2010 12/9/2010
Ashley Luke Director, Creative Partnerships
Canada & USA
Toronto International Film Festival and Market and No Border Finance Market in New York.
7/9/2010 23/9/2010
Megan Simpson Huberman
Director, Creative & Enterprise Development
Canada & USA
Toronto International Film Festival and Market. 7/9/2010 23/9/2010
Tim Dixon Manager UK G’Day UK. 8/9/2010 18/9/2010
Irene Morgan Regional Manager, North America
Australia Corroboree Workshop on Hamilton Island & familiarisation tour. 8/9/2010 18/9/2010
Justine Cooper Director, Marketing & Communications
UK Australive Live Event and meetings with key industry partners. 11/9/2010 19/9/2010
10. Overseas travel (cont’d)

170 APPENDICES NSW TRADE & INVESTMENT ANNUAL REPORT 2010 -11
Name of officer Title Country visited
Purpose Date from Date to
Susan Saretzki Senior Manager China Provide Induction to the new T&I Officer at the NSW Guangzhou Office and to represent NSW at the China International Small and Medium Enterprises Fair (CISMEF) in Guangzhou.
12/9/2010 18/9/2010
Christopher Gough
Director, Visit Sydney Canada Attend 16th World Route Development Forum in Vancouver. 18/9/2010 21/9/2010
Tony Zhang Director, Shanghai Office Australia Assist with visiting delegations and meeting with NSW investment projects.
18/9/2010 3/10/2010
Sue McCreadie Senior Manager Singapore SPIKES ASIA. 18/9/2010 22/9/2010
Bozanan Vukovic Project Officer Singapore SPIKES ASIA. 18/9/2010 22/9/2010
Nerida Moore Development Executive France MIPCOM 2010. 29/9/2010 11/10/2010
Tania Chambers Chief Executive France MIPCOM 2010. 29/9/2010 11/10/2010
Michael O’Sullivan Director India and UAE
Undertake an investment attraction mission to India. 5/10/2010 16/10/2010
Sue McCreadie Senior Manager France Attend MIPCOM and promote Digital Sydney. 2/10/2010 9/10/2010
Sue McCreadie Senior Manager USA Ausfilm Week Los Angeles & promotion of Film Fund. 23/10/2010 1/11/2010
Paul De Carvalho Director, Production Attraction
USA Ausfilm Week in Los Angeles. 23/10/2010 1/11/2010
Richard Sheldrake Director General UAE/India Trade and Investment Meetings to UAE & India and visit NSW Government Officer in Abu Dhabi and Mumbai.
27/10/2010 5/11/2010
Professor Mary O’Kane
NSW Chief Scientist & Engineer
China Represent Minister for Science at Symposium & Technology on Traditional Chinese Medicine Study in Beijing.
31/10/2010 2/11/2010
Suzanne Pierce A/Associate Director, Science
China NSW China Study Tour. 31/10/2010 4/11/2010
Matinde Chacha Project Officer Hong Kong Manage NSW stand at Hong Kong International Wine & Spirits Fair 2010.
2/11/2010 7/11/2010
Wayne Murphy Export Adviser Hong Kong Manage NSW stand at Hong Kong International Wine & Spirits Fair 2010.
2/11/2010 7/11/2010
Crista Bracamonte Senior Policy Officer, Biotechnology
Germany BIO Europe Munich & Medica 2010 Dusseldorf. 13/11/2010 23/11/2010
Nicole Smith A/Manager Brazil Manage AISES led sporting events business mission. 20/11/2010 28/11/2010
Lyndel Gray Executive Director and General Manager, Tourism NSW
India Participation in the Tourism Australia (TA) CEO’s delegation to India.
20/11/2010 26/11/2010
Roslyn Mitchelson Export Adviser USA Manage NSW stand at Performance Racing & Industry Show 2010 in Orlando.
6/12/2010 13/12/2010
Tania Chambers Chief Executive Singapore Asian Television Awards and Advisory Board Meeting. 7/12/2010 9/12/2010
Michael O’Sullivan Director Hong Kong & China
Represent NSW at the Food & Wine Festival with Bright Food in Shanghai, Trade & Investment meetings in Hong Kong, Guangzhou & Shanghai and interviews with candidates for the Director position in Guangzhou.
12/12/2010 17/12/2010
Barry Buffier Deputy Director General USA Travel with the Minister and meeting with current and potential NSW investors.
14/12/2010 24/12/2010
Justine Cooper Director, Marketing & Communications
USA G’Day USA and meetings with key industry partners. 12/1/2011 25/1/2011
Kylie Hargreaves Executive Director USA G’Day USA to support and manage NSW mission and representation on Anchor Events in Los Angeles, San Francisco, Bostons, New York.
16/1/2011 31/1/2011
Barry Buffier Deputy Director General USA Attend G’Day USA. 18/1/2011 22/1/2011
Gary Offner Director Japan & UK To manage NSW participation at Nanotech 2011 and undertake program of business meetings and discussions with allies about NSW operations in Japan & UK.
9/2/2011 25/2/2011
Tony Zhang Director, Shanghai Office Australia To talk to Industry leaders and growers about market opportunities in China.
20/2/2011 2/3/2011
10. Overseas travel (cont’d)
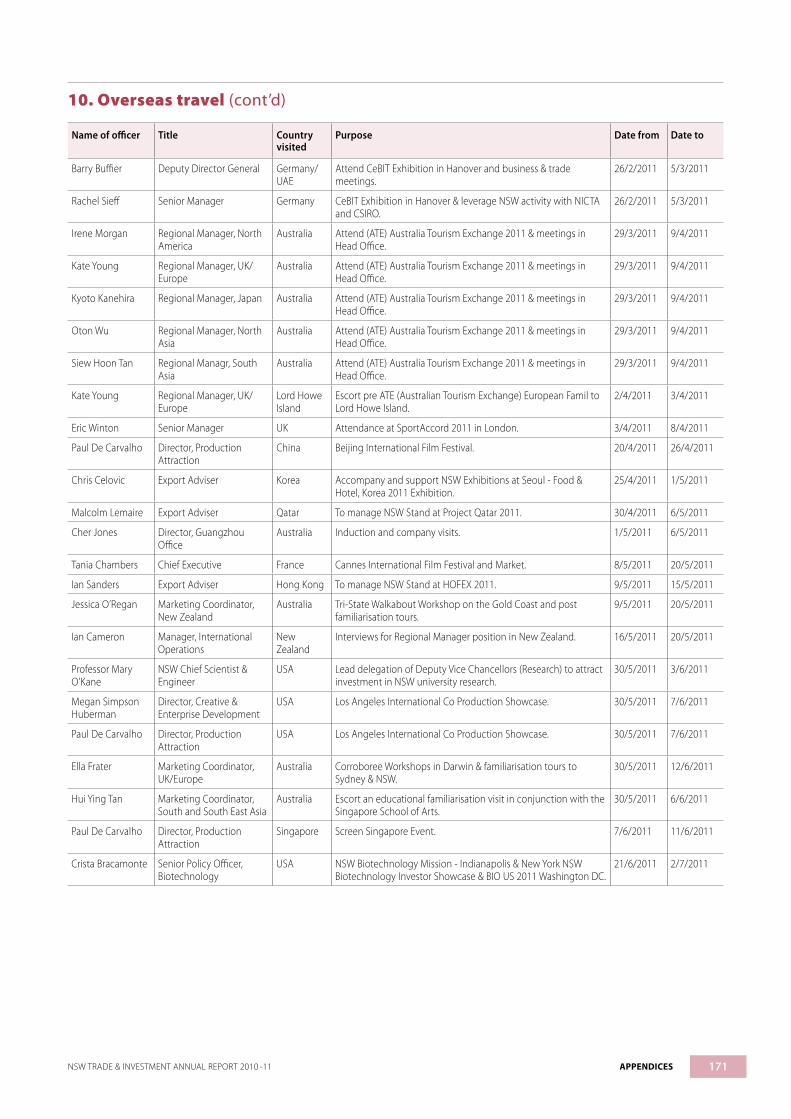
171NSW TRADE & INVESTMENT ANNUAL REPORT 2010 -11 APPENDICES
Name of officer Title Country visited
Purpose Date from Date to
Barry Buffier Deputy Director General Germany/UAE
Attend CeBIT Exhibition in Hanover and business & trade meetings.
26/2/2011 5/3/2011
Rachel Sieff Senior Manager Germany CeBIT Exhibition in Hanover & leverage NSW activity with NICTA and CSIRO.
26/2/2011 5/3/2011
Irene Morgan Regional Manager, North America
Australia Attend (ATE) Australia Tourism Exchange 2011 & meetings in Head Office.
29/3/2011 9/4/2011
Kate Young Regional Manager, UK/Europe
Australia Attend (ATE) Australia Tourism Exchange 2011 & meetings in Head Office.
29/3/2011 9/4/2011
Kyoto Kanehira Regional Manager, Japan Australia Attend (ATE) Australia Tourism Exchange 2011 & meetings in Head Office.
29/3/2011 9/4/2011
Oton Wu Regional Manager, North Asia
Australia Attend (ATE) Australia Tourism Exchange 2011 & meetings in Head Office.
29/3/2011 9/4/2011
Siew Hoon Tan Regional Managr, South Asia
Australia Attend (ATE) Australia Tourism Exchange 2011 & meetings in Head Office.
29/3/2011 9/4/2011
Kate Young Regional Manager, UK/Europe
Lord Howe Island
Escort pre ATE (Australian Tourism Exchange) European Famil to Lord Howe Island.
2/4/2011 3/4/2011
Eric Winton Senior Manager UK Attendance at SportAccord 2011 in London. 3/4/2011 8/4/2011
Paul De Carvalho Director, Production Attraction
China Beijing International Film Festival. 20/4/2011 26/4/2011
Chris Celovic Export Adviser Korea Accompany and support NSW Exhibitions at Seoul - Food & Hotel, Korea 2011 Exhibition.
25/4/2011 1/5/2011
Malcolm Lemaire Export Adviser Qatar To manage NSW Stand at Project Qatar 2011. 30/4/2011 6/5/2011
Cher Jones Director, Guangzhou Office
Australia Induction and company visits. 1/5/2011 6/5/2011
Tania Chambers Chief Executive France Cannes International Film Festival and Market. 8/5/2011 20/5/2011
Ian Sanders Export Adviser Hong Kong To manage NSW Stand at HOFEX 2011. 9/5/2011 15/5/2011
Jessica O’Regan Marketing Coordinator, New Zealand
Australia Tri-State Walkabout Workshop on the Gold Coast and post familiarisation tours.
9/5/2011 20/5/2011
Ian Cameron Manager, International Operations
New Zealand
Interviews for Regional Manager position in New Zealand. 16/5/2011 20/5/2011
Professor Mary O’Kane
NSW Chief Scientist & Engineer
USA Lead delegation of Deputy Vice Chancellors (Research) to attract investment in NSW university research.
30/5/2011 3/6/2011
Megan Simpson Huberman
Director, Creative & Enterprise Development
USA Los Angeles International Co Production Showcase. 30/5/2011 7/6/2011
Paul De Carvalho Director, Production Attraction
USA Los Angeles International Co Production Showcase. 30/5/2011 7/6/2011
Ella Frater Marketing Coordinator, UK/Europe
Australia Corroboree Workshops in Darwin & familiarisation tours to Sydney & NSW.
30/5/2011 12/6/2011
Hui Ying Tan Marketing Coordinator, South and South East Asia
Australia Escort an educational familiarisation visit in conjunction with the Singapore School of Arts.
30/5/2011 6/6/2011
Paul De Carvalho Director, Production Attraction
Singapore Screen Singapore Event. 7/6/2011 11/6/2011
Crista Bracamonte Senior Policy Officer, Biotechnology
USA NSW Biotechnology Mission - Indianapolis & New York NSW Biotechnology Investor Showcase & BIO US 2011 Washington DC.
21/6/2011 2/7/2011
10. Overseas travel (cont’d)

172 APPENDICES NSW TRADE & INVESTMENT ANNUAL REPORT 2010 -11
Crown Lands Division
Name of Officer Position Country Visited
Purpose of Visit Date from
Date to
Stephen Fenn Manager Cemetery Policy
New Zealand
Completion of Executive Masters of Public Administration (ANZSOG EMPA Program).
4/07/2010 9/07/2010
Susan Tracey Senior Project Officer
New Zealand
Completion of Executive Masters of Public Administration (ANZSOG EMPA Program).
30/11/2010 4/12/2010
NSW Office of Water
Name of Officer Position Country Visited
Purpose of Visit Date from
Date to
Dr Simon Mitrovic Senior Research Scientist
Capetown South Africa
Give oral presentation to the International Society for Limnology conference.
16/8/2010 20/8/2010
Dr Simon Mitrovic Senior Research Scientist
Istanbul Turkey
Present a poster paper at the International Cyanobacteria and Toxins Conference.
29/8/2010 3/9/2010
Dr Simon Mitrovic and Mr Doug Westhorpe
Senior Research ScientistAquatic Ecologist
San Juan, Peurto Rico
To attend, co chair a session (Dr Mitrovic only), and to give presentations to the American Society for Limnology and Oceanography conference.
13/2/2011 18/2/2011
11. Credit Card Certification
Credit card use in NSW Trade & Investment has been in accordance with the Premier’s Memoranda and Treasurer’s Directions.
Mark I Paterson AO
Director General
10. Overseas travel (cont’d)

12. Consultants
NSW Trade & Investment The following tables contain information for the combined NSW Trade & Investment.
Consultants equal to or more than $50 000
Consultant Cost $ Title/Nature
AECOM 249 923 Study into the feasibility of a second motor racing circuit or other significant infrastructure project at Mount Panorama, Bathurst NSW.
Price Waterhouse Coopers 144 858 Accounting Treatment of Crown Reserves and Review of fees and charges.
Ellis Partners 70 400 Boyds Bay Development Project.
Independent Pricing & Regulatory Tribunal
77 000 Review of the method of rent determination for domestic tenancies in NSW.
Lantz Marshall 62 040 Options Paper and Preliminary site analysis - Gladesville Reserve/Former Henley Bowling Club re-development.
City Plan Services Pty Ltd 59 565 Forster Tuncurry Harbour master planning.
Stratos Consulting Pty Ltd 90 000 Regional Marine Infrastructure Risk Reduction/Industry Support business case.
Sweet Reason Pty Ltd 154 300 Audit of infrastructure-Planning Sydney’s Cultural Facilities.
GHD Pty Ltd 47 000* WCMA River Styles.
IRP Environmental Consultants Pty Ltd
32 500* Bureau of Meteorology BOM SWIC Project.
Environmental Evidence Australia
68 723 Setting of Ecological Objectives in Water.
Ernst & Young 27 455* Preparation of Maintenance of Effort Capital Bid for Water Sharing Plan Science and Evaluation.
The University Of New England
19 864* Providing an Overview of Assemblage Structure Patterns for Seasons 1 To 4.
Parsons Brinckerhoff Australia Pty Ltd
29 900* Project 2114743a Final Report ‘Groundwater Quality Analysis-Lower Gwydir Alluvium’.
APP Corporation Pty Ltd 95 423 Strategic Assistance in the Preparation of the Sustaining The Basin Project Business Cases.
David Christopher Malone 64 680 Consultancy for BOM SWIC Project.
Total 1 293 631
* 2010-11 payment of total consultancy
Consultancies less than $50 000During the year fifty five other consultancies were engaged in the following categories.
Category Number Cost $
Information Technology 4 58 300
Environmental 10 152 353
Management Services 38 542 660
Organisation Review 2 37 278
Legal 1 27 500
Total 55 818091
Total consultancy costs 71 2 111 722
173NSW TRADE & INVESTMENT ANNUAL REPORT 2010 -11 APPENDICES

174 APPENDICES NSW TRADE & INVESTMENT ANNUAL REPORT 2010 -11
13. Payment of accounts
DPI and Resources & Energy and Industry and Innovation & Investment Divisions
Time for payment of accountsPayments were predominately made on an accrual accounting basis during 2010 -11, with creditor payments generally being made in line with each creditor’s payment terms for metropolitan based businesses. Due to the extended period of drought conditions, businesses relying on rural production were continued to be paid using zero terms. Payment terms are entered into the financial management information system for each creditor. As invoices are received they are entered into the system which automatically calculates when the invoice is due for payment and produces a cheque or Electronic Funds Transfer (EFT) payment in time to reach the creditor by the due date. These terms may be overridden in urgent or special circumstances. This system allows the maximum benefits to be gained from the State’s cash management processes and also sees creditors being paid as required.
During the 2010 -11 financial years the department processed 70 605 accounts payable documents. The department continues to
actively pursue a campaign whereby creditors’ bank account details are requested to enable as many payments as possible to be made via EFT. This process expedites the payment to the creditor and reduces the work involved in reconciling the department’s bank accounts. In the 2010 -11 financial year, 82 per cent of all payments were made using EFT.
EFT Remittance Advices may be automatically faxed or emailed to each creditor, if they have the facilities to receive Remittance Advices by such means. This reduces the number of Remittance Advices requiring printing, enveloping, and posting. Further savings are being achieved through this process with an estimated average cost of seven cents per email. It is estimated that in excess of 90 per cent of all Remittance Advices are either faxed or emailed to creditors.
Aged Analysis at the end of each quarterBelow is a schedule of the dollar amount of payments made during 2010 -11. Also included is the time these documents were paid, in relation to the due date.
Quarter Current (ie within due date)
$
Less than 30 days overdue
$
Between 30 and 60 days overdue
$
Between 60 and 90 days overdue
$
More than 90 days overdue
$
September 2010 64 331 390 81 888 372 38 087 021 6 758 479 4 618 773
December 2010 33 217 639 97 773 180 25 409 283 7 840 937 3 229 399
March 2011 52 794 121 79 609 153 21 422 324 7 961 596 13 483 898
June 2011 30 868 693 132 421 385 25 396 651 7 041 755 4 214 707
Due to the manner in which the financial management system reports payment analysis, it is considered that payments in the ‘less than 30 days overdue’ are also paid on time.
The payments that appear to be overdue are inflated due to the invoice date on all invoices being used as the base date. In some instances such as payment of Major and Small Business Grants which involve large dollar amounts, other agencies are used as an invoice collection point due to milestones needing to be signed
off by project boards. Following approval, these invoices are then forwarded on to NSW Trade & Investment for payment. The invoice date may be months prior to the department actually receiving the invoice.
Accounts paid on time within each quarterBelow is a schedule indicating the percentage of payments paid ‘on time’ as compared to the department’s target.
Total Accounts Paid On Time
Quarter Target % Actual % Actual $ Total Amount Paid $
September 2010 80 74.72 146 219 762 195 684 035
December 2010 80 78.22 130 990 819 167 470 437
March 2011 80 75.68 133 403 274 176 271 092
June 2011 80 81.67 163 290 078 199 943 191
Drought Transport Assistance Claims and Business Grants, as distinct from supplier’s invoices, take some time to be received into the department and therefore distort the Total Accounts Paid on Time values. This also has impacted on the target percentage.
For the full 2010 -11 financial year, 77.62 per cent of all accounts were paid on time.
All accounts for payment are directed to and processed in the department’s Orange office.
In addition:
– there were no instances of penalty interest being paid or
incurred during 2010 -11
– there were instances of supplier’s enquiries regarding late payments
– invoices were generally entered into the accounting system within one week of receipt of the invoice by the Accounts Payable Section.
These indicators will continue to be monitored during 2011 -12 and in future years to ensure the department’s payment performance continues to improve.

175NSW TRADE & INVESTMENT ANNUAL REPORT 2010 -11 APPENDICES
Crown Lands Division and Soil Conservation Service In 2010 -11, accounts were processed and paid by Corporate Finance of former Land and Property Management Authority. Corporate Finance is now included under the Department of Finance and Services.
The number of invoices paid on time was above the target in all quarters.
In 2010 -11, there were no instances where interest was paid in accordance with section 15 of the Public Finance and Audit Regulation 2005.
Aged Analysis at the end of each quarter
Quarter Current (within due date)
$
Overdue less than 30 days
$
Overdue 30-60 days
$
Overdue 60-90 days
$
Overdue more than 90 days
$
September 2010 1 740 096 18 170 24 782 0 0
December 2010 1 185 570 218 997 43 132 2 021 0
March 2011 3 081 204 259 194 37 484 11 331 57 835
June 2011 1 677 785 373 333 31 010 0 9 787
Accounts paid on time within each quarter
Quarter Total Accounts Paid on Time Total Amount Paid
$Number Value Amount Paid on Time $
Target % Actual % Target % Actual %
September 2010 85 91 90 96 27 874 381 29 133 131
December 2010 85 89 90 95 46 501 034 48 745 613
March 2011 85 80 90 94 55 659 825 58 945 824
June 2011 89 87 90 97 58 143 273 60 125 163
Note: The report does not include payments made to employees, payments related to payroll and super funds (as they are not external creditors) or corporate credit cards payments (as they are automatically settled on time each month).
The payment statistics (performance) are calculated on the end of the following month basis. That is, statistics are calculated on the basis that payments are made by the end of the month following the month in which an invoice or statement is received.
NSW Office of Water
Aged analysis at the end of each quarter
Quarter Current (ie within due date)
$
Less than 30 days overdue
$
Between 30 and 60 days overdue
$
Between 60 and 90 days overdue
$
More than 90 days overdue
$
September Quarter 941 846 339 605 18 237 4 459 601 141
December Quarter 5 581 148 0 0 171 630 1 899 826
March Quarter 1 263 814 251 887 525 098 0 3 547
June Quarter 1 820 671 36 677 6 246 0 0
Accounts paid on time within each quarter
Quarter Target%
Actual%
Actual$
Total Amount Paid$
September Quarter 90 92 88 424 849 100 080 897
December Quarter 90 91 96 939 449 102 975 073
March Quarter 90 88 74 120 943 79 992 641
June Quarter 90 90 136 657 261 156 791 194
Please note – statistics are for Department of Water & Energy until 31st October. Notes on above table: Percentage of accounts paid on time is based on SAP Payment Analysis Report, which compares vendor masterfile payment terms, invoice document date and payment document date to determine if payment was made on time, and if not, how many days it was late. The dollar value is the actual dollar value of the documents in each column (ie paid on time, not paid on time), so the percentage is based on documents, not dollar value.
13. Payment of accounts (cont’d)
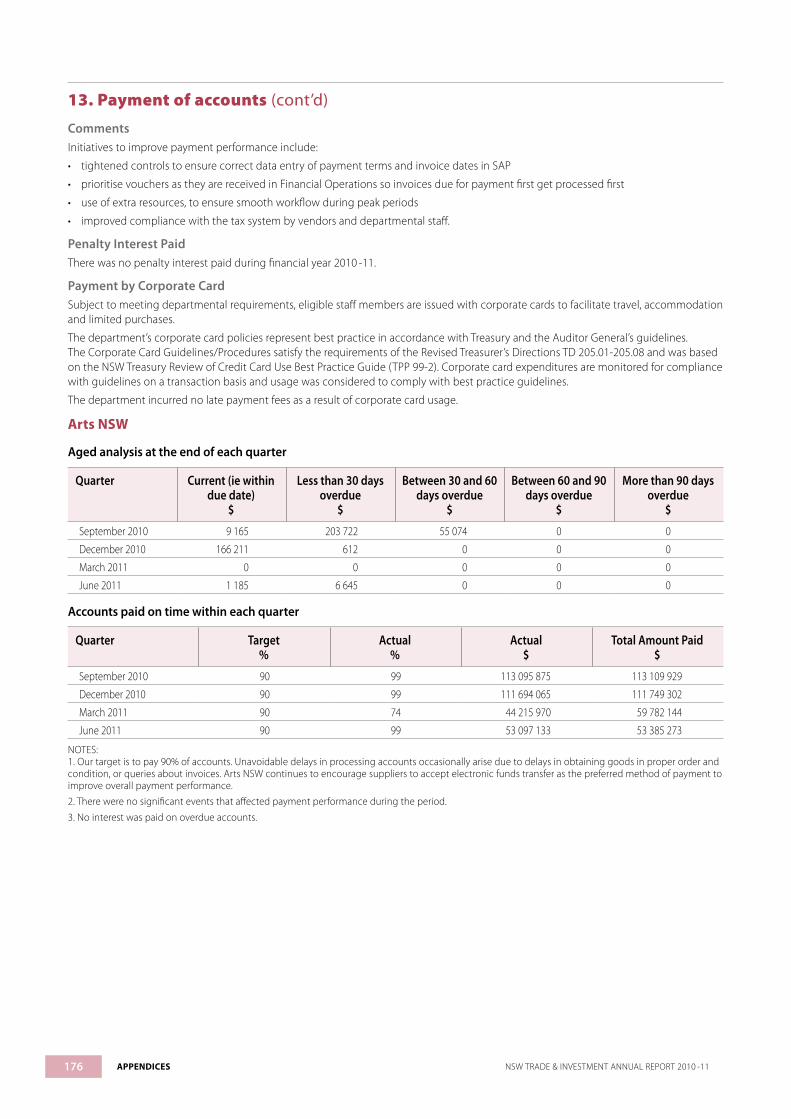
176 APPENDICES NSW TRADE & INVESTMENT ANNUAL REPORT 2010 -11
CommentsInitiatives to improve payment performance include:
• tightened controls to ensure correct data entry of payment terms and invoice dates in SAP
• prioritise vouchers as they are received in Financial Operations so invoices due for payment first get processed first
• use of extra resources, to ensure smooth workflow during peak periods
• improved compliance with the tax system by vendors and departmental staff.
Penalty Interest PaidThere was no penalty interest paid during financial year 2010 -11.
Payment by Corporate CardSubject to meeting departmental requirements, eligible staff members are issued with corporate cards to facilitate travel, accommodation and limited purchases.
The department’s corporate card policies represent best practice in accordance with Treasury and the Auditor General’s guidelines. The Corporate Card Guidelines/Procedures satisfy the requirements of the Revised Treasurer’s Directions TD 205.01-205.08 and was based on the NSW Treasury Review of Credit Card Use Best Practice Guide (TPP 99-2). Corporate card expenditures are monitored for compliance with guidelines on a transaction basis and usage was considered to comply with best practice guidelines.
The department incurred no late payment fees as a result of corporate card usage.
Arts NSW
Aged analysis at the end of each quarter
Quarter Current (ie within due date)
$
Less than 30 days overdue
$
Between 30 and 60 days overdue
$
Between 60 and 90 days overdue
$
More than 90 days overdue
$
September 2010 9 165 203 722 55 074 0 0
December 2010 166 211 612 0 0 0
March 2011 0 0 0 0 0
June 2011 1 185 6 645 0 0 0
Accounts paid on time within each quarter
Quarter Target %
Actual %
Actual $
Total Amount Paid $
September 2010 90 99 113 095 875 113 109 929
December 2010 90 99 111 694 065 111 749 302
March 2011 90 74 44 215 970 59 782 144
June 2011 90 99 53 097 133 53 385 273
NOTES: 1. Our target is to pay 90% of accounts. Unavoidable delays in processing accounts occasionally arise due to delays in obtaining goods in proper order and condition, or queries about invoices. Arts NSW continues to encourage suppliers to accept electronic funds transfer as the preferred method of payment to improve overall payment performance.2. There were no significant events that affected payment performance during the period.
3. No interest was paid on overdue accounts.
13. Payment of accounts (cont’d)

14. Land Disposal
DPI and Resources & Energy DivisionThe department sold three surplus employee housing properties for a net of $327 399.
Site Amount $
Cottage, 29 Monaghan St, Cobar 129 544
Cottage, 27 Enmore St, Trangie 86 915
Cottage, 8 Harris St, Trangie 110 940
Industry, Innovation & Investment DivisionThe department, through the Ministerial Corporation for Industry, is responsible for an industrial land bank consisting of two sites located at Albury, NSW. The Ministerial Corporation for Industry will continue to market the land for sale and has contracted the assistance of the State Property Authority to assist in this process.
During the 2010-11 financial year, a contract for the sale of one site was settled for a total contract value of $360 000.
Crown lands DivisionThere were three lands with a value greater than $5.0 million disposed for no/nil consideration. They were either added to an existing Reserve (with a Trust) or transferred to create a Reserve (with a Trust). They are:
Location Carrying Value $m Reason for Disposal Gazette Details
Randwick LGA 51 Added to an existing reserve (Prince Henry) through Crown Lands Act 1989
Gazette No.: 24 (1652), 4th Mar 2011
Pittwater LGA 12 Transferred to create reserve through Crown Lands Act 1989
Gazette No.: 37(2634), 15th Apr 2011
Parramatta LGA 13.7 Transferred to create reserve through Crown Lands Act 1989
Gazette No.: 24 (1651), 4th Mar 2011
Documents supporting the transactions are held with LPMA (former) and may be sought under Government Information (Public Access) Act 2009.
177NSW TRADE & INVESTMENT ANNUAL REPORT 2010 -11 APPENDICES
Office of Liquor, Gaming & Racing
Aged analysis at the end of each quarter
Quarter Current (ie within due date)
$
Less than 30 days overdue
$
Between 30 and 60 days overdue
$
Between 60 and 90 days overdue
$
More than 90 days overdue
$
September 2010 117 541 12 154 0 0 0
December 2010 0 0 13 720 0 0
March 2011 155 0 0 0 0
June 2011 25 520 2 399 0 0 0
Accounts paid on time within each quarter
Quarter Target %
Actual %
Actual $
Total Amount Paid $
September 2010 90 96 12 374 035 12 882 509
December 2010 90 96 6 496 141 6 746 997
March 2011 90 98 22 220 714 22 638 728
June 2011 90 90 7 290 106 8 054 613
NOTES: 1. Our target is to pay 90 per cent of accounts. Unavoidable delays in processing accounts occasionally arise due to delays in obtaining goods in proper order and condition, or queries about invoices. Liquor, Gaming and Racing continues to encourage suppliers to accept electronic funds transfer as the preferred method of payment to improve overall payment performance. 2. There were no significant events that affected payment performance during the period. 3. No interest was paid on overdue accounts.
13. Payment of accounts (cont’d)

NSW Office of WaterNSW Office of Water disposed of the following sites at Wyangla. The properties were surplus to NSW Office of Water requirements. There was no family or business association between any of the buyers and the person responsible for approving the disposal.
All documents relating to the property disposals are available under the Freedom of Information Act 1989.
Site Amount $
Lot 3 DP253231 Waugoola Rd Wyangla 9 000
Lot 172 DP18792 Waugoola Rd Wyangla 9 000
178 APPENDICES NSW TRADE & INVESTMENT ANNUAL REPORT 2010 -11
15. Capital WorksThe following tables contain information for the combined NSW Trade & Investment.
Completed Capital Works Amount $
Minerals Business & Technology 2 331 000
ICT Enhancement 150 000
Tourism Signposting Project 300 000
Colleges EIF Capital Works Program 2 740 000
Wharf 4/5 substructure works 750 000
Carriage Works parapet stabilisation 355 000
Pier 2/3 sprinkler system 216 300
Pier 2/3 theatre walk 93 010
Bangarra office refurbishment 70 000
CarriageWorks fire doors 58 750
Wharf 4/5 roof electrical repairs 360 000
CarriageWorks drainage installation 26 400
Minor office works 24 571
6 Figtree Dr Office Accommodation 5 600
CNSW Metro Relocations 15 100
CORIS : Compliance Systems - Online Service Delivery 199 290
CORIS : Business Intelligence - Bi And Reporting 665 810
Desktop Replacement 87 688
Office Accommodation Consolidation 50 418
Refit of L11 323 Castlereagh Street and office alteration 18 314
Refit Of L5 323 Castlereagh Street 36 000
Refit of L6 323 Castlereagh Street 43 812
Refit of L7 323 Castlereagh Street 262 469
Capital Works in Progress Amount $
EMAI Biosecurity Upgrade 33 107 000
Commercial Fisheries Management System 1 396 000
Biosecurity Information Management System 2 850 000
GHI Relocation to Ourimbah 4 577 000
Clarity Portfolio Management System 335 000
Offshore Artificial Reef 25 000
Water Management Monitoring and Information System 19 975
Wharf 4/5 amenities refurbishment 697 184
Greening Wharf 4/5 858 311
14. Land Disposal (cont’d)
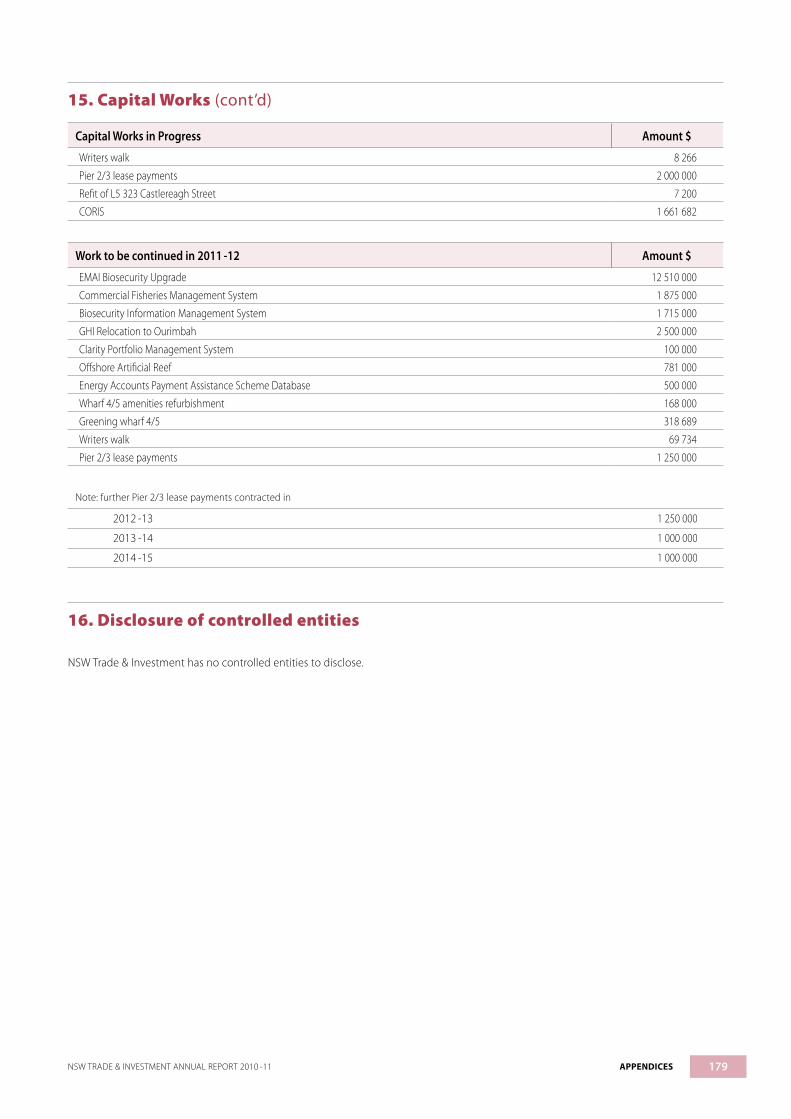
179NSW TRADE & INVESTMENT ANNUAL REPORT 2010 -11 APPENDICES
16. Disclosure of controlled entities
NSW Trade & Investment has no controlled entities to disclose.
Capital Works in Progress Amount $
Writers walk 8 266
Pier 2/3 lease payments 2 000 000
Refit of L5 323 Castlereagh Street 7 200
CORIS 1 661 682
Work to be continued in 2011 -12 Amount $
EMAI Biosecurity Upgrade 12 510 000
Commercial Fisheries Management System 1 875 000
Biosecurity Information Management System 1 715 000
GHI Relocation to Ourimbah 2 500 000
Clarity Portfolio Management System 100 000
Offshore Artificial Reef 781 000
Energy Accounts Payment Assistance Scheme Database 500 000
Wharf 4/5 amenities refurbishment 168 000
Greening wharf 4/5 318 689
Writers walk 69 734
Pier 2/3 lease payments 1 250 000
Note: further Pier 2/3 lease payments contracted in
2012 -13 1 250 000
2013 -14 1 000 000
2014 -15 1 000 000
15. Capital Works (cont’d)
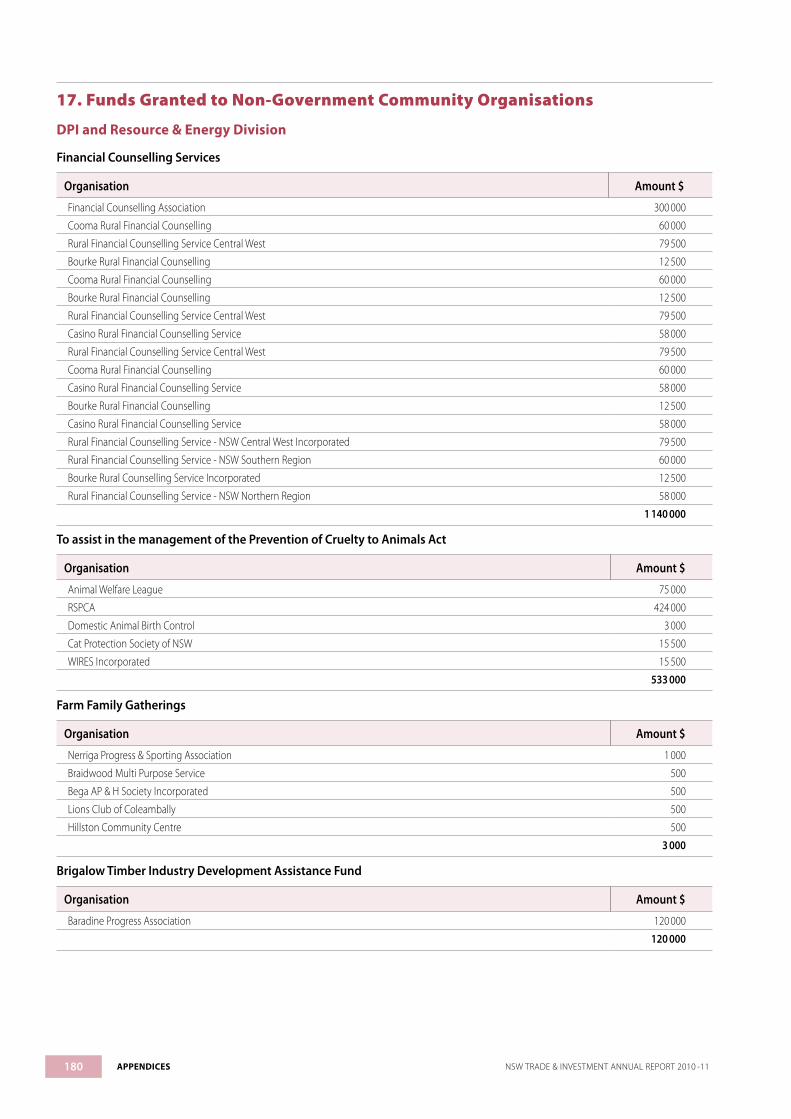
17. Funds Granted to Non-Government Community Organisations
DPI and Resource & Energy Division
Financial Counselling Services
Organisation Amount $
Financial Counselling Association 300 000
Cooma Rural Financial Counselling 60 000
Rural Financial Counselling Service Central West 79 500
Bourke Rural Financial Counselling 12 500
Cooma Rural Financial Counselling 60 000
Bourke Rural Financial Counselling 12 500
Rural Financial Counselling Service Central West 79 500
Casino Rural Financial Counselling Service 58 000
Rural Financial Counselling Service Central West 79 500
Cooma Rural Financial Counselling 60 000
Casino Rural Financial Counselling Service 58 000
Bourke Rural Financial Counselling 12 500
Casino Rural Financial Counselling Service 58 000
Rural Financial Counselling Service - NSW Central West Incorporated 79 500
Rural Financial Counselling Service - NSW Southern Region 60 000
Bourke Rural Counselling Service Incorporated 12 500
Rural Financial Counselling Service - NSW Northern Region 58 000
1 140 000
To assist in the management of the Prevention of Cruelty to Animals Act
Organisation Amount $
Animal Welfare League 75 000
RSPCA 424 000
Domestic Animal Birth Control 3 000
Cat Protection Society of NSW 15 500
WIRES Incorporated 15 500
533 000
Farm Family Gatherings
Organisation Amount $
Nerriga Progress & Sporting Association 1 000
Braidwood Multi Purpose Service 500
Bega AP & H Society Incorporated 500
Lions Club of Coleambally 500
Hillston Community Centre 500
3 000
Brigalow Timber Industry Development Assistance Fund
Organisation Amount $
Baradine Progress Association 120 000
120 000
180 APPENDICES NSW TRADE & INVESTMENT ANNUAL REPORT 2010 -11
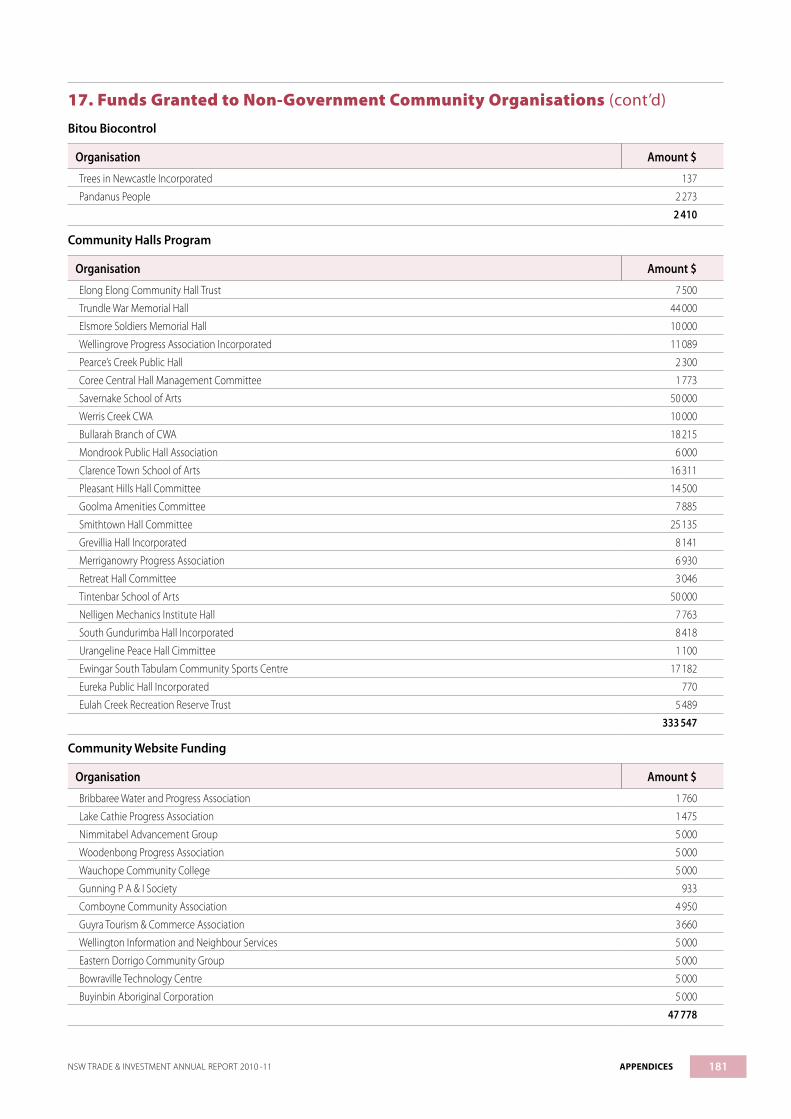
Bitou Biocontrol
Organisation Amount $
Trees in Newcastle Incorporated 137
Pandanus People 2 273
2 410
Community Halls Program
Organisation Amount $
Elong Elong Community Hall Trust 7 500
Trundle War Memorial Hall 44 000
Elsmore Soldiers Memorial Hall 10 000
Wellingrove Progress Association Incorporated 11 089
Pearce’s Creek Public Hall 2 300
Coree Central Hall Management Committee 1 773
Savernake School of Arts 50 000
Werris Creek CWA 10 000
Bullarah Branch of CWA 18 215
Mondrook Public Hall Association 6 000
Clarence Town School of Arts 16 311
Pleasant Hills Hall Committee 14 500
Goolma Amenities Committee 7 885
Smithtown Hall Committee 25 135
Grevillia Hall Incorporated 8 141
Merriganowry Progress Association 6 930
Retreat Hall Committee 3 046
Tintenbar School of Arts 50 000
Nelligen Mechanics Institute Hall 7 763
South Gundurimba Hall Incorporated 8 418
Urangeline Peace Hall Cimmittee 1 100
Ewingar South Tabulam Community Sports Centre 17 182
Eureka Public Hall Incorporated 770
Eulah Creek Recreation Reserve Trust 5 489
333 547
Community Website Funding
Organisation Amount $
Bribbaree Water and Progress Association 1 760
Lake Cathie Progress Association 1 475
Nimmitabel Advancement Group 5 000
Woodenbong Progress Association 5 000
Wauchope Community College 5 000
Gunning P A & I Society 933
Comboyne Community Association 4 950
Guyra Tourism & Commerce Association 3 660
Wellington Information and Neighbour Services 5 000
Eastern Dorrigo Community Group 5 000
Bowraville Technology Centre 5 000
Buyinbin Aboriginal Corporation 5 000
47 778
181NSW TRADE & INVESTMENT ANNUAL REPORT 2010 -11 APPENDICES
17. Funds Granted to Non-Government Community Organisations (cont’d)

Small Community Awareness Fund
Organisation Amount $
Merriwa Central School 5 000
Cudgegong Business Group Incorporated 3 200
Walla Walla Community Development Committee 5 000
Tarago & District Progress Association 5 000
Dunedoo District Development Group 5 000
Cowra Visitors Information Centre 5 000
Eden Community Access Centre 5 000
Packsaddle Progress Association 4 040
37 240
Energy and Water Consumers Advocacy Program
Organisation Amount $
Public Interest Advocacy Centre 320 000
320 000
Freshwater Trust Small Grants Program
Organisation Amount $
NSW Council of Freshwater Anglers 4 750
4 750
Making More Fish Naturally
Organisation Amount $
Coombadjha Art Studio 3 200
Friends of the Mongarlowe 18 473
CB Alexander Foundation 10 135
Hat Head Bowling & Recreation Club 800
32 608
Habitat Grant Program
Organisation Amount $
Tweed Landcare 11 200
Hat Head Bowling and Recreation Club 800
Wetland Care Australia 14 795
Clarence Landcare 10 000
36 795
TOTAL 2 611 127
182 APPENDICES NSW TRADE & INVESTMENT ANNUAL REPORT 2010 -11
17. Funds Granted to Non-Government Community Organisations (cont’d)

Industry, Innovation and Investment Division
Regional Flagship Events ProgramThe program supports regional events that have the potential to become tourism flagships for the region, building its image and boosting visitation from outside the region. All grants are provided for under the Tourism NSW Growth Program.
Event Region Amount
5 Lands Walk Central Coast 10 000
Batlow Apple Blossom Festival Snowy Mountains 10 000
Bitter and Twisted International Boutique Beer Festival Hunter 20 000
Byron Bay Film Festival Northern Rivers 10 000
Dorrigo Folk and Bluegrass Festival Mid North Coast 10 000
Fireside Festival The Poachers Way Capital Country 10 000
Grenfell Henry Lawson Festival of Arts Central NSW 10 000
Griffith La Festa - Faces of Australia Riverina 10 000
Hunter Valley Wine & Food Month Hunter 10 000
Jervis Bay Triathlon Festival South Coast 10 000
Kurri Kurri Nostalgia Festival and Cruise Hunter 20 000
Lake Light Sculpture Snowy Mountains 20 000
Lithgow Flash Gift Blue Mountains 10 000
Moree on a plate New England North West 10 000
Music Under the Stars at Perry Sandhill’s Outback 10 000
Old Bar Beach Festival Mid North Coast 20 000
Opera in the Paddock New England North West 10 000
Peats Ridge Sustainable Art and Music Festival Central Coast 10 000
Tastes at the Bay Festival Mid North Coast 10 000
Wings over Illawarra South Coast 10 000
Zoo Grooves Central NSW 10 000
All amounts are GST exclusive.
Regional Tourism Partnership Program 2010 – 11The Regional Tourism Partnership Program, administered by Tourism NSW, provided funding to 13 RTOs and the Forum of Regional Tourism Organisations (FORTO). $5.133m has been provided to support the RTOs and FORTO for each year of the program.
NB. This program is funded on a Calendar Year basis (not Financial Year). 2011 is the final calendar year of the program.
Regional Tourism Organisation Total $
Mid North Coast 350 600
Blue Mountains 350 500
Hunter 273 100
Snowy Mountains 505 425
South Coast 857 059
Central Coast 71 946
Central Coast (on behalf of Central Coast, Hunter & Blue Mountains) 509 872*
Capital Country 55 500
Central NSW 112 916
New England North West 50 000
New England North West (on behalf of New England North West, Outback NSW & Capital Country) 635 977*
Outback 62 778
Riverina 297 699
Northern Rivers 533 000
Lord Howe 168 810
183NSW TRADE & INVESTMENT ANNUAL REPORT 2010 -11 APPENDICES
17. Funds Granted to Non-Government Community Organisations (cont’d)
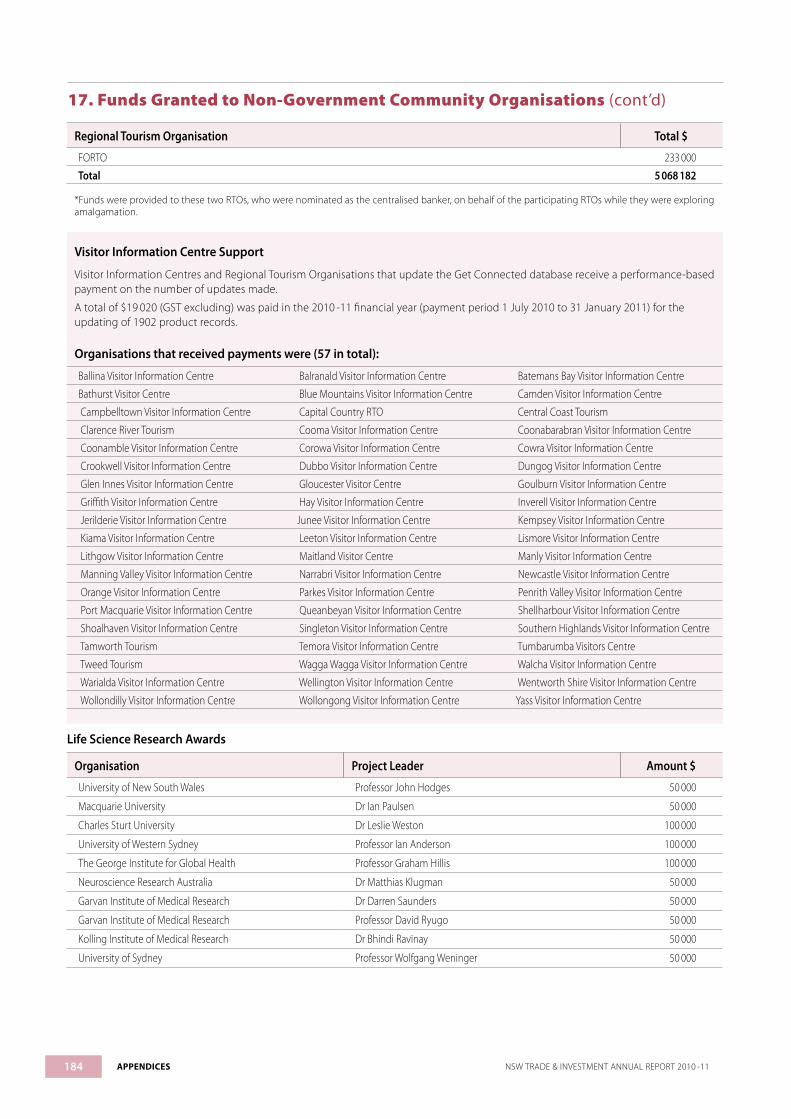
Regional Tourism Organisation Total $
FORTO 233 000
Total 5 068 182
*Funds were provided to these two RTOs, who were nominated as the centralised banker, on behalf of the participating RTOs while they were exploring amalgamation.
Visitor Information Centre Support
Visitor Information Centres and Regional Tourism Organisations that update the Get Connected database receive a performance-based payment on the number of updates made.
A total of $19 020 (GST excluding) was paid in the 2010 -11 financial year (payment period 1 July 2010 to 31 January 2011) for the updating of 1902 product records.
Organisations that received payments were (57 in total):
Ballina Visitor Information Centre Balranald Visitor Information Centre Batemans Bay Visitor Information Centre
Bathurst Visitor Centre Blue Mountains Visitor Information Centre Camden Visitor Information Centre
Campbelltown Visitor Information Centre Capital Country RTO Central Coast Tourism
Clarence River Tourism Cooma Visitor Information Centre Coonabarabran Visitor Information Centre
Coonamble Visitor Information Centre Corowa Visitor Information Centre Cowra Visitor Information Centre
Crookwell Visitor Information Centre Dubbo Visitor Information Centre Dungog Visitor Information Centre
Glen Innes Visitor Information Centre Gloucester Visitor Centre Goulburn Visitor Information Centre
Griffith Visitor Information Centre Hay Visitor Information Centre Inverell Visitor Information Centre
Jerilderie Visitor Information Centre Junee Visitor Information Centre Kempsey Visitor Information Centre
Kiama Visitor Information Centre Leeton Visitor Information Centre Lismore Visitor Information Centre
Lithgow Visitor Information Centre Maitland Visitor Centre Manly Visitor Information Centre
Manning Valley Visitor Information Centre Narrabri Visitor Information Centre Newcastle Visitor Information Centre
Orange Visitor Information Centre Parkes Visitor Information Centre Penrith Valley Visitor Information Centre
Port Macquarie Visitor Information Centre Queanbeyan Visitor Information Centre Shellharbour Visitor Information Centre
Shoalhaven Visitor Information Centre Singleton Visitor Information Centre Southern Highlands Visitor Information Centre
Tamworth Tourism Temora Visitor Information Centre Tumbarumba Visitors Centre
Tweed Tourism Wagga Wagga Visitor Information Centre Walcha Visitor Information Centre
Warialda Visitor Information Centre Wellington Visitor Information Centre Wentworth Shire Visitor Information Centre
Wollondilly Visitor Information Centre Wollongong Visitor Information Centre Yass Visitor Information Centre
Life Science Research Awards
Organisation Project Leader Amount $
University of New South Wales Professor John Hodges 50 000
Macquarie University Dr Ian Paulsen 50 000
Charles Sturt University Dr Leslie Weston 100 000
University of Western Sydney Professor Ian Anderson 100 000
The George Institute for Global Health Professor Graham Hillis 100 000
Neuroscience Research Australia Dr Matthias Klugman 50 000
Garvan Institute of Medical Research Dr Darren Saunders 50 000
Garvan Institute of Medical Research Professor David Ryugo 50 000
Kolling Institute of Medical Research Dr Bhindi Ravinay 50 000
University of Sydney Professor Wolfgang Weninger 50 000
184 APPENDICES NSW TRADE & INVESTMENT ANNUAL REPORT 2010 -11
17. Funds Granted to Non-Government Community Organisations (cont’d)
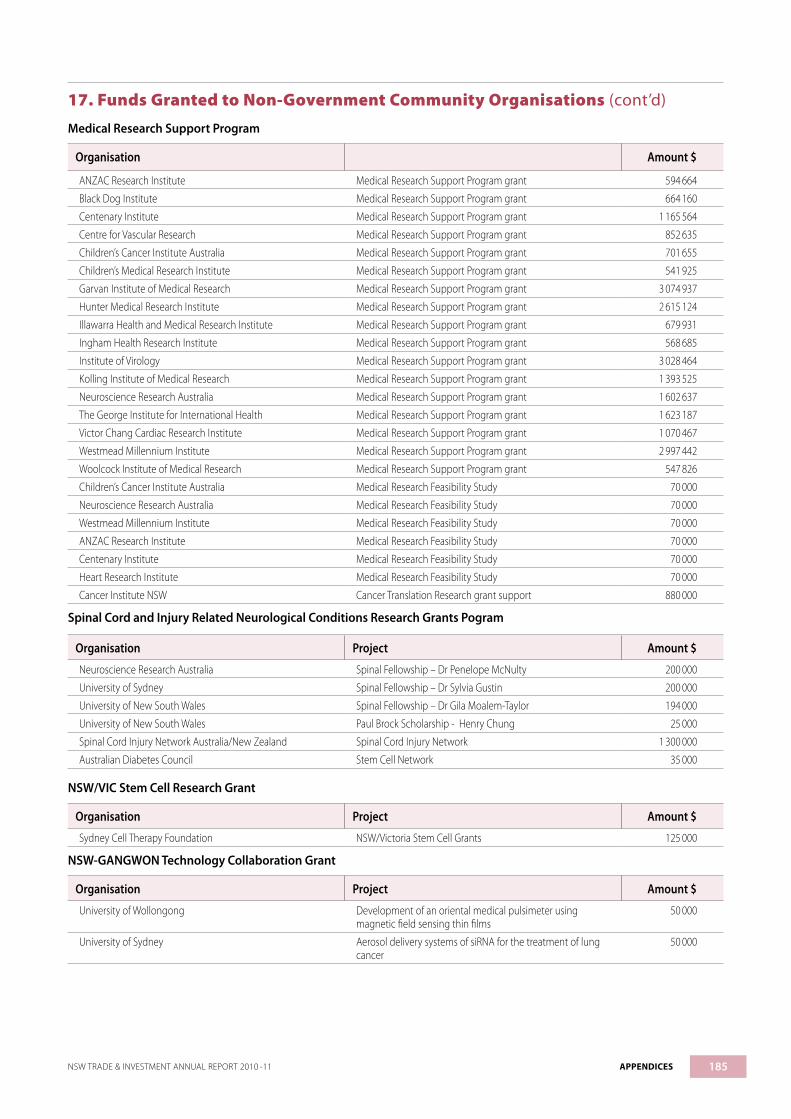
Medical Research Support Program
Organisation Amount $
ANZAC Research Institute Medical Research Support Program grant 594 664
Black Dog Institute Medical Research Support Program grant 664 160
Centenary Institute Medical Research Support Program grant 1 165 564
Centre for Vascular Research Medical Research Support Program grant 852 635
Children’s Cancer Institute Australia Medical Research Support Program grant 701 655
Children’s Medical Research Institute Medical Research Support Program grant 541 925
Garvan Institute of Medical Research Medical Research Support Program grant 3 074 937
Hunter Medical Research Institute Medical Research Support Program grant 2 615 124
Illawarra Health and Medical Research Institute Medical Research Support Program grant 679 931
Ingham Health Research Institute Medical Research Support Program grant 568 685
Institute of Virology Medical Research Support Program grant 3 028 464
Kolling Institute of Medical Research Medical Research Support Program grant 1 393 525
Neuroscience Research Australia Medical Research Support Program grant 1 602 637
The George Institute for International Health Medical Research Support Program grant 1 623 187
Victor Chang Cardiac Research Institute Medical Research Support Program grant 1 070 467
Westmead Millennium Institute Medical Research Support Program grant 2 997 442
Woolcock Institute of Medical Research Medical Research Support Program grant 547 826
Children’s Cancer Institute Australia Medical Research Feasibility Study 70 000
Neuroscience Research Australia Medical Research Feasibility Study 70 000
Westmead Millennium Institute Medical Research Feasibility Study 70 000
ANZAC Research Institute Medical Research Feasibility Study 70 000
Centenary Institute Medical Research Feasibility Study 70 000
Heart Research Institute Medical Research Feasibility Study 70 000
Cancer Institute NSW Cancer Translation Research grant support 880 000
Spinal Cord and Injury Related Neurological Conditions Research Grants Pogram
Organisation Project Amount $
Neuroscience Research Australia Spinal Fellowship – Dr Penelope McNulty 200 000
University of Sydney Spinal Fellowship – Dr Sylvia Gustin 200 000
University of New South Wales Spinal Fellowship – Dr Gila Moalem-Taylor 194 000
University of New South Wales Paul Brock Scholarship - Henry Chung 25 000
Spinal Cord Injury Network Australia/New Zealand Spinal Cord Injury Network 1 300 000
Australian Diabetes Council Stem Cell Network 35 000
NSW/VIC Stem Cell Research Grant
Organisation Project Amount $
Sydney Cell Therapy Foundation NSW/Victoria Stem Cell Grants 125 000
NSW-GANGWON Technology Collaboration Grant
Organisation Project Amount $
University of Wollongong Development of an oriental medical pulsimeter using magnetic field sensing thin films
50 000
University of Sydney Aerosol delivery systems of siRNA for the treatment of lung cancer
50 000
185NSW TRADE & INVESTMENT ANNUAL REPORT 2010 -11 APPENDICES
17. Funds Granted to Non-Government Community Organisations (cont’d)

NSW-CHINA Collaborative Research Program
Organisation Project Amount $
Karitane Australia Using standardised Chinese herbal medicine formulae and acupuncture to manage postpartum depression
5 000
Other Medical Research Grants
Organisation Project Amount $
University of Wollongong Capital Funding – Illawarra Heath and Medical Research Institute
5 000 000
Oncology Children’s Foundation Cytoskeleton Network 75 000
Australian Research Council Centres Of Excellence (COE) Science Leveraging Fund Support
Organisation Project Amount $
University of New South Wales Centre of Excellence for Quantum Computation and Communication Technology
500 000
University of Newcastle Centre of Excellence for Geotechnical Science and Engineering
500 000
University of New South Wales Centre of Excellence for Population Ageing Research 500 000
Macquarie University Centre of Excellence for Core to Crust Fluid Systems 500 000
Macquarie University Centre of Excellence for Cognition and its Disorders 500 000
Macquarie University Centre of Excellence for Engineered Quantum Systems 500 000
University of Sydney Centre of Excellence for All-sky Astrophysics 290 000
University of Sydney Centre of Excellence for Ultrahigh Bandwidth Devices for Optical Systems
500 000
University of New South Wales Centre of Excellence for Climate Systems Science 500 000
Australian Solar Institute (Asi) Science Leveraging Fund Support
Organisation Project Amount $
University of New South Wales Hot Carrier Cells 150 000
University of Sydney Upconversion of the Solar Spectrum for improved PV Energy Conversion
150 000
Cooperative Research Centre (Crc) Science Leveraging Fund Support
Organisation Project Amount $
Pork CRC Ltd CRC for High Integrity Australian Pork 200 000
NSW Cooperative Research Centre Bid Support Program Science Leveraging Fund Support
Organisation Project Amount $
University of Newcastle CRC for Securing and Rebuilding Biodiversity 30 000
Woolcock Institute for Medical Research CRC for Sleep and Alertness 30 000
Education Investment Fund (Eif) Science Leveraging Fund Support
Organisation Project Amount
University of Wollongong Retrofitting for Resilient and Sustainable Buildings 303 750
University of Sydney The Australian Institute for Nanoscience 303 750
University of Newcastle Newcastle Institute for Energy and Resources 303 750
University of Technology, Sydney Building for the Future 303 750
186 APPENDICES NSW TRADE & INVESTMENT ANNUAL REPORT 2010 -11
17. Grants to Non-Government Community Organisations (cont’d)

Education Investment Fund Super Science (Eifss) Science Leveraging Fund Support
Organisation Project Amount $
Intersect Future Industries - Intersect 1 000 000
Sydney Institute of Marine Science Marine and Climate - Sydney Institute of Marine Science 30 000
University of New South Wales Future Industries – Bioplatforms 944 000
Macquarie University Future Industries – Bioplatforms 656 000
Techvouchers Science Leveraging Fund Support Grants
Organisation Project Amount $
University of Western Sydney Connector – Traditional Medicine Internationalisation Platform 75 000
University of New England Connector 50 000
University of Technology, Sydney Connector 50 000
University of Newcastle TechVoucher – Widden Stud Australia Pty Ltd 15 000
University of Newcastle TechVoucher – Arrowfield Pty Ltd 15 000
University of Newcastle TechVoucher – Darley Pty Ltd 15 000
University of Newcastle TechVoucher – Vinery Stud Pty Ltd 15 000
University of Newcastle TechVoucher – Nusep Pty Ltd 15 000
University of Sydney TechVoucher – Strategic Bovine Services Pty Ltd 12 000
University of Newcastle TechVoucher – Metal Science Technologies Pty Ltd 14 617
University of Newcastle TechVoucher - Harness Racing NSW Pty Ltd 15 000
ANSTO TechVoucher – Perten Instruments of Australia Pty Ltd 15 000
University of Technology, Sydney Biodetectors Pty Ltd 15 000
CSIRO TechVoucher - L&A Fazzini Manufacturing Pty Ltd 15 000
BuildingIQ Pty Ltd TechVoucher – BuildingIQ Pty Ltd 15 000
University of Wollongong TechVoucher – Clover Corporation Ltd 15 000
University of Sydney TechVoucher – BioPower Systems Pty Ltd 15 000
University of Sydney TechVoucher – Rislin Pty Ltd 12 000
NSW Department of Environment, Climate Change and Water TechVoucher – Incident Screen Pty Ltd 9104
University of New South Wales TechVoucher – Incident Screen Pty Ltd 5 000
Macquarie University TechVoucher – Minomic International Pty Ltd 15 000
University of Sydney TechVoucher – Personal Audio Pty Ltd 15 000
University of Wollongong TechVoucher – Datatrace DNA Pty Ltd 15 000
Macquarie University TechVoucher – EIM Medical Consulting Pty Ltd 15 000
University of New South Wales TechVoucher – Western Sydney Business Connection 15 000
Sunday Silicon Technologies Pty Ltd TechVoucher – Sunday Silicon Technologies Pty Ltd 9 957
ANSTO TechVoucher – Sunday Silicon Technologies Pty Ltd 3 810
University of New England TechVoucher – ICT International Pty Ltd 15000
CSIRO TechVoucher – Biofiba Limited 15 000
University of Sydney TechVoucher – Seeker Wireless Pty Ltd 15 000
Macquarie University TechVoucher – Keepad Interactive Pty Ltd 15 000
Other Science Leveraging Fund Support Grants
Organisation Project Amount $
Schizophrenia Research Institute Funding to establish Chair in Schizophrenia Research 500 000
Brandon Capital Medical Research Commercialisation Fund 150 000
Brandon Capital Medical Research Commercialisation Fund Extension 300 000
187NSW TRADE & INVESTMENT ANNUAL REPORT 2010 -11 APPENDICES
17. Funds Granted to Non-Government Community Organisations (cont’d)

Science Exposed Support Grants
Organisation Project Amount $
Astronomical Society of Albury-Wodonga Joint event between Border Stargaze and Charles Sturt University
2 000
Australian Museum Sydney Loves Science (Science Ignite Video) 10 000
Australian Museum Science Week Schools Launch Event 14 000
CSIRO Bega Council Library Event 3 000
Fizzics Science in the Cinema/Under 5’s Science Resource Kit/split The Science Team
6 500
Sirius Ventures Cooking and chemistry Workshop Galit Segev 2 500
Macqurie University Indigenous Science Education Program 15 000
Museum of Applied Arts & Sciences (Powerhouse Museum) Career Panels 4 000
The Royal Institution of Australia Inc Science of Superheroes 1 500
Silver Screen Pictures Electric Car Festival - Tom Farrell Institute for Environment 3 000
Sydney Observatory Transit of Venus/Madlab/Girls Night Out 5 100
Taronga Conservatorium Society Australia Sound of Science Audio Tours 3 000
The Science Team Under 5’s Science Resource Kit 5 000
ACCI Hunter Valley Electric Car Festival 3 650
University of Newcastle Café Smart 1 200
University of Newcastle Science and Engineering Challenge 10 000
University of Western Sydney Western Sydney Schools Science Program 6 550
Capacity Building ProgramsThese programs are designed to increase business and economic activity and foster commitment from local government to economic development. The programs benefit the broader community, particularly the business community. Organisations such as small chambers of commerce, Regional Development Australia Committees and community based organisations are eligible to apply on behalf of their community.
Organisation Project Funding Source Amount ($)
Regional Development Australia - Northern Rivers
Margins and Mark Ups Workshop Business Growth Program 2 168
Australian Industry Defence Network NSW Marketing Stage II Cluster Development 7 485
Community Technology Centres Association Incorporated
Rural eBusiness Cluster Cluster Development 5 000
BEC - St George and Sutherland Shire Ltd
China Lunch Room Cluster Cluster Projects 5 000
North Coast Business Road Show Inc Tweed Heads - North Coast Business Roadshow
Cluster Projects 1 250
Capital Region BEC (formerly Queanbeyan Enterprise Centre Incorporated)
Southern Highlands Small Business Group
Cluster Projects 1 250
Mudgee Fine Foods Inc Strategic Business Cluster Program - Network support
Cluster Projects 1 250
Sydney Women’s Network Sydney Women’s Network Cluster Projects 1 446
Pamela Trantalles Strategic Business Clusters - Business Network Support
Cluster Projects 2 500
Wilson Webb Pty Ltd (for Orana Lean Group)
Orana Lean Group Business Cluster Cluster Projects 600
Industry Development Centre - Hunter Creative Industries (Hunter) Cluster Cluster Projects 5 000
Hume Lean Network Inc Lean Business Systems Review and Development
Cluster Projects 20 000
Blue Mountains, Lithgow and Oberon Tourism
Blue Mountains, Lithgow and Oberon Tourism Indigenous Program
Cluster Projects 14 500
Lean Network Incorporated Lean Network Kaizen Blitz Cluster Projects 5 000
188 APPENDICES NSW TRADE & INVESTMENT ANNUAL REPORT 2010 -11
17. Funds Granted to Non-Government Community Organisations (cont’d)
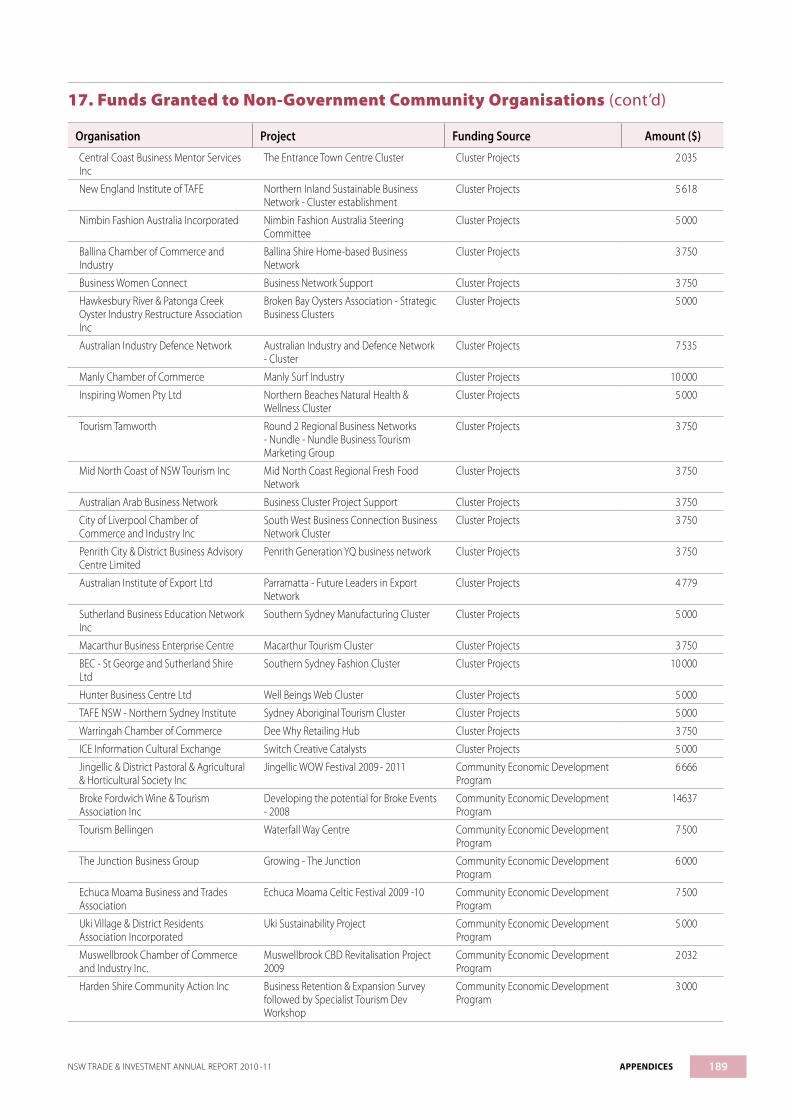
Organisation Project Funding Source Amount ($)
Central Coast Business Mentor Services Inc
The Entrance Town Centre Cluster Cluster Projects 2 035
New England Institute of TAFE Northern Inland Sustainable Business Network - Cluster establishment
Cluster Projects 5 618
Nimbin Fashion Australia Incorporated Nimbin Fashion Australia Steering Committee
Cluster Projects 5 000
Ballina Chamber of Commerce and Industry
Ballina Shire Home-based Business Network
Cluster Projects 3 750
Business Women Connect Business Network Support Cluster Projects 3 750
Hawkesbury River & Patonga Creek Oyster Industry Restructure Association Inc
Broken Bay Oysters Association - Strategic Business Clusters
Cluster Projects 5 000
Australian Industry Defence Network Australian Industry and Defence Network - Cluster
Cluster Projects 7 535
Manly Chamber of Commerce Manly Surf Industry Cluster Projects 10 000
Inspiring Women Pty Ltd Northern Beaches Natural Health & Wellness Cluster
Cluster Projects 5 000
Tourism Tamworth Round 2 Regional Business Networks - Nundle - Nundle Business Tourism Marketing Group
Cluster Projects 3 750
Mid North Coast of NSW Tourism Inc Mid North Coast Regional Fresh Food Network
Cluster Projects 3 750
Australian Arab Business Network Business Cluster Project Support Cluster Projects 3 750
City of Liverpool Chamber of Commerce and Industry Inc
South West Business Connection Business Network Cluster
Cluster Projects 3 750
Penrith City & District Business Advisory Centre Limited
Penrith Generation YQ business network Cluster Projects 3 750
Australian Institute of Export Ltd Parramatta - Future Leaders in Export Network
Cluster Projects 4 779
Sutherland Business Education Network Inc
Southern Sydney Manufacturing Cluster Cluster Projects 5 000
Macarthur Business Enterprise Centre Macarthur Tourism Cluster Cluster Projects 3 750
BEC - St George and Sutherland Shire Ltd
Southern Sydney Fashion Cluster Cluster Projects 10 000
Hunter Business Centre Ltd Well Beings Web Cluster Cluster Projects 5 000
TAFE NSW - Northern Sydney Institute Sydney Aboriginal Tourism Cluster Cluster Projects 5 000
Warringah Chamber of Commerce Dee Why Retailing Hub Cluster Projects 3 750
ICE Information Cultural Exchange Switch Creative Catalysts Cluster Projects 5 000
Jingellic & District Pastoral & Agricultural & Horticultural Society Inc
Jingellic WOW Festival 2009 - 2011 Community Economic Development Program
6 666
Broke Fordwich Wine & Tourism Association Inc
Developing the potential for Broke Events - 2008
Community Economic Development Program
14637
Tourism Bellingen Waterfall Way Centre Community Economic Development Program
7 500
The Junction Business Group Growing - The Junction Community Economic Development Program
6 000
Echuca Moama Business and Trades Association
Echuca Moama Celtic Festival 2009 -10 Community Economic Development Program
7 500
Uki Village & District Residents Association Incorporated
Uki Sustainability Project Community Economic Development Program
5 000
Muswellbrook Chamber of Commerce and Industry Inc.
Muswellbrook CBD Revitalisation Project 2009
Community Economic Development Program
2 032
Harden Shire Community Action Inc Business Retention & Expansion Survey followed by Specialist Tourism Dev Workshop
Community Economic Development Program
3 000
189NSW TRADE & INVESTMENT ANNUAL REPORT 2010 -11 APPENDICES
17. Funds Granted to Non-Government Community Organisations (cont’d)

Organisation Project Funding Source Amount ($)
LightnUp Inc Evaluating Lismore Lantern Parade for Future Expansion
Community Economic Development Program
2 500
Brunswick Heads Chamber of Commerce
Brunswick Heads Chamber of Commerce inc. - BRE Survey and Home-based Business Project
Community Economic Development Program
3 500
Bundanoon Community Assc. Inc. Bundanoon - Shop Local Campaign & Marketing of Bundy on Tap
Community Economic Development Program
10 000
Mungindi Progress Association Putting Mungindi on the Map Community Economic Development Program
6 205
Glen Innes Rotary Club Gourmet in the Glen - Food & Wine Festival - 2009 & 2010
Community Economic Development Program
7 500
The Elvis Revival Incorporated Strategic Review of the Parkes Elvis Festival
Community Economic Development Program
1 500
Gloucester Chamber of Commerce Meeting Customer Needs in Retail Services - 2010
Community Economic Development Program
1 200
Narooma Chamber of Commerce & Tourism Inc
Narooma Oyster Festival 2010 Community Economic Development Program
6 000
Shoalhaven Business Chamber Shoalhaven Business Chamber - Monthly Meetings
Community Economic Development Program
2 000
Gundagai Regional Enhancement Group
Gundagai Tourism Forum Community Economic Development Program
735
Cowra Region Vineyards Association CRVA Marketing and Promotions Project 2009
Developing Regional Resources 7 400
Business Enterprise Centre Cabonne Orange Blayney Incorporated
Blayney Card Shop Local Program Developing Regional Resources 1 000
Lightning Ridge Tourism Association Lightning Ridge Marketing Plan Workshop
Developing Regional Resources 752
CENTROC Growing Health Workforce in Central NSW Marketing Plan
Developing Regional Resources 6 987
Dungog District Chamber of Commerce Community College Project Developing Regional Resources 300
Hunter Business Chamber Business Development Forums 2010 Developing Regional Resources 500
Central Coast Tourism Inc. Destination Management Plan 2010 -13 Developing Regional Resources 1 000
Namoi Catchment Management Authority
Namoi Open House Series 2010 Developing Regional Resources 2 500
Hunter Manufacturing Awards Inc Hunter Manufacturing Awards 2010 Developing Regional Resources 500
Illawarra Innovative Industry Network Exhibiting at National Manufacturing Week 2010
Developing Regional Resources 5 000
Regional Development Australia - Northern Rivers
Northern Rivers Food - The Art of Dealing with Supermarkets
Developing Regional Resources 1 390
Sydney International Eventing Incorporated
Sydney Weekend of Equestrian World Cups, 7- 9 May 2010
Developing Regional Resources 5 000
Hunter Valley Wine Industry Association 2010 Hunter Valley Wine Industry and Legends Awards Dinner
Developing Regional Resources 500
Arts Northern Rivers Inc Visual Arts Speed Dating 4 Artists Developing Regional Resources 11 260
Illawarra Innovative Industry Network Joint/Group Tendering Workshop Developing Regional Resources 1 500
Hunter Valley Wine Industry Association Trade Visit to 2010 Hunter Valley Wine Show
Developing Regional Resources 5 000
Central Coast Apprenticeship and Traineeship Advisory Committee
Central Coast Training Desk Developing Regional Resources 2 500
Southern New England Vignerons Association Inc.
New England Vignerons Australia Regional Wine Branding Strategy
Developing Regional Resources 19 000
Thurgoona Football Club Incorporated Thurgoona 70s Festival Developing Regional Resources 5 000
HunterNet Co-operative Ltd Innovation Assessment Tool Developing Regional Resources 7 500
190 APPENDICES NSW TRADE & INVESTMENT ANNUAL REPORT 2010 -11
17. Funds Granted to Non-Government Community Organisations (cont’d)

Organisation Project Funding Source Amount ($)
HunterNet Co-operative Ltd Land Warfare Conference and Land Environment Working Group Attendance Funding
Developing Regional Resources 1 000
The Eastern Suburbs Business Enterprise Centre
Your Key to Business Growth - Blacktown and Burwood
Developing Regional Resources 1 000
Hunter Business Centre Ltd Winning with Tenders Program 2010 -11 Developing Regional Resources 2 000
Regional Development Australia - Illawarra
Illawarra Indigenous Employment Luncheon 2010
Developing Regional Resources 9 530
Regional Development Australia - Illawarra
Wollongong DVD Project Developing Regional Resources 7 000
Regional Development Australia - Illawarra
RDAI - Website Upgrade Project Developing Regional Resources 10 000
Regional Development Australia - Hunter
University of Newcastle Chamber Choir Tour to China
Developing Regional Resources 5 000
Foundation for Regional Development Limited
Country & Regional Living Expo 2010 - Sponsorship
Developing Regional Resources 75 000
Orana Arts Capacity Buildings Workshops 2008-09 Enterprising Regions Program 676
Kendall Community Centre Reserve Trust
The Good Life In Kendall Festival 2009 Enterprising Regions Program 10 000
Toukley & District Chamber of Commerce
Toukley Beyond 2009 Enterprising Regions Program 7 092
Central Coast Tourism Inc. Norah Head Lighthouse Reserve Business Plan 2009
Enterprising Regions Program 5 000
Raymond Terrace Business Association Marketing Raymond Terrace Enterprising Regions Program 15 000
Brunswick Heads Chamber of Commerce
Brunswick Heads Simple Pleasures 2010 Enterprising Regions Program 15 000
Coleambally Chamber of Commerce and Industry
Coleambally Community Planning Project Enterprising Regions Program 6 474
Kyogle Community Economic Development Committee Inc
Kyogle Community Plan Review 2009 Enterprising Regions Program 3 500
Stuart Town Advancement Association Stuart Town Development Project Enterprising Regions Program 2 700
Community Technology Centre at Tea Gardens
Tea Gardens Hawks Nest Tourism & Marketing Brochure
Enterprising Regions Program 3 250
Earth Learning Incorporated Caldera Sustainable Communities 2010 Project
Enterprising Regions Program 20 000
Packsaddle Progress Association Inc Packsaddle Gymkhana and Bikekhana Enterprising Regions Program 2 584
Bingara & District vision 20/20 Bingara Community Economic Development Project
Enterprising Regions Program 10 000
South West Rocks Chamber of Commerce
South West Rocks Destination Marketing Enterprising Regions Program 10 715
Northlakes Chamber of Commerce Incorporated
Cardiff - An Emerging Experience Project Enterprising Regions Program 11 945
Deniliquin Chamber of Commerce Deniliquin Events Co-ordinator 2010 - 2011
Enterprising Regions Program 15 000
Intereach NSW Inc The Country Store Business Plan Enterprising Regions Program 6 250
Lower Hunter Vocational Education Partnership
Growing 2322 Enterprising Regions Program 3 000
Regional Development Australia - Northern Rivers
Lismore Sustainable Living Expo 2010 Enterprising Regions Program 10 000
Condobolin Rodeo Committee Inc Professional Bull Riders Challenge 2010 -11
Enterprising Regions Program 15 000
Flair Awards Inc Fashion in the Manning Valley Enterprising Regions Program 7 000
South East Arts Region Inc Visual Arts South East Enterprising Regions Program 4 250
Australian Springtime Flora Festival Inc Flora Festival Upgrade Enterprising Regions Program 30 000
191NSW TRADE & INVESTMENT ANNUAL REPORT 2010 -11 APPENDICES
17. Funds Granted to Non-Government Community Organisations (cont’d)
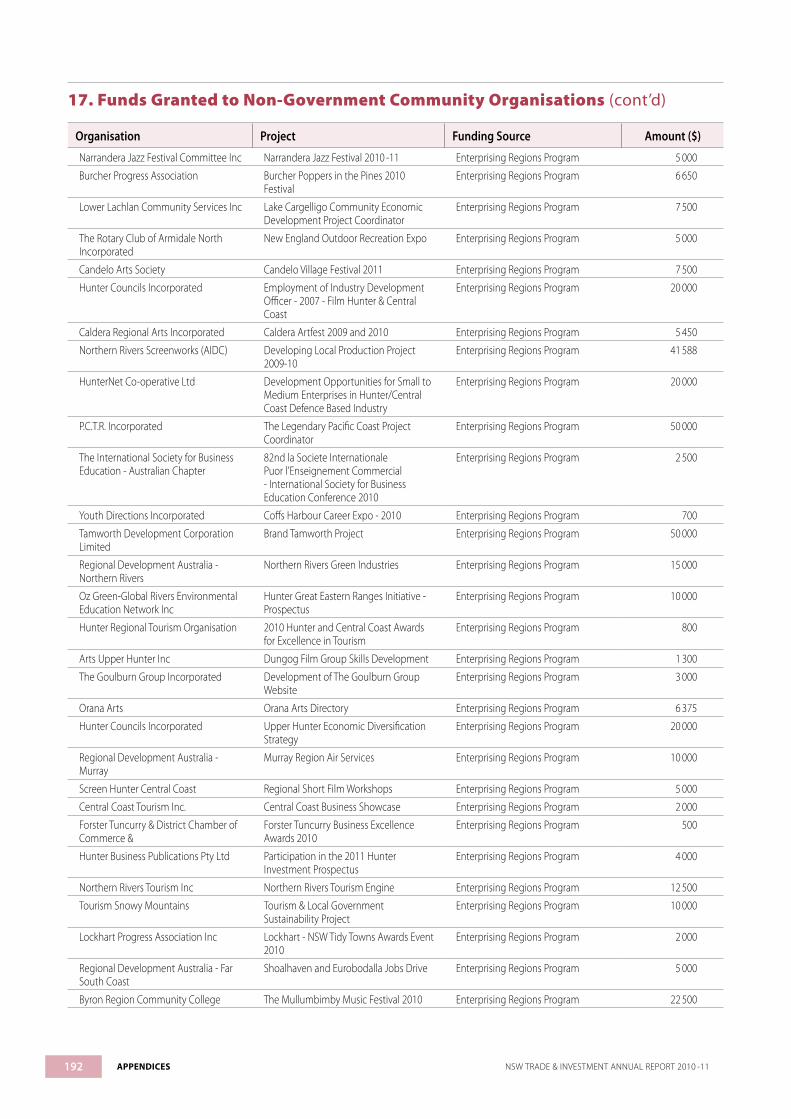
Organisation Project Funding Source Amount ($)
Narrandera Jazz Festival Committee Inc Narrandera Jazz Festival 2010 -11 Enterprising Regions Program 5 000
Burcher Progress Association Burcher Poppers in the Pines 2010 Festival
Enterprising Regions Program 6 650
Lower Lachlan Community Services Inc Lake Cargelligo Community Economic Development Project Coordinator
Enterprising Regions Program 7 500
The Rotary Club of Armidale North Incorporated
New England Outdoor Recreation Expo Enterprising Regions Program 5 000
Candelo Arts Society Candelo Village Festival 2011 Enterprising Regions Program 7 500
Hunter Councils Incorporated Employment of Industry Development Officer - 2007 - Film Hunter & Central Coast
Enterprising Regions Program 20 000
Caldera Regional Arts Incorporated Caldera Artfest 2009 and 2010 Enterprising Regions Program 5 450
Northern Rivers Screenworks (AIDC) Developing Local Production Project 2009-10
Enterprising Regions Program 41 588
HunterNet Co-operative Ltd Development Opportunities for Small to Medium Enterprises in Hunter/Central Coast Defence Based Industry
Enterprising Regions Program 20 000
P.C.T.R. Incorporated The Legendary Pacific Coast Project Coordinator
Enterprising Regions Program 50 000
The International Society for Business Education - Australian Chapter
82nd la Societe Internationale Puor l’Enseignement Commercial - International Society for Business Education Conference 2010
Enterprising Regions Program 2 500
Youth Directions Incorporated Coffs Harbour Career Expo - 2010 Enterprising Regions Program 700
Tamworth Development Corporation Limited
Brand Tamworth Project Enterprising Regions Program 50 000
Regional Development Australia - Northern Rivers
Northern Rivers Green Industries Enterprising Regions Program 15 000
Oz Green-Global Rivers Environmental Education Network Inc
Hunter Great Eastern Ranges Initiative - Prospectus
Enterprising Regions Program 10 000
Hunter Regional Tourism Organisation 2010 Hunter and Central Coast Awards for Excellence in Tourism
Enterprising Regions Program 800
Arts Upper Hunter Inc Dungog Film Group Skills Development Enterprising Regions Program 1 300
The Goulburn Group Incorporated Development of The Goulburn Group Website
Enterprising Regions Program 3 000
Orana Arts Orana Arts Directory Enterprising Regions Program 6 375
Hunter Councils Incorporated Upper Hunter Economic Diversification Strategy
Enterprising Regions Program 20 000
Regional Development Australia - Murray
Murray Region Air Services Enterprising Regions Program 10 000
Screen Hunter Central Coast Regional Short Film Workshops Enterprising Regions Program 5 000
Central Coast Tourism Inc. Central Coast Business Showcase Enterprising Regions Program 2 000
Forster Tuncurry & District Chamber of Commerce &
Forster Tuncurry Business Excellence Awards 2010
Enterprising Regions Program 500
Hunter Business Publications Pty Ltd Participation in the 2011 Hunter Investment Prospectus
Enterprising Regions Program 4 000
Northern Rivers Tourism Inc Northern Rivers Tourism Engine Enterprising Regions Program 12 500
Tourism Snowy Mountains Tourism & Local Government Sustainability Project
Enterprising Regions Program 10 000
Lockhart Progress Association Inc Lockhart - NSW Tidy Towns Awards Event 2010
Enterprising Regions Program 2 000
Regional Development Australia - Far South Coast
Shoalhaven and Eurobodalla Jobs Drive Enterprising Regions Program 5 000
Byron Region Community College The Mullumbimby Music Festival 2010 Enterprising Regions Program 22 500
192 APPENDICES NSW TRADE & INVESTMENT ANNUAL REPORT 2010 -11
17. Funds Granted to Non-Government Community Organisations (cont’d)
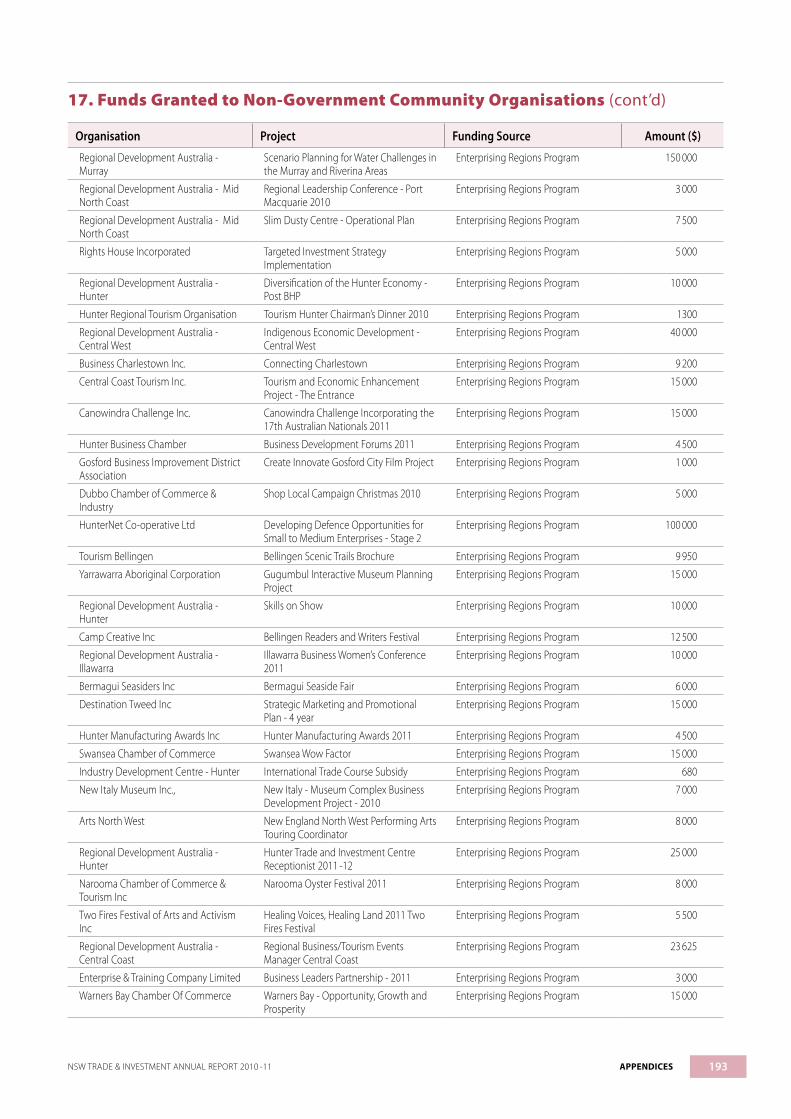
Organisation Project Funding Source Amount ($)
Regional Development Australia - Murray
Scenario Planning for Water Challenges in the Murray and Riverina Areas
Enterprising Regions Program 150 000
Regional Development Australia - Mid North Coast
Regional Leadership Conference - Port Macquarie 2010
Enterprising Regions Program 3 000
Regional Development Australia - Mid North Coast
Slim Dusty Centre - Operational Plan Enterprising Regions Program 7 500
Rights House Incorporated Targeted Investment Strategy Implementation
Enterprising Regions Program 5 000
Regional Development Australia - Hunter
Diversification of the Hunter Economy - Post BHP
Enterprising Regions Program 10 000
Hunter Regional Tourism Organisation Tourism Hunter Chairman’s Dinner 2010 Enterprising Regions Program 1300
Regional Development Australia - Central West
Indigenous Economic Development - Central West
Enterprising Regions Program 40 000
Business Charlestown Inc. Connecting Charlestown Enterprising Regions Program 9 200
Central Coast Tourism Inc. Tourism and Economic Enhancement Project - The Entrance
Enterprising Regions Program 15 000
Canowindra Challenge Inc. Canowindra Challenge Incorporating the 17th Australian Nationals 2011
Enterprising Regions Program 15 000
Hunter Business Chamber Business Development Forums 2011 Enterprising Regions Program 4 500
Gosford Business Improvement District Association
Create Innovate Gosford City Film Project Enterprising Regions Program 1 000
Dubbo Chamber of Commerce & Industry
Shop Local Campaign Christmas 2010 Enterprising Regions Program 5 000
HunterNet Co-operative Ltd Developing Defence Opportunities for Small to Medium Enterprises - Stage 2
Enterprising Regions Program 100 000
Tourism Bellingen Bellingen Scenic Trails Brochure Enterprising Regions Program 9 950
Yarrawarra Aboriginal Corporation Gugumbul Interactive Museum Planning Project
Enterprising Regions Program 15 000
Regional Development Australia - Hunter
Skills on Show Enterprising Regions Program 10 000
Camp Creative Inc Bellingen Readers and Writers Festival Enterprising Regions Program 12 500
Regional Development Australia - Illawarra
Illawarra Business Women’s Conference 2011
Enterprising Regions Program 10 000
Bermagui Seasiders Inc Bermagui Seaside Fair Enterprising Regions Program 6 000
Destination Tweed Inc Strategic Marketing and Promotional Plan - 4 year
Enterprising Regions Program 15 000
Hunter Manufacturing Awards Inc Hunter Manufacturing Awards 2011 Enterprising Regions Program 4 500
Swansea Chamber of Commerce Swansea Wow Factor Enterprising Regions Program 15 000
Industry Development Centre - Hunter International Trade Course Subsidy Enterprising Regions Program 680
New Italy Museum Inc., New Italy - Museum Complex Business Development Project - 2010
Enterprising Regions Program 7 000
Arts North West New England North West Performing Arts Touring Coordinator
Enterprising Regions Program 8 000
Regional Development Australia - Hunter
Hunter Trade and Investment Centre Receptionist 2011 -12
Enterprising Regions Program 25 000
Narooma Chamber of Commerce & Tourism Inc
Narooma Oyster Festival 2011 Enterprising Regions Program 8 000
Two Fires Festival of Arts and Activism Inc
Healing Voices, Healing Land 2011 Two Fires Festival
Enterprising Regions Program 5 500
Regional Development Australia - Central Coast
Regional Business/Tourism Events Manager Central Coast
Enterprising Regions Program 23 625
Enterprise & Training Company Limited Business Leaders Partnership - 2011 Enterprising Regions Program 3 000
Warners Bay Chamber Of Commerce Warners Bay - Opportunity, Growth and Prosperity
Enterprising Regions Program 15 000
193NSW TRADE & INVESTMENT ANNUAL REPORT 2010 -11 APPENDICES
17. Funds Granted to Non-Government Community Organisations (cont’d)

Organisation Project Funding Source Amount ($)
Regional Development Australia - Northern Rivers
Broadband Needs and Services Survey for Critical Industries in the Northern Rivers
Enterprising Regions Program 5 000
Karuah Chamber of Commerce Incorporated
Karuah Sustainable Events and Tourism Strategy
Enterprising Regions Program 13 635
Lake Macquarie Floatilla of Lights Incorporated
Hunter Region Floatilla of Lights Festival Marketing Strategy
Enterprising Regions Program 1 750
Inland NSW Tourism Awards Inc Electronic Awards Enterprising Regions Program 1 250
Regional Development Australia - Central Coast
Participation at Aspen Shortsfest 2011 Enterprising Regions Program 2 000
The Milparinka Heritage & Tourism Association Inc
Corner Country Tourism Marketing 2010 -11
Enterprising Regions Program 3 000
Newcastle Port Corporation 2011 Cruise Down Under Conference - Taste of the Hunter Showcase
Enterprising Regions Program 1 500
SustainableNorfolk.com Norfolk Island Community Economic Transition Project
Enterprising Regions Program 14 610
Hunter Valley Wine Industry Association Regional Heroes Foundation Partnership Program 2011
Enterprising Regions Program 7 500
Nelson Bay Town Management Inc Nelson Bay Sculptures By The Bay Festival Enterprising Regions Program 5 500
Tourism Shellharbour Tourism Shellharbour Strategic Marketing & Action Plan
Enterprising Regions Program 5 000
Parkes Under the Stars Opera at The Dish 2011 Enterprising Regions Program 7 000
Intereach NSW Inc Deniliquin - The Country Store marketing project
Enterprising Regions Program 7 500
Regional Development Australia - Far West
Regional Development Australia - Far West - Scenario planning for Water Changes
Enterprising Regions Program 30 000
Regional Development Australia - Murray
National Manufacturing Week 2011 Enterprising Regions Program 10 000
The Milparinka Heritage & Tourism Association Inc
Corner Country Famil 2011 Enterprising Regions Program 3 500
Harden Murrumburrah & District Chamber of Commerce & Industry
Harden Murrumburrah Business Awards 2011 -12
Enterprising Regions Program 5 000
Regional Development Australia - Hunter
Hunter Central Coast Innovation Festival 2011
Enterprising Regions Program 26 200
Hunter Valley Wine Industry Association 2011 Hunter Valley Wine Industry & Legends Awards Dinner
Enterprising Regions Program 1 000
Regional Development Australia - Central Coast
Central Coast Marine Discovery Centre Ex-HMAS Adelaide Displays
Enterprising Regions Program 8 000
Regional Development Australia - Northern Rivers
2011 North Coast Energy Forum Enterprising Regions Program 2 500
Regional Development Australia - Central Coast
Devil Ark Prospectus Enterprising Regions Program 10 000
Regional Development Australia - Illawarra
Innovation Festival Event - 2011 Enterprising Regions Program 7 000
Uralla Arts Council Incorporated Promotional / Marketing - 2008 - Arts Festival
Enterprising Regions Program 9 000
Gowest - a Regional Development Board
Regional Streaming Video Promotion Enterprising Regions Program 2 000
Regional Development Australia - Central West
Central Western Investment Prospectus Enterprising Regions Program 44 801
Regional Development Australia - Mid North Coast
North Coast Innovation Festival 2010 Enterprising Regions Program 25000
Regional Development Australia - Hunter
Hunter National Broadband Network Project
Enterprising Regions Program 17 850
Regional Development Australia - Northern Inland
Marketing & Development of the Northern Inland Food & Wine Industry
Enterprising Regions Program 10 000
194 APPENDICES NSW TRADE & INVESTMENT ANNUAL REPORT 2010 -11
17. Funds Granted to Non-Government Community Organisations (cont’d)

Organisation Project Funding Source Amount ($)
Regional Development Australia - Illawarra
Economic Gardening - Illawarra 2010 Enterprising Regions Program 55 871
Regional Development Australia - Northern Inland
Business Life Cycle Challenge 2010 - Pilot Enterprising Regions Program 30 000
Regional Development Australia - Hunter
Hunter Central Coast Innovation Festival 2010
Enterprising Regions Program 5 000
Regional Development Australia - Sydney Inc
Organisation for Economic Cooperation and Development, Climate Change, Employment & Local Development Project
Enterprising Regions Program 10 000
Regional Development Australia - Sydney Inc
Employment of Project staff Enterprising Regions Program 200 000
Regional Development Australia - Central Coast
Central Coast Bears sustainable business case for National Rugby League licence
Enterprising Regions Program 50 000
Regional Development Australia - Central Coast
Regional Economic Development and Employment Strategy Projects, Stage 1
Enterprising Regions Program 60 000
Regional Development Australia - Hunter
Wallsend Accommodation and Tourism Audit
Enterprising Regions Program 20 000
Regional Development Australia - Hunter
Williamtown Aerospace Centre Marketing - Stage 2
Enterprising Regions Program 49 000
Regional Development Australia - Murray
Outreach Services Funding - River Redgum Region July 2010
Enterprising Regions Program 30 000
Regional Development Australia - Hunter
National Broadband Network Project for the Hunter and Central Coast Phase 2
Enterprising Regions Program 60 500
Regional Development Australia - Central Coast
Pride in the Central Coast (Stage 4 - Regional Identity)
Enterprising Regions Program 110 000
Regional Development Australia - Hunter
Australian Association of Angel Investors Conference
Enterprising Regions Program 45 000
Regional Development Australia - Hunter
Cruise Ship Terminal Site Feasibility Study Enterprising Regions Program 27 500
Capital Region BEC (formerly Queanbeyan Enterprise Centre Incorporated)
Queanbeyan Business Excellence Awards Enterprising Regions Program 2 500
Agrifood Skills Council Project Officer 2009 Enterprising Regions Program 40 000
Regional Development Australia - Far West
RDA Far West Regional Leadership Advisory Network
Enterprising Regions Program 6 000
Wyong Regional Chamber of Commerce
Business Development - 2007 - advancing Wyong 2007
Main Street / Small Towns 24 100
North Sydney Chamber Of Commerce Incorporated
Harbourside Chamber Group Networks 3 750
Regional Development Australia - Orana
Rural, Regional & Remote Australian National Forum - Dubbo 2010
Regional Development Board Innovation Program
10 000
Regional Development Australia - Central Coast
Central Coast Business Showcase Regional Development Board Innovation Program
20000
Regional Development Australia - Orana
Country & Regional Living Expo 2010 Regional Development Board Innovation Program
10 000
Regional Development Australia - Central West
Newton’s Nation Road Trip Regional Development Board Innovation Program
4 964
Regional Development Australia - Illawarra
State of the Illawarra - Regional Leaders Summit 2010
Regional Development Board Innovation Program
8 000
Regional Development Australia - Murray
Murray Now : Economic Development Modelling
Regional Development Board Innovation Program
6 700
Regional Development Australia - Murray
Infrastructure Working Group - Nov 2010 Regional Development Board Innovation Program
5 000
Central Coast Economic Development Board
Replacement of Content Management Systems Central Coast Tourism 2009
Regional Development Board Innovation Program
7 854
195NSW TRADE & INVESTMENT ANNUAL REPORT 2010 -11 APPENDICES
17. Funds Granted to Non-Government Community Organisations (cont’d)
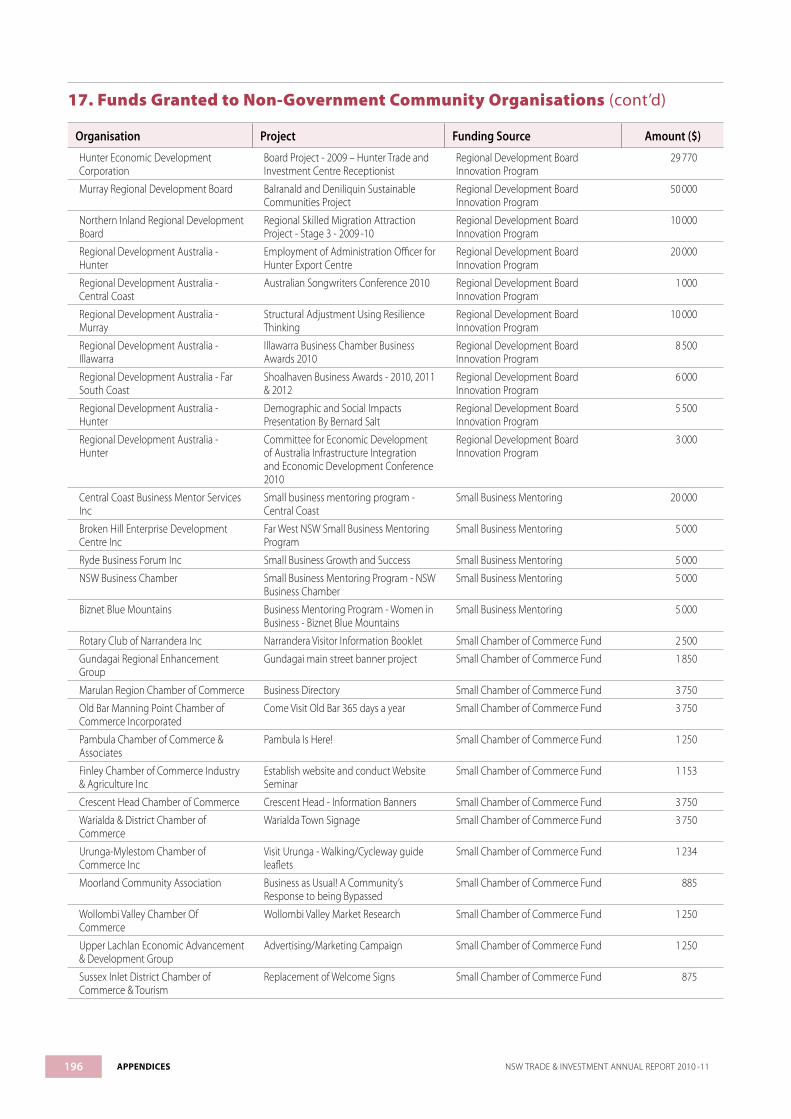
Organisation Project Funding Source Amount ($)
Hunter Economic Development Corporation
Board Project - 2009 – Hunter Trade and Investment Centre Receptionist
Regional Development Board Innovation Program
29 770
Murray Regional Development Board Balranald and Deniliquin Sustainable Communities Project
Regional Development Board Innovation Program
50 000
Northern Inland Regional Development Board
Regional Skilled Migration Attraction Project - Stage 3 - 2009 -10
Regional Development Board Innovation Program
10 000
Regional Development Australia - Hunter
Employment of Administration Officer for Hunter Export Centre
Regional Development Board Innovation Program
20 000
Regional Development Australia - Central Coast
Australian Songwriters Conference 2010 Regional Development Board Innovation Program
1 000
Regional Development Australia - Murray
Structural Adjustment Using Resilience Thinking
Regional Development Board Innovation Program
10 000
Regional Development Australia - Illawarra
Illawarra Business Chamber Business Awards 2010
Regional Development Board Innovation Program
8 500
Regional Development Australia - Far South Coast
Shoalhaven Business Awards - 2010, 2011 & 2012
Regional Development Board Innovation Program
6 000
Regional Development Australia - Hunter
Demographic and Social Impacts Presentation By Bernard Salt
Regional Development Board Innovation Program
5 500
Regional Development Australia - Hunter
Committee for Economic Development of Australia Infrastructure Integration and Economic Development Conference 2010
Regional Development Board Innovation Program
3 000
Central Coast Business Mentor Services Inc
Small business mentoring program - Central Coast
Small Business Mentoring 20 000
Broken Hill Enterprise Development Centre Inc
Far West NSW Small Business Mentoring Program
Small Business Mentoring 5 000
Ryde Business Forum Inc Small Business Growth and Success Small Business Mentoring 5 000
NSW Business Chamber Small Business Mentoring Program - NSW Business Chamber
Small Business Mentoring 5 000
Biznet Blue Mountains Business Mentoring Program - Women in Business - Biznet Blue Mountains
Small Business Mentoring 5 000
Rotary Club of Narrandera Inc Narrandera Visitor Information Booklet Small Chamber of Commerce Fund 2 500
Gundagai Regional Enhancement Group
Gundagai main street banner project Small Chamber of Commerce Fund 1 850
Marulan Region Chamber of Commerce Business Directory Small Chamber of Commerce Fund 3 750
Old Bar Manning Point Chamber of Commerce Incorporated
Come Visit Old Bar 365 days a year Small Chamber of Commerce Fund 3 750
Pambula Chamber of Commerce & Associates
Pambula Is Here! Small Chamber of Commerce Fund 1 250
Finley Chamber of Commerce Industry & Agriculture Inc
Establish website and conduct Website Seminar
Small Chamber of Commerce Fund 1 153
Crescent Head Chamber of Commerce Crescent Head - Information Banners Small Chamber of Commerce Fund 3 750
Warialda & District Chamber of Commerce
Warialda Town Signage Small Chamber of Commerce Fund 3 750
Urunga-Mylestom Chamber of Commerce Inc
Visit Urunga - Walking/Cycleway guide leaflets
Small Chamber of Commerce Fund 1 234
Moorland Community Association Business as Usual! A Community’s Response to being Bypassed
Small Chamber of Commerce Fund 885
Wollombi Valley Chamber Of Commerce
Wollombi Valley Market Research Small Chamber of Commerce Fund 1 250
Upper Lachlan Economic Advancement & Development Group
Advertising/Marketing Campaign Small Chamber of Commerce Fund 1 250
Sussex Inlet District Chamber of Commerce & Tourism
Replacement of Welcome Signs Small Chamber of Commerce Fund 875
196 APPENDICES NSW TRADE & INVESTMENT ANNUAL REPORT 2010 -11
17. Funds Granted to Non-Government Community Organisations (cont’d)

Organisation Project Funding Source Amount ($)
Tilba District Chamber of Commerce Information Plaques on Historical Buildings
Small Chamber of Commerce Fund 750
Brewarrina Enterprise Alliance Mural/Sculpture Tour Small Chamber of Commerce Fund 3 750
Cobar Business Association Inc Cobar Online Business Directory Small Chamber of Commerce Fund 3 166
Camden Haven Chamber of Commerce Industry & Tourism Inc
Pole Mounted CBD banners Small Chamber of Commerce Fund 1 175
Urunga-Mylestom Chamber of Commerce Inc
Visit Urunga Canvas Banners Small Chamber of Commerce Fund 3 715
Tenterfield & District Business Association Inc
Economy Booster Support Local Tenterfield Businesses
Small Chamber of Commerce Fund 3 750
Woodenbong Progress Association A3 Business Directory Small Chamber of Commerce Fund 1 248
Nabiac Memorial Neighbourhood Centre Inc
Nabiac Information & Promotional Signage
Small Chamber of Commerce Fund 2 670
Morpeth Business Association Marketing Morpeth Small Chamber of Commerce Fund 3 605
Hillston Development Group Shop Local Campaign Small Chamber of Commerce Fund 2 400
Ariah Park Community Projects Inc To improve promotion and welcome signage for Ariah Park
Small Chamber of Commerce Fund 3 750
Tilligerry Peninsula Chamber of Commerce
Tilligerry Marketing Plan Small Chamber of Commerce Fund 5 000
Gloucester Chamber of Commerce Meeting Customer Needs in Retail Services workshops - Bulahdelah & Gloucester
Small Chamber of Commerce Fund 1 750
Eden Chamber of Commerce Marketing Cruise Eden Small Chamber of Commerce Fund 3 750
Scone Chamber of Commerce Business Website Small Chamber of Commerce Fund 3 683
Myall Coast Chamber of Commerce and Tourism
Myall Coast Website Small Chamber of Commerce Fund 5 000
Lower Lachlan Community Services Inc Lake Cargelligo Business and Community Bulletin Board
Small Chamber of Commerce Fund 500
Lower Lachlan Community Services Inc Lake Cargelligo Business and Community Directory
Small Chamber of Commerce Fund 500
Berry Chamber of Commerce Showcasing Berry on the Web Small Chamber of Commerce Fund 3 750
Balranald Inc Balranald Online Small Chamber of Commerce Fund 3 750
White Cliffs Opal Fields Tourist Association Inc
White Cliffs Information Bay Signs Small Chamber of Commerce Fund 2 665
Brunswick Heads Chamber of Commerce
Marketing Small Business Using Social Media
Small Chamber of Commerce Fund 3 750
Nimbin Community Development Association Inc
www.nimbin.nsw.au website Small Chamber of Commerce Fund 3 750
Bellingen Chamber of Commerce Bellingen Economic Development Plan 2010
Small Chamber of Commerce Fund 3 750
Trundle Village Progress Association Trundle Getz to Shop Local Small Chamber of Commerce Fund 5 000
Dorrigo Chamber of Commerce Dorrigo Economic Development Plan 2 Small Chamber of Commerce Fund 3 750
Bulahdelah Chamber Of Commerce & Tourism Inc
Bulahdelah Businesses Working Together Small Chamber of Commerce Fund 3 750
Capertee Valley Alliance Inc Capertee Valley web Site Development Small Chamber of Commerce Fund 3 750
Scone Chamber of Commerce Into the Future - Scone Networking & Skills Expansion Program
Small Chamber of Commerce Fund 3 750
Urunga-Mylestom Chamber of Commerce Inc
Economic Development Plan Small Chamber of Commerce Fund 3 750
Harrington Crowdy Head Chamber of Commerce, Industry and Tourism Inc
Harrington....off the highway to another world
Small Chamber of Commerce Fund 5 000
Wingham Chamber of Commerce Wingham Business Community Marketing Plan
Small Chamber of Commerce Fund 3 750
197NSW TRADE & INVESTMENT ANNUAL REPORT 2010 -11 APPENDICES
17. Funds Granted to Non-Government Community Organisations (cont’d)

Organisation Project Funding Source Amount ($)
Glen Innes Severn Tourist Association Incorporated
Semi trailer Advertising Glen Innes Severn area/website
Small Chamber of Commerce Fund 5 000
Bogan Community Tourism & Business Group Incorporated
‘Bogan Day Out’ Festival Marketing Campaign
Small Chamber of Commerce Fund 3 750
Quirindi Chamber of Commerce Industry and Tourism Inc
Quirindi Business Promotion - Shop Locally 2011
Small Chamber of Commerce Fund 5 000
NSW Enterprise Workshop 2010 NSW Enterprise Workshop Program Stepping Up 12 000
Wagga Wagga Business Enterprise Centre Ltd
Business Mentoring Program Stepping Up 20 000
Ace North Coast Inc Northern Rivers Business Mentoring Program Tweed Heads
Stepping Up 20 000
Ace North Coast Inc Northern Rivers Business Mentoring Program Lismore
Stepping Up 20 000
Business Women Connect 2010 Central Coast Women in Business Awards
Strategic Partnerships Program 750
Gloucester Chamber of Commerce Gloucester Business Awards 2010 Strategic Partnerships Program 550
Warringah Chamber of Commerce Linda Hailey Key Note Speaker Sydney Economic Development Projects
2 500
Regional Development Australia - Sydney Inc
Western Sydney Manufacturing Leaders Forum 2011
Sydney Economic Development Projects
25 000
Warringah Chamber of Commerce Key note Speaker Carol Skyring Sydney Economic Development Projects
1 500
The Eastern Suburbs Business Enterprise Centre
Business Mentoring Program - Women in Business - Eastern Suburbs
Women in Business (WIB) 5 000
Hunter Business Centre Ltd Business Mentoring Program - Women in Business - Hunter 2011
Women in Business (WIB) 5 000
Armidale & District Business Enterprise Centre Ltd
Business Mentoring Program - Women in Business - Armidale
Women in Business (WIB) 5 000
Armidale & District Business Enterprise Centre Ltd
Business Mentoring Program - Women in Business - Tamworth
Women in Business (WIB) 5 000
Summit Employment and Training Business Mentoring Program - Women in Business - Griffith
Women in Business (WIB) 5 000
Parkes Forbes Enterprise Development Centre Inc
Business Mentoring Program - Women in Business Stream - Dubbo
Women in Business (WIB) 5 000
Murray Hume Business Enterprise Centre Inc
Business Mentoring Program - Women in Business
Women in Business (WIB) 5 000
Penrith City & District Business Advisory Centre Limited
Young Entrepreneurs Business Mentoring Program
Youth Programs 5 000
NSW Office of WaterNo funds were granted
Arts NSW
ConnectEd Arts
Organisation Purpose/Program Name Funding $
Albury City Council ‘The Games We Play’ 8 300
Albury City Council for Albury Entertainment Centre
travel and ticket subsidies for Chicago Shakespeare Company’s ‘Funk it up About Nothin’ and Queensland Arts Council’s ‘statespeare’
3 200
Australian Theatre for Young People an Indigenous Arts Camp ($40 000); Artists in Schools Residency Programs - ‘Plugged In’ (Working Title) ($30 000)
70 000
Bangarra Dance Theatre Australia Ltd an Indigenous Youth Performance Program ($30 000); attendance by Indigenous students at performances of ‘Belong’ at the Sydney Opera House ($4 950)
34 950
198 APPENDICES NSW TRADE & INVESTMENT ANNUAL REPORT 2010 -11
17. Funds Granted to Non-Government Community Organisations (cont’d)

Organisation Purpose/Program Name Funding $
Bathurst Regional Council for Bathurst Memorial Entertainment Centre
Bathurst Memorial Entertainment Centre’s Performing Arts Education Program ($15 000); travel/ticket subsidy for students attending performances at Bathurst Memorial Entertainment Centre ($3 200)
18 200
Bundanon Trust the Adopt a School Program ($20 000); the Bundanon Regional Schools Program ($4 750)
24 750
Cessnock Regional Art Gallery travel subsidies for schools to visit the gallery 3 000
Dubbo City Council for Western Plains Cultural Centre
ARTEXPRESS exhibition/senior drawing workshop attendance 3 200
Griffith City Council for Griffith Regional Theatre
‘Anyone Can Impro’ ($15 000); Art & Shows for Kids 2011 ($5 000) 20 000
Illawarra Performing Arts Centre Ltd ‘Passport to Performance’ 5 000
Lake Macquarie City Council for Lake Macquarie City Art Gallery
‘Bridging Cultures’ ($31 550); the schools and education component of ‘Wrapped in a Possum Skin Cloak by the Lake’ ($12 900)
44 450
Monkey Baa Theatre for Young People Ltd ‘Dubbo Takes the Stage’ ($6 500); production costs for the 2011 ‘Emily Eyefinger’ tour ($40 000); the RIPPA Regional and Rural Workshop Program - Part 2 ($20 100)
66 600
Moorambilla Voices Limited 2011 program funding 26 000
Musica Viva Australia the Bega Valley Extended Residency Project 30 000
National Aboriginal Islander Skills Development Association Inc
the Aboriginal Talent Identification Residency Program in dance at the National Centre for Indigenous Excellence, Redfern
50 000
NSW Department of Education and Training the administration of the Artists in Schools - Individual Residencies program ($113 000) and travel and accommodation for artists and teachers involved in the forum ($2 000); the administration of the Artists in Schools - Individual Residencies program ($52 000) and 7 schools travel to Casula Powerhouse ($9 065); travel subsidies, teacher relief and administration costs for the ATYP Indigenous Drama Camp ($20 000) and the Creative Education Partnerships professional development forum ($15 000)
211 065
Opera Australia WotOpera 2011 15 000
Orange City Council for Orange Civic Theatre Local folklore and puppetry workshops ($15 000); the 2011 Orange Civic Theatre Access Program ($5 000)
20 000
Outback Theatre for Young People ‘Alive and Kicking’, Stage Two ($20 000); ‘starting from Scratch’, Stage Two ($20 000)
40 000
Parramatta City Council for Riverside Theatres the disability project, ‘Beyond the Square’ 26 222
Penrith Performing and Visual Arts Ltd the Nepean project 35 000
PlayWriting Australia student visits to the National Play Festival 2011 5 000
Powerhouse Youth Theatre Inc PYT School Shorts 6 000
Sutherland Shire Council for Hazelhurst Regional Gallery and Arts Centre
FROM ART TO WEB, Visual Arts to Visual Art Gallery 25 000
Tantrum Theatre Co-operative Ltd the ‘As You Like It’ performance workshop tour ($14 878); the Throsby Theatre Project ($32 385)
47 263
The Performance Space Ltd the 2011 Teachers’ Club 8 000
Tweed Shire Council for Tweed River Regional Art Gallery
travel subsidies for schools to visit the Tweed River Art Gallery 3 200
University of Wollongong More than an Overture 25 000
Wagga Wagga City Council for Wagga Wagga Civic Theatre
Wagga Wagga Civic Theatre Access Program 15 000
TOTAL 889 400
199NSW TRADE & INVESTMENT ANNUAL REPORT 2010 -11 APPENDICES
17. Funds Granted to Non-Government Community Organisations (cont’d)

Fellowships and Scholarships
Organisation Purpose/Program Name Funding $
Lauren Brincat 2009 Helen Lempriere Travelling Art Scholarship [Visual Arts and Craft Strategy $20 000]
30 000
Pauline Curby 2010 History Fellowship: a study of changing attitudes to capital punishment in NSW between 1915 and 1939
20 000
Karla Dickens 2010 Indigenous Arts Fellowship: the translation of the language of the Rabbit: Home is where the Rabbits Live
15 000
Ceridwen Dovey 2010 Writer’s Fellowship: a collection of short stories focused on the interactions between human beings and non-human animals in situations of political conflict or violence
20 000
Robert Evitt 2010 Indigenous History Fellowship: Aboriginal knowledge, fire, and climate change in New South Wales
20 000
Agatha Gothe-Snape the 2011 Women and Arts Fellowship: researching, developing and staging ‘Every Artist Remembered’ at ACCA in Victoria
30 000
Dr Amanda Kaladelfos 2010 NSW Archival Research Fellowship: an examination of capital punishment in NSW between 1855 and 1939: ‘The Road to the Scaffold’
15 000
Emily Maguire 2011 Writer’s Fellowship: ‘Fishing for Tigers’: a novel set amongst the louche world of Hanoi’s expatriate community and the wealthy, isolated cities of Australia.
20 000
Jane McKernan 2010 Robert Helpmann Scholarship: a program of professional research and skills development in Europe
30 000
Museum of Applied Arts and Sciences 2011 NSW Design Travelling Scholarship ($18 000) and management costs ($7 000)
25 000
Khaled Sabsabi 2010 Helen Lempriere Travelling Art Scholarship (Visual Arts and Craft Strategy): a profesional development residency in Beirut, Lebanon
30 000
Rosie Tsarpalias 2011 Rex Cramphorn Scholarship - research, develop and test a participatory performance model that is open, sustainable and portable with young people in Menindee, Arlaparra (NT) and Bankstown
30 000
TOTAL 285 000
Indigenous Strategic Projects
Organisation Purpose/Program Name Funding $
Art Gallery of New South Wales a NSW Aboriginal Art Education Kit ($25 000); the NSW Aboriginal Visual Arts Industry Induction Program ($106 000)
131 000
Arts Northern Rivers Inc the ‘Fabric Of Our Culture’ project 12 650
Australian Dance Council - Ausdance (NSW) Inc
the NSW Indigenous Dance Forum 2011 50 000
Bangarra Dance Theatre Australia Ltd year 1 of triennial funding towards the Indigenous Employment Program (2011-13)
100 000
Beyond Empathy Ltd year 1 of triennial funding (2011-13) for the Better Factory Enterprise Strategy, Bowraville NSW
100 000
Biennale of Sydney a NSW Aboriginal Professional Development Program 72 750
Boolarng Nangamai Aboriginal Corporation participation in the Beauval Indigenous Cultural Exchange, Saskatchewan, Canada
10 000
Bundanon Trust Aroha Groves: In residence at Bundanon and trialling ‘how to make and exhibit virtual art’ workshop with local students
6 450
Gadigal Information Service Aboriginal Corporation
Klub Koori 25 000
Grafton Artsfest Inc the ‘Exploring Our Stories’ project 4 600
Great Lakes Community Resources Inc the ‘Cool Kids Are Hot’ Cultural Art Program 14 200
History Council of NSW Inc a mentor for the 2010 Indigenous History Award recipient (Robert Evitt) 5 000
Melbourne International Comedy Festival Ltd the development of Deadly Funny’s NSW program 12 000
Moorambilla Voices Limited ‘Carvin’ it up’: the Ngemba Wailwan artists and Moorambilla Voices project (MV2011)
15 000
200 APPENDICES NSW TRADE & INVESTMENT ANNUAL REPORT 2010 -11
17. Funds Granted to Non-Government Community Organisations (cont’d)
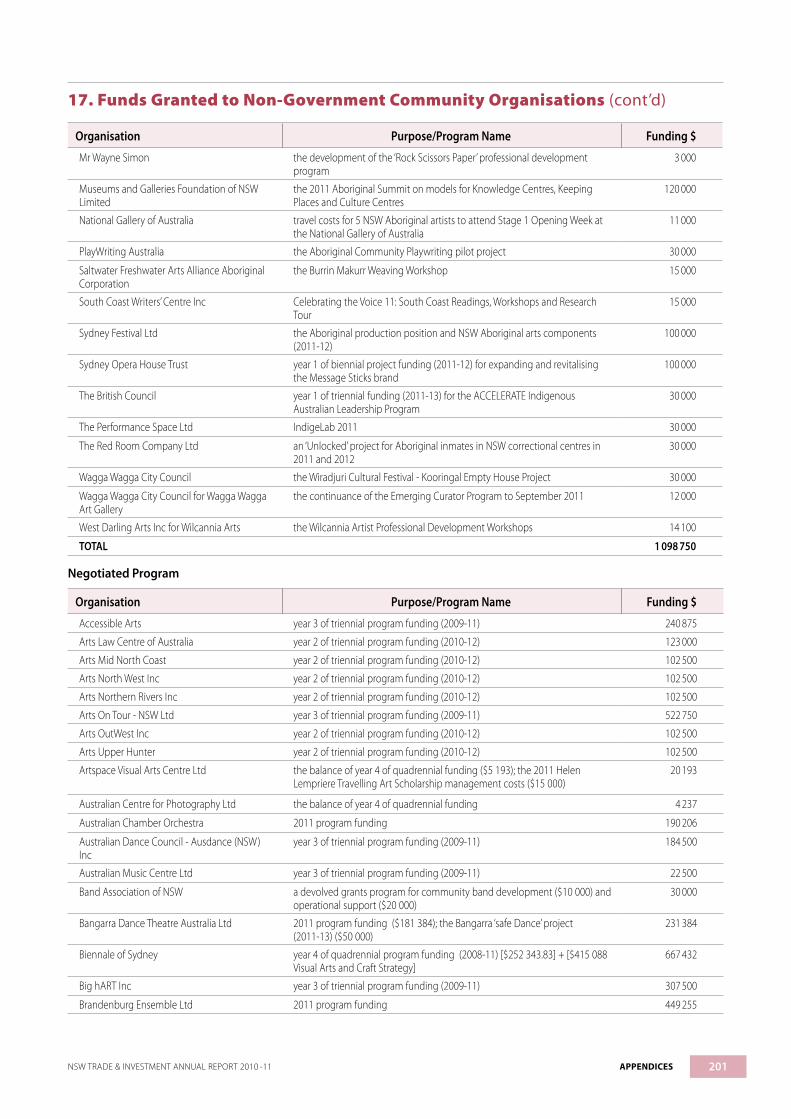
Organisation Purpose/Program Name Funding $
Mr Wayne Simon the development of the ‘Rock Scissors Paper’ professional development program
3 000
Museums and Galleries Foundation of NSW Limited
the 2011 Aboriginal Summit on models for Knowledge Centres, Keeping Places and Culture Centres
120 000
National Gallery of Australia travel costs for 5 NSW Aboriginal artists to attend Stage 1 Opening Week at the National Gallery of Australia
11 000
PlayWriting Australia the Aboriginal Community Playwriting pilot project 30 000
Saltwater Freshwater Arts Alliance Aboriginal Corporation
the Burrin Makurr Weaving Workshop 15 000
South Coast Writers’ Centre Inc Celebrating the Voice 11: South Coast Readings, Workshops and Research Tour
15 000
Sydney Festival Ltd the Aboriginal production position and NSW Aboriginal arts components (2011-12)
100 000
Sydney Opera House Trust year 1 of biennial project funding (2011-12) for expanding and revitalising the Message Sticks brand
100 000
The British Council year 1 of triennial funding (2011-13) for the ACCELERATE Indigenous Australian Leadership Program
30 000
The Performance Space Ltd IndigeLab 2011 30 000
The Red Room Company Ltd an ‘Unlocked’ project for Aboriginal inmates in NSW correctional centres in 2011 and 2012
30 000
Wagga Wagga City Council the Wiradjuri Cultural Festival - Kooringal Empty House Project 30 000
Wagga Wagga City Council for Wagga Wagga Art Gallery
the continuance of the Emerging Curator Program to September 2011 12 000
West Darling Arts Inc for Wilcannia Arts the Wilcannia Artist Professional Development Workshops 14 100
TOTAL 1 098 750
Negotiated Program
Organisation Purpose/Program Name Funding $
Accessible Arts year 3 of triennial program funding (2009-11) 240 875
Arts Law Centre of Australia year 2 of triennial program funding (2010-12) 123 000
Arts Mid North Coast year 2 of triennial program funding (2010-12) 102 500
Arts North West Inc year 2 of triennial program funding (2010-12) 102 500
Arts Northern Rivers Inc year 2 of triennial program funding (2010-12) 102 500
Arts On Tour - NSW Ltd year 3 of triennial program funding (2009-11) 522 750
Arts OutWest Inc year 2 of triennial program funding (2010-12) 102 500
Arts Upper Hunter year 2 of triennial program funding (2010-12) 102 500
Artspace Visual Arts Centre Ltd the balance of year 4 of quadrennial funding ($5 193); the 2011 Helen Lempriere Travelling Art Scholarship management costs ($15 000)
20 193
Australian Centre for Photography Ltd the balance of year 4 of quadrennial funding 4 237
Australian Chamber Orchestra 2011 program funding 190 206
Australian Dance Council - Ausdance (NSW) Inc
year 3 of triennial program funding (2009-11) 184 500
Australian Music Centre Ltd year 3 of triennial program funding (2009-11) 22 500
Band Association of NSW a devolved grants program for community band development ($10 000) and operational support ($20 000)
30 000
Bangarra Dance Theatre Australia Ltd 2011 program funding ($181 384); the Bangarra ‘safe Dance’ project (2011-13) ($50 000)
231 384
Biennale of Sydney year 4 of quadrennial program funding (2008-11) [$252 343.83] + [$415 088 Visual Arts and Craft Strategy]
667 432
Big hART Inc year 3 of triennial program funding (2009-11) 307 500
Brandenburg Ensemble Ltd 2011 program funding 449 255
201NSW TRADE & INVESTMENT ANNUAL REPORT 2010 -11 APPENDICES
17. Funds Granted to Non-Government Community Organisations (cont’d)

Organisation Purpose/Program Name Funding $
CarriageWorks Ltd year 1 of triennial funding (2011-13) 1 500 000
Company B Ltd 2011 program funding , including pay parity ($320 000) 936 135
Critical Path year 3 of triennial program funding (2009-11) 256 250
d/Lux Media Arts Incorporated year 3 of triennial program funding (2009-11) [$41 078 + Visual Arts and Craft Strategy $26 608]
67 686
Eastern Riverina Arts Inc year 2 of triennial program funding (2010-12) 102 500
Flying Fruit Fly Foundation Ltd year 3 of triennial program funding (2009-11) 225 500
Griffith City Council for Western Riverina Arts Inc
year 1 of the establishment of a Regional Arts Board for the Leeton, Narrandera and Griffith Council areas (2011-12)
100 000
Local Government and Shires Associations of NSW
year 1 of triennial program funding for the Local Government Cultural Development Program (2011-13)
110 000
Murray Arts Inc year 2 of triennial program funding (2010-12) 102 500
Museum of Contemporary Art the presentation of the 2011 Lloyd Rees Memorial Lecture ($5 000); year 1 of triennial program funding (2011-13) ($2 000 000)
2 005 000
Museums and Galleries Foundation of NSW Limited
year 3 of triennial program funding (2009-11) 1 099 000
Music NSW Incorporated year 3 of triennial program funding (2009-11) 125 050
Music NSW Incorporated for Indent year 2 of triennial funding for Indent (2010-12) 256 250
Musica Viva Australia 2011 program funding for Cafe Carnivale ($165 000); 2011 program funding for Musica Viva In Schools ($115 000); 2011 program funding ($383 821); the Newcastle series ($16 000)
679 821
National Association for the Visual Arts Ltd the 2011 devolved grants program and professional development support [Visual Arts and Craft Strategy]
66 000
New Music Network Inc the 2011 venue subsidy scheme 35 000
Object - Australian Centre for Craft and Design year 4 of quadrennial program funding (2008-11) [$461 875] + [$212 866 Visual Arts and Craft Strategy]
674 741
Opera Australia 2011 program funding 2 259 294
Orana Arts Inc year 2 of triennial program funding (2010-12) 102 500
Outback Arts Inc year 2 of triennial program funding (2010-12) 102 500
Regional Arts New South Wales Ltd year 3 of triennial program funding (2009-11) 543 250
Royal Australian Historical Society the 2011 devolved grants program 23 575
South East Arts Region (SEAR) Inc year 2 of triennial program funding (2010-12) 102 500
South West Arts Inc year 2 of triennial program funding (2010-12) 102 500
Southern Tablelands Arts (STARTS) Inc year 2 of triennial program funding (2010-12) 102 500
Sydney Dance Company 2011 program funding ($262 493); year 2 of triennial funding (2010-12) for two premiere seasons per year at the Sydney Theatre ($71 909)
334 402
Sydney Festival Ltd 2011 Sydney Festival ($4,530 000); part payment 2012 Sydney Festival ($762 155)
5 292 155
Sydney Symphony Orchestra Holdings Pty Ltd 2011 program funding 3 155 848
Sydney Theatre Company 2011 program funding ($355 307); year 1 of triennial funding for ‘The Residents’ (2011-13) ($700 000)
1 055 307
Sydney Writers’ Festival year 2 of triennial program funding (2010-12) 410 000
The Australian Ballet 2011 program funding 664 091
The Bell Shakespeare Company Ltd 2011 program funding ($60 5782); the 2011 regional NSW tour of ‘Julius Caesar’ ($11 7504)
723 286
The Performance Space Ltd the balance of year 4 of quadrennial funding (2008-11) [Visual Arts and Craft Strategy] ($157); year 2 of triennial program funding (2010-12) ($656 000)
656 157
The Sydney Film Festival year 2 of triennial program funding (2010-12) as per tripartite agreement 225 500
West Darling Arts Inc year 2 of triennial program funding (2010-12) 106 600
TOTAL 27 809 729
202 APPENDICES NSW TRADE & INVESTMENT ANNUAL REPORT 2010 -11
17. Funds Granted to Non-Government Community Organisations (cont’d)

NSW Premier’s History Awards
Organisation Purpose/Program Name Funding $
Dr Bain Attwood Australian History Prize: Possession: Batman’s Treaty and the Matter of History
15 000
Dr Lisa Ford Multimedia Prize: Settler Sovereignty: Jurisdiction and Indigenous People in America and Australia, 1788-1836
15 000
Bentley Dean Multimedia Prize: Contact 7 500
Martin Butler Multimedia Prize: Contact 7 500
Jackie French Young People Prize: The Night They Stormed Eureka 15 000
Pauline Curby History Prize: Randwick 15 000
TOTAL 75 000
NSW Premier’s Literary Awards
Organisation Purpose/Program Name Funding $
Patricia Cornelius Play Award: Do Not Go Gentle… 30 000
Cath Crowley Ethel Turner Prize: Graffiti Moon 30 000
Libby Gleeson Special Award 20 000
Debra Oswald Script Writing Award: Offspring: telemovie pilot 30 000
Jennifer Maiden Kenneth Slessor Prize: Pirate Rain 30 000
Sophie Masson Patricia Wrightson Prize: My Australian Story: The Hunt for Ned Kelly 30 000
Alex Miller Christina Stead Prize: Lovesong 40 000
Margaret Simons Book of the Year Award: Malcom Fraser: The Political Memoirs ($5 000); Douglas Stewart Prize: Malcolm Fraser: The Political Memoirs ($20 000)
25 000
Rt Hon Malcolm Fraser Book of the Year Award: Malcom Fraser: The Political Memoirs ($5 000); Douglas Stewart Prize: Malcolm Fraser: The Political Memoirs ($20 000)
25 000
TOTAL 260 000
Programs
Organisation Purpose/Program Name Funding $
Albury City Council for Albury Art Gallery 2011 program funding 15 000
Albury City Council for Albury Library/Museum 2011 program funding 20 000
Armidale & Region Aboriginal Cultural Centre & Keeping Place
year 1 of triennial program funding (2011-13) 55 000
Arts Inertia Inc 2011 program funding 15 000
Asian Australian Artists Association Inc year 2 of triennial program funding (2010-12) 133 250
At The Vanishing Point - Contemporary Art Inc 2011 program funding [Visual Arts and Craft Strategy] 25 000
Auburn Community Development Network Inc 2011 program funding 60 000
Australia Council the MAPS project - Year 2 ($50 000); year 1 of biennial funding for the NSW Manager Arts Support Australia (2010-11 & 2011-12) ($80 000)
130 000
Australian Poetry Limited 2011 program funding 40 000
Australian Script Centre Inc 2011 program funding 12 000
Australian Theatre for Young People 2011 program funding 87 550
Bankstown Youth Development Service Inc year 2 of triennial program funding (2010-12) 174 250
Bathurst Regional Council for Bathurst Memorial Entertainment Centre
2011 program funding 50 000
Bathurst Regional Council for Bathurst Regional Art Gallery
year 1 of triennial program funding (2011-13) 70 000
Blacktown City Council 2011 program funding for the Western Sydney Young People’s Literature Project
130 000
Blacktown City Council for Blacktown Arts Centre year 2 of triennial program funding (2010-12) 153 750
203NSW TRADE & INVESTMENT ANNUAL REPORT 2010 -11 APPENDICES
17. Funds Granted to Non-Government Community Organisations (cont’d)

Organisation Purpose/Program Name Funding $
Brand X Productions Incorporated 2011 program funding 40 000
Broken Hill City Council for Broken Hill Regional Art Gallery
year 1 of triennial program funding (2011-13) 45 000
Broken Hill City Council for Broken Hill Regional Writers’ Centre
2011 program funding 22 550
Camden Council 2011 program funding 20 000
Camden Haven Music Festival Inc 2011 program funding 9 000
Campbelltown City Council for Campbelltown Arts Centre
year 2 of triennial program funding (2010-12) 256 250
Central West Libraries for Central West Writers’ Centre
2011 program funding 30 250
Cessnock Regional Art Gallery 2011 program funding 40 000
Children’s Book Council of Australia (NSW) Inc 2011 program funding 12 000
Clarence Valley Council for Grafton Regional Gallery
2011 program funding 45 000
Cowra Shire Council for Cowra Art Gallery 2011 program funding 20 000
Critical Stages 2011 program funding 120 000
Darlinghurst Theatre Limited 2011 program funding 120 000
De Quincey Company Ltd 2011 program funding 90 000
Dubbo City Council for Western Plains Cultural Centre
year 1 of triennial program funding (2011-13) 65 000
Electrofringe Ltd 2011 program funding 30 000
Ensemble Offspring 2011 program funding 35 000
Events NSW for Wonderland Music Pty Ltd year 1 of triennial funding for Tropfest (2011-13) 20 000
Factory 49 Incorporated 2011 program funding 10 000
Fairfield City Council for Fairfield City Museum & Gallery
2011 program funding 40 000
First Draft Inc year 1 of triennial funding program (2011-13) [Visual Arts and Craft Strategy]
90 000
fLiNG Physical Theatre Inc 2011 program funding 50 000
Force Majeure Limited year 2 of biennial program funding (2010-11) 123 000
Forster Local Aboriginal Land Council for Tobwabba Art
2011 program funding 45 000
Gondwana Choirs Ltd year 2 of triennial program funding (2010-12) 123 000
Gosford City Council for Gosford Regional Gallery and Arts Centre
2011 program funding 25 000
Gosford City Council for Laycock Street and Peninsula Theatres
2011 program funding 15 000
Goulburn Mulwaree Council for Goulburn Regional Art Gallery
2011 program funding 50 000
Griffin Theatre Company Ltd 2011 program funding 225 000
Hawkesbury City Council for Hawkesbury Museum and Art Gallery
year 2 of triennial program funding (2010-12) 102 500
History Council of NSW Inc year 1 of triennial program funding (2011-13) 100 000
Horizon Theatre Company Ltd 2011 program funding 15 000
HotHouse Theatre Limited year 3 of triennial program funding (2009-11) 153 750
Hunter Writers’ Centre Inc 2011 program funding 35 200
Illawarra Performing Arts Centre Ltd 2011 program funding 65 000
Information and Cultural Exchange Inc year 3 of triennial program funding (2009-11) 307 500
Ironwood Chamber Ensemble 2011 program funding 12 000
204 APPENDICES NSW TRADE & INVESTMENT ANNUAL REPORT 2010 -11
17. Funds Granted to Non-Government Community Organisations (cont’d)

Organisation Purpose/Program Name Funding $
Lake Macquarie City Council for Lake Macquarie City Art Gallery
year 2 of triennial program funding (2010-12) 82 000
Legs on the Wall Inc year 1 of biennial program funding (2011-12) 165 000
Lismore City Council year 2 of Creative Enterprise Hub (2010-11& 2011-12) 50 000
Lismore City Council for Lismore Regional Gallery 2011 program funding 50 000
Liverpool City Council for Casula Powerhouse Arts Centre
2011 program funding 125 000
Maitland City Council for Maitland Regional Art Gallery
year 1 of triennial program funding (2011-13) 65 000
Manly Council for Manly Art Gallery and Museum 2011 program funding 30 000
Metro Migrant Resource Centre 2011 program funding 15 000
Monkey Baa Theatre for Young People Ltd 2011 program funding 100 000
Moorambilla Voices Limited 2011 program funding 49 000
MOP Projects Incorporated 2011 program funding [Visual Arts and Craft Strategy] 35 000
Moree Cultural Art Foundation Ltd for Moree Plains Gallery
2011 program funding 30 000
National Association for the Visual Arts Ltd the 2011 ‘We Are Here’ (WAH) Artist Run Initiative conference ($22 000); the development of a national business case and operational plan ($5 000)
27 000
National Young Writers’ Festival Inc 2011 program funding 24 000
New England Regional Art Museum Ltd 2011 program funding 20 000
New England Writers’ Centre Inc 2011 program funding 47 300
New Music Network Inc 2011 program funding 50 000
New South Wales Writers’ Centre Inc 2011 program funding 113 300
New Theatre (Sydney) Inc New Theatre Independent season 40 000
Newcastle City Council for Livesites 2011 program funding 40 000
Newcastle City Council for Newcastle Region Art Gallery
annual program funding 60 000
Newcastle City Council for The Loft Youth Arts & Cultural Centre
2011 program funding 36 000
Newcastle Historic Reserve Trust 2011 program funding 18 000
Northern Rivers Performing Arts Inc 2011 program funding 245 000
Northern Rivers Writers’ Centre Inc 2011 program funding ($60 500); the Byron Bay Writers Festival Screen Culture ($7 250)
67 750
Now Now Music Incorporated 2011 program funding 25 000
Open City Inc 2011 program funding 25 000
Opera North West Ltd 2011 program funding 20 000
Orange City Council for Orange Regional Gallery year 1 of triennial program funding (2011-13) 60 000
Orange City Council for Orange Regional Gallery year 1 of the strategic industry development of Curatorial/Collections Management Position (2011-13)
40 000
Outback Theatre for Young People 2011 program funding 70 000
Pacific Opera Company Limited 2011 program funding 20 000
PACT Centre for Emerging Artists year 1 of triennial program funding (2011-13) 75 000
Parramatta City Council year 2 of a Creative Enterprise Hub (2010-11& 2011-12) 50 000
Parramatta City Council for Parramatta Artists’ Studios
2011 program funding ($80 000); year 2 of the creative enterprise officer’s position ($35 875)
115 875
Peloton Inc 2011 program funding [Visual Arts and Craft Strategy] 30 000
Penrith Performing and Visual Arts Ltd year 1 of triennial program funding (2011-13) 350 000
Penrith Performing and Visual Arts Ltd year 1 of triennial funding for the ‘Mondo Project’ Producer/Curator position (2011-13)
50 000
205NSW TRADE & INVESTMENT ANNUAL REPORT 2010 -11 APPENDICES
17. Funds Granted to Non-Government Community Organisations (cont’d)
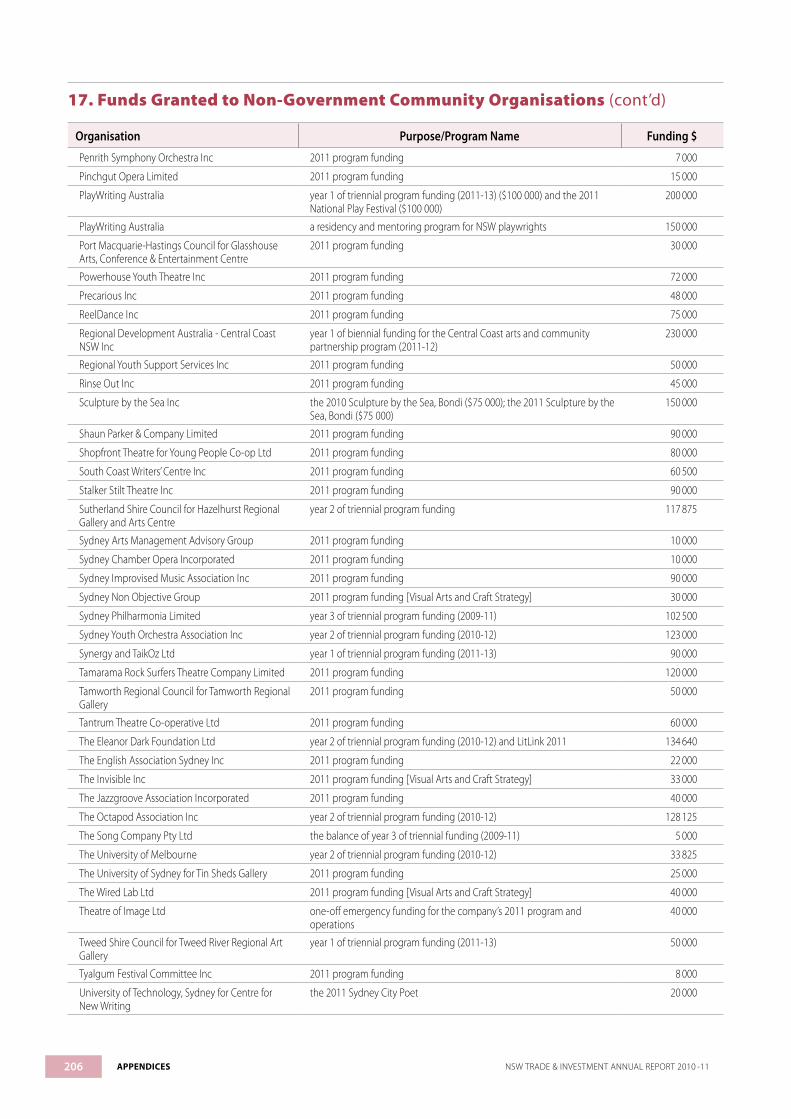
Organisation Purpose/Program Name Funding $
Penrith Symphony Orchestra Inc 2011 program funding 7 000
Pinchgut Opera Limited 2011 program funding 15 000
PlayWriting Australia year 1 of triennial program funding (2011-13) ($100 000) and the 2011 National Play Festival ($100 000)
200 000
PlayWriting Australia a residency and mentoring program for NSW playwrights 150 000
Port Macquarie-Hastings Council for Glasshouse Arts, Conference & Entertainment Centre
2011 program funding 30 000
Powerhouse Youth Theatre Inc 2011 program funding 72 000
Precarious Inc 2011 program funding 48 000
ReelDance Inc 2011 program funding 75 000
Regional Development Australia - Central Coast NSW Inc
year 1 of biennial funding for the Central Coast arts and community partnership program (2011-12)
230 000
Regional Youth Support Services Inc 2011 program funding 50 000
Rinse Out Inc 2011 program funding 45 000
Sculpture by the Sea Inc the 2010 Sculpture by the Sea, Bondi ($75 000); the 2011 Sculpture by the Sea, Bondi ($75 000)
150 000
Shaun Parker & Company Limited 2011 program funding 90 000
Shopfront Theatre for Young People Co-op Ltd 2011 program funding 80 000
South Coast Writers’ Centre Inc 2011 program funding 60 500
Stalker Stilt Theatre Inc 2011 program funding 90 000
Sutherland Shire Council for Hazelhurst Regional Gallery and Arts Centre
year 2 of triennial program funding 117 875
Sydney Arts Management Advisory Group 2011 program funding 10 000
Sydney Chamber Opera Incorporated 2011 program funding 10 000
Sydney Improvised Music Association Inc 2011 program funding 90 000
Sydney Non Objective Group 2011 program funding [Visual Arts and Craft Strategy] 30 000
Sydney Philharmonia Limited year 3 of triennial program funding (2009-11) 102 500
Sydney Youth Orchestra Association Inc year 2 of triennial program funding (2010-12) 123 000
Synergy and TaikOz Ltd year 1 of triennial program funding (2011-13) 90 000
Tamarama Rock Surfers Theatre Company Limited 2011 program funding 120 000
Tamworth Regional Council for Tamworth Regional Gallery
2011 program funding 50 000
Tantrum Theatre Co-operative Ltd 2011 program funding 60 000
The Eleanor Dark Foundation Ltd year 2 of triennial program funding (2010-12) and LitLink 2011 134 640
The English Association Sydney Inc 2011 program funding 22 000
The Invisible Inc 2011 program funding [Visual Arts and Craft Strategy] 33 000
The Jazzgroove Association Incorporated 2011 program funding 40 000
The Octapod Association Inc year 2 of triennial program funding (2010-12) 128 125
The Song Company Pty Ltd the balance of year 3 of triennial funding (2009-11) 5 000
The University of Melbourne year 2 of triennial program funding (2010-12) 33 825
The University of Sydney for Tin Sheds Gallery 2011 program funding 25 000
The Wired Lab Ltd 2011 program funding [Visual Arts and Craft Strategy] 40 000
Theatre of Image Ltd one-off emergency funding for the company’s 2011 program and operations
40 000
Tweed Shire Council for Tweed River Regional Art Gallery
year 1 of triennial program funding (2011-13) 50 000
Tyalgum Festival Committee Inc 2011 program funding 8 000
University of Technology, Sydney for Centre for New Writing
the 2011 Sydney City Poet 20 000
206 APPENDICES NSW TRADE & INVESTMENT ANNUAL REPORT 2010 -11
17. Funds Granted to Non-Government Community Organisations (cont’d)

Organisation Purpose/Program Name Funding $
University of Technology, Sydney for UTS Shopfront the development, management and hosting of the Empty Spaces website
40 000
Urban Theatre Projects Ltd 2011 program funding 150 000
Version 1.0 inc 2011 program funding 100 000
Vibewire Youth Services Inc 2011 program of activity and business development to address operational and governance structures
20 000
Wagga Wagga City Council for Museum of the Riverina
year 3 of triennial program funding (2009-11) 82 000
Wagga Wagga City Council for Wagga Wagga Art Gallery
year 2 of triennial program funding (2010-12) 51 250
Wagga Wagga Writers Writers Inc 2011 program funding 44 550
Waverley Council for Bondi Pavilion Community Cultural Centre
2011 program funding 38 000
Western Sydney Dance Action Incorporated 2011 program funding 160 000
Wollongong City Council for Wollongong City Gallery
2011 program funding 50 000
Wyong Neighbourhood Centre 2011 program funding 35 000
Youth Musical Endeavours Limited: SBS Youth Orchestra
2011 program funding 5 000
TOTAL 9 844 290
Projects
Organisation Purpose/Program Name Funding $
107 Projects Inc. for Ampersand the creation of Ampersand Magazine - Growth 2011 25 000
A Red Letter Day Event Management for ASONG activities that support Australian content on radio 2 000
Accessible Arts an arts development grant for mentoring, travel and/or exhibition opportunities for an artist with a disability exhibiting at AART.BOXX 2011
5 000
Accessible Arts for Shh Ltd the creation and presentation of ‘How To Lose Sight’ 45 000
Albury City Council for Albury Art Gallery the capital redevelopment of the Albury Art Gallery 134 000
Albury City Council for Albury Library/Museum the creation and presentation of the Indigenous exhibition ‘Wiradjuri Talk Back’ 31 500
Arts Mid North Coast the creation and presentation of the Mid North Coast Youth Digital Distributions Project
25 000
Arts North West Inc the strategic industry development of the NENW Performing Arts Touring Coordinator ‘s position
27 886
Arts North West Inc for Dhiiyann Indigenous Unit, Moree
the strategic industry development of the Dhiiyaan Indigenous Unit, Moree 40 000
Arts On Tour - NSW Ltd the balance of funds for the 2011 NSW Touring Program 91 232
Arts On Tour - NSW Ltd for Christine Dunstan Productions Pty Ltd
a tour of Nancye Hayes and Reg Livermore in ‘Turns’ 78 275
Arts OutWest Inc the creation and presentation of the Central West Aboriginal Arts Event ($28 030); the creation of Arts Media Skills for Arts OutWest Young Consultants ($27 055)
55 085
Arts OutWest Inc for Orange Health Service, Bloomfield Campus
the strategic industry development of the Arts, Health and Wellbeing Program 30 000
Arts Radar Pty Ltd for Ms Annalouise Paul the creation of ‘Mother Tongue’ 30 000
Artspace Visual Arts Centre Ltd year 2 of the NSW - Canada Visual Artist Exchange Program 12 000
Asian Australian Artists Association Inc year 2 of the strategic industry development of ‘Chinatown Community Mapping Project’ (2010-12)
45 100
Auspicious Arts Projects Inc for Serial Space Gallery the creation and presentation of the Serial Space Residency Program 30 000
Australasian Performing Right Association Limited a music research project ($20 000); year 1 of the Sounds Australia initiative (2011-13) ($25 000)
45 000
Australia Council for Hany Armanious the 2011 Venice Biennale (Hany Armanious) 55 000
207NSW TRADE & INVESTMENT ANNUAL REPORT 2010 -11 APPENDICES
17. Funds Granted to Non-Government Community Organisations (cont’d)

Organisation Purpose/Program Name Funding $
Australian Centre for Photography Ltd to carry out strategic development and business planning 10 000
Australian Dance Council - Ausdance (NSW) Inc the strategic industry development of the DanceWest residency program 14 000
Australian Dance Council - Ausdance (NSW) Inc for Mr Steven Anton
the creation and presentation of ‘supermodern’ 28 947
Australian Performance Exchange the creation of ‘Asylum’ 12 900
Australian Theatre for Young People the creation of ‘Building Futures’ 30 000
Balranald Shire Council for Theatre Royal Performing Arts & Cinema Precinct
the capital redevelopment of the Theatre Royal Performing Arts & Cinema Precinct
99 585
Bankstown City Council year 2 of the strategic industry development of the Bankstown Arts Centre Director’s position (2010-12)
50 533
Blue Knob Hall Inc for Blue Knob Hall Gallery and Cafe
the capital development of Blue Knob Hall Studio 25 000
Blue Mountains Musical Society Inc the development and presentation of ‘Morgan’s Run’ 15 000
Bundanon Trust the creation and presentation of SiteWorks 2011 - Commissioned Projects 55 000
Byron Bay Community Association Inc for Byron Theatre
the capital redevelopment of the Byron Theatre 50 000
Campbelltown City Council for Campbelltown Arts Centre
the strategic industry development of the Pacific Communities Arts Development Strategy 2011
50 000
Carclew Youth Performing Arts Centre Inc the creation and presentation of Lowdown Magazine Online - Youth Performing Arts in Australia
8 000
CarriageWorks Ltd replacement of sprung floor and technical fit out 226 000
Central Coast Conservatorium Inc audience development and participation partnerships ($44 880); the 2011 recital series ($18 320); the Central Coast Symphony Orchestra Subscription Series ($8 674)
71 874
City of Canada Bay Council the creation and presentation of ‘Reclamation’ [Visual Arts and Craft Strategy] 40 000
Clarence Valley Conservatorium Incorporated the 2011 concert series 22 500
Coffs Harbour Regional Conservatorium Inc the 2011 Sunday Soundscapes concerts 23 993
Cootamundra Shire Council for Cootamundra Creative Arts and Cultural Centre
the capital development of the Arts Centre theatre and amenities 100 000
Cre8ion Pty Ltd a regional tour of ‘Double Exposure’ 8 500
Critical Path for The Drill Hall the capital redevelopment of the Drill Hall’s dance area 50 000
Critical Stages a regional tour of ‘Capture the Flag’ 48 725
d/Lux Media Arts Incorporated the capital development of a self contained production lab for digital and locative media production
20 000
d/Lux Media Arts Incorporated business planning and cash flow management 10 000
Darlinghurst Theatre Limited the creation and presentation of ‘10 000 Beers’ ($50 000); the strategic industry development of the Sponsorship Manager’s position 2011 ($40 000)
90 000
Darlinghurst Theatre Limited for Milk Crate Theatre the creation of ‘Eternity’ 30 000
De Quincey Company Ltd for The Opium Dimensions
the creation of the ‘Dreams Rising’ section of ‘Dark Interpreter’ 15 000
DirtyFeet Limited the creation of ‘As We Are’, Stage Two 30 000
Dubbo City Council for Western Plains Cultural Centre
the creation and presentation of ‘On The Sly’ at Dubbo Regional Museum 8 000
Erth Visual & Physical Incorporated the creation of ‘IBunyip’ ($30 000); year 1 of the strategic industry development of the General Manager position (2011-13) ($30 000)
60 000
Factory 49 Incorporated for F Mataraga, K Mackay, L Shreeve, P Aitken, M Sarroff
the creation and presentation of ‘Circle/Square’ [Visual Arts and Craft Strategy] 10 000
FlickerFest Pty Ltd 2011 festival operations ($5 000) and technical equipment upgrade ($5 000) 10 000
Force Majeure Limited the presentation of ‘Not In A Million Years’ 20 000
208 APPENDICES NSW TRADE & INVESTMENT ANNUAL REPORT 2010 -11
17. Funds Granted to Non-Government Community Organisations (cont’d)

Organisation Purpose/Program Name Funding $
Four Winds Concerts Inc the capital development of the ‘Aound Shell’ ($99 000); the creation and presentation of the ‘Inspiring’ Schools Outreach Program ($12 000); the strategic industry development of technology and community infrastructure ($20 000)
131 000
Free Broadcast Inc the creation of FBi Radio’s Open Day project ($20 000); the ‘Creating Pathways in Contemporary Music’ project ($25 000)
45 000
Gadigal Information Service Aboriginal Corporation
Gadigal Music’s NSW Emerging Artists EP Series 30 000
General Cemetery Necropolis Trust the creation and presentation of ‘Hidden’: a Rookwood Sculpture Walk [Visual Arts and Craft Strategy]
25 000
Glen Innes Arts Council Inc for Chapel Theatre the capital development of the Chapel Cinema: upgrade to digital cinema ($60 000); the capital development of the Chapel Theatre: roof replacement ($40 000)
100 000
Gosford Business Improvement District Association Inc
the strategic industry development of ‘Create, Innovate Gosford City 2011’ 15 000
Gosford Business Improvement District Association Inc
the ‘Create, Innovate Gosford City’ project 2011 22 990
Goulburn Mulwaree Council for Goulburn Regional Art Gallery
the strategic industry development of Indigenous Art & Culture for inmates of Goulburn Correctional Centre [Visual Arts and Craft Strategy]
41 224
Goulburn Regional Conservatorium Inc the 2011 subscription series 24 493
Griffin Theatre Company Ltd a scoping study into the establishment of the NSW Theatre Network 15 000
Gunnedah Music Centre Music for Festivals ($5 000); the 2011 concert series ($25 000) 30 000
History Council of NSW Inc a mentor for the 2010 History Fellowship recipient (Pauline Curby) ($5 000); a mentor for the 2010 NSW Archival Fellowship recipient (Amanda Kaladelfos) ($5 000)
10 000
Illawarra Performing Arts Centre Ltd year 1 of the strategic industry development of the Artistic Community Projects Coordinator position (2011-13)
27 000
Information and Cultural Exchange Inc the capital redevelopment of the creative enterprise hub - stage 3 55 000
Kaldor Public Art Projects Ltd year 1 of ‘Roman Ondak at Parramatta’ 25 000
Kangaroo Valley Arts Festival Inc the presentation of ‘Dance and Drum’ 10 000
Korean Women’s Art Society Sydney the exhibition celebrating 50 years of friendship between Australia and Korea 1 000
Leeton Shire Council for Western Riverina Arts Inc the creation and presentation of ‘Connecting Cultural Journeys’ 25 500
Liquid Architecture Sound Inc the presentation of Liquid Architecture 12, festival of sound arts 10 000
Lismore City Council for Lismore Regional Gallery the strategic industry development of ‘Splendid 2011’ 30 000
Live at the Village Inc the presentation of a Jazzgroove Mothership Orchestra concert and workshop 7 400
Liverpool City Council for Casula Powerhouse Arts Centre
the capital redevelopment of the Performance Space ($13 144); the creation and presentation of the Australian Muslim Women’s Project ($52 500)
65 644
Liverpool City Council for Liverpool Regional Museum
the strategic industry development of The Heritage Services Co-ordinator position 2011
33 000
Lockhart Shire Council for Green’s Gunyah Museum Repairs to the building and collection 4 000
Macedonian Welfare Association of NSW Inc the creation of the migration objects research project ‘Made in Macedonia’ 15 000
Macquarie Conservatorium of Music Incorporated a series of free public concerts ($13 500); a Sydney Symphony Orchestra performance and band conductors ($15 740); the 2011 concert series ($18 281)
47 521
Marguerite Pepper Productions Pty Ltd for MAKEbeLIVE Productions
the creation of ‘The Adventures of Lolita Red’ 13 000
Marguerite Pepper Productions Pty Ltd for My Darling Patricia
the creation and presentation of ‘Posts in The Paddock’ 49 000
Matilda Ltd the participation of NSW designers in the 2011 London Design Festival Showcase
40 000
Media Entertainment & Arts Alliance the strategic industry development of a Theatre Weekend for Actors/Performers
7 000
Mid-Western Regional Council for Kandos Bicentennial Industrial Museum
the capital redevelopment of Kandos Bicentennial Industrial Museum entrance foyer
59 340
209NSW TRADE & INVESTMENT ANNUAL REPORT 2010 -11 APPENDICES
17. Funds Granted to Non-Government Community Organisations (cont’d)

Organisation Purpose/Program Name Funding $
Miss Katthy Cavaliere participation in an exhibition in the Italian Pavilion at the 2011 Venice Biennale 3 000
Mitchell Conservatorium Incorporated the 2011 Mitchell Musicians concert tour ($15 260); visiting artists performances, workshops and masterclasses ($12 125)
27 385
Monkey Baa Theatre for Young People Ltd a tour of Duncan Ball’s ‘Emily Eyefinger’ 30 000
Mosman Council for Mosman Art Gallery & Community Centre
the creation and presentation of ‘Open Air’ ($20 000); the creation of ‘Bungaree: The First Australian’ (Stage One) [Visual Arts and Craft Strategy] ($30 000)
50 000
Murray Conservatorium Board of Management Inc the ‘Symphony by the Murray’ 32100
Muru Mittigar Limited the capital development of the Muru Mittigar museum and traditional knowledge centre
95 000
Museums Australia Incorporated for Museums Australia (NSW)
bursaries for regional and rural attendees to the ‘Place, Space and Identity: New Directions for NSW Museums’ symposium
5 000
Music NSW Incorporated a Music Industry Incubator Scoping Project ($5 000); the Byron Bluesfest Whichway Initiative ($12 000); the strategic industry development of Devolved Funding - Export ($40 000); year 1 of the strategic industry developmen of the Music NSW Education Officer position (2011-12) ($16 000)
73 000
Music NSW Incorporated a review of operations ($15 000); travel support for NSW acts to showcase at Big Sound in Brisbane 8-10 September 2010 ($17 000)
32 000
Music NSW Incorporated for Sound Summit the presentation of ‘Sound Summit’ 15 000
National Aboriginal Islander Skills Development Association Inc
the strategic industry development of ‘Future Tracks - 2’ 41 686
National Art School stage 1 of the capital upgrade of the National Art School 500 000
National Association for the Visual Arts Ltd for Ms Anna Laerkesen
the creation and presentation of the Artists Residency Program [Visual Arts and Craft Strategy]
30 000
National Young Writers’ Festival Inc for Crack Theatre Festival
the strategic industry development of Crack Theatre Festival Accessibility 13 592
New England Conservatorium of Music Ltd ‘Closing the Music Gap’ Stage 2 ($23 250); the festival component of ‘accessFest’ ($45 000)
68 250
Northern Rivers Conservatorium Arts Centre Inc the commissioning of a music score and soundscape for NORPA’s ‘Railway Wonderland’ ($22 085); two ‘CabaretConnection’ concerts ($11 751); two ‘Viva La Musica’ concerts ($6 493)
40 329
Object - Australian Centre for Craft and Design one-off support towards creative industries and business development 100 000
Opera Australia a tour of the Oz Opera NSW Primary Schools Program:’Sid the Serpent’ 62 540
Opera Australia for Polyartistry the strategic industry development of the ‘Polyartistry Twitter Opera Project’ 30 000
Orange City Council the creation and presentation of ‘Mining Wentworth’ ($12 000); the creation of the Sustainable Collections Project Stage 4 ($36 000)
48 000
Orange Regional Conservatorium Inc a one-week residency and performance project: ‘Rewriting the Score’ ($44 426); the ‘Occidental Strings’ regional tour ($31 554)
75 980
Outback Arts Inc the creation and presentation of the Farwest Indigenous Art Exhibitions [Visual Arts and Craft Strategy]
8 000
PACT Centre for Emerging Artists the creation and presentation of new works by six Indigenous emerging artists ($8294); the presentation of the 2011 Erskineville Performance Art Festival (aka ‘Tiny Stadiums’) ($20 098)
28 392
Palerang Council for Bungendore School of Arts the capital redevelopment of Bungendore School of Arts 5 800
Parramatta City Council for Riverside Theatres the creation and presentation of ‘Breakout’ Stage 3 ($15 000); the strategic industry development of ‘The Indy Project’ ($25 660); year 1 of the strategic industry development of the Creative Director/Coordinator (WAPD Program) position (2011-13) ($25 000)
65 660
Peloton Inc the creation and presentation of ‘Drawing a line in the sand between a rock and a hard place’ [Visual Arts and Craft Strategy]
40 000
Penrith Performing and Visual Arts Ltd the creation and touring of an all Indigenous cast production of ‘The Maids’ 30 000
Performing Lines Ltd for Branch Nebula the creation of ‘Concrete and Bone Sessions’ 30 000
Performing Lines Ltd for Miss Zoe Lea Coombs Marr
the presentation of The Imperial Panda Festival 30 000
Performing Lines Ltd for Mr Martin del Amo the creation and presentation of ‘Mountains Never Meet’ 36 950
210 APPENDICES NSW TRADE & INVESTMENT ANNUAL REPORT 2010 -11
17. Funds Granted to Non-Government Community Organisations (cont’d)

Organisation Purpose/Program Name Funding $
Performing Lines Ltd for Ride On Theatre the presentation of ‘The Story of Mary MacLane - By Herself ’ 30 000
Performing Lines Ltd for Sue Healey Company the creation and presentation of ‘Virtuosi’ 19 500
PlayWriting Australia a playwright exchange program developed with the National New Play Network (NNPN), USA
12 000
Port Macquarie-Hastings Council the creation of Migration Heritage in the Hastings: Stage 1 14 000
Port Macquarie-Hastings Council for Glasshouse Arts, Conference & Entertainment Centre
the creation and presentation of ‘Project People of the First Sunrise; East Coast Indigenous Art’ [Visual Arts and Craft Strategy]
17 000
Powerhouse Youth Theatre Inc the creation of the ‘Hero Project’ 19 339
Precarious Inc the presentation of ‘Superb and Broken’ 29 761
Queer Screen Limited a three-day script development lab for Australian filmmakers 10 000
Regional Arts Victoria for Edge Productions Inc the Shorter+Sweeter Dance tour 25 530
Renew Newcastle Limited the strategic industry development of Newcastle Creative Enterprise Project 2011
50 000
Rinse Out Inc the creation and presentation of ‘Underbelly Arts Artist Project Allowance’ 30 000
Riverina Conservatorium of Music Incorporated preparation, rehearsal and touring of Schubert’s ‘Die Winterreise’ ($11 85); the 2011 subscription series and Winter Festival of Music ($34 800)
46 650
Saltwater Freshwater Arts Alliance Aboriginal Corporation
the strategic industry development of the Community Engagement Officer position (2011)
26 484
Shaun Parker & Company Limited the presentation of ‘Happy as Larry’ at Dance Massive Fest ($27 055); year 1 of the strategic industry development of the Company/General Manager’s position (2011-12) ($40 000)
67 055
Shear Outback Limited the creation and presentation of ‘the Moccasin Trail’ ($48 120); the strategic industry development of ‘ i-Shear ... Virtual’ ($30 000)
78 120
Shh Ltd the creation of ‘La Traviata’ 30 000
South Coast Writers’ Centre Inc the creation and presentation of an Indigenous Writers and Educators Symposium
10 000
South East Arts Region (SEAR) Inc the creation of ‘Past Present’ 10 000
South West Arts Inc the strategic industry development of ‘Growing Our Place - Public Art Initiative’ 25 000
South West Music Inc the 2011 Riverina Bush Concerts 34 750
Southern Cross Soloists Music Ltd the creation and presentation of the Bangalow Music Festival 2011 10 000
Stalker Stilt Theatre Inc the strategic industry development of the Dance Dramaturgy Masterclass 30 000
Sulphide Street Station Railway & Historical Museum Trust
the creation of the Museum Collection Significance Assessment 5 000
Sydney Dance Company commissioning and presentation of a musical score by Ezio Bosso 10 000
Sydney Dance Company an upgrade of the studio floors 79 856
Sydney International Piano Competition the Sydney International Piano Competition ($66 000 paid over two financial years)
33 000
Sydney Philharmonia Limited a business review consultancy 10 000
Sydney Theatre Company the Walsh Bay Precinct Open Day 30 000
Sydney Writers’ Festival the development of residency for NSW writer in Ireland 12 000
Sylvanvale Foundation the creation and presentation of Studio West 25 000
Synergy and TaikOz Ltd travel costs for Synergy Percussion to perform at the Tongyeong International Music Festival, South Korea
8 000
Tamarama Rock Surfers Theatre Company Limited year 2 of the strategic industry development of the Creative Producer’s position (2010-12)
28 700
Tamarama Rock Surfers Theatre Company Limited for Tin Shed
the presentation of ‘Boxing Day’ 14 692
Tamworth Regional Conservatorium of Music Inc the 2011 concert program ($24 842); the commissioning of a new work for orchestra and didgeridoo ($2 920)
27 762
The Australian Ballet the strategic industry development of ‘Ballet 4 Western Sydney’ 23 000
The Australian Children’s Music Foundation Limited a research project to evaluate ACMF music programs in NSW 20 000
211NSW TRADE & INVESTMENT ANNUAL REPORT 2010 -11 APPENDICES
17. Funds Granted to Non-Government Community Organisations (cont’d)

Organisation Purpose/Program Name Funding $
The Ballina Players Incorporated the capital redevelopment of the Ballina Players Theatre 32 000
The Performance Space Ltd IndigeSpace 2011 40 000
The Performance Space Ltd for Deborah Pollard and Paschal Daantos Berry
the creation and presentation of ‘Within and Without’ 30 000
The Performance Space Ltd for Ms Vicki Van Hout the creation and presentation of ‘Briwyant’ 30 000
The Red Room Company Ltd musicians’ fees for a performance at the second NSW Parliamentary Poetry Soiree ($500); the creation and presentation of ‘Clubs and Socs’ ($15 000)
15 500
The Royal Australian Institute of Architects Australia’s exhibition and participation in the 12th Venice Architecture Biennale, 2010
60 000
The Song Company Pty Ltd 2011 regional touring 14 500
The Song Company Pty Ltd business development activities to address cash flow and financial problems 10 000
The Trustee for the Australian World Orchestra Foundation
the Australian World Orchestra program in August 2011 5 000
The University of Sydney for Seymour Centre the creation and presentation of The Seymour Companies season ($60 000); the presentation of Suzie Miller’s ‘Transparency’ ($25 787)
85 787
The University of Sydney for Tin Sheds Gallery the capital redevelopment of the ‘Ave a Go’ Window Gallery ($12 000); the creation and presentation of ‘Emergency Architecture’ ($40 000)
52 000
Theatre Kantanka the presentation of ‘Bargain Garden’ 20 000
Tura New Music for Falling Like a Bird the creation and presentation of ‘Falling Like a Bird’ 24 134
Upper Hunter Conservatorium of Music Inc the 2011 visiting artists series 40 100
Urban Theatre Projects Ltd the presentation of ‘Ama and Chan’ 28 000
Urban Theatre Projects Ltd for Ms Rosie Tsarpalias the creation of ‘Worlds Apart’ 9 438
Version 1.0 inc the creation of ‘The Securency Project’ 20 000
Vim Inc a residency for a NSW playwright at the Albee Foundation in Long Island, New York, in 2011
14 000
Wagga Wagga City Council the creation and presentation of ‘Masters and Apprentices’ 30 000
Wattle Flat Progress Association the Wattle Flat Country Music Awards 1 500
Waverley Council the strategic industry development of the Waverley Arts Revitalization and Development (WARD) initiative [Visual Arts and Craft Strategy]
15 000
Western Sydney Dance Action Incorporated for youMove Company Ltd
the presentation of ‘4Tell’ 18 000
Wollongong Conservatorium of Music Limited the 2011 classical chamber series ($24 950); the 2011 jazz series ($17 500); the Illawarra Music Festival ($18 500)
60 950
Wyong Shire Council year 1 of the strategic industry development of the Arts Facility Program Development Officer’s position (2011-13)
33 000
Wyong Shire Council for Wyong Memorial Hall the capital redevelopment of Wyong Memorial Hall 50 000
Young Regional School of Music Inc the 2011 concert series 30 940
TOTAL 6 534 459
Quick Response
Organisation Purpose/Program Name Funding $
May-Brit Akerholt participation in the ‘Invisible Presences: Translation, Dramaturgy and Performance’ conference in Belfast
2 704
Pamela Aitken participation in the Poland International Exhibition of Spatial Forms 3 000
Nick Atkins participation in the Marnay Sur-Seine Art Centre, international artist-in-residence program
3 000
Penelope Cain a professional development and research period in London and Paris 3 000
Rebecca Clarke travel and accommodation costs for rehearsal and presentation of the play ‘Belongings’ in Brisbane
3 000
Jonathan Bottrell a site-specific solo exhibition at Galerie Mirchandani + Steinruecke in Mumbai, India
3 000
212 APPENDICES NSW TRADE & INVESTMENT ANNUAL REPORT 2010 -11
17. Funds Granted to Non-Government Community Organisations (cont’d)

Organisation Purpose/Program Name Funding $
Nicola Bowery participation in The Art of Good Health and Wellbeing Conference, Melbourne
1 280
Julian Callaghan presentations at three international events: Make Music NY and the MATA Festival; masterclasses at the Cortona Sessions, Italy; and ‘The Spirit of Gravity, Brighton UK
3 000
Courtney Collins participation as a writer in residence at Hedgebrook Writer’s Retreat, Seattle USA
3 000
Matthew Curtis participation in the Invitational International Glass Exhibition in Michigan, USA
3 000
Keg de Souza the presentation of’Brief Utopia’ at the Primavera 2011 exhibition at the Museum of Contemporary Art, Sydney
3 000
Luke Escombe-Wolhuter participation in the 2011 Edinburgh Fringe Festival 3 000
Chris Fox exhibiting the ‘Salon Jetpack’ project at the Los Angles Art Show 2011 3 000
Anatoly Frusin attendance at the Sibiu International Theatre Festival, Romania, and the European Festival of the Performing Arts, France
3 000
Paul Gilchrist the theatrical production of ‘A Quiet Night in Rangoon’ as part of The Spare Room Season at the New Theatre
3 000
Anne Glynn a placement in the 24HR Art International Residency Program, Huantei Art City Studio in Beijing, China
3 000
Rochelle Haley the performance of ‘strings’ in Kuala Lumpur, Malaysia 3 000
Raz Harel participation in the Fest Napuan concert in Port Vila, Vanuatu 3 000
Alexandra Harrison the development and presentation of ‘What’s Coming’ at the Nottdance Festival, UK
3 000
Joshua Howard delivering a paper and exhibiting art work at the ASCA Practicing Theory Workshop and Conference in Amsterdam
3 000
Jannali Jones the presentation of a paper at the American Association of Australasian Literary Studies (AAALS) conference in Texas, USA
2 500
David Lawrey participation in the ‘Otherworldly: Optical Delusions and Small Realities’ exhibition at the Museum of Arts and Design, New York
3 000
Linda Luke the production and documentation of ‘Thirteen: reflections on teenage homelessness’
3 000
Laura McLean the ‘Other Possible Worlds - Proposals on this Side of Utopia’ workshop at Casino Luxembourg - Forum d’art contemporain, Luxembourg
3 000
Angelica Mesiti presentation of work in the exhibition ‘Videonale 13’ at the Kunstmuseum Bonn
3 000
Jacqueline Middleton participation in the ‘Otherworldly: Optical Delusions and Small Realities’ exhibition at the Museum of Arts and Design, New York
3 000
Susan Norrie participation in the Yokohama Triennale 2011 3 000
Margaret Roberts participation in the Poland International Exhibition of Spatial Forms 3 000
Benjamin Sewell participation in SOFA (Sculptural Objects and Found Arts) in Chicago 3 000
Alan Schacher participation in a Performance Arts Laboratory and Performance Arts Event in Java, Indonesia
3 000
Sumugan Sivanesan a SOMA studio residency in Mexico City 3 000
Lachlan Skipworth participation in the Bang on a Can Summer Music Festival at the Massachusetts Museum of Contemporary Art in the USA
2 500
Karen Therese Smith creative development of the solo performance work ‘The Comfort Zone’ 3 000
Tim Spencer the presentation of ‘Show Me Yours, I’ll Show You Mine’ at The Horse’s Mouth Festival, Old Fitzroy Hotel
3 000
Josephine Starrs participation in the International Symposium on Electronic Art (ISEA) in Istanbul, Turkey in September 2011
3 000
Rosie Tsarpalias the presentation of performance work ‘Downtown’ at the Trouble Festival in Brussels, Belgium
3 000
Nicholas Tsoutas presentation of a paper on Australian residencies at the TransCultural Exchange Conference in Boston, USA
3 000
213NSW TRADE & INVESTMENT ANNUAL REPORT 2010 -11 APPENDICES
17. Funds Granted to Non-Government Community Organisations (cont’d)
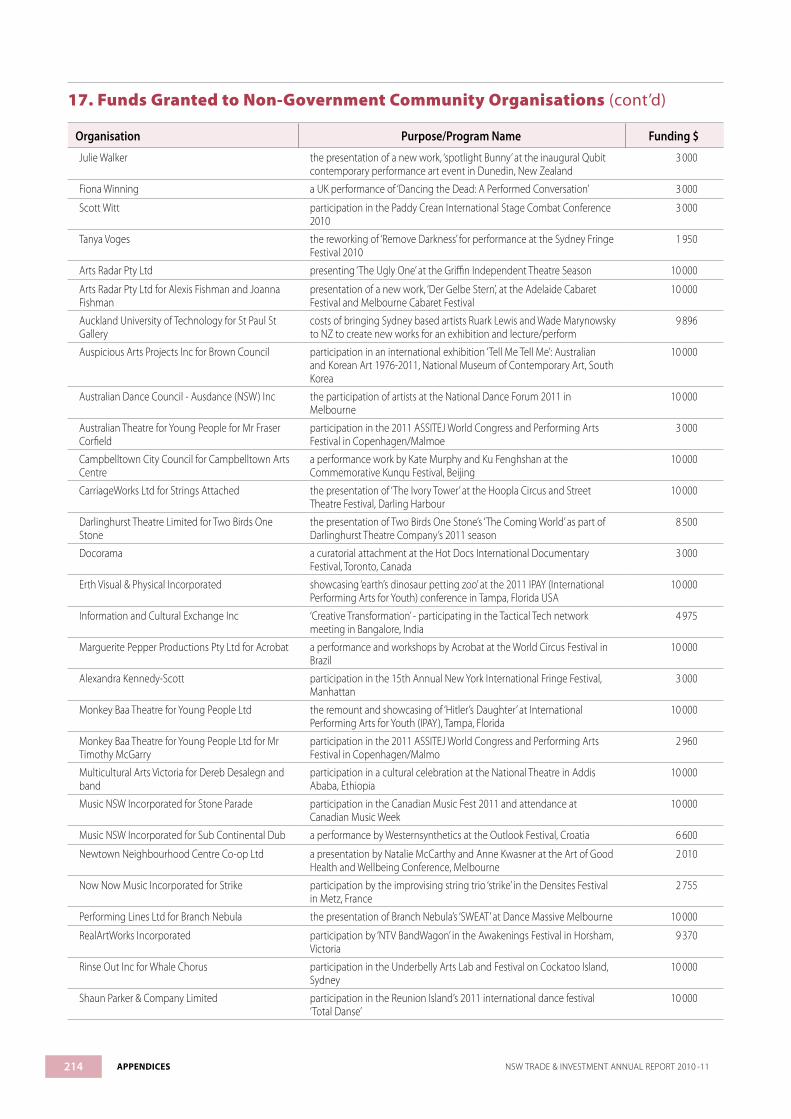
Organisation Purpose/Program Name Funding $
Julie Walker the presentation of a new work, ‘spotlight Bunny’ at the inaugural Qubit contemporary performance art event in Dunedin, New Zealand
3 000
Fiona Winning a UK performance of ‘Dancing the Dead: A Performed Conversation’ 3 000
Scott Witt participation in the Paddy Crean International Stage Combat Conference 2010
3 000
Tanya Voges the reworking of ‘Remove Darkness’ for performance at the Sydney Fringe Festival 2010
1 950
Arts Radar Pty Ltd presenting ‘The Ugly One’ at the Griffin Independent Theatre Season 10 000
Arts Radar Pty Ltd for Alexis Fishman and Joanna Fishman
presentation of a new work, ‘Der Gelbe Stern’, at the Adelaide Cabaret Festival and Melbourne Cabaret Festival
10 000
Auckland University of Technology for St Paul St Gallery
costs of bringing Sydney based artists Ruark Lewis and Wade Marynowsky to NZ to create new works for an exhibition and lecture/perform
9 896
Auspicious Arts Projects Inc for Brown Council participation in an international exhibition ‘Tell Me Tell Me’: Australian and Korean Art 1976-2011, National Museum of Contemporary Art, South Korea
10 000
Australian Dance Council - Ausdance (NSW) Inc the participation of artists at the National Dance Forum 2011 in Melbourne
10 000
Australian Theatre for Young People for Mr Fraser Corfield
participation in the 2011 ASSITEJ World Congress and Performing Arts Festival in Copenhagen/Malmoe
3 000
Campbelltown City Council for Campbelltown Arts Centre
a performance work by Kate Murphy and Ku Fenghshan at the Commemorative Kunqu Festival, Beijing
10 000
CarriageWorks Ltd for Strings Attached the presentation of ‘The Ivory Tower’ at the Hoopla Circus and Street Theatre Festival, Darling Harbour
10 000
Darlinghurst Theatre Limited for Two Birds One Stone
the presentation of Two Birds One Stone’s ‘The Coming World’ as part of Darlinghurst Theatre Company’s 2011 season
8 500
Docorama a curatorial attachment at the Hot Docs International Documentary Festival, Toronto, Canada
3 000
Erth Visual & Physical Incorporated showcasing ‘earth’s dinosaur petting zoo’ at the 2011 IPAY (International Performing Arts for Youth) conference in Tampa, Florida USA
10 000
Information and Cultural Exchange Inc ‘Creative Transformation’ - participating in the Tactical Tech network meeting in Bangalore, India
4 975
Marguerite Pepper Productions Pty Ltd for Acrobat a performance and workshops by Acrobat at the World Circus Festival in Brazil
10 000
Alexandra Kennedy-Scott participation in the 15th Annual New York International Fringe Festival, Manhattan
3 000
Monkey Baa Theatre for Young People Ltd the remount and showcasing of ‘Hitler’s Daughter’ at International Performing Arts for Youth (IPAY), Tampa, Florida
10 000
Monkey Baa Theatre for Young People Ltd for Mr Timothy McGarry
participation in the 2011 ASSITEJ World Congress and Performing Arts Festival in Copenhagen/Malmo
2 960
Multicultural Arts Victoria for Dereb Desalegn and band
participation in a cultural celebration at the National Theatre in Addis Ababa, Ethiopia
10 000
Music NSW Incorporated for Stone Parade participation in the Canadian Music Fest 2011 and attendance at Canadian Music Week
10 000
Music NSW Incorporated for Sub Continental Dub a performance by Westernsynthetics at the Outlook Festival, Croatia 6 600
Newtown Neighbourhood Centre Co-op Ltd a presentation by Natalie McCarthy and Anne Kwasner at the Art of Good Health and Wellbeing Conference, Melbourne
2 010
Now Now Music Incorporated for Strike participation by the improvising string trio ‘strike’ in the Densites Festival in Metz, France
2 755
Performing Lines Ltd for Branch Nebula the presentation of Branch Nebula’s ‘SWEAT’ at Dance Massive Melbourne 10 000
RealArtWorks Incorporated participation by ‘NTV BandWagon’ in the Awakenings Festival in Horsham, Victoria
9 370
Rinse Out Inc for Whale Chorus participation in the Underbelly Arts Lab and Festival on Cockatoo Island, Sydney
10 000
Shaun Parker & Company Limited participation in the Reunion Island’s 2011 international dance festival ‘Total Danse’
10 000
214 APPENDICES NSW TRADE & INVESTMENT ANNUAL REPORT 2010 -11
17. Funds Granted to Non-Government Community Organisations (cont’d)

Organisation Purpose/Program Name Funding $
Sport for Jove Theatre Company Ltd the production of Stephen Jeffrey’s ‘The Libertine’ in the Darlinghurst Theatre’s curated season
10 000
Tamarama Rock Surfers Theatre Company Limited for The Impending Room
the presentation of Howard Barker’s ‘Judith’ at the Bondi Pavilion Theatre 7 000
The University of Sydney for Centre for Social Robotics, ACFR
participation in the ‘TransLife, the International Triennial of New Media Art 2011’ at the National Art Museum of China (NAMOC) in Beijing
7 300
Version 1.0 inc a Balkan tour of ‘seven kilometers north-east’ 10 000
Western Sydney Dance Action Incorporated a music and dance collaboration, ‘Thinking About Forever,’ to be performed at the Sydney Festival 2011
10 000
TOTAL 359 300
Screen Audience Development
Organisation Purpose/Program Name Funding $
Arts North West Inc the NXNW Festival 7 500
Australian Teachers of Media Inc the 2011 ATOM Awards Screenings 4 000
Blackfella Films Pty Ltd the 2011 Message Sticks Indigenous Film Festival 10 000
Cultural Media Limited the 2011 Palestinian Film Festival 7 500
d/Lux Media Arts Incorporated the 2011 ‘d/tour’ regional touring program 10 000
Dungog Film Festival Limited the 2011 Dungog Film Festival 10 000
FlickerFest Pty Ltd Flickerfest 2011 ($20 000); the Flickerfest 2011 national touring exhibition ($10 000)
30 000
Glen Innes Arts Council Inc the 2011 New England Short Film Festival 2 000
Greenhouse Events Pty Ltd the Byron Bay International Film Festival 2011 7 500
Gwydir Shire Council for The Roxy the 2011 North West Film Festival 10 000
In the Bin Film Festival Trust the In the Bin Film Festival 2011 NSW tour 12 250
Information and Cultural Exchange Inc the Arab Film Festival 2011 10 000
Newtown Flicks NSW Inc the Newtown Flicks Short Film Festival 2011 5 000
Petite Grand Kaboom Ltd the Little Big Shots International Film Festival for Kids - NSW Tour 2011 5 000
Popcorn Taxi Pty Ltd Popcorn Taxi 2011 15 000
Portable Australia Pty Ltd the 2011 Portable Film Festival 7 500
Queer Fruits Film Festival the 2011 Queer Fruits Film Festival 5 000
Queer Screen Limited the annual program of events 15 000
Screen Culture Association Inc Antenna- Sydney International Documentary Film Festival 9 500
Women in Film and Television Inc the 2011 WOW Film Festival and national tour 10 000
Wonderland Music Pty Ltd Movie Extra Tropfest 2011 - year 1 of triennial funding (2011-13) 20 000
TOTAL 212 750
NSW Department of Education and Training transfer of core funding for the Regional Conservatoriums 1 446 923
TOTAL 1 446 923
48 815 601
Note: The above figures exclude the following payments made in the 2009 -10 financial year.
Museum of Contemporary Art year 1 of triennial program funding (2011-13) 1 500 000
Opera Australia 2011 program funding 951 148
Sydney Festival Ltd 2011 Festival First Night 1 250 000
The Song Company Pty Ltd 2011 program funding 200 000
3 901 148
215NSW TRADE & INVESTMENT ANNUAL REPORT 2010 -11 APPENDICES
17. Funds Granted to Non-Government Community Organisations (cont’d)

Crown Lands Division
Local Parks and Reserves
Trust Project Grant $ Loan $
Albury Council Ongoing maintenance of Albury City Council Reserves 5 000
Baulkham Hills Council Ongoing maintenance of Eric Mobbs & Ted Horwood Reserve, Fred Caterson Reserve, Holland Reserve and Baulkham Hills Reserve
120 000
Broken Hill Council Ongoing maintenance of Broken Hill Plantation Reserve 2 000
Cessnock Council Ongoing maintenance of Bushfire Brigade Reserve 3 000
Clarence Valley Council Ongoing maintenance of Clarence Coast Reserve 5 000
Cooma Monaro Council Ongoing maintenance of Mt Gladstone Recreation Reserve 38 000
Frenchs Forest Cemetery Trust Ongoing maintenance of Frenchs Forest Cemetery Reserve 14 000
Griffith Council Ongoing maintenance of Griffith City Council Reserves 2 000
Kiama Council Ongoing maintenance of Saddleback Mountain Reserve 15 000
Ku-rin-gai Council Ongoing maintenance of Hassell Park Reserve, Roseville Chase Reserve and Lindfield Soldiers Mem. Reserve 65 000
Lithgow Council Ongoing maintenance of Hassans Walls Reserve 10 000
Lockhart Council Ongoing maintenance of Lockhart Council Reserve 20 000
Oberon Council Ongoing maintenance of Oberon Council Reserve 6 000
Port Stephens Council Ongoing maintenance of Fingal Bay Rec. Reserve 10 000
Strathfield Council Ongoing maintenance of Strathfield Public Reserve and Hudson Park Reserve 29 000
Sutherland Council Ongoing maintenance of Waratah Park Reserve, Ferntree Reserve, Burnum Burnum Sanctuary & Jannali Reserve and Kareela Reserve 51 000
Tweed Council Ongoing maintenance of the reserve 5 000
Uralla Council Ongoing maintenance of Observatory Hill Reserve 3 000
Wollongong Council Ongoing maintenance of Council reserves and Bulli Tops Reserve 10 000
Walgett Council Ongoing maintenance of Lightning Ridge Reserve 2 000
Blue Mountains Council Ongoing maintenance of Bush Fire Brigade Reserve 18 000
Aust Volunteer Coast Guard - Lemon Tree Passage
Ongoing maintenance of Lemon Tree Passage Coast Guard Reserve13 000
Tumut Shire Council Ongoing maintenance of Tumut Council Crown Reserve 8 000
Gosford City Council Ongoing maintenance of Patonga Recreation Reserve 5 000
Warringah Shire Council Ongoing maintenance of the Melwood, Cromer Park, Beacon Hill Bush Fire, Reserve 70341, Allambie Heights, Beverley Job, MacKillop, Frank Beckham Reserves 170 000
Canterbury Shire Council Ongoing maintenance of Parry Park 24 000
Gundagai Shire Council Ongoing maintenance of Gundagai Council Reserve 5 000
Cowra Shire Council Ongoing maintenance of Cowra Shire Reserve 17 000
Gunnedah Shire Council Ongoing maintenance of Gunnedah Shire Council Reserve 10 000
Manly Council Ongoing maintenance of Tania Park and Seaforth Reserve Oval Reserve 59 000
Pittwater Council Ongoing maintenance of Ingleside and Hitchcock Park Reserve 20 000
Mosman Council Ongoing maintenance of Rawson Park Reserve 48 000
Trundle Racecourse Trust Amenities building 15 000
Cook Park Reserve Trust - Rockdale Council
General upgrade of Ramsgate Life Saving Club40 000
Port Stephens Art Centre Trust Landscaping at the centre 13 200 1 300
Mt Russell Recreation Reserve Improvement of reserve grounds 1 500
Uralla Community Trust-northern tablelands
Repairs to hall 3 500
216 APPENDICES NSW TRADE & INVESTMENT ANNUAL REPORT 2010 -11
17. Funds Granted to Non-Government Community Organisations (cont’d)

Trust Project Grant $ Loan $
Wollombi Museum Trust Rewiring of building & Installation of flood lighting 5 000 2 500
Bonville Hall Reserve Trust Replace and install new guttering on hall 3 729
Pambula Wetlands Reserve Trust Operational Funds 2 500
Old Bega Hospital Trust Install security fence 2 475
Ulladulla Wildflower Reserve Trust Brochure, operational costs 1 800
Edith Recreation Reserve Water tank & repair to toilets 7 200
Wattle Flat Heritage Lands Trust Establish fire asset protection zone, extension vehicle access, Composting toilet, Erosion control works, replace western boundary fence. 25 000
Gore Hill Memorial Cemetery Trust Install security fence 12 000
Panuara Recreation Reserve Trust Upgrade tennis court 5 000
Naira Park Trust Installation of irrigation system on second playing field 5 545
Tathra Forest Wildlife Reserve Trust Repair boardwalks and viewing platforms and purchase of construction materials 7 200
Wolumla Park Trust Operational expenses 5 700
Ashby Reserve Trust Upgrade BBQ area 10 000
Eatonsville Public Hall Reserve Trust Update electricity to safety switch, paint for interior of hall 3 250
Ellangowan Public Hall Reserve Trust Lay vinyl in kitchen 1 900
Lawrence Public Hall Reserve Trust Restoration of front wall of hall, relocation of electricity meter box due to required restoration of front wall, maintenance to Hall, replacing rotten handrails, awnings over doorways 15 100
Lightning Ridge Reserve Trust Purchase and installation of new amenities block to replace condemned block 30 000 10 000
Red Rock Public Reserve Trust Repairs to ninety metres of broken board walk access to the densely vegetated and environmentally sensitive areas of the public reserve 22 330
Upper Orana Recreation Paint Amenities block 2 000
Booyong Public recreation Reserve Trust
Fencing along railway line 3 395
Bidjigal Reserve Trust Track improvements 7 000
Red Range Reserve Trust Upgrade cattle yards, including fences 5 935 6 000
Ben Lomond War Memorial Construction of storeroom, disabled access and BBQ area 18 000 15 000
Hartley Vale Reserve Trust Stabilisation of fences, sandstone footings and fence work 6 700
Wyrallah Flood Refuge Reserve Trust Replace cattle troughs and cattle crossing 14 090
Manning Entrance Station Reserve Trust
Reinstate wharf facility, signage and foreshore improvements, replace pit toilets with self contained system 67 500
Warialda Rail Public Reserve Trust Replace tank stand (concrete) 2 000
Hannam Vale Recreation Reserve Trust Replace cricket pitch and practice pitch 9 000
Kootingal Community Hall Reserve Trust
Disabled hand rails for the front and both side access ramps leading into the Hall 1 650
Yallambee Homes Reserve Trust Construction of a storage shed 5 000
Ophir Reserve Trust Repair and upgrading of low level crossing 44 700
Bega Council Removal of old bridge, construct walking track at Bemboka River Reserve Trust 10 000
Maitland Mens Shed Reserve Trust Kerb and guttering construction and driveway to boundary. 5 000
Riley’s Hill Dry Dock Reserve Trust Construction and installation of interpretive signs on the dock site 1 200
Mulbring Community Hall Reserve Trust
Upgrade electrical service to hall, upgrade kitchen 5 500 5 900
Tumut Shire Council Reserves Installation of interpretive signage at Adelong Falls 10 000
Cudgegong River park Installation of security gate 30 000
Nerriga Craft & Museum Centre Trust Painting of all buildings 6 814
Towrang Stockade Trust Footbridge repair, replace information signage, install grave side plaques 3 553
217NSW TRADE & INVESTMENT ANNUAL REPORT 2010 -11 APPENDICES
17. Funds Granted to Non-Government Community Organisations (cont’d)

Trust Project Grant $ Loan $
Tullakool Hall Trust Replace and repair guttering and rain water tanks 7 000
Young Community Trust Supply, erect & dismantle of scaffolding for maintenance works 9 130
Bermagui Flora and Fauna Reserve Trust
Operations and track maintenance1 000
Maitland Mens Shed Trust For creation of IT Room 10 000
Port Stephens Art Centre Trust Complete landscaping at the Centre 7 700
Joy Cummings Centre Reserve Trust Operational Funds 7 600
Norah Head Reserve Trust Install new signage 1 500
Emmaville Community Centre Trust Fund establishment costs and fund treatment of pests 4 000
Wiangaree Public Hall Trust Repair to hall 25 000
Newcastle Velodrome Trust Repairs to main track to halt water seepage 2 500
Wyangala Waters State Park Ongoing operations of the Park 1 000
Junee Reefs Public Hall Trust Relocation of water tank: roofing and concreting 2 000
Gundagai Shire Council Urgent repairs to Old Gaol 7 500 7 500
Four Post Youth Camp Trust Tree lopping, water pump and power 8 320 6 000
Newcastle Historic Trust Repairs to building 20 000 50 000
Norah Head Light house Trust Public Toilet & sewer construction 55 000 100 000
Yallambie School Reserve Trust Building extensions to support employment program for disabled students 10 000 100 000
East Maitland Community Reserve Trust
Reserve operational costs2 000
Waratah Community Reserve Trust Replace gas supply lines and essential plumbing works 9 000 10 000
Hartley Reserve Trust Painting exterior of old school building 10 000
Binya Public Hall Trust Repairs to roof 7 000 10 000
Bemboka River Reserve - Bega Council
Signage and fencing5 000
Rennie Recreation Reserve Trust Materials to upgrade power supply from two phase to three phase 36 000
Binya Public Hall Trust Towards cost of repairs to roof of the hall on the reserve 7 000 10 000
Brewarrina Business Cooperative Ltd Purchase and installation of security doors for Cultural Museum 8 000
Cumborah Recreation Reserve Trust Purchase cleaning materials for tennis courts and chemical s for toilets 385
Hillston Common Trust Purchase of picnic table for common 2 900
Lightning Ridge Historical Society Trust
Purchase of poly water tank 490
Niangala Community Hall Reserve Trust
Upgrading stage area in community hall 9 800
Sculpture by the Sea Sponsorship and sculpture 67 771
Newcastle Bogey Hole Remedial works to ensure safe access 34 900
Manly Council Establishment of surfing reserve 5 000
National Surfing Website Operational funds 10 000
Shoalhaven Shire Council Install security glass and fencing at Nowra racing Complex 21 500
Kempsey Shire Council Repair and improve access and build viewing platform at Crescent Head Surfing reserve
75 500
Consultancy
Trust Project Amount $
Coffs Harbour Showground Final contribution towards Master Plan 2 969
Snug Cove and Environs Plan of Management 17 732
Port Macquarie Council Plan of Management 17 000
218 APPENDICES NSW TRADE & INVESTMENT ANNUAL REPORT 2010 -11
17. Funds Granted to Non-Government Community Organisations (cont’d)
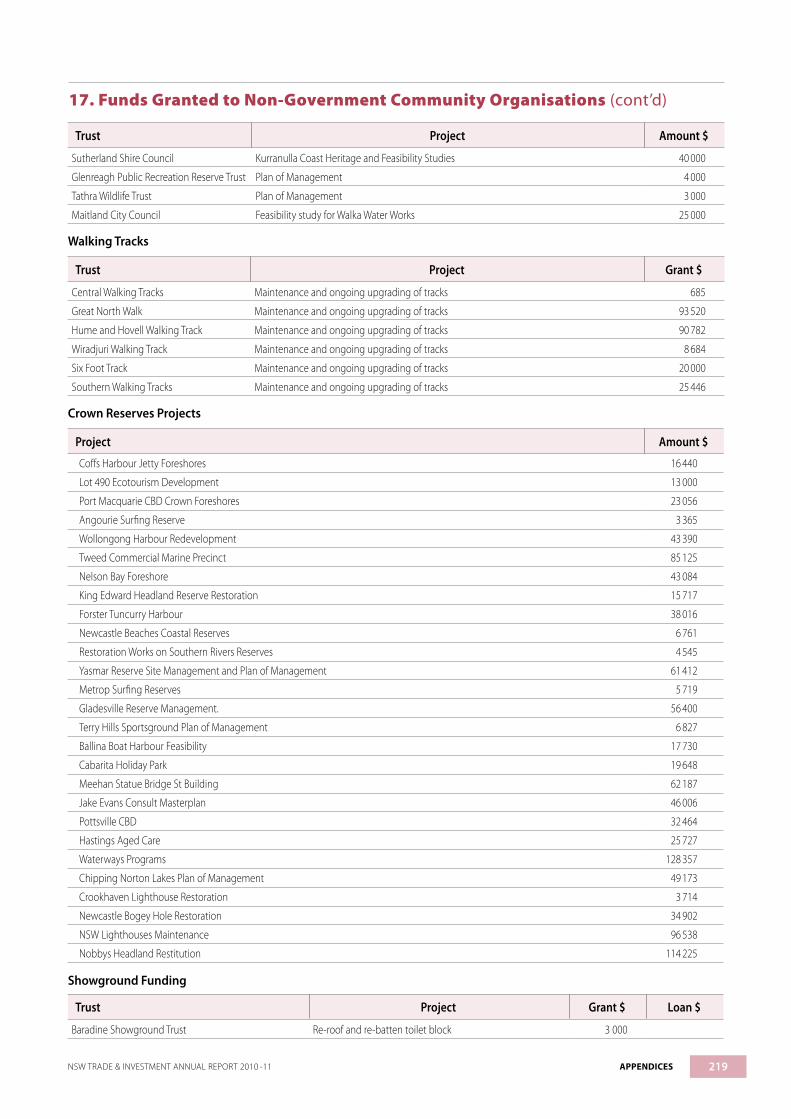
Trust Project Amount $
Sutherland Shire Council Kurranulla Coast Heritage and Feasibility Studies 40 000
Glenreagh Public Recreation Reserve Trust Plan of Management 4 000
Tathra Wildlife Trust Plan of Management 3 000
Maitland City Council Feasibility study for Walka Water Works 25 000
Walking Tracks
Trust Project Grant $
Central Walking Tracks Maintenance and ongoing upgrading of tracks 685
Great North Walk Maintenance and ongoing upgrading of tracks 93 520
Hume and Hovell Walking Track Maintenance and ongoing upgrading of tracks 90 782
Wiradjuri Walking Track Maintenance and ongoing upgrading of tracks 8 684
Six Foot Track Maintenance and ongoing upgrading of tracks 20 000
Southern Walking Tracks Maintenance and ongoing upgrading of tracks 25 446
Crown Reserves Projects
Project Amount $
Coffs Harbour Jetty Foreshores 16 440
Lot 490 Ecotourism Development 13 000
Port Macquarie CBD Crown Foreshores 23 056
Angourie Surfing Reserve 3 365
Wollongong Harbour Redevelopment 43 390
Tweed Commercial Marine Precinct 85 125
Nelson Bay Foreshore 43 084
King Edward Headland Reserve Restoration 15 717
Forster Tuncurry Harbour 38 016
Newcastle Beaches Coastal Reserves 6 761
Restoration Works on Southern Rivers Reserves 4 545
Yasmar Reserve Site Management and Plan of Management 61 412
Metrop Surfing Reserves 5 719
Gladesville Reserve Management. 56 400
Terry Hills Sportsground Plan of Management 6 827
Ballina Boat Harbour Feasibility 17 730
Cabarita Holiday Park 19 648
Meehan Statue Bridge St Building 62 187
Jake Evans Consult Masterplan 46 006
Pottsville CBD 32 464
Hastings Aged Care 25 727
Waterways Programs 128 357
Chipping Norton Lakes Plan of Management 49 173
Crookhaven Lighthouse Restoration 3 714
Newcastle Bogey Hole Restoration 34 902
NSW Lighthouses Maintenance 96 538
Nobbys Headland Restitution 114 225
Showground Funding
Trust Project Grant $ Loan $
Baradine Showground Trust Re-roof and re-batten toilet block 3 000
219NSW TRADE & INVESTMENT ANNUAL REPORT 2010 -11 APPENDICES
17. Funds Granted to Non-Government Community Organisations (cont’d)

Trust Project Grant $ Loan $
Bega Showground Trust Installation of rainwater tanks, bore and associated works 10 000 31 500
Bedgerebong Recreation and Showground Trust Upgrade facilities 5 000
Bellingen Showground Trust Roof repairs and insulation of the main pavilion 15 000 20 000
Boggabri Showground Trust Build new amenities block and fill in disused well 30 707 25 000
Bribbaree Showground Trust Upgrade power supply 3 495 1 000
Candelo Showground Trust Replacement of Luncheon Pavilion flooring 2 500 2 000
Cobargo Showground Trust Upgrade electricals 5 000
Coffs Harbour Showground Trust Masterplan contribution 2 969
Coolamon Shire Council Installation of pump at Ardlethan Showground 6 000 11 570
Dunedoo Showground Trust Install electrical safety switches 7 170 7 000
Dungog Showground Trust Structural works to main grandstand 9 200 10 000
Grafton Showground Trust Replacement of eastern skillion galvanised roofing and guttering and replacement of 32 Skylight Windows
30 000 40 000
Greater Hume Shire Electricity and BBQ for Henty Showground 4 000 5 900
Gulgong Showground Trust Upgrade kitchen and replace windows 4 500 6 500
Inverell Showground Trust Purchase of new lawn mower 5 000 10 000
Kempsey Showground Trust Installation of a grid feed solar system and removal of three dangerous trees
26 070 43 000
Kyogle Showground Trust Refurbishment of Caretakers Cottage 19 300 30 000
Moss Vale DAH&I Replace and upgrade amenities at Showground 12 000 5 000
Mullumbimby Showground Trust Stage 1 Upgrade of electrical system to meet safety standards
6 203 10 000
Murrumburrah Harden Showground Trust Multipurpose cattle/horse shed & yards 17 162 30 000
Murwillumbah Showground Trust Removal and replacement of main switchboard 12 200 30 000
Parkes Showground Trust Upgrading arena lights stage 2, catering facilities and repair grandstand
18 500 21 500
Peak Hill Showground Trust Installation of new amenities block and septic tank system at Peak Hill Showground
15 000 15 000
Tenterfield Showground Trust Repair to grandstand caused by flood 100 000
Wingham Showground Trust Towards upgrading caretaker’s cottage 30 000 32 000
Walgett Council Install portable grandstand at Collarenebri Showground 3 500 1 880
West Wyalong Showground Trust Improvements to the electricity infrastructure supporting the PA system and lighting
8 735
Reserves of High Visitation
Trust Project Grant $
Penrose Park Recreation Reserve Trust General maintenance 20 000
Mount Arthur Reserve Trust Operational costs,4WD vehicle and surveillance camera 40 500
Burrendong Arboretum Trust Fern tree canopy secure works and operational costs 122 000
Goobarragandra Valley Reserves Trust Operational costs 12 500
Wee Jasper Reserves Trust Operational costs 94 000
Caravan Parks
Trust Project Grant $ Loan $
Richmond Valley Council Plan of management for Silver Sands Caravan Park 20 000 30 000
North Coast Accommodation Trust Demolition of existing building and install 2 new cabins at Clarkes Beach Holiday Park
280 000
North Coast Accommodation Trust Build new amenities block at Red Rock Public Recreation Reserve
350 000
220 APPENDICES NSW TRADE & INVESTMENT ANNUAL REPORT 2010 -11
17. Funds Granted to Non-Government Community Organisations (cont’d)
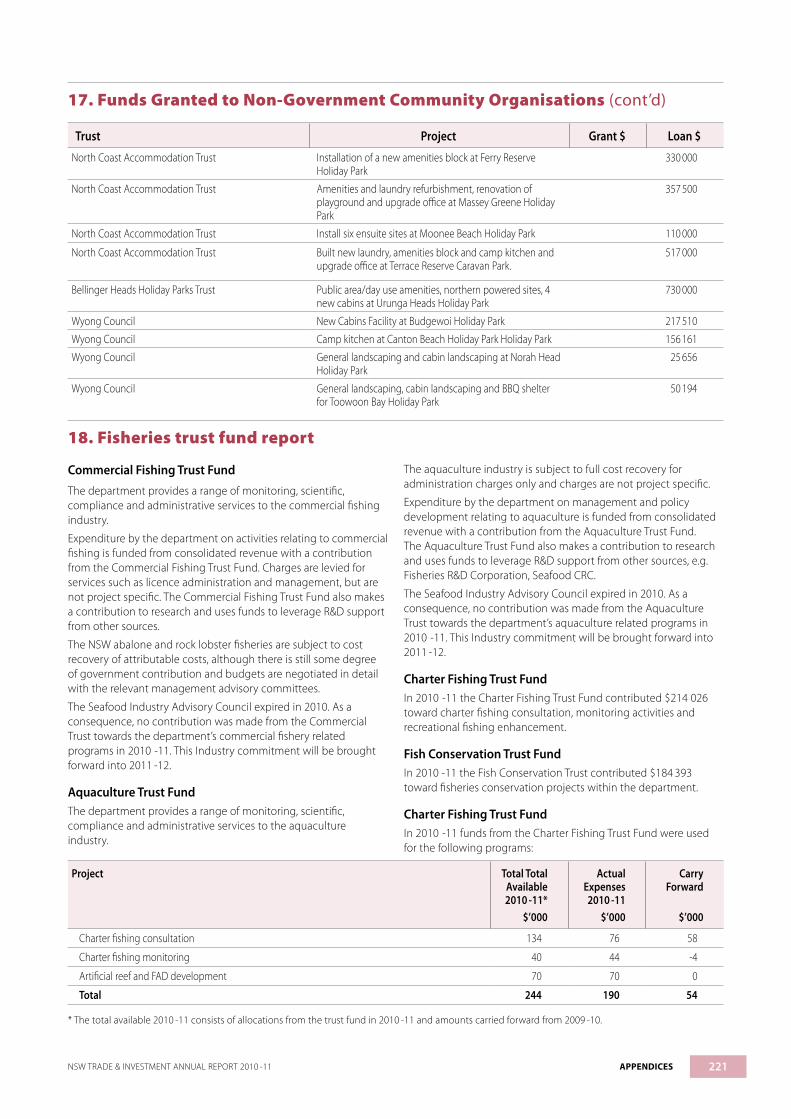
18. Fisheries trust fund report
Commercial Fishing Trust FundThe department provides a range of monitoring, scientific, compliance and administrative services to the commercial fishing industry.
Expenditure by the department on activities relating to commercial fishing is funded from consolidated revenue with a contribution from the Commercial Fishing Trust Fund. Charges are levied for services such as licence administration and management, but are not project specific. The Commercial Fishing Trust Fund also makes a contribution to research and uses funds to leverage R&D support from other sources.
The NSW abalone and rock lobster fisheries are subject to cost recovery of attributable costs, although there is still some degree of government contribution and budgets are negotiated in detail with the relevant management advisory committees.
The Seafood Industry Advisory Council expired in 2010. As a consequence, no contribution was made from the Commercial Trust towards the department’s commercial fishery related programs in 2010 -11. This Industry commitment will be brought forward into 2011 -12.
Aquaculture Trust FundThe department provides a range of monitoring, scientific, compliance and administrative services to the aquaculture industry.
The aquaculture industry is subject to full cost recovery for administration charges only and charges are not project specific.
Expenditure by the department on management and policy development relating to aquaculture is funded from consolidated revenue with a contribution from the Aquaculture Trust Fund. The Aquaculture Trust Fund also makes a contribution to research and uses funds to leverage R&D support from other sources, e.g. Fisheries R&D Corporation, Seafood CRC.
The Seafood Industry Advisory Council expired in 2010. As a consequence, no contribution was made from the Aquaculture Trust towards the department’s aquaculture related programs in 2010 -11. This Industry commitment will be brought forward into 2011 -12.
Charter Fishing Trust FundIn 2010 -11 the Charter Fishing Trust Fund contributed $214 026 toward charter fishing consultation, monitoring activities and recreational fishing enhancement.
Fish Conservation Trust FundIn 2010 -11 the Fish Conservation Trust contributed $184 393 toward fisheries conservation projects within the department.
Charter Fishing Trust FundIn 2010 -11 funds from the Charter Fishing Trust Fund were used for the following programs:
Project Total Total Available 2010 -11*
$’000
Actual Expenses 2010 -11
$’000
Carry Forward
$’000
Charter fishing consultation 134 76 58
Charter fishing monitoring 40 44 -4
Artificial reef and FAD development 70 70 0
Total 244 190 54
* The total available 2010 -11 consists of allocations from the trust fund in 2010 -11 and amounts carried forward from 2009 -10.
Trust Project Grant $ Loan $
North Coast Accommodation Trust Installation of a new amenities block at Ferry Reserve Holiday Park
330 000
North Coast Accommodation Trust Amenities and laundry refurbishment, renovation of playground and upgrade office at Massey Greene Holiday Park
357 500
North Coast Accommodation Trust Install six ensuite sites at Moonee Beach Holiday Park 110 000
North Coast Accommodation Trust Built new laundry, amenities block and camp kitchen and upgrade office at Terrace Reserve Caravan Park.
517 000
Bellinger Heads Holiday Parks Trust Public area/day use amenities, northern powered sites, 4 new cabins at Urunga Heads Holiday Park
730 000
Wyong Council New Cabins Facility at Budgewoi Holiday Park 217 510
Wyong Council Camp kitchen at Canton Beach Holiday Park Holiday Park 156 161
Wyong Council General landscaping and cabin landscaping at Norah Head Holiday Park
25 656
Wyong Council General landscaping, cabin landscaping and BBQ shelter for Toowoon Bay Holiday Park
50 194
221NSW TRADE & INVESTMENT ANNUAL REPORT 2010 -11 APPENDICES
17. Funds Granted to Non-Government Community Organisations (cont’d)

Recreational Fishing (Saltwater) Trust Fund In 2010 -11 funds from the Recreational Fishing (Saltwater) Trust Fund were used for the following programs:
Project Total Available 2010 -11*
$’000
Actual Expenses 2010 -11
$’000
Carry Forward
$’000
ACoRF meeting expenses 28 32 -3
Angel rings installation 21 21 0
Artificial reefs monitoring and research 266 201 66
Barotrauma in coastal recreational fishing species research 233 163 71
Biology of estuary perch and rock blackfish 60 20 39
Clifton Gardens jetty upgrade 50 50 0
Coastal fish habitat protection and management 167 168 -1
Coastal habitat restoration grants program 747 406 341
Coopernook fishing platform 46 0 46
Estuarine artificial reefs deployment 625 770 -145
Eurobodalla fish cleaning tables 61 0 61
Eurobodalla sustainable recreational fishing education program 14 0 14
Expenditure committee meeting expenses 30 30 0
Fish aggregation devices (FADs) 311 317 -6
Fishcare volunteer program 533 580 -47
Fisheries officers (9 coastal officers) 1 053 979 75
Fisheries officers (mobile squad) 165 534 -369
Gamefish tagging program 135 127 8
Gosford fish cleaning tables 85 0 85
Greater Sydney region recreational fishing survey survey and extension 52 2 50
Lake Macquarie fish cleaning tables 23 0 23
Long Jetty upgrade – Wyong Council 12 12 0
Marine recreational management project 55 55 0
Marine stocking environmental impact statement 244 194 50
Maximising survival of recreationally caught fish research 230 214 16
Membership to Recfish Australia 46 20 26
Merimbula public jetty upgrade 45 45 0
Moruya River anglers fishing platform 8 0 8
Movements of key recreational fishing species 50 10 40
Mulloway and prawn stocking research in NSW estuaries 220 109 111
National Marine Science Centre recreational fishing display 20 0 20
Offshore artificial reef design and construction 460 25 435
Production of rockfishing safety resource folder 5 5 0
Recreational fishing access (coastal) 129 136 -8
Recreational fishing governance project 37 37 0
Recreational fishing havens 1 965 1 965 0
Recreational fishing in Shoalhaven River 82 25 57
Recreational fishing trust executive officer 159 173 -14
Recreational fishing publications 232 145 87
Research on recreational fishing cost effective sampling methods 50 27 23
Research on Mangrove Jack 54 0 54
Research on recreational fishing havens 287 273 14
222 APPENDICES NSW TRADE & INVESTMENT ANNUAL REPORT 2010 -11
18. Fisheries trust fund report (cont’d)

Project Total Available 2010 -11*
$’000
Actual Expenses 2010 -11
$’000
Carry Forward
$’000
Research on relationships between bag and size limits & management 25 0 25
Research on striped marlin 1 1 0
Research survey on licence churn 42 0 42
Richmond River rescue 20 20 0
Research on grey nurse shark fishing interactions 74 74 0
Research on tagging of iconic recreational species 203 133 70
Rockfishing safety workshops 20 17 3
Satellite tagging of tiger sharks 7 0 7
Small grants program 100 90 10
Southern bluefin tuna assessment 2 0 2
Statewide survey of recreational fishing in NSW workshops 50 16 34
Stockton recreational fishing platform 32 0 32
Study on landed fish at gamefishing tournaments 35 27 8
Study on rock fishing fatalities 44 44 0
Swansea radio tower 11 11 0
Sydney International Boat Show fishing clinic 20 20 0
Young Leaders Program 6 0 6
Total 9 787 8 323 1 466
* The total available 2010 -11 consists of allocations from the trust fund in 2010 -11 and amounts carried forward from 2009 -10.
ACoRF meeting expenses - the Advisory Council on Recreational Fishing (ACoRF) provides high quality advice to the Minister for Primary Industries on issues relating to recreational fishing.Angel rings installation – involves deployment of angel rings (lifebuoys) at rockfishing blackspots.Artificial reefs monitoring and research – investigation of the effectiveness of artificial reefs with regard to changes in fish populations.Barotrauma in coastal recreational fishing species research – investigates the effects of barotrauma on the behaviour and physiology of key recreational fish species in NSW.Biology of estuary perch and rock blackfish – essential research of key recreational species along the NSW coast.Clifton Gardens jetty upgrade – supporting funds for essential upgrade works at a popular fishing location.Coastal fish habitat protection and management – this position manages fisheries habitat protection issues, threatened species management and enhances recreational fisheries and fishing access via development assessment and land use planning processes.Coastal habitat restoration grants program – matching funds for angling clubs, local councils and other groups for on-grounds habitat rehabilitation projects to enhance native fish stocks.Coopernook fishing platform - construction of a fishing platformEstuarine artificial reefs deployment – deployment of artificial reefs in estuaries to enhance angler catch.Eurobodalla fish cleaning tables – construction of seven fish cleaning tables in the Eurobodalla area.Eurobodalla sustainable recreational fishing education program - engage recreational fishing and school groups throughout the
Eurobodalla region to promote sustainable fishing practices.Expenditure committee meeting expenses – the Recreational Fishing Saltwater Trust Expenditure Committee (RFSTEC) provides advice on Trust expenditure to ACoRF.Fish aggregating devices (FADs) - these are placed in coastal waters to attract pelagic fish such as mahi-mahi, tunas and marlin for recreational angling.Fishcare volunteer program - a dynamic volunteer program providing face to face education of recreational fishers, including promoting awareness of fishing rules and sustainable fishing.Fisheries officers (9 coastal officers) – to maximise compliance with fishing rules and provide advisory services to recreational fishers.Fisheries officers (mobile squads) - mobile support groups with 3 Trust funded officers with rapid response capacity to promote compliance with fishing regulations. Gamefish tagging program – provides valuable scientific information on the movement and growth of billfish, tuna, sharks and sportfish.Gosford fish cleaning tables – construction of eleven fish cleaning tables in the Gosford area.Greater Sydney recreational fishing survey and extension – involves setting up a web based portal to disseminate research survey information to anglers.Lake Macquarie fish cleaning tables - construction of five fish cleaning tables in the Lake Macquarie area.Long Jetty upgrade – supporting funds for essential works at a popular fishing location in the Wyong area.Marine recreational management project – development of new recreational fisheries initiatives and advisory tools.
223NSW TRADE & INVESTMENT ANNUAL REPORT 2010 -11 APPENDICES
18. Fisheries trust fund report (cont’d)

Marine stocking environmental impact statement – investigating environmental impacts of a new marine stocking program.Maximising survival of recreationally caught fish research – study to estimate the survival of popular recreational estuarine species and to determine factors that increase survival when released.Membership to RecFish Australia - represents the interests of recreational fishers at a national level.Merimbula public jetty upgrade - supporting funds for essential works at a popular fishing location.Moruya River anglers fishing platform - construction of a fishing platform.Movements of key recreational fishing species – involves tagging of fish to measure detailed movements.Mulloway and prawn stocking research in NSW estuaries - research to explore the effects of stocking mulloway fingerlings and prawn juveniles in estuaries.National Marine Science Centre recreational fishing display – contributing funding for an interactive display of recreational fishing projects, advisory information and aquariums with recreational species.Offshore artificial reef design and construction – involves developing a detailed design of the offshore reefs and construction and deployment the artificial reefs.Production of rockfishing safety resource folder – involves a reprint of rockfishing DVDs for anglers.Recreational fishing access (coastal) – identification of sites of significance to recreational fishing to secure and maintain fair access for anglers.Recreational fishing governance project – investigation of options to improve governance arrangements for the recreational fishing sector.Recreational fishing havens – involves repayment of a loan used for the buyout of commercial fishing entitlements to create 30 recreational fishing havens.Recreational fishing in Shoalhaven River - research surveys in the Shoalhaven River, including regional stakeholder workshops.Recreational fishing trust executive officer - oversees the Recreational Fishing Trusts and provides efficient service delivery to the Expenditure Committees and ACoRF.Recreational fishing publications – boosts production of advisory material to educate the community about responsible and sustainable fishing.Research on cost effective sampling methods – investigation of methods for surveys of recreational fishers.Research on Mangrove Jack – investigation of diet, growth, age, longevity of Mangrove Jack.
Research on recreational fishing havens – involves surveys of fish in havens.Research on relationships between bag and size limits & management – research to improve our empirical understanding of the benefits of bag and size limits.Research on striped marlin – investigation of age, growth and reproduction of this important recreational species.Research survey on licence churn – investigating why some anglers do not renew their fishing licence.Richmond River rescue – installation of flood mitigation gates in the Richmond River floodplain to improve environmental outcomes.Research on grey nurse shark fishing interactions – investigation of the behavioural response of grey nurse sharks to different recreational hook-and-line methods.Research on tagging of iconic recreational species – development of a spatial model for the distribution and movements of key recreational species.Rockfishing safety workshops – community workshops to promote rockfishing safety.Satellite tagging of tiger sharks – gathering of detailed information on the movements of tigers sharks.Small grants program – provides grants for fishing clubs, councils and other community members for small, local projects aimed at enhancing recreational fishing.Southern bluefin tuna assessment – involves carrying out a species impact statement for this highly valued species.Statewide survey of recreational fishing in NSW workshops – identify the most cost effective methods for estimating recreational catch at a statewide level.Stockton recreational fishing platform – construction of a fishing platform.Study of landed fish at gamefishing tournaments - collection of valuable biological data on gamefish at gamefishing tournaments across NSW.Study on rock fishing fatalities – study of recreational fishing related drownings since 2000 to develop water safety initiatives.Swansea radio tower – to improve safety for recreational fishing boaters in the Swansea region. Sydney International Boat Show fishing clinic – contributing funding for the fishing clinic at the popular Sydney International Boat Show.Young Leaders Program – education and mentoring of young people by recognised leaders in recreational fishing advocacy and management.
Recreational Fishing (Freshwater) Trust Fund In 2010 -11 funds from the Recreational Fishing (Freshwater) Trust Fund were used for the following programs:
Project Total Available 2010 -11*
$’000
Actual Expenses 2010 -11
$’000
Carry Forward
$’000
Corowa fishing platform 25 0 25
Dollar-for-dollar native fish stocking program 200 159 41
Detecting Redfin in Coxs River 15 11 4
224 APPENDICES NSW TRADE & INVESTMENT ANNUAL REPORT 2010 -11
18. Fisheries trust fund report (cont’d)

Project Total Available 2010 -11*
$’000
Actual Expenses 2010 -11
$’000
Carry Forward
$’000
Effectiveness of stocking research 200 201 -1
Enhanced fish production for stocking 391 386 5
Expenditure committee meeting expenses 26 28 -1
Fishcare volunteer program 160 169 -9
Fisheries officers (inland) 756 728 27
Freshwater catfish research 5 5 0
Freshwater recreational management 163 171 -8
Gaden trout hatchery 491 711 -220
Hatchery trainee program 5 1 4
Hatchery tour guide 51 56 -4
Inland habitat restoration grants program 259 171 89
Inland stocking management officer 104 93 11
Macquarie perch research 3 3 0
Maximising survival of inland line caught fish research 217 198 18
Murray cod research 71 64 7
Nodavirus research 72 48 24
Recreational fishing access (inland) 145 155 -11
Regional fish habitat manager 149 167 -18
Research on bass populations in Clarence River 15 12 3
Research on bass stocking rates 67 52 16
Small grants program 60 62 -2
Species impact statement – Trout Cod in dams 30 0 30
Total 3 680 3 651 30
* The total available 2010 -11 consists of allocations from the trust fund in 2010 -11 and amounts carried forward from 2009 -10.
Corowa fishing platform - construction of a fishing platform.
Dollar-for-dollar native fish stocking program – provides grants for fishing clubs, councils and community groups to buy native fish from hatcheries to stock in approved public waterways.
Detecting Redfin in Coxs River – survey of the Coxs River to detect the presence and prevent spread of redfin perch.
Effectiveness of stocking research – research to improve effectiveness of freshwater stocking practices in NSW.
Enhanced fish production for stocking – enhancement of the stocking capacity of fish hatcheries at Narrandera, Jindabyne, Ebor and Port Stephens.
Expenditure committee meeting expenses – the Recreational Fishing Freshwater Trust Expenditure Committee (RFFTEC) provides advice on priorities for Trust expenditure to ACoRF.
Fishcare volunteer program - a dynamic volunteer program providing face to face education of recreational fishers, including promoting awareness of fishing rules and sustainable fishing.
Fisheries officers (Inland) – 6 additional officers to maximise compliance with fishing rules and provide advisory services to recreational fishers.
Freshwater catfish research – aims to identify patterns of population structure in freshwater catfish and identify suitable reintroduction sites within the Murray-Darling catchment.
Freshwater recreational management – management of fish stocking programs in NSW and community liaison and correspondence with fishing clubs and other key stakeholder groups.
Gaden trout hatchery – involves production of trout for stocking in public waterways.
Hatchery trainee program – provides support for work experience students to learn hatchery skills at Narrandera.
Hatchery tour guide – provides informative and interactive tours for visitors at the Gaden Trout Hatchery.
Inland habitat restoration grants program – provides matching funding to angling clubs, local councils and Landcare groups for on-grounds habitat rehabilitation projects to enhance native fish stocks.
Inland stocking management officer – monitoring and assessment of inland stockings to improve environmental outcomes.
Macquarie perch research - investigation of captive breeding techniques of Macquarie perch.
Maximising survival of inland line caught fish research – studies to estimate the survival of popular recreational inland species and establish factors that increase survival when released.
Murray cod research – involves biological research on this iconic species.
225NSW TRADE & INVESTMENT ANNUAL REPORT 2010 -11 APPENDICES
18. Fisheries trust fund report (cont’d)

Nodavirus research – aims to understand the causes and management of nodavirus outbreaks in Australian bass to ensure ongoing stocking of the species.
Recreational fishing access (inland) – identification of travelling stock reserves and other parcels of land of significance to anglers to ensure maintenance of appropriate access for fishers.
Regional fish habitat manager – inland conservation management focused on protecting and rehabilitating valuable freshwater fish habitats for healthy and productive recreational fisheries.
Research on bass populations in Clarence River – investigation of life history parameters in a local bass population.
Research on bass stocking rates – scientific modelling and determination of appropriate stocking rates and sizes for Australian bass.
Small grants program – provides grants for fishing clubs, councils and other community members for small, local projects aimed at enhancing recreational fishing.
Species impact statement – Trout Cod in dams – undertaking a Species Impact Statement to enable potential fishing of Trout Cod in stocked impoundments.
Funds from the Freshwater and Saltwater trust funds were jointly used for the following programs
Project Total Available 2010 -11*
$’000
Actual Expenses 2010 -11
$’000
Carry Forward
$’000
Economic survey of recreational fishing 75 0 75
Fishing guides 114 168 -54
Fishing promotion 50 20 30
Fishing safety DVD 40 28 12
Fishing workshops 88 89 -1
Get hooked….its fun to fish school education program 411 417 -7
Recreational fishing fee administration 1 538 1 396 141
Recreational fishing fee renewal notice 165 146 19
Recreational fishing fee research database 90 36 54
Recreational Fishing Infrastructure Manager 134 136 -3
Recreational fishing promotion calendar 28 25 3
Recreational fishing reserves access project 140 65 75
Tournament management 142 89 53
Tournament monitoring 189 198 -10
Total 3 204 2 813 389
* The total available 2010 -11 consists of allocations from the trust fund in 2010 -11 and amounts carried forward from 2009 -10.
Economic survey of recreational fishing – involves development of cost effective methodology and a survey of recreational fishing.
Fishing guides – printing and distribution of 300 000 Recreational Saltwater and Freshwater Guides free of charge to anglers.
Fishing promotion – raises awareness of fishing rules, including the need for a recreational fishing licence, to encourage responsible and sustainable fishing practices.
Fishing safety DVD – production of high quality DVD modules on fishing safely.
Fishing workshops – children’s workshops across regional NSW, including workshops for special needs groups and culturally and linguistically diverse communities.
Get Hooked…Its fun to fish school education program – a primary school education program teaching children the importance of aquatic habitats and to introduce them to safe and responsible fishing.
Recreational fishing fee administration - management of a network of 1000 fee agents, and internet and telephone fee payment systems. Includes payment of agent commissions.
Recreational fishing fee renewal notice – mailing out of renewal letters (with advisory material) to one and three year fee receipt holders.
Recreational fishing fee research database – collection of information on fishing fee receipt holders, including names, addresses, phone details and other demographic information for use in surveys of recreational angling.
Recreational fishing infrastructure manager – development of recreational fishing infrastructure projects and on-grounds works throughout NSW to provide quality fishing facilities.
Recreational fishing promotion calendar – production of a calendar to promote the Trusts and recreational fishing.
Recreational fishing reserves access project – to establish crown land reserves dedicated for recreational fishing.
Tournament management – development and implementation of a code of conduct for fishing competitions to improve the environmental and social impacts of these events.
Tournament monitoring – collection of catch and effort information at selected fishing competitions across NSW to monitor fish populations.
226 APPENDICES NSW TRADE & INVESTMENT ANNUAL REPORT 2010 -11
18. Fisheries trust fund report (cont’d)
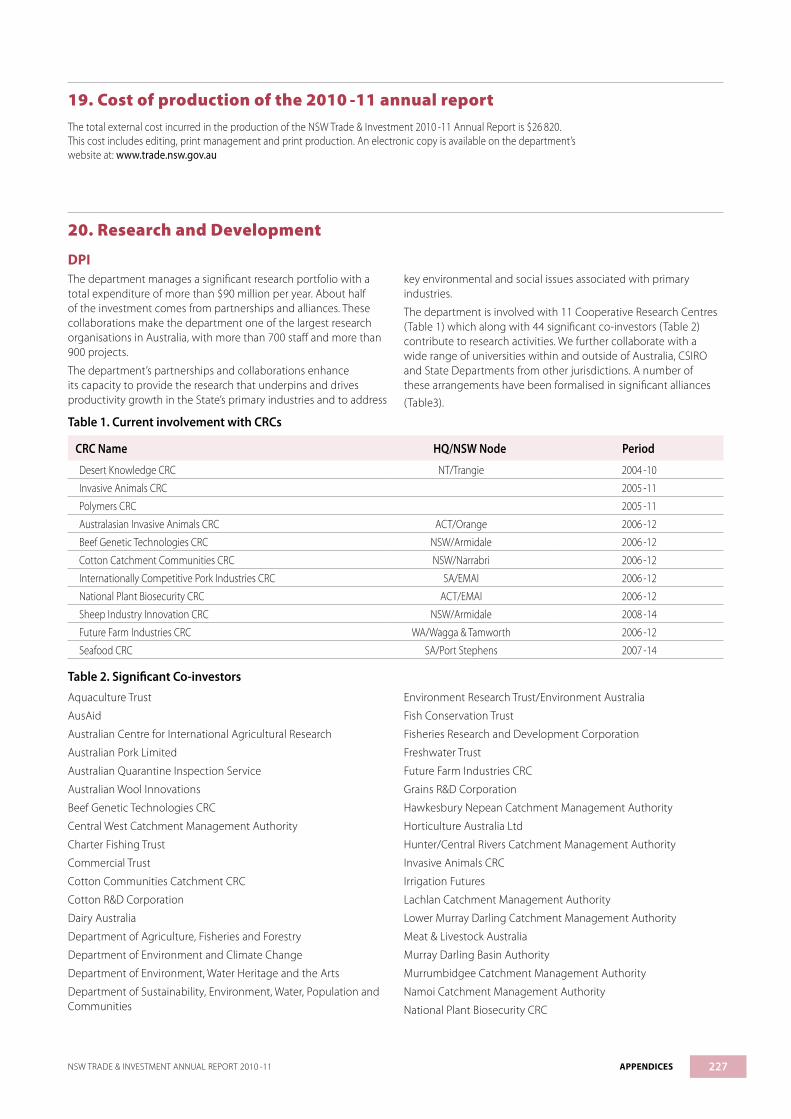
19. Cost of production of the 2010 -11 annual reportThe total external cost incurred in the production of the NSW Trade & Investment 2010 -11 Annual Report is $26 820. This cost includes editing, print management and print production. An electronic copy is available on the department’s website at: www.trade.nsw.gov.au
20. Research and Development
DPI The department manages a significant research portfolio with a total expenditure of more than $90 million per year. About half of the investment comes from partnerships and alliances. These collaborations make the department one of the largest research organisations in Australia, with more than 700 staff and more than 900 projects.
The department’s partnerships and collaborations enhance its capacity to provide the research that underpins and drives productivity growth in the State’s primary industries and to address
key environmental and social issues associated with primary industries.
The department is involved with 11 Cooperative Research Centres (Table 1) which along with 44 significant co-investors (Table 2) contribute to research activities. We further collaborate with a wide range of universities within and outside of Australia, CSIRO and State Departments from other jurisdictions. A number of these arrangements have been formalised in significant alliances (Table3).
Table 1. Current involvement with CRCs
CRC Name HQ/NSW Node Period
Desert Knowledge CRC NT/Trangie 2004 -10
Invasive Animals CRC 2005 -11
Polymers CRC 2005 -11
Australasian Invasive Animals CRC ACT/Orange 2006 -12
Beef Genetic Technologies CRC NSW/Armidale 2006 -12
Cotton Catchment Communities CRC NSW/Narrabri 2006 -12
Internationally Competitive Pork Industries CRC SA/EMAI 2006 -12
National Plant Biosecurity CRC ACT/EMAI 2006 -12
Sheep Industry Innovation CRC NSW/Armidale 2008 -14
Future Farm Industries CRC WA/Wagga & Tamworth 2006 -12
Seafood CRC SA/Port Stephens 2007 -14
Table 2. Significant Co-investorsAquaculture Trust
AusAid
Australian Centre for International Agricultural Research
Australian Pork Limited
Australian Quarantine Inspection Service
Australian Wool Innovations
Beef Genetic Technologies CRC
Central West Catchment Management Authority
Charter Fishing Trust
Commercial Trust
Cotton Communities Catchment CRC
Cotton R&D Corporation
Dairy Australia
Department of Agriculture, Fisheries and Forestry
Department of Environment and Climate Change
Department of Environment, Water Heritage and the Arts
Department of Sustainability, Environment, Water, Population and Communities
Environment Research Trust/Environment Australia
Fish Conservation Trust
Fisheries Research and Development Corporation
Freshwater Trust
Future Farm Industries CRC
Grains R&D Corporation
Hawkesbury Nepean Catchment Management Authority
Horticulture Australia Ltd
Hunter/Central Rivers Catchment Management Authority
Invasive Animals CRC
Irrigation Futures
Lachlan Catchment Management Authority
Lower Murray Darling Catchment Management Authority
Meat & Livestock Australia
Murray Darling Basin Authority
Murrumbidgee Catchment Management Authority
Namoi Catchment Management Authority
National Plant Biosecurity CRC
227NSW TRADE & INVESTMENT ANNUAL REPORT 2010 -11 APPENDICES

NHT – Weeds of National Significance
Northern Rivers Catchment Management
Pork CRC
Rural Industries R&D Corporation
Saltwater Trust
Sheep Industry Innovations CRC
Southern Rivers Catchment Management Authority
Sydney Water
Western Catchment Management Authority
Table 3. Formal Alliances
Alliance Key Partners
Animal Genetics and Breeding Unit University of New England
Australian Cotton Research Institute CSIRO
Australian Lucerne Alliance Grains R&D Corporation Seedmark
EH Graham Centre for Agricultural Innovation Charles Sturt University
National Centre for Greenhouse Gas Research University of New England
Primary Industries Innovation Centre University of New England
Industry, Innovation & Investment Division (incl Tourism NSW)During 2010 -11, the department’s Industry, Innovation & Investment Division continued to engage the Hunter Valley Research Foundation and the Illawarra Regional Information Service to provide research and information services to assist their regional communities, government, business, and academic institutions. As well as specialising in economic, community and industry research and analyses, these organisations provide publications, data sheets, presentations and other resources and consultancy services that assist business and investment planning.
In 2010 -11, Tourism NSW continued to provide research funding and advice for a range of studies and surveys. During the year, advice and/or funding were provided for:
• National and International Visitor Surveys
• Destination Visitor Surveys for the following destinations: Byron Shire, Sapphire Coast, Coffs Coast and Forster – Tuncurry.
• Brand Health Tracking
• Sydney Precinct Perception Study
• Advertising evaluation studies
• Regional tourism snapshots
• International market profiles
• Domestic tourism snapshots for holiday and business visitors and those visiting friends and relatives
• Snapshots and factsheets for market segments including wine and food tourism and outbound tourism
• Snapshots summarising the ABS Overseas Arrivals and Departures data
• Snapshots summarising the ABS Survey of Tourism Accommodation data
• Aviation industry analysis
• New South Wales Tourism Satellite Accounts (UNSW)
• Australians’ Travel Behaviour – Ethnicity Analysis
The department’s Office for Science and Medical Research provided funding in 2010 -11 to New South Wales research and development through a range of programs including:
• Life Sciences Research Awards
• Medical Research Support Program (MRSP)
• NSW-China Collaborative Research Program
• NSW-Gangwon Technology Collaboration Program
• Joint NSW/VIC Stem Cell Grants Program
• Science Leveraging Fund Program
• NSW Cooperative Research Centres (CRCs) Bid Support Program
• Spinal Cord Injury & Related Neurological Conditions Grants Program
• TechVouchers Program
• Science Information and Awareness
• National Science Week NSW Science Exposed support grants program
• Medical Research Networks.
Office Liquor, Gaming and Racing (OLGR)Through the department’s Office Liquor Gaming and Racing a wide range of gambling-related research projects were commissioned, continued or completed during 2010 -11. Research was funded by the Responsible Gambling Fund (RGF), and included projects commissioned under the auspices of Gambling Research Australia, a national program. Detailed information about individual research projects is contained in the RGF’s annual report.
20. Research and Development (cont’d)
228 APPENDICES NSW TRADE & INVESTMENT ANNUAL REPORT 2010 -11
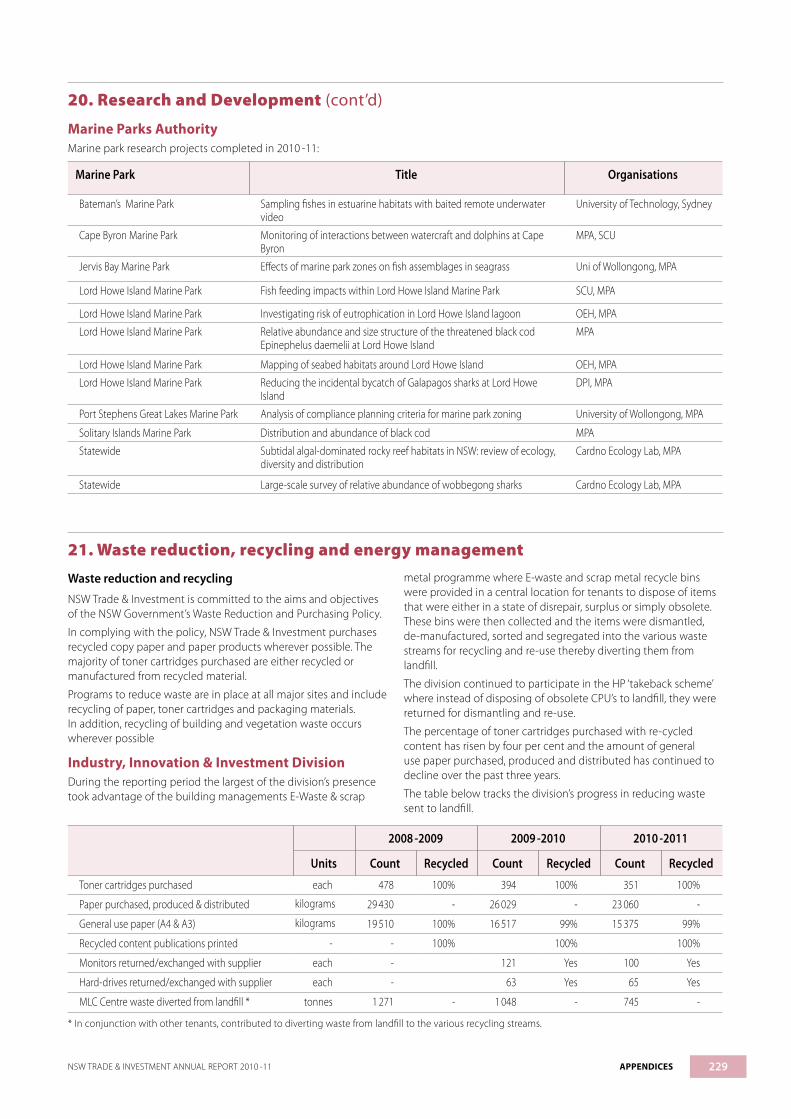
Marine Parks AuthorityMarine park research projects completed in 2010 -11:
Marine Park Title Organisations
Bateman’s Marine Park Sampling fishes in estuarine habitats with baited remote underwater video
University of Technology, Sydney
Cape Byron Marine Park Monitoring of interactions between watercraft and dolphins at Cape Byron
MPA, SCU
Jervis Bay Marine Park Effects of marine park zones on fish assemblages in seagrass Uni of Wollongong, MPA
Lord Howe Island Marine Park Fish feeding impacts within Lord Howe Island Marine Park SCU, MPA
Lord Howe Island Marine Park Investigating risk of eutrophication in Lord Howe Island lagoon OEH, MPA
Lord Howe Island Marine Park Relative abundance and size structure of the threatened black cod Epinephelus daemelii at Lord Howe Island
MPA
Lord Howe Island Marine Park Mapping of seabed habitats around Lord Howe Island OEH, MPA
Lord Howe Island Marine Park Reducing the incidental bycatch of Galapagos sharks at Lord Howe Island
DPI, MPA
Port Stephens Great Lakes Marine Park Analysis of compliance planning criteria for marine park zoning University of Wollongong, MPA
Solitary Islands Marine Park Distribution and abundance of black cod MPA
Statewide Subtidal algal-dominated rocky reef habitats in NSW: review of ecology, diversity and distribution
Cardno Ecology Lab, MPA
Statewide Large-scale survey of relative abundance of wobbegong sharks Cardno Ecology Lab, MPA
20. Research and Development (cont’d)
21. Waste reduction, recycling and energy management
Waste reduction and recyclingNSW Trade & Investment is committed to the aims and objectives of the NSW Government’s Waste Reduction and Purchasing Policy.
In complying with the policy, NSW Trade & Investment purchases recycled copy paper and paper products wherever possible. The majority of toner cartridges purchased are either recycled or manufactured from recycled material.
Programs to reduce waste are in place at all major sites and include recycling of paper, toner cartridges and packaging materials. In addition, recycling of building and vegetation waste occurs wherever possible
Industry, Innovation & Investment DivisionDuring the reporting period the largest of the division’s presence took advantage of the building managements E-Waste & scrap
metal programme where E-waste and scrap metal recycle bins were provided in a central location for tenants to dispose of items that were either in a state of disrepair, surplus or simply obsolete. These bins were then collected and the items were dismantled, de-manufactured, sorted and segregated into the various waste streams for recycling and re-use thereby diverting them from landfill.
The division continued to participate in the HP ‘takeback scheme’ where instead of disposing of obsolete CPU’s to landfill, they were returned for dismantling and re-use.
The percentage of toner cartridges purchased with re-cycled content has risen by four per cent and the amount of general use paper purchased, produced and distributed has continued to decline over the past three years.
The table below tracks the division’s progress in reducing waste sent to landfill.
2008 -2009 2009 -2010 2010 -2011
Units Count Recycled Count Recycled Count Recycled
Toner cartridges purchased each 478 100% 394 100% 351 100%
Paper purchased, produced & distributed kilograms 29 430 - 26 029 - 23 060 -
General use paper (A4 & A3) kilograms 19 510 100% 16 517 99% 15 375 99%
Recycled content publications printed - - 100% 100% 100%
Monitors returned/exchanged with supplier each - 121 Yes 100 Yes
Hard-drives returned/exchanged with supplier each - 63 Yes 65 Yes
MLC Centre waste diverted from landfill * tonnes 1 271 - 1 048 - 745 -
* In conjunction with other tenants, contributed to diverting waste from landfill to the various recycling streams.
229NSW TRADE & INVESTMENT ANNUAL REPORT 2010 -11 APPENDICES
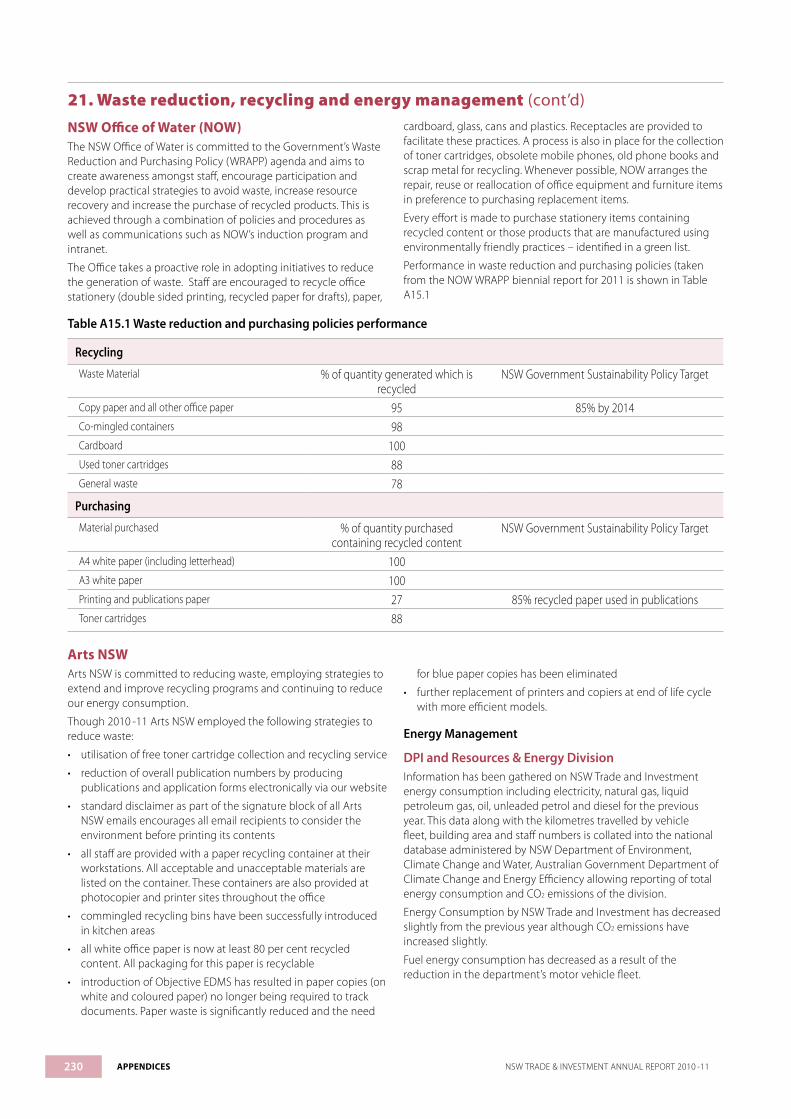
NSW Office of Water (NOW)The NSW Office of Water is committed to the Government’s Waste Reduction and Purchasing Policy (WRAPP) agenda and aims to create awareness amongst staff, encourage participation and develop practical strategies to avoid waste, increase resource recovery and increase the purchase of recycled products. This is achieved through a combination of policies and procedures as well as communications such as NOW’s induction program and intranet.
The Office takes a proactive role in adopting initiatives to reduce the generation of waste. Staff are encouraged to recycle office stationery (double sided printing, recycled paper for drafts), paper,
cardboard, glass, cans and plastics. Receptacles are provided to facilitate these practices. A process is also in place for the collection of toner cartridges, obsolete mobile phones, old phone books and scrap metal for recycling. Whenever possible, NOW arranges the repair, reuse or reallocation of office equipment and furniture items in preference to purchasing replacement items.
Every effort is made to purchase stationery items containing recycled content or those products that are manufactured using environmentally friendly practices – identified in a green list.
Performance in waste reduction and purchasing policies (taken from the NOW WRAPP biennial report for 2011 is shown in Table A15.1
Table A15.1 Waste reduction and purchasing policies performance
Recycling
Waste Material % of quantity generated which is recycled
NSW Government Sustainability Policy Target
Copy paper and all other office paper 95 85% by 2014Co-mingled containers 98Cardboard 100Used toner cartridges 88General waste 78
Purchasing
Material purchased % of quantity purchased containing recycled content
NSW Government Sustainability Policy Target
A4 white paper (including letterhead) 100A3 white paper 100Printing and publications paper 27 85% recycled paper used in publicationsToner cartridges 88
Arts NSWArts NSW is committed to reducing waste, employing strategies to extend and improve recycling programs and continuing to reduce our energy consumption.
Though 2010 -11 Arts NSW employed the following strategies to reduce waste:
• utilisation of free toner cartridge collection and recycling service
• reduction of overall publication numbers by producing publications and application forms electronically via our website
• standard disclaimer as part of the signature block of all Arts NSW emails encourages all email recipients to consider the environment before printing its contents
• all staff are provided with a paper recycling container at their workstations. All acceptable and unacceptable materials are listed on the container. These containers are also provided at photocopier and printer sites throughout the office
• commingled recycling bins have been successfully introduced in kitchen areas
• all white office paper is now at least 80 per cent recycled content. All packaging for this paper is recyclable
• introduction of Objective EDMS has resulted in paper copies (on white and coloured paper) no longer being required to track documents. Paper waste is significantly reduced and the need
for blue paper copies has been eliminated
• further replacement of printers and copiers at end of life cycle with more efficient models.
Energy Management
DPI and Resources & Energy DivisionInformation has been gathered on NSW Trade and Investment energy consumption including electricity, natural gas, liquid petroleum gas, oil, unleaded petrol and diesel for the previous year. This data along with the kilometres travelled by vehicle fleet, building area and staff numbers is collated into the national database administered by NSW Department of Environment, Climate Change and Water, Australian Government Department of Climate Change and Energy Efficiency allowing reporting of total energy consumption and CO2 emissions of the division.
Energy Consumption by NSW Trade and Investment has decreased slightly from the previous year although CO2 emissions have increased slightly.
Fuel energy consumption has decreased as a result of the reduction in the department’s motor vehicle fleet.
21. Waste reduction, recycling and energy management (cont’d)
230 APPENDICES NSW TRADE & INVESTMENT ANNUAL REPORT 2010 -11

2008 - 2009 2009 - 2010
Energy Type Units Energy Use C02 Tonnes Energy Use CO2 tonnes
Electricity gigajoules(GJ) 64 102 18 305 57 485 17 131
Green gigajoules(GJ) 4 205 0 7 905 0
LPG gigajoules(GJ) 2 468 167 1 741 291
NG gigajoules(GJ) 16 322 1 071 37 524 2 540
Heating Oil gigajoules(GJ) 0 0 0 0
MV Petrol kilolitres(kl) 1 177 2 970 1 071 2 745
MV Diesel kilolitres(kl) 441 1 319 342 995
MV LPG kilolitres(kl) 0 0 0 0
Other Petrol kilolitres(kl) 62 157 56 146
Other Diesel kilolitres(kl) 215 644 167 485
Industry, Innovation & Investment Division
Sustainability and Environmental PerformanceThe NSW Government Sustainability Policy sets targets and strategies for the NSW Government to lead by example in sustainable water use, reducing greenhouse gas emissions from energy, waste and fleet management and sustainable purchasing.
Industry, Innovation & Investment Division is aware of and supports the NSW Government’s commitment of becoming carbon neutral by 2020.
Energy managementDuring the reporting period the division continued to promote environmental awareness to staff in the use of motor vehicles, energy consumption, the purchasing of energy efficient equipment and sustainability. A number of factors including an overall reduction in energy consumption contributed to a marginal decrease in CO2 emissions. A significant component of this decrease was the result of staff purchasing a greater quantity of ethanol blended fuels in its motor vehicle fleet.
The following table provides details of energy use over the past twelve months in comparison to the two previous financial years.
2008 - 09 2009 -10 2010 -11
Units Energy Use CO2 tonnes Energy Use CO2 tonnes Energy Use CO2 tonnes
Electricity gigajoules (GJ) 5 448 256 5 740 281 5 780 277
Green gigajoules (GJ) -296 -14 -313 -15 -312 -14.9
Motor Vehicle Petrol Litres 86 260 7 3911 45 028
Motor Vehicle LPG Litres 2 354 0 0
Motor Vehicles E10 Litres 36 985 40 811 58 953
Motor Vehicles Diesel Litres 0 4 457 4 899
TOTAL gigajoules (GJ) 9 725 9 790 9 461
TOTAL tonnes C02 1.844 1.918 1.896
NSW Office of WaterThis report is currently being compiled by the Government Architects Office within NSW Public Works which is part of the Department of Finance and Services.
Arts NSW
Units (GJ) Energy Use 2009 -10 CO2 tonnes 2010 -11 Energy Use and CO2 tonnes
351.4GJ 97 610.4 kWh 83.17/16.37 Scope 2 - 87.5 Scope 3 - 16.87
Motor Vehicle - Petrol consumption 1410 L - Cost: $1 820
21. Waste reduction, recycling and energy management (cont’d)
231NSW TRADE & INVESTMENT ANNUAL REPORT 2010 -11 APPENDICES

22. Implementation of Recovery and Threat Abatement Plans
Black Cod Recovery Plan finalised The department released and will lead the implementation of a plan to assist in the recovery of the diminishing black cod population, in partnership with other agencies, local government, universities and other researchers.
Black cod is listed as a vulnerable species under the NSW Fisheries Management Act 1994. The black cod is found in warm temperate and subtropical parts of the south-western Pacific, including off south eastern Australia and Lord Howe Island. They can grow up to two metres in length and at least 80 kilograms in weight, however it is more common to see smaller fish up to one metre. The species is slow-moving, curious, territorial and slow growing, making it vulnerable to overfishing in the past and it is now unusual to find them in areas where they were once common.
The plan outlines the key threats to the black cod population and a range of strategies to assist in the recovery of the species. Key threatening processes listed in the plan include line and spear fishing, as well as accidental hooking and loss of habitat. As part of the recovery plan the department will initiate and collaborate in research to get a better understanding of the biology and ecology of the black cod including their habitat requirements, movements and reproductive biology. Other actions identified in the plan include surveying the distribution and abundance of black cod in NSW, maximising compliance and protecting their habitat at identified important sites.
23. Multicultural Policies and Services Program
Multicultural Policies and Services Program Report 2010 -11NSW Trade & Investment is committed to the Community Relations Commission and Principles of Multiculturalism Act 2000 and the implementation of the department’s Multicultural Policies and Services Plan for 2010 -12. The plan is a tool for integrating multicultural initiatives into the department’s planning cycle and used as a model for consistency and good practice to ensure its programs and services reflect and are responsive to, the cultural diversity for the people of NSW.
The department is dedicated to ensuring that quality service programs meet the needs of a culturally diverse market. Training of departmental service staff involves sessions highlighting the cultural diversity of our clientele and educating officers on how best to satisfy the individual needs of all people.
During 2010 -11 NSW Trade & Investment delivered its commitment to multiculturalism through a range of activities delivered through different divisions of the department.
Industry, Innovation & Investment DivisionThroughout the year the department has developed integrated strategic marketing initiatives promoting business programs and services to culturally diverse populations in NSW, Australia and internationally. Using a mix of communication channels and collateral, the department produced materials to support various campaigns.
United Arab Emirates and NSW – A dynamic partnership publicationThis publication was developed to position Sydney and NSW as the leading global hub for business and was tailored specifically to the country to deliver market specific communication to clients.
China and NSW – A dynamic partnership publicationThis publication was developed to position Sydney and NSW as the leading global hub for business and was tailored specifically to the country to deliver market specific communication to clients. This publication was translated into Chinese and printed in market for distribution by the Shanghai and Guangzhou offices.
Bright Foods MOU – NSW Food and Wine Festival, Shanghai (video)The NSW Government signed a memorandum of understanding with China’s Bright Food Group and the China Development Bank in June 2010, which acknowledged the potential for up to $3 billlion in investment in NSW by the group. Following the MOU, the NSW Food and Wine Festival in Shanghai was held on 9 December 2010 and ran across two weeks in five of Bright Food’s retails stores. For the festival and for use as a sales tool and display at trade shows, a two minute film promoting the NSW food and beverage sector was produced. As the film was displayed to consumers in Bright Food stores the film also promoted NSW tourism. This food and wine video was translated into Chinese for the festival.
Nanotech (video)Nanotech 2011, held in Japan, was identified as a platform on which to advance dialogue and commercial opportunities between NSW nanotechnology related businesses, institutions and researchers. A trade show stand was created for the event and key messages printed on the stand were translated into Japanese. The corporate video was translated into Japanese for use throughout the event and on the stand.
NSW Asia Business Council 2010 Council members maintained strong links with NSW business communities from China, Hong Kong, India, Indonesia, Japan, Korea, the Middle East, the Philippines, Singapore, Taiwan, Thailand and Vietnam. Through their networks in NSW and in overseas markets, members helped to promote two-way trade and investment with Asia and provided strategic advice on business and investment opportunities for NSW and Asian companies.
The council considered ways to support the NSW Government response to the findings of the NSW Ministerial Taskforce on International Education, to which the council had presented a submission in June 2009. A new Multicultural Business Advisory Panel commenced during the year and is expected to start functioning in early 2011 -12. The Panel aims to harness cultural diversity, language skills and overseas contacts to assist the Board to grow the NSW economy.
232 APPENDICES NSW TRADE & INVESTMENT ANNUAL REPORT 2010 -11

Chambers of CommerceThe department worked with a number of international chambers of commerce and other organisations to ensure business owners from culturally diverse backgrounds were given the opportunity to receive assistance and establish business links. The department was involved with the Australia-India Business Council, the Australia China Business Council, the Australia-Israel Chamber of Commerce and the French Australian Chamber of Commerce & Industry. These partners joined in the promotion of targeted events to ethnic communities for the Small Business September 2010. In line with increasing activities in the US, UK/EU and Japan target markets, the division will increase its collaboration with entities such as the Japan External Trade Organisation and the European Australian Business Council.
Small Business ActivitiesThe department funded a $36 363 study into Arabic-speaking owner-operated businesses in the Auburn-Bankstown corridor of Sydney managed by the University Western Sydney Urban Research Centre (URC). The study was designed to examine business practices in this community and investigate strategies to encourage employment generation amongst Arabic owner-operated businesses in the Auburn-Bankstown corridor. Researchers interviewed 30 businesses across different industries.
Small Business September 2010Small Business September (SBS) 2010 delivered 518 events across NSW during September, a 32 per cent increase on SBS 2009. 56.6 per cent of the events were delivered in regional locations and 43.4 per cent of the events were held in metropolitan Sydney.
For the first time SBS bilingual seminars were offered to provide equal opportunity for more members of the community to succeed in business. Throughout SBS, bilingual seminars were conducted in Arabic, Vietnamese, Chinese and Turkish, the most prevalent languages other than English in South Western Sydney.
The ethnic media schedule was based upon the location of the events and the communities residing in those areas. The advertisements were translated into Arabic, Chinese and Vietnamese. Targeted print media included An Nahar, Sing Tao and the Dan Viet. SBS 2010 had a client reach of over 28 111 attendees at all of the events. The department is committed to ensuring that the SBS initiative continues to reach ethnic business communities across the State.
Business Advisory Services Business Advisory Services (BAS) located in areas with high proportion of business/owner operators from culturally diverse backgrounds, deliver special information services for particular language groups on a demand driven basis. The Sydney Business Advisory Service for example has clients from non-English speaking background and is in regular liaison with multicultural communities in metropolitan areas, in particular:
• Fairfield - Vietnamese • Bankstown - Arabic • Strathfield - Korean • Blacktown - Sudanese • Hurstville - Chinese
The Sydney BAS also attended regular meetings with NSW Adult Migrant English Service centres to highlight BAS services. The Sydney BAS ran regular import and export workshops, drawing high participation from the multicultural community. The BAS
will continue to liaise with multicultural chambers in Sydney to determine their interest and information needs and to organise small business seminars in community languages across the specific areas (Auburn, Fairfield and Holroyd).
Fact sheetsThe department continues to update a range of small business fact sheets, seven of which were translated into seven languages (Arabic, Chinese (Mandarin), Italian, Greek, Vietnamese, Korean and Turkish). These brochures were distributed through the department’s ethnic community business networks and Business Advisory Services program contractors. The fact sheets were accessible on the department’s small business website (www.smallbiz.nsw.gov.au) and were sent to members of the community on request.
The department translated a generic brochure on programs and services in Chinese, Arabic, Italian, Greek, Vietnamese and Korean. Brochures were distributed to relevant business chambers and councils with a large ethnic population. We will continue to ensure that the small business fact sheets are kept relevant and up to date.
Business and skilled migration programThe department promoted the business and skilled migration program, which provides support to recently arrived migrants wishing to establish a business in NSW. The program’s services include information materials, consultancy, visa sponsorship and information and networking seminars. The department provides a number of materials designed to assist migrants establishing a business in NSW. The program provided the following:
• The Guide to Doing Business in NSW was re-published in English and Chinese languages
• The NSW Welcomes Business Migrants Flyers were re-published in English and Chinese languages
• The Business Migration to NSW presentation was updated in Chinese
• 67 meetings with prospective business migrants to discuss their business plans
• 2 seminars with newly arrived business migrants in NSW.
Tourism NSWThe department promoted cultural events to a domestic audience as part of the Sydney Brand campaigns and these included:
• The First Emperor – China’s Entombed Warriors – Art Gallery of NSW
• Annie Leibovitz – Photography Exhibition – Art Gallery of NSW
• Chinese New Year Festival
• Paramarsala
• Gourmet Safari Tours within the multicultural communities of Auburn, Cabramatta, Marrickville, Punchbowl, Haberfield, Earlwood and Bankstown
• Ultimately Sydney Tours multicultural precincts
• Sydney Eat Streets including Stanley St, East Sydney Norton St, Leichhardt, Church St and Cabramatta
• Sydney Festival
• Asia on your doorstep
• Balmain – Rozelle Food Week
• Crave 2010, Breakfast of the Bridge and Night Noodle Markets
• Vivacity Summer 2010 -11.
23. Multicultural Policies and Services Program (cont’d)
233NSW TRADE & INVESTMENT ANNUAL REPORT 2010 -11 APPENDICES

We delivered a major marketing campaign in September and October 2010 to promote travel to Sydney for the Crave Sydney International Food Festival. The festival is a month-long feast of food themed events, from fine dining in Sydney’s leading restaurants to the Night Noodle Markets in Hyde Park. The department funded the Haymarket Chamber of Commerce to support the ‘Asia on Your Doorstep’ campaign, as part of the precinct funding program. The campaign aimed to drive domestic visitation to Chinatown during July and August 2010. Campaign activities included a Food Lovers Guide, promotional dining vouchers, guided tours, accommodation offers and a dedicated website www.asiaonyourdoorstep.com. Funding for the promotion of multicultural events will continue to be available through granting process under the Regional Tourism Partnership Program, Regional Flagship Events Program and Greater Sydney Tourism Partnership Program.
We also produced a number of market specific fact sheets for media and trade purposes including Halal restaurants and Muslim Services Fact Sheet and Indian Restaurants Fact sheet. During the latter half of the year the branch completed two research surveys into ethnicity as a tourism driver, looking at the Sydney and wider Australian market sources to help better understand marketing opportunities to the multicultural communities. Findings included that domestic tourism is favoured by those who have an English-speaking background, whilst respondents of Asian heritage tend to save for overseas family reunion travel. Asian Australians encourage their overseas friends and family to visit Australia and are likely to accompany them to local tourist attractions. The department is reviewing the results and looking at ways to implement the findings.
We continued to develop and support 17 multilingual consumer websites in seven languages other than English, namely traditional and simplified Chinese (both Mandarin and Cantonese), Japanese, Korean, Italian, French and German to promote Sydney and NSW in key domestic and international markets. The department continues to maintain and enhance content on existing multilingual websites.
DPIWaterSmart Farms and NutrientSmart Farms ProjectsThe WaterSmart Farms and Nutrient Smart Farms Projects under the Hawkesbury Nepean River Recovery Program to date have serviced Arabic, Chinese and Vietnamese landholders. Bi-lingual officers have been provided at field days and training events to present material in the required language and also assist with written exercises. Various communication material and forms have also been translated into these three languages.
The Irrigation Scheduling (SMS) component of the WaterSmart Farms Project has developed a training package that has been delivered in Vietnamese and Cantonese to engage irrigators from these backgrounds into the program. Vietnamese and Cantonese bi-lingual officers have also assisted growers with training in the use of compost on farms as part of the NutrientSmart Farms compost program.
Significant work has also been undertaken by the Arabic bi-lingual officer to effectively engage Arabic growers in the WaterSmart Farms potable water grant program. Bi-lingual officers have undertaken farm natural resource management surveys with Vietnamese, Chinese and Arabic landholders to ensure a representative sample from the Hawkesbury Nepean region is achieved.
Australia shares citrus expertise with Bhutan Mandarins are one of the most important horticultural export crops in Bhutan, grown by more than 22 000 households. Traditional Bhutanese farming practices rely on few inputs and marketable crop yields are relatively low, compared to other countries. ACIAR (Australian Centre for International Agricultural Research) funded a four year collaborative project between the Bhutan Department of Agriculture and Department of Primary Industries, with the aim of increasing production by improving orchard management practices.
Through training workshops the Bhutanese have been exposed to a number of management practices they can use to improve orchard productivity. These include tree pruning, better-timed fertiliser and irrigation applications and more targeted pest and disease management. Conversely, the work in Bhutan has benefited Australia by providing first-hand knowledge about the impacts of exotic pests and diseases that affect citrus, including the devastating huanglongbing (HLB) or citrus greening. Some of these pests and diseases are already present in countries within close proximity to Australia and pose a significant biosecurity risk to the Australian industry.
Australian component of ACIAR project This project is examining the potential for new Asian vegetables for the Australian market. Consultations have been held with Vietnamese market gardeners in the Sydney Basin and a field day at Gosford Primary Industries Institute was attended by members of the Vietnamese and Chinese farming community.
Cambodian and Australian vegetable industriesAs the lead agency in the Australian component of the ACIAR Australian-Cambodian Vegetable group, the department is currently developing the Field Identification Guide for Tomato, Capsicums, Chilli and Eggplants. The guide includes organisms that are found in both Cambodia and Australia and will be translated into Khmer and possibly other languages.
We also have a contract for a 12 month project under the National Vegetable Industry Development Program to:
• prepare translated (Vietnamese, Khmer, Chinese, Arabic) resources in sanitation for field growers
• run four language based workshops and conduct one on-farm workshop for each language group
• facilitate growers from 4 language groups, to use the fresh wise resources to assist growers through the FreshCare training course
• conduct one on-farm food safety audit per grower group
• prepare bilingual water quality fact sheets on wash water safety, spray water quality, irrigation water quality and minimising water use
• translate a spray application basics fact sheet into 4 languages.
Fishing and information workshops590 children, parents and relatives including disabled youth and refugees from Chinese, Vietnamese, Indonesian, Korean, Philippine, Arabic, Italian, Greek, Spanish, Malaysian, Cook Is and Pacific Is communities participated in the one-day fishing and information workshops. Various organisations and community groups provide support for these workshops including: the Australian-Korean Welfare Association, Korean Society of Sydney, Asian Women at
23. Multicultural Policies and Services Program (cont’d)
234 APPENDICES NSW TRADE & INVESTMENT ANNUAL REPORT 2010 -11
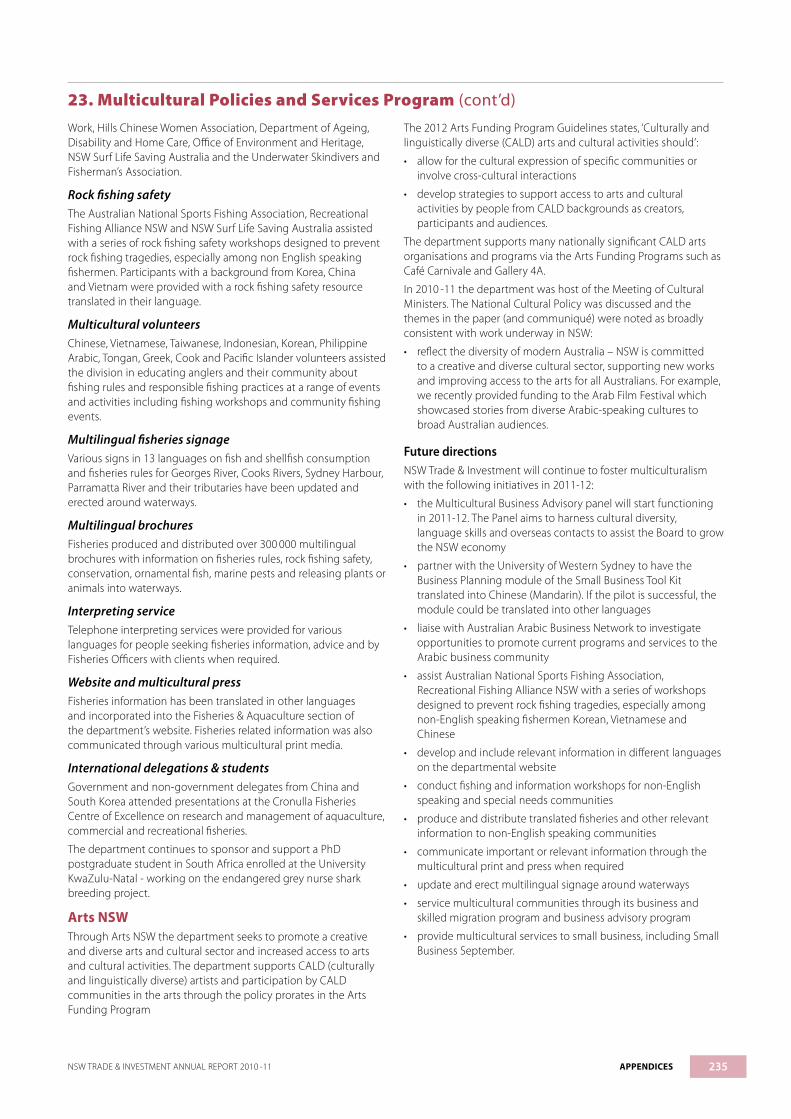
Work, Hills Chinese Women Association, Department of Ageing, Disability and Home Care, Office of Environment and Heritage, NSW Surf Life Saving Australia and the Underwater Skindivers and Fisherman’s Association.
Rock fishing safetyThe Australian National Sports Fishing Association, Recreational Fishing Alliance NSW and NSW Surf Life Saving Australia assisted with a series of rock fishing safety workshops designed to prevent rock fishing tragedies, especially among non English speaking fishermen. Participants with a background from Korea, China and Vietnam were provided with a rock fishing safety resource translated in their language.
Multicultural volunteersChinese, Vietnamese, Taiwanese, Indonesian, Korean, Philippine Arabic, Tongan, Greek, Cook and Pacific Islander volunteers assisted the division in educating anglers and their community about fishing rules and responsible fishing practices at a range of events and activities including fishing workshops and community fishing events.
Multilingual fisheries signageVarious signs in 13 languages on fish and shellfish consumption and fisheries rules for Georges River, Cooks Rivers, Sydney Harbour, Parramatta River and their tributaries have been updated and erected around waterways.
Multilingual brochuresFisheries produced and distributed over 300 000 multilingual brochures with information on fisheries rules, rock fishing safety, conservation, ornamental fish, marine pests and releasing plants or animals into waterways.
Interpreting serviceTelephone interpreting services were provided for various languages for people seeking fisheries information, advice and by Fisheries Officers with clients when required.
Website and multicultural pressFisheries information has been translated in other languages and incorporated into the Fisheries & Aquaculture section of the department’s website. Fisheries related information was also communicated through various multicultural print media.
International delegations & studentsGovernment and non-government delegates from China and South Korea attended presentations at the Cronulla Fisheries Centre of Excellence on research and management of aquaculture, commercial and recreational fisheries.
The department continues to sponsor and support a PhD postgraduate student in South Africa enrolled at the University KwaZulu-Natal - working on the endangered grey nurse shark breeding project.
Arts NSWThrough Arts NSW the department seeks to promote a creative and diverse arts and cultural sector and increased access to arts and cultural activities. The department supports CALD (culturally and linguistically diverse) artists and participation by CALD communities in the arts through the policy prorates in the Arts Funding Program
The 2012 Arts Funding Program Guidelines states, ‘Culturally and linguistically diverse (CALD) arts and cultural activities should’:
• allow for the cultural expression of specific communities or involve cross-cultural interactions
• develop strategies to support access to arts and cultural activities by people from CALD backgrounds as creators, participants and audiences.
The department supports many nationally significant CALD arts organisations and programs via the Arts Funding Programs such as Café Carnivale and Gallery 4A.
In 2010 -11 the department was host of the Meeting of Cultural Ministers. The National Cultural Policy was discussed and the themes in the paper (and communiqué) were noted as broadly consistent with work underway in NSW:
• reflect the diversity of modern Australia – NSW is committed to a creative and diverse cultural sector, supporting new works and improving access to the arts for all Australians. For example, we recently provided funding to the Arab Film Festival which showcased stories from diverse Arabic-speaking cultures to broad Australian audiences.
Future directionsNSW Trade & Investment will continue to foster multiculturalism with the following initiatives in 2011-12:
• the Multicultural Business Advisory panel will start functioning in 2011-12. The Panel aims to harness cultural diversity, language skills and overseas contacts to assist the Board to grow the NSW economy
• partner with the University of Western Sydney to have the Business Planning module of the Small Business Tool Kit translated into Chinese (Mandarin). If the pilot is successful, the module could be translated into other languages
• liaise with Australian Arabic Business Network to investigate opportunities to promote current programs and services to the Arabic business community
• assist Australian National Sports Fishing Association, Recreational Fishing Alliance NSW with a series of workshops designed to prevent rock fishing tragedies, especially among non-English speaking fishermen Korean, Vietnamese and Chinese
• develop and include relevant information in different languages on the departmental website
• conduct fishing and information workshops for non-English speaking and special needs communities
• produce and distribute translated fisheries and other relevant information to non-English speaking communities
• communicate important or relevant information through the multicultural print and press when required
• update and erect multilingual signage around waterways
• service multicultural communities through its business and skilled migration program and business advisory program
• provide multicultural services to small business, including Small Business September.
23. Multicultural Policies and Services Program (cont’d)
235NSW TRADE & INVESTMENT ANNUAL REPORT 2010 -11 APPENDICES
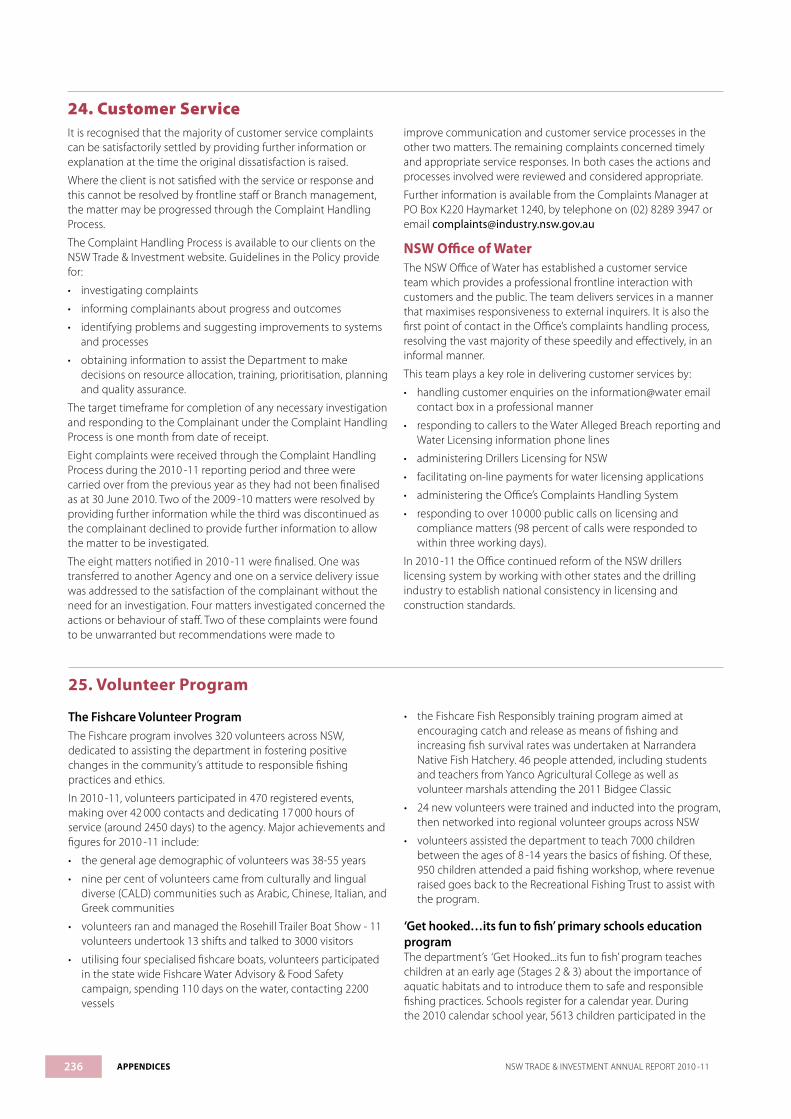
24. Customer ServiceIt is recognised that the majority of customer service complaints can be satisfactorily settled by providing further information or explanation at the time the original dissatisfaction is raised.
Where the client is not satisfied with the service or response and this cannot be resolved by frontline staff or Branch management, the matter may be progressed through the Complaint Handling Process.
The Complaint Handling Process is available to our clients on the NSW Trade & Investment website. Guidelines in the Policy provide for:
• investigating complaints
• informing complainants about progress and outcomes
• identifying problems and suggesting improvements to systems and processes
• obtaining information to assist the Department to make decisions on resource allocation, training, prioritisation, planning and quality assurance.
The target timeframe for completion of any necessary investigation and responding to the Complainant under the Complaint Handling Process is one month from date of receipt.
Eight complaints were received through the Complaint Handling Process during the 2010 -11 reporting period and three were carried over from the previous year as they had not been finalised as at 30 June 2010. Two of the 2009 -10 matters were resolved by providing further information while the third was discontinued as the complainant declined to provide further information to allow the matter to be investigated.
The eight matters notified in 2010 -11 were finalised. One was transferred to another Agency and one on a service delivery issue was addressed to the satisfaction of the complainant without the need for an investigation. Four matters investigated concerned the actions or behaviour of staff. Two of these complaints were found to be unwarranted but recommendations were made to
improve communication and customer service processes in the other two matters. The remaining complaints concerned timely and appropriate service responses. In both cases the actions and processes involved were reviewed and considered appropriate.
Further information is available from the Complaints Manager at PO Box K220 Haymarket 1240, by telephone on (02) 8289 3947 or email [email protected]
NSW Office of WaterThe NSW Office of Water has established a customer service team which provides a professional frontline interaction with customers and the public. The team delivers services in a manner that maximises responsiveness to external inquirers. It is also the first point of contact in the Office’s complaints handling process, resolving the vast majority of these speedily and effectively, in an informal manner.
This team plays a key role in delivering customer services by:
• handling customer enquiries on the information@water email contact box in a professional manner
• responding to callers to the Water Alleged Breach reporting and Water Licensing information phone lines
• administering Drillers Licensing for NSW
• facilitating on-line payments for water licensing applications
• administering the Office’s Complaints Handling System
• responding to over 10 000 public calls on licensing and compliance matters (98 percent of calls were responded to within three working days).
In 2010 -11 the Office continued reform of the NSW drillers licensing system by working with other states and the drilling industry to establish national consistency in licensing and construction standards.
25. Volunteer Program
The Fishcare Volunteer ProgramThe Fishcare program involves 320 volunteers across NSW, dedicated to assisting the department in fostering positive changes in the community’s attitude to responsible fishing practices and ethics.
In 2010 -11, volunteers participated in 470 registered events, making over 42 000 contacts and dedicating 17 000 hours of service (around 2450 days) to the agency. Major achievements and figures for 2010 -11 include:
• the general age demographic of volunteers was 38-55 years
• nine per cent of volunteers came from culturally and lingual diverse (CALD) communities such as Arabic, Chinese, Italian, and Greek communities
• volunteers ran and managed the Rosehill Trailer Boat Show - 11 volunteers undertook 13 shifts and talked to 3000 visitors
• utilising four specialised fishcare boats, volunteers participated in the state wide Fishcare Water Advisory & Food Safety campaign, spending 110 days on the water, contacting 2200 vessels
• the Fishcare Fish Responsibly training program aimed at encouraging catch and release as means of fishing and increasing fish survival rates was undertaken at Narrandera Native Fish Hatchery. 46 people attended, including students and teachers from Yanco Agricultural College as well as volunteer marshals attending the 2011 Bidgee Classic
• 24 new volunteers were trained and inducted into the program, then networked into regional volunteer groups across NSW
• volunteers assisted the department to teach 7000 children between the ages of 8 -14 years the basics of fishing. Of these, 950 children attended a paid fishing workshop, where revenue raised goes back to the Recreational Fishing Trust to assist with the program.
‘Get hooked…its fun to fish’ primary schools education programThe department’s ‘Get Hooked...its fun to fish’ program teaches children at an early age (Stages 2 & 3) about the importance of aquatic habitats and to introduce them to safe and responsible fishing practices. Schools register for a calendar year. During the 2010 calendar school year, 5613 children participated in the
236 APPENDICES NSW TRADE & INVESTMENT ANNUAL REPORT 2010 -11

program. At the time of printing in the 2011 school calendar year, 83 schools (32 freshwater, 51 saltwater) involving 4232 students had enrolled in the program.
Volunteers are essential to the running of this program. In the 2010 -11 financial year, 56 specialised ‘schools based’ Fishcare
volunteers participated in 50 incursions and 24 excursions. Schools Volunteers dedicated more than 1800 hours of service to the program, with the majority of the hours dedicated to the 2010 -11 state wide Get Hooked Workshop Weeks, where 1098 students got to put theory learnt throughout the year into practice.
25. Volunteer Program (cont’d)
26. Freedom of InformationIn conjunction with the introduction of the Government Information (Public Access) Act 2009 (the GIPA Act) from 1 July 2010 NSW Trade & Investment consolidated the Right to Information functions of a number of former agencies and divisions wherever possible as they joined the cluster.
The GIPA Act encourages the proactive release of information by agencies and responding to requests for information informally where appropriate. Guidelines and authorisations to staff have been issued to increase the range of information able to be accessed without the need for a formal application under the GIPA Act. This includes managers regularly assessing information for which they are responsible for publication on the departmental
website where it may useful or of interest to members of the public.
There was no adverse impact upon the department’s activities and no major issues arose in connection with the department’s compliance with GIPA requirements.
Further information is available from the Right to Information Officer at PO Box K220 Haymarket 1240 or by telephone on (02) 8289 3947.
Schedule 2 Statistical information about access applications to be included in annual report.
Table A: Number of applications by type of applicant and outcome*
Access granted in
full
Access granted in
part
Access refused in
full
Information not held
Information already
available
Refuse to deal with
application
Refuse to confirm/
deny whether
information is held
Application withdrawn
Media 1 2 2 4 1 2
Members of Parliament 12 11 1 2 2 2 1
Private sector business 8 3 2
Not for profit organisations or community groups
3 8 2 1 1
Members of the public (application by legal representative)
19 12 3 1 1 2 2
Members of the public (other)
24 24 1 5 2 2 2
* More than one decision can be made in respect of a particular access application. If so, a recording must be made in relation to each such decision. This also applies to Table B.
Table B: Number of applications by type of application and outcome
Access granted in
full
Access granted in
part
Access refused in
full
Information not held
Information already
available
Refuse to deal with
application
Refuse to confirm/
deny whether
information is held
Application withdrawn
Personal information applications*
7 1 1 1 1
Access applications (other than personal information applications)
57 46 8 14 5 6 7
Access applications that are partly personal information applications and partly other
3 13 1
* A personal information application is an access application for personal information (as defined in clause 4 of Schedule 4 to the Act) about the applicant (the applicant being an individual).
237NSW TRADE & INVESTMENT ANNUAL REPORT 2010 -11 APPENDICES
26. Freedom of Information (cont’d)
Table C: Invalid applications
Reason for invalidity No of applications
Application does not comply with formal requirements (section 41 of the Act) 9
Application is for excluded information of the agency (section 43 of the Act)
Application contravenes restraint order (section 110 of the Act)
Total number of invalid applications received 7
Invalid applications that subsequently became valid applications 3
Table D: Conclusive presumption of overriding public interest against disclosure: matters listed in Schedule 1 to Act
Number of times consideration used*
Overriding secrecy laws 4
Cabinet information 7
Executive Council information
Contempt
Legal professional privilege 10
Excluded information
Documents affecting law enforcement and public safety 1
Transport safety
Adoption
Care and protection of children
Ministerial code of conduct
Aboriginal and environmental heritage 1
* More than one public interest consideration may apply in relation to a particular access application and, if so, each such consideration is to be recorded (but only once per application). This also applies in relation to Table E.
Table E: Other public interest considerations against disclosure: matters listed in table to section 14 of Act
Number of occasions when application not successful
Responsible and effective government 8
Law enforcement and security 4
Individual rights, judicial processes and natural justice 40
Business interests of agencies and other persons 36
Environment, culture, economy and general matters
Secrecy provisions 1
Exempt documents under interstate Freedom of Information legislation
Table F: Timeliness
Number of applications
Decided within the statutory timeframe (20 days plus any extensions) 134
Decided after 35 days (by agreement with applicant) 11
Not decided within time (deemed refusal) 1
Total 146
238 APPENDICES NSW TRADE & INVESTMENT ANNUAL REPORT 2010 -11
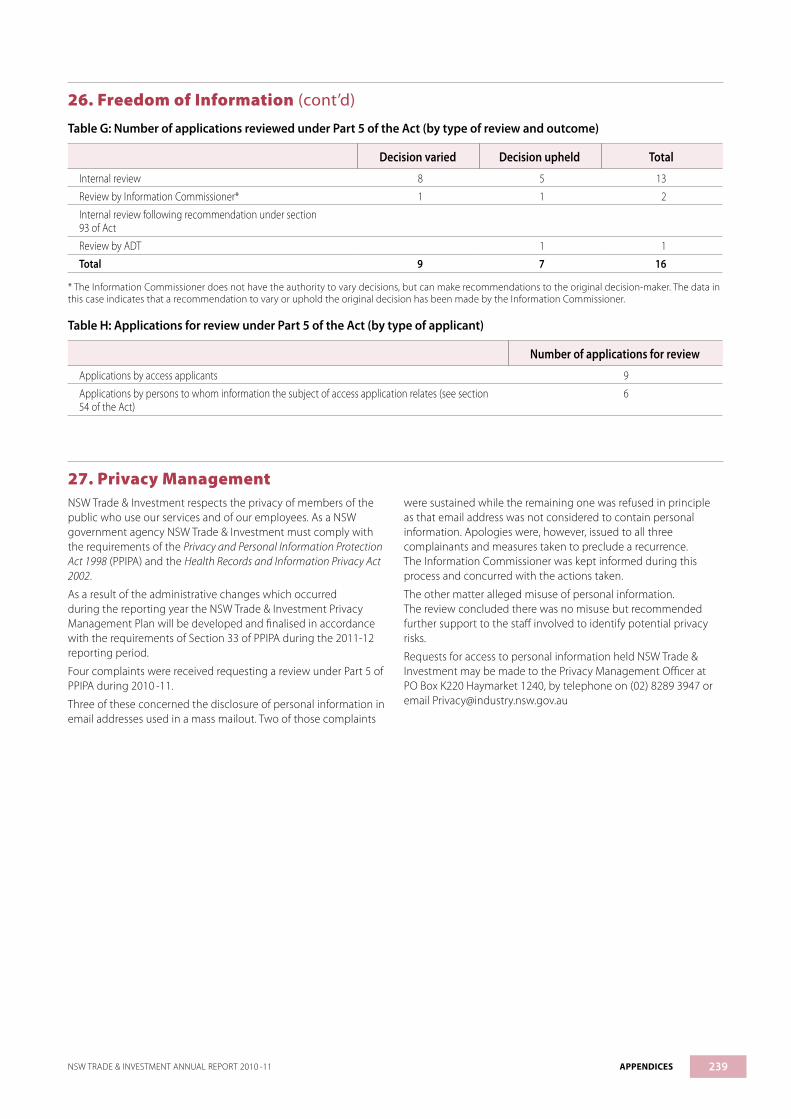
27. Privacy ManagementNSW Trade & Investment respects the privacy of members of the public who use our services and of our employees. As a NSW government agency NSW Trade & Investment must comply with the requirements of the Privacy and Personal Information Protection Act 1998 (PPIPA) and the Health Records and Information Privacy Act 2002.
As a result of the administrative changes which occurred during the reporting year the NSW Trade & Investment Privacy Management Plan will be developed and finalised in accordance with the requirements of Section 33 of PPIPA during the 2011-12 reporting period.
Four complaints were received requesting a review under Part 5 of PPIPA during 2010 -11.
Three of these concerned the disclosure of personal information in email addresses used in a mass mailout. Two of those complaints
were sustained while the remaining one was refused in principle as that email address was not considered to contain personal information. Apologies were, however, issued to all three complainants and measures taken to preclude a recurrence. The Information Commissioner was kept informed during this process and concurred with the actions taken.
The other matter alleged misuse of personal information. The review concluded there was no misuse but recommended further support to the staff involved to identify potential privacy risks.
Requests for access to personal information held NSW Trade & Investment may be made to the Privacy Management Officer at PO Box K220 Haymarket 1240, by telephone on (02) 8289 3947 or email [email protected]
Table G: Number of applications reviewed under Part 5 of the Act (by type of review and outcome)
Decision varied Decision upheld Total
Internal review 8 5 13
Review by Information Commissioner* 1 1 2
Internal review following recommendation under section 93 of Act
Review by ADT 1 1
Total 9 7 16
* The Information Commissioner does not have the authority to vary decisions, but can make recommendations to the original decision-maker. The data in this case indicates that a recommendation to vary or uphold the original decision has been made by the Information Commissioner.
Table H: Applications for review under Part 5 of the Act (by type of applicant)
Number of applications for review
Applications by access applicants 9
Applications by persons to whom information the subject of access application relates (see section 54 of the Act)
6
26. Freedom of Information (cont’d)
239NSW TRADE & INVESTMENT ANNUAL REPORT 2010 -11 APPENDICES

FINANCIAL STATEMENTS 2010 -11
Financial Statements – Department of Trade & Investment, Regional Infrastructure and Services 241
Financial Statements – Ministerial Corporation for Industry 330
Financial Statements – Small Business Development Corporation of New South Wales 344
Financial Statements – Marine Parks Authority 355
240 FINANCIAL STATEMENTS NSW TRADE & INVESTMENT ANNUAL REPORT 2010 -11

241NSW TRADE & INVESTMENT ANNUAL REPORT 2010 -11 FINANCIAL STATEMENTS
DEPARTMENT OF TRADE & INVESTMENT, REGIONAL INFRASTRUCTURE AND SERVICESFinancial Statements for the year ended 30 June 2011
Statement by the Director-General 242Independent Auditor’s Report 243Statement of Comprehensive Income 245Statement of Financial Position 246Statement of Changes in Equity 247Statement of Cash Flows 248Service Group Statements 249Summary of Compliance with Financial Directives 265Notes to and forming part of the financial statements 268
1. Summary of Significant Accounting Policies 208
2. Expenses Excluding Losses 2973. Revenues 2994. Gain/(Loss) on Disposal 3005. Other Gains/(Losses) 3006. Conditions on Contributions 3017. Appropriations 3018a. Acceptance by the Crown Entity of
Employee Benefits and Other Liabilities 3018b. Transfer to NSW Treasury 3019. Transfer Payments 30110. Service Groups of the Department 30211. Current Assets – Cash and Cash
Equivalents 30412. Current/Non - Current Assets
– Receivables 30413. Current/Non-Current Assets
– Inventories 30514. Non-Current Assets.–.Financial Assets
at Fair Value 30515. Non-Current Assets -Property, Plant and
Equipment 30616. Intangible Assets 30717. Current/Non-Current Other Financial
Assets 30818. Assets held for sale 308 19. Biological Assets 308
20. Restricted Assets 30921. Current Liabilities – Payables 31022. Current/Non-Current Liabilities
– Borrowings 31023a. Current/Non-Current Liabilities
– Provisions 31023b. Employee Benefits 31224. Current/Non-Current Liabilities
– Other 31725. Commitments for Expenditure 31726. Contingent Liabilities 31827. Budget Review 31928. Reconciliation of Cash Flows from
Operating Activities to Net Cost Services 319
29. Trust Funds 31930. Fisheries Management Act – Special
Fisheries Trust Funds 32031. Administered Assets and Liabilities 32232. Administered Expenses & Income 32333. Joint Venture 32434. Financial Instruments 32535. Prior Period Errors 32936. Events after Reporting Period 329

242 FINANCIAL STATEMENTS NSW TRADE & INVESTMENT ANNUAL REPORT 2010 -11
FINANCIAL STATEMENTS - NSW TRADE & INVESTMENT

243NSW TRADE & INVESTMENT ANNUAL REPORT 2010 -11 FINANCIAL STATEMENTS
FINANCIAL STATEMENTS - NSW TRADE & INVESTMENT

244 FINANCIAL STATEMENTS NSW TRADE & INVESTMENT ANNUAL REPORT 2010 -11
FINANCIAL STATEMENTS - NSW TRADE & INVESTMENT

245NSW TRADE & INVESTMENT ANNUAL REPORT 2010 -11 FINANCIAL STATEMENTS
FINANCIAL STATEMENTS - NSW TRADE & INVESTMENT
STATEMENT OF COMPREHENSIVE INCOME FOR THE YEAR ENDED 30 JUNE 2011
Notes Actual2011$000
Budget2011$000
Actual2010$000
Expenses excluding lossesOperating expenses Employee related 2(a) 441 270 410 811 361 014 Other operating expenses 2(b) 177 920 173 569 143 825Depreciation and amortisation 2(c) 1(j)(vi) 43 347 31 845 23 428Grants & subsidies 2 (d) 382 816 462 263 223 436Finance Costs 2(e) 1(e) (352) 1 129 1 276Other expenses 2(f ) 129 133 189 491 102 408Total expenses excluding losses 1 174 134 1 269 108 855 387
RevenueSale of goods and services 3(a) 1(i)(ii) 95 804 94 002 71 688Investment revenue 3(b) 1(i)(v) 22 488 5 099 4 511Fees and fines 3(c) 13 351 12 673 13 257Grants and contributions 3(d) 96 978 219 577 84 950Other revenue 3(e) 21 246 8 713 7 660Personnel services revenue 3(f ) 104 961 87 789 66 505Total Revenue 354 828 427 853 248 571
Gain / (loss) on disposal 4 (16 963) 117 473Other Gains / (losses) 5 1 012 (1 372) 346Increase in share of jointly controlled assets in joint ventures 33(a) 69 871 0 0Impairment – Intangible – Water Entitlements - MDBA 33(a) (46 236) 0 0Share of operating result of joint ventures accounted for under the equity accounting method
33(b) (1 606) 0 0
Net Cost of Services 28 813 228 842 510 605 997
Government contributionsRecurrent appropriation (net of transfer payments) 7 728 980 852 793 592 959Capital appropriation (net of transfer payments) 7 63 865 55 583 25 649(Asset sale proceeds transferred to the Crown Entity) 0 (995) 0Acceptance by the Crown Entity of employee benefits and other liabilities 8(a) 25 494 25 487 22 528Transfers to NSW Treasury 8(b) (10 346) (17 298) 0Total Government Contributions 807 993 915 570 641 136
SURPLUS / (DEFICIT) FOR THE YEAR (5 235) 73 060 35 139
Other comprehensive incomeNet increase / (decrease) in property, plant and equipment asset revaluation reserve
22 516 0 5 056
Available for sale financial assets Valuation gains / losses (220) 0 938 Transferred to surplus / deficit on disposal 0 0 0Net change in the asset revaluation reserve arising from a change in the restoration liability
0 0 0
Superannuation actuarial gains / (losses) 3 175 0 0Net increase / (decrease) on revaluation of investments accounted for under the equity method
33(b) 35 342 0 0
Net increase / (decrease) on revaluation of share of jointly controlled assets in joint ventures
33(a) 10 952 0 0
Other net increases / (decreases) in equity 1 136 (15) 0Other comprehensive income for the year 72 901 (15) 5 994
TOTAL COMPREHENSIVE INCOME FOR THE YEAR 67 666 73 045 41 133
The accompanying notes form part of these financial statements

246 FINANCIAL STATEMENTS NSW TRADE & INVESTMENT ANNUAL REPORT 2010 -11
FINANCIAL STATEMENTS - NSW TRADE & INVESTMENT
STATEMENT OF FINANCIAL POSITION AS AT 30 JUNE 2011
Notes Actual2011$000
Budget2011$000
Actual2010$000
ASSETSCurrent AssetsCash and cash equivalents 11 281 482 251 475 169 375Receivables 12 170 706 162 695 65 783Inventories 13 29 596 25 752 1 885Other financial assets 17 6 065 6 661 50Assets held for sale 18 913 969 525Total Current Assets 488 762 447 552 237 618
Non-Current AssetsReceivables 12 170 908 33 093 58 556Inventories 13 14 985 14 747 0Financial assets at fair value 14 4 124 4 164 4 410Property Plant and Equipment - Land and buildings 15 6 253 712 6 059 406 253 714 - Plant and Equipment 15 48 429 52 429 36 577 - Infrastructure Systems 15 1 058 758 708 362 43 807 - Leased Assets (Buildings) 15 42 679 0 0 - Work in progress - PPE 15 45 228 0 0Total Property Plant and Equipment 15 7 448 806 6 820 197 334 098Intangible assets - Intangible assets 16 1(j)(xii) 160 128 156 305 11 370 - Work in progress - Intangible assets 16 5 261 0 0Total Intangible assets 16 165 389 156 305 11 370Investments accounted for under the equity method 33(b) 70 980 0 0Biological assets 19 6 875 5 902 5 902Other financial assets 17 22 685 65 887 6 795Total Non-Current Assets 7 904 752 7 100 295 421 131
Total Assets 8 393 514 7 547 847 658 749
LIABILITIESCurrent LiabilitiesPayables 21 1(k)(i) 104 302 112 463 80 997Borrowings 22 1(k)(ii) 6 771 6 138 4 440Provisions 23(a) 1(k)(iv)(v) 131 081 742 996 77 037Other 24 19 605 30 020 24 020Total Current Liabilities 261 759 891 617 186 494
Non-Current LiabilitiesPayables 21 0 0 0Borrowings 22 13 385 14 198 15 235Provisions 23 693 508 23 901 60 028Other 24 11 338 (15 378) 138Total Non-Current Liabilities 718 231 22 721 75 401
Total Liabilities 979 990 914 338 261 895
Net Assets 7 413 524 6 633 509 396 854
EQUITYReserves 74 392 166 317 5 994Accumulated funds 7 339 132 6 467 192 390 860Total Equity 7 413 524 6 633 509 396 854
The accompanying notes form part of these financial statements

247NSW TRADE & INVESTMENT ANNUAL REPORT 2010 -11 FINANCIAL STATEMENTS
FINANCIAL STATEMENTS - NSW TRADE & INVESTMENT
STATEMENT OF CHANGES IN EQUITY FOR THE YEAR ENDED 30 JUNE 2011
Notes Accumulated Funds
$’000
AssetRevaluation
Reserve$’000
Total Equity
$’000Balance at 1 July 2010 390 860 5 994 396 854Correction of errors 35 (3 500) 0 (3 500)Restated total equity at 1 July 2010 387 360 5 994 393 354
Surplus/ (deficit) for the year (5 235) 0 (5 235)
Other comprehensive incomeNet increase / (decrease) in property, plant and equipment 0 22 516 22 516Available for sale financial assets:
Valuation gains / (losses) (220) 0 (220)Transfer on disposal 0 0 0
Change in restoration liability 0 0 0Superannuation actuarial gains / (losses) 3 175 0 3 175Net increase / (decrease) on revaluation of investments accounted for under the equity method 0 35 342 35 342Net increase / (decrease) on revaluation of share of jointly controlled assets in joint ventures 0 10 952 10 952Other net increases / (decreases) in equity 1 136 0 1 136Total other comprehensive income 4 091 68 810 72 901Total comprehensive income for the year (1 144) 68 810 67 666
Transfers to / (from) reserves 412 (412) 0
Transactions with owners in their capacity as ownersIncrease / (decrease) in net assets from equity transfers 6 952 504 0 6 952 504Total transactions with owners in their capacity as owners 6 952 504 0 6 952 504
Balance at 30 June 2011 7 339 132 74 392 7 413 524
Balance at 1 July 2009 354 149 0 354 149Correction of errors (3) 0 (3)Restated total equity at 1 July 2009 354 146 0 354 146
Surplus/ (deficit) for the year 35 139 0 35 139
Other comprehensive incomeNet increase / (decrease) in property, plant and equipment 0 5 056 5 056Available for sale financial assets:
Valuation gains / (losses) 0 938 938Transfer on disposal 0 0 0
Change in restoration liability 0 0 0Superannuation actuarial gains / (losses) 0 0 0Other net increases / (decreases) in equity 0 0 0Total other comprehensive income 0 5 994 5 994Total comprehensive income for the year 35 139 5 994 41 133
Transfers to / (from) reserves 0 0 0
Transactions with owners in their capacity as ownersIncrease / (decrease) in net assets from equity transfers 1 575 0 1 575Total transactions with owners in their capacity as owners 1 575 0 1 575
Balance at 30 June 2010 390 860 5 994 396 854
The accompanying notes form part of these financial statements

248 FINANCIAL STATEMENTS NSW TRADE & INVESTMENT ANNUAL REPORT 2010 -11
FINANCIAL STATEMENTS - NSW TRADE & INVESTMENT
STATEMENT OF CASH FLOWS FOR THE YEAR ENDED 30 JUNE 2011
Notes Actual2011$000
Budget2011$000
Actual2010$000
CASH FLOWS FROM OPERATING ACTIVITIESPaymentsEmployee related (404 506) (389 822) (315 240)Grants and subsidies (351 133) (453 422) (227 964)Finance costs (658) (1 029) (741)Other (571 396) (435 166) (230 699)Total Payments (1 327 693) (1 279 439) (774 644)
ReceiptsSale of goods and services 139 269 192 891 133 774Fees and fines 13 351 11 493 13 257Interest received 6 581 4 877 2 454Other 408 055 133 714 128 891Total Receipts 567 256 342 975 278 376
Cash Flows from GovernmentRecurrent appropriation 746 458 852 793 616 811Capital appropriation (excluding equity appropriation) 64 866 55 583 25 649Asset sale proceeds transferred to the Crown Entity 0 (995) 0Cash reimbursements from the Crown Entity 0 0 0Cash transfers to the Consolidated Fund (23 852) 0 (5 131)Transfers to NSW Treasury (10 346) 0 0Net Cash Flows from Government 777 126 907 381 637 329NET CASH FLOWS FROM OPERATING ACTIVITIES 28 16 689 (29 083) 141 061
CASH FLOWS FROM INVESTING ACTIVITIESProceeds from sale of Land and Buildings, Plant and Equipment and Infrastructure Systems
2 305 8 959 1 745
Proceeds from the sale of investments 0 0 122Advance repayments received 2 138 753 0Purchases of Land and Buildings, Plant and Equipment and Infrastructure Systems (62 979) (59 931) (33 711)Purchase Intangibles (10 763) 0 (4 499)Purchases of investments 0 0 0Advances made (807) (825) 0Other 2 275 0 0NET CASH FLOWS FROM INVESTING ACTIVITIES (67 831) (51 044) (36 343)
CASH FLOWS FROM FINANCING ACTIVITIESProceeds from borrowings and advances 881 0 0Repayment of borrowings and advances (4 807) (4 948) (4 727)NET CASH FLOWS FROM FINANCING ACTIVITIES (3 926) (4 948) (4 727)
NET INCREASE/(DECREASE) IN CASH (55 068) (85 075) 99 991Opening cash and cash equivalents 169 375 169 375 67 566Cash transferred in / (out) as a result of administrative restructuring 167 175 167 175 1 818CLOSING CASH AND CASH EQUIVALENTS 11 281 482 251 475 169 375
The accompanying notes form part of these financial statements

249N
SW TRAD
E & INVESTM
ENT AN
NU
AL REPORT 2010 -11
FINA
NCIA
L STATEMEN
TS
FINA
NCIA
L STATEMEN
TS - NSW
TRAD
E & IN
VESTMEN
T
Service group statements for the year ended 30 June 2011 for Department of Trade and Investment, Regional Infrastructure and Services Service groups previously within: Department of Industry and Investment
EXPENSES & INCOME Agriculture and Biosecurity
Fisheries and Compliance
Science and Research Activities
(Agriculture, Fisheries and
Forestry)
Mineral Resources and
Mine Safety
Energy Supply and Use
Investment Attraction
and Industry Development
Small Business and Regional Development
Science and Medical
Research Policy and Industry Innovation
Tourism Personnel Services
2011$000
2011$000
2011$000
2011$000
2011$000
2011$000
2011$000
2011$000
2011$000
2011$000
Expenses excluding lossesOperating Expenses
Employee related 61 883 42 027 82 969 42 621 9 448 8 407 21 999 10 129 12 901 59 812Other operating expenses 44 126 18 276 31 812 21 321 4 117 12 005 7 556 4 195 3 536 0
Depreciation and amortisation 5 789 3 808 6 274 2 893 591 644 1 679 564 780 0Grants and subsidies 59 994 839 478 2 259 124 477 6 910 21 526 42 122 5 245 0Finance costs 367 658 0 0 0 0 0 0 0 0Other expenses 7 550 1 565 19 2 264 2 27 766 48 671 652 32 101 0Total expenses excluding losses 179 709 67 173 121 552 71 358 138 635 55 732 101 431 57 662 54 563 59 812
RevenueSale of goods and services 14 858 7 539 10 192 31 591 1 228 627 1 718 320 459 0Investment revenue 2 127 1 888 1 863 859 588 191 498 168 231 0Fees and fines 0 12 495 0 0 0 0 0 0 0 0Grants and contributions 26 956 2 525 29 560 25 138 244 770 1 151 12 3 221 0Other revenue 7 246 352 3 148 1 402 132 111 82 1 295 1 575 0Personnel services revenue 0 0 0 0 0 0 0 0 0 59 812Total Revenue 51 187 24 799 44 763 58 990 2 192 1 699 3 449 1 795 5 486 59 812
Gain/ (loss) on disposal (1 132) (721) (1 225) (566) (130) (126) (328) (110) (152) 0Other gains /(losses) 398 138 228 105 21 23 74 21 56 0Joint ventures (note 33) 0 0 0 0 0 0 0 0 0 0Net Cost of Services 129 256 42 957 77 786 12 829 136 552 54 136 98 236 55 956 49 173 0
Government contributions ** 0 0 0 0 0 0 0 0 0 0
SURPLUS/ (DEFICIT) FOR THE YEAR (129 256) (42 957) (77 786) (12 829) (136 552) (54 136) (98 236) (55 956) (49 173) 0Other Comprehensive IncomeNet increase / (decrease) in asset revaluation reserve 5 376 3 536 5 827 2 687 549 598 1 559 524 723 0Available for sale financial assets
Valuation gains / losses (55) (36) (60) (28) (6) (6) (16) (5) (8) 0Superannuation actuarial gains / (losses) 3 281 0 0 0 0 0 0 0 0 0Revaluation of investments - equity method 0 0 0 0 0 0 0 0 0 0Revaluation of share in joint ventures 0 0 0 0 0 0 0 0 0 0Other net increases / (decreases) in equity 0 0 0 0 0 0 0 0 0 0Total Other Comprehensive Income 8 602 3 500 5 767 2 659 543 592 1 543 519 715 0TOTAL COMPREHENSIVE INCOME (120 654) (39 457) (72 019) (10 170) (136 009) (53 544) (96 693) (55 437) (48 458) 0
* The name and purpose of each service group is summarised in Note 10.** Appropriations are made on a Department basis and not to individual service groups. Consequently, government contributions must be included in the ‘Not Attributable’ column.

250FIN
AN
CIAL STATEM
ENTS
NSW
TRADE & IN
VESTMEN
T ANN
UAL REPO
RT 2010 -11
FINA
NCIA
L STATEMEN
TS - NSW
TRAD
E & IN
VESTMEN
T
Service group statements for the year ended 30 June 2011 for Department of Trade and Investment, Regional Infrastructure and Services (continued)Service groups previously within: Department of Environment, Climate Change and Water Communities NSW Department of Services,Technology and Administration
EXPENSES & INCOME Urban Water Utilities Water Management Marine Parks Authority Secretariat
Catchment Management
Authorities Secretariat
Arts Industry and Facilities Development
Community Development, Services and
Industry Regulation
Personnel Services Retail Tenancy Unit
April - June2011 $000
April - June2011 $000
April - June2011 $000
April -June2011 $000
April -June2011 $000
April -June2011 $000
April -June2011 $000
April -June2011 $000
Expenses excluding lossesOperating Expenses
Employee related 1 660 17 508 1 143 1 135 1 054 2 959 46 684 127Other operating expenses 2 081 10 426 820 330 1 483 629 0 98
Depreciation and amortisation 0 8 076 57 0 795 617 0 0Grants and subsidies 30 440 17 783 4 14 839 14 353 4 465 0 0Finance costs 0 (438) 0 0 0 0 0 0Other expenses 0 6 139 0 0 0 0 0 0Total expenses excluding losses 34 181 59 494 2 024 16 304 17 685 8 670 46 684 225
RevenueSale of goods and services 1 15 168 22 0 351 (2 953) 0 223Investment revenue 0 1 012 0 0 0 0 0 0Fees and fines 0 0 21 0 0 0 0 0Grants and contributions 0 18 013 63 75 90 0 0 0Other revenue 60 4 652 0 0 542 438 0 0Personnel services revenue 0 256 0 0 0 0 45 149 0Total Revenue 61 39 101 106 75 983 (2 515) 45 149 223
Gain/ (loss) on disposal 0 (46) (12) 0 0 0 0 0Other gains /(losses) 0 (115) 0 0 0 0 0 0Joint ventures (note 33) 0 22 029 0 0 0 0 0 0Net Cost of Services 34 120 (1 475) 1 930 16 229 16 702 11 185 1 535 2
Government contributions ** 0 0 0 0 0 0 0 0
SURPLUS/ (DEFICIT) FOR THE YEAR (34 120) 1 475 (1 930) (16 229) (16 702) (11 185) (1 535) (2)Other Comprehensive IncomeNet increase / (decrease) in asset revaluation reserve 0 0 0 0 0 0 0 0Available for sale financial assets 0 0 0 0 0 0 0 0
Valuation gains / losses 0 0 0 0 0 0 0 0Superannuation actuarial gains / (losses) 0 0 0 0 (578) 0 0 0Revaluation of investments - equity method 0 35 342 0 0 0 0 0 0Revaluation of share in joint ventures 0 10 952 0 0 0 0 0 0Other net increases / (decreases) in equity 0 1 136 0 0 0 0 0 0Total Other Comprehensive Income 0 47 430 0 0 (578) 0 0 0TOTAL COMPREHENSIVE INCOME (34 120) 48 905 (1 930) (16 229) (17 280) (11 185) (1 535) (2)
* The name and purpose of each service group is summarised in Note 10.** Appropriations are made on a Department basis and not to individual service groups. Consequently, government contributions must be included in the ‘Not Attributable’ column.

251N
SW TRAD
E & INVESTM
ENT AN
NU
AL REPORT 2010 -11
FINA
NCIA
L STATEMEN
TS
FINA
NCIA
L STATEMEN
TS - NSW
TRAD
E & IN
VESTMEN
T
Service group statements for the year ended 30 June 2011 for Department of Trade and Investment, Regional Infrastructure and Services (continued)Service groups previously within: Land and Property Management Authority
EXPENSES & INCOME Crown Lands Soil Conservation, Rural Services and
Programs
Commercial activity:Crown Leaseholds
Entity (CLE)
Commercial activity:Land Development Working Account
(LDWA)
Commercial activity:Crown Lands
Homesites Program (CLHP)
Office of Biofuels Not Attributable Total NSW Trade & Investment
April - June2011 $000
April - June2011 $000
April - June2011 $000
April - June2011 $000
April - June2011 $000
April - June2011 $000
2011 $000
2011 $000
Expenses excluding lossesOperating Expenses
Employee related 14 542 2 199 0 0 5 58 0 441 270Other operating expenses 4 272 3 572 573 2 164 4 526 2 0 177 920
Depreciation and amortisation 299 138 10 342 1 0 0 0 43 347Grants and subsidies 33 837 342 2 903 0 0 0 0 382 816Finance costs 565 0 0 0 (1 504) 0 0 (352)Other expenses 3 512 0 (1 108) 0 0 0 0 129 133Total expenses excluding losses 57 027 6 251 12 710 2 165 3 027 60 0 1 174 134
RevenueSale of goods and services 0 8 186 259 665 5 350 0 0 95 804Investment revenue 13 800 0 767 0 (1 504) 0 0 22 488Fees and fines 520 0 368 (53) 0 0 0 13 351Grants and contributions (10 840) 0 0 0 0 0 0 96 978Other revenue (50) 0 261 0 0 0 0 21 246Personnel services revenue (256) 0 0 0 0 0 0 104 961Total Revenue 3 174 8 186 1 655 612 3 846 0 0 354 828
Gain/ (loss) on disposal 7 523 514 (25 975) 5 523 0 0 0 (16 963)Other gains /(losses) (607) 13 534 123 0 0 0 1 012Joint ventures (note 33) 0 0 0 0 0 0 0 22 029Net Cost of Services 46 937 (2 462) 36 496 (4 093) (819) 60 0 813 228
Government contributions ** 0 0 0 0 0 0 807 993 807 993
SURPLUS/ (DEFICIT) FOR THE YEAR (46 937) 2 462 (36 496) 4 093 819 (60) 807 993 (5 235)Other Comprehensive IncomeNet increase / (decrease) in asset revaluation reserve
1 137 0 0 0 0 0 0 22 516
Available for sale financial assetsValuation gains / losses 0 0 0 0 0 0 0 (220)
Superannuation actuarial gains / (losses) 472 0 0 0 0 0 0 3 175Revaluation of investments - equity method 0 0 0 0 0 0 0 35 342Revaluation of share in joint ventures 0 0 0 0 0 0 0 10 952Other net increases / (decreases) in equity 0 0 0 0 0 0 0 1 136Total Other Comprehensive Income 1 609 0 0 0 0 0 0 72 901TOTAL COMPREHENSIVE INCOME (45 328) 2 462 (36 496) 4 093 819 (60) 807 993 67 666
* The name and purpose of each service group is summarised in Note 10.** Appropriations are made on a Department basis and not to individual service groups. Consequently, government contributions must be included in the ‘Not Attributable’ column
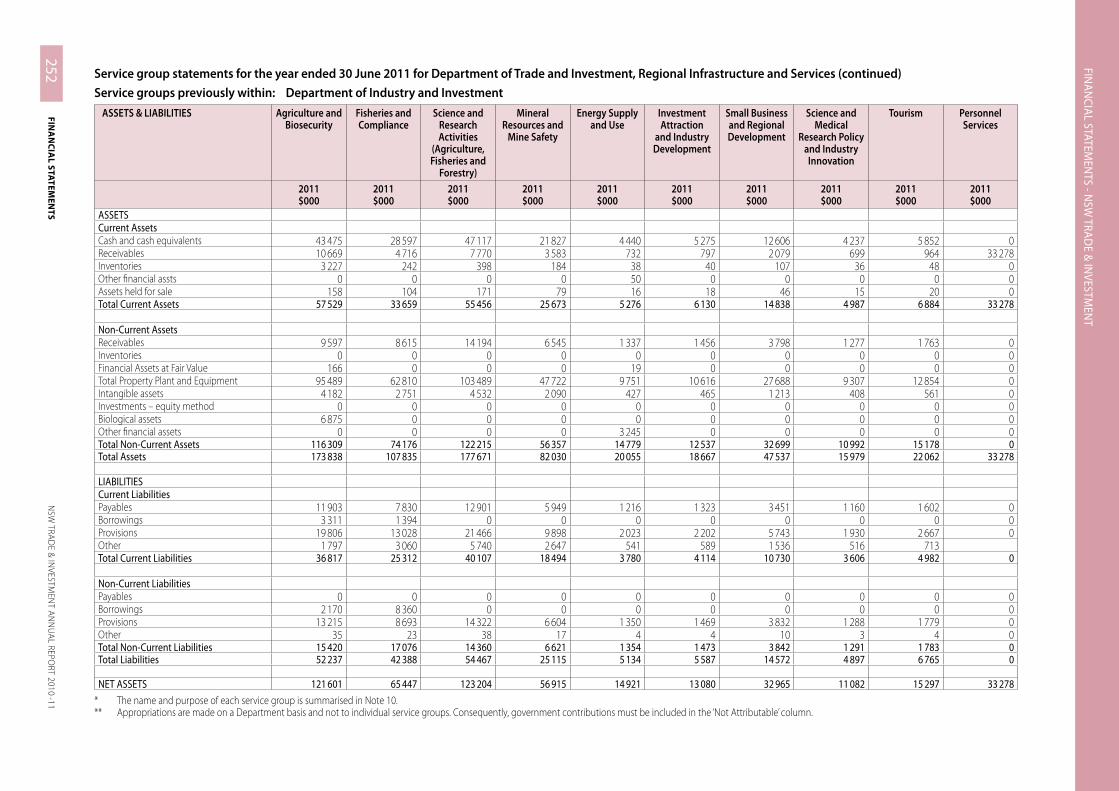
252FIN
AN
CIAL STATEM
ENTS
NSW
TRADE & IN
VESTMEN
T ANN
UAL REPO
RT 2010 -11
FINA
NCIA
L STATEMEN
TS - NSW
TRAD
E & IN
VESTMEN
T
Service group statements for the year ended 30 June 2011 for Department of Trade and Investment, Regional Infrastructure and Services (continued)Service groups previously within: Department of Industry and Investment
ASSETS & LIABILITIES Agriculture and Biosecurity
Fisheries and Compliance
Science and Research Activities
(Agriculture, Fisheries and
Forestry)
Mineral Resources and
Mine Safety
Energy Supply and Use
Investment Attraction
and Industry Development
Small Business and Regional Development
Science and Medical
Research Policy and Industry Innovation
Tourism Personnel Services
2011 $000
2011 $000
2011 $000
2011 $000
2011 $000
2011 $000
2011 $000
2011 $000
2011 $000
2011 $000
ASSETSCurrent AssetsCash and cash equivalents 43 475 28 597 47 117 21 827 4 440 5 275 12 606 4 237 5 852 0Receivables 10 669 4 716 7 770 3 583 732 797 2 079 699 964 33 278Inventories 3 227 242 398 184 38 40 107 36 48 0Other financial assts 0 0 0 0 50 0 0 0 0 0Assets held for sale 158 104 171 79 16 18 46 15 20 0Total Current Assets 57 529 33 659 55 456 25 673 5 276 6 130 14 838 4 987 6 884 33 278
Non-Current AssetsReceivables 9 597 8 615 14 194 6 545 1 337 1 456 3 798 1 277 1 763 0Inventories 0 0 0 0 0 0 0 0 0 0Financial Assets at Fair Value 166 0 0 0 19 0 0 0 0 0Total Property Plant and Equipment 95 489 62 810 103 489 47 722 9 751 10 616 27 688 9 307 12 854 0Intangible assets 4 182 2 751 4 532 2 090 427 465 1 213 408 561 0Investments – equity method 0 0 0 0 0 0 0 0 0 0Biological assets 6 875 0 0 0 0 0 0 0 0 0Other financial assets 0 0 0 0 3 245 0 0 0 0 0Total Non-Current Assets 116 309 74 176 122 215 56 357 14 779 12 537 32 699 10 992 15 178 0Total Assets 173 838 107 835 177 671 82 030 20 055 18 667 47 537 15 979 22 062 33 278
LIABILITIESCurrent LiabilitiesPayables 11 903 7 830 12 901 5 949 1 216 1 323 3 451 1 160 1 602 0Borrowings 3 311 1 394 0 0 0 0 0 0 0 0Provisions 19 806 13 028 21 466 9 898 2 023 2 202 5 743 1 930 2 667 0Other 1 797 3 060 5 740 2 647 541 589 1 536 516 713Total Current Liabilities 36 817 25 312 40 107 18 494 3 780 4 114 10 730 3 606 4 982 0
Non-Current LiabilitiesPayables 0 0 0 0 0 0 0 0 0 0Borrowings 2 170 8 360 0 0 0 0 0 0 0 0Provisions 13 215 8 693 14 322 6 604 1 350 1 469 3 832 1 288 1 779 0Other 35 23 38 17 4 4 10 3 4 0Total Non-Current Liabilities 15 420 17 076 14 360 6 621 1 354 1 473 3 842 1 291 1 783 0Total Liabilities 52 237 42 388 54 467 25 115 5 134 5 587 14 572 4 897 6 765 0
NET ASSETS 121 601 65 447 123 204 56 915 14 921 13 080 32 965 11 082 15 297 33 278
* The name and purpose of each service group is summarised in Note 10.** Appropriations are made on a Department basis and not to individual service groups. Consequently, government contributions must be included in the ‘Not Attributable’ column.

253N
SW TRAD
E & INVESTM
ENT AN
NU
AL REPORT 2010 -11
FINA
NCIA
L STATEMEN
TS
FINA
NCIA
L STATEMEN
TS - NSW
TRAD
E & IN
VESTMEN
T
Service group statements for the year ended 30 June 2011 for Department of Trade and Investment, Regional Infrastructure and Services (continued)Service groups previously within: Department of Environment, Climate Change and Water Communities NSW Department of Services, Technology and Administration
ASSETS & LIABILITIES Urban Water Utilities Water Management Marine Parks Authority Secretariat
Catchment Management
Authorities Secretariat
Arts Industry and Facilities Development
Community Development,
Services and Industry Regulation
Personnel Services Retail Tenancy Unit
2011 $000
2011 $000
2011 $000
2011 $000
2011 $000
2011 $000
2011 $000
2011 $000
ASSETSCurrent AssetsCash and cash equivalents 6 281 55 138 805 2 615 10 511 4 555 0 0Receivables 612 29 667 3 3 (74) 422 29 583 0Inventories 0 0 0 0 0 0 0 0Other financial assts 0 0 0 0 0 0 0 0Assets held for sale 0 0 0 0 0 0 0 0Total Current Assets 6 893 84 805 808 2 618 10 437 4 977 29 583 0
Non-Current AssetsReceivables 0 0 0 0 0 0 1 254 0Inventories 0 0 0 0 0 0 0 0Financial Assets at Fair Value 0 0 0 0 0 0 0 0Total Property Plant and Equipment 0 588 481 1 530 0 153 397 2 103 0 0Intangible assets 0 143 646 0 0 23 4 846 0 0Investments – equity method 0 70 980 0 0 0 0 0 0Biological assets 0 0 0 0 0 0 0 0Other financial assets 0 5 0 0 0 0 0 0Total Non-Current Assets 0 803 112 1 530 0 153 420 6 949 1 254 0Total Assets 6 893 887 917 2 338 2 618 163 857 11 926 30 837 0
LIABILITIESCurrent LiabilitiesPayables 4 330 12 003 93 70 590 1 905 9 322 0Borrowings 0 0 0 0 0 0 0 0Provisions 1 143 9 726 405 2 897 383 1 478 21 729 0Other 558 1 395 0 0 0 0 0 0Total Current Liabilities 6 031 23 124 498 2 967 973 3 383 31 051 0
Non-Current LiabilitiesPayables 0 0 0 0 0 0 0 0Borrowings 0 0 0 0 0 0 0 0Provisions 92 791 0 0 3 46 1 254 0Other 0 0 0 0 2 766 0 0 0Total Non-Current Liabilities 92 791 0 0 2 769 46 1 254 0Total Liabilities 6 123 23 915 498 2 967 3 742 3 429 32 305 0
NET ASSETS 770 864 002 1 840 (349) 160 115 8 497 (1 468) 0* The name and purpose of each service group is summarised in Note 10.** Appropriations are made on a Department basis and not to individual service groups. Consequently, government contributions must be included in the ‘Not Attributable’ column.

254FIN
AN
CIAL STATEM
ENTS
NSW
TRADE & IN
VESTMEN
T ANN
UAL REPO
RT 2010 -11
FINA
NCIA
L STATEMEN
TS - NSW
TRAD
E & IN
VESTMEN
T
Service group statements for the year ended 30 June 2011 for Department of Trade and Investment, Regional Infrastructure and Services (continued)Service groups previously within: Land and Property Management Authority
ASSETS & LIABILITIES Crown Lands Soil Conservation, Rural Services and
Programs
Commercial activity:Crown Leaseholds
Entity (CLE)
Commercial activity:Land Development Working Account
(LDWA)
Commercial activity:Crown Lands
Homesites Program (CLHP)
Office of Biofuels Not Attributable Total NSW Trade & Investment
2011 $000
2011 $000
2011 $000
2011 $000
2011 $000
2011 $000
2011 $000
2011 $000
ASSETSCurrent AssetsCash and cash equivalents 4 568 2 202 3 445 8 015 9 921 0 0 281 482Receivables 17 454 6 037 23 991 (2 844) 565 0 0 170 706Inventories 0 106 0 4 128 21 042 0 0 29 596Other financial assts 6 015 0 0 0 0 0 0 6 065Assets held for sale 60 226 0 0 0 0 0 913Total Current Assets 28 097 8 571 27 436 9 299 31 528 0 0 488 762
Non-Current AssetsReceivables 0 0 120 984 0 88 0 0 170 908Inventories 0 0 0 4 460 10 525 0 0 14 985Financial Assets at Fair Value 3 939 0 0 0 0 0 0 4 124Total Property Plant and Equipment 37 891 21 691 6 263 987 0 0 0 0 7 448 806Intangible assets 245 0 0 0 0 0 0 165 389Investments – equity method 0 0 0 0 0 0 0 70 980Biological assets 0 0 0 0 0 0 0 6 875Other financial assets 19 435 0 0 0 0 0 0 22 685Total Non-Current Assets 61 510 21 691 6 384 971 4 460 10 613 0 0 7 904 752Total Assets 89 607 30 262 6 412 407 13 759 42 141 0 0 8 393 514
LIABILITIESCurrent LiabilitiesPayables 2 552 8 688 13 970 1 751 1 615 78 0 104 302Borrowings 2 066 0 0 0 0 0 0 6 771Provisions 7 015 6 452 0 0 1 081 9 0 131 081Other 513 0 0 0 0 0 0 19 605Total Current Liabilities 12 146 15 140 13 970 1 751 2 696 87 0 261 759
Non-Current LiabilitiesPayables 0 0 0 0 0 0 0 0Borrowings 2 855 0 0 0 0 0 0 13 385Provisions 62 7 356 630 954 0 398 0 0 693 508Other 0 0 0 0 8 434 0 0 11 338Total Non-Current Liabilities 2 917 7 356 630 954 0 8 832 0 0 718 231Total Liabilities 15 063 22 496 644 924 1 751 11 528 87 0 979 990
NET ASSETS 74 544 7 766 5 767 483 12 008 30 613 (87) 0 7 413 524* The name and purpose of each service group is summarised in Note 10.** Appropriations are made on a Department basis and not to individual service groups. Consequently, government contributions must be included in the ‘Not Attributable’ column

255N
SW TRAD
E & INVESTM
ENT AN
NU
AL REPORT 2010 -11
FINA
NCIA
L STATEMEN
TS
FINA
NCIA
L STATEMEN
TS - NSW
TRAD
E & IN
VESTMEN
T
Service group statements for the year ended 30 June 2011 for Department of Trade and Investment, Regional Infrastructure and Services (continued)Service groups previously within: Department of Industry and Investment
ADMINISTEREDEXPENSES & INCOME
Agriculture and Biosecurity
Fisheries and Compliance
Science and Research Activities
(Agriculture, Fisheries and
Forestry)
Mineral Resources and
Mine Safety
Energy Supply and Use
Investment Attraction
and Industry Development
Small Business and Regional Development
Science and Medical
Research Policy and Industry Innovation
Tourism Personnel Services
2011 $000
2011 $000
2011 $000
2011 $000
2011 $000
2011 $000
2011 $000
2011 $000
2011 $000
2011 $000
Administered ExpensesTransfer payments 14 789 0 9 557 0 0 17 370 23 0 0 0Other 0 0 0 0 0 0 0 0 0 0Total Administered Expenses 14 789 0 9 557 0 0 17 370 23 0 0 0
Administered RevenueTransfer receipts 14 789 0 9 557 0 0 17 370 23 0 0 0Consolidated fund - Fees and fines 851 509 0 4 185 0 0 0 0 0 0 - Other 0 0 0 1 329 701 0 0 0 0 0 0Total Administered Revenue 15 640 509 9 557 1 333 886 0 17 370 23 0 0 0ADMINISTERED REVENUE less EXPENSES 851 509 0 1 333 886 0 0 0 0 0 0
Service groups previously within: Department of Environment, Climate Change and Water Communities NSW Department of Services, Technology and Administration
ADMINISTEREDEXPENSES & INCOME
Urban Water Utilities Water Management Marine Parks Authority Secretariat
Catchment Management
Authorities Secretariat
Arts Industry and Facilities Development
Community Development, Services and
Industry Regulation
Personnel Services Retail Tenancy Unit
April - June2011 $000
April - June2011 $000
April - June2011 $000
April -June2011 $000
April -June2011 $000
April -June2011 $000
April -June2011 $000
April -June2011 $000
Administered ExpensesTransfer payments 0 0 0 0 37 315 0 0 0Other 0 0 0 0 0 959 0 0Total Administered Expenses 0 0 0 0 37 315 959 0 0
Administered RevenueTransfer receipts 0 0 0 0 37 315 0 0 0Consolidated fund - Fees and fines 0 503 0 0 0 602 0 0 - Other 0 0 0 0 0 0 0 0Total Administered Revenue 0 503 0 0 37 315 602 0 0ADMINISTERED REVENUE less EXPENSES 0 503 0 0 0 (357) 0 0
* The name and purpose of each service group is summarised in Note 10.
** Appropriations are made on a Department basis and not to individual service groups. Consequently, government contributions must be included in the ‘Not Attributable’ column.

256FIN
AN
CIAL STATEM
ENTS
NSW
TRADE & IN
VESTMEN
T ANN
UAL REPO
RT 2010 -11
FINA
NCIA
L STATEMEN
TS - NSW
TRAD
E & IN
VESTMEN
T
Service group statements for the year ended 30 June 2011 for Department of Trade and Investment, Regional Infrastructure and Services (continued)Service groups previously within: Land and Property Management Authority
ADMINISTEREDEXPENSES & INCOME
Crown Lands Soil Conservation, Rural Services and
Programs
Commercial activity:Crown Leaseholds
Entity (CLE)
Commercial activity:Land Development Working Account
(LDWA)
Office of Biofuels) Not Attributable Total
April - June2011 $000
April - June2011 $000
April - June2011 $000
April -June2011 $000
April -June2011 $000
2011 $000
2011 $000
Administered ExpensesTransfer payments 0 0 0 0 0 0 79 054Other 0 0 0 0 0 0 959Total Administered Expenses 0 0 0 0 0 0 80 013
Administered RevenueTransfer receipts 0 0 0 0 0 0 79 054Consolidated fund - Fees and fines 0 0 0 0 0 0 6 650 - Other 0 0 0 0 0 17 1 329 718Total Administered Revenue 0 0 0 0 0 17 1 415 422ADMINISTERED REVENUE less EXPENSES 0 0 0 0 0 17 1 335 409
* The name and purpose of each service group is summarised in Note 10.** Appropriations are made on a Department basis and not to individual service groups. Consequently, government contributions must be included in the ‘Not Attributable’ column

257N
SW TRAD
E & INVESTM
ENT AN
NU
AL REPORT 2010 -11
FINA
NCIA
L STATEMEN
TS
FINA
NCIA
L STATEMEN
TS - NSW
TRAD
E & IN
VESTMEN
T
Service group statements for the year ended 30 June 2010 for NSW Department of Industry and Investment - Division of Primary Industries
DIVISION’S EXPENSES & INCOME Service Group 43.1 - Agriculture,
Biosecurity and Mine Safety
Service Group 43.2 - Mineral Resources
Service Group 43.3 - Fisheries and
Compliance
Service Group 43.4 - Science and
Research
Service Group 43.5 - Personnel Services
Not Attributable Total
2010$000
2010$000
2010$000
2010$000
2010$000
2010$000
2010$000
Expenses excluding lossesOperating ExpensesEmployee related 62 701 42 019 42 415 90 845 64 243 0 302 223Other operating expenses 34 877 22 398 19 068 42 248 0 0 118 591Depreciation and amortisation 5 547 2 834 3 738 8 281 0 0 20 400Grants and subsidies 38 439 54 454 32 0 0 38 979Finance costs 535 0 741 0 0 0 1 276Other expenses 4 514 10 619 1 036 36 0 0 16 205Total expenses excluding losses 146 613 77 924 67 452 141 442 64 243 0 497 674
RevenueSale of goods and services 15 176 35 098 8 259 11 775 0 0 70 308Investment revenue 756 332 1 009 972 0 0 3 069Fees and fines 0 0 13 257 0 0 0 13 257Grants and contributions 16 446 25 261 1 978 32 956 0 0 76 641Other revenue 436 778 543 3 677 0 0 5 434Personnel services revenue 0 0 0 0 64 243 0 64 243Total Revenue 32 814 61 469 25 046 49 380 64 243 0 232 952
Gain/ (loss) on disposal 131 67 88 204 0 0 490Other gains /(losses) 51 26 34 77 0 0 188Net Cost of Services 113 617 16 362 42 284 91 781 0 0 264 044
Government contributions ** 0 0 0 0 0 284 910 284 910
SURPLUS/ (DEFICIT) FOR THE YEAR (113 617) (16 362) (42 284) (91 781) 0 284 910 20 866Other Comprehensive IncomeNet increase / (decrease) in asset revaluation reserve
1 375 702 926 2 053 0 0 5 056
Available for sale financial assets Valuation gains / losses 259 132 174 387 0 0 952 Transferred to surplus / deficit on disposal
0 0 0 0 0 0 0
Net change in the asset revaluation reserve arising from a change in the restoration liability
0 0 0 0 0 0 0
Superannuation actuarial gains / (losses)
0 0 0 0 0 0 0
Other net increases / (decreases) in equity
0 0 0 0 0 0 0
Total Other Comprehensive Income 1 634 834 1 100 2 440 0 0 6 008TOTAL COMPREHENSIVE INCOME (111 983) (15 528) (41 184) (89 341) 0 284 910 26 874
* The name and purpose of each service group is summarised in Note 10.** Appropriations are made on a Department basis and not to individual service groups. Consequently, government contributions must be included in the ‘Not Attributable’ column.

258FIN
AN
CIAL STATEM
ENTS
NSW
TRADE & IN
VESTMEN
T ANN
UAL REPO
RT 2010 -11
FINA
NCIA
L STATEMEN
TS - NSW
TRAD
E & IN
VESTMEN
T
Service group statements for the year ended 30 June 2010 for NSW Department of Industry and Investment - Division of Primary Industries (continued)
DIVISION’S ADMINISTERED EXPENSES & INCOME
Service Group 43.1 -Agriculture,
Biosecurity and Mine Safety
Service Group 43.2 -Mineral Resources
Service Group 43.3 -Fisheries and Compliance
Service Group 43.4 -Science and
Research
Service Group 43.5 -Personnel Services
Not Attributable Total
2010$000
2010$000
2010$000
2010$000
2010$000
2010$000
2010$000
Administered ExpensesTransfer payments 0 0 0 0 0 0 0Other 0 0 0 0 0 0 0Total Administered Expenses 0 0 0 0 0 0 0
Administered RevenuesTransfer receiptsConsolidated Fund- Fees and fines 0 0 0 0 0 5 388 5 388- Other 0 0 0 0 0 1 064 640 1 064 640Total Administered Revenues 0 0 0 0 0 1 070 028 1 070 028Administrated Revenues less Expenses
0 0 0 0 0 1 070 028 1 070 028
* The name and purpose of each service group is summarised in Note 10.** Administered assets and liabilities are disclosed in Note 31

259N
SW TRAD
E & INVESTM
ENT AN
NU
AL REPORT 2010 -11
FINA
NCIA
L STATEMEN
TS
FINA
NCIA
L STATEMEN
TS - NSW
TRAD
E & IN
VESTMEN
T
Service group statements for the year ended 30 June 2010 for NSW Department of Industry and Investment - Division of Primary Industries (continued)
DIVISION’S ASSETS & LIABILITIES Service Group 43.1 -Agriculture,
Biosecurity and Mine Safety
Service Group 43.2 -Mineral Resources
Service Group 43.3 -Fisheries and Compliance
Service Group 43.4 -Science and
Research
Service Group 43.5 -Personnel Services
Not Attributable Total
2010$000
2010$000
2010$000
2010$000
2010$000
2010$000
2010$000
ASSETSCurrent AssetsCash and cash equivalents 31 939 16 320 21 522 47 686 0 0 117 467Receivables 7 101 3 629 4 785 10 602 29 334 0 55 451Inventories 513 262 345 765 0 0 1 885Other financial assets 0 0 0 0 0 0 0Assets held for sale 143 73 96 213 0 0 525Total Current Assets 39 696 20 284 26 748 59 266 29 334 0 175 328
Non-Current AssetsFinancial Assets at Fair Value 1 179 603 795 1 760 0 0 4 337Receivables 15 921 8 135 10 728 23 772 0 0 58 556Property Plant and Equipment 87 329 44 624 58 846 130 386 0 0 321 185Biological assets 1 605 820 1 081 2 396 0 0 5 902Intangible assets 2 927 1 496 1 972 4 371 0 0 10 766Other financial assets 1 830 935 1 233 2 734 0 0 6 732Total Non-Current Assets 110 791 56 613 74 655 165 419 0 0 407 478Total Assets 150 487 76 897 101 403 224 685 29 334 0 582 806
LIABILITIESCurrent LiabilitiesPayables 15 753 8 049 10 615 23 519 1 839 0 59 775Borrowings 3 133 0 1 307 0 0 0 4 440Provisions 11 715 5 986 7 894 17 493 27 495 0 70 583Other 6 485 3 314 4 370 9 683 0 0 23 852Total Current Liabilities 37 086 17 349 24 186 50 695 29 334 0 158 650
Non-Current LiabilitiesPayables 0 0 0 0 0 0 0Borrowings 3 901 301 10 152 881 0 0 15 235Provisions 996 509 671 1 489 55 334 0 58 999Other 0 0 0 0 0 0 0Total Non-Current Liabilities 4 897 810 10 823 2 370 55 334 0 74 234Total Liabilities 41 983 18 159 35 009 53 065 84 668 0 232 884
NET ASSETS 108 504 58 738 66 394 171 620 (55 334) 0 349 922
* The name and purpose of each service group is summarised in Note 10.

260FIN
AN
CIAL STATEM
ENTS
NSW
TRADE & IN
VESTMEN
T ANN
UAL REPO
RT 2010 -11
FINA
NCIA
L STATEMEN
TS - NSW
TRAD
E & IN
VESTMEN
T
Service group statements for the year ended 30 June 2010 for NSW Department of Industry and Investment - Division of State and Regional Development and Tourism
DIVISION’S EXPENSES & INCOME Service Group 46.1 -Investment
and Industry Development
Service Group 46.2 -Enterprise,
Small Business and Regional Development
Service Group 46.3 -International
Markets and Trade
Service Group 46.4 -Innovation, Research
and Policy
Service Group 46.5 -Tourism
Not Attributable Total
2010$000
2010$000
2010$000
2010$000
2010$000
2010$000
2010$000
Expenses excluding lossesOperating Expenses
Employee related 9 374 13 583 6 025 9 559 12 219 0 50 760Other operating expenses 1 470 6 054 4 730 4 109 5 172 0 21 535
Depreciation and amortisation 1 189 657 254 321 585 0 3 006Grants and subsidies 7 668 18 327 0 41 774 4 139 0 71 908Finance costs 0 0 0 0 0 0 0Other expenses 19 186 31 744 2 649 2 794 33 980 0 90 353Total expenses excluding losses 38 887 70 365 13 658 58 557 56 095 0 237 562
RevenueSale of goods and services 0 99 403 0 86 0 588Investment revenue 70 201 105 140 181 0 697Fees and fines 0Grants and contributions 764 300 673 13 5 264 0 7 014Other revenue 52 871 75 296 1 501 0 2 795Personnel services revenue 2 262 0 0 0 0 0 2 262Total Revenue 3 148 1 471 1 256 449 7 032 0 13 356
Gain/ (loss) on disposal (2) (6) (2) (2) (5) 0 (17)Other gains /(losses) 15 49 23 31 40 0 158Net Cost of Services 35 726 68 851 12 381 58 079 49 028 0 224 065
Government contributions ** 213 760 213 760
SURPLUS/ (DEFICIT) FOR THE YEAR (35 726) (68 851) (12 381) (58 079) (49 028) 213 760 (10 305)Other Comprehensive IncomeTotal Other Comprehensive Income 0 0 0 0 0 0 0TOTAL COMPREHENSIVE INCOME (35 726) (68 851) (12 381) (58 079) (49 028) 213 760 (10 305)
* The name and purpose of each service group is summarised in Note 10.** Appropriations are made on a Department basis and not to individual service groups. Consequently, government contributions must be included in the ‘Not Attributable’ column.

261N
SW TRAD
E & INVESTM
ENT AN
NU
AL REPORT 2010 -11
FINA
NCIA
L STATEMEN
TS
FINA
NCIA
L STATEMEN
TS - NSW
TRAD
E & IN
VESTMEN
T
Service group statements for the year ended 30 June 2010 for NSW Department of Industry and Investment - Division of State and Regional Development and Tourism (continued)
DIVISION’S ASSETS & LIABILITIES Service Group 46.1 -Investment
and Industry Development
Service Group 46.2 -Enterprise,
Small Business and Regional Development
Service Group 46.3 -International
Markets and Trade
Service Group 46.4 -Innovation, Research
and Policy
Service Group 46.5 -Tourism
Not Attributable Total
2010$000
2010$000
2010$000
2010$000
2010$000
2010$000
2010$000
ASSETSCurrent AssetsCash and cash equivalents 0 0 0 0 0 9 085 9 085Receivables 734 3 363 1 205 1 631 2 942 0 9 875Inventories 0 0 0 0 0 0 0Other financial assets 0 0 0 0 0 0 0Assets held for sale 0 0 0 0 0 0 0Total Current Assets 734 3 363 1 205 1 631 2 942 9 085 18 960
Non-Current AssetsReceivables 0 0 0 0 0 0 0Financial Assets at Fair Value 0 0 0 0 0 0 0Total Property Plant and Equipment 9 315 969 469 556 1 277 0 12 586Biological assets 0 0 0 0 0 0 0Intangible assets 40 306 61 80 118 0 605Other financial assets 0 0 0 0 0 0 0Total Non-Current Assets 9 355 1 275 530 636 1 395 0 13 191Total Assets 10 089 4 638 1 735 2 267 4 337 9 085 32 151
LIABILITIESCurrent LiabilitiesPayables 4 489 4 875 705 478 944 0 11 491Borrowings 0 0 0 0 0 0 0Provisions 527 1 519 937 1 307 1 786 0 6 076Other 111 170 12 85 173 0 551Total Current Liabilities 5 127 6 564 1 654 1 870 2 903 0 18 118
Non-Current LiabilitiesPayables 0 0 0 0 0 0 0Borrowings 0 0 0 0 0 0 0Provisions 94 271 141 188 336 0 1 030Other 14 40 20 28 36 0 138Total Non-Current Liabilities 108 311 161 216 372 0 1 168Total Liabilities 5 235 6 875 1 815 2 086 3 275 0 19 286
NET ASSETS 4 854 (2 237) (80) 181 1 062 9 085 12 865* The name and purpose of each service group is summarised in Note 10.** Appropriations are made on a Department basis and not to individual service groups. Consequently, government contributions must be included in the ‘Not Attributable’ column.
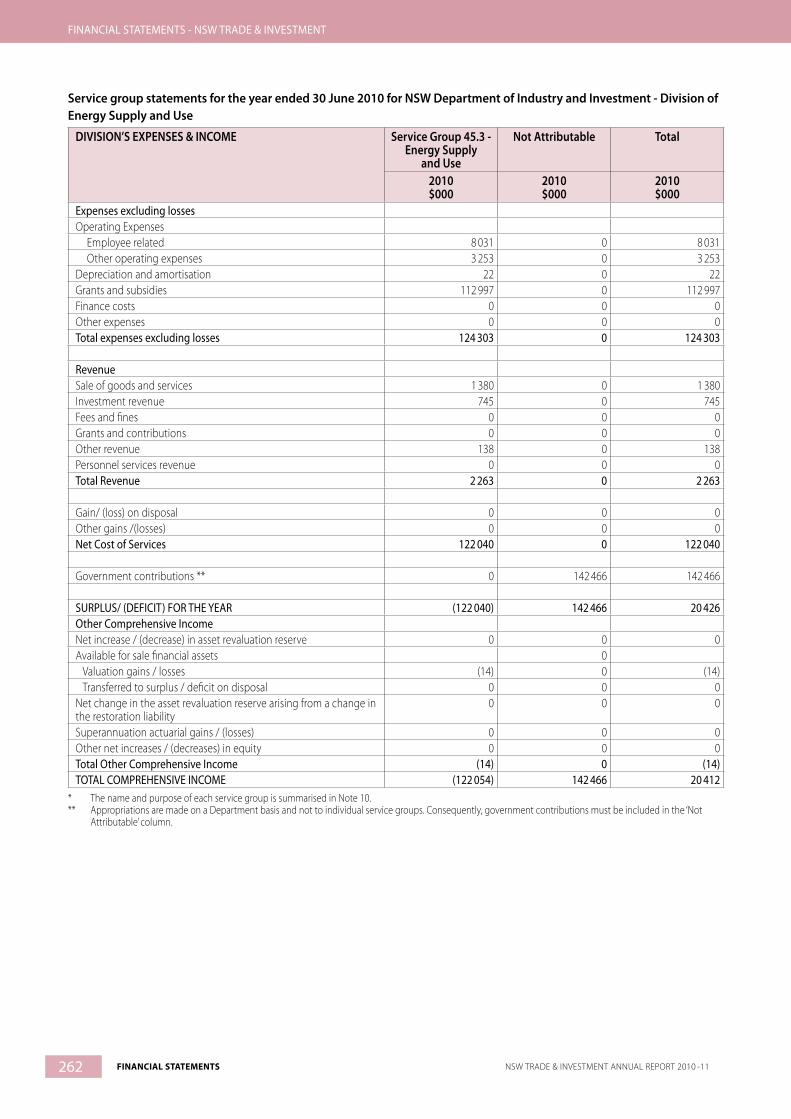
262 FINANCIAL STATEMENTS NSW TRADE & INVESTMENT ANNUAL REPORT 2010 -11
FINANCIAL STATEMENTS - NSW TRADE & INVESTMENT
Service group statements for the year ended 30 June 2010 for NSW Department of Industry and Investment - Division of Energy Supply and Use
DIVISION’S EXPENSES & INCOME Service Group 45.3 -Energy Supply
and Use
Not Attributable Total
2010$000
2010$000
2010$000
Expenses excluding lossesOperating Expenses
Employee related 8 031 0 8 031Other operating expenses 3 253 0 3 253
Depreciation and amortisation 22 0 22Grants and subsidies 112 997 0 112 997Finance costs 0 0 0Other expenses 0 0 0Total expenses excluding losses 124 303 0 124 303
RevenueSale of goods and services 1 380 0 1 380Investment revenue 745 0 745Fees and fines 0 0 0Grants and contributions 0 0 0Other revenue 138 0 138Personnel services revenue 0 0 0Total Revenue 2 263 0 2 263
Gain/ (loss) on disposal 0 0 0Other gains /(losses) 0 0 0Net Cost of Services 122 040 0 122 040
Government contributions ** 0 142 466 142 466
SURPLUS/ (DEFICIT) FOR THE YEAR (122 040) 142 466 20 426Other Comprehensive IncomeNet increase / (decrease) in asset revaluation reserve 0 0 0Available for sale financial assets 0 Valuation gains / losses (14) 0 (14) Transferred to surplus / deficit on disposal 0 0 0Net change in the asset revaluation reserve arising from a change in the restoration liability
0 0 0
Superannuation actuarial gains / (losses) 0 0 0Other net increases / (decreases) in equity 0 0 0Total Other Comprehensive Income (14) 0 (14)TOTAL COMPREHENSIVE INCOME (122 054) 142 466 20 412
* The name and purpose of each service group is summarised in Note 10.** Appropriations are made on a Department basis and not to individual service groups. Consequently, government contributions must be included in the ‘Not Attributable’ column.

263NSW TRADE & INVESTMENT ANNUAL REPORT 2010 -11 FINANCIAL STATEMENTS
FINANCIAL STATEMENTS - NSW TRADE & INVESTMENT
Service group statements for the year ended 30 June 2010 for NSW Department of Industry and Investment - Division of Energy Supply and Use (continued)
DIVISION’S ASSETS & LIABILITIES Service Group 45.3 -Energy Supply
and Use
Not Attributable Total
2010$000
2010$000
2010$000
ASSETSCurrent AssetsCash and cash equivalents 38 669 0 38 669Receivables 161 0 161Inventories 0 0 0Other financial assets 50 0 50Assets held for sale 0 0 0Total Current Assets 38 880 0 38 880
Non-Current AssetsReceivables 73 0 73Financial Assets at Fair Value 0Total Property Plant and Equipment 326 0 326Biological assets 0 0 0Intangible assets 0 0 0Other financial assets 63 0 63Total Non-Current Assets 462 0 462Total Assets 39 342 0 39 342
LIABILITIESCurrent LiabilitiesPayables 9 050 0 9 050Borrowings 0 0 0Provisions 379 0 379Other 0 0 0Total Current Liabilities 9 429 0 9 429
Non-Current LiabilitiesPayables 0 0 0Borrowings 0 0 0Provisions 0 0 0Other 0 0 0Total Non-Current Liabilities 0 0 0Total Liabilities 9 429 0 9 429
NET ASSETS 29 913 0 29 913* The name and purpose of each service group is summarised in Note 10.** Appropriations are made on a Department basis and not to individual service groups. Consequently, government contributions must be included in the ‘Not Attributable’ column.

264 FINANCIAL STATEMENTS NSW TRADE & INVESTMENT ANNUAL REPORT 2010 -11
FINANCIAL STATEMENTS - NSW TRADE & INVESTMENT
Service group statements for the year ended 30 June 2010 for NSW Department of Industry and Investment - Division of Energy Supply and Use (continued)
DIVISION’S ADMINISTERED EXPENSES & INCOME Service Group 45.3 -Energy Supply
and Use
Not Attributable Total
2010$000
2010$000
2010$000
Administered ExpensesTransfer payments 0 0 0Other 0 0 0Total Administered Expenses 0 0 0
Administered RevenuesTransfer receipts 0 0 0Consolidated Fund 0 0 0- Fees and fines 0 0 0- Other 0 0 0Total Administered Revenues 0 0 0Administrated Revenues less Expenses 0 0 0
* The name and purpose of each service group is summarised in Note 10.
** Administered assets and liabilities are disclosed in Note 31
Government contributions The Department receives appropriations for multiple Ministers which are attributed as follows:
Government contributions- Appropriations to:Recurrent
2010$000
Capital2010$000
Division of Primary Industries (Minister for Primary Industries) comprising service groups 43.1, 43.2, 43.3, 43.4, 43.5 288 436 25 020Division of State and Regional Development (Minister for State Development) comprising service groups 46.1, 46.2, 46.3, 46.4, 46.5 221 297 479Division of Energy Supply and Use (Minister for Energy) comprising service group 45.3 141 152 150Total Appropriations 650 885 25 649
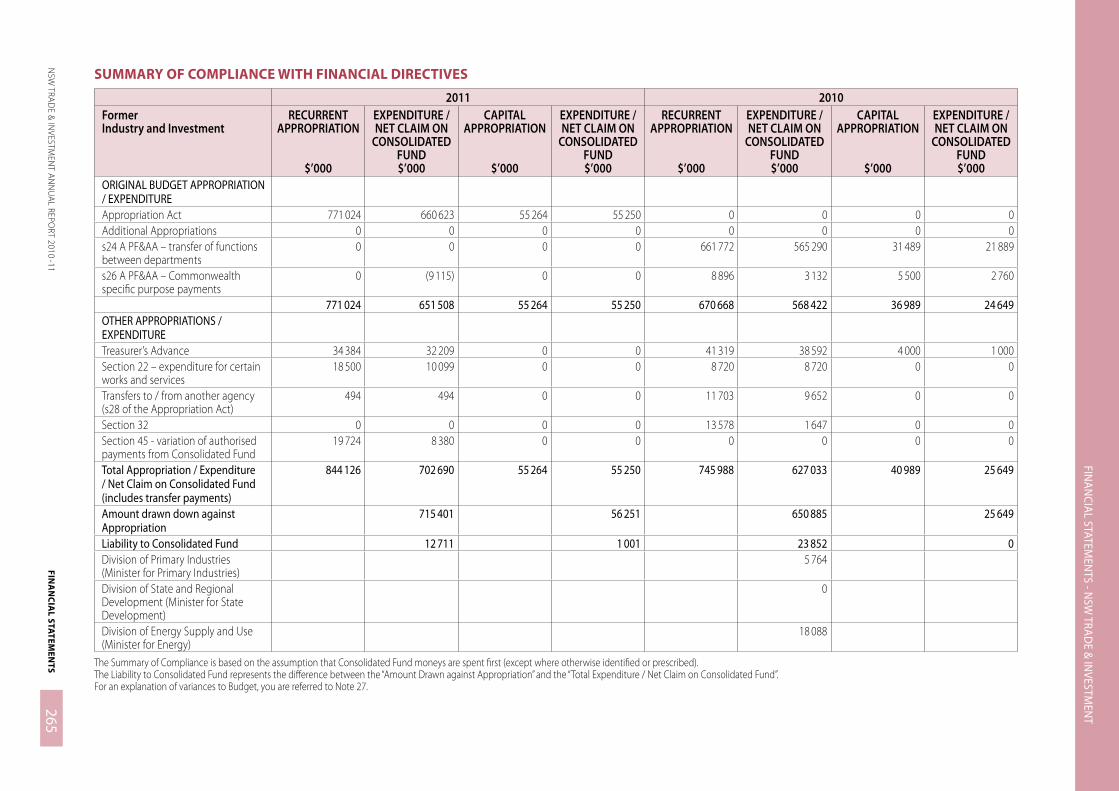
265N
SW TRAD
E & INVESTM
ENT AN
NU
AL REPORT 2010 -11
FINA
NCIA
L STATEMEN
TS
FINA
NCIA
L STATEMEN
TS - NSW
TRAD
E & IN
VESTMEN
T
SUMMARY OF COMPLIANCE WITH FINANCIAL DIRECTIVES
2011 2010FormerIndustry and Investment
RECURRENT APPROPRIATION
$’000
EXPENDITURE / NET CLAIM ON
CONSOLIDATED FUND$’000
CAPITAL APPROPRIATION
$’000
EXPENDITURE / NET CLAIM ON
CONSOLIDATED FUND$’000
RECURRENT APPROPRIATION
$’000
EXPENDITURE / NET CLAIM ON
CONSOLIDATED FUND$’000
CAPITAL APPROPRIATION
$’000
EXPENDITURE / NET CLAIM ON
CONSOLIDATED FUND$’000
ORIGINAL BUDGET APPROPRIATION / EXPENDITUREAppropriation Act 771 024 660 623 55 264 55 250 0 0 0 0Additional Appropriations 0 0 0 0 0 0 0 0s24 A PF&AA – transfer of functions between departments
0 0 0 0 661 772 565 290 31 489 21 889
s26 A PF&AA – Commonwealth specific purpose payments
0 (9 115) 0 0 8 896 3 132 5 500 2 760
771 024 651 508 55 264 55 250 670 668 568 422 36 989 24 649OTHER APPROPRIATIONS / EXPENDITURETreasurer’s Advance 34 384 32 209 0 0 41 319 38 592 4 000 1 000Section 22 – expenditure for certain works and services
18 500 10 099 0 0 8 720 8 720 0 0
Transfers to / from another agency (s28 of the Appropriation Act)
494 494 0 0 11 703 9 652 0 0
Section 32 0 0 0 0 13 578 1 647 0 0Section 45 - variation of authorised payments from Consolidated Fund
19 724 8 380 0 0 0 0 0 0
Total Appropriation / Expenditure / Net Claim on Consolidated Fund (includes transfer payments)
844 126 702 690 55 264 55 250 745 988 627 033 40 989 25 649
Amount drawn down against Appropriation
715 401 56 251 650 885 25 649
Liability to Consolidated Fund 12 711 1 001 23 852 0Division of Primary Industries (Minister for Primary Industries)
5 764
Division of State and Regional Development (Minister for State Development)
0
Division of Energy Supply and Use (Minister for Energy)
18 088
The Summary of Compliance is based on the assumption that Consolidated Fund moneys are spent first (except where otherwise identified or prescribed).The Liability to Consolidated Fund represents the difference between the “Amount Drawn against Appropriation” and the “Total Expenditure / Net Claim on Consolidated Fund”.For an explanation of variances to Budget, you are referred to Note 27.
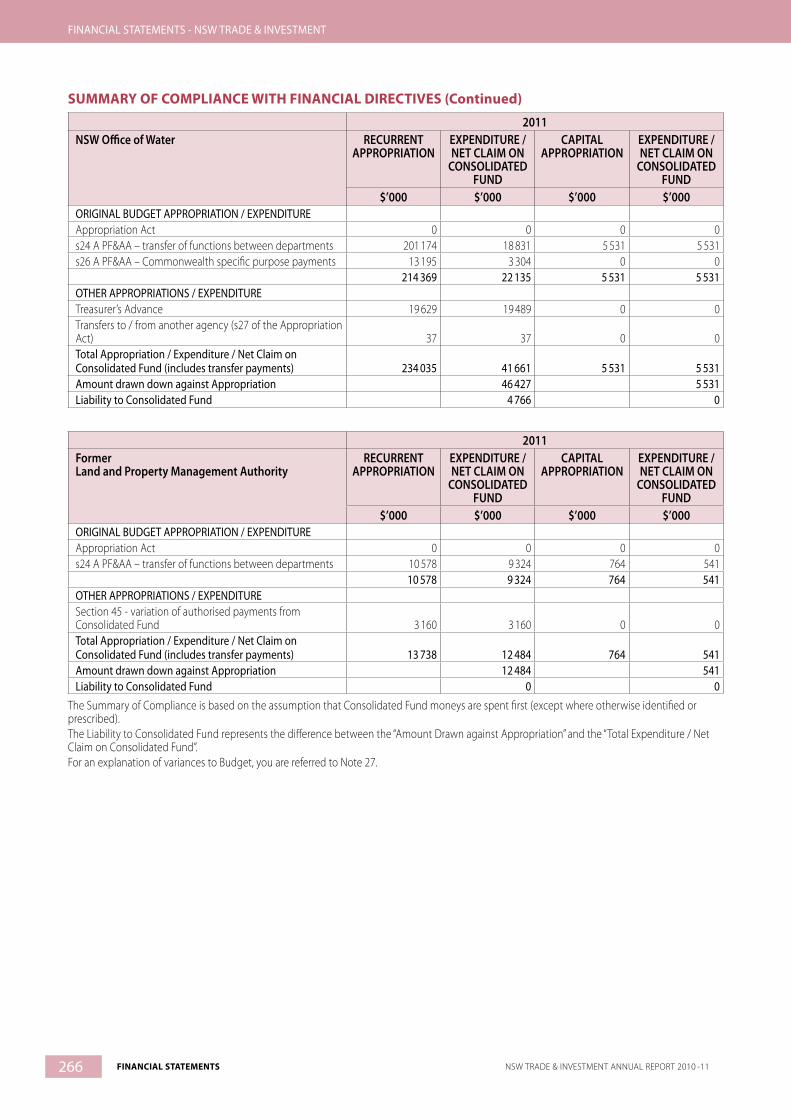
266 FINANCIAL STATEMENTS NSW TRADE & INVESTMENT ANNUAL REPORT 2010 -11
FINANCIAL STATEMENTS - NSW TRADE & INVESTMENT
SUMMARY OF COMPLIANCE WITH FINANCIAL DIRECTIVES (Continued)
2011NSW Office of Water RECURRENT
APPROPRIATIONEXPENDITURE / NET CLAIM ON
CONSOLIDATED FUND
CAPITAL APPROPRIATION
EXPENDITURE / NET CLAIM ON
CONSOLIDATED FUND
$’000 $’000 $’000 $’000ORIGINAL BUDGET APPROPRIATION / EXPENDITUREAppropriation Act 0 0 0 0s24 A PF&AA – transfer of functions between departments 201 174 18 831 5 531 5 531s26 A PF&AA – Commonwealth specific purpose payments 13 195 3 304 0 0
214 369 22 135 5 531 5 531OTHER APPROPRIATIONS / EXPENDITURETreasurer’s Advance 19 629 19 489 0 0Transfers to / from another agency (s27 of the Appropriation Act) 37 37 0 0Total Appropriation / Expenditure / Net Claim on Consolidated Fund (includes transfer payments) 234 035 41 661 5 531 5 531Amount drawn down against Appropriation 46 427 5 531Liability to Consolidated Fund 4 766 0
2011FormerLand and Property Management Authority
RECURRENT APPROPRIATION
EXPENDITURE / NET CLAIM ON
CONSOLIDATED FUND
CAPITAL APPROPRIATION
EXPENDITURE / NET CLAIM ON
CONSOLIDATED FUND
$’000 $’000 $’000 $’000ORIGINAL BUDGET APPROPRIATION / EXPENDITUREAppropriation Act 0 0 0 0s24 A PF&AA – transfer of functions between departments 10 578 9 324 764 541
10 578 9 324 764 541OTHER APPROPRIATIONS / EXPENDITURESection 45 - variation of authorised payments from Consolidated Fund 3 160 3 160 0 0Total Appropriation / Expenditure / Net Claim on Consolidated Fund (includes transfer payments) 13 738 12 484 764 541Amount drawn down against Appropriation 12 484 541Liability to Consolidated Fund 0 0
The Summary of Compliance is based on the assumption that Consolidated Fund moneys are spent first (except where otherwise identified or prescribed).The Liability to Consolidated Fund represents the difference between the “Amount Drawn against Appropriation” and the “Total Expenditure / Net Claim on Consolidated Fund”.For an explanation of variances to Budget, you are referred to Note 27.
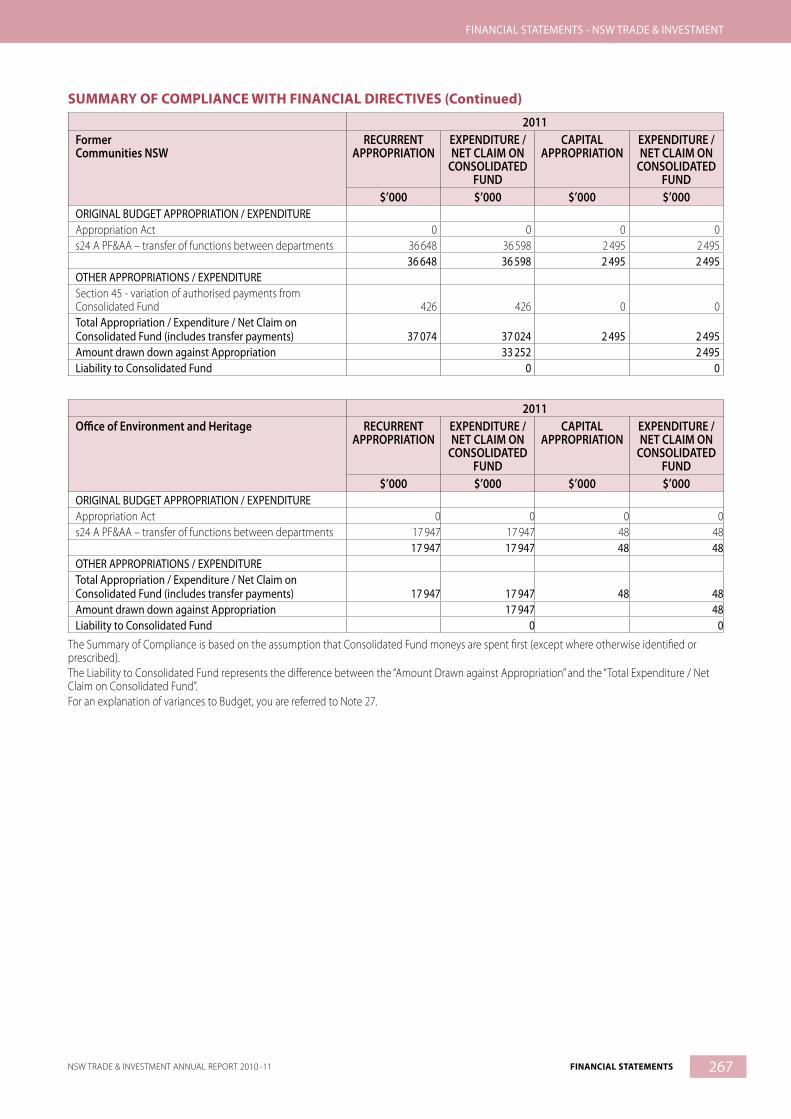
267NSW TRADE & INVESTMENT ANNUAL REPORT 2010 -11 FINANCIAL STATEMENTS
FINANCIAL STATEMENTS - NSW TRADE & INVESTMENT
SUMMARY OF COMPLIANCE WITH FINANCIAL DIRECTIVES (Continued)
2011FormerCommunities NSW
RECURRENT APPROPRIATION
EXPENDITURE / NET CLAIM ON
CONSOLIDATED FUND
CAPITAL APPROPRIATION
EXPENDITURE / NET CLAIM ON
CONSOLIDATED FUND
$’000 $’000 $’000 $’000ORIGINAL BUDGET APPROPRIATION / EXPENDITUREAppropriation Act 0 0 0 0s24 A PF&AA – transfer of functions between departments 36 648 36 598 2 495 2 495
36 648 36 598 2 495 2 495OTHER APPROPRIATIONS / EXPENDITURESection 45 - variation of authorised payments from Consolidated Fund 426 426 0 0Total Appropriation / Expenditure / Net Claim on Consolidated Fund (includes transfer payments) 37 074 37 024 2 495 2 495Amount drawn down against Appropriation 33 252 2 495Liability to Consolidated Fund 0 0
2011Office of Environment and Heritage RECURRENT
APPROPRIATIONEXPENDITURE / NET CLAIM ON
CONSOLIDATED FUND
CAPITAL APPROPRIATION
EXPENDITURE / NET CLAIM ON
CONSOLIDATED FUND
$’000 $’000 $’000 $’000ORIGINAL BUDGET APPROPRIATION / EXPENDITUREAppropriation Act 0 0 0 0s24 A PF&AA – transfer of functions between departments 17 947 17 947 48 48
17 947 17 947 48 48OTHER APPROPRIATIONS / EXPENDITURETotal Appropriation / Expenditure / Net Claim on Consolidated Fund (includes transfer payments) 17 947 17 947 48 48Amount drawn down against Appropriation 17 947 48Liability to Consolidated Fund 0 0
The Summary of Compliance is based on the assumption that Consolidated Fund moneys are spent first (except where otherwise identified or prescribed).The Liability to Consolidated Fund represents the difference between the “Amount Drawn against Appropriation” and the “Total Expenditure / Net Claim on Consolidated Fund”.For an explanation of variances to Budget, you are referred to Note 27.
268 FINANCIAL STATEMENTS NSW TRADE & INVESTMENT ANNUAL REPORT 2010 -11
FINANCIAL STATEMENTS - NSW TRADE & INVESTMENT
Notes to and forming part of the financial statements
1. SUMMARY OF SIGNIFICANT ACCOUNTING POLICIES
(a) Reporting entityDepartment of Trade and Investment, Regional Infrastructure and Services (NSW Trade & Investment) as a reporting entity comprises all the entities under its control. The entity also encompasses funds which, while containing assets that are restricted for specific uses by the grantor or donor, are nevertheless controlled by NSW Trade & Investment.
NSW Trade & Investment is a NSW Government department. NSW Trade & Investment is a not-for-profit entity (as profit is not its principal objective). The reporting entity is consolidated as part of the NSW Total State Sector Accounts.
In 2011 the following 3 orders impacting on the Department have been issued pursuant to the Public Sector Employment and Management Act 2002.
1. On 4 April 2011 as part of the Public Sector Employment and Management (Departments) Order 2011 the name of the Department of Industry and Investment (Industry and Investment) was changed to the Department of Trade and Investment, Regional Infrastructure and Services.
This order also:
• transferred certain staff and functions to NSW Trade & Investment from the former Land and Property Management Authority (LPMA) and Communities NSW.
• established the Department of Primary Industries as a Division of the Government Service. Staff and functions were transferred to this new department from the former Industry and Investment, Department of Environment Climate Change and Water (DECCW) and LPMA.
2. The Public Sector Employment and Management (Departments and Ministers) Amendment Order 2011 provided further clarification of staff and functional transfers of the administrative restructure, including the transfer of certain staff and functions from the Department of Services, Technology and Administration (DSTA) to NSW Trade & Investment, and adding to the definition of the group of staff and functions transferring to DPI. This order commenced from 4 April 2011.
3. The Public Sector Employment and Management (Miscellaneous) Order 2011, which commenced on 1 July 2011, replaced the separate DPI Division of the Government Service with a Departmental Office within NSW Trade & Investment.
Primary Industries was a part of NSW Trade & Investment (as part of Industry & Investment) up to and including 3 April 2011, and will be included in Trade & Investment as a Departmental Office from 1 July 2011 as per the Orders above. Reporting for the separate DPI Division of the Government Service from 4 April 2011 to 30 June 2011 has
also been incorporated within these financial statements and not disclosed separately.
In accordance with Treasury Circular TC11/09, the restructure of NSW Trade & Investment has been recognised from 1 April rather than 4 April for financial and reporting purposes. For more detailed financial information on restructured activities transferred refer to Administrative Restructures, Note 1(r).
NSW Trade & Investment provides Personnel Services to Forests NSW, Mine Subsidence Board, Film and Television Office, Casino, Liquor and Gaming Control Authority, Australian Museum, Museum of Applied Arts and Science, NSW Art Gallery Trust, State Library of NSW, Sydney Opera House Trust and 13 Catchment Management Authorities. The recipients of Personnel Services are separate reporting entities and not controlled by NSW Trade & Investment.
These financial statements for the year ended 30 June 2011 have been authorised for issue by the Director-General on 30 November 2011.
(b) Basis of preparationNSW Trade & Investment’s financial statements are general purpose financial statements which, subject to note 1(a), have been prepared in accordance with:
• applicable Australian Accounting Standards (which include Australian Accounting Interpretations)
• the requirements of the Public Finance and Audit Act 1983 and Regulation 2010 and
• the Financial Reporting Directions published in the Financial Reporting Code for Budget Dependent General Government Sector Agencies or issued by the Treasurer.
Property, plant and equipment, assets (or disposal groups) held for sale and financial assets at ‘fair value through profit and loss’ and available for sale are measured at fair value.
Judgements, key report assumptions and estimations management has made are disclosed in the relevant notes to the financial statements.
All amounts are rounded to the nearest one thousand dollars and are expressed in Australian currency.
(c) Statement of complianceSubject to note 1(a), and the items listed below, the financial statements and notes comply with Australian Accounting Standards, which include Australian Accounting Interpretations. Significant items are as follows:
• Peppercorn Leases currently accounted for as Operating Leases in relation to the former Communities NSW have not yet been re-assessed in line with AASB 117 and TPP11-01.
• Activities undertaken by the former LPMA to identify and recognise certain parcels of land which may be controlled via Crown Reserves have been ongoing.
269NSW TRADE & INVESTMENT ANNUAL REPORT 2010 -11 FINANCIAL STATEMENTS
FINANCIAL STATEMENTS - NSW TRADE & INVESTMENT
• The potential for impact of contamination on Crown Lands is disclosed at note 26 Contingent Liabilities.
• Work in Progress in relation to NSW Office of Water has transferred in as a result of the restructure and has not yet been adequately reviewed in respect of capitalising or expensing items disclosed in WIP.
• In some instances, costs of administration of grants programs have been disclosed in the Statement of Comprehensive Income as grant expenses rather than by their original nature.
(d) Administered activitiesNSW Trade & Investment administers, but does not control, certain activities on behalf of the Crown Entity. It is accountable for the transactions relating to those administered activities but does not have the discretion, for example, to deploy the resources resulting from these transactions for the achievement of NSW Trade & Investment’s own objectives.
Transactions and balances relating to the administered activities are not recognised as NSW Trade & Investment’s revenues, expenses, assets, and liabilities but are disclosed in the accompanying schedules as “Administered Revenues”, “Administered Expenses”, “Administered Assets” and “Administered Liabilities”.
Included in Administered revenue are any fines, royalties, regulatory fees and contributions collected by the Department on behalf of the Crown.
The accrual basis of accounting and all applicable accounting standards have been adopted for the reporting of the administered activities.
(e) Borrowing costsBorrowing costs are recognised as expenses in the period in which they are incurred, in accordance with Treasury’s Mandate to not-for-profit general government sector agencies.
(f) InsuranceNSW Trade & Investment’s insurance activities are conducted through the NSW Treasury Managed Fund Scheme of self insurance for Government agencies. The expense (premium) is determined by the Fund Manager based on past claim experience.
(g) Accounting for interests in joint ventures The Department’s investment in jointly controlled entities is accounted for using the equity method. Under this method, the Department’s share of the joint venture’s accumulated results is recognised as revenue or expense in the statement of comprehensive income and the share of movements in reserves is recognised in the Department’s reserves. Contributions made by the Department to the joint ventures are charged directly to the investment.
In respect of its interest in jointly controlled assets, the Department recognises in its financial statements: its share of the jointly controlled assets, classified according to the nature of the assets; any liabilities that it has incurred; any
expenses incurred by the joint venture, and any expenses that it has incurred in respect of its interest in the joint ventures.
The Department assesses impairment of its assets attributed to interests in joint ventures on an annual basis.
(h) Accounting for the Goods and Services Tax (GST)Income, expenses and assets are recognised net of the amount of GST, except that:
• the amount of GST incurred by NSW Trade & Investment as a purchaser that is not recoverable from the Australian Taxation Office is recognised as part of the cost of acquisition of an asset or as part of an item of expense and
• receivables and payables are stated with the amount of GST included.
Cash flows are included in the statement of cash flows on a gross basis. However, the GST components of cash flows arising from investing and financing activities which is recoverable from, or payable to, the Australian Tax Office are classified as operating cash flows.
(i) Income recognitionIncome is measured at the fair value of the consideration or contribution received or receivable. Additional comments regarding the accounting policies for the recognition of income are discussed below.(i) Parliamentary Appropriations and Contributions
Except as specified below, parliamentary appropriations and contributions from other bodies (including grants and donations) are generally recognised as income when NSW Trade & Investment obtains control over the assets comprising the appropriations / contributions. Control over appropriations and contributions are normally obtained upon the receipt of cash. Appropriations are not recognised as income in the following circumstances:
• ‘Equity appropriations’ to fund payments to adjust a for-profit entity’s capital structure are recognised as equity injections (i.e. contribution by owners) on receipt and equity withdrawals on payment to a for-profit entity. The reconciliation between the statement of comprehensive income, statement of summary of compliance with financial directives and the total appropriation is disclosed in Note 7.
• Unspent appropriations are recognised as liabilities rather than income, as the authority to spend the money lapses and the unspent amount must be repaid to the Consolidated Fund.
The liability is disclosed in Note 24 as part of “Current Liabilities – Other”. The amount will be repaid and the liability will be extinguished next financial year. Any liability in respect of transfer payments is disclosed in Note 31 “Administered Assets and Liabilities”.(ii) Sale of Goods
Revenue from the sale of goods is recognised as revenue when NSW Trade & Investment transfers the significant risks

270 FINANCIAL STATEMENTS NSW TRADE & INVESTMENT ANNUAL REPORT 2010 -11
FINANCIAL STATEMENTS - NSW TRADE & INVESTMENT
and rewards of ownership of the assets.(iii) Rendering of Services
Revenue is recognised when the service is provided or by reference to the stage of completion (based on labour hours incurred to date).(iv) Personnel services revenue
Reimbursement of employee benefits and related on-costs for the entities that the Department supplies personnel services is recognised as revenue.(v) Investment Revenue
Interest revenue is recognised using the effective interest method as set out in AASB 139 Financial Instruments: Recognition and Measurement. Rental revenue is recognised in accordance with AASB 117 Leases on a straight-line basis over the lease term. Royalty revenue is recognised in accordance with AASB 118 Revenue on an accrual basis in accordance with the substance of the relevant agreement.
Dividend revenue is recognised in accordance with AASB 118 when NSW Trade & Investment’s right to receive payment is established.(vi) Sale of Land
From the date of the administrative restructure implemented under the Public Sector Employment and Management (Departments) Order 2011 NSW Trade & Investment has undertaken activities associated with the acquisition, management and divestiture of land that were previously undertaken by the former LPMA.
(a) Sale of land
Revenue from the sale of developed and undeveloped land is recognised on settlement when NSW Trade & Investment transfers the significant risks and rewards of ownership of the assets. A 10% deposit of the sale price is normally paid on the date of exchange of contract and is recognised as a liability until the settlement of the sale.(b) Sale of surplus land controlled by other government agencies
NSW Trade & Investment acts as an agent for other government agencies in regard to the sale of surplus Crown land. After deducting NSW Trade & Investment’s selling expenses, the proceeds from the sale are remitted to the selling government agency, which is responsible for transferring any Crown share of proceeds to the Consolidated Fund. These proceeds are therefore not recognised as revenue in these financial statements.(c) Land declared to be Crown land
Land declared to be Crown or returned to Crown is recognised at fair value upon publication of the notice in the NSW Government Gazette.(d) Land acquisition sales
Revenue from land acquisition sales, for Crown land acquired by other government agencies and local governments, is recognised upon the publication of the acquisition notice in the NSW Government Gazette.(e) Cost of sales
The cost of sales includes the cost of land for land sales
and development costs incurred in bringing the land to the ‘developed land’ stage.
(j) Assets(i) Acquisition of assets
The cost method of accounting is used for the initial recording of all acquisitions of assets controlled by NSW Trade & Investment. Cost is the amount of cash or cash equivalents paid or the fair value of the other consideration given to acquire the asset at the time of its acquisition or construction or, where applicable, the amount attributed to that asset when initially recognised in accordance with the specific requirements of other Australian Accounting Standards.
Assets acquired at no cost, or for nominal consideration, are initially recognised at their fair value at the date of acquisition (see also assets transferred as a result of an equity transfer – Note 1(n).
Fair value is the amount for which an asset could be exchanged between knowledgeable, willing parties in an arms length transaction.
Where payment for an asset is deferred beyond normal credit terms, its cost is the cash price equivalent, i.e. the deferred payment amount is effectively discounted at an asset-specific rate.(ii) Land assets
NSW Trade & Investment has three broad categories of land which are reported as assets:
(a) Crown land under tenure
Crown land under tenure represents all parcels of Crown land which have a lease, license, permissive occupancy or enclosure permit in place.(b) Untenured Crown land
Untenured Crown land includes all parcels of Crown land, except for those with tenure arrangements in place or Crown reserves under management by reserve trusts. Untenured Crown land includes Crown reserves for which no formal trust has been established, unoccupied Crown land, certain Crown roads, land granted under Aboriginal land claims awaiting transfer, waterways and New South Wales land on the continental shelf within the three nautical mile zone.(c) Department Land
These are parcels of land where NSW Trade & Investment buildings are situated, research stations and any other land held for the Department’s own activities. These lands form part of the other land and buildings asset category.
(iii) Capitalisation thresholds
Property, plant and equipment and intangible assets costing $5000 and above individually (or forming part of a network costing more than $5,000) are capitalised.(iv) Revaluation of property, plant and equipment
Physical non-current assets are valued in accordance with the “Valuation of Physical Non-Current Assets at Fair Value” Policy and Guidelines Paper (TPP 07-1). This policy adopts fair value in accordance with AASB 116 Property, Plant and

271NSW TRADE & INVESTMENT ANNUAL REPORT 2010 -11 FINANCIAL STATEMENTS
FINANCIAL STATEMENTS - NSW TRADE & INVESTMENT
Equipment.
Property, plant and equipment is measured on an existing use basis, where there are no feasible alternative uses in the existing natural, legal, financial and socio-political environment. However, in the limited circumstances where there are feasible alternative uses, assets are valued at their highest and best use.
Fair value of property, plant and equipment is determined based on the best available market evidence, including current market selling prices for the same or similar assets. Where there is no available market evidence, the asset’s fair value is measured at its market buying price, the best indicator of which is depreciated replacement cost.
NSW Trade & Investment re-values each class of property, plant and equipment at least every five years or with sufficient regularity to ensure that the carrying amount of each asset in the class does not differ materially from its fair value at reporting date.
The last revaluation was completed by the former departments as follows:
Industry and Investment 2009
Communities NSW 2009
DECCW – land 2010
DECCW – buildings / infrastructure 2006
DECCW – River Murray Operations joint venture 2010
LPMA – land (other than Crown land) 2010
Revaluations were based on an independent assessment.
The methods of revaluing the Crown land assets utilises mass valuation techniques for the two broad categories of Crown land as follows:
(a) Land under tenure
NSW Trade & Investment’s interest in land under tenure is limited by the existence of agreements, which in many cases will deny NSW Trade & Investment occupancy of the land for many years or even in perpetuity. NSW Trade & Investment’s interest in these tenures is generally limited to the right to receive the income stream from the rentals combined with (in the case of term leases) the present value of the market value of the land deferred for the lease term. Land held as finance leases are not included in this category.
Consequently, the basis of valuation is capitalisation of the income stream from the different classifications of land within each local government area (LGA), appropriately taking into account the conditions attached to the leases.
In 2011, individual capitalisation rates were determined by the valuers for different types of tenure arrangements within different LGAs. These were in the range of 3% to 12% and applied to the income stream to determine the land values.
The only exception to this relates to Crown land under enclosure permit, which is valued on the same basis as untenured Crown land.
(b) Untenured Crown land
The determination of global rates per hectare for a variety of land classifications for each LGA has been considered the most appropriate approach to determine a value for untenured Crown land. This methodology has the advantage of being a practical way to cost effectively arrive at a market-based value for Crown land where NSW Trade & Investment holds full interest.
During 2011 the revaluation methodology was enhanced through the application of individual valuations for high value parcels, with the remaining lands being subject to mass valuation. 1,721 Crown reserves included within the Crown land assets were valued on an individual basis.
For the mass valuations in 2011, a valuation rate per hectare was provided for each land category type, within each LGA. The land was valued at the highest and best use taking into account zoning and other restrictions, access to services, infrastructure and property market demand. These value elements were considered in a global way when formulating a level to apply to the particular land category. The rates per hectare for each land category were determined following a consideration of sales of comparable land in the locality. Where significantly different classes of land were identified within a category, these were accounted for in compiling the overall rate per hectare for the land category.
NSW Trade & Investment has recognised land under roads at a value per hectare rate based on the value of adjoining land. As per Treasury Circular 10/07 Land Under Roads, where an agency previously recognised and is continuing to recognise land under roads, the same valuation methodology used in 2007/08 must be applied to all land under roads, until otherwise advised. NSW Trade & Investment has elected to continue to recognise land under roads under the same valuation methodology used in 2007/08.
Non-specialised assets with short useful lives are measured at depreciated historical cost, as a surrogate for fair value.
When revaluing non-current assets by reference to current prices for assets newer than those being re-valued (adjusted to reflect the present condition of the assets), the gross amount and the related accumulated depreciation are separately restated.
For other assets, any balances of accumulated depreciation at the revaluation date in respect of those assets are credited to the asset accounts to which they relate. The net asset accounts are then increased or decreased by the revaluation increments or decrements.
Revaluation increments are credited directly to the asset revaluation reserve, except that, to the extent that an increment reverses a revaluation decrement in respect of that class of asset previously recognised as an expense in the surplus / deficit, the increment is recognised immediately as revenue in the surplus / deficit.
Revaluation decrements are recognised immediately as expenses in the surplus / deficit, except that, to the extent

272 FINANCIAL STATEMENTS NSW TRADE & INVESTMENT ANNUAL REPORT 2010 -11
FINANCIAL STATEMENTS - NSW TRADE & INVESTMENT
that a credit balance exists in the asset revaluation reserve in respect of the same class of assets, they are debited directly to the asset revaluation reserve.
As a not-for-profit entity, revaluation increments and decrements are offset against one another within a class of non-current assets, but not otherwise.
Where an asset that has previously been revalued is disposed of, any balance remaining in the asset revaluation reserve in respect of that asset is transferred to accumulated funds.(v) Impairment of property, plant and equipment
As a not-for-profit entity with no cash generating units, NSW Trade & Investment is effectively exempted from AASB 136 Impairment of Assets and impairment testing. This is because AASB 136 modifies the recoverable amount test to the higher of fair value less costs to sell and depreciated replacement cost. This means that, for an asset already measured at fair value, impairment can only arise if selling costs are material. Selling costs are regarded as immaterial.(vi) Assets not able to be reliably measured
NSW Trade & Investment holds certain assets that have not been recognised in the Statement of Financial Position because NSW Trade & Investment is unable to measure reliably the value for the assets:
(a) Rare collections and specimens
These assets include the insect and mite collection, the plant pathology herbarium, the domestic animal pathology collection and a collection of mineral core specimens obtained through drilling over a considerable period of time. The maintenance and preservation of these collections is estimated to cost $0.357m for 2011 (2010: $0.406m).(b) Cultural artefacts and historic infrastructure
Additionally the Department’s assets include a range of cultural artefacts and historic infrastructure transferred from the former DECCW.(c) Crown land estate
NSW Trade & Investment also holds assets within the Crown land estate, which have been managed as public assets for many years and include Crown reserve land, buildings and other infrastructure.
These assets are not presently included within NSW Trade & Investment asset values, due to uncertainty over who controls them from an accounting standard perspective, or because NSW Trade & Investment is unable to reliably measure the value of the assets. The management of these Crown land assets is carried out in a variety of ways, including through other government agencies, statutory bodies, local councils, community reserve trusts, and trust administrators. Due to this variety of management regimes, the question of accounting control is still to be resolved. Many of these assets are already subject to reporting outside of NSW Trade & Investment’s financial statements, but not within the total state sector accounts.
Following previous audit qualification, a study has commenced to determine the questions over appropriate
accounting control and reporting entity requirements. It is anticipated that the outcome of this study will be factored into reporting for 2012.
During 2011 NSW Trade & Investment completed a multi year project in order to address the issue of reliable measurement of Crown reserve land. To separately identify the Crown reserves, the project formally identified approximately 86,500 parcels of land and converted them to the state’s Integrated Titling System. These parcels form approximately 39,000 Crown reserves across NSW. 7,354 of these Crown reserves have been individually valued and 5,633 are presently not included within the asset values. It is currently estimated that the total value of Crown reserve land on which the question of control is yet to be determined and therefore not currently recognised by NSW Trade & Investment, is between $3 billion and $4 billion. However, the total value may be outside of this range, depending on the determination of control and valuation outcomes.
Buildings and infrastructure assets that are located on Crown land are not presently included within NSW Trade & Investment asset values. The reasons for this include the overall question of control and measurement. In a number of situations, NSW government funds might not have been provided to build the assets, with funding instead coming from local councils, community programs, or businesses. If a reserve trust was dissolved, any built assets on the land would return to the Crown land estate. However, a reserve trust may also organise for the removal of the built assets prior to dissolution. As a result, there is currently no certainty over the control of assets that are being managed by external parties.
As part of the project to measure the value of Crown reserve land, indicative valuation ranges were collected for buildings and infrastructure on Crown reserves. At 30 June 2011, approximately 82% of the higher valued parcels of land had been assessed for an indication of asset values. Based on the preliminary assessment, it is currently estimated that the total value of buildings and infrastructure on Crown reserves would be in the range of $4 billion to $5.5 billion. However, the figure could be outside this range and may not all be attributable to assets controlled by NSW Trade & Investment.
(vii) Depreciation of property, plant and equipment
Except for certain heritage assets, depreciation is provided for on a straight-line basis for all depreciable assets so as to write off the depreciable amount of each asset as it is consumed over its useful life to NSW Trade & Investment.
All material separately identifiable components of assets are depreciated over their shorter useful lives.
Land is not a depreciable asset.
Certain heritage assets including original artworks and collections and heritage buildings may not have a limited useful life because appropriate curatorial and preservation policies are adopted. Such assets are not subject to depreciation. The decision not to recognise depreciation for these assets is reviewed annually.

273NSW TRADE & INVESTMENT ANNUAL REPORT 2010 -11 FINANCIAL STATEMENTS
FINANCIAL STATEMENTS - NSW TRADE & INVESTMENT
The depreciation of buildings and infrastructure is calculated on a straight line basis. Due to the nature and location of its activities, a maximum useful life of 40 years is appropriate for use for Assets from the former Industry and Investment. For practical purposes and a basis of accounting treatment, useful life is expressed in 10 year increments, up to the maximum of 40 years. For Assets transferred from the former LMPA normal life expectancies of 40 years for buildings and 50 years for Infrastructure systems have been used. Buildings and Leased Assets (Buildings) transferred from the former Communities NSW and buildings and improvements from the former DECCW have assessed useful lives of 40 – 100 years. Infrastructure transferred from the former DECCW was depreciated over up to 20 years.
Equipment and vehicles are depreciated on a straight line basis over the remaining life to scrap value (where applicable) so as to write off the depreciable amount of each asset as it is consumed over its useful life to the entity. Each class of asset has a default life which may be varied as a result of management review either at acquisition or at any time during the asset life.
Default asset class lives are:
Plant and equipment 2 - 20 years
Marine Craft and equipment 3 - 10 years
Vehicles and trailers 5 - 10 years
Furniture and fittings 10 years
Leasehold improvements Period of lease
Fully depreciated assets have a cost of $3.187 million. (viii) Major Inspection Costs
When each major inspection is performed, the labour cost of performing major inspections for faults is recognised in the carrying amount of an asset as a replacement of a part, if the recognition criteria are satisfied.(ix) Restoration costs
The estimated cost of dismantling and removing an asset and restoring the site is included in the cost of an asset, to the extent it is recognised as a liability.(x) Maintenance
Day-to-day servicing costs or maintenance are charged as expenses as incurred, except where they relate to the replacement of a part or component of an asset, in which case the costs are capitalised and depreciated.(xi) Leased assets
A distinction is made between finance leases which effectively transfer from the lessor to the lessee substantially all the risks and benefits incidental to ownership of the leased assets, and operating leases under which the lessor effectively retains all such risks and benefits.
Where a non-current asset is acquired by means of a finance lease, the asset is recognised at its fair value at the commencement of the lease term. The corresponding liability is established at the same amount. Lease payments
are allocated between the principal component and the interest expense.
Operating Lease payments are charged to the Statement of Comprehensive Income in the periods in which they are incurred. Commitment values for leases are outlined in Note 25(c).(xii) Intangible assets
NSW Trade & Investment recognises intangible assets only if it is probable that future economic benefits will flow to NSW Trade & Investment and the cost of the asset can be measured reliably. Intangible assets are measured initially at cost. Where an asset is acquired at no or nominal cost, the cost is its fair value as at the date of acquisition.
Acquired computer software licences are capitalised on the basis of the costs incurred to acquire and bring to use the specific software. These costs are amortised over their estimated useful lives.
Internally developed software costs that are directly associated with the production of identifiable and unique software products controlled by NSW Trade & Investment and that will probably generate economic benefits exceeding costs beyond one year, are recognised as intangible assets. Direct costs include software development employee costs and an appropriate portion of relevant overheads. Costs associated with maintaining computer software are recognised as an expense as incurred.
All research costs are expensed. Development costs are only capitalised when certain criteria are met.
The useful lives of intangible assets are assessed to be finite.
Intangible assets are subsequently measured at fair value only if there is an active market. As there is no active market for NSW Trade & Investment’s intangible software assets, the assets are carried at cost less any accumulated amortisation.
NSW Trade & Investment intangible assets are amortised using the straight line method over a period of 3 - 10 years.
Water licences have been valued at cost where there is no active market.
Intangible assets are tested for impairment where an indicator of impairment exists. If the recoverable amount is less than its carrying amount the carrying amount is reduced to recoverable amount and the reduction is recognised as an impairment loss.(xiii) Loans and receivables
Loans and receivables are non-derivative financial assets with fixed or determinable payments that are not quoted in an active market. These financial assets are recognised initially at fair value, usually based on the transaction cost or face value. Subsequent measurement is at amortised cost using the effective interest method, less an allowance for any impairment of receivables. Any changes are recognised in the surplus / (deficit) for the year when impaired, derecognised or through the amortisation process.
Short-term receivables with no stated interest rate are measured at the original invoice amount where the effect

274 FINANCIAL STATEMENTS NSW TRADE & INVESTMENT ANNUAL REPORT 2010 -11
FINANCIAL STATEMENTS - NSW TRADE & INVESTMENT
of discounting is immaterial.(xiv) Inventories
Inventories held for distribution are stated at cost, adjusted when applicable, for any loss of service potential. A loss of service potential is identified and measured based on the existence of a current replacement cost that is lower than the carrying amount. Inventories (other than those held for distribution) are stated at the lower of cost and net realisable value. Cost is calculated using the weighted average cost or “first in first out” method.”
The cost of inventories acquired at no cost or for nominal consideration is the current replacement cost as at the date of acquisition. Current replacement cost is the cost NSW Trade & Investment would incur to acquire the asset. Net realisable value is the estimated selling price in the ordinary course of business less the estimated costs of completion and the estimated costs necessary to make the sale.
Land development inventories (refer note 12) include land development projects at different stages of completion and comprise developed land for sale, works in progress (land under development) and undeveloped land. Registered valuers are engaged in determining the net realisable value of property where there is an indication that the net realisable value may have fallen below cost. All direct development expenditures and appropriate development overheads are charged to the relevant projects. Developed land is land which has been subdivided and registered on completion of all development activity. Land for sale as developed land is recognised initially as inventory at the time the decision is made to develop the land. The value of the land is measured at fair value on acquisition as determined by registered valuers. Work in progress (land under development) represents land that has been subdivided into precincts and where development activity relating to the precinct has commenced. Current developed land and work in progress is expected to be sold within the next twelve months. Undeveloped land consists of land holdings where no development has taken place and land holdings where estate major work activity has been undertaken. It excludes precincts on which development activity has commenced. Undeveloped land is classified as a non-current asset. (xv) Investments
Investments are initially recognised at fair value plus, in the case of investments not at fair value through profit or loss, transaction costs. NSW Trade & Investment determines the classification of its financial assets after initial recognition and, when allowed and appropriate, re-evaluates this at each financial year end.
• Fair value through profit or loss – NSW Trade & Investment subsequently measures investments classified as “held for trading” or designated “at fair value through profit or loss” at fair value. Financial assets are classified as “held for trading” if they are acquired for the purpose of selling in the near term. Derivatives are also classified as held for trading. Gains or losses on these assets are recognised in the surplus / (deficit) for the year.
• Held to maturity investments – Non-derivative financial assets with fixed or determinable payments and fixed maturity that NSW Trade & Investment has the positive intention and ability to hold to maturity are classified as “held-to-maturity”. These investments are measured at amortised cost using the effective interest method. Changes are recognised in the surplus / (deficit) for the year when impaired, derecognised or though the amortisation process.
• Available for sale investments - Any residual investments that do not fall into any other category are accounted for as available-for-sale investments and measured at fair value in other comprehensive income until disposed or impaired, at which time the cumulative gain or loss previously recognised in other comprehensive income is recognised in the surplus / (deficit) for the year. However, interest calculated using the effective interest method and dividends are recognised in the surplus / (deficit) for the year.
Purchases or sales of investments under contract that require delivery of the asset within the timeframe established by convention or regulation are recognised on the trade date i.e. the date the entity commits itself to purchase or sell the asset.
The fair value of investments that are traded at fair value in an active market is determined by reference to quoted current bid prices at the close of business on the statement of financial position date. (xvi) Impairment of financial assets
All financial assets, except those measured at fair value through profit and loss, are subject to an annual review for impairment. An allowance for impairment is established when there is objective evidence that the entity will not be able to collect all amounts due.
For financial assets carried at amortised cost, the amount of the allowance is the difference between the asset’s carrying amount and the present value of estimated future cash flows, discounted at the effective interest rate. The amount of the impairment loss is recognised in the surplus / (deficit) for the year.
When an available for sale financial asset is impaired, the amount of the cumulative loss is removed from equity and recognised in the surplus / (deficit) for the year, based on the difference between the acquisition cost (net of any principal repayment and amortisation) and current fair value, less any impairment loss previously recognised in the surplus / (deficit) for the year.
Any reversals of impairment losses are reversed through the surplus / (deficit) for the year, where there is objective evidence, except reversals of impairment losses on an investment in an equity instrument classified as “available for sale” must be made through the reserve. Reversals of impairment losses of financial assets carried at amortised cost cannot result in a carrying amount that exceeds what the carrying amount would have been had there not been an impairment loss.

275NSW TRADE & INVESTMENT ANNUAL REPORT 2010 -11 FINANCIAL STATEMENTS
FINANCIAL STATEMENTS - NSW TRADE & INVESTMENT
(xvii) De-recognition of financial assets and financial liabilities
A financial asset is derecognised when the contractual rights to the cash flows from the financial assets expire; or if NSW Trade & Investment transfers the financial asset:
• where substantially all the risks and rewards have been transferred; or
• where NSW Trade & Investment has not transferred substantially all the risks and rewards, if the entity has not retained control.
Where NSW Trade & Investment has neither transferred nor retained substantially all the risks and rewards or transferred control, the asset is recognised to the extent of NSW Trade & Investment’s continuing involvement in the asset.
A financial liability is derecognised when the obligation specified in the contract is discharged or cancelled or expires.(xviii) Assets (or disposal groups) held for sale
NSW Trade & Investment has certain non-current assets (or disposal groups) classified as held for sale, where their carrying amount will be recovered principally through a sale transaction, not through continuing use. Non-current assets (or disposal groups) held for sale is recognised at the lower of carrying amount and fair value less costs to sell. These assets are not depreciated while they are classified as held for sale. Refer note 18.(xix) Trust funds
NSW Trade & Investment receives monies in a trustee capacity for various trusts as set out in Notes 29 and 30 and security deposits held in trust in relation to Crown land tenures.
As NSW Trade & Investment performs only a custodial role in respect of these monies, and because the monies can not be used for the achievement of the NSW Trade & Investment’s own objectives, these funds are separately disclosed in the financial statements.(xx) Other financial assets
The Public Reserves Management Fund (PRMF) provides low interest loans to Crown land reserves with terms ranging from five years to 20 years. These loans are non-derivative financial assets with fixed or determinable payments that are not quoted in an active market. They are initially recognised at fair value and amortised cost thereafter in accordance with AASB 139. The fair value of the long term loans are estimated as the present value of all future cash receipts, discounted using the NSW TCorp Government bond rate at the commencement date of the loans, for the relevant term of the loans. Any changes are accounted for in the surplus / (deficit) for the year when impaired, derecognised or through the amortisation process.(xxi) Other assets
Other assets are recognised on a cost basis.(xxii) Restricted assets
Legislation or Treasurer’s Directions impose restrictions on the use of certain assets of NSW Trade & Investment.
NSW Trade & Investment administers the PRMF which provides funds for the development, maintenance and protection of Crown land reserves throughout NSW. Crown land reserves are generally managed by reserve trusts which are incorporated bodies administered by local government councils, volunteer boards or other responsible organisations. The PRMF was established by the Public Reserves Management Fund Act 1987. Refer Note 20.
(k) Liabilities(i) Payables
These amounts represent liabilities for goods and services provided to NSW Trade & Investment and other amounts. Payables are recognised initially at fair value, usually based on the transaction cost or face value. Subsequent measurement is at amortised cost using the effective interest method. Short-term payables with no stated interest rate are measured at the original invoice amount where the effect of discounting is immaterial.(ii) Borrowings
Loans are not held for trading or designated at fair value through profit or loss and are recognised at amortised cost using the effective interest method. Gains or losses are recognised in the surplus / (deficit) for the year on derecognition.
Finance lease liabilities are determined in accordance with AASB 117 Leases.(iii) Financial Guarantees
A financial guarantee contract is a contract that requires the issuer to make specified payments to reimburse the holder for a loss it incurs because a specified debtor fails to make payment when due in accordance with the original or modified terms of a debt instrument.
Financial guarantee contracts are recognised as a liability at the time the guarantee is issued and initially measured at fair value, where material. After initial recognition, the liability is measured at the higher of the amount determined in accordance with AASB 137 Provisions, Contingent Liabilities and Contingent Assets and the amount initially recognised, less accumulated amortisation, where appropriate.
NSW Trade & Investment has reviewed its financial guarantees and determined that there is no material liability to be recognised for financial guarantee contracts at 30 June 2011 and 30 June 2010. However, refer Note 26 regarding disclosures on contingent liabilities.(iv) Employee benefits and other provision
(a) Salaries and wages, annual leave, sick leave and on-costs
Liabilities for salaries and wages (including non-monetary benefits) and all annual leave which is reported in the accounts as falling due wholly within 12 months of the reporting date are recognised and measured in respect of employees’ services up to the reporting date at undiscounted amounts based on the amounts expected to be paid when the liabilities are settled.

276 FINANCIAL STATEMENTS NSW TRADE & INVESTMENT ANNUAL REPORT 2010 -11
FINANCIAL STATEMENTS - NSW TRADE & INVESTMENT
Unused non-vesting sick leave does not give rise to a liability as it is not considered probable that sick leave taken in the future will be greater than the benefits accrued in the future.
The outstanding amounts of payroll tax, workers’ compensation insurance premiums and fringe benefits tax, which are consequential to employment, are recognised as liabilities and expenses where the employee benefits to which they relate have been recognised.(b) Long Service Leave and Superannuation
NSW Trade & Investment’s liabilities (apart from the commercial and semi-commercial activities) for long service leave and defined benefit superannuation are assumed by the Crown Entity. NSW Trade & Investment accounts for the liability as having been extinguished, resulting in the amount assumed being shown as part of the non-monetary revenue item described as “Acceptance by the Crown Entity of employee benefits and other liabilities”.
NSW Trade & Investment’s semi-commercial activity is a member of the Non-Budget Long Service Leave (LSL) Pool. NSW Trade & Investment makes long service leave liability contributions to the NSW Treasury Special Deposits Account. This contribution discharges its liability for long service leave and is expensed as incurred. NSW Trade & Investment is reimbursed by the NSW Treasury for long service leave payments made. NSW Trade & Investment’s long service leave liability and equivalent asset are recognised in the statement of financial position as the reimbursement from the Non-Budget LSL Pool is ‘virtually certain’.
Long service leave is measured at present value in accordance with AASB 119 Employee Benefits. This is based on the application of certain factors (specified in NSWTC 09/04) to employees with five or more years of service, using current rates of pay. These factors were determined based on an actuarial review to approximate present value.
NSW Trade & Investment’s commercial activities’ liability for long service is measured at present value in accordance with AASB 119. The present value is based on the application of the valuation ratio at the Commonwealth government bond rate at the reporting date to employees with five or more years of service, using expected future rates of pay. This ratio is determined based on a periodical actuarial review to approximate present value. The actuarial review was conducted in January 2009 and is applicable to years 2009 through to 2012.
Where NSW Trade & Investment does not have the unconditional right to defer settlement beyond 12 months, the liability is recognised as a current liability.
The superannuation expense for NSW Trade & Investment’s budget dependent section for the financial year is determined by using formulae specified
in the Treasurer’s Circular. The expense for certain superannuation schemes (i.e. Basic benefit and First State Super) is calculated as a percentage of the employees’ salary. For other superannuation schemes (i.e. State Superannuation Scheme and State Authorities Superannuation Scheme), the expense is calculated as a multiple of the employees’ superannuation contribution.
NSW Trade & Investment’s commercial and semi-commercial activities are responsible for employee superannuation entitlements under defined contribution plans and defined benefits plans. Contributions to defined contribution superannuation plans are expensed when incurred. For defined benefit plans, the actuarial valuations are carried out at each reporting date by Pillar Administration using the projected unit credit method. Actuarial unit credit method Actuarial gains and losses are recognised directly in equity in the period in which they occur, as per NSW Treasury’s mandate. The defined benefit obligation recognised in the statement of financial position represents the present value of the defined benefit obligation, adjusted for unrecognised past service costs, net of the fair value of the plan assets.
(v) Other Provisions
Other provisions exist when NSW Trade & Investment has a present legal or constructive obligation as a result of a past event; it is probable that an outflow of resources will be required to settle the obligation; and a reliable estimate can be made of the obligation.
Any provision for restructuring is recognised only when an agency has a detailed formal plan and the agency has raised a valid expectation in those affected by the restructuring that it will carry out the restructuring by starting to implement the plan or announcing its main features to those affected.
If the effect of the time value of money is material, provisions are discounted at an appropriate percentage, which is a pre-tax rate that reflects the current market assessments of the time value of money and the risks specific to the liability.
(a) Aboriginal Land Rights Act 1983
NSW Trade & Investment has provided for the liability of land claims which have been granted to Local Aboriginal Land Councils under the Aboriginal Land Rights Act 1983 as at 30 June 2011, but not yet transferred. The amount, representing the fair value of land granted based on estimated size of the land, is expensed when granted. Until the land is surveyed, the precise area to be transferred is unknown.
These parcels of land remain under the care, control and management of the Crown pending formal land boundary surveys being undertaken so that freehold title can be prepared. Once this action occurs, freehold title can be issued to the respective Local Aboriginal Land Councils and the value transferred from the provision.
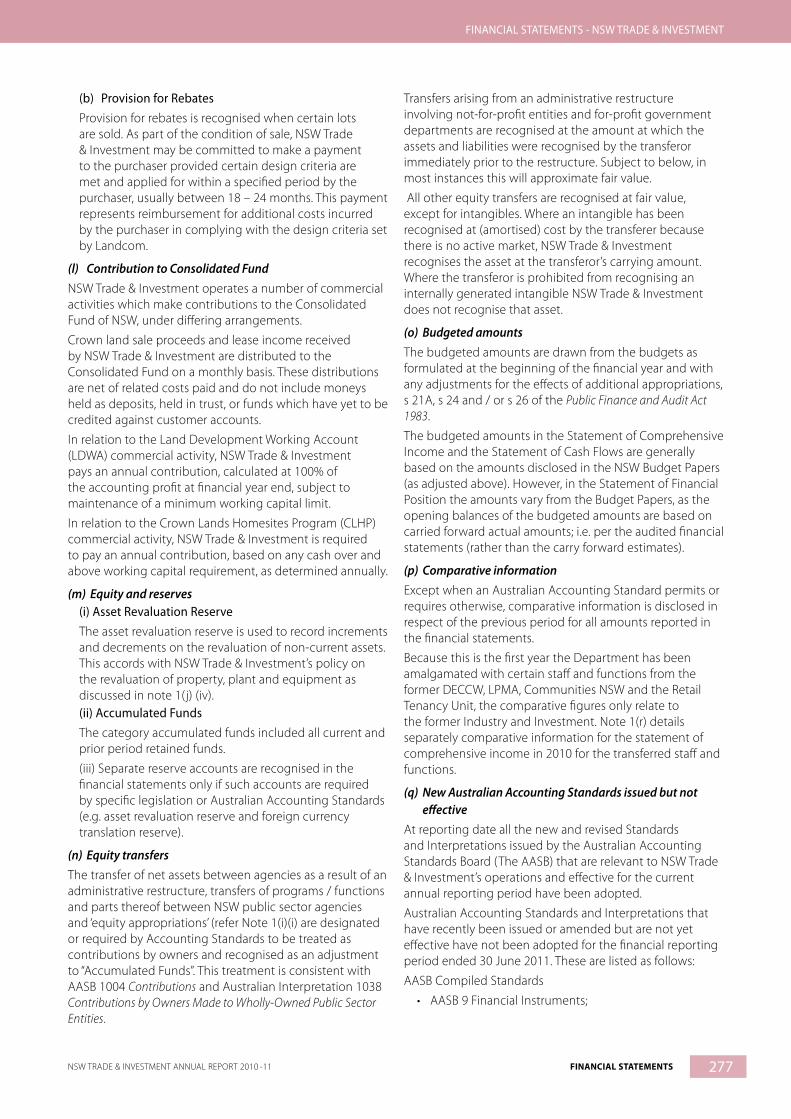
277NSW TRADE & INVESTMENT ANNUAL REPORT 2010 -11 FINANCIAL STATEMENTS
FINANCIAL STATEMENTS - NSW TRADE & INVESTMENT
(b) Provision for Rebates
Provision for rebates is recognised when certain lots are sold. As part of the condition of sale, NSW Trade & Investment may be committed to make a payment to the purchaser provided certain design criteria are met and applied for within a specified period by the purchaser, usually between 18 – 24 months. This payment represents reimbursement for additional costs incurred by the purchaser in complying with the design criteria set by Landcom.
(l) Contribution to Consolidated FundNSW Trade & Investment operates a number of commercial activities which make contributions to the Consolidated Fund of NSW, under differing arrangements.
Crown land sale proceeds and lease income received by NSW Trade & Investment are distributed to the Consolidated Fund on a monthly basis. These distributions are net of related costs paid and do not include moneys held as deposits, held in trust, or funds which have yet to be credited against customer accounts.
In relation to the Land Development Working Account (LDWA) commercial activity, NSW Trade & Investment pays an annual contribution, calculated at 100% of the accounting profit at financial year end, subject to maintenance of a minimum working capital limit.
In relation to the Crown Lands Homesites Program (CLHP) commercial activity, NSW Trade & Investment is required to pay an annual contribution, based on any cash over and above working capital requirement, as determined annually.
(m) Equity and reserves(i) Asset Revaluation Reserve
The asset revaluation reserve is used to record increments and decrements on the revaluation of non-current assets. This accords with NSW Trade & Investment’s policy on the revaluation of property, plant and equipment as discussed in note 1(j) (iv).(ii) Accumulated Funds
The category accumulated funds included all current and prior period retained funds.
(iii) Separate reserve accounts are recognised in the financial statements only if such accounts are required by specific legislation or Australian Accounting Standards (e.g. asset revaluation reserve and foreign currency translation reserve).
(n) Equity transfersThe transfer of net assets between agencies as a result of an administrative restructure, transfers of programs / functions and parts thereof between NSW public sector agencies and ‘equity appropriations’ (refer Note 1(i)(i) are designated or required by Accounting Standards to be treated as contributions by owners and recognised as an adjustment to “Accumulated Funds”. This treatment is consistent with AASB 1004 Contributions and Australian Interpretation 1038 Contributions by Owners Made to Wholly-Owned Public Sector Entities.
Transfers arising from an administrative restructure involving not-for-profit entities and for-profit government departments are recognised at the amount at which the assets and liabilities were recognised by the transferor immediately prior to the restructure. Subject to below, in most instances this will approximate fair value.
All other equity transfers are recognised at fair value, except for intangibles. Where an intangible has been recognised at (amortised) cost by the transferer because there is no active market, NSW Trade & Investment recognises the asset at the transferor’s carrying amount. Where the transferor is prohibited from recognising an internally generated intangible NSW Trade & Investment does not recognise that asset.
(o) Budgeted amountsThe budgeted amounts are drawn from the budgets as formulated at the beginning of the financial year and with any adjustments for the effects of additional appropriations, s 21A, s 24 and / or s 26 of the Public Finance and Audit Act 1983.
The budgeted amounts in the Statement of Comprehensive Income and the Statement of Cash Flows are generally based on the amounts disclosed in the NSW Budget Papers (as adjusted above). However, in the Statement of Financial Position the amounts vary from the Budget Papers, as the opening balances of the budgeted amounts are based on carried forward actual amounts; i.e. per the audited financial statements (rather than the carry forward estimates).
(p) Comparative informationExcept when an Australian Accounting Standard permits or requires otherwise, comparative information is disclosed in respect of the previous period for all amounts reported in the financial statements.
Because this is the first year the Department has been amalgamated with certain staff and functions from the former DECCW, LPMA, Communities NSW and the Retail Tenancy Unit, the comparative figures only relate to the former Industry and Investment. Note 1(r) details separately comparative information for the statement of comprehensive income in 2010 for the transferred staff and functions.
(q) New Australian Accounting Standards issued but not effective
At reporting date all the new and revised Standards and Interpretations issued by the Australian Accounting Standards Board (The AASB) that are relevant to NSW Trade & Investment’s operations and effective for the current annual reporting period have been adopted.
Australian Accounting Standards and Interpretations that have recently been issued or amended but are not yet effective have not been adopted for the financial reporting period ended 30 June 2011. These are listed as follows:
AASB Compiled Standards
• AASB 9 Financial Instruments;
278 FINANCIAL STATEMENTS NSW TRADE & INVESTMENT ANNUAL REPORT 2010 -11
FINANCIAL STATEMENTS - NSW TRADE & INVESTMENT
• AASB 124 Related Party Disclosures;
• AASB 1053 Application of Tiers of Australian Accounting Standards;
• AASB 1054 Australian Additional Disclosures;
Amending Pronouncements and Errata (not yet fully compiled)
• AASB 2009-11 Amendments to Australian Accounting Standards arising from AASB 9;
• AASB 2010-2 Amendments to Australian Accounting Standards arising form Reduced Disclosure Requirements;
• AASB 2010-6 Amendments to Australian Accounting Standards –Disclosure on Transfers of Financial Assets;
• AASB 2010-7 Amendments to Australian Accounting Standards arising from AASB 9;
• AASB 2010-8 Amendments to Australian Accounting Standards – Deferred Tax: Recovery of Underlying Assets;
• AASB 2010-9 Amendments to Australian Accounting Standards – Severe Hyperinflation and Removal of Fixed Dates for First-time Adopters;
• AASB 2011-1 Amendments to Australian Accounting Standards arising from the Trans-Tasman Convergence Project;
• AASB 2011-2 Amendments to Australian Accounting Standards arising from the Trans-Tasman Convergence Project – Reduced Disclosure Requirements;
• AASB 2011-3 Amendments to Australian Accounting Standards – Orderly Adoption of Charges to the ABS
GFS Manual and Related Amendments;
Recent Amending Pronouncements and Errata (fully compiled)
• AASB 2009-12 Amendments to Australian Accounting Standards;
• AASB 2010-4 Further Amendments to Australian Accounting Standards arising from the Annual Improvements Project;
• AASB 2010-5 Amendments to Australian Accounting Standards;
• AASB 2010-10 Further Amendments to Australian Accounting Standards – Removal of Fixed Dates for First-time Adopters.
NSW Trade & Investment has reviewed the new accounting standards and at this stage does not anticipate any material impact on the figures reported in these financial statements.
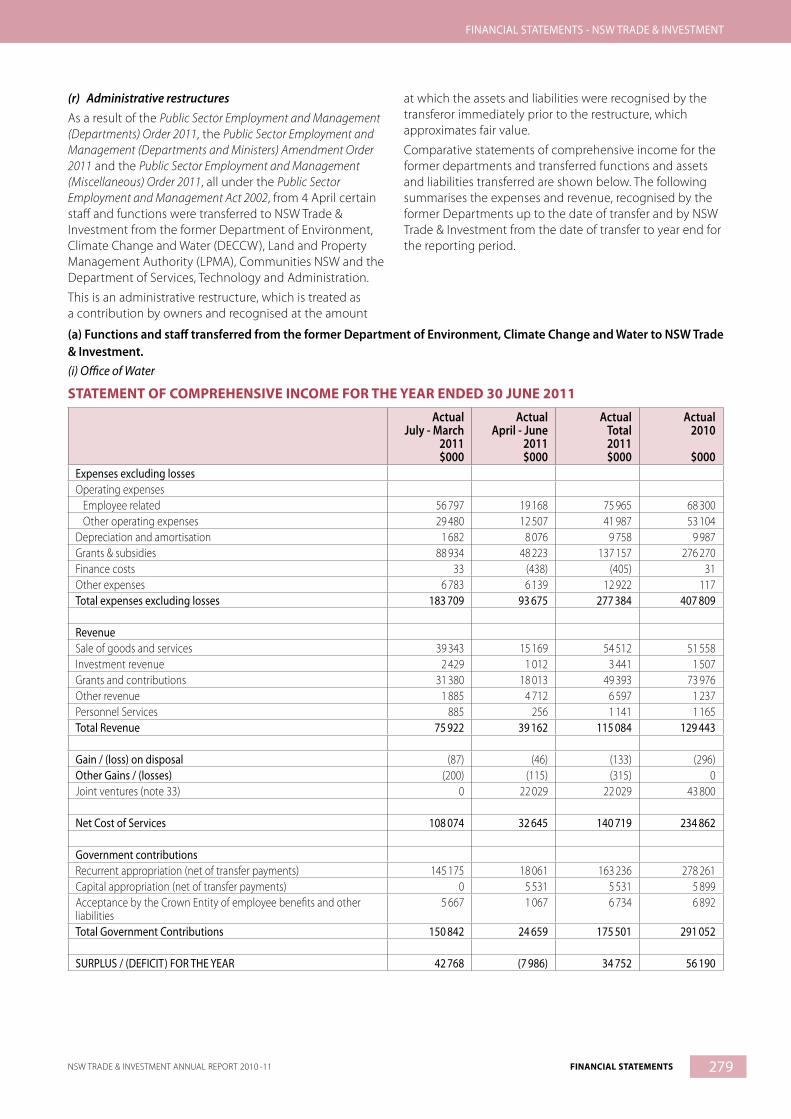
279NSW TRADE & INVESTMENT ANNUAL REPORT 2010 -11 FINANCIAL STATEMENTS
FINANCIAL STATEMENTS - NSW TRADE & INVESTMENT
(r) Administrative restructuresAs a result of the Public Sector Employment and Management (Departments) Order 2011, the Public Sector Employment and Management (Departments and Ministers) Amendment Order 2011 and the Public Sector Employment and Management (Miscellaneous) Order 2011, all under the Public Sector Employment and Management Act 2002, from 4 April certain staff and functions were transferred to NSW Trade & Investment from the former Department of Environment, Climate Change and Water (DECCW), Land and Property Management Authority (LPMA), Communities NSW and the Department of Services, Technology and Administration.
This is an administrative restructure, which is treated as a contribution by owners and recognised at the amount
at which the assets and liabilities were recognised by the transferor immediately prior to the restructure, which approximates fair value.
Comparative statements of comprehensive income for the former departments and transferred functions and assets and liabilities transferred are shown below. The following summarises the expenses and revenue, recognised by the former Departments up to the date of transfer and by NSW Trade & Investment from the date of transfer to year end for the reporting period.
(a) Functions and staff transferred from the former Department of Environment, Climate Change and Water to NSW Trade & Investment.(i) Office of Water
STATEMENT OF COMPREHENSIVE INCOME FOR THE YEAR ENDED 30 JUNE 2011
ActualJuly - March
2011$000
ActualApril - June
2011$000
ActualTotal2011$000
Actual2010
$000Expenses excluding lossesOperating expenses Employee related 56 797 19 168 75 965 68 300 Other operating expenses 29 480 12 507 41 987 53 104Depreciation and amortisation 1 682 8 076 9 758 9 987Grants & subsidies 88 934 48 223 137 157 276 270Finance costs 33 (438) (405) 31Other expenses 6 783 6 139 12 922 117Total expenses excluding losses 183 709 93 675 277 384 407 809
RevenueSale of goods and services 39 343 15 169 54 512 51 558Investment revenue 2 429 1 012 3 441 1 507Grants and contributions 31 380 18 013 49 393 73 976Other revenue 1 885 4 712 6 597 1 237Personnel Services 885 256 1 141 1 165Total Revenue 75 922 39 162 115 084 129 443
Gain / (loss) on disposal (87) (46) (133) (296)Other Gains / (losses) (200) (115) (315) 0Joint ventures (note 33) 0 22 029 22 029 43 800
Net Cost of Services 108 074 32 645 140 719 234 862
Government contributionsRecurrent appropriation (net of transfer payments) 145 175 18 061 163 236 278 261Capital appropriation (net of transfer payments) 0 5 531 5 531 5 899Acceptance by the Crown Entity of employee benefits and other liabilities
5 667 1 067 6 734 6 892
Total Government Contributions 150 842 24 659 175 501 291 052
SURPLUS / (DEFICIT) FOR THE YEAR 42 768 (7 986) 34 752 56 190
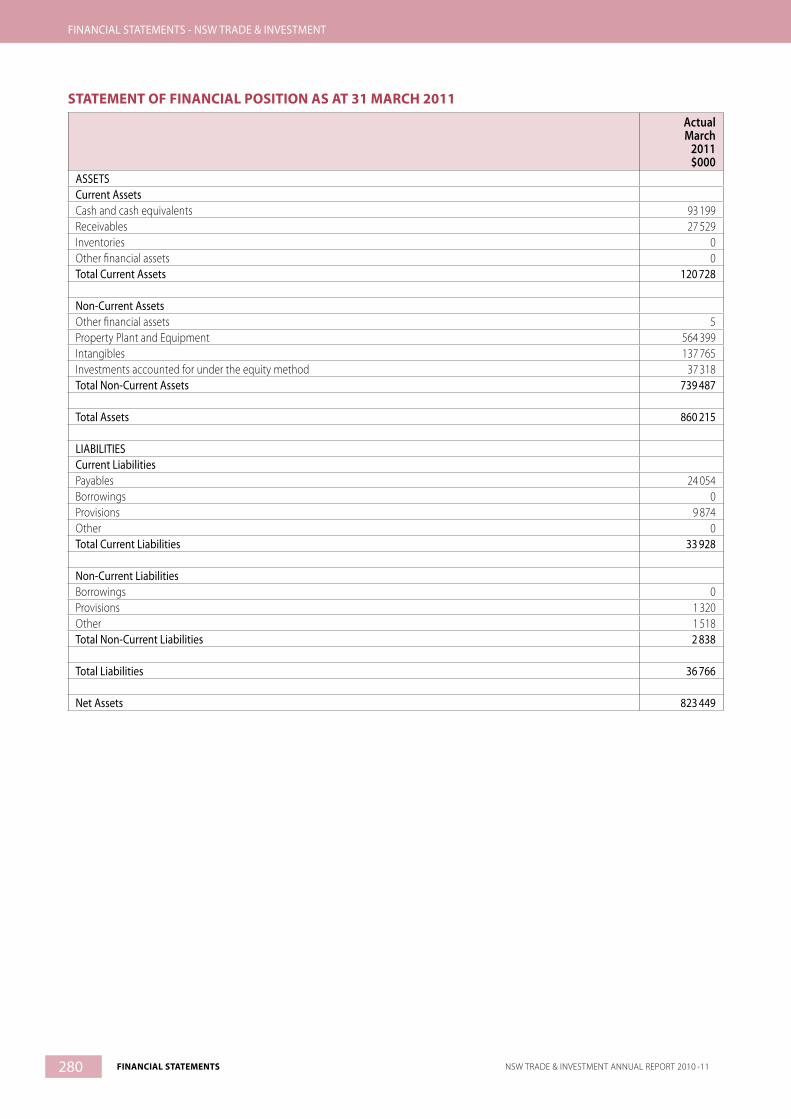
280 FINANCIAL STATEMENTS NSW TRADE & INVESTMENT ANNUAL REPORT 2010 -11
FINANCIAL STATEMENTS - NSW TRADE & INVESTMENT
STATEMENT OF FINANCIAL POSITION AS AT 31 MARCH 2011
ActualMarch
2011$000
ASSETSCurrent AssetsCash and cash equivalents 93 199Receivables 27 529Inventories 0Other financial assets 0Total Current Assets 120 728
Non-Current AssetsOther financial assets 5Property Plant and Equipment 564 399Intangibles 137 765Investments accounted for under the equity method 37 318Total Non-Current Assets 739 487
Total Assets 860 215
LIABILITIESCurrent LiabilitiesPayables 24 054Borrowings 0Provisions 9 874Other 0Total Current Liabilities 33 928
Non-Current LiabilitiesBorrowings 0Provisions 1 320Other 1 518Total Non-Current Liabilities 2 838
Total Liabilities 36 766
Net Assets 823 449

281NSW TRADE & INVESTMENT ANNUAL REPORT 2010 -11 FINANCIAL STATEMENTS
FINANCIAL STATEMENTS - NSW TRADE & INVESTMENT
(ii) Marine Parks Authority Secretariat
STATEMENT OF COMPREHENSIVE INCOME FOR THE YEAR ENDED 30 JUNE 2011
ActualJuly - March
2011$000
ActualApril - June
2011$000
ActualTotal2011$000
ActualTotal2010$000
Expenses excluding lossesOperating expenses Employee related 3 694 1 143 4 837 5 065 Other operating expenses 1 202 820 2 022 747Depreciation and amortisation 169 57 226 136Grants & subsidies 3 4 7 98 984Total expenses excluding losses 5 068 2 024 7 092 104 932
RevenueSale of goods and services 0 22 22 0Investment revenue 10 0 10 0Fees and Fines 43 21 64 0Grants and contributions 134 63 197 138Other revenue (1) 0 (1) 29Total Revenue 186 106 292 167
Gain / (loss) on disposal (29) (12) (41) 0
Net Cost of Services 4 911 1 930 6 841 104 765
Government contributionsRecurrent appropriation (net of transfer payments) 4 608 1 839 6 447 106 574Capital appropriation (net of transfer payments) 87 48 135 0Acceptance by the Crown Entity of employee benefits and other liabilities
163 24 187 38
Total Government Contributions 4 858 1 911 6 769 106 612
SURPLUS / (DEFICIT) FOR THE YEAR (53) (19) (72) 1 847
STATEMENT OF FINANCIAL POSITION AS AT 31 MARCH 2011
ActualMarch
2011$000
ASSETSCurrent AssetsCash and cash equivalents 756Receivables 7Total Current Assets 763
Non-Current AssetsProperty Plant and Equipment 1 551Total Non-Current Assets 1 551
Total Assets 2 314
LIABILITIESCurrent LiabilitiesPayables 455Total Current Liabilities 455
Total Liabilities 455
Net Assets 1 859
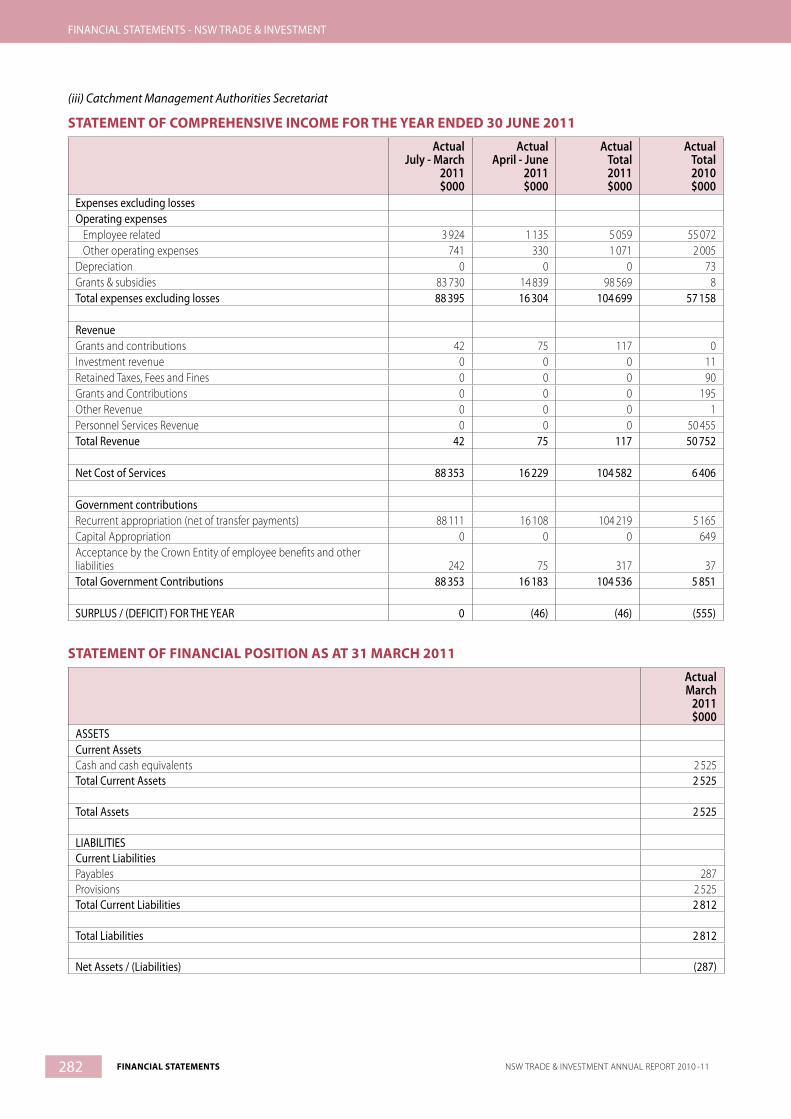
282 FINANCIAL STATEMENTS NSW TRADE & INVESTMENT ANNUAL REPORT 2010 -11
FINANCIAL STATEMENTS - NSW TRADE & INVESTMENT
(iii) Catchment Management Authorities Secretariat
STATEMENT OF COMPREHENSIVE INCOME FOR THE YEAR ENDED 30 JUNE 2011
ActualJuly - March
2011$000
ActualApril - June
2011$000
ActualTotal2011$000
ActualTotal2010$000
Expenses excluding lossesOperating expenses Employee related 3 924 1 135 5 059 55 072 Other operating expenses 741 330 1 071 2 005Depreciation 0 0 0 73Grants & subsidies 83 730 14 839 98 569 8Total expenses excluding losses 88 395 16 304 104 699 57 158
RevenueGrants and contributions 42 75 117 0Investment revenue 0 0 0 11Retained Taxes, Fees and Fines 0 0 0 90Grants and Contributions 0 0 0 195Other Revenue 0 0 0 1Personnel Services Revenue 0 0 0 50 455Total Revenue 42 75 117 50 752
Net Cost of Services 88 353 16 229 104 582 6 406
Government contributionsRecurrent appropriation (net of transfer payments) 88 111 16 108 104 219 5 165Capital Appropriation 0 0 0 649Acceptance by the Crown Entity of employee benefits and other liabilities 242 75 317 37Total Government Contributions 88 353 16 183 104 536 5 851
SURPLUS / (DEFICIT) FOR THE YEAR 0 (46) (46) (555)
STATEMENT OF FINANCIAL POSITION AS AT 31 MARCH 2011
ActualMarch
2011$000
ASSETSCurrent AssetsCash and cash equivalents 2 525Total Current Assets 2 525
Total Assets 2 525
LIABILITIESCurrent LiabilitiesPayables 287Provisions 2 525Total Current Liabilities 2 812
Total Liabilities 2 812
Net Assets / (Liabilities) (287)
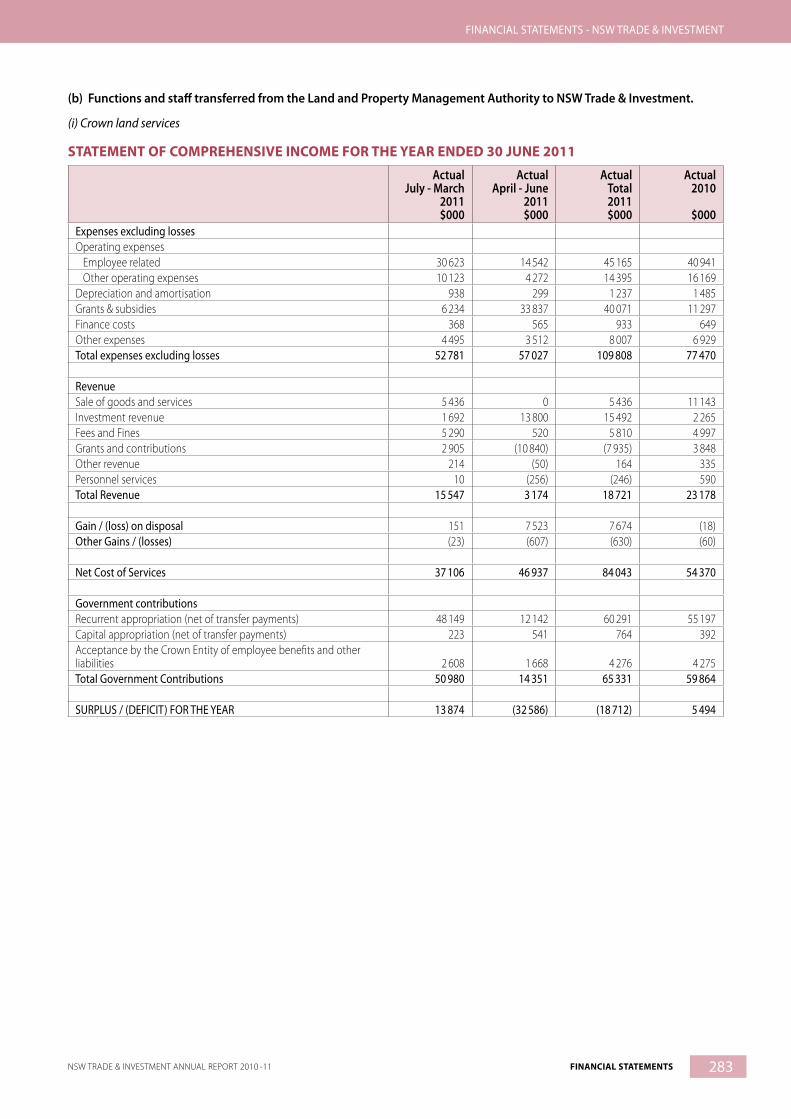
283NSW TRADE & INVESTMENT ANNUAL REPORT 2010 -11 FINANCIAL STATEMENTS
FINANCIAL STATEMENTS - NSW TRADE & INVESTMENT
(b) Functions and staff transferred from the Land and Property Management Authority to NSW Trade & Investment.
(i) Crown land services
STATEMENT OF COMPREHENSIVE INCOME FOR THE YEAR ENDED 30 JUNE 2011
ActualJuly - March
2011$000
ActualApril - June
2011$000
ActualTotal2011$000
Actual2010
$000Expenses excluding lossesOperating expenses Employee related 30 623 14 542 45 165 40 941 Other operating expenses 10 123 4 272 14 395 16 169Depreciation and amortisation 938 299 1 237 1 485Grants & subsidies 6 234 33 837 40 071 11 297Finance costs 368 565 933 649Other expenses 4 495 3 512 8 007 6 929Total expenses excluding losses 52 781 57 027 109 808 77 470
RevenueSale of goods and services 5 436 0 5 436 11 143Investment revenue 1 692 13 800 15 492 2 265Fees and Fines 5 290 520 5 810 4 997Grants and contributions 2 905 (10 840) (7 935) 3 848Other revenue 214 (50) 164 335Personnel services 10 (256) (246) 590Total Revenue 15 547 3 174 18 721 23 178
Gain / (loss) on disposal 151 7 523 7 674 (18)Other Gains / (losses) (23) (607) (630) (60)
Net Cost of Services 37 106 46 937 84 043 54 370
Government contributionsRecurrent appropriation (net of transfer payments) 48 149 12 142 60 291 55 197Capital appropriation (net of transfer payments) 223 541 764 392Acceptance by the Crown Entity of employee benefits and other liabilities 2 608 1 668 4 276 4 275Total Government Contributions 50 980 14 351 65 331 59 864
SURPLUS / (DEFICIT) FOR THE YEAR 13 874 (32 586) (18 712) 5 494

284 FINANCIAL STATEMENTS NSW TRADE & INVESTMENT ANNUAL REPORT 2010 -11
FINANCIAL STATEMENTS - NSW TRADE & INVESTMENT
STATEMENT OF FINANCIAL POSITION AS AT 31 MARCH 2011
ActualMarch
2011$000
ASSETSCurrent AssetsCash and cash equivalents 20Receivables 6 796Other financial assets 6 472Assets held for sale 60Total Current Assets 13 348
Non-Current AssetsReceivables 9 084Other financial assets 21 286Property Plant and Equipment 36 654Intangibles 189Total Non-Current Assets 67 213
Total Assets 80 561
LIABILITIESCurrent LiabilitiesPayables (21 124)Borrowings 1 515Provisions 6 033Other 3 727Total Current Liabilities (9 849)
Non-Current LiabilitiesBorrowings 3 995Provisions 77Total Non-Current Liabilities 4 072
Total Liabilities (5 777)
Net Assets 86 338

285NSW TRADE & INVESTMENT ANNUAL REPORT 2010 -11 FINANCIAL STATEMENTS
FINANCIAL STATEMENTS - NSW TRADE & INVESTMENT
(ii) Crown Leaseholds Entity (CLE)
STATEMENT OF COMPREHENSIVE INCOME FOR THE YEAR ENDED 30 JUNE 2011
ActualJuly - March
2011$000
ActualApril - June
2011$000
ActualTotal2011$000
Actual2010
$000Expenses excluding lossesOperating expenses Employee related 0 0 0 0 Other operating expenses 814 573 1 387 1 296Depreciation and amortisation 0 10 342 10 342 0Grants & subsidies 13 392 2 903 16 295 17 337Other expenses 11 458 (1 108) 10 350 116 112Total expenses excluding losses 25 664 12 710 38 374 134 745
RevenueSale of goods and services 38 315 259 38 574 54 554Investment revenue 2 071 767 2 838 2 634Retained taxes, fines and fees 1 261 368 1 629 2 045Grants and contributions 6 285 0 6 285 501Other revenue 62 889 261 63 150 19 803Total Revenue 110 821 1 655 112 476 79 537
Gain / (loss) on disposal (84 306) (25 975) (110 281) (101 113)Other Gains / (losses) (29 041) 534 (28 507) (22 196)
Net Cost of Services 28 190 36 496 64 686 178 517
Government contributionsRecurrent appropriation (net of transfer payments) 0 0 0 0Capital appropriation (net of transfer payments) 0 0 0 0Acceptance by the Crown Entity of employee benefits and other liabilities 0 0 0 0Payment to OSR – Tax Equivalent (48 152) (9 293) (57 445) (50 709)Total Government Contributions (48 152) (9 293) (57 445) (50 709)
SURPLUS / (DEFICIT) FOR THE YEAR (76 342) (45 789) (122 131) (229 226)

286 FINANCIAL STATEMENTS NSW TRADE & INVESTMENT ANNUAL REPORT 2010 -11
FINANCIAL STATEMENTS - NSW TRADE & INVESTMENT
STATEMENT OF FINANCIAL POSITION AS AT 31 MARCH 2011
ActualMarch
2011$000
ASSETSCurrent AssetsCash and cash equivalents 9 739Receivables 24 476Total Current Assets 34 215
Non-Current AssetsReceivables 124 194Property Plant and Equipment 6 294 786Total Non-Current Assets 6 418 980
Total Assets 6 453 195
LIABILITIESCurrent LiabilitiesPayables 17 130Total Current Liabilities 17 130
Non-Current LiabilitiesProvisions 635 405Total Non-Current Liabilities 635 405Total Liabilities 652 535Net Assets 5 800 660
(iii) Soil Conservation, Rural Services and Programs (SCS)
STATEMENT OF COMPREHENSIVE INCOME FOR THE YEAR ENDED 30 JUNE 2011
ActualJuly - March
2011$000
ActualApril - June
2011$000
ActualTotal2011$000
Actual2010
$000Expenses excluding lossesOperating expenses Employee related 8 867 2 199 11 066 10 890 Other operating expenses 10 168 3 572 13 740 16 033Depreciation and amortisation 446 138 584 492Grants and subsidies 188 342 530 0Total expenses excluding losses 19 669 6 251 25 920 27 415
RevenueSale of goods and services 15 678 8 186 23 864 26 692Other revenue 515 0 515 0Total Revenue 16 193 8 186 24 379 26 692
Gain / (loss) on disposal 6 514 520 542Other Gains / (losses) 9 13 22 14
Net Cost of Services 3 461 (2 462) 999 167
Government contributionsRecurrent appropriation (net of transfer payments) 188 342 530 329Capital appropriation (net of transfer payments) 0 0 0 0Acceptance by the Crown Entity of employee benefits and other liabilities
0 0 0 0
Total Government Contributions 188 342 530 329
SURPLUS / (DEFICIT) FOR THE YEAR 3 273 (2 804) 469 162

287NSW TRADE & INVESTMENT ANNUAL REPORT 2010 -11 FINANCIAL STATEMENTS
FINANCIAL STATEMENTS - NSW TRADE & INVESTMENT
STATEMENT OF FINANCIAL POSITION AS AT 31 MARCH 2011
ActualMarch
2011$000
ASSETSCurrent AssetsCash and cash equivalents 84Receivables 8 930Inventories 121Assets held for sale 384Total Current Assets 9 519
Non-Current AssetsInventories 0Property Plant and Equipment 21 299Total Non-Current Assets 21 299
Total Assets 30 818
LIABILITIESCurrent LiabilitiesPayables 11 237Provisions 6 627Total Current Liabilities 17 864
Non Current LiabilitiesProvisions 8 409Total Non Current Liabilities 8 409Total Liabilities 26 273
Net Assets 4 545

288 FINANCIAL STATEMENTS NSW TRADE & INVESTMENT ANNUAL REPORT 2010 -11
FINANCIAL STATEMENTS - NSW TRADE & INVESTMENT
(iv) Crown Lands Homesites Program (CLHSP)
STATEMENT OF COMPREHENSIVE INCOME FOR THE YEAR ENDED 30 JUNE 2011
ActualJuly - March
2011$000
ActualApril - June
2011$000
ActualTotal2011$000
Actual2010
$000Expenses excluding lossesOperating expenses Employee related 0 5 5 0 Other operating expenses 9 153 4 526 13 679 16 440Depreciation and amortisation 0 0 0 0Grants & subsidies 0 0 0 0Finance costs 1 504 (1 504) 0 0Other expenses 0 0 0 0Total expenses excluding losses 10 657 3 027 13 684 16 440
RevenueSale of goods and services 10 132 5 350 15 482 21 682Investment revenue 0 (1 504) (1 504) 0Fees and Fines 8 0 8 1 249Grants and contributions 0 0 0 10Other revenue 0 0 0 0Personnel services 0 0 0 0Total Revenue 10 140 3 846 13 986 22 941
Gain / (loss) on disposal 0 0 0 0Other Gains / (losses) 0 0 0 0
Net Cost of Services 517 (819) (302) (6 501)
Government contributionsRecurrent appropriation (net of transfer payments) 0 0 0 0Capital appropriation (net of transfer payments) 0 0 0 0Acceptance by the Crown Entity of employee benefits and other liabilities 0 0 0 0Total Government Contributions 0 0 0 0
SURPLUS / (DEFICIT) FOR THE YEAR (517) 819 302 6 501

289NSW TRADE & INVESTMENT ANNUAL REPORT 2010 -11 FINANCIAL STATEMENTS
FINANCIAL STATEMENTS - NSW TRADE & INVESTMENT
STATEMENT OF FINANCIAL POSITION AS AT 31 MARCH 2011
ActualMarch
2011$000
ASSETSCurrent AssetsCash and cash equivalents 10 304Receivables 68Inventories 21 638Total Current Assets 32 010
Non-Current AssetsReceivables 88Inventories 9 550Total Non-Current Assets 9 638
Total Assets 41 648
LIABILITIESCurrent LiabilitiesPayables 1 737Provisions 1 357Total Current Liabilities 3 094
Non-Current LiabilitiesProvisions 327Other 8 434Total Non-Current Liabilities 8 761
Total Liabilities 11 855
Net Assets 29 793

290 FINANCIAL STATEMENTS NSW TRADE & INVESTMENT ANNUAL REPORT 2010 -11
FINANCIAL STATEMENTS - NSW TRADE & INVESTMENT
(v) Land Development Working Account (LDWA)
STATEMENT OF COMPREHENSIVE INCOME FOR THE YEAR ENDED 30 JUNE 2011
ActualJuly - March
2011$000
ActualApril - June
2011$000
ActualTotal2011$000
Actual2010
$000Expenses excluding lossesOperating expenses Employee related 0 0 0 11 Other operating expenses 1 595 2 164 3 759 4.390Depreciation and amortisation 2 1 3 3Total expenses excluding losses 1 597 2 165 3 762 4 404
RevenueSale of goods and services 754 665 1 419 4.942Retained taxes. fines and fees 120 (53) 67 27Total Revenue 874 612 1 486 4 969
Gain / (loss) on disposal 1 994 5 523 7 517 0Other Gains / (losses) (138) 123 (15) 46
Net Cost of Services (1 133) (4 093) (5 226) (611)
Government contributionsRecurrent appropriation (net of transfer payments) 0 0 0 0Capital appropriation (net of transfer payments) 0 0 0 0Acceptance by the Crown Entity of employee benefits and other liabilities 0 0 0 0Payments to OSR – Tax Equivalent 0 (1 053) (1 053) (2 290)Total Government Contributions 0 (1 053) (1 053) (2 290)
SURPLUS / (DEFICIT) FOR THE YEAR 1 133 3 040 4 173 (1 679)
STATEMENT OF FINANCIAL POSITION AS AT 31 MARCH 2011
ActualMarch
2011$000
ASSETSCurrent AssetsCash and cash equivalents 4 975Receivables (2 978)Inventories 2 107Total Current Assets 4 104
Non-Current AssetsInventories 5 197Property Plant and Equipment 1Total Non-Current Assets 5 198
Total Assets 9 302
LIABILITIESCurrent LiabilitiesPayables 333Total Current Liabilities 333
Total Liabilities 333
Net Assets 8 969
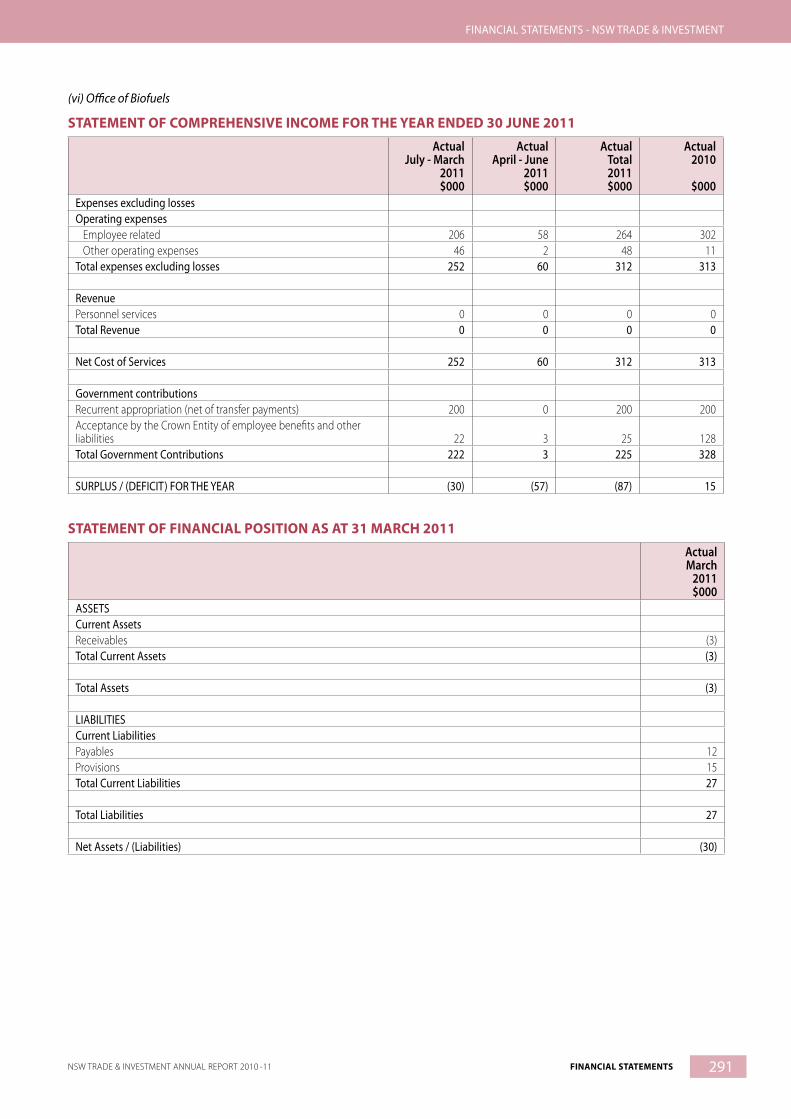
291NSW TRADE & INVESTMENT ANNUAL REPORT 2010 -11 FINANCIAL STATEMENTS
FINANCIAL STATEMENTS - NSW TRADE & INVESTMENT
(vi) Office of Biofuels
STATEMENT OF COMPREHENSIVE INCOME FOR THE YEAR ENDED 30 JUNE 2011
ActualJuly - March
2011$000
ActualApril - June
2011$000
ActualTotal2011$000
Actual2010
$000Expenses excluding lossesOperating expenses Employee related 206 58 264 302 Other operating expenses 46 2 48 11Total expenses excluding losses 252 60 312 313
RevenuePersonnel services 0 0 0 0Total Revenue 0 0 0 0
Net Cost of Services 252 60 312 313
Government contributionsRecurrent appropriation (net of transfer payments) 200 0 200 200Acceptance by the Crown Entity of employee benefits and other liabilities 22 3 25 128Total Government Contributions 222 3 225 328
SURPLUS / (DEFICIT) FOR THE YEAR (30) (57) (87) 15
STATEMENT OF FINANCIAL POSITION AS AT 31 MARCH 2011
ActualMarch
2011$000
ASSETSCurrent AssetsReceivables (3)Total Current Assets (3)
Total Assets (3)
LIABILITIESCurrent LiabilitiesPayables 12Provisions 15Total Current Liabilities 27
Total Liabilities 27
Net Assets / (Liabilities) (30)

292 FINANCIAL STATEMENTS NSW TRADE & INVESTMENT ANNUAL REPORT 2010 -11
FINANCIAL STATEMENTS - NSW TRADE & INVESTMENT
(c) Functions and staff transferred from the former Communities NSW to NSW Trade & Investment.
(i) Arts NSW
STATEMENT OF COMPREHENSIVE INCOME FOR THE YEAR ENDED 30 JUNE 2011
ActualJuly - March
2011$000
ActualApril - June
2011$000
ActualTotal2011$000
Actual2010
$000Expenses excluding lossesOperating expenses Employee related 3 066 1 054 4 120 5 360 Other operating expenses 2 975 1 483 4 458 5 189Depreciation and amortisation 2 526 795 3 321 3 174Grants & subsidies 34 402 14 353 48 755 50 835Total expenses excluding losses 42 969 17 685 60 654 64 558
RevenueSale of goods and services 1 346 351 1 697 1 773Investment revenue 0 0 0 382Grants and contributions 1 054 90 1 144 1 739Other revenue 284 542 826 2 690Total Revenue 2 684 983 3 667 6 584
Net Cost of Services 40 285 16 702 56 987 57 974
Government contributionsRecurrent appropriation (net of transfer payments) 72 251 (13 346) 58 905 56 356Capital appropriation (net of transfer payments) 2 167 1 406 3 573 3 223Acceptance by the Crown Entity of employee benefits and other liabilities 80 16 96 (57)Total Government Contributions 74 498 (11 924) 62 574 59 522
SURPLUS / (DEFICIT) FOR THE YEAR 34 213 (28 626) 5 587 1 548

293NSW TRADE & INVESTMENT ANNUAL REPORT 2010 -11 FINANCIAL STATEMENTS
FINANCIAL STATEMENTS - NSW TRADE & INVESTMENT
STATEMENT OF FINANCIAL POSITION AS AT 31 MARCH 2011
ActualMarch
2011$000
ASSETSCurrent AssetsCash and cash equivalents 26 181Receivables 2 070Total Current Assets 28 521
Non-Current AssetsProperty Plant and Equipment 150 925Total Non-Current Assets 150 925
Total Assets 179 176
LIABILITIESCurrent LiabilitiesPayables 1 569Provisions 568Total Current Liabilities 2 137
Non-Current LiabilitiesPayables 2 766Provisions 6Total Non-Current Liabilities 2 772
Total Liabilities 4 909
Net Assets 174 267

294 FINANCIAL STATEMENTS NSW TRADE & INVESTMENT ANNUAL REPORT 2010 -11
FINANCIAL STATEMENTS - NSW TRADE & INVESTMENT
(ii) Office of Liquor, Gaming and Racing
STATEMENT OF COMPREHENSIVE INCOME FOR THE YEAR ENDED 30 JUNE 2011
ActualJuly - March
2011$000
ActualApril - June
2011$000
ActualTotal2011$000
Actual2010
$000Expenses excluding lossesOperating expenses Employee related 9 654 2 959 12 613 20 584 Other operating expenses 1 722 629 2 351 8 373Depreciation and amortisation 2 023 617 2 640 1 001Grants & subsidies 9 228 4 465 13 693 14 014Total expenses excluding losses 22 627 8 670 31 297 43 972
RevenueSale of goods and services 4 559 (2 953) 1 606 2 518Investment revenue 0 0 0 432Grants and contributions 0 0 0 100Other revenue 589 438 1 027 2 612Total Revenue 5 148 (2 515) 2 633 5 662
Net Cost of Services 17 479 11 185 28 664 38 310
Government contributionsRecurrent appropriation (net of transfer payments) 23 373 9 283 32 656 33 029Capital appropriation (net of transfer payments) 1 011 1 089 2 100 1 888Acceptance by the Crown Entity of employee benefits and other liabilities 665 (47) 618 2 175Total Government Contributions 25 049 10 325 35 374 37 092
SURPLUS / (DEFICIT) FOR THE YEAR 7 570 (860) 6 710 (1 218)
STATEMENT OF FINANCIAL POSITION AS AT 31 MARCH 2011
ActualMarch
2011$000
ASSETSCurrent AssetsCash and cash equivalents 19 392Receivables 2 525Total Current Assets 21 917
Non-Current AssetsProperty Plant and Equipment 1 996Intangible assets 4 014Total Non-Current Assets 6 010
Total Assets 27 927
LIABILITIESCurrent LiabilitiesPayables 2 045Provisions 2 706Total Current Liabilities 4 751
Non-Current LiabilitiesProvisions 38Total Non-Current Liabilities 38
Total Liabilities 4 789
Net Assets 23 138

295NSW TRADE & INVESTMENT ANNUAL REPORT 2010 -11 FINANCIAL STATEMENTS
FINANCIAL STATEMENTS - NSW TRADE & INVESTMENT
(iii) Personnel Services provided to the Art Gallery, Australian Museum, Casino, Liquor and Gaming Control Authority, Museum of Applied Arts and Sciences, State Library and Sydney Opera House Trust
STATEMENT OF COMPREHENSIVE INCOME FOR THE YEAR ENDED 30 JUNE 2011
ActualJuly - March
2011$000
ActualApril - June
2011$000
ActualTotal2011$000
Actual2010$000
Expenses excluding lossesOperating expenses Employee related 118 925 46 684 165 609 153 883Total expenses excluding losses 118 925 46 684 165 609 153 883
RevenuePersonnel services revenue 113 003 45 149 158 152 145 974Total Revenue 113 003 45 149 158 152 145 974
Net Cost of Services 5 922 1 535 7 457 7 909
Government contributionsAcceptance by the Crown Entity of employee benefits and other liabilities
5 922 1 535 7 457 7 909
Total Government Contributions 5 922 1 535 7 457 7 909
SURPLUS / (DEFICIT) FOR THE YEAR 0 0 0 0
STATEMENT OF FINANCIAL POSITION AS AT 31 MARCH 2011
ActualMarch
2011$000
ASSETSCurrent AssetsReceivables 25 344Total Current Assets 25 344
Non-Current AssetsReceivables 1 262Total Non-Current Assets 1 262
Total Assets 26 606
LIABILITIESCurrent LiabilitiesPayables 5 883Provisions 19 659Total Current Liabilities 25 542
Non-Current LiabilitiesProvisions 1 262Total Non-Current Liabilities 1 262
Total Liabilities 26 804
Net Assets / (Liabilities) (198)
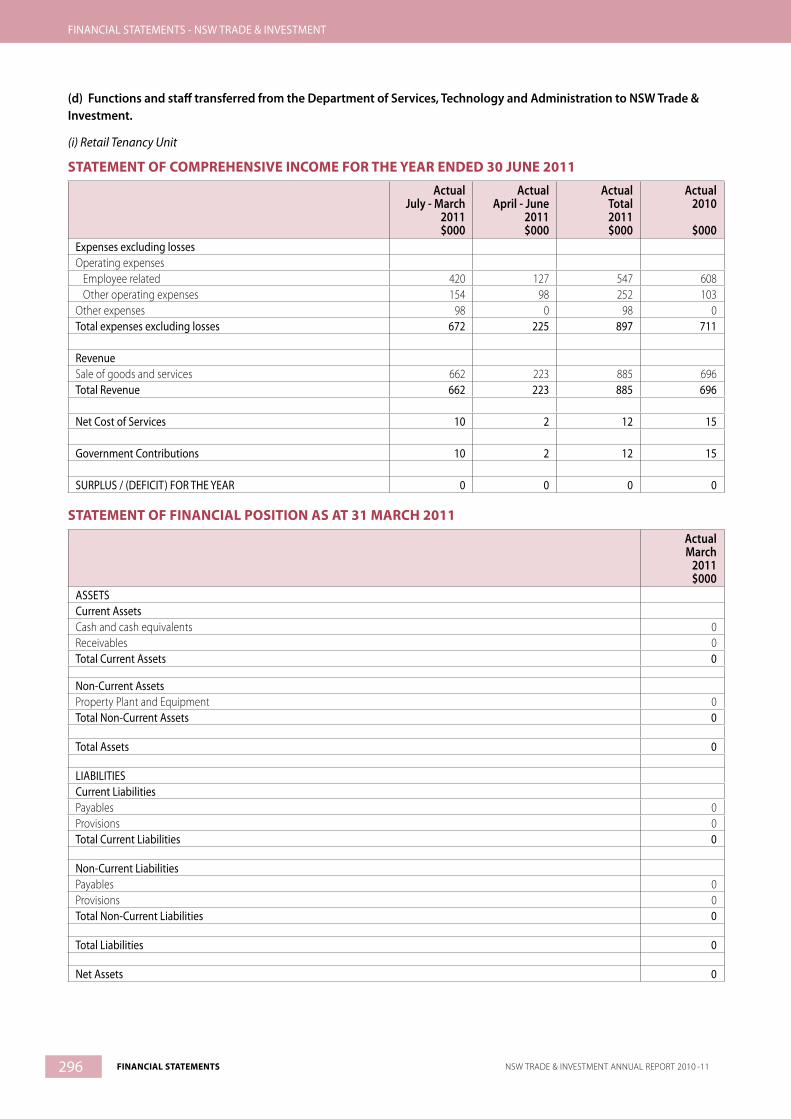
296 FINANCIAL STATEMENTS NSW TRADE & INVESTMENT ANNUAL REPORT 2010 -11
FINANCIAL STATEMENTS - NSW TRADE & INVESTMENT
(d) Functions and staff transferred from the Department of Services, Technology and Administration to NSW Trade & Investment.
(i) Retail Tenancy Unit
STATEMENT OF COMPREHENSIVE INCOME FOR THE YEAR ENDED 30 JUNE 2011
ActualJuly - March
2011$000
ActualApril - June
2011$000
ActualTotal2011$000
Actual2010
$000Expenses excluding lossesOperating expenses Employee related 420 127 547 608 Other operating expenses 154 98 252 103Other expenses 98 0 98 0Total expenses excluding losses 672 225 897 711
RevenueSale of goods and services 662 223 885 696Total Revenue 662 223 885 696
Net Cost of Services 10 2 12 15
Government Contributions 10 2 12 15
SURPLUS / (DEFICIT) FOR THE YEAR 0 0 0 0
STATEMENT OF FINANCIAL POSITION AS AT 31 MARCH 2011
ActualMarch
2011$000
ASSETSCurrent AssetsCash and cash equivalents 0Receivables 0Total Current Assets 0
Non-Current AssetsProperty Plant and Equipment 0Total Non-Current Assets 0
Total Assets 0
LIABILITIESCurrent LiabilitiesPayables 0Provisions 0Total Current Liabilities 0
Non-Current LiabilitiesPayables 0Provisions 0Total Non-Current Liabilities 0
Total Liabilities 0
Net Assets 0
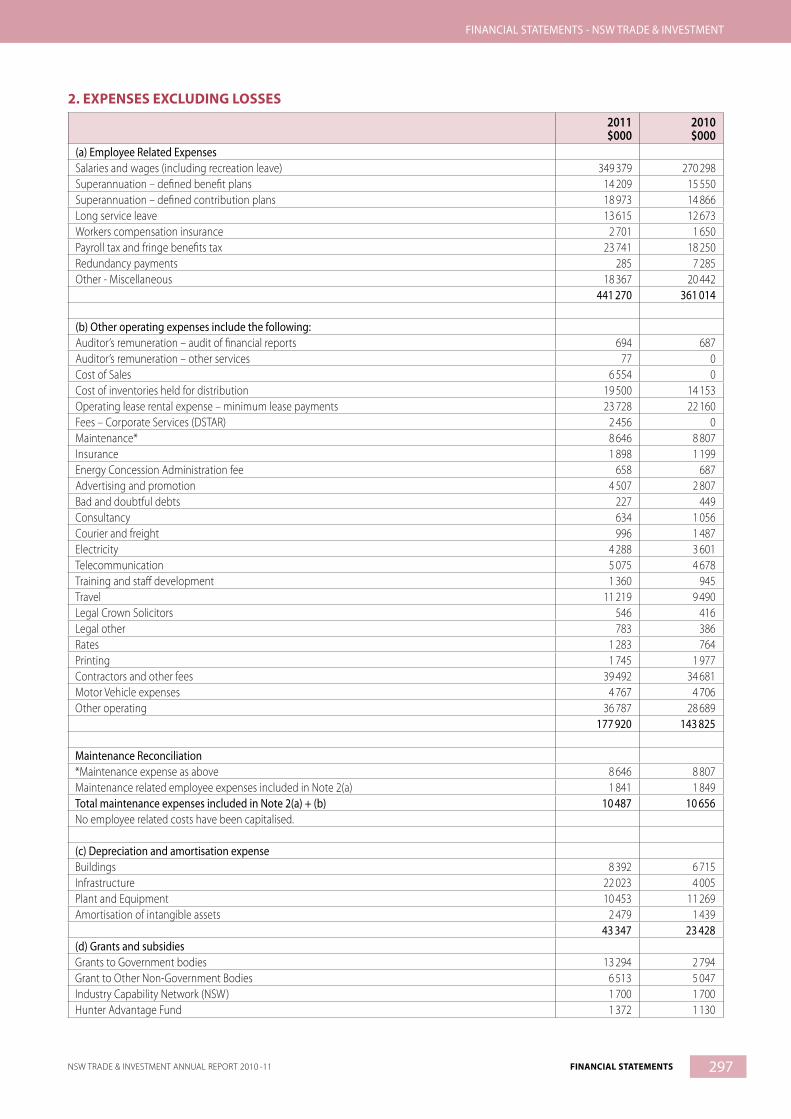
297NSW TRADE & INVESTMENT ANNUAL REPORT 2010 -11 FINANCIAL STATEMENTS
FINANCIAL STATEMENTS - NSW TRADE & INVESTMENT
2. EXPENSES EXCLUDING LOSSES
2011$000
2010$000
(a) Employee Related ExpensesSalaries and wages (including recreation leave) 349 379 270 298Superannuation – defined benefit plans 14 209 15 550Superannuation – defined contribution plans 18 973 14 866Long service leave 13 615 12 673Workers compensation insurance 2 701 1 650Payroll tax and fringe benefits tax 23 741 18 250Redundancy payments 285 7 285Other - Miscellaneous 18 367 20 442
441 270 361 014
(b) Other operating expenses include the following: Auditor’s remuneration – audit of financial reports 694 687Auditor’s remuneration – other services 77 0Cost of Sales 6 554 0Cost of inventories held for distribution 19 500 14 153Operating lease rental expense – minimum lease payments 23 728 22 160Fees – Corporate Services (DSTAR) 2 456 0Maintenance* 8 646 8 807Insurance 1 898 1 199Energy Concession Administration fee 658 687Advertising and promotion 4 507 2 807Bad and doubtful debts 227 449Consultancy 634 1 056Courier and freight 996 1 487Electricity 4 288 3 601Telecommunication 5 075 4 678Training and staff development 1 360 945Travel 11 219 9 490Legal Crown Solicitors 546 416Legal other 783 386Rates 1 283 764Printing 1 745 1 977Contractors and other fees 39 492 34 681Motor Vehicle expenses 4 767 4 706Other operating 36 787 28 689 177 920 143 825
Maintenance Reconciliation*Maintenance expense as above 8 646 8 807Maintenance related employee expenses included in Note 2(a) 1 841 1 849Total maintenance expenses included in Note 2(a) + (b) 10 487 10 656No employee related costs have been capitalised.
(c) Depreciation and amortisation expenseBuildings 8 392 6 715Infrastructure 22 023 4 005Plant and Equipment 10 453 11 269Amortisation of intangible assets 2 479 1 439
43 347 23 428(d) Grants and subsidiesGrants to Government bodies 13 294 2 794Grant to Other Non-Government Bodies 6 513 5 047Industry Capability Network (NSW) 1 700 1 700Hunter Advantage Fund 1 372 1 130

298 FINANCIAL STATEMENTS NSW TRADE & INVESTMENT ANNUAL REPORT 2010 -11
FINANCIAL STATEMENTS - NSW TRADE & INVESTMENT
2011$000
2010$000
Katoomba / Echo Point Development 164 968Illawarra Advantage Fund 2 136 983Science Leverage Fund 9 941 9 811Science and Medical Research 32 491 31 663Tourism Service Organisations 5 190 4 138Payroll Tax Incentive Scheme 17 899 16 215Renewable Remote Power Generation 7 11 933Life Support Rebates Scheme 3 530 2 985Pensioner Energy Rebate Scheme 104 435 86 720Energy Accounts Payment Assistance 14 358 10 896Customer Assistance Policy 1 805 140Drought Transport Subsidies 3 109 20 315Destruction of Noxious Weeds 9 183 8 353Livestock, Health and Pest Authority 675 656Animal Welfare Organisations 533 533Wild Dog Destruction Board 55 55Rural Counsellors Contribution 840 840Gwydir Valley Pilot 5 432 1 181Brigalow Structural Adjustment 0 1 922River Red Gum Structural Adjustment 39 877 2 458Disaster Response Services 0 0Interest Free Loan Grant Expense 116 0Centralised Monitoring Fee – Clubs 265 0Responsible Gambling Fund 4 200 0Arts Funding program 14 353 0Catchment Management Authorities 10 143 0Subsidies to organisations – public trading enterprises 421 0Country Towns Water Supply and Sewerage Scheme 30 504 0Recurrent grant to Murray Darling Basin Authority 8 815 0Achieving Sustainable Groundwater Entitlements Program 27 0Grants – Hawkesbury Nepean River Package 5 857 0State Water Corporation 21 637 0Pensioner rate rebates – Australian Inland Energy Water Infrastructure 75 0Water and Sewer System for Aboriginal Communities 1 471 0Crown lease waivers 2 938 0Aboriginal Land Council (non cash) Capital Grant (1 108) 0Non cash capital land grant 8 552 0State Parks Trusts 11 0
382 816 223 436
(e) Finance CostsInterest on Treasury Advance 658 741Interest on Private Sector Loans 92 0Amortised interest expense (1 102) 535
(352) 1 276
(f ) Other expensesInvestment asset revaluation – decrement 70 11Beekeepers’ Compensation 36 51Shark Meshing 1 308 966Buyout of Commercial Fisheries 209 0Remedial Works to Mine Areas 2 255 1 891Australian Standing Committee on Agriculture 7 532 4 566Coal compensation expense 0 8 720
2. EXPENSES EXCLUDING LOSSES (continued)
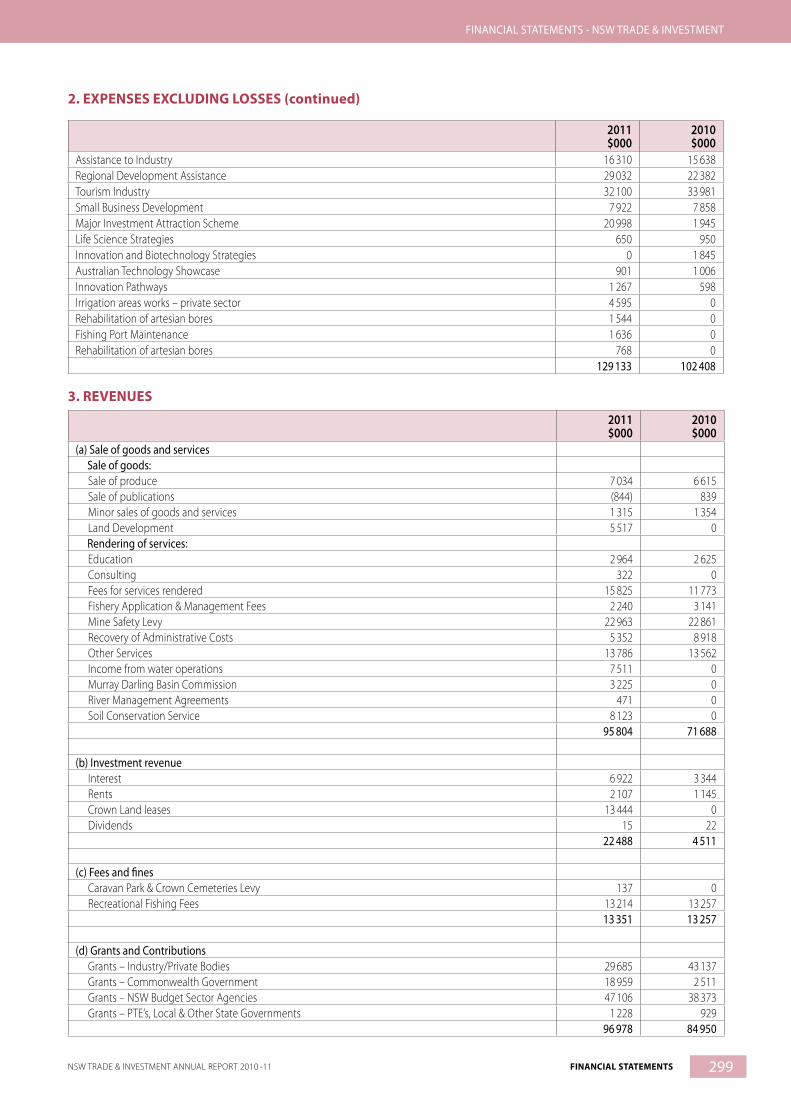
299NSW TRADE & INVESTMENT ANNUAL REPORT 2010 -11 FINANCIAL STATEMENTS
FINANCIAL STATEMENTS - NSW TRADE & INVESTMENT
2011$000
2010$000
Assistance to Industry 16 310 15 638Regional Development Assistance 29 032 22 382Tourism Industry 32 100 33 981Small Business Development 7 922 7 858Major Investment Attraction Scheme 20 998 1 945Life Science Strategies 650 950Innovation and Biotechnology Strategies 0 1 845Australian Technology Showcase 901 1 006Innovation Pathways 1 267 598Irrigation areas works – private sector 4 595 0Rehabilitation of artesian bores 1 544 0Fishing Port Maintenance 1 636 0Rehabilitation of artesian bores 768 0
129 133 102 408
3. REVENUES
2011$000
2010$000
(a) Sale of goods and services Sale of goods: Sale of produce 7 034 6 615 Sale of publications (844) 839 Minor sales of goods and services 1 315 1 354 Land Development 5 517 0 Rendering of services: Education 2 964 2 625 Consulting 322 0 Fees for services rendered 15 825 11 773 Fishery Application & Management Fees 2 240 3 141 Mine Safety Levy 22 963 22 861 Recovery of Administrative Costs 5 352 8 918 Other Services 13 786 13 562 Income from water operations 7 511 0 Murray Darling Basin Commission 3 225 0 River Management Agreements 471 0 Soil Conservation Service 8 123 0
95 804 71 688
(b) Investment revenue Interest 6 922 3 344 Rents 2 107 1 145 Crown Land leases 13 444 0 Dividends 15 22
22 488 4 511
(c) Fees and fines Caravan Park & Crown Cemeteries Levy 137 0 Recreational Fishing Fees 13 214 13 257
13 351 13 257
(d) Grants and Contributions Grants – Industry/Private Bodies 29 685 43 137 Grants – Commonwealth Government 18 959 2 511 Grants – NSW Budget Sector Agencies 47 106 38 373 Grants – PTE’s, Local & Other State Governments 1 228 929
96 978 84 950
2. EXPENSES EXCLUDING LOSSES (continued)

300 FINANCIAL STATEMENTS NSW TRADE & INVESTMENT ANNUAL REPORT 2010 -11
FINANCIAL STATEMENTS - NSW TRADE & INVESTMENT
2011$000
2010$000
(e) Other revenue Other Revenue 21 246 7 660
21 246 7 660
(f ) Personnel Services Revenue Casino Liquor Gaming and Racing 2 345 0 Land and Property Information 0 0 Mine Subsidence Board 2 816 2 262 Forests NSW 40 692 64 243 Catchment Management Authorities 14 129 0 Australian Museum 6 549 0 Museum of Applied Arts and Sciences 6 338 0 Art Gallery 6 454 0 State Library 9 467 0 Film and Television 2 175 0 Sydney Opera House 13 996 0
104 961 66 505
4. GAIN/(LOSS) ON DISPOSAL
2011$000
2010$000
Gain / (loss) on disposal of property, plant and equipmentProceeds from disposal 1 550 584Written down value of assets disposed (18 935) (227)Net gain / (loss) on disposal of property, plant and equipment (17 385) 357
Gain / (loss) on disposal of assets held for saleProceeds from disposal 755 1 162Written down value of assets disposed (333) (1 046)Net gain / (loss) on disposal of assets held for sale 422 116
Gain / (loss) on disposal of investmentsProceeds from disposal 0 122Written down value of assets disposed 0 (122)Net gain / (loss) on disposal of investments 0 0Net gain/(loss) on disposal (16 963) 473
5. OTHER GAINS /(LOSSES)
2011$000
2010$000
Impairment of Receivables 529 158Impairment of Property Plant and Equipment (205) 0Impairment of Intangibles (286) 0Gain on biological assets 974 188Net Other gains / (losses) 1 012 346
3. REVENUES (continued)
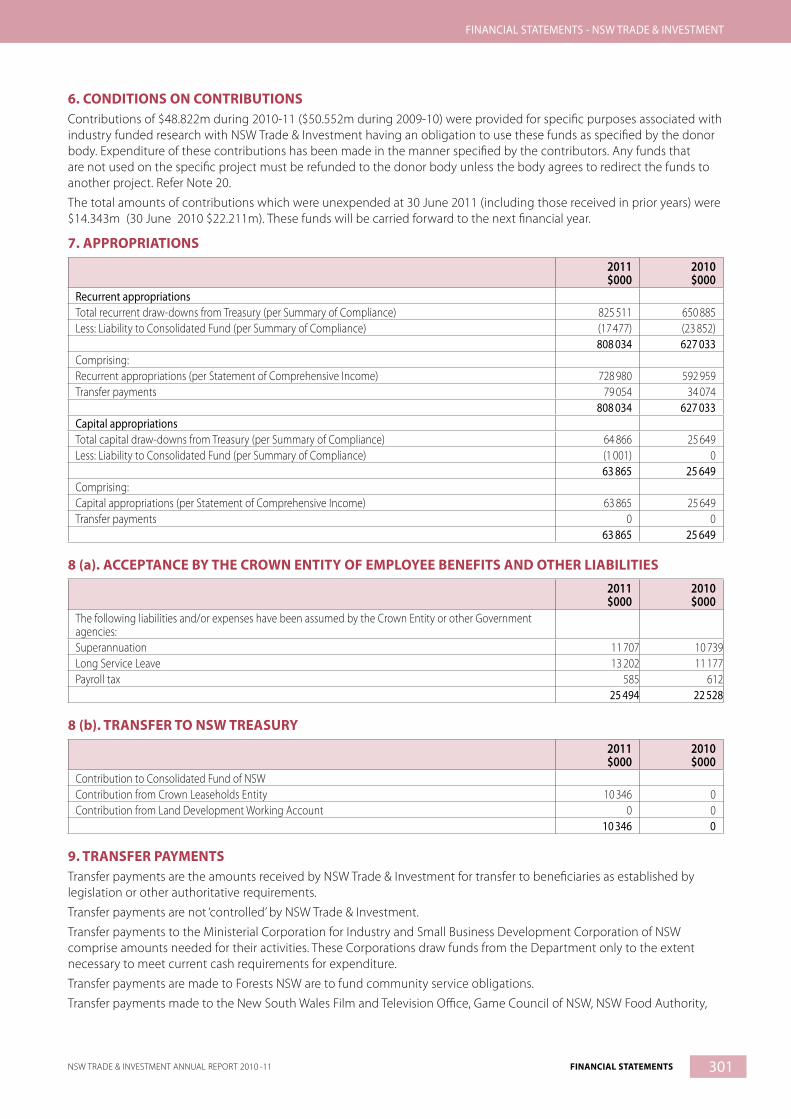
301NSW TRADE & INVESTMENT ANNUAL REPORT 2010 -11 FINANCIAL STATEMENTS
FINANCIAL STATEMENTS - NSW TRADE & INVESTMENT
6. CONDITIONS ON CONTRIBUTIONSContributions of $48.822m during 2010-11 ($50.552m during 2009-10) were provided for specific purposes associated with industry funded research with NSW Trade & Investment having an obligation to use these funds as specified by the donor body. Expenditure of these contributions has been made in the manner specified by the contributors. Any funds that are not used on the specific project must be refunded to the donor body unless the body agrees to redirect the funds to another project. Refer Note 20.
The total amounts of contributions which were unexpended at 30 June 2011 (including those received in prior years) were $14.343m (30 June 2010 $22.211m). These funds will be carried forward to the next financial year.
7. APPROPRIATIONS
2011$000
2010$000
Recurrent appropriationsTotal recurrent draw-downs from Treasury (per Summary of Compliance) 825 511 650 885Less: Liability to Consolidated Fund (per Summary of Compliance) (17 477) (23 852)
808 034 627 033Comprising:Recurrent appropriations (per Statement of Comprehensive Income) 728 980 592 959Transfer payments 79 054 34 074
808 034 627 033Capital appropriationsTotal capital draw-downs from Treasury (per Summary of Compliance) 64 866 25 649Less: Liability to Consolidated Fund (per Summary of Compliance) (1 001) 0
63 865 25 649Comprising:Capital appropriations (per Statement of Comprehensive Income) 63 865 25 649Transfer payments 0 0
63 865 25 649
8 (a). ACCEPTANCE BY THE CROWN ENTITY OF EMPLOYEE BENEFITS AND OTHER LIABILITIES
2011$000
2010$000
The following liabilities and/or expenses have been assumed by the Crown Entity or other Government agencies:Superannuation 11 707 10 739Long Service Leave 13 202 11 177Payroll tax 585 612
25 494 22 528
8 (b). TRANSFER TO NSW TREASURY
2011$000
2010$000
Contribution to Consolidated Fund of NSWContribution from Crown Leaseholds Entity 10 346 0Contribution from Land Development Working Account 0 0
10 346 0
9. TRANSFER PAYMENTSTransfer payments are the amounts received by NSW Trade & Investment for transfer to beneficiaries as established by legislation or other authoritative requirements.
Transfer payments are not ‘controlled’ by NSW Trade & Investment.
Transfer payments to the Ministerial Corporation for Industry and Small Business Development Corporation of NSW comprise amounts needed for their activities. These Corporations draw funds from the Department only to the extent necessary to meet current cash requirements for expenditure.
Transfer payments are made to Forests NSW are to fund community service obligations.
Transfer payments made to the New South Wales Film and Television Office, Game Council of NSW, NSW Food Authority,
302 FINANCIAL STATEMENTS NSW TRADE & INVESTMENT ANNUAL REPORT 2010 -11
FINANCIAL STATEMENTS - NSW TRADE & INVESTMENT
9. TRANSFER PAYMENTS (continued)Art Gallery of NSW, Australian Museum, Museum of Applied Arts and Sciences, State Library of NSW and Sydney Opera House are to fund operations.
2011$000
2010$000
Small Business Development Corporation of NSW 23 38Ministerial Corporation for Industry 8 910 8 553New South Wales Film and Television Office 8 460 1 937Game Council of NSW 2 556 2 527Forests NSW 9 557 9 557NSW Food Authority 12 233 11 462Art Gallery of NSW 5 884 0Australian Museum 5 410 0Museum of Applied Arts and Sciences 7 082 0State Library of NSW 9 562 0Sydney Opera House Trust 9 377 0
79 054 34 074
10. SERVICE GROUPS OF THE DEPARTMENTAgriculture and Biosecurity Service Description: This service group covers development and delivery of services and initiatives such as extension, education and promotion of animal welfare, to drive sustainable development of agriculture and private forestry, as well as development and implementation of industry safety, biosecurtiy and emergency response plans to support improved industry safety and biosecurity.
Fisheries and ComplianceService Description: This service group covers development and delivery of compliance, regulatory programs, services and initiatives to protect primary industries from pests, diseases and contaminants and drive sustainable development of aquaculture, commercial fishing and recreational fishing.
Science and Research Activities (Agriculture, Fisheries and Forestry)Service Description: This service group covers provision of science, research and innovative technologies to increase the international competitiveness of the State’s primary industries in an environmentally sustainable way, as well as provision of the science to underpin effective biosecurity policy and implementation.
Mineral Resources and Mine SafetyService Description: This service group covers assessment of the State’s geology and mineral resources, their allocation to private interests for exploration and mining, and regulation of exploration and mining activities for safety and environmental performance.
Energy Supply and UseService Description: This service group covers: promoting and maintaining competition in energy supply markets; developing national energy market frameworks in partnership with other states; forecasting energy supply and demand; developing electricity and gas network and licensed pipeline regulation and monitoring performance; promoting renewable energy and energy saving schemes; and implementing consumer protection strategies for residential energy and urban ETA customers.
Investment Attraction and Industry DevelopmentService Description: This service group covers investment attraction for large projects through undertaking industry specific analysis for the identified priority areas, identifying export industries and markets, and generating industry investment. This includes the development and implementation of industry and sectoral plans to proactively drive industry growth at a State and regional level.
Small Business and Regional DevelopmentService Description: This service group covers providing strategic support to increase employment and investment growth in regional and metropolitan areas, with a focus on local infrastructure and small and medium enterprises.
Science and Medical Research Policy, and Industry InnovationService Description: This service group covers the research and development, analysis and stakeholder engagement activities required to help drive innovation, increase competitiveness and economic growth.
TourismService Description: This service group covers promoting New South Wales to domestic and international tourism markets and providing opportunities for an increase in jobs and tourist expenditure.
Personnel Services (former Industry & Investment)Service Description: This service group covers provision of personnel services to Forests NSW and the Mine Subsidence Board as part of the State’s Work Choices insulation legislation.

303NSW TRADE & INVESTMENT ANNUAL REPORT 2010 -11 FINANCIAL STATEMENTS
FINANCIAL STATEMENTS - NSW TRADE & INVESTMENT
10. SERVICE GROUPS OF THE DEPARTMENT (continued)Service groups transferred from former Communities NSW – for three months ended 30 June 2011Arts Industry and Facilities DevelopmentService Description: This service group covers development of the arts industry, primarily through providing grants to cultural organisations; and providing arts accommodation, primarily through Communities NSW managed properties.
Community Development, Services and Industry RegulationService Description: This service group covers the Department’s regulatory framework, compliance functions and coordination and development services which enhance community safety and wellbeing and includes the regulation and safe conduct of the liquor, gaming, racing and charity industries, and the development of volunteering and of Western Sydney.
Personnel Services (former Communities NSW)Service Description: This service group covers providing personnel services to selected agencies as part of the State’s Work Choices insulation legislation. Personnel services are provided to the Art Gallery of New South Wales, State Library of New South Wales, Sydney Opera House Trust, Australian Museum, Museum of Applied Arts and Sciences and Casino, Liquor and Gaming Control Authority.
Service groups transferred from former Department of Environment, Climate change and Water – for three months ended 30 June 2011Urban Water UtilitiesService Description: This service group covers planning and policy development for urban water industries, coordination and review of the Metropolitan Water Plan, facilitating water recycling across New South Wales, guiding and assisting non-metropolitan urban waste utilities in best practice management, overseeing and monitoring utility performance, funding backlog water and sewerage infrastructure, and providing emergency drought assistance.
Water ManagementService Description: This service group covers establishing and managing sustainable water sharing, licensing, allocation and trading arrangements to realise business, social and environmental benefits. Key services include: interstate water management, statutory water sharing planning, licence administration and compliance, water quantity and quality assessment, allocation of available water, development and implementation of ETA trading rules, and advice on ecosystem protection strategies and plans.
Functions transferredMarine Parks Authority Secretariat was formally a function within the Parks and Wildlife Service Group and the Catchment Management Authorities Secretariat was formally a function within the Environment Protection and Regulation Service Group of the former DECCW. Both Parks & Wildlife and Environment Protection and Regulation Service Groups are now within the Office of Environment and Heritage and will be reported in the Department of Premier and Cabinet’s Financial Statements.
Service groups transferred from former Land and Property Management Authority – for three months ended 30 June 2011Crown LandsService Description: This service group covers management of the Crown land estate. Services include land administration in relation to leaseholds, licences, permits, Crown roads, acquisitions, sales, non commercial tenures, the Land Board and processing Aboriginal and Native Title land claims. It also includes Crown reserves administration including recreational areas, walking tracks, showgrounds and caravan parks.
Soil Conversation, Rural Services and ProgramsService Description: This service group covers provision of a specialist consulting service, a soil and water conservation earthworks team and implements programs to assist rural communities. Government payments for services performed by commercial businesses are also included.
Commercial activity transferred from former Land and Property Management Authority – for three months ended 30 June 2011Crown Leaseholds Entity (CLE)Objective: To collect revenue from Crown estate leases and in administration of property management activities.
Land Development Working Account (LDWA)Objective: Development and sale of Crown land for commercial, industrial, rural and residential purposes in New South Wales.
Crown Lands Homesites Program (CLHP)Objective: Provision of Crown estate land for residential use.
Office of BiofuelsObjective: The Office of Biofuels was established in 2007 to implement the NSW Government’s Biofuels program and to support the further development of Biofuels strategy.
Retail Tenancy Unit (RTU)Objective: The RTU gives information, advice on procedures and processes under the Retail Leases Act 1994 as well as strategic assistance to retail landlords and tenants.
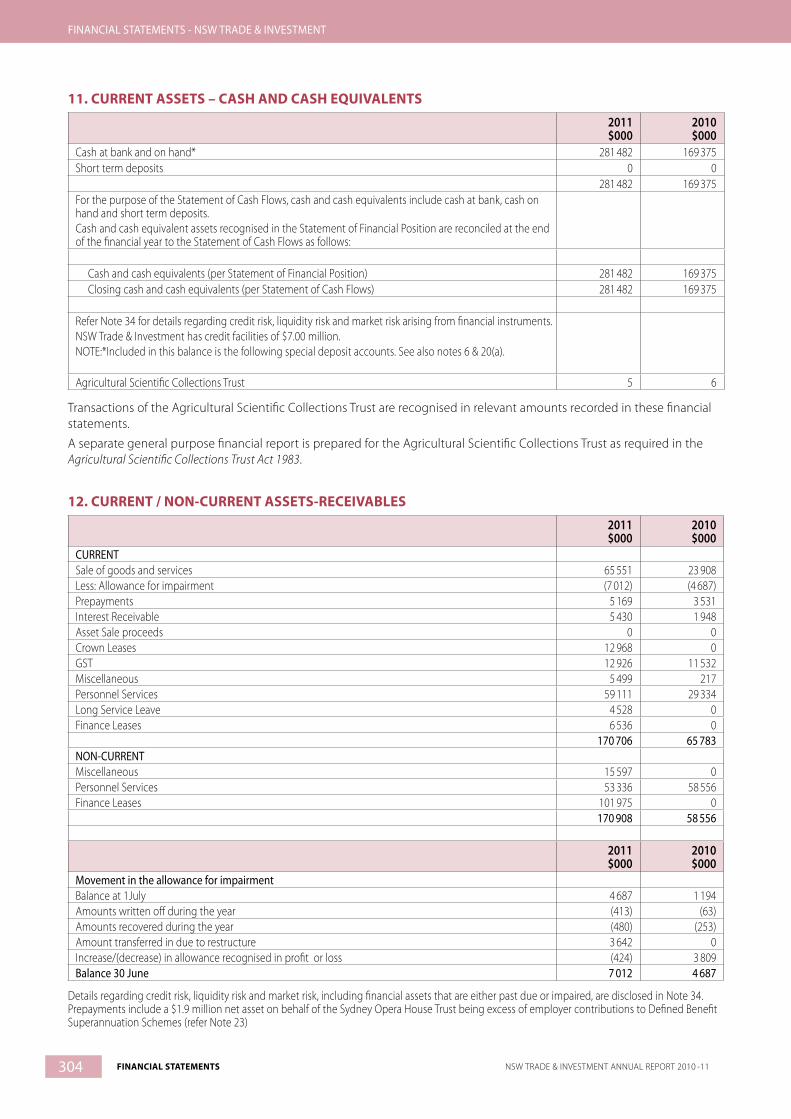
304 FINANCIAL STATEMENTS NSW TRADE & INVESTMENT ANNUAL REPORT 2010 -11
FINANCIAL STATEMENTS - NSW TRADE & INVESTMENT
11. CURRENT ASSETS – CASH AND CASH EQUIVALENTS
2011$000
2010$000
Cash at bank and on hand* 281 482 169 375Short term deposits 0 0
281 482 169 375For the purpose of the Statement of Cash Flows, cash and cash equivalents include cash at bank, cash on hand and short term deposits.Cash and cash equivalent assets recognised in the Statement of Financial Position are reconciled at the end of the financial year to the Statement of Cash Flows as follows:
Cash and cash equivalents (per Statement of Financial Position) 281 482 169 375 Closing cash and cash equivalents (per Statement of Cash Flows) 281 482 169 375
Refer Note 34 for details regarding credit risk, liquidity risk and market risk arising from financial instruments.NSW Trade & Investment has credit facilities of $7.00 million.NOTE:*Included in this balance is the following special deposit accounts. See also notes 6 & 20(a).
Agricultural Scientific Collections Trust 5 6
Transactions of the Agricultural Scientific Collections Trust are recognised in relevant amounts recorded in these financial statements.
A separate general purpose financial report is prepared for the Agricultural Scientific Collections Trust as required in the Agricultural Scientific Collections Trust Act 1983.
12. CURRENT / NON-CURRENT ASSETS-RECEIVABLES
2011$000
2010$000
CURRENTSale of goods and services 65 551 23 908Less: Allowance for impairment (7 012) (4 687)Prepayments 5 169 3 531Interest Receivable 5 430 1 948Asset Sale proceeds 0 0Crown Leases 12 968 0GST 12 926 11 532Miscellaneous 5 499 217Personnel Services 59 111 29 334Long Service Leave 4 528 0Finance Leases 6 536 0
170 706 65 783NON-CURRENTMiscellaneous 15 597 0Personnel Services 53 336 58 556Finance Leases 101 975 0
170 908 58 556
2011$000
2010$000
Movement in the allowance for impairmentBalance at 1July 4 687 1 194Amounts written off during the year (413) (63)Amounts recovered during the year (480) (253)Amount transferred in due to restructure 3 642 0Increase/(decrease) in allowance recognised in profit or loss (424) 3 809Balance 30 June 7 012 4 687
Details regarding credit risk, liquidity risk and market risk, including financial assets that are either past due or impaired, are disclosed in Note 34. Prepayments include a $1.9 million net asset on behalf of the Sydney Opera House Trust being excess of employer contributions to Defined Benefit Superannuation Schemes (refer Note 23)

305NSW TRADE & INVESTMENT ANNUAL REPORT 2010 -11 FINANCIAL STATEMENTS
FINANCIAL STATEMENTS - NSW TRADE & INVESTMENT
13. CURRENT / NON-CURRENT ASSETS – INVENTORIES
2011$000
2010$000
CURRENTValued at CostLand Developments 25 169 0Materials and Parts 497 416Work in progress and finished goods 3 930 1 469
29 596 1 885NON-CURRENTValued at CostLand Developments 14 985 0Materials and Parts 0 0
14 985 0
14. NON-CURRENT ASSETS – FINANCIAL ASSETS AT FAIR VALUE
2011$000
2010$000
NON-CURRENTGold Exhibits 3 939 4 173Shares 185 237
4 124 4 410
Gold ExhibitsNSW Trade & Investment has control and custody of certain gold exhibits which were transferred following the closure of the Earth Exchange (Mining Museum) in 1995. The 2011 valuations are based on the estimated specimen value as at 6 June 2011.These exhibits are as follows:
2011 2010
Weight (Troy Oz) $000 $000Maitland Bar 344.41 3 380 3 580Lucky Hit 42.64 359 380Woods Flat 20.85 175 186Alluvial Gold 18.00 25 27TOTAL 425.90 3 939 4 173
The value of shares represents holdings in:
2011$000
2010$000
Australian Co-Operative Foods Ltd 53 53Norco Co-Operative Ltd 92 92Rice Growers Co-Operative Mills Ltd 17 15Rice Marketing Board of NSW 4 4Cougar Energy Limited 19 73
185 237
Refer note 33 for further information regarding interests in Joint Ventures.Refer Note 34 for further information regarding credit risk, liquidity risk and market risk arising from financial instruments.
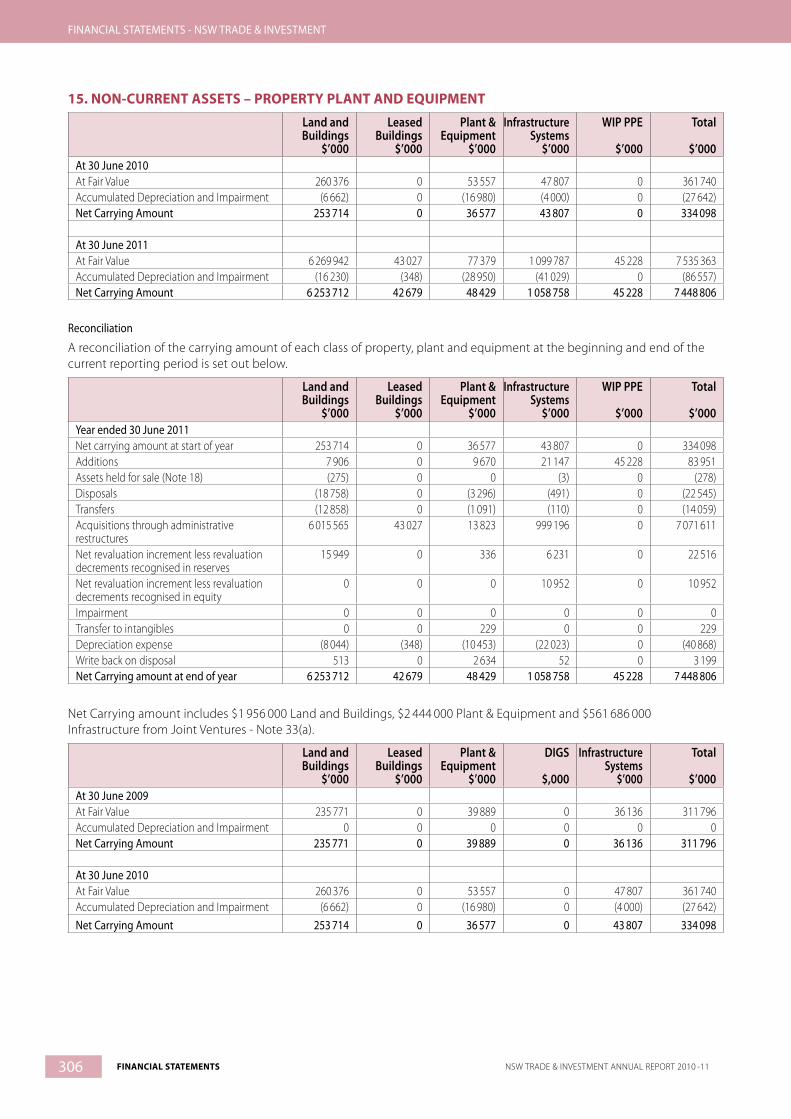
306 FINANCIAL STATEMENTS NSW TRADE & INVESTMENT ANNUAL REPORT 2010 -11
FINANCIAL STATEMENTS - NSW TRADE & INVESTMENT
15. NON-CURRENT ASSETS – PROPERTY PLANT AND EQUIPMENT
Land and Buildings
$’000
Leased Buildings
$’000
Plant & Equipment
$’000
Infrastructure Systems
$’000
WIP PPE
$’000
Total
$’000At 30 June 2010At Fair Value 260 376 0 53 557 47 807 0 361 740Accumulated Depreciation and Impairment (6 662) 0 (16 980) (4 000) 0 (27 642)Net Carrying Amount 253 714 0 36 577 43 807 0 334 098
At 30 June 2011At Fair Value 6 269 942 43 027 77 379 1 099 787 45 228 7 535 363Accumulated Depreciation and Impairment (16 230) (348) (28 950) (41 029) 0 (86 557)Net Carrying Amount 6 253 712 42 679 48 429 1 058 758 45 228 7 448 806
Reconciliation
A reconciliation of the carrying amount of each class of property, plant and equipment at the beginning and end of the current reporting period is set out below.
Land and Buildings
$’000
Leased Buildings
$’000
Plant & Equipment
$’000
Infrastructure Systems
$’000
WIP PPE
$’000
Total
$’000Year ended 30 June 2011Net carrying amount at start of year 253 714 0 36 577 43 807 0 334 098Additions 7 906 0 9 670 21 147 45 228 83 951Assets held for sale (Note 18) (275) 0 0 (3) 0 (278)Disposals (18 758) 0 (3 296) (491) 0 (22 545)Transfers (12 858) 0 (1 091) (110) 0 (14 059)Acquisitions through administrative restructures
6 015 565 43 027 13 823 999 196 0 7 071 611
Net revaluation increment less revaluation decrements recognised in reserves
15 949 0 336 6 231 0 22 516
Net revaluation increment less revaluation decrements recognised in equity
0 0 0 10 952 0 10 952
Impairment 0 0 0 0 0 0Transfer to intangibles 0 0 229 0 0 229Depreciation expense (8 044) (348) (10 453) (22 023) 0 (40 868)Write back on disposal 513 0 2 634 52 0 3 199Net Carrying amount at end of year 6 253 712 42 679 48 429 1 058 758 45 228 7 448 806
Net Carrying amount includes $1 956 000 Land and Buildings, $2 444 000 Plant & Equipment and $561 686 000 Infrastructure from Joint Ventures - Note 33(a).
Land and Buildings
$’000
Leased Buildings
$’000
Plant & Equipment
$’000
DIGS
$,000
Infrastructure Systems
$’000
Total
$’000At 30 June 2009At Fair Value 235 771 0 39 889 0 36 136 311 796Accumulated Depreciation and Impairment 0 0 0 0 0 0Net Carrying Amount 235 771 0 39 889 0 36 136 311 796
At 30 June 2010At Fair Value 260 376 0 53 557 0 47 807 361 740Accumulated Depreciation and Impairment (6 662) 0 (16 980) 0 (4 000) (27 642)Net Carrying Amount 253 714 0 36 577 0 43 807 334 098
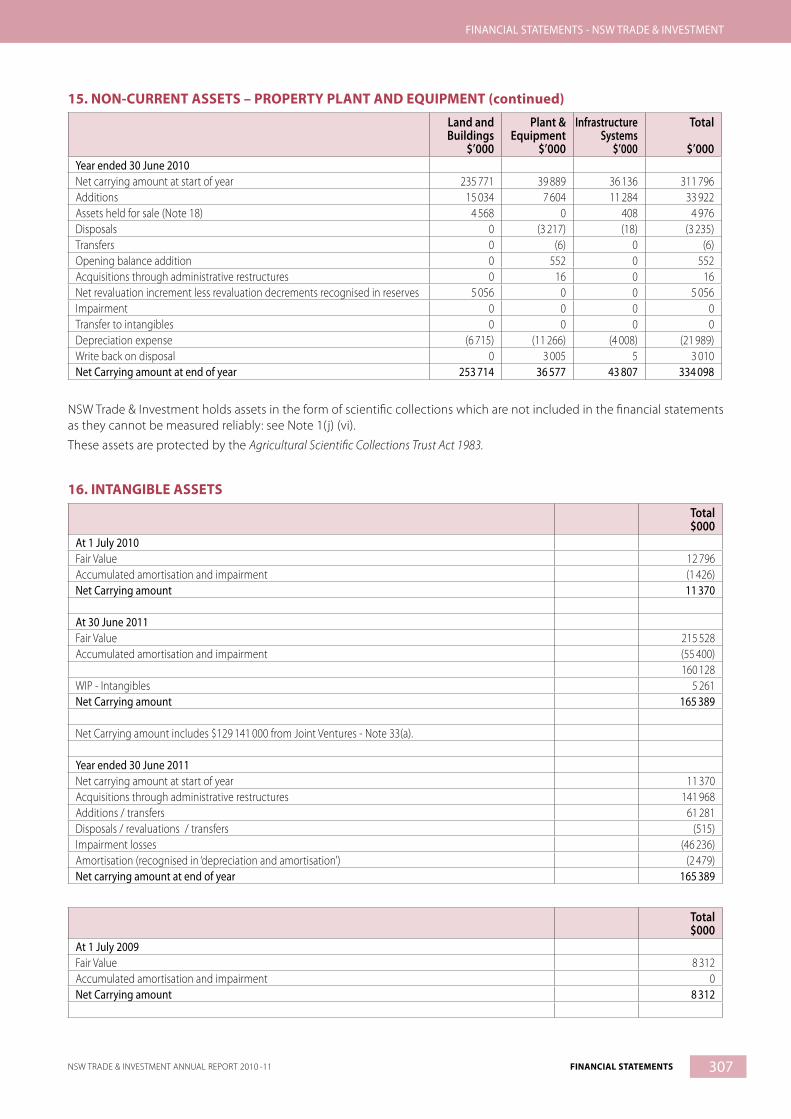
307NSW TRADE & INVESTMENT ANNUAL REPORT 2010 -11 FINANCIAL STATEMENTS
FINANCIAL STATEMENTS - NSW TRADE & INVESTMENT
15. NON-CURRENT ASSETS – PROPERTY PLANT AND EQUIPMENT (continued)
Land and Buildings
$’000
Plant & Equipment
$’000
Infrastructure Systems
$’000
Total
$’000Year ended 30 June 2010Net carrying amount at start of year 235 771 39 889 36 136 311 796Additions 15 034 7 604 11 284 33 922Assets held for sale (Note 18) 4 568 0 408 4 976Disposals 0 (3 217) (18) (3 235)Transfers 0 (6) 0 (6)Opening balance addition 0 552 0 552Acquisitions through administrative restructures 0 16 0 16 Net revaluation increment less revaluation decrements recognised in reserves 5 056 0 0 5 056Impairment 0 0 0 0Transfer to intangibles 0 0 0 0Depreciation expense (6 715) (11 266) (4 008) (21 989)Write back on disposal 0 3 005 5 3 010Net Carrying amount at end of year 253 714 36 577 43 807 334 098
NSW Trade & Investment holds assets in the form of scientific collections which are not included in the financial statements as they cannot be measured reliably: see Note 1(j) (vi).
These assets are protected by the Agricultural Scientific Collections Trust Act 1983.
16. INTANGIBLE ASSETS
Total$000
At 1 July 2010Fair Value 12 796Accumulated amortisation and impairment (1 426)Net Carrying amount 11 370
At 30 June 2011Fair Value 215 528Accumulated amortisation and impairment (55 400)
160 128WIP - Intangibles 5 261Net Carrying amount 165 389
Net Carrying amount includes $129 141 000 from Joint Ventures - Note 33(a).
Year ended 30 June 2011Net carrying amount at start of year 11 370Acquisitions through administrative restructures 141 968Additions / transfers 61 281Disposals / revaluations / transfers (515)Impairment losses (46 236)Amortisation (recognised in ‘depreciation and amortisation’) (2 479)Net carrying amount at end of year 165 389
Total$000
At 1 July 2009Fair Value 8 312Accumulated amortisation and impairment 0Net Carrying amount 8 312
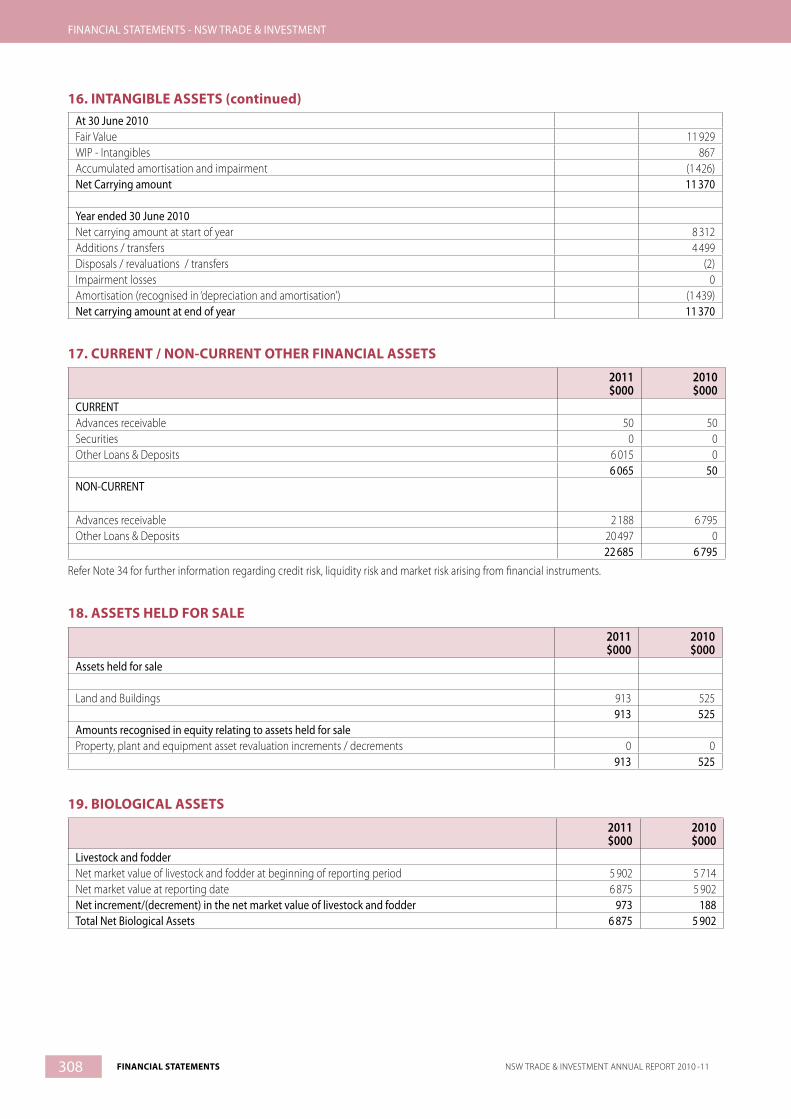
308 FINANCIAL STATEMENTS NSW TRADE & INVESTMENT ANNUAL REPORT 2010 -11
FINANCIAL STATEMENTS - NSW TRADE & INVESTMENT
At 30 June 2010Fair Value 11 929WIP - Intangibles 867Accumulated amortisation and impairment (1 426)Net Carrying amount 11 370
Year ended 30 June 2010Net carrying amount at start of year 8 312Additions / transfers 4 499Disposals / revaluations / transfers (2)Impairment losses 0Amortisation (recognised in ‘depreciation and amortisation’) (1 439)Net carrying amount at end of year 11 370
17. CURRENT / NON-CURRENT OTHER FINANCIAL ASSETS
2011$000
2010$000
CURRENT Advances receivable 50 50Securities 0 0Other Loans & Deposits 6 015 0
6 065 50NON-CURRENT
Advances receivable 2 188 6 795Other Loans & Deposits 20 497 0
22 685 6 795
Refer Note 34 for further information regarding credit risk, liquidity risk and market risk arising from financial instruments.
18. ASSETS HELD FOR SALE
2011$000
2010$000
Assets held for sale
Land and Buildings 913 525913 525
Amounts recognised in equity relating to assets held for saleProperty, plant and equipment asset revaluation increments / decrements 0 0
913 525
19. BIOLOGICAL ASSETS
2011$000
2010$000
Livestock and fodderNet market value of livestock and fodder at beginning of reporting period 5 902 5 714Net market value at reporting date 6 875 5 902Net increment/(decrement) in the net market value of livestock and fodder 973 188Total Net Biological Assets 6 875 5 902
16. INTANGIBLE ASSETS (continued)
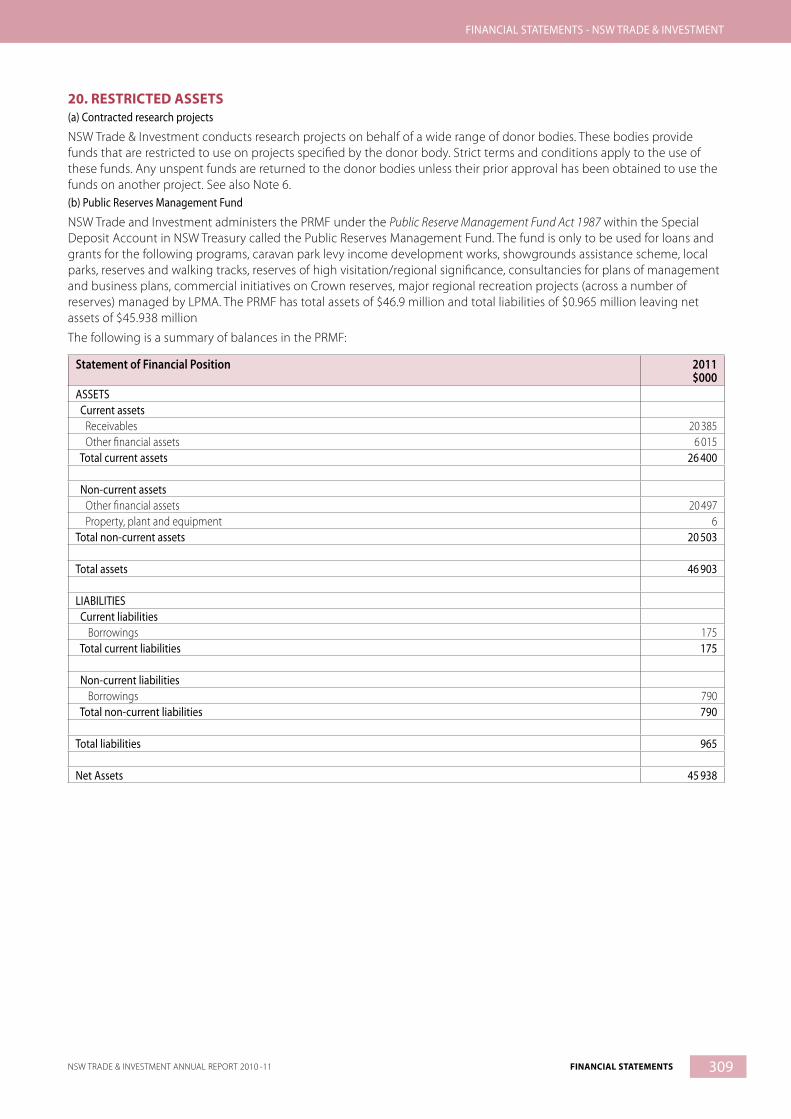
309NSW TRADE & INVESTMENT ANNUAL REPORT 2010 -11 FINANCIAL STATEMENTS
FINANCIAL STATEMENTS - NSW TRADE & INVESTMENT
20. RESTRICTED ASSETS(a) Contracted research projects
NSW Trade & Investment conducts research projects on behalf of a wide range of donor bodies. These bodies provide funds that are restricted to use on projects specified by the donor body. Strict terms and conditions apply to the use of these funds. Any unspent funds are returned to the donor bodies unless their prior approval has been obtained to use the funds on another project. See also Note 6.(b) Public Reserves Management Fund
NSW Trade and Investment administers the PRMF under the Public Reserve Management Fund Act 1987 within the Special Deposit Account in NSW Treasury called the Public Reserves Management Fund. The fund is only to be used for loans and grants for the following programs, caravan park levy income development works, showgrounds assistance scheme, local parks, reserves and walking tracks, reserves of high visitation/regional significance, consultancies for plans of management and business plans, commercial initiatives on Crown reserves, major regional recreation projects (across a number of reserves) managed by LPMA. The PRMF has total assets of $46.9 million and total liabilities of $0.965 million leaving net assets of $45.938 million
The following is a summary of balances in the PRMF:
Statement of Financial Position 2011$000
ASSETS Current assets Receivables 20 385 Other financial assets 6 015 Total current assets 26 400
Non-current assets Other financial assets 20 497 Property, plant and equipment 6Total non-current assets 20 503
Total assets 46 903
LIABILITIES Current liabilities Borrowings 175 Total current liabilities 175
Non-current liabilities Borrowings 790 Total non-current liabilities 790
Total liabilities 965
Net Assets 45 938

310 FINANCIAL STATEMENTS NSW TRADE & INVESTMENT ANNUAL REPORT 2010 -11
FINANCIAL STATEMENTS - NSW TRADE & INVESTMENT
21. CURRENT LIABILITIES - PAYABLES
2011$000
2010$000
CURRENTAccrued Salaries, wages and on-costs 13 974 5 141Goods & Services Tax Payable 2 562 296Other Taxes Payable 1 780 1 131Unearned Income 16 691 3 141Personnel Services Payable 0 0Creditors 69 295 71 288
104 302 80 997
Details regarding credit risk, liquidity risk and market risk, including a maturity analysis of the above payables are disclosed in Note 34.
22. CURRENT/ NON-CURRENT LIABILITIES – BORROWINGS2011$000
2010$000
CURRENTSecured/UnsecuredTreasury Advance Repayable – Locust Loan 3 311 3 133Treasury Advance Repayable – Buyout of Commercial Fishers 1 394 1 307Treasury Advance Repayable – PRMF Cudgegong Park loan 175 0ANZ Promissory Notes – Tweed River project 1 891 0
6 771 4 440
2011$000
2010$000
NON-CURRENTSecured/UnsecuredTreasury Advance Repayable – Locust Loan 2 170 5 481Treasury Advance Repayable – Buyout of Commercial Fishers 8 360 9 754Treasury Advance Repayable – PRMF Cudgegong Park loan 790 0ANZ Promissory Notes – Tweed River project 2 065 0
13 385 15 235Repayment of Borrowings Not later than one year 6 771 4 440Between one and five years 11 470 11 625Later than five years 1 915 3 610Total borrowings at face value 20 156 19 675
Details regarding credit risk, liquidity risk and market risk, including a maturity analysis of the above borrowings are disclosed in Note 34.
23(a). CURRENT/NON-CURRENT LIABILITIES – PROVISIONS
2011$000
2010$000
CURRENTEmployee benefits and related on-costsRecreation Leave 66 218 35 501Long Service Leave 32 226 23 646Payroll Tax 8 601 4 674Other Oncosts 5 375 0Superannuation – pooled fund 33 0Other (Redundancy) 11 083 11 335
123 536 75 156Other provisionsRestoration costs 6 492 1 881Dividends 1 053 0
7 545 1 881Total current provisions 131 081 77 037

311NSW TRADE & INVESTMENT ANNUAL REPORT 2010 -11 FINANCIAL STATEMENTS
FINANCIAL STATEMENTS - NSW TRADE & INVESTMENT
2011$000
2010$000
NON-CURRENTEmployee benefits and related on-costsRecreation Leave 0 0Long Service Leave 1 249 246Payroll Tax 396 246Other Oncosts 329 0Superannuation – pooled fund 59 382 58 555
61 356 59 047Other provisionsRestoration costs 1 198 981Aboriginal Land Council Claims 630 954 0
632 152 981Total non-current provisions 693 508 60 028
Aggregate employee benefits and related on-costsProvisions – current 123 536 75 156Provisions – non-current 61 356 59 047Accrued salaries, wages and on-costs (Note 21) 13 974 5 141
198 866 139 344
Movements in provisions (other than employee benefits)Restoration costsCarrying amount at beginning of financial year 2 862 2 020Additional provisions recognised 6 034 1 000Amounts used (715) 0Unused amounts reversed (491) (158)Unwinding / change in the discount rate 0 0Carrying amount at end of financial year 7 690 2 862
DividendsCarrying amount at beginning of financial year 0 0Additional provisions recognised 1 053 0Amounts used 0 0Unused amounts reversed 0 0Unwinding / change in the discount rate 0 0Carrying amount at end of financial year 1 053 0
Aboriginal Land Council ClaimsCarrying amount at beginning of financial year 0 0Additional provisions recognised 734 0Amounts used (5 559) 0Unwinding / change in the discount rate 373 0Administrative Restructures Transfers in from LPMA 635 406 0Carrying amount at end of financial year 630 954 0
23(a). CURRENT/NON-CURRENT LIABILITIES – PROVISIONS (continued)

312 FINANCIAL STATEMENTS NSW TRADE & INVESTMENT ANNUAL REPORT 2010 -11
FINANCIAL STATEMENTS - NSW TRADE & INVESTMENT
23(b). EMPLOYEE BENEFITS JUNE 2011Accounting policyActuarial gains and losses are recognised immediately in other comprehensive income in the year in which they occur.
Fund informationThe Pooled Fund holds in trust the investments of the closed NSW public sector superannuation schemes:
State Authorities Superannuation Scheme (SASS)
State Superannuation Scheme (SSS)
Police Superannuation Scheme (PSS)
State Authorities Non-contributory Superannuation Scheme (SANCS)
These schemes are all defined benefit schemes – at least a component of the final benefit is derived from a multiple of member salary and years of membership.
All the schemes are closed to new members.
Based on the 12 month Pillar Statements.
The Department has a $1.9 million prepayment for the employer’s obligation to defined benefits superannuation schemes at the Sydney Opera House Trust (refer Note 12).
The net actuarial loss on $0.106 million and the superannuation revenue of $0.506 million have been recognised in NSW Trade & Investment due to restructures and transfers from LPMA and Communities NSW.
Financial Year to June 2011
Reconciliation of the present value of the defined benefit obligation
Financial Year to June 2011 SASS$000
SANCS$000
SSS$000
Total$000
Present value of partly funded defined benefit obligations at beginning of year
39 544 9 302 249 083 297 929
Current service cost 1 137 416 735 2 288Interest cost 1 976 453 12 561 14 990Contributions by fund participants 655 0 1 117 1 772Actuarial (gains)/losses 833 23 (5 601) (4 745)Benefits paid (3 578) (1 264) (10 802) (15 644)Past service cost 0 0 0 0Curtailments 0 0 0 0Settlements 0 0 0 0Business Combinations 0 0 0 0Exchange rate changes 0 0 0 0Present value of partly funded defined benefit obligations at end of the year
40 567 8 930 247 093 296 590
Financial Year to June 2010 SASS$000
SANCS$000
SSS$000
Total$000
Present value of partly funded defined benefit obligations at beginning of year
32 072 6 306 178 758 217 136
Current service cost 910 302 855 2 067Interest cost 1 744 338 9 743 11 825Contributions by fund participants 550 0 808 1 358Actuarial (gains)/losses 1 462 517 12 090 14 069Benefits paid (3 575) (1 218) (8 350) (13 143)Past service cost 0 0 0 0Curtailments 0 0 0 0Settlements 0 0 0 0Business Combinations 0 0 0 0Exchange rate changes 0 0 0 0Present value of partly funded defined benefit obligations at end of the year
33 163 6 245 193 904 233 312

313NSW TRADE & INVESTMENT ANNUAL REPORT 2010 -11 FINANCIAL STATEMENTS
FINANCIAL STATEMENTS - NSW TRADE & INVESTMENT
Reconciliation of the fair value of Fund assets
Financial Year to June 2011 SASS$000
SANCS$000
SSS$000
Total$000
Fair value of Fund assets at beginning of year 37 902 8 712 196 095 242 709Expected return on fund assets 3 191 719 16 407 20 317Actuarial gains/(losses) (308) (10) (387) (705)Employer contributions 972 345 1 406 2 723Contributions by Fund participants 655 0 1 117 1 772Benefits paid (3 578) (1 264) (10 802) (15 644)Settlements 0 0 0 0Business Combinations 0 0 0 0Exchange rate changes 0 0 0 0Fair value of Fund assets at end of the year 38 834 8 502 203 836 251 172
Financial Year to June 2010 SASS$000
SANCS$000
SSS$000
Total$000
Fair value of Fund assets at beginning of year 31 465 6 288 132 074 169 827Expected return on fund assets 2 675 532 11 031 14 238Actuarial gains/(losses) (743) 23 473 (247)Employer contributions 1 030 316 1 377 2 723Contributions by Fund participants 550 0 808 1 358Benefits paid (3 575) (1 218) (8 350) (13 143)Settlements 0 0 0 0Business Combinations 0 0 0 0Exchange rate changes 0 0 0 0Fair value of Fund assets at end of the year 31 402 5 941 137 413 174 756
Reconciliation of the assets and liabilities recognised in the statement of financial position
Financial Year to June 2011 SASS$000
SANCS$000
SSS$000
Total$000
Present value of partly funded defined benefit obligations at end of year 40 567 8 930 247 093 296 590Fair value of fund assets at end of year (38 834) (8 502) (203 836) (251 172)Subtotal 1 733 428 43 257 45 418Unrecognised past service cost 0 0 0 0Unrecognised gain/(loss) 0 0 0 0Adjustment for limitation on net asset 80 53 11 979 12 112Net Liability / (Asset) recognised in statement of financial position at end of year
1 813 481 55 236 57 530
Financial Year to June 2010 SASS$000
SANCS$000
SSS$000
Total$000
Present value of partly funded defined benefit obligations at end of year 33 163 6 245 193 904 233 312Fair value of fund assets at end of year (31 402) (5 941) (137 414) (174 757)Subtotal 1 761 304 56 490 58 555Unrecognised past service cost 0 0 0 0Unrecognised gain/(loss) 0 0 0 0Adjustment for limitation on net asset 0 0 0 0Net Liability / (Asset) recognised in statement of financial position at end of year
1 761 304 56 490 58 555
23(b). EMPLOYEE BENEFITS JUNE 2011 (continued)

314 FINANCIAL STATEMENTS NSW TRADE & INVESTMENT ANNUAL REPORT 2010 -11
FINANCIAL STATEMENTS - NSW TRADE & INVESTMENT
Expense recognised in income statement
Financial Year to June 2011 SASS$000
SANCS$000
SSS$000
Total$000
Components Recognised in Income StatementCurrent service cost 1 137 415 735 2 287Interest cost 1 976 453 12 561 14 990Expected return on Fund assets (net of expenses) (3 191) (719) (16 407) (20 317)Actuarial losses / (gains) recognised in year 0 0 0 0Past service cost 0 0 0 0Movement in adjustment for limitation on net asset 0 0 0 0Curtailment or settlement (gain)/loss 0 0 0 0Expense / (income) recognised (78) 149 (3 111) (3 040)
Financial Year to June 2010 SASS$000
SANCS$000
SSS$000
Total$000
Components Recognised in Income StatementCurrent service cost 910 302 855 2 067Interest cost 1 744 338 9 743 11 825Expected return on Fund assets (net of expenses) (2 675) (532) (10 819) (14 026)Actuarial losses / (gains) recognised in year 0 0 0 0Past service cost 0 0 0 0Movement in adjustment for limitation on net asset 0 0 0 0Curtailment or settlement (gain)/loss 0 0 0 0Expense / (income) recognised (21) 108 (221) (134)
Amounts recognised in other comprehensive income
Financial Year to June 2011 SASS$000
SANCS$000
SSS$000
Total$000
Actuarial (gains) / losses 1 141 33 (5 205) (4 031)Adjustment for limit on net assets (16) (35) 2 641 2 590
1 125 (2) (2 564) (1 441)
Financial Year to June 2010 SASS$000
SANCS$000
SSS$000
Total$000
Actuarial (gains) / losses 2 203 494 12 328 15 025Adjustment for limit on net assets 0 0 0 0
2 203 494 12 328 15 025
Fund assetsThe percentage invested in each asset class at the balance sheet date
30 Jun 11 30 Jun 10Australian equities 33.4% 31.0%Overseas equities 29.5% 26.8%Australian fixed interest securities 5.7% 6.1%Overseas fixed interest securities 3.1% 4.3%Property 9.9% 9.5%Cash 5.1% 9.6%Other 13.3% 12.7%
Fair value of Fund assetsAll Fund assets are invested by STC at arm’s length through independent fund managers.
Expected rate of return on assetsThe expected return on assets assumption is determined by weighing the expected long-term return for each asset class by the target allocation of assets to each class. The returns used for each class are net of investment tax and investment fees.
23(b). EMPLOYEE BENEFITS JUNE 2011 (continued)

315NSW TRADE & INVESTMENT ANNUAL REPORT 2010 -11 FINANCIAL STATEMENTS
FINANCIAL STATEMENTS - NSW TRADE & INVESTMENT
Actual return on Fund Assets
Financial Year to June 2011 SASS$000
SANCS$000
SSS$000
Total$000
Actual return on Fund assets 3 183 709 16 301 20 1933 183 709 16 301 20 193
Financial Year to June 2010 SASS$000
SANCS$000
SSS$000
Total$000
Actual return on Fund assets 2 920 555 11 961 15 4362 920 555 11 961 15 436
Valuation method and principal actuarial assumptions at the balance sheet date(a) Valuation Method
The Projected Unit Credit (PUC) valuation method was used to determine the present value of the defined benefit obligations and the related current service costs. This method sees each period of service as giving rise to an additional unit of benefit entitlement and measures each unit separately to build up the final obligation.
(b) Economic Assumptions
30-Jun-11Salary increase rate (excluding promotional increases) 3.50% paRate of CPI Increase 2.50% paExpected rate of return on assets 8.60% pa Discount rate 5.28% pa
(c) Demographic Assumptions
The demographic assumptions at 30 June 2011 are those that were used in the 2009 triennial actuarial valuation. The triennial review will be available from the NSW Treasury website.
Historical Information
Financial Year to June 2011 SASS$000
SANCS$000
SSS$000
Total$000
Present value of defined benefit obligation 40 565 8 928 247 094 296 587Fair value of Fund assets (38 832) (8 503) (203 827) (251 162)(Surplus) / Deficit in Fund 1 733 425 43 267 45 425Experience adjustments – Fund liabilities 833 23 (5 601) (4 745)Experience adjustments – Fund assets 308 10 397 715
Financial Year to June 2010 SASS$000
SANCS$000
SSS$000
Total$000
Present value of defined benefit obligation 33 165 6 246 193 906 233 317Fair value of Fund assets (31 404) (5 941) (136 702) (174 047)(Surplus) / Deficit in Fund 1 761 305 57 204 59 270Experience adjustments – Fund liabilities 1 462 517 12 090 14 069Experience adjustments – Fund assets 743 (23) (473) 247
Expected contributions
Financial Year to June 2011 SASS$000
SANCS$000
SSS$000
Total$000
Expected employer contributions to be paid in the next reporting period 1 015 372 1 569 2 956
1 015 372 1 569 2 956
23(b). EMPLOYEE BENEFITS JUNE 2011 (continued)

316 FINANCIAL STATEMENTS NSW TRADE & INVESTMENT ANNUAL REPORT 2010 -11
FINANCIAL STATEMENTS - NSW TRADE & INVESTMENT
Financial Year to June 2010 SASS$000
SANCS$000
SSS$000
Total$000
Expected employer contributions to be paid in the next reporting period
1 051 337 1 376 2 764
1 051 337 1 376 2 764
Funding Arrangements for Employer Contributions
(a) Surplus / (deficit)The following is a summary of the 30 June financial position of the Fund calculated in accordance with AAS 25 “Financial Reporting by Superannuation Plan”.
Financial Year to June 2011 SASS$000
SANCS$000
SSS$000
Total$000
Accrued benefits 36 983 8 216 181 411 226 610Net market value of Fund assets (38 834) (8 502) (203 836) (251 172)Net (Surplus) / Deficit (1 851) (286) (22 425) (24 562)
Financial Year to June 2010 SASS$000
SANCS$000
SSS$000
Total$000
Accrued benefits 29 807 5 670 140 250 175 727Net market value of Fund assets (31 402) (5 941) (137 413) (174 756)Net (Surplus) / Deficit (1 595) (271) 2 837 971
(b) Contribution recommendationsRecommended contribution rates for the entity are:
SASS SANCS SSSMultiple of members
contributions% member salary Multiple of members
contributions1.90 2.50 1.60
(c) Funding MethodContribution rates are set after discussions between the employer, STC and NSW Treasury.
(d) Economic AssumptionsThe economic assumptions adopted for the 2009 actuarial review of the Fund are:
Weighted-Average Assumptions 30 Jun 11 30 Jun 10Expected salary increase rate 4.0% pa 4.0% paExpected rate of CPI Increase 2.5% pa 2.5% paExpected rate of return on Fund assets backing current pension liabilities 8.3% pa 8.3% paExpected rate of return on Fund assets backing other liabilities 7.3% pa 5.59% pa
Nature of Asset/LiabilityIf a surplus exists in the employer’s interest in the Fund, the employer may be able to take advantage of it in the form of a reduction in the required contribution rate, depending on the advice of the Fund’s actuary.
Where a deficiency exists, the employer is responsible for any difference between the employer’s share of Fund assets and the defined benefit obligation.
23(b). EMPLOYEE BENEFITS JUNE 2011 (continued)

317NSW TRADE & INVESTMENT ANNUAL REPORT 2010 -11 FINANCIAL STATEMENTS
FINANCIAL STATEMENTS - NSW TRADE & INVESTMENT
24. CURRENT/NON-CURRENT LIABILITIES - OTHER
2011$000
2010$000
CURRENTLiability to Consolidated Fund (see also note 7) 18 478 23 852Lease Incentive 167 167Other 960 1Total current liabilities - other 19 605 24 020
NON-CURRENTLease Incentive 11 338 138
11 338 138
25. COMMITMENTS FOR EXPENDITURE
2011$000
2010$000
(a) Capital CommitmentsCapital
Aggregate capital expenditure for acquisition contracted for at balance date but not provided for:Not later than one year 5 630 41 228Later than one year and not later than five years 0 1 278Later than five years 0 0Total (including GST) 5 630 42 506
Aggregate capital expenditure for the acquisition of contracted for at balance date but not provided for:Not later than one yearLater than one year and not later than five years 0 0Later than five years 0 0Total (including GST) 0 0
Aggregate capital expenditure for the acquisition of contracted for at balance date but not provided for:Not later than one year 0 0Later than one year and not later than five years 0 0Later than five years 0 0Total (including GST) 0 0
(b) Other Expenditure CommitmentsAggregate other expenditure for the acquisition of goods and services contracted for at balance date but not provided for:Not later than one year 31 572 16 020Later than one year and not later than five years 0 7 574Later than five years 0 0Total (including GST) 31 572 23 594
(c) Operating Lease CommitmentsOther CommitmentsFuture non-cancellable operating lease rentals not provided for and payable:Not later than one year 20 948 19 682Later than one year and not later than five years 18 507 15 869Later than five years 1 078 1 392Total (including GST) 40 533 36 943Representing:Non-cancellable operating leases 40 533 36 943
Head Office and Maitland Buildings Future non-cancellable operating lease rentals not provided for and payable:Not later than one year 7 399 6 801

318 FINANCIAL STATEMENTS NSW TRADE & INVESTMENT ANNUAL REPORT 2010 -11
FINANCIAL STATEMENTS - NSW TRADE & INVESTMENT
2011$000
2010$000
Later than one year and not later than five years 26 297 28 742Later than five years 26 968 40 044Total (including GST) 60 664 75 587Representing:Non-cancellable operating leases 60 644 75 587
Operating Leases predominantly comprise office accommodation, computer equipment and motor vehicles. Some contingent rental payments are arrived at by increasing the base rental by the annual CPI. Other lease agreements, approximately 50% which do not include annual CPI increments, have annual set increases detailed in the lease agreements. Lease renewal options for office accommodation exist in the large majority of cases. There are no renewal or purchase options for motor vehicles or computer equipment, except by negotiation at the end of the lease term. This usually does not occur.
2011$000
2010$000
(d) Grants and Subsidies CommitmentsNot later than one year 82 387 74 420Later than one year and not later than five years 76 370 98 701Later than five years 6 875 2 750Total (Including GST) 165 632 175 871
The total commitments include input tax credits of $27.6399m that are expected to be recoverable from the Australian Taxation Office.
26. CONTINGENT LIABILITIES
2011$000
2010$000
Negligence (1) 520 0Contamination (1) 988 0Minerals and mine safety 0 26Appeals (1) 810 187Disputed fish seizure 0 137Compulsory acquisition (2) 2 000 0Underwriting (3) 1 020 0Disputed legislation (1) 79 70
5 417 420
1. Various legal appeals
2. In March 2004 the Land and Environment Court directed the Minister Assisting the Minister for Natural Resources (Lands) to acquire a parcel of land owned by Nedoni Pty Ltd. The land is located at Byron Bay. It was intended that the Minister for Lands would acquire the parcel of land on behalf of the Crown. The potential liability to LDWA has been estimated at approximately $2 million, being the land value and other costs of acquisition. Due to unresolved issues concerning the amount of land to be acquired, a reliable land valuation estimate cannot be determined at this stage and a liability has therefore not been recognised. Audit Committee to note that Nedoni may have a $2 - $5 million dollar liability of either as approved by Treasury is not in accordance with the Supreme Court decision that the Minister has to acquire land for a road.
3. PRMF has a contingent liability in respect of an underwriting it has provided to Lands Administration Ministerial Corporation (LAMC) for a $1,020,031.78 receivable LAMC had from Burrendong State Park. Burrendong State Park has indicated that it would not have capacity to repay the loan to LAMC for a number of years. At year end it was not possible to determine what portion of the loan Burrendong State Park would not be able to repay.
4. Liabilities to remediate contamination on Crown Lands may exist but are not considered to be presently quantifiable. Further Crown Lands may be subject to contamination but have not been fully assessed and may not be able to be economically viable to assess.
NSW Trade & Investment is insured by the Treasury Managed Fund.
25. COMMITMENTS FOR EXPENDITURE (continued)
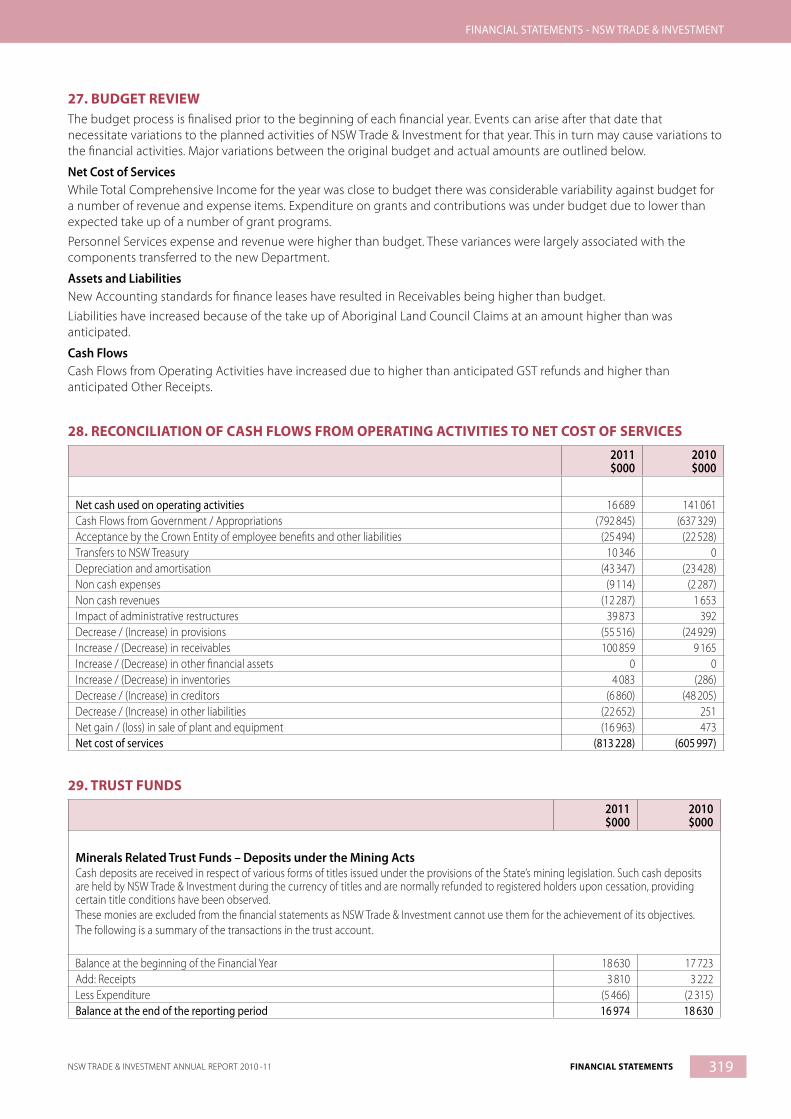
319NSW TRADE & INVESTMENT ANNUAL REPORT 2010 -11 FINANCIAL STATEMENTS
FINANCIAL STATEMENTS - NSW TRADE & INVESTMENT
27. BUDGET REVIEWThe budget process is finalised prior to the beginning of each financial year. Events can arise after that date that necessitate variations to the planned activities of NSW Trade & Investment for that year. This in turn may cause variations to the financial activities. Major variations between the original budget and actual amounts are outlined below.
Net Cost of ServicesWhile Total Comprehensive Income for the year was close to budget there was considerable variability against budget for a number of revenue and expense items. Expenditure on grants and contributions was under budget due to lower than expected take up of a number of grant programs.
Personnel Services expense and revenue were higher than budget. These variances were largely associated with the components transferred to the new Department.
Assets and LiabilitiesNew Accounting standards for finance leases have resulted in Receivables being higher than budget.
Liabilities have increased because of the take up of Aboriginal Land Council Claims at an amount higher than was anticipated.
Cash FlowsCash Flows from Operating Activities have increased due to higher than anticipated GST refunds and higher than anticipated Other Receipts.
28. RECONCILIATION OF CASH FLOWS FROM OPERATING ACTIVITIES TO NET COST OF SERVICES
2011$000
2010$000
Net cash used on operating activities 16 689 141 061Cash Flows from Government / Appropriations (792 845) (637 329)Acceptance by the Crown Entity of employee benefits and other liabilities (25 494) (22 528)Transfers to NSW Treasury 10 346 0Depreciation and amortisation (43 347) (23 428)Non cash expenses (9 114) (2 287)Non cash revenues (12 287) 1 653Impact of administrative restructures 39 873 392Decrease / (Increase) in provisions (55 516) (24 929)Increase / (Decrease) in receivables 100 859 9 165Increase / (Decrease) in other financial assets 0 0Increase / (Decrease) in inventories 4 083 (286)Decrease / (Increase) in creditors (6 860) (48 205)Decrease / (Increase) in other liabilities (22 652) 251Net gain / (loss) in sale of plant and equipment (16 963) 473Net cost of services (813 228) (605 997)
29. TRUST FUNDS
2011$000
2010$000
Minerals Related Trust Funds – Deposits under the Mining ActsCash deposits are received in respect of various forms of titles issued under the provisions of the State’s mining legislation. Such cash deposits are held by NSW Trade & Investment during the currency of titles and are normally refunded to registered holders upon cessation, providing certain title conditions have been observed.These monies are excluded from the financial statements as NSW Trade & Investment cannot use them for the achievement of its objectives.The following is a summary of the transactions in the trust account.
Balance at the beginning of the Financial Year 18 630 17 723Add: Receipts 3 810 3 222Less Expenditure (5 466) (2 315)Balance at the end of the reporting period 16 974 18 630

320 FINANCIAL STATEMENTS NSW TRADE & INVESTMENT ANNUAL REPORT 2010 -11
FINANCIAL STATEMENTS - NSW TRADE & INVESTMENT
30. FISHERIES MANAGEMENT ACT – SPECIAL FISHERIES TRUST FUNDS
2011$000
2010$000
Amendments to the Fisheries Management Amendment Act in 1997 and 2000 have provided for the establishment of six special fisheries trust funds. Under NSW Trade & Investment’s accounting structure, all revenue paid into these trust funds and any expenditure there from is included in NSW Trade & Investment’s Financial Statements. While a separate bank account for each of these trusts is not kept, NSW Trade & Investment maintains separate projects.A summary of the accrual transactions relating to these special fisheries trust funds is outlined in the following table.The ‘balance’ of each of these special fisheries trust funds comprises cash and receivables.
Recreational Fishing (Freshwater) Trust FundBalance at the beginning of the Financial Year 235 716Add: Revenue Sale of goods and services 0 0 Investment income 11 19 Transfer from Saltwater Trust 4 000 3 002 Grants and contributions 0 0Sub total 4 011 3 021
Less: Projects Funded* (3 964) (3 502)Sub total (3 964) (3 502)
Balance at the end of the reporting period 282 235
* Of the ‘projects funded’ in 2011 and in prior periods, an amount of $21 402 was unexpended at 30 June 2011, (2010 $286 213). This amount will be carried forward into the various approved project budgets for 2011-12.
Recreational Fishing (Saltwater) Trust FundBalance at the beginning of the Financial Year 6 252 6 121Add: Revenue Sale of goods and services 1 44 Investment income 367 260 Grants and contributions 0 0 Retained fees, grants and contributions 12 493 13 255Sub total 12 861 13 559
Less: Projects Funded* (8 039) (8 461) Transfer to Freshwater Trust (4 000) (3 000) Loan repayment transfer (1 965) (1 967) Other 0 0Sub total (14 004) (13 428)Balance at the end of the reporting period 5 109 6 252
* Of the ‘projects funded’ in 2011 and in prior periods, an amount of $1 867 385 was unexpended at 30 June 2011, (2010 $2 271 790). This amount will be carried forward into the various approved project budgets for 2011-12.Commercial Fishing Trust FundBalance at the beginning of the Financial Year 5 488 4 788Add: Revenue Sale of goods and services 2 648 3 267 Investment income 269 219Sub total 2 917 3 486
Less: Projects Funded* (2 841) (358)Less: Contribution to NSW Trade & Investment activities* (204) (2 428)Sub total (3 045) (2 786)
Balance at the end of the reporting period 5 360 5 488
* Of the ‘projects funded’ in 2011 and in prior periods, an amount of $224 687 was unexpended at 30 June 2011, (2010 $351 992). This amount will be carried forward into the various approved project budgets for 2011-12.

321NSW TRADE & INVESTMENT ANNUAL REPORT 2010 -11 FINANCIAL STATEMENTS
FINANCIAL STATEMENTS - NSW TRADE & INVESTMENT
2011$000
2010$000
Fish Conservation Trust FundBalance at the beginning of the Financial Year 56 15Add: Revenue Sale of goods and services 134 220 Investment income* 3 4Sub total 137 224
Less: Projects Funded* (184) (183)Sub total (184) (183)Balance at the end of the reporting period 9 56
* Of the ‘projects funded’ in 2011 and in prior periods, an amount of $198 319 was unexpended at 30 June 2011, (2010 $195 999). This amount will be carried forward into the various approved project budgets for 20011-12.
Aquaculture Trust FundBalance at the beginning of the Financial Year 302 193Add: Revenue Sale of goods and services 321 354 Investment income 35 19 Grants and contributions 212 211Sub total 568 584
Less: Contribution to NSW Trade & Investment activities* 0 (471) Other (Bad debts expense) (2) (4)Sub total (2) (475)
Balance at the end of the reporting period 868 302
* Of the ‘projects funded’ in 2011 and in prior periods, an amount of $312 643 was overexpended at 30 June 2011, (2010 $131 961). This amount will be carried forward into the various approved project budgets for 2011-12.
Charter Fishing Trust FundBalance at the beginning of the Financial Year 334 313Add: Revenue Sale of goods and services 190 197 Investment income 19 13Sub total 209 210
Less: Projects Funded* (214) (189)Sub total (214) (189)
Balance at the end of the reporting period 329 334
* Of the ‘projects funded’ in 2011 and in prior periods, an amount of $54 012 was unexpended at 30 June 2011, (2010 $23 739). This amount will be carried forward into the various approved project budgets for 2011-12.
30. FISHERIES MANAGEMENT ACT – SPECIAL FISHERIES TRUST FUNDS (continued)

322 FINANCIAL STATEMENTS NSW TRADE & INVESTMENT ANNUAL REPORT 2010 -11
FINANCIAL STATEMENTS - NSW TRADE & INVESTMENT
31. ADMINISTERED ASSETS AND LIABILITIES
Mining Royalties and Exploration Licences
NSW Trade & Investment administers certain activities on behalf of other bodies. The assets and liabilities associated with these activities are listed below:
2011$000
2010$000
Administered AssetsReceivables – Royalties/Mining lease Less Provision for Doubtful Debts
1 111(926)
2 272(926)
185 1 346Administered LiabilitiesCurrentPayables – Royalties 186 4 244Income received in Advance, Caroona and WatermarkNon CurrentIncome received in Advance, Caroona and Watermark
79 355
152 811
70 653
132 499232 352 207 396
Retail Tenancy Trust Fund for the period April to June 2011Under the administrative restructure the Retail Tenancy Trust Fund was transferred to NSW Trade & Investment. NSW Trade & Investment holds money in the Retail Leases Security Bonds Trust and Interest Accounts with NSW Treasury Corporation. Retail lease Security Bonds are lodged with the Director-General in accordance with Section 16C of the Retail leases Act 1994. These monies are excluded from the financial statements of NSW Trade & Investment as NSW Trade & Investment cannot use them for the achievement of its objectives other than the recovery of expenses relating to administration of the Retail Leases Act. The following is a summary of the transactions in the trust account for the period April to June 2011.
Interest Account
Trust Account Total
$000 $000 $000Cash Balance at 4 April 2011 transferred in 7 893 117 638 125 531Add: Bonds Lodgements 0 8 147 8 147 Interest Revenue 1 649 0 1 649Less: Bonds Released 0 6 527 6 527 Transfer to NSW Treasury Consolidated Fund 0 0 0 Transfer to Department to administer Retail Leases Act 1994 157 0 157Balance at 30 June 2011 9 385 119 258 128 643
Liquor, Gaming and RacingUnder the administrative restructure the NSW Office of Liquor, Gaming and Racing was transferred to NSW Trade & Investment. Amounts in relation to Local Court Fees and Fines remained uncollected at year end.
2011$000
Receivables – Fees and fines 336Balance at 30 June 2011 336

323NSW TRADE & INVESTMENT ANNUAL REPORT 2010 -11 FINANCIAL STATEMENTS
FINANCIAL STATEMENTS - NSW TRADE & INVESTMENT
32. ADMINISTERED EXPENSES & INCOMEEXPENSESNSW Cellar Pool Subsidy SchemeDuring the period April to June $0.959 million was paid by the NSW Office of Liquor, Gaming and Racing on behalf of Treasury to suppliers and producers in response to their claims for this liquor subsidy.
INCOME
2011$000
2010$000
The following monies have been collected on behalf of the Crown Entity and forwarded to NSW Treasury:Fees 5 717 4 995Fines 142 393Licences 791 864Unclaimed monies 17 30Exploration licences 85 986 74 328Royalty on Minerals 1 243 715 989 418
1 336 368 1 070 028
33. JOINT VENTURESIn July 2001, the Treasurer of NSW granted approval for the former Department of Mineral resources to enter into a joint venture with the Commonwealth and nine other participants, entitled the Cooperative Research Centre for Landscape Environments and Mineral Exploration (CRC LEME).
The joint venture is a non commercial, non profit entity established to conduct strategic research, education and training in regolith geoscience and its applications in mineral exploration and environmental issues.
There are no assets arising from NSW Trade & Investment’s participation in the joint venture or any liabilities arising from its interest in the joint venture. NSW Trade & Investment does not have a percentage share in the output or assets of the joint venture and no revenue is probable.
NSW Trade & Investment is also engaged with several other joint ventures. These include the Australian Cotton Co-Operative Research Centre, The Australian Sheep Industry Co-Operative Research Centre, the Co-Operative Research Centre for Plant Based Dryland Salinity, and the Quality Wheat Co-Operative Research Centre.
As at the financial year ended 30 June 2011, NSW Trade & Investment had an interest in the following joint ventures:
• 50% share in the joint venture entity Dumaresq-Barwon border Rivers Commission
• 26.67% ownership interest in the jointly controlled assets of the Living Murray initiative and the River Murray Operations. These assets are administered by the Murray-Darling Basin Authority.
(a) ACCOUNTING FOR SHARE OF JOINTLY CONTROLLED ASSETS IN JOINT VENTURESReconciliation of movement in share of jointly controlled assets in joint venturesThe movement in NSW Trade & Investment’s share of the jointly controlled assets of the Living Murray Initiative and the River Murray Operations during the financial year is detailed below:
Property, plant and equipmentLand and Buildings
Plant and Equipment
Infrastructure systems Total
$000 $000 $000 $000Share of jointly controlled assts at beginning of the year 1 956 2 263 539 095 543 314
Share of additions recognised 0 728 18 965 19 693Share of disposals 0 (300) (41) (341)
0 428 18 924 19 352Depreciation expense 0 (247) (7 285) (7 532)Impairment 0 0 0 0Share of net revaluation increment / (decrement) 0 0 10 952 10 952Share of net carrying amount at year end 1 956 2 444 561 686 566 086

324 FINANCIAL STATEMENTS NSW TRADE & INVESTMENT ANNUAL REPORT 2010 -11
FINANCIAL STATEMENTS - NSW TRADE & INVESTMENT
33. JOINT VENTURES (continued)
Intangibles ASSETSWater
EntitlementsFlooding
Easements Total TOTAL$000 $000 $000 $000
Share of jointly controlled assts at beginning of the year 123 773 1 085 124 858 668 172Share of additions recognised 50 519 0 50 519 70 212Share of disposals 0 0 0 (341)
50 159 0 50 519 69 871Depreciation expense 0 0 0 (7 532)Impairment (46 236) 0 (46 236) (46 236)Share of net revaluation increment / (decrement) 0 0 0 10 952Share of net carrying amount at year end 128 056 1 085 129 141 695 227
The above disclosures are based upon the audited special purpose financial statements of the Living Murray Initiative and the River Murray Operations joint ventures for the full financial year ended 30 June 2011. Opening balances for 1 April / 4 April are not available to NSW Trade & Investment.NSW Trade & Investment’s share in Joint Venture assets is included in Non-current Assets – Property Plant and Equipment – Note 15 and Intangible Assets – Note 16
(b) INVESTMENTS ACCOUNTED FOR UNDER THE EQUITY METHOD
2011$000
Share of operating result of joint ventures accounted for under the equity methodDumaresq – Barwon Border Rivers Commission (1 606)
(1 606)
Non-current Investments accounted for under the equity methodDumaresq – Barwon Border Rivers Commission 70 980
70 980
Joint venture entity: Dumaresq – Barwon Border Rivers Commission 70 980
The Dumaresq-Barwon Border Rivers Commission is established by the New South Wales – Queensland Border Rivers Agreement and is responsible for sharing the waters of the rivers and streams which either form or intersect the boundary between the two States and the associated groundwater resources. The Commission undertakes the investigation, construction and operation of works to conserve and regulate those waters where considered desirable.
2011Ownership Interest 50%Dumaresq – Barwon Border Rivers Commission reporting date 30 June
2011$000
Net assets audited 141 960
Summarised financial information as at 30 June 2011
Statement of Financial Position 2011$000
ASSETS Current assets Cash and cash equivalents 3 284 Receivables 67 Non-current assets Property, plant and equipment 138 957Total assets 142 308

325NSW TRADE & INVESTMENT ANNUAL REPORT 2010 -11 FINANCIAL STATEMENTS
FINANCIAL STATEMENTS - NSW TRADE & INVESTMENT
LIABILITIES Current liabilities Payables 348Total liabilities 348
Net Assets 141 960
Statement of Comprehensive Income 2011$000
Revenues 2 444 Expenses (3 456) Loss on disposal 0Loss for the year (1 012)
Aggregate asset revaluation increment for the financial year 70 537
Share of operating loss (506)Prior period error adjustment 0Contribution for the financial year (1 100)Share of operating result (1 606)
34. FINANCIAL INSTRUMENTSNSW Trade & Investment’s principal financial instruments are outlined below. These financial instruments arise directly from NSW Trade & Investment’s operations or are required to finance NSW Trade & Investment’s operations. NSW Trade & Investment does not enter into or trade financial instruments, including derivative financial instruments, for speculative purposes.NSW Trade & Investment’s main risks arising from financial instruments are outlined below, together with NSW Trade & Investment’s objectives, policies and processes for measuring and managing risk. Further quantitative and qualitative disclosures are included throughout these financial statements.The Director General has overall responsibility for the establishment and oversight of risk management and reviews and agrees policies for managing each of these risks. Risk management policies are established to identify and analyse the risks faced by NSW Trade & Investment, to set risk limits and controls and to monitor risks. Compliance with policies is reviewed by the audit committee on a continuous basis.
(a) Financial instrument categories
Financial Assets
Class:
Note Category Carrying Amount
2011$’000
Carrying Amount
2010$’000
Cash and cash equivalents 11 N/A 281 482 169 375Receivables1 12 Loans and receivables (at amortised cost) 323 519 109 275Financial Assets at fair value 14 At fair value through profit or loss - designated as
such upon initial recognition4 124 4 410
Other Financial Assets 17 Loans and receivables (at amortised cost) 28 750 6 845637 875 289 905
Financial Liabilities
Class:
Note Category Carrying Amount
2011$’000
Carrying Amount
2010$’000
Payables2 21 Financial liabilities measured at amortised cost 83 269 77 561Borrowings 22 Financial liabilities measured at amortised cost 20 156 19 675Other3 24 Financial liabilities measured at amortised cost 12 465 306
115 890 97 542
Notes1. Excludes statutory receivables and prepayments (i.e. not within scope of AASB 7).2. Excludes statutory payables and unearned revenue (i.e. not within scope of AASB 7).3. Excludes Liability to Consolidated Fund.
33. JOINT VENTURES (continued)

326 FINANCIAL STATEMENTS NSW TRADE & INVESTMENT ANNUAL REPORT 2010 -11
FINANCIAL STATEMENTS - NSW TRADE & INVESTMENT
(b) Credit RiskCredit risk arises when there is the possibility of NSW Trade & Investment’s debtors defaulting on their contractual obligations, resulting in a financial loss to NSW Trade & Investment. The maximum exposure to credit risk is generally represented by the carrying amount of the financial assets (net of any allowance for impairment).
Credit risk arises from the financial assets of NSW Trade & Investment, including cash, receivables, authority deposits and advances receivable. No collateral is held by NSW Trade & Investment. NSW Trade & Investment has not granted any financial guarantees.
Credit risk associated with NSW Trade & Investment’s financial assets, other than receivables, is managed through the selection of counterparties and establishment of minimum credit rating standards.
CashCash comprises cash on hand and bank balances within the NSW Treasury Banking System. Interest is earned on daily bank balances at the monthly average NSW Treasury Corporation (TCorp) 11am unofficial cash rate, adjusted for a management fee to NSW Treasury.
Receivables – trade debtorsAll trade debtors are recognised as amounts at balance date. Collectability of trade debtors is reviewed on an ongoing basis. Procedures as established in the Treasurer’s Directions are followed to recover outstanding amounts, including letters of demand. Debts which are known to be uncollectible are written off. An allowance for impairment is raised when there is objective evidence that the entity will not be able to collect all amounts due. This evidence includes past experience, and current and expected changes in economic conditions and debtor credit ratings. No interest is earned on trade debtors. Sales are made on 30 day terms.
NSW Trade & Investment is not materially exposed to concentrations of credit risk to a single trade debtor or group of debtors. Based on past experience, debtors that are not past due $54 007 (2010: $15 459) and past due $10, 344 (2010: $3, 494) but not considered impaired together represent 98% (2010: 93%) of the total trade debtors. There are no debtors which are currently not past due or impaired whose terms have been renegotiated.
The only financial assets that are past due or impaired are ‘sales of goods and services’ in the ‘receivables’ category of the balance sheet.
Total 1,2
$’000
Past due but not impaired1,2
$’000
Considered impaired1,2
$’0002011< 3 months overdue 8 608 8 608 03 months – 6 months overdue 827 827 0> 6 months overdue 2 109 909 1 2002010< 3 months overdue 2 511 2 511 03 months – 6 months overdue 416 416 0> 6 months overdue 5 254 567 4 687
Notes1. Each column in the table reports “gross receivables”.2. The ageing analysis excludes statutory receivables, as these are not within the scope of AASB 7 and excludes receivables that are not past due
and not impaired. Therefore, the “total” does not reconcile to the receivables total recognised in the statement of financial position.
Authority DepositsNSW Trade & Investment has no funds placed on deposit with TCorp.
Other FacilitiesNSW Trade & Investment has access to the following banking facilities: 2011 2010 $’000 $’000MasterCard Limit 7 000 2 430
(c) Liquidity riskLiquidity risk is the risk that NSW Trade & Investment will be unable to meet its payment obligations when they fall due. NSW Trade & Investment continuously manages risk through monitoring future cash flows and maturities planning to ensure adequate holding of high quality liquid assets. The objective is to maintain a balance between continuity of
34. FINANCIAL INSTRUMENTS (continued)
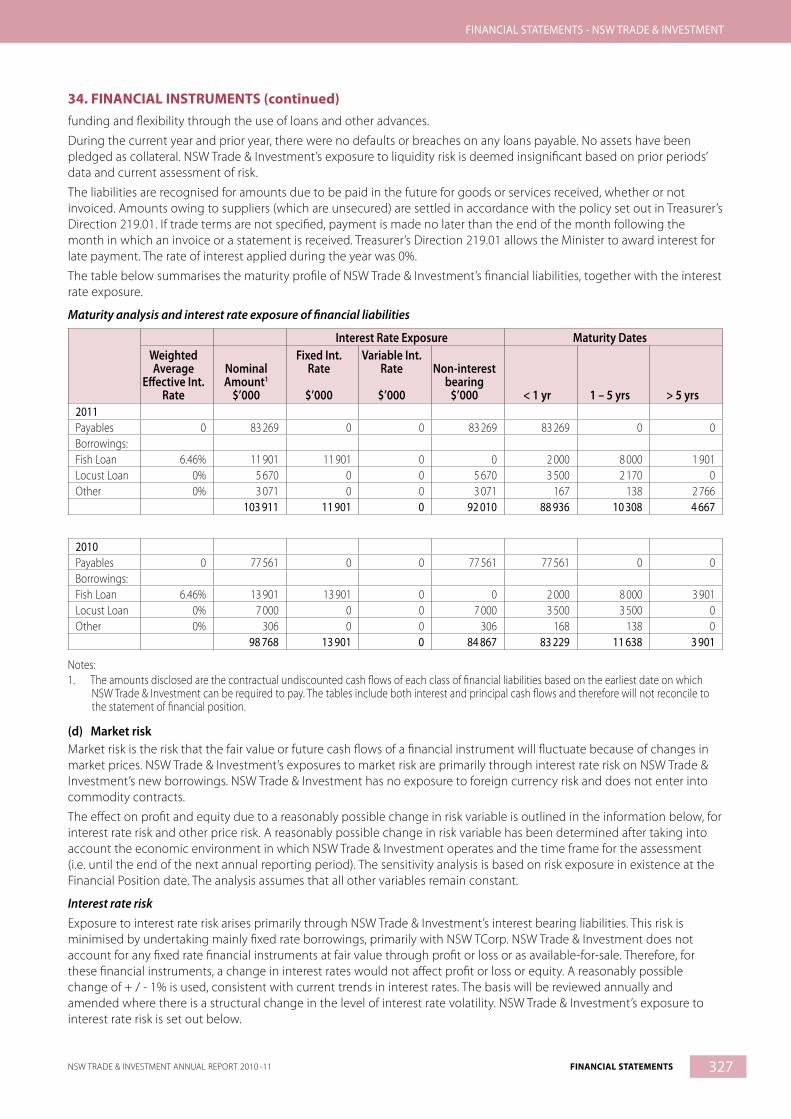
327NSW TRADE & INVESTMENT ANNUAL REPORT 2010 -11 FINANCIAL STATEMENTS
FINANCIAL STATEMENTS - NSW TRADE & INVESTMENT
funding and flexibility through the use of loans and other advances.
During the current year and prior year, there were no defaults or breaches on any loans payable. No assets have been pledged as collateral. NSW Trade & Investment’s exposure to liquidity risk is deemed insignificant based on prior periods’ data and current assessment of risk.
The liabilities are recognised for amounts due to be paid in the future for goods or services received, whether or not invoiced. Amounts owing to suppliers (which are unsecured) are settled in accordance with the policy set out in Treasurer’s Direction 219.01. If trade terms are not specified, payment is made no later than the end of the month following the month in which an invoice or a statement is received. Treasurer’s Direction 219.01 allows the Minister to award interest for late payment. The rate of interest applied during the year was 0%.
The table below summarises the maturity profile of NSW Trade & Investment’s financial liabilities, together with the interest rate exposure.
Maturity analysis and interest rate exposure of financial liabilities
Interest Rate Exposure Maturity DatesWeighted Average
Effective Int. Rate
Nominal Amount1
$’000
Fixed Int. Rate
$’000
Variable Int. Rate
$’000
Non-interest bearing
$’000 < 1 yr 1 – 5 yrs > 5 yrs2011Payables 0 83 269 0 0 83 269 83 269 0 0Borrowings:Fish Loan 6.46% 11 901 11 901 0 0 2 000 8 000 1 901Locust Loan 0% 5 670 0 0 5 670 3 500 2 170 0Other 0% 3 071 0 0 3 071 167 138 2 766
103 911 11 901 0 92 010 88 936 10 308 4 667
2010Payables 0 77 561 0 0 77 561 77 561 0 0Borrowings:Fish Loan 6.46% 13 901 13 901 0 0 2 000 8 000 3 901Locust Loan 0% 7 000 0 0 7 000 3 500 3 500 0Other 0% 306 0 0 306 168 138 0
98 768 13 901 0 84 867 83 229 11 638 3 901
Notes:1. The amounts disclosed are the contractual undiscounted cash flows of each class of financial liabilities based on the earliest date on which
NSW Trade & Investment can be required to pay. The tables include both interest and principal cash flows and therefore will not reconcile to the statement of financial position.
(d) Market riskMarket risk is the risk that the fair value or future cash flows of a financial instrument will fluctuate because of changes in market prices. NSW Trade & Investment’s exposures to market risk are primarily through interest rate risk on NSW Trade & Investment’s new borrowings. NSW Trade & Investment has no exposure to foreign currency risk and does not enter into commodity contracts.
The effect on profit and equity due to a reasonably possible change in risk variable is outlined in the information below, for interest rate risk and other price risk. A reasonably possible change in risk variable has been determined after taking into account the economic environment in which NSW Trade & Investment operates and the time frame for the assessment (i.e. until the end of the next annual reporting period). The sensitivity analysis is based on risk exposure in existence at the Financial Position date. The analysis assumes that all other variables remain constant.
Interest rate riskExposure to interest rate risk arises primarily through NSW Trade & Investment’s interest bearing liabilities. This risk is minimised by undertaking mainly fixed rate borrowings, primarily with NSW TCorp. NSW Trade & Investment does not account for any fixed rate financial instruments at fair value through profit or loss or as available-for-sale. Therefore, for these financial instruments, a change in interest rates would not affect profit or loss or equity. A reasonably possible change of + / - 1% is used, consistent with current trends in interest rates. The basis will be reviewed annually and amended where there is a structural change in the level of interest rate volatility. NSW Trade & Investment’s exposure to interest rate risk is set out below.
34. FINANCIAL INSTRUMENTS (continued)
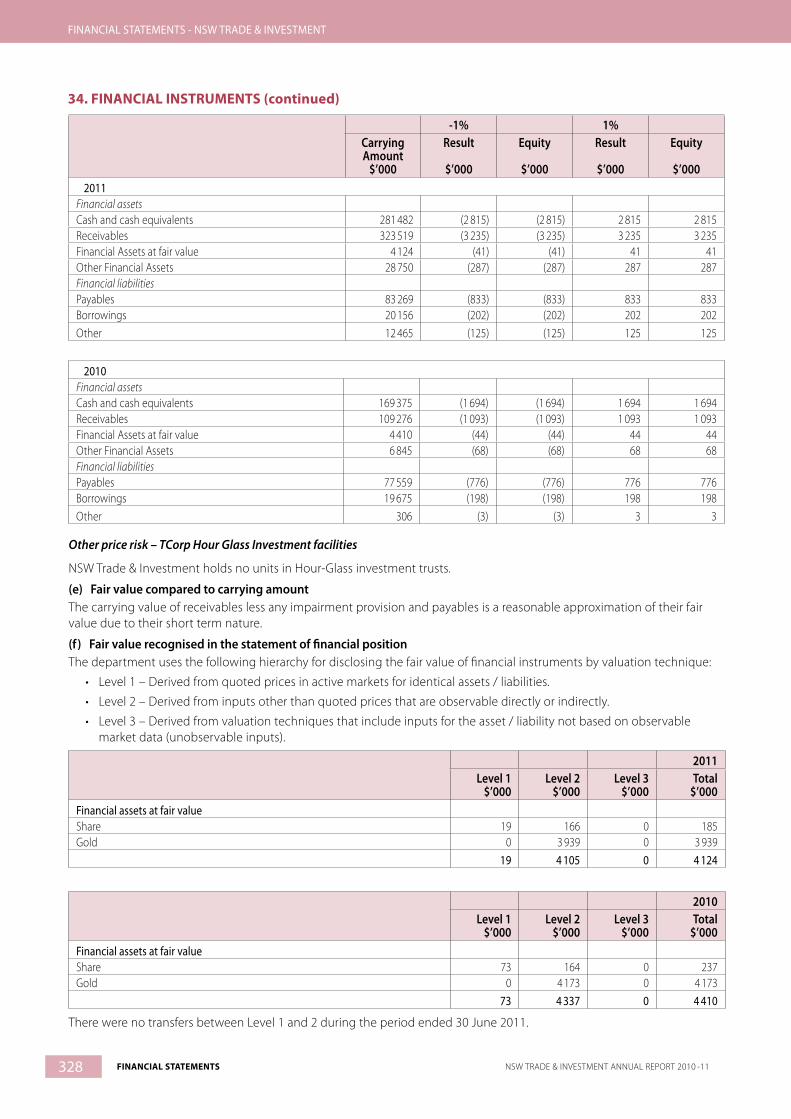
328 FINANCIAL STATEMENTS NSW TRADE & INVESTMENT ANNUAL REPORT 2010 -11
FINANCIAL STATEMENTS - NSW TRADE & INVESTMENT
-1% 1%Carrying Amount
$’000
Result
$’000
Equity
$’000
Result
$’000
Equity
$’0002011
Financial assetsCash and cash equivalents 281 482 (2 815) (2 815) 2 815 2 815Receivables 323 519 (3 235) (3 235) 3 235 3 235Financial Assets at fair value 4 124 (41) (41) 41 41Other Financial Assets 28 750 (287) (287) 287 287Financial liabilitiesPayables 83 269 (833) (833) 833 833Borrowings 20 156 (202) (202) 202 202Other 12 465 (125) (125) 125 125
2010Financial assetsCash and cash equivalents 169 375 (1 694) (1 694) 1 694 1 694Receivables 109 276 (1 093) (1 093) 1 093 1 093Financial Assets at fair value 4 410 (44) (44) 44 44Other Financial Assets 6 845 (68) (68) 68 68Financial liabilitiesPayables 77 559 (776) (776) 776 776Borrowings 19 675 (198) (198) 198 198Other 306 (3) (3) 3 3
Other price risk – TCorp Hour Glass Investment facilities
NSW Trade & Investment holds no units in Hour-Glass investment trusts.
(e) Fair value compared to carrying amountThe carrying value of receivables less any impairment provision and payables is a reasonable approximation of their fair value due to their short term nature.
(f) Fair value recognised in the statement of financial positionThe department uses the following hierarchy for disclosing the fair value of financial instruments by valuation technique:
• Level 1 – Derived from quoted prices in active markets for identical assets / liabilities.
• Level 2 – Derived from inputs other than quoted prices that are observable directly or indirectly.
• Level 3 – Derived from valuation techniques that include inputs for the asset / liability not based on observable market data (unobservable inputs).
2011Level 1
$’000Level 2
$’000Level 3
$’000Total
$’000Financial assets at fair valueShare 19 166 0 185Gold 0 3 939 0 3 939
19 4 105 0 4 124
2010Level 1
$’000Level 2
$’000Level 3
$’000Total
$’000Financial assets at fair valueShare 73 164 0 237Gold 0 4 173 0 4 173
73 4 337 0 4 410
There were no transfers between Level 1 and 2 during the period ended 30 June 2011.
34. FINANCIAL INSTRUMENTS (continued)

329NSW TRADE & INVESTMENT ANNUAL REPORT 2010 -11 FINANCIAL STATEMENTS
FINANCIAL STATEMENTS - NSW TRADE & INVESTMENT
35. Prior Period ErrorsAn over estimation of the amount receivable from another agency in a prior period has been corrected ($3 500 000).
36. Events after reporting period • The Public Sector Employment and Management (Miscellaneous) Order 2011 under the Public Sector Employment and
Management Act 2002 commenced on 1 July 2011.
• The order:
1. established Destination NSW as a Division of the Government Service and transferred staff from the Department of Trade and Investment, Regional Infrastructure and Services principally involved in matters relating to tourism to Destination NSW to enable it to exercise its functions.
2. established the Department of Primary Industries as a separate Departmental Office within the Department of Trade and Investment, Regional Infrastructure and Services, replacing the previous separate Division of the Government Service which had been created on 4 April 2011. Reporting for the Department of Primary Industries has been incorporated within the financial statements of NSW Trade & Investment for 2011.
• Under the Contaminated Land Management Act 1997 a management order for remediation sites at Urunga was issued by the EPA on 16 November 2011. Under the order the Department is required to prepare and implement a remedial action plan for the site in accordance with EPA guidelines. The commencement of the remediation action plan is to occur before 21 January 2013.
End of the audited financial statements.

MINISTERIAL CORPORATION FOR INDUSTRY Financial Statements for the year ended 30 June 2011
Statement by Ministerial Corporation for Industry 331
Independent Auditor’s Report 332
Statement of Comprehensive Income 334
Statement of Financial Position 335
Statement of Changes in Equity 336
Statement of Cash Flows 336
Notes to the financial statements 337
FINANCIAL STATEMENTS NSW TRADE & INVESTMENT ANNUAL REPORT 2010 -11330

331NSW TRADE & INVESTMENT ANNUAL REPORT 2010 -11 FINANCIAL STATEMENTS
FINANCIAL STATEMENTS - MINISTERIAL CORPORATION FOR INDUSTRY

332 FINANCIAL STATEMENTS NSW TRADE & INVESTMENT ANNUAL REPORT 2010 -11
FINANCIAL STATEMENTS - MINISTERIAL CORPORATION FOR INDUSTRY
333NSW TRADE & INVESTMENT ANNUAL REPORT 2010 -11 FINANCIAL STATEMENTS
FINANCIAL STATEMENTS - MINISTERIAL CORPORATION FOR INDUSTRY

334 FINANCIAL STATEMENTS NSW TRADE & INVESTMENT ANNUAL REPORT 2010 -11
FINANCIAL STATEMENTS - MINISTERIAL CORPORATION FOR INDUSTRY
STATEMENT OF COMPREHENSIVE INCOME FOR THE YEAR ENDED 30 JUNE 2011Notes Actual
2011$’000
Budget2011
$’000
Actual2010
$’000Expenses excluding lossesOperating expenses
Other operating expenses 2(a) 13 979 32 362 9 434
Total expenses excluding losses 13 979 32 362 9 434
RevenueInvestment revenue 3(a) 279 - 2
Grants and contributions 3(b) 8 910 32 362 8 553
Other revenue 3(c) - - 108
Total Revenue 9 189 32 362 8 663
Gain / (loss) on disposal 4 (30) - -
Other gains / (losses) 5 30 - (325)
Net Cost of Services 4 790 - 1 096
DEFICIT FOR THE YEAR (4 790) - (1 096)
Other comprehensive incomeNon-current assets held for sale
Valuation gains / (losses) 9 - -
Other comprehensive income for the year 9 - -
TOTAL COMPREHENSIVE INCOME FOR THE YEAR (4 781) - (1 096)
The accompanying notes form part of these financial statements.
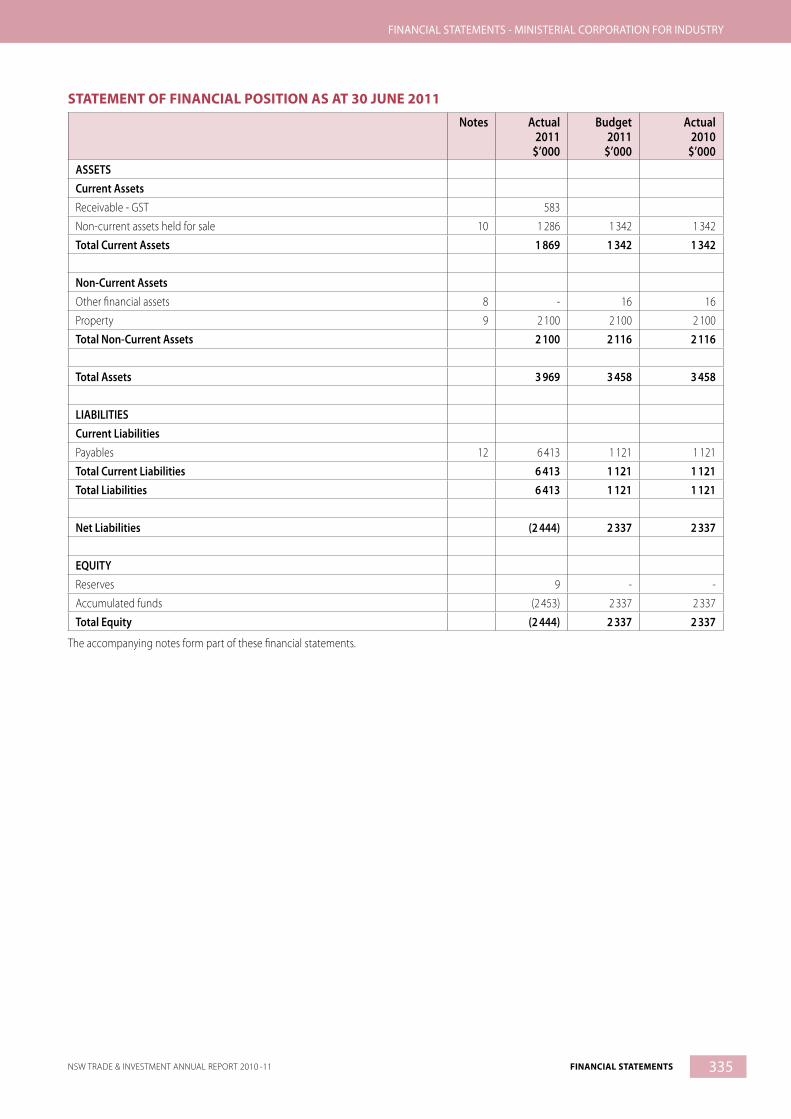
335NSW TRADE & INVESTMENT ANNUAL REPORT 2010 -11 FINANCIAL STATEMENTS
FINANCIAL STATEMENTS - MINISTERIAL CORPORATION FOR INDUSTRY
STATEMENT OF FINANCIAL POSITION AS AT 30 JUNE 2011
Notes Actual2011
$’000
Budget2011
$’000
Actual2010
$’000ASSETSCurrent AssetsReceivable - GST 583
Non-current assets held for sale 10 1 286 1 342 1 342
Total Current Assets 1 869 1 342 1 342
Non-Current AssetsOther financial assets 8 - 16 16
Property 9 2 100 2 100 2 100
Total Non-Current Assets 2 100 2 116 2 116
Total Assets 3 969 3 458 3 458
LIABILITIESCurrent LiabilitiesPayables 12 6 413 1 121 1 121
Total Current Liabilities 6 413 1 121 1 121Total Liabilities 6 413 1 121 1 121
Net Liabilities (2 444) 2 337 2 337
EQUITYReserves 9 - -
Accumulated funds (2 453) 2 337 2 337
Total Equity (2 444) 2 337 2 337
The accompanying notes form part of these financial statements.

336 FINANCIAL STATEMENTS NSW TRADE & INVESTMENT ANNUAL REPORT 2010 -11
FINANCIAL STATEMENTS - MINISTERIAL CORPORATION FOR INDUSTRY
STATEMENT OF CHANGES IN EQUITY FOR THE YEAR ENDED 30 JUNE 2011
Reserves
$’000
Accumulated Funds$’000
Total
$’000Balance at 1 July 2010 - 2 337 2 337Deficit for the year - (4 790) (4 790)
Other comprehensive income:
Non-current assets held for sale
Valuation gains / (losses) 9 - 9
Total other comprehensive income 9 (4 790) (4 781)
Transactions with owners in their capacity as owners -- 0
Balance at 30 June 2011 9 (2 453) (2 444)
Balance at 1 July 2009 - 3 433 3 433
Deficit for the year - (1 096) (1 096)
Total other comprehensive income - - -
Transactions with owners in their capacity as owners - - -
Balance at 30 June 2010 - 2 337 2 337
The accompanying notes form part of these financial statements.
STATEMENT OF CASH FLOWS FOR THE YEAR ENDED 30 JUNE 2011
Notes Actual2011
$’000
Budget2011
$’000
Actual2010
$’000CASH FLOWS FROM OPERATING ACTIVITIESPaymentsGrants, Subsidies and Assistance to Industry (9 270) (32 362) (8 663)
Total Payments (9 270) (32 362) (8 663)
ReceiptsGrants and contributions 8 910 32 362 8 663
Total Receipts 8 910 32 362 8 663
NET CASH FLOWS FROM OPERATING ACTIVITIES 16 (360) - -
CASH FLOWS FROM INVESTING ACTIVITIESProceeds from sale of property 360 - -
NET CASH FLOWS FROM INVESTING ACTIVITIES 360 - -
NET INCREASE / (DECREASE) IN CASH - - -
Opening cash and cash equivalents - - -
CLOSING CASH AND CASH EQUIVALENTS 7 - - -
The Ministerial Corporation for Industry has no bank account and all transactions are processed through the Department of Trade and Investment, Regional Infrastructure and Services’ accountThe accompanying notes form part of these financial statements.
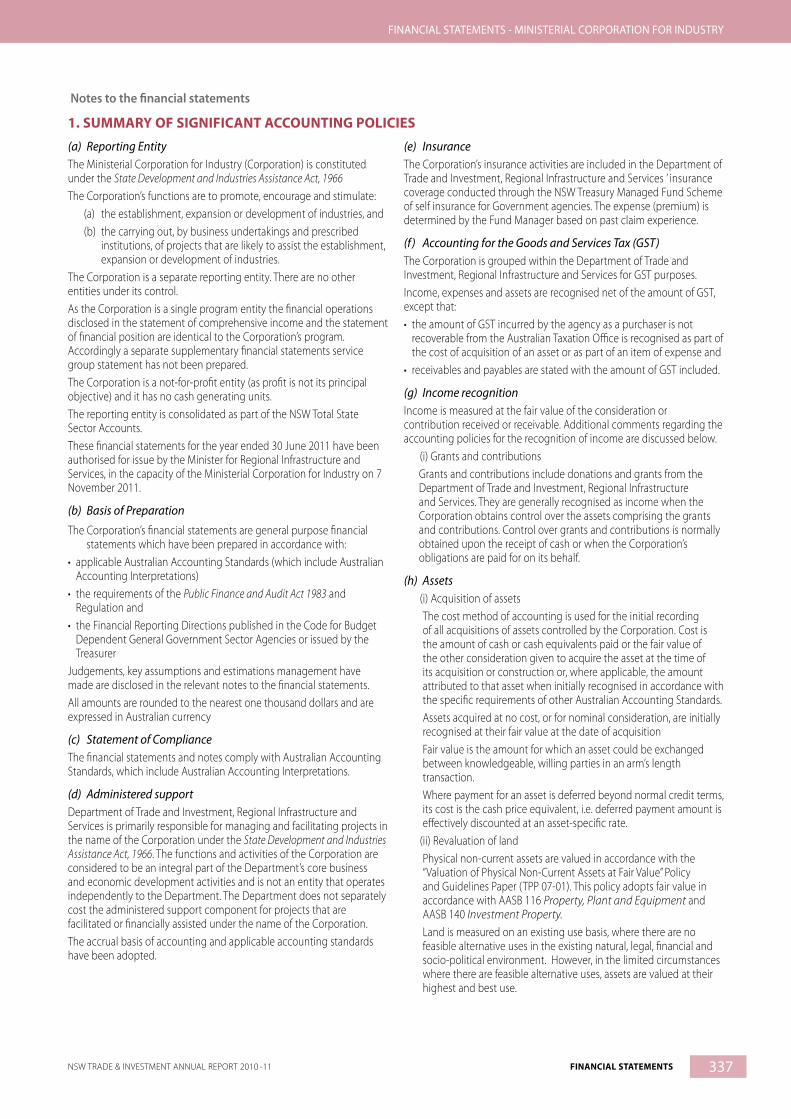
337NSW TRADE & INVESTMENT ANNUAL REPORT 2010 -11 FINANCIAL STATEMENTS
FINANCIAL STATEMENTS - MINISTERIAL CORPORATION FOR INDUSTRY
Notes to the financial statements
1. SUMMARY OF SIGNIFICANT ACCOUNTING POLICIES
(a) Reporting EntityThe Ministerial Corporation for Industry (Corporation) is constituted under the State Development and Industries Assistance Act, 1966The Corporation’s functions are to promote, encourage and stimulate:
(a) the establishment, expansion or development of industries, and (b) the carrying out, by business undertakings and prescribed
institutions, of projects that are likely to assist the establishment, expansion or development of industries.
The Corporation is a separate reporting entity. There are no other entities under its control.As the Corporation is a single program entity the financial operations disclosed in the statement of comprehensive income and the statement of financial position are identical to the Corporation’s program. Accordingly a separate supplementary financial statements service group statement has not been prepared.The Corporation is a not-for-profit entity (as profit is not its principal objective) and it has no cash generating units.The reporting entity is consolidated as part of the NSW Total State Sector Accounts.These financial statements for the year ended 30 June 2011 have been authorised for issue by the Minister for Regional Infrastructure and Services, in the capacity of the Ministerial Corporation for Industry on 7 November 2011.
(b) Basis of Preparation
The Corporation’s financial statements are general purpose financial statements which have been prepared in accordance with:
• applicable Australian Accounting Standards (which include Australian Accounting Interpretations)
• the requirements of the Public Finance and Audit Act 1983 and Regulation and
• the Financial Reporting Directions published in the Code for Budget Dependent General Government Sector Agencies or issued by the Treasurer
Judgements, key assumptions and estimations management have made are disclosed in the relevant notes to the financial statements.All amounts are rounded to the nearest one thousand dollars and are expressed in Australian currency
(c) Statement of ComplianceThe financial statements and notes comply with Australian Accounting Standards, which include Australian Accounting Interpretations.
(d) Administered supportDepartment of Trade and Investment, Regional Infrastructure and Services is primarily responsible for managing and facilitating projects in the name of the Corporation under the State Development and Industries Assistance Act, 1966. The functions and activities of the Corporation are considered to be an integral part of the Department’s core business and economic development activities and is not an entity that operates independently to the Department. The Department does not separately cost the administered support component for projects that are facilitated or financially assisted under the name of the Corporation.The accrual basis of accounting and applicable accounting standards have been adopted.
(e) InsuranceThe Corporation’s insurance activities are included in the Department of Trade and Investment, Regional Infrastructure and Services ’ insurance coverage conducted through the NSW Treasury Managed Fund Scheme of self insurance for Government agencies. The expense (premium) is determined by the Fund Manager based on past claim experience.
(f ) Accounting for the Goods and Services Tax (GST)The Corporation is grouped within the Department of Trade and Investment, Regional Infrastructure and Services for GST purposes.Income, expenses and assets are recognised net of the amount of GST, except that:• the amount of GST incurred by the agency as a purchaser is not
recoverable from the Australian Taxation Office is recognised as part of the cost of acquisition of an asset or as part of an item of expense and
• receivables and payables are stated with the amount of GST included.
(g) Income recognitionIncome is measured at the fair value of the consideration or contribution received or receivable. Additional comments regarding the accounting policies for the recognition of income are discussed below.
(i) Grants and contributionsGrants and contributions include donations and grants from the Department of Trade and Investment, Regional Infrastructure and Services. They are generally recognised as income when the Corporation obtains control over the assets comprising the grants and contributions. Control over grants and contributions is normally obtained upon the receipt of cash or when the Corporation’s obligations are paid for on its behalf.
(h) Assets(i) Acquisition of assetsThe cost method of accounting is used for the initial recording of all acquisitions of assets controlled by the Corporation. Cost is the amount of cash or cash equivalents paid or the fair value of the other consideration given to acquire the asset at the time of its acquisition or construction or, where applicable, the amount attributed to that asset when initially recognised in accordance with the specific requirements of other Australian Accounting Standards.Assets acquired at no cost, or for nominal consideration, are initially recognised at their fair value at the date of acquisitionFair value is the amount for which an asset could be exchanged between knowledgeable, willing parties in an arm’s length transaction.Where payment for an asset is deferred beyond normal credit terms, its cost is the cash price equivalent, i.e. deferred payment amount is effectively discounted at an asset-specific rate.
(ii) Revaluation of landPhysical non-current assets are valued in accordance with the “Valuation of Physical Non-Current Assets at Fair Value” Policy and Guidelines Paper (TPP 07-01). This policy adopts fair value in accordance with AASB 116 Property, Plant and Equipment and AASB 140 Investment Property.Land is measured on an existing use basis, where there are no feasible alternative uses in the existing natural, legal, financial and socio-political environment. However, in the limited circumstances where there are feasible alternative uses, assets are valued at their highest and best use.

338 FINANCIAL STATEMENTS NSW TRADE & INVESTMENT ANNUAL REPORT 2010 -11
FINANCIAL STATEMENTS - MINISTERIAL CORPORATION FOR INDUSTRY
Fair value land is determined based on the best available market evidence, including current market selling prices for the same or similar assets. Where there is no available market evidence, the asset’s fair value is measured at its market buying price, the best indicator of which is depreciated replacement cost.The Corporation’s physical non-current assets are represented by land held for sale for commercial or industrial development. Land is valued at market based value. Physical non-current assets are revalued every 5 years or with sufficient regularity to ensure that the carrying amount of each asset in the class does not differ materially from its fair value at reporting dateLand held by the Corporation subject to transfer as part of the Government’s contribution to the redevelopment of Katoomba Echo Point is valued at the call option to the developer under the Deed of Agreement between the Corporation, Blue Mountains City Council and the developer.Land Held for Sale was revalued in November 2010 by external independent valuers.Revaluation increments are credited directly to the asset revaluation reserve, except that, to the extent that an increment reverses a revaluation decrement in respect of that class of asset previously recognised as an expense in the surplus / deficit, the increment is recognised immediately as revenue in the surplus / deficit.Revaluation decrements are recognised immediately as expenses in the surplus / deficit, except that, to the extent that a credit balance exists in the asset revaluation reserve in respect of the same class of assets, they are debited directly to the asst revaluation reserve.As a not-for-profit entity, revaluation increments and decrements are offset against one another within a class of non-current assets, but not otherwise.Where an asset that has previously been revalued is disposed of, any balance remaining in the asset revaluation reserve in respect of that asset is transferred to accumulated funds.
(iii) Impairment of landAs a not-for-profit entity with no cash generating units, the Corporation is effectively exempted from AASB 136 Impairment of Assets and impairment testing. This is because AASB 136 modifies the recoverable amount test to the higher of fair value less costs to sell and depreciated replacement cost. This means that, for an asset already measured at fair value, impairment can only arise if selling costs are material. Selling costs are regarded as immaterial.
(iv) Depreciation of property, plant and equipmentLand is not a depreciable asset. Such assets are not subject to depreciation.(v) Loans and receivablesLoans and receivables are non-derivative financial assets with fixed or determinable payments that are not quoted in an active market. These financial assets are recognised initially at fair value, usually based on the transaction cost or face value. Subsequent measurement is at amortised cost using the effective interest method, less an allowance for any impairment of receivables. Any changes are recognised in the surplus / (deficit) for the year when impaired, derecognised or through the amortisation process.Short-term receivables with no stated interest rate are measured at the original invoice amount where the effect of discounting is immaterial.
(vi) Impairment of financial assetsAll financial assets, except those measured at fair value through profit and loss, are subject to an annual review for impairment. An allowance for impairment is established when there is objective evidence that the Corporation will not be able to collect all amounts due.
For financial assets carried at amortised cost, the amount of the allowance is the difference between the asset’s carrying amount and the present value of estimated future cash flows, discounted at the effective interest rate. The amount of the impairment loss is recognised in the surplus / (deficit) for the year.Any reversals of impairment losses are reversed through the surplus / (deficit) for the year, where there is objective evidence, except reversals of impairment losses on an investment in an equity instrument classified as “available for sale” must be made through the reserve. Reversals of impairment losses of financial assets carried at amortised cost cannot result in a carrying amount that exceeds what the carrying amount would have been had there not been an impairment loss.
(vii) Non-current assets (or disposal group) held for saleThe Corporation has certain non-current assts classified as held for sale, where their carrying amount will be recovered principally through a sale transaction, not through continuing use. Non-current assets (or disposal groups) held for sale are recognised at the lower of carrying amount and fair value less costs to sell. These assets are not depreciated while they are classified as held for sale.
(i) Liabilities(i) PayablesThese amounts represent liabilities for goods and services provided to the Corporation and other amounts. Payables are recognised initially at fair value, usually based on the transaction cost or face value. Subsequent measurement is at amortised cost using the effective interest method. Short-term payables with no stated interest rate are measured at the original invoice amount where the effect of discounting is immaterial.
(j) Equity and reserves(i) Asset Revaluation reserveThe asset revaluation reserve is used to record increments and decrements on the valuation of non-current assets. This accords with the Corporation’s policy on the revaluation of property, plant and equipment as discussed in note 1(h)(ii).(ii) Accumulated FundsThe category accumulated funds includes all current and prior period retained funds.
(k) Budgeted amountsThe budgeted amounts are drawn from the budgets as formulated at the beginning of the financial year and with any adjustments for the effects of additional appropriations, s21A, s24 and / or s26 of the Public Finance and Audit Act, 1983.The budgeted amounts in the statement of comprehensive income and the statement of cash flows are generally based on the amounts disclosed in the NSW Budget Papers (as adjusted above). However, in the statement of financial position, the amounts vary from the Budget Papers, as the opening balances of the budgeted amounts are based on carried forward actual amounts; per the audited financial statements (rather than carried forward estimates).
(l) Comparative InformationExcept when an Australian Accounting Standard permits or requires otherwise, comparative information is disclosed in respect of the previous period for all amounts reported in the financial statements.
(m) Grants, Subsidies and Industry AssistancePayments for grants, subsidies and industry assistance are expensed at the time the Corporation becomes liable to make the payment.

339NSW TRADE & INVESTMENT ANNUAL REPORT 2010 -11 FINANCIAL STATEMENTS
FINANCIAL STATEMENTS - MINISTERIAL CORPORATION FOR INDUSTRY
The approval of the grant, subsidy or assistance may cover a number of years, and it is not considered that a liability arises until conditions specified in the approval have been met. Grants, subsidies and assistance which have been approved but have not been paid or accrued have been included in commitments for expenditure (Refer Note 13).
(n) Going ConcernThe Corporation is reliant on the continued ongoing financial support of the Department of Trade and Investment, Regional Infrastructure and Services. The Department will continue to provide ongoing financial support for at least the next 12 months and into the foreseeable future. The Corporation has prepared its financial statements on a going concern basis based on this ongoing financial support.
(l) New Australian Accounting Standards issued but not effective
Australian Accounting Standards and Interpretations that have recently been issued or amended but are not yet effective have not been adopted for the financial reporting period ended 30 June 2011. These are listed as follows:AASB Compiled Standards• AASB 9 Financial Instruments; • AASB 124 Related Party Disclosures;• AASB 1053 Application of Tiers of Australian Accounting Standards; • AASB 1054 Australian Additional Disclosures;Amending Pronouncements and Errata (not yet fully compiled)• AASB 2009-11 Amendments to Australian Accounting Standards
arising from AASB 9;• AASB 2010-2 Amendments to Australian Accounting Standards arising
form Reduced Disclosure Requirements;• AASB 2010-6 Amendments to Australian Accounting Standards –
Disclosure on Transfers of Financial Assets;• AASB 2010-7 Amendments to Australian Accounting Standards arising
from AASB 9;• AASB 2010-8 Amendments to Australian Accounting Standards –
Deferred Tax: Recovery of Underlying Assets;• AASB 2010-9 Amendments to Australian Accounting Standards
– Severe Hyperinflation and Removal of Fixed Dates for First-time Adopters;
• AASB 2011-1 Amendments to Australian Accounting Standards arising from the Trans-Tasman Convergence Project;
• AASB 2011-2 Amendments to Australian Accounting Standards arising from the Trans-Tasman Convergence Project – Reduced Disclosure Requirements;
• AASB 2011-3 Amendments to Australian Accounting Standards – Orderly Adoption of Charges to the ABS GFS Manual and Related Amendments;
Recent Amending Pronouncements and Errata (fully compiled)• AASB 2009-12 Amendments to Australian Accounting Standards;• AASB 2010-4 Further Amendments to Australian Accounting
Standards arising from the Annual Improvements Project;• AASB 2010-5 Amendments to Australian Accounting Standards;• AASB 2010-10 Further Amendments to Australian Accounting
Standards – Removal of Fixed Dates for First-time Adopters.
2. EXPENSES EXCLUDING LOSSES
2011$’000
2010$’000
(a) Other operating expenses include the following:Auditor’s remuneration – audit of the financial statements 16 16
Other expenses 164 14
Grants, subsidies and industry assistance 13 799 9 404
13 979 9 434
3. REVENUE
2011$’000
2010$’000
(a) Investment revenueRecognition of indexation on loan 279 2
279 2
(b) Grants and contributionsDepartment of Trade and Investment, Regional Infrastructure and Services 8 910 8 553
8 910 8 553
(c) Other revenueMiscellaneous revenue - 108
- 108

340 FINANCIAL STATEMENTS NSW TRADE & INVESTMENT ANNUAL REPORT 2010 -11
FINANCIAL STATEMENTS - MINISTERIAL CORPORATION FOR INDUSTRY
4. GAIN / (LOSS) ON DISPOSAL
2011$’000
2010$’000
Gain / (loss) on disposal of propertyProceeds from disposal 360 -
Value of land disposed (390) -
Net gain / (loss) on disposal (30) -
5. OTHER GAINS / (LOSSES)
2011$’000
2010$’000
Valuation adjustment to land held for sale 325 (325)
Impairment of Loan (295) -
Other gains / (losses) 30 (325)
6. SERVICE GROUPS OF THE CORPORATIONThe Corporation operates from within the Department of Trade and Investment, Regional Infrastructure and Services service group Investment Attraction and Industry Development, as disclosed in the 2010-2011 NSW Budget Papers.
7. CURRENT ASSETS – CASH AND CASH EQUIVALENTSThe Corporation did not hold cash or cash equivalents as at 30 June 2011 (2010: Nil)The Corporation’s transactions were operated through the Department of Trade and Investment, Regional Infrastructure and Services bank account.
8. NON-CURRENT ASSETS – OTHER FINANCIAL ASSETS 2011
$’0002010
$’000Loans to industry 295 16
Less: Allowance for impairment (295) -
- 16
Details regarding credit risk, liquidity risk and market risk, including financial assets that are either past due or impaired, are disclosed in Note 17.
Movement in the allowance for impairment
2011$’000
Balance at 1 July -
Increase / (decrease) in allowance recognised in surplus / (deficit) 295
Balance at 30 June 295
9. NON-CURRENT ASSETS – PROPERTY
Land$’000
Total$’000
At 1 July 2010 – fair valueGross carrying amount 2 100 2 100
Net Carrying Amount 2 100 2 100
At 30 June 2011 – fair valueGross carrying amount 2 100 2 100
Net Carrying Amount 2 100 2 100

341NSW TRADE & INVESTMENT ANNUAL REPORT 2010 -11 FINANCIAL STATEMENTS
FINANCIAL STATEMENTS - MINISTERIAL CORPORATION FOR INDUSTRY
ReconciliationA reconciliation of the carrying amount of property at the beginning and end of the current reporting period is set out below.
Land$’000
Total$’000
Year ended 30 June 2011Net carrying amount at start of year 2 100 2 100Net carrying amount at end of year 2 100 2 100
Land$’000
Total$’000
At 1 July 2009 – fair valueGross carrying amount 2 635 2 635Impairment losses (recognised in other gain / losses) (535) (535)Net Carrying Amount 2 100 2 100
At 30 June 2010 – fair valueGross carrying amount 2 100 2 100Net Carrying Amount 2 100 2 100
ReconciliationA reconciliation of the carrying amount of property at the beginning and end of the previous reporting period is set out below.
Land$’000
Total$’000
Year ended 30 June 2010Net carrying amount at start of year 2 100 2 100Net carrying amount at end of year 2 100 2 100
10. NON-CURRENT ASSETS (OR DISPOSAL GROUPS) HELD FOR SALE
2011$’000
2010$’000
Land 1 286 1 3421 286 1 342
Amounts recognised in equity relating to land held for sale Property asset revaluation increments / (decrements) 9 -
9 -The land held for sale relates to the Corporation’s previous involvement in a development agreement with the Albury Wodonga Development Corporation (now trading as the Albury Wodonga Corporation) to develop, market and sell industrial property at Albury. The Corporation contributed the industrial land with the Albury Wodonga Corporation responsible for development of the site. This development agreement has ceased. The Corporation continues to market the land for sale.
11. RESTRICTED ASSETSThe Land disclosed in Note 9 Non-current assets – Property is held by the Corporation as part of a development to build the Blue Mountains Cultural Centre at Katoomba. This will be a mixed use development comprising a cultural centre, retail area and other facilities. The land is subject of a call option under the Deed of Agreement between the Corporation, Blue Mountains City Council and the developer. The call option can only be exercised after practical completion and registration with Land and Property Information NSW.
12. CURRENT LIABILITIES – PAYABLES
2011$’000
2010$’000
Grants, subsidies and industry assistance 6 413 1 1216 413 1 121
Details regarding credit risk, liquidity risk and market risk, including a maturity analysis of the above payables are disclosed in Note 17.
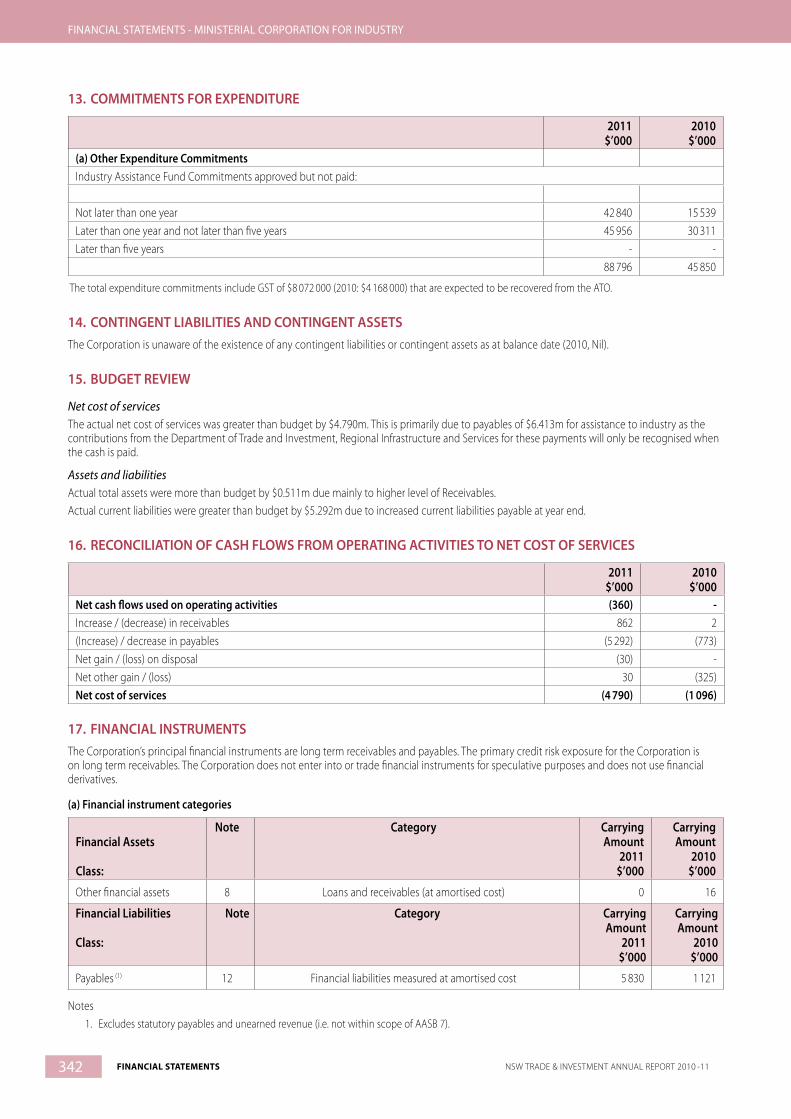
342 FINANCIAL STATEMENTS NSW TRADE & INVESTMENT ANNUAL REPORT 2010 -11
FINANCIAL STATEMENTS - MINISTERIAL CORPORATION FOR INDUSTRY
13. COMMITMENTS FOR EXPENDITURE
2011$’000
2010$’000
(a) Other Expenditure CommitmentsIndustry Assistance Fund Commitments approved but not paid:
Not later than one year 42 840 15 539Later than one year and not later than five years 45 956 30 311Later than five years - -
88 796 45 850
The total expenditure commitments include GST of $8 072 000 (2010: $4 168 000) that are expected to be recovered from the ATO.
14. CONTINGENT LIABILITIES AND CONTINGENT ASSETSThe Corporation is unaware of the existence of any contingent liabilities or contingent assets as at balance date (2010, Nil).
15. BUDGET REVIEW
Net cost of servicesThe actual net cost of services was greater than budget by $4.790m. This is primarily due to payables of $6.413m for assistance to industry as the contributions from the Department of Trade and Investment, Regional Infrastructure and Services for these payments will only be recognised when the cash is paid.
Assets and liabilitiesActual total assets were more than budget by $0.511m due mainly to higher level of Receivables.Actual current liabilities were greater than budget by $5.292m due to increased current liabilities payable at year end.
16. RECONCILIATION OF CASH FLOWS FROM OPERATING ACTIVITIES TO NET COST OF SERVICES
2011$’000
2010$’000
Net cash flows used on operating activities (360) -Increase / (decrease) in receivables 862 2(Increase) / decrease in payables (5 292) (773)Net gain / (loss) on disposal (30) -Net other gain / (loss) 30 (325)Net cost of services (4 790) (1 096)
17. FINANCIAL INSTRUMENTSThe Corporation’s principal financial instruments are long term receivables and payables. The primary credit risk exposure for the Corporation is on long term receivables. The Corporation does not enter into or trade financial instruments for speculative purposes and does not use financial derivatives.
(a) Financial instrument categories
Financial Assets
Class:
Note Category Carrying Amount
2011$’000
Carrying Amount
2010$’000
Other financial assets 8 Loans and receivables (at amortised cost) 0 16
Financial Liabilities
Class:
Note Category Carrying Amount
2011$’000
Carrying Amount
2010$’000
Payables (1) 12 Financial liabilities measured at amortised cost 5 830 1 121
Notes1. Excludes statutory payables and unearned revenue (i.e. not within scope of AASB 7).
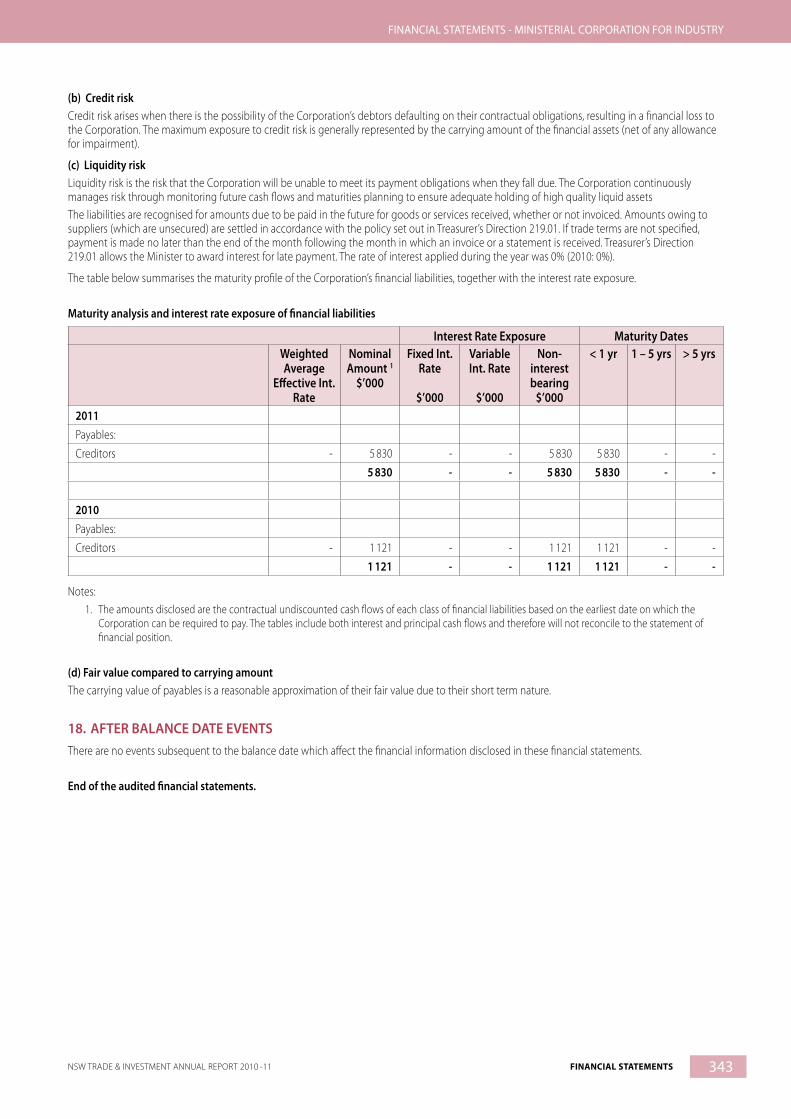
343NSW TRADE & INVESTMENT ANNUAL REPORT 2010 -11 FINANCIAL STATEMENTS
FINANCIAL STATEMENTS - MINISTERIAL CORPORATION FOR INDUSTRY
(b) Credit riskCredit risk arises when there is the possibility of the Corporation’s debtors defaulting on their contractual obligations, resulting in a financial loss to the Corporation. The maximum exposure to credit risk is generally represented by the carrying amount of the financial assets (net of any allowance for impairment).
(c) Liquidity riskLiquidity risk is the risk that the Corporation will be unable to meet its payment obligations when they fall due. The Corporation continuously manages risk through monitoring future cash flows and maturities planning to ensure adequate holding of high quality liquid assetsThe liabilities are recognised for amounts due to be paid in the future for goods or services received, whether or not invoiced. Amounts owing to suppliers (which are unsecured) are settled in accordance with the policy set out in Treasurer’s Direction 219.01. If trade terms are not specified, payment is made no later than the end of the month following the month in which an invoice or a statement is received. Treasurer’s Direction 219.01 allows the Minister to award interest for late payment. The rate of interest applied during the year was 0% (2010: 0%).
The table below summarises the maturity profile of the Corporation’s financial liabilities, together with the interest rate exposure.
Maturity analysis and interest rate exposure of financial liabilities
Interest Rate Exposure Maturity DatesWeighted Average
Effective Int. Rate
Nominal Amount 1
$’000
Fixed Int. Rate
$’000
Variable Int. Rate
$’000
Non-interest bearing
$’000
< 1 yr 1 – 5 yrs > 5 yrs
2011Payables:
Creditors - 5 830 - - 5 830 5 830 - -
5 830 - - 5 830 5 830 - -
2010Payables:
Creditors - 1 121 - - 1 121 1 121 - -
1 121 - - 1 121 1 121 - -
Notes:1. The amounts disclosed are the contractual undiscounted cash flows of each class of financial liabilities based on the earliest date on which the
Corporation can be required to pay. The tables include both interest and principal cash flows and therefore will not reconcile to the statement of financial position.
(d) Fair value compared to carrying amountThe carrying value of payables is a reasonable approximation of their fair value due to their short term nature.
18. AFTER BALANCE DATE EVENTSThere are no events subsequent to the balance date which affect the financial information disclosed in these financial statements.
End of the audited financial statements.
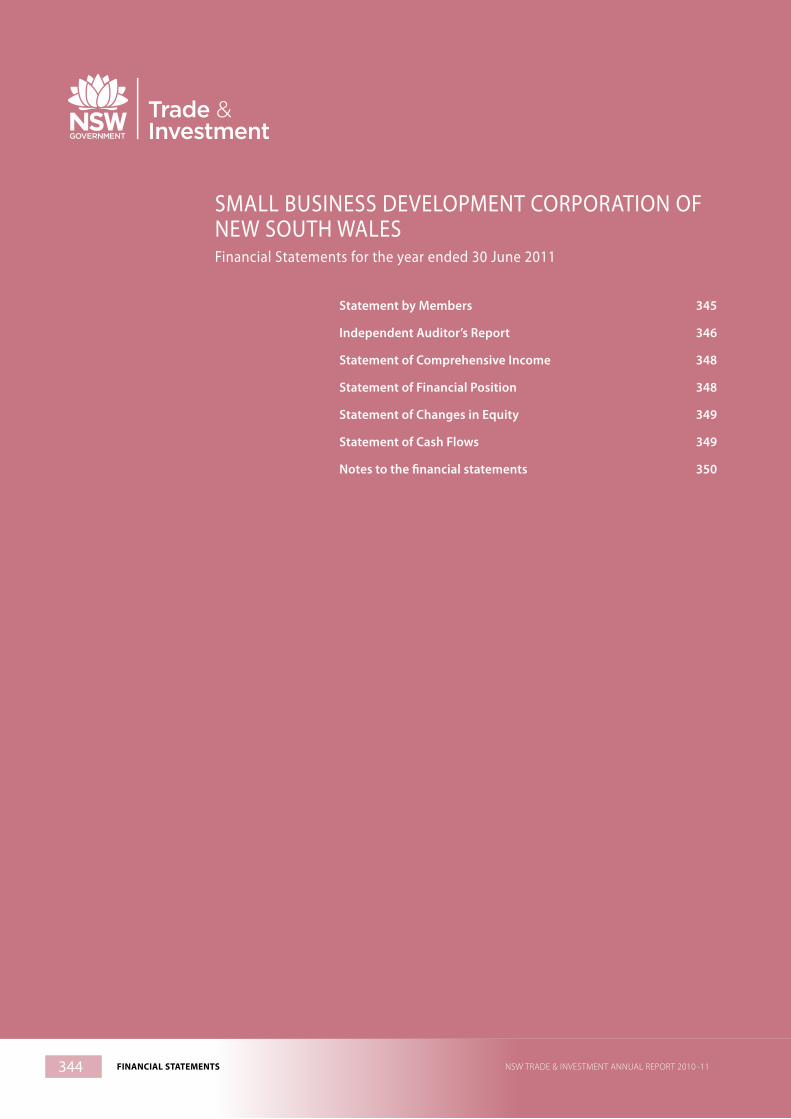
344 FINANCIAL STATEMENTS NSW TRADE & INVESTMENT ANNUAL REPORT 2010 -11
SMALL BUSINESS DEVELOPMENT CORPORATION OF NEW SOUTH WALESFinancial Statements for the year ended 30 June 2011
Statement by Members 345
Independent Auditor’s Report 346
Statement of Comprehensive Income 348
Statement of Financial Position 348
Statement of Changes in Equity 349
Statement of Cash Flows 349
Notes to the financial statements 350

345NSW TRADE & INVESTMENT ANNUAL REPORT 2010 -11 FINANCIAL STATEMENTS
FINANCIAL STATEMENTS - SMALL BUSINESS DEVELOPMENT CORPORATION OF NEW SOUTH WALES

346 FINANCIAL STATEMENTS NSW TRADE & INVESTMENT ANNUAL REPORT 2010 -11
FINANCIAL STATEMENTS - SMALL BUSINESS DEVELOPMENT CORPORATION OF NEW SOUTH WALES
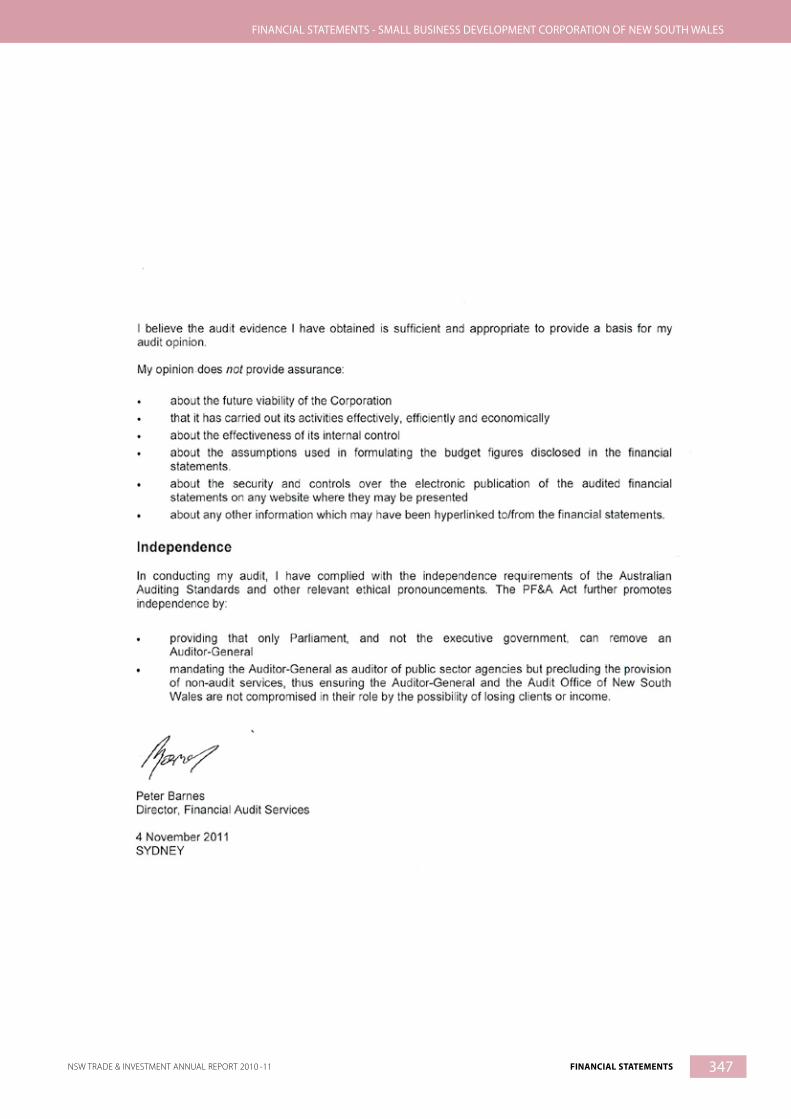
347NSW TRADE & INVESTMENT ANNUAL REPORT 2010 -11 FINANCIAL STATEMENTS
FINANCIAL STATEMENTS - SMALL BUSINESS DEVELOPMENT CORPORATION OF NEW SOUTH WALES

348 FINANCIAL STATEMENTS NSW TRADE & INVESTMENT ANNUAL REPORT 2010 -11
FINANCIAL STATEMENTS - SMALL BUSINESS DEVELOPMENT CORPORATION OF NEW SOUTH WALES
STATEMENT OF COMPREHENSIVE INCOME FOR THE YEAR ENDED 30 JUNE 2011
Notes Actual2011
$’000
Budget2011
$’000
Actual2010
$’000Expenses excluding lossesOperating expenses
Other operating expenses 2(a) 22 100 26
Total expenses excluding losses 22 100 26
RevenueGrants and contributions 3(a) 23 100 25
Total Revenue 23 100 25
Other gains / (losses) - - -
Net Cost of Services 1 - (1)
SURPLUS / (DEFICIT) FOR THE YEAR 1 - (1)
Other comprehensive income
Other comprehensive income for the year - - -
TOTAL COMPREHENSIVE INCOME FOR THE YEAR 1 - (1)
The accompanying notes form part of these financial statements.
STATEMENT OF FINANCIAL POSITION AS AT 30 JUNE 2011
Notes Actual2011
$’000
Budget2011
$’000
Actual2010
$’000ASSETSCurrent AssetsCash and cash equivalents 5 - - -Receivables - GST 1 - -
Total Current Assets 1 - -Total Assets 1 - -
LIABILITIESCurrent LiabilitiesPayables 6 6 6 6
Total Current Liabilities 6 6 6Total Liabilities 6 6 6
Net Assets (5) (6) (6)
EQUITYAccumulated funds (5) (6) (6)
Total Equity (5) (6) (6)
The accompanying notes form part of these financial statements.
349NSW TRADE & INVESTMENT ANNUAL REPORT 2010 -11 FINANCIAL STATEMENTS
FINANCIAL STATEMENTS - SMALL BUSINESS DEVELOPMENT CORPORATION OF NEW SOUTH WALES
STATEMENT OF CHANGES IN EQUITY FOR THE YEAR ENDED 30 JUNE 2011
Accumulated Funds$’000
Total
$’000Balance at 1 July 2010 (6) (6)Surplus / (deficit) for the year 1 1
Total other comprehensive income - -Transactions with owners in their capacity as owners - -Balance at 30 June 2011 (5) (5)
Balance at 1 July 2009 (5) (5)
Surplus / (deficit) for the year (1) (1)
Total other comprehensive income - -
Transactions with owners in their capacity as owners - -
Balance at 30 June 2010 (6) (6)
STATEMENT OF CASH FLOWS FOR THE YEAR ENDED 30 JUNE 2011
Notes Actual2011
$’000
Budget2011
$’000
Actual2010
$’000CASH FLOWS FROM OPERATING ACTIVITIESPaymentsOther (23) (100) (25)
Total Payments (23) (100) (25)
ReceiptsGrants and contributions 23 100 25
Total Receipts 23 100 25
NET CASH FLOWS FROM OPERATING ACTIVITIES 10 - - -
NET INCREASE / (DECREASE) IN CASH - - -Opening cash and cash equivalents - - -CLOSING CASH AND CASH EQUIVALENTS 5 - - -
The Small Business Development Corporation of New South Wales has no bank account and all transactions are processed through the Department of Trade and Investment, Regional Infrastructure and Services’ account.
The accompanying notes form part of these financial statements.

350 FINANCIAL STATEMENTS NSW TRADE & INVESTMENT ANNUAL REPORT 2010 -11
FINANCIAL STATEMENTS - SMALL BUSINESS DEVELOPMENT CORPORATION OF NEW SOUTH WALES
Notes to the financial statements
1. SUMMARY OF SIGNIFICANT ACCOUNTING POLICIES
(a) Reporting Entity
The Small Business Development Corporation of New South Wales (the “Corporation”) is constituted under the Small Business Development Corporation Act, 1984. The objectives of the Corporation are:
(i) develop policy objectives for Government programs of assistance to the small business sector of the economy
(ii) to evaluate such Government programs in the light of these objectives
(iii) to make recommendations for improvement of such Government programs and
(iv) to assist the Government generally in matters relating to the development of the small business sector of the economy.
The Corporation is a single program entity, the financial operations disclosed in the statement of comprehensive income and the statement of financial position are identical to the Corporation’s program. Accordingly, a separate supplementary financial statements service group statement has not been prepared.
The Corporation is a not-for-profit entity (as profit is not its principal objective) and it has no cash generating units. The reporting entity is consolidated as part of the NSW Total State Sector Accounts.
The financial statements for the year ended 30 June 2011 have been authorised for issue by the Board of the Small Business Development Corporation of New South Wales on 27 October 2011.
(b) Basis of Preparation
• The Corporation’s financial statements are general purpose financial statements which have been prepared in accordance with:
• applicable Australian Accounting Standards (which include Australian Accounting Interpretations)
• the requirements of the Public Finance and Audit Act 1983 and Regulation and
• the Financial Reporting Directions published in the Financial Reporting Code for Budget Dependent General Government Sector Agencies or issued by the Treasurer.
Judgements, key assumptions and estimations management have made are disclosed in the relevant notes to the financial statements.
All amounts are rounded to the nearest one thousand dollars and are expressed in Australian currency.
(c) Statement of Compliance
The financial statements and notes comply with Australian Accounting Standards, which include Australian Accounting Interpretations.
(d) Administered support
The Department of Trade and Investment, Regional Infrastructure and Services is responsible for administering the Small Business Development Corporation Act, 1984. The functions and activities of the Corporation are considered to be an integral part of the Department’s core small business portfolio activities and is not an entity that operates independently to the Department.
The accrual basis of accounting and applicable accounting standards have been adopted.
(e) Insurance
The Corporation’s insurance activities are included in the Department of Trade and Investment, Regional Infrastructure and Services insurance coverage conducted through the NSW Treasury Managed Fund Scheme of self insurance for Government agencies. The expense (premium) is determined by the Fund Manager based on past claim experience.
(f ) Accounting for the Goods and Services Tax (GST)
The Corporation is grouped with the Department of Trade and Investment, Regional Infrastructure and Services for GST purposes.
Income, expenses and assets are recognised net of the amount of GST, except that:
• the amount of GST incurred by the agency as a purchaser is not recoverable from the Australian Taxation Office is recognised as part of the cost of acquisition of an asset or as part of an item of expense and
• receivables and payables are stated with the amount of GST included.
(g) Income recognition
Income is measured at the fair value of the consideration or contribution received or receivable. Additional comments regarding the accounting policies for the recognition of income are discussed below.
(i) Contributions from other bodies
Contributions from other bodies (including grants and donations) are generally recognised as income when the Corporation obtains control over the assets comprising the contributions. Control over contributions is normally obtained upon the receipt of cash.
(h) Grants, Subsidies and Industry Assistance
Payments for grants, subsidies and industry assistance are expensed at the time the Corporation becomes liable to make the payment. The approval of the grant, subsidy or assistance may cover a number of years, and it is not considered that a liability arises until conditions specified in the approval have been met.
351NSW TRADE & INVESTMENT ANNUAL REPORT 2010 -11 FINANCIAL STATEMENTS
FINANCIAL STATEMENTS - SMALL BUSINESS DEVELOPMENT CORPORATION OF NEW SOUTH WALES
(i) Payables
These amounts represent liabilities for goods and services provided to the Corporation and other amounts. Payables are recognised initially at fair value, usually based on the transaction cost or face value. Subsequent measurement is at amortised cost using the effective interest method. Short-term payables with no stated interest rate are measured at the original invoice amount where the effect of discounting is immaterial.
(j) Equity and Reserves – Accumulated Funds
The category accumulated funds includes all current and prior period retained funds.
(k) Budgeted amounts
The budgeted amounts are drawn from the budgets as formulated at the beginning of the financial year and with any adjustments for the effects of additional appropriations, s21A, s24 and / or s26 of the Public Finance and Audit Act, 1983.
The budgeted amounts in the statement of comprehensive income and the statement of cash flows are generally based on the amounts disclosed in the NSW Budget Papers (as adjusted above). However, in the statement of financial position, the amounts vary from the Budget Papers, as the opening balances of the budgeted amounts are based on carried forward actual amounts; i.e. per the audited financial statements (rather than carried forward estimates).
(l) Comparative Information
Except when an Australian Accounting Standard permits or requires otherwise, comparative information is disclosed in respect of the previous period for all amounts reported in the financial statements.
(m) New Australian Accounting Standards issued but not effective
Australian Accounting Standards and Interpretations that have recently been issued or amended but are not yet effective have not been adopted for the financial reporting period ended 30 June 2011. These are listed as follows:
AASB Compiled Standards
• AASB 9 Financial Instruments;
• AASB 124 Related Party Disclosures;
• AASB 1053 Application of Tiers of Australian Accounting Standards;
• AASB 1054 Australian Additional Disclosures;
Amending Pronouncements and Errata (not yet fully compiled)
• AASB 2009-11 Amendments to Australian Accounting Standards arising from AASB 9;
• AASB 2010-2 Amendments to Australian Accounting Standards arising form Reduced Disclosure Requirements;
• AASB 2010-6 Amendments to Australian Accounting Standards –Disclosure on Transfers of Financial Assets;
• AASB 2010-7 Amendments to Australian Accounting Standards arising from AASB 9;
• AASB 2010-8 Amendments to Australian Accounting Standards – Deferred Tax: Recovery of Underlying Assets;
• AASB 2010-9 Amendments to Australian Accounting Standards – Severe Hyperinflation and Removal of Fixed Dates for First-time Adopters;
• AASB 2011-1 Amendments to Australian Accounting Standards arising from the Trans-Tasman Convergence Project;
• AASB 2011-2 Amendments to Australian Accounting Standards arising from the Trans-Tasman Convergence Project – Reduced Disclosure Requirements;
• AASB 2011-3 Amendments to Australian Accounting Standards – Orderly Adoption of Charges to the ABS GFS Manual and Related Amendments;
Recent Amending Pronouncements and Errata (fully compiled)
• AASB 2009-12 Amendments to Australian Accounting Standards;
• AASB 2010-4 Further Amendments to Australian Accounting Standards arising from the Annual Improvements Project;
• AASB 2010-5 Amendments to Australian Accounting Standards;
• AASB 2010-10 Further Amendments to Australian Accounting Standards – Removal of Fixed Dates for First-time Adopters.
(n) Going concern
The Corporation is reliant on the continued ongoing financial support of the Department of Trade and Investment, Regional Infrastructure and Services. The Department will continue to provide ongoing financial support for at least the next 12 months and into the foreseeable future. The Corporation has prepared its financial statements on a going concern basis based on this ongoing financial support.
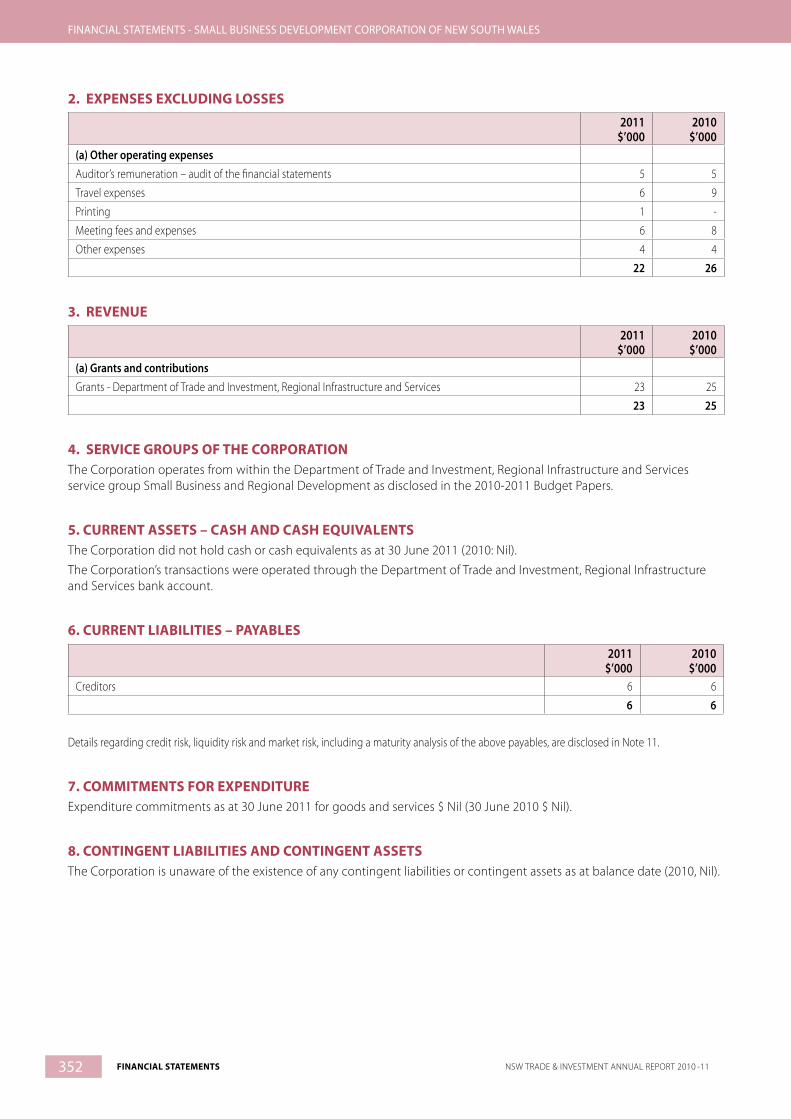
352 FINANCIAL STATEMENTS NSW TRADE & INVESTMENT ANNUAL REPORT 2010 -11
FINANCIAL STATEMENTS - SMALL BUSINESS DEVELOPMENT CORPORATION OF NEW SOUTH WALES
2. EXPENSES EXCLUDING LOSSES
2011$’000
2010$’000
(a) Other operating expensesAuditor’s remuneration – audit of the financial statements 5 5
Travel expenses 6 9
Printing 1 -
Meeting fees and expenses 6 8
Other expenses 4 4
22 26
3. REVENUE
2011$’000
2010$’000
(a) Grants and contributionsGrants - Department of Trade and Investment, Regional Infrastructure and Services 23 25
23 25
4. SERVICE GROUPS OF THE CORPORATIONThe Corporation operates from within the Department of Trade and Investment, Regional Infrastructure and Services service group Small Business and Regional Development as disclosed in the 2010-2011 Budget Papers.
5. CURRENT ASSETS – CASH AND CASH EQUIVALENTSThe Corporation did not hold cash or cash equivalents as at 30 June 2011 (2010: Nil).
The Corporation’s transactions were operated through the Department of Trade and Investment, Regional Infrastructure and Services bank account.
6. CURRENT LIABILITIES – PAYABLES
2011$’000
2010$’000
Creditors 6 6
6 6
Details regarding credit risk, liquidity risk and market risk, including a maturity analysis of the above payables, are disclosed in Note 11.
7. COMMITMENTS FOR EXPENDITUREExpenditure commitments as at 30 June 2011 for goods and services $ Nil (30 June 2010 $ Nil).
8. CONTINGENT LIABILITIES AND CONTINGENT ASSETSThe Corporation is unaware of the existence of any contingent liabilities or contingent assets as at balance date (2010, Nil).
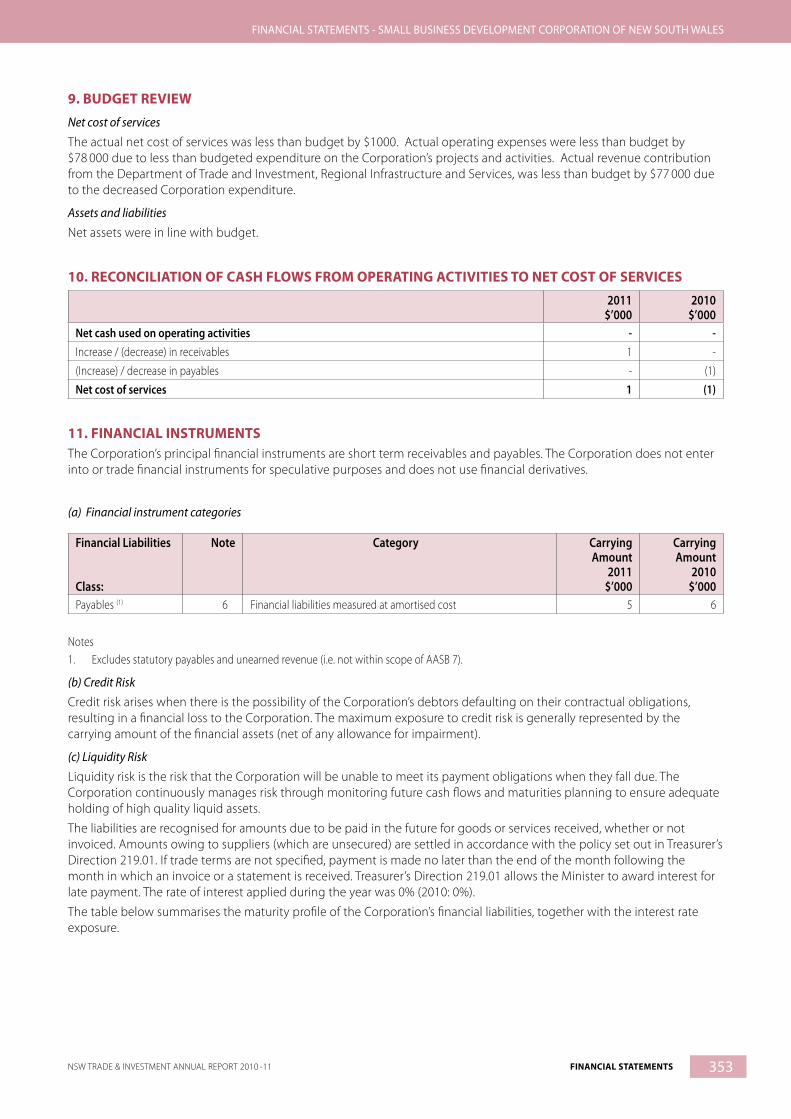
353NSW TRADE & INVESTMENT ANNUAL REPORT 2010 -11 FINANCIAL STATEMENTS
FINANCIAL STATEMENTS - SMALL BUSINESS DEVELOPMENT CORPORATION OF NEW SOUTH WALES
9. BUDGET REVIEW
Net cost of services
The actual net cost of services was less than budget by $1000. Actual operating expenses were less than budget by $78 000 due to less than budgeted expenditure on the Corporation’s projects and activities. Actual revenue contribution from the Department of Trade and Investment, Regional Infrastructure and Services, was less than budget by $77 000 due to the decreased Corporation expenditure.
Assets and liabilities
Net assets were in line with budget.
10. RECONCILIATION OF CASH FLOWS FROM OPERATING ACTIVITIES TO NET COST OF SERVICES
2011$’000
2010$’000
Net cash used on operating activities - -Increase / (decrease) in receivables 1 -
(Increase) / decrease in payables - (1)
Net cost of services 1 (1)
11. FINANCIAL INSTRUMENTSThe Corporation’s principal financial instruments are short term receivables and payables. The Corporation does not enter into or trade financial instruments for speculative purposes and does not use financial derivatives.
(a) Financial instrument categories
Financial Liabilities
Class:
Note Category Carrying Amount
2011$’000
Carrying Amount
2010$’000
Payables (1) 6 Financial liabilities measured at amortised cost 5 6
Notes1. Excludes statutory payables and unearned revenue (i.e. not within scope of AASB 7).
(b) Credit Risk
Credit risk arises when there is the possibility of the Corporation’s debtors defaulting on their contractual obligations, resulting in a financial loss to the Corporation. The maximum exposure to credit risk is generally represented by the carrying amount of the financial assets (net of any allowance for impairment).
(c) Liquidity Risk
Liquidity risk is the risk that the Corporation will be unable to meet its payment obligations when they fall due. The Corporation continuously manages risk through monitoring future cash flows and maturities planning to ensure adequate holding of high quality liquid assets.
The liabilities are recognised for amounts due to be paid in the future for goods or services received, whether or not invoiced. Amounts owing to suppliers (which are unsecured) are settled in accordance with the policy set out in Treasurer’s Direction 219.01. If trade terms are not specified, payment is made no later than the end of the month following the month in which an invoice or a statement is received. Treasurer’s Direction 219.01 allows the Minister to award interest for late payment. The rate of interest applied during the year was 0% (2010: 0%).
The table below summarises the maturity profile of the Corporation’s financial liabilities, together with the interest rate exposure.

354 FINANCIAL STATEMENTS NSW TRADE & INVESTMENT ANNUAL REPORT 2010 -11
FINANCIAL STATEMENTS - SMALL BUSINESS DEVELOPMENT CORPORATION OF NEW SOUTH WALES
Maturity analysis and interest rate exposure of financial liabilities
Interest Rate Exposure Maturity DatesWeighted Average
EffectiveInt. Rate
Nominal 1
Amount
$’000
FixedInt. Rate
$’000
Variable Int. Rate
$’000
Non-interest bearing $’000 < 1 yr 1 – 5 yrs > 5 yrs
2011Payables:
Creditors - 5 - - 5 5 - -
5 -- - 5 5 - 0
2010Payables:
Creditors - 6 - - 6 6 - -
6 - - 6 6 - -
Notes:1. The amounts disclosed are the contractual undiscounted cash flows of each class of financial liabilities based on the earliest date on which the
Corporation can be required to pay. The tables include both interest and principal cash flows and therefore will not reconcile to the statement of financial position.
(d) Fair value compared to carrying amount
The carrying value of payables is a reasonable approximation of their fair value due to their short term nature.
Financial Liabilities Carrying Amount2011
$’000
Fair Value2011
$’000
Carrying Amount
2010$’000
Fair Value2010
$’000
Creditors 5 5 6 6
12. AFTER BALANCE DATE EVENTSThere are no events subsequent to the balance date which affect the financial information disclosed in these financial statements.
End of the audited financial statements.

355NSW TRADE & INVESTMENT ANNUAL REPORT 2010 -11 FINANCIAL STATEMENTS
Statement by Marine Parks Authority 356
Independent Auditor’s Report 357
Statement of Comprehensive Income 359
Statement of Changes in Equity 359
Statement of Financial Position 360
Statement of Cash Flows 361
Notes to and forming part of the financial statements 362
MARINE PARKS AUTHORITY Financial Statements for the year ended 30 June 2011
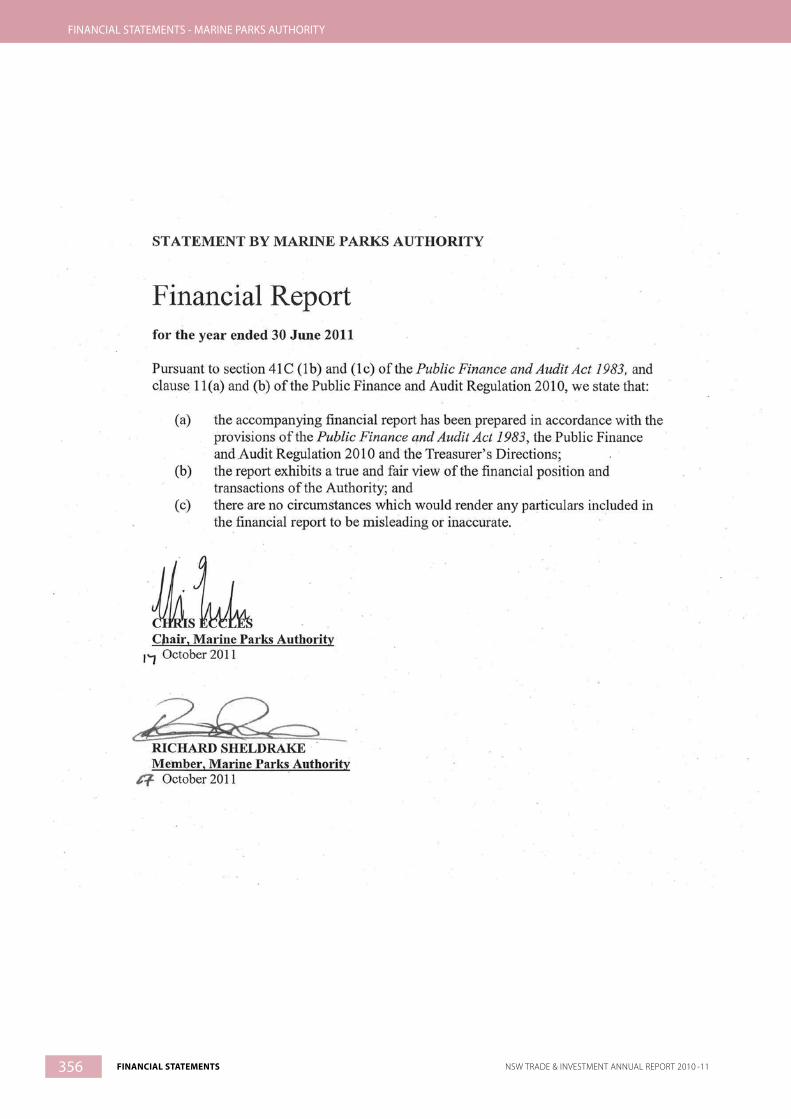
356 FINANCIAL STATEMENTS NSW TRADE & INVESTMENT ANNUAL REPORT 2010 -11
FINANCIAL STATEMENTS - MARINE PARKS AUTHORITY

357NSW TRADE & INVESTMENT ANNUAL REPORT 2010 -11 FINANCIAL STATEMENTS
FINANCIAL STATEMENTS - MARINE PARKS AUTHORITY

358 FINANCIAL STATEMENTS NSW TRADE & INVESTMENT ANNUAL REPORT 2010 -11
FINANCIAL STATEMENTS - MARINE PARKS AUTHORITY
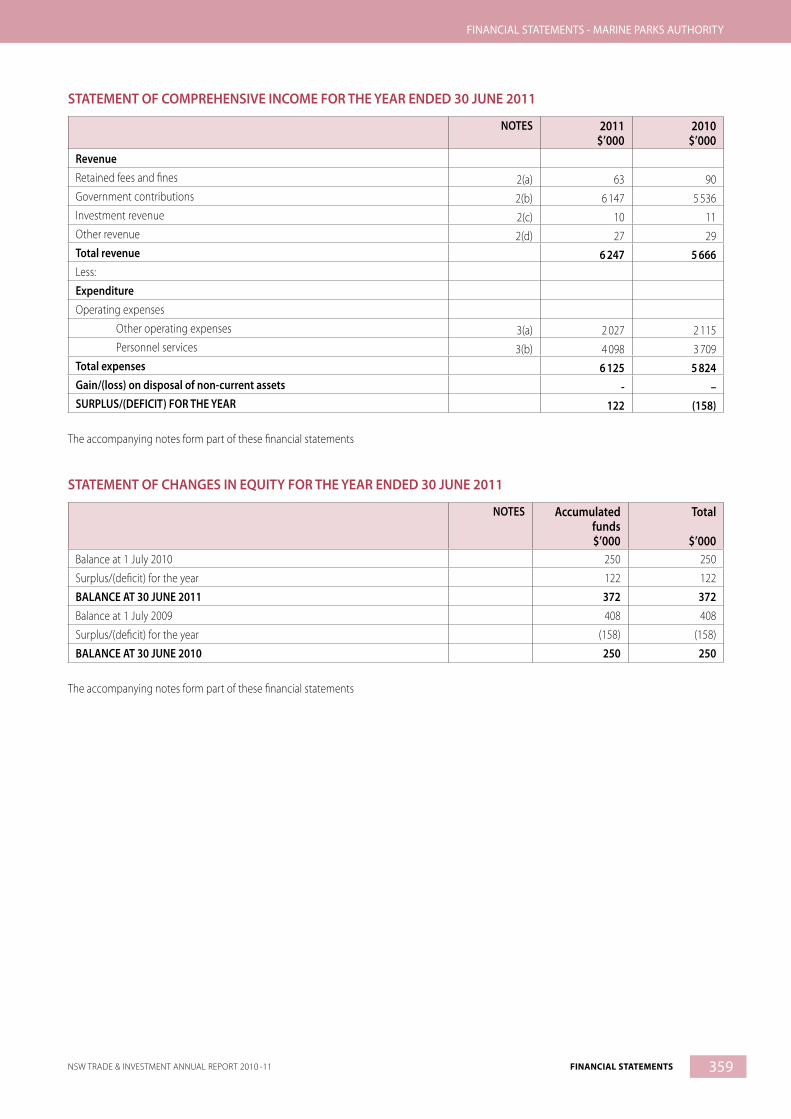
359NSW TRADE & INVESTMENT ANNUAL REPORT 2010 -11 FINANCIAL STATEMENTS
FINANCIAL STATEMENTS - MARINE PARKS AUTHORITY
STATEMENT OF COMPREHENSIVE INCOME FOR THE YEAR ENDED 30 JUNE 2011
NOTES 2011$’000
2010$’000
RevenueRetained fees and fines 2(a) 63 90Government contributions 2(b) 6 147 5 536Investment revenue 2(c) 10 11Other revenue 2(d) 27 29Total revenue 6 247 5 666Less:
ExpenditureOperating expenses
Other operating expenses 3(a) 2 027 2 115 Personnel services 3(b) 4 098 3 709
Total expenses 6 125 5 824Gain/(loss) on disposal of non-current assets - –SURPLUS/(DEFICIT) FOR THE YEAR 122 (158)
The accompanying notes form part of these financial statements
STATEMENT OF CHANGES IN EQUITY FOR THE YEAR ENDED 30 JUNE 2011
NOTES Accumulated funds$’000
Total
$’000Balance at 1 July 2010 250 250
Surplus/(deficit) for the year 122 122
BALANCE AT 30 JUNE 2011 372 372Balance at 1 July 2009 408 408
Surplus/(deficit) for the year (158) (158)
BALANCE AT 30 JUNE 2010 250 250
The accompanying notes form part of these financial statements

360 FINANCIAL STATEMENTS NSW TRADE & INVESTMENT ANNUAL REPORT 2010 -11
FINANCIAL STATEMENTS - MARINE PARKS AUTHORITY
STATEMENT OF FINANCIAL POSITION AS AT 30 JUNE 2011
NOTES 2011$’000
2010$’000
ASSETSCurrent assetsCash and cash equivalents 4 372 250Receivables - –Other - –Total current assets 372 250Non-current assetsProperty, plant and equipment - – Land and buildings - – Plant and equipment - –Total property, plant and equipment - –Intangible assets - –Total non-current assets - –Total assets 372 250LIABILITIESCurrent liabilitiesPayables - –Borrowings - –Provisions - –Other - –Total current liabilities - –Non-current liabilitiesBorrowings - –Provisions - –Total non-current liabilities - –Total liabilities - –Net assets 372 250EQUITYReserves - –Accumulated funds 372 250Total equity 372 250
The accompanying notes form part of these financial statements
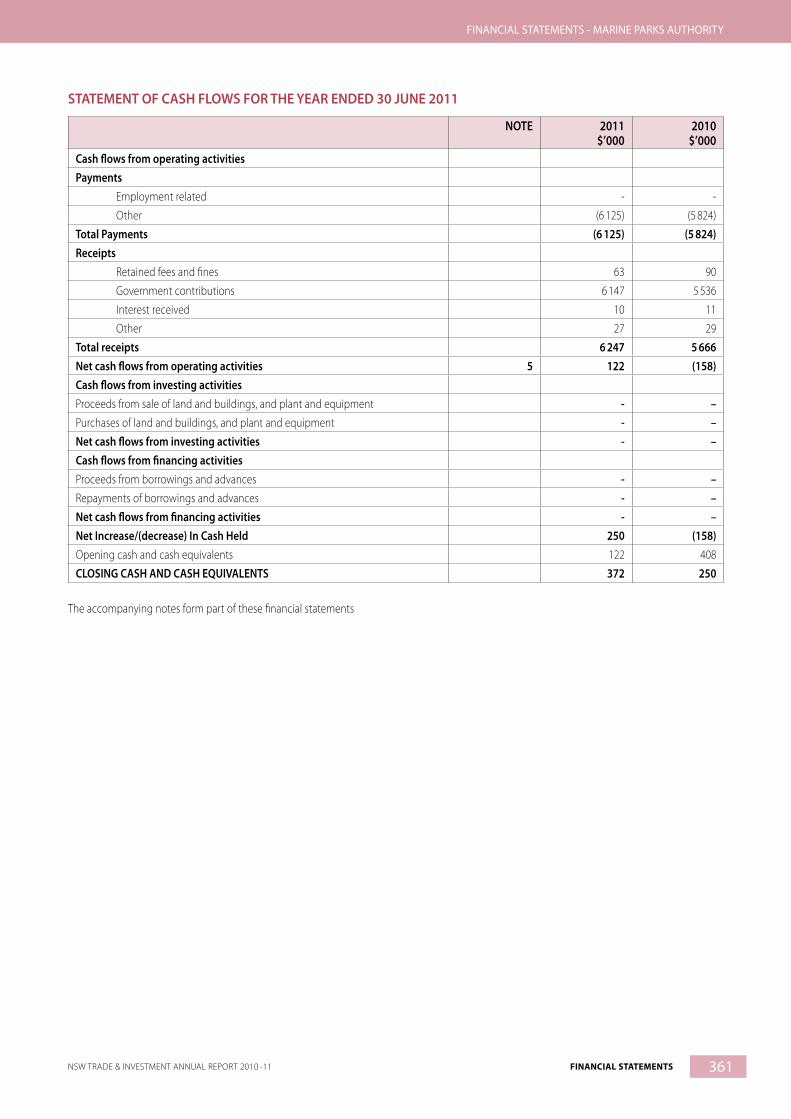
361NSW TRADE & INVESTMENT ANNUAL REPORT 2010 -11 FINANCIAL STATEMENTS
FINANCIAL STATEMENTS - MARINE PARKS AUTHORITY
STATEMENT OF CASH FLOWS FOR THE YEAR ENDED 30 JUNE 2011
NOTE 2011$’000
2010$’000
Cash flows from operating activitiesPayments
Employment related - -
Other (6 125) (5 824)
Total Payments (6 125) (5 824)Receipts
Retained fees and fines 63 90
Government contributions 6 147 5 536
Interest received 10 11
Other 27 29
Total receipts 6 247 5 666Net cash flows from operating activities 5 122 (158)Cash flows from investing activitiesProceeds from sale of land and buildings, and plant and equipment - –Purchases of land and buildings, and plant and equipment - –Net cash flows from investing activities - –Cash flows from financing activitiesProceeds from borrowings and advances - –Repayments of borrowings and advances - –Net cash flows from financing activities - –Net Increase/(decrease) In Cash Held 250 (158)Opening cash and cash equivalents 122 408
CLOSING CASH AND CASH EQUIVALENTS 372 250
The accompanying notes form part of these financial statements

362 FINANCIAL STATEMENTS NSW TRADE & INVESTMENT ANNUAL REPORT 2010 -11
FINANCIAL STATEMENTS - MARINE PARKS AUTHORITY
NOTES TO AND FORMING PART OF THE FINANCIAL STATEMENTS
1. Summary of significant accounting policies
a) Reporting entityThe Marine Parks Authority (MPA) is a reporting entity established under the Marine Parks Act 1997As a result of the Public Sector Employment and Management (Departments) Order 2011 the activities of the Authority were administered during the reporting period by the former Department of Environment Climate Change and Water (DECCW) from 1st July 2010 to 31st March 2011 and by the Department of Trade and Investment, Regional Infrastructure and Services (DTIRIS) from 1st April 2011 until 30th June 2011The MPA has no staff of its own, no material assets under its control or liabilitiesTransactions relating to the operations of the MPA, as represented in the financial statements, are salaries and operational expenses, and any revenues identified by the administering agency.The financial statements were authorised for issue by the Chair of the Authority in October 2011.
(b) Basis of preparationThe Authority’s financial statements are general purpose statements which have been prepared in accordance with:• applicable Australian Accounting Standards (which
include Australian Accounting Interpretations); and • the requirements of the Public Finance and Audit Act 1983
and Regulations.Where there are inconsistencies between the above requirements, the legislative provisions have prevailed.All amounts are rounded to the nearest one thousand dollars and are expressed in Australian currency.
(c) Income recognitionIncome is recognised when DTIRIS / Former DECCW has control of the income or right to receive, it is probable that the economic benefits will flow to that Department and the amount of revenue can be measured
reliably.
(d) Employee benefits The Marine Parks Authority does not employ staff of its own. Staff from DTIRIS / Former DECCW are used to perform various functions in relation to the activities of the MPA.
(e) Capital chargeThe Marine Parks Authority does not own assets. It utilises assets controlled by DTIRIS / Former DECCW for the undertaking of its functions. A charge-out cost has been included within operating expenses to reflect the use of these assets. The Marine Parks Authority utilises items such as marine craft, computers, buildings and general plant and equipment.
(f ) Marine Parks Act The Marine Parks Act 1997 (the Act) commenced on 1 July 1998. The objectives of the Act are: to conserve marine biological diversity and marine habitats by declaring and providing for the management of a comprehensive system of marine parks; to maintain ecological processes in marine parks; to provide for the ecologically sustainable use of fish (including commercial and recreational fishing) and marine vegetation in marine parks; and to provide opportunities for public appreciation, understanding and enjoyment of marine parks.The Act provides for the establishment of a Marine Parks Fund in which all fees and charges under the Act and money received in connection with administration of the Act are paid. During 2010-11 the fund was administered by DTIRIS / Former DECCW.
(g) Early adoption of Australian Accounting StandardsAt reporting date, a number of Australian Accounting Standards have been issued by the Australian Accounting Standards Board but are not yet operative. These standards have not been early adopted by the Authority. These standards have been assessed for their possible impact on financial statements, if any, in the period of their initial application. The assessment concluded that there will be no material impact.
2. Revenues
2011 $’000
2010 $’000
(a) Retained fees and fines
Retained fees and fines 63 90
63 90
(b) Grants and contributions
Agency contributions 5 950 5 311
New South Wales Government 34 107
Federal Government 163 118
6 147 5 536
(c) Investment revenue
Interest on bank account 10 11
10 11(d) Other revenue
Other 27 29
27 29
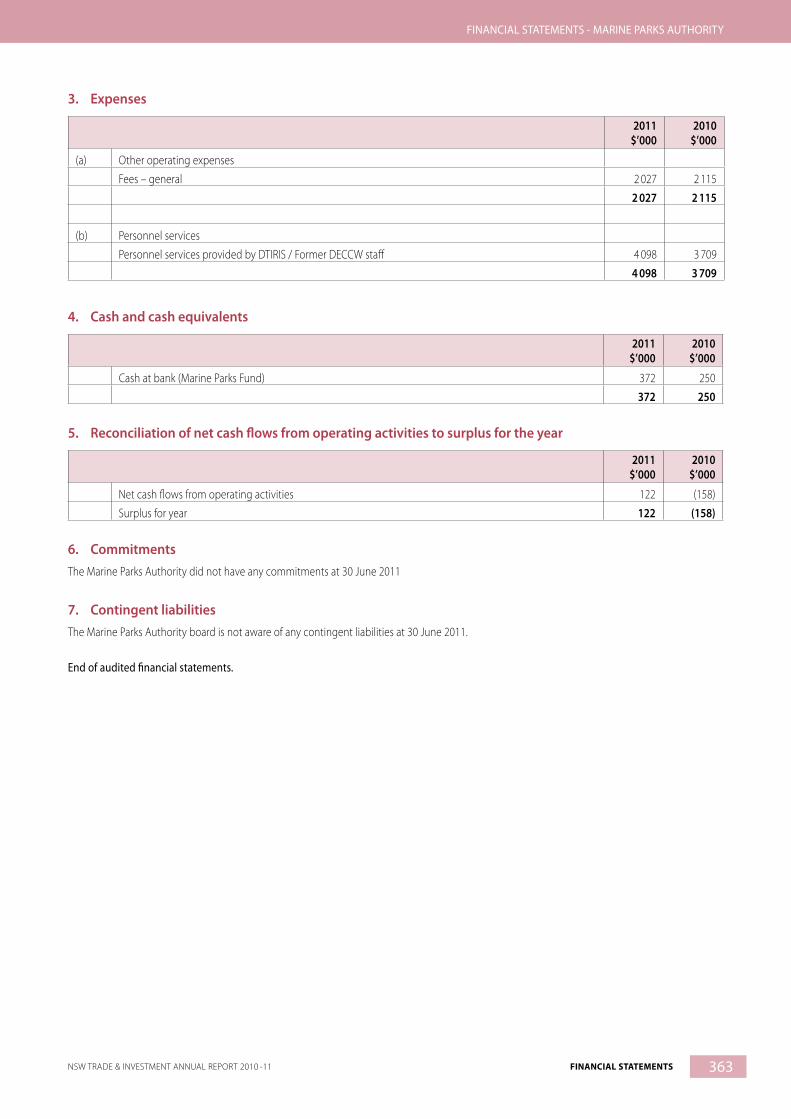
363NSW TRADE & INVESTMENT ANNUAL REPORT 2010 -11 FINANCIAL STATEMENTS
FINANCIAL STATEMENTS - MARINE PARKS AUTHORITY
3. Expenses
2011 $’000
2010 $’000
(a) Other operating expenses
Fees – general 2 027 2 115
2 027 2 115
(b) Personnel services
Personnel services provided by DTIRIS / Former DECCW staff 4 098 3 709
4 098 3 709
4. Cash and cash equivalents
2011 $’000
2010 $’000
Cash at bank (Marine Parks Fund) 372 250
372 250
5. Reconciliation of net cash flows from operating activities to surplus for the year
2011 $’000
2010 $’000
Net cash flows from operating activities 122 (158)
Surplus for year 122 (158)
6. CommitmentsThe Marine Parks Authority did not have any commitments at 30 June 2011
7. Contingent liabilitiesThe Marine Parks Authority board is not aware of any contingent liabilities at 30 June 2011.
End of audited financial statements.
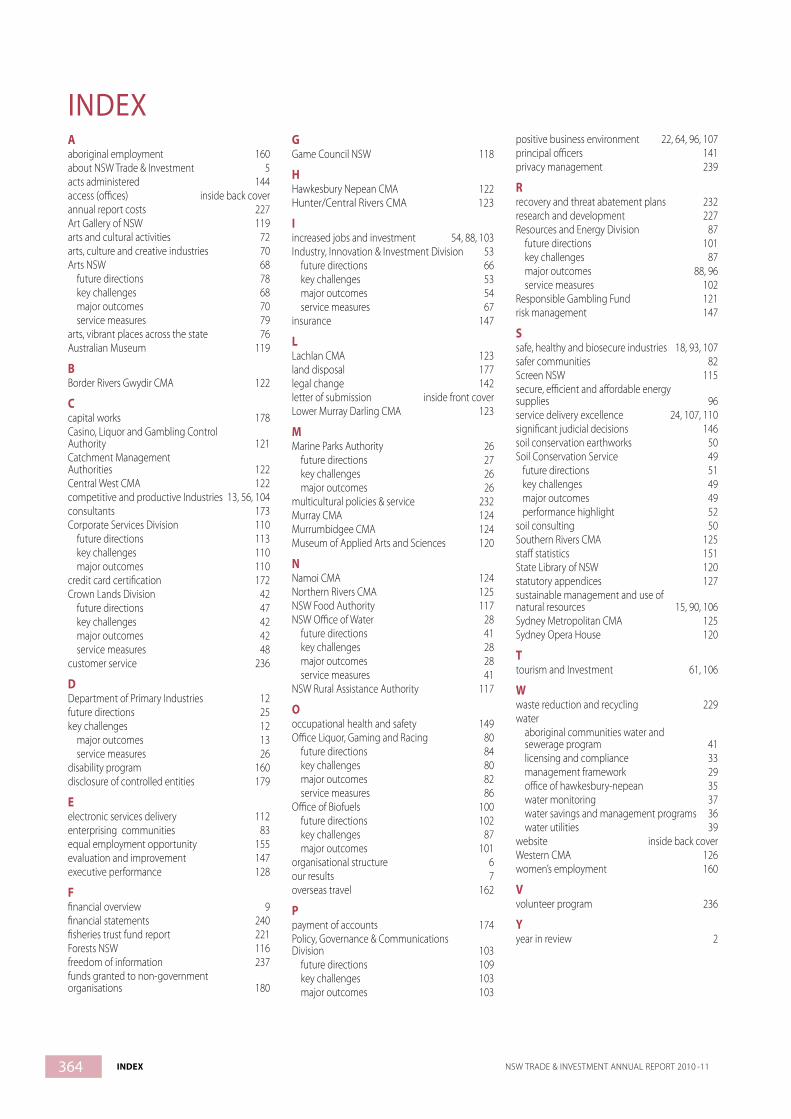
364 INDEX NSW TRADE & INVESTMENT ANNUAL REPORT 2010 -11
Aaboriginal employment 160about NSW Trade & Investment 5acts administered 144access (offices) inside back coverannual report costs 227Art Gallery of NSW 119arts and cultural activities 72arts, culture and creative industries 70Arts NSW 68 future directions 78 key challenges 68 major outcomes 70 service measures 79arts, vibrant places across the state 76Australian Museum 119
BBorder Rivers Gwydir CMA 122
Ccapital works 178Casino, Liquor and Gambling Control Authority 121Catchment Management Authorities 122Central West CMA 122competitive and productive Industries 13, 56, 104consultants 173Corporate Services Division 110 future directions 113 key challenges 110 major outcomes 110credit card certification 172Crown Lands Division 42 future directions 47 key challenges 42 major outcomes 42 service measures 48customer service 236
DDepartment of Primary Industries 12future directions 25key challenges 12 major outcomes 13 service measures 26disability program 160disclosure of controlled entities 179
Eelectronic services delivery 112enterprising communities 83equal employment opportunity 155evaluation and improvement 147executive performance 128
Ffinancial overview 9financial statements 240fisheries trust fund report 221Forests NSW 116freedom of information 237funds granted to non-government organisations 180
GGame Council NSW 118
HHawkesbury Nepean CMA 122Hunter/Central Rivers CMA 123
Iincreased jobs and investment 54, 88, 103Industry, Innovation & Investment Division 53 future directions 66 key challenges 53 major outcomes 54 service measures 67insurance 147
LLachlan CMA 123land disposal 177legal change 142letter of submission inside front coverLower Murray Darling CMA 123
MMarine Parks Authority 26 future directions 27 key challenges 26 major outcomes 26multicultural policies & service 232Murray CMA 124Murrumbidgee CMA 124Museum of Applied Arts and Sciences 120
NNamoi CMA 124Northern Rivers CMA 125NSW Food Authority 117NSW Office of Water 28 future directions 41 key challenges 28 major outcomes 28 service measures 41NSW Rural Assistance Authority 117
Ooccupational health and safety 149Office Liquor, Gaming and Racing 80 future directions 84 key challenges 80 major outcomes 82 service measures 86Office of Biofuels 100 future directions 102 key challenges 87 major outcomes 101organisational structure 6our results 7overseas travel 162
Ppayment of accounts 174Policy, Governance & Communications Division 103 future directions 109 key challenges 103 major outcomes 103
positive business environment 22, 64, 96, 107principal officers 141privacy management 239
Rrecovery and threat abatement plans 232research and development 227Resources and Energy Division 87 future directions 101 key challenges 87 major outcomes 88, 96 service measures 102Responsible Gambling Fund 121risk management 147
Ssafe, healthy and biosecure industries 18, 93, 107safer communities 82Screen NSW 115secure, efficient and affordable energy supplies 96service delivery excellence 24, 107, 110significant judicial decisions 146soil conservation earthworks 50Soil Conservation Service 49 future directions 51 key challenges 49 major outcomes 49 performance highlight 52soil consulting 50Southern Rivers CMA 125staff statistics 151State Library of NSW 120statutory appendices 127sustainable management and use of natural resources 15, 90, 106Sydney Metropolitan CMA 125Sydney Opera House 120
Ttourism and Investment 61, 106
Wwaste reduction and recycling 229water aboriginal communities water and sewerage program 41 licensing and compliance 33 management framework 29 office of hawkesbury-nepean 35 water monitoring 37 water savings and management programs 36 water utilities 39website inside back coverWestern CMA 126women’s employment 160
Vvolunteer program 236
Yyear in review 2
INDEX
AccessDepartment of Primary Industries
Head Office161 Kite StreetOrange NSW 2800Locked Bag 21Orange NSW 2800T: +61 2 6391 3100F: +61 2 6391 3336W: www.trade.nsw.gov.auHours of businessMonday to Friday 8.30am – 4.30pm
Sydney OfficeLevel 6201 Elizabeth StreetSydney NSW 2000PO Box K220Haymarket NSW 1240T: +61 2 8289 3999F: + 61 2 9286 3208W: www.trade.nsw.gov.auHours of businessMonday to Friday 8.30am – 4.30pm
NSW Office of WaterLevel 18227 Elizabeth Street Sydney NSW 2000GPO Box 3889Sydney NSW 2001T: (02) 8281 7777F: (02) 8281 7799 E: [email protected] W: www.water.nsw.gov.auHours of businessMonday to Friday 8.30am – 5pm
Crown Lands Division437 Hunter Street Newcastle NSW 2300PO Box 2185 Dangar NSW 2309T: 02 4920 5000F: 02 4925 3452W: www.crownland.nsw.gov.auHours of businessMonday to Friday 8.30am – 4.30pm
Soil Conservation ServiceLevel 12Macquarie Tower10 Valentine AveParramatta NSW 2150PO Box 3935Parramatta NSW 2124 T: (02) 8836 5350F: (02) 8836 5363W: www.scs.nsw.gov.auHours of business
Industry, Innovation & Investment DivisionLevel 47 MLC Centre19 Martin PlaceSydney NSW 2000GPO Box 5477Sydney NSW 2001T: +61 2 9338 6600F: +61 2 9338 6950W: www.business.nsw.gov.auHours of businessMonday to Friday 9.00am – 5.00pm
Tourism NSWTourism House55 Harrington StreetThe Rocks NSW 2000GPO Box 7050Sydney NSW 2001T: +61 2 9931 1111F: +61 2 9931 1424W: www.tourism.nsw.gov.auHours of businessMonday to Friday 8.30am – 6.00pm
Arts NSWSt James CentreLevel 9111 Elizabeth StreetSydney NSW 2001Postal address:Arts NSWPO A226 Sydney South NSW 1235T: 02 9228 5533 (switch) F: 02 9228 4722 W: www.arts.nsw.gov.auHours of businessMonday to Friday 9.00am – 5.00pm
Office of Liquor, Gaming and Racing323 Castlereagh StreetSydney NSW 2000GPO Box 7060Sydney NSW 2001T: 02 9995 0300F: 02 9995 0669E: [email protected]: www.olgr.nsw.gov.auHours of businessMonday to Friday 8:30am – 4:30pm
Resources & Energy Division
Minerals Branch516 High StreetMaitland NSW 2320PO Box 344Hunter Regional Mail Centre 2310T: +61 2 4931 6666F: +61 2 4931 6790W: www.dpi.nsw.gov.au/mineralsMonday to Friday 8.30am – 4.30pm
Energy Branch227 Elizabeth StreetSydney NSW 2000GPO Box 3889, Sydney NSW 2001 Sydney NSW 2001T: +61 2 8281 7393F: +61 2 8281 7451W: www.trade.nsw.gov.au/energyHours of businessMonday to Friday 8.30am – 5.00pm
Office of BiofuelsLevel 17227 Elizabeth StreetSydney NSW 2000GPO Box 3889Sydney NSW 2001 Switch: (02) 8281 7777 T: (02) 8281 7719 F: (02) 8281 7755 W: www.biofuels.nsw.gov.auHours of businessMonday to Friday 8.30am – 5.00pm
Statutory Agencies
Screen NSW Level 43, MLC Centre19 Martin PlaceSydney NSW 2000GPO Box 1744Sydney NSW 2001T: +61 2 8222 4844F: +61 2 8222 4840W: www.screen.nsw.gov.auHours of businessMonday to Friday 9.00am – 5.00pm
Forests NSW121-131 Oratava AvenueWest Pennant Hills NSW 2125PO Box 100Beecroft NSW 2119T: +61 2 9872 0111F: +61 2 9871 6941General enquiries: 1800 655 687W: www.dpi.nsw.gov.au/forestsHours of businessMonday to Friday 8.30am – 4.30pm
NSW Food Authority6 Avenue of the AmericasNewington NSW 2127Po Box 6682Silverwater NSW 1811T: 1300 552 406 (Australia-wide) +61 2 9741 4850 (Outside Australia)F: + 61 2 9647 0026 W: www.foodauthority.nsw.gov.auHours of businessMonday to Friday 8.30am – 5.30pm
NSW Rural Assistance Authority161 Kite StreetOrange NSW 2800Locked Bag 23Orange NSW 2800T: +61 2 6391 3000F: + 61 2 6391 3098W: www.raa.nsw.gov.auHours of businessMonday to Friday 8.30am – 5.00pm
Game Council of NSW52 Hill StreetOrange NSW 2800PO Box 2506Orange NSW 2800T: +61 2 6360 5111F: +61 2 6361 2093W: www.gamecouncil.nsw.gov.au Hours of businessMonday to Friday 9.00am – 5.00pm
Access to NSW Trade & Investment regional and international offices can be found through the relevant agency website above.We wish to thank the Annual Report Working Group and all staff for their contribution to this Annual Report.NSW Trade & Investment has made an electronic copy of the Annual Report and is available at: www.trade.nsw.gov.au

www.trade.nsw.gov.au


