26
NTIA Broadband Data Transparency Workshop October 30, 2009 U.S. Department of Commerce Washington, DC 1
| Date post: | 18-Feb-2019 |
| Category: |
Documents |
| Upload: | trinhthuan |
| View: | 222 times |
| Download: | 0 times |

NTIA Broadband Data Transparency Workshop
October 30, 2009
U.S. Department of Commerce
Washington, DC
1
“You want data, we got data…”
• Broadband Technology Opportunities Program
• Broadband Mapping
• Current Population Survey
2
Broadband Technology Opportunities Program
National Telecommunications and Information Administration
Department of Commerce
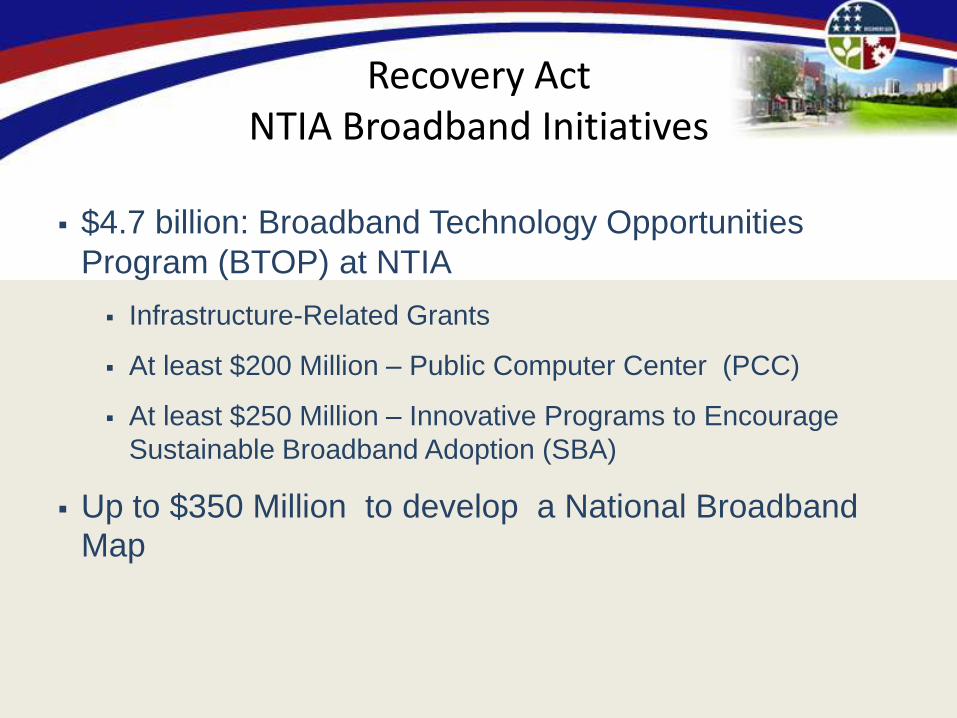
Recovery Act NTIA Broadband Initiatives
$4.7 billion: Broadband Technology Opportunities
Program (BTOP) at NTIA
Infrastructure-Related Grants
At least $200 Million – Public Computer Center (PCC)
At least $250 Million – Innovative Programs to Encourage
Sustainable Broadband Adoption (SBA)
Up to $350 Million to develop a National Broadband
Map

5
BTOP Program Purposes
Provide access in unserved areas
Provide improved access in underserved areas
Provide broadband education, awareness,
training, access, equipment and support
Improve access and use by public safety
agencies
Stimulate broadband demand, economic growth,
and job creation

6
NTIA Responsibilitiesfor BTOP Data
Report to Congress every 3 months on status of program
Establish publicly available database of grant
applications and recipients at www.broadbandusa.gov
Require grant recipients to report on ARRA measures
www.FederalReporting.gov
Require grant recipients to report quarterly on financials
and programmatic progress

Types of Recipient Data
Grantee reporting requirements are under development
and must comply with OMB information collection
requirements. Some examples of the ARRA and BTOP
data elements would include:
ARRA: Number of jobs created/retained by recipient
project; total cost of infrastructure investments made
by state and local governments.
BTOP: Progress in achieving the project goals,
objectives, and milestones; expenditure of grant
funds; amount of non-federal investment being added
to complete the project.

Types of Recipient Data (cont’d)
Some examples of the BTOP project specific elements
include:
Infrastructure Projects: Availability of broadband offering
including technology used, location of infrastructure, area
served and number of households passed.
SBA: The technology being fostered; the increase in the
number of homes/businesses/anchor institutions
subscribing to broadband service.
PCC: Number of work stations available to public; total
hours of operation per week that the PCC is open; speed
of broadband to the public computer center.

9
Our Question For You
What data do you want from the BTOP
data base?
How would it be useful?

10
Towards a
National Broadband Map
American Recovery and Reinvestment Act of 2009
11
Laying the Groundwork
The State Broadband Data and Development Grant Program
One eligible entity per state;
Initially funding two years of broadband mapping efforts, and up to $500,000 for broadband planning efforts;
Received applications from all 50 states, 5 territories and the District of Columbia;
Awardees of the program are required to collect and verify broadband availability data for their states; and
Specific Information about the data to be collected can be found in the Federal Register Notices published on July 7th and August 9th 2009.

12
Data Collected Through the SBDD Grant Program
For wireline services, data may be submitted by state to NTIA by address or census block/street segment and will include information such as provider name, end user category, type of technology, maximum advertised up/downstream speed and typical up/downstream speed.
For wireless services, data will be submitted by state via shapefilesdepicting areas in which broadband services are available, types of technology, spectrum used, maximum advertised speeds and typical speeds.
For Community Anchor Institutions (CAI), data will be submitted to NTIA indicating whether the CAI currently subscribes to broadband services, the type of broadband technology subscribed to, and the current advertised upstream/downstream speed subscribed to.
CAIs include: schools, libraries, medical and healthcare providers, public safety entities, community colleges and other institutions of higher education, and other community support organizations and entities.
As discussed in the NOFA, NTIA also contemplates collecting pricing data from publicly available sources.
13
Our Question For You
What data do you want the national
broadband map to display?
How would it be useful?

14
Current Population Survey
• Basic CPS Information (e.g., Unemployment rate, industry and occupation, usual weekly earnings)
• Supplements– January Displaced Workers
– April Child Support
– June Fertility
– August Veterans
– September Volunteers
– October School Enrollment
– November Voting and Registration
– December Food Security
– Other Topics as appropriate: INTERNET USE!
15
Current Population Survey
• large sample/ scientific design
• small standard error
• high response rate for both the basic CPS and Internet Use Supplement

16
Current Population Survey
• State Based Sample Design
– 53 Separate Samples
• 48 States
• District of Columbia
• New York– New York City
– Balance of State
• California– Los Angeles County
– Balance of State
17
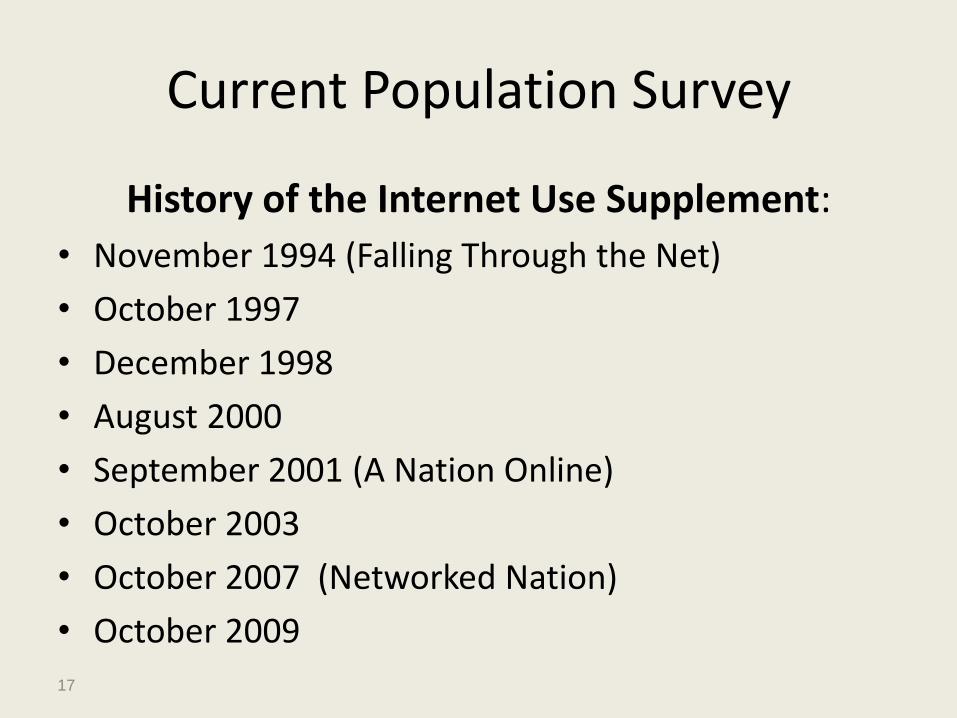
Current Population Survey
History of the Internet Use Supplement:
• November 1994 (Falling Through the Net)
• October 1997
• December 1998
• August 2000
• September 2001 (A Nation Online)
• October 2003
• October 2007 (Networked Nation)
• October 2009

18
Current Population Survey
October 2007
• Sample Size: approx. 54,000 households/
Information on 128,395 persons
• Focus on dial-up vs. broadband at home vs. non-use (only 4 questions).
• Basic finding: 50.8% US HHs had broadband (rural = 38.8%).
19
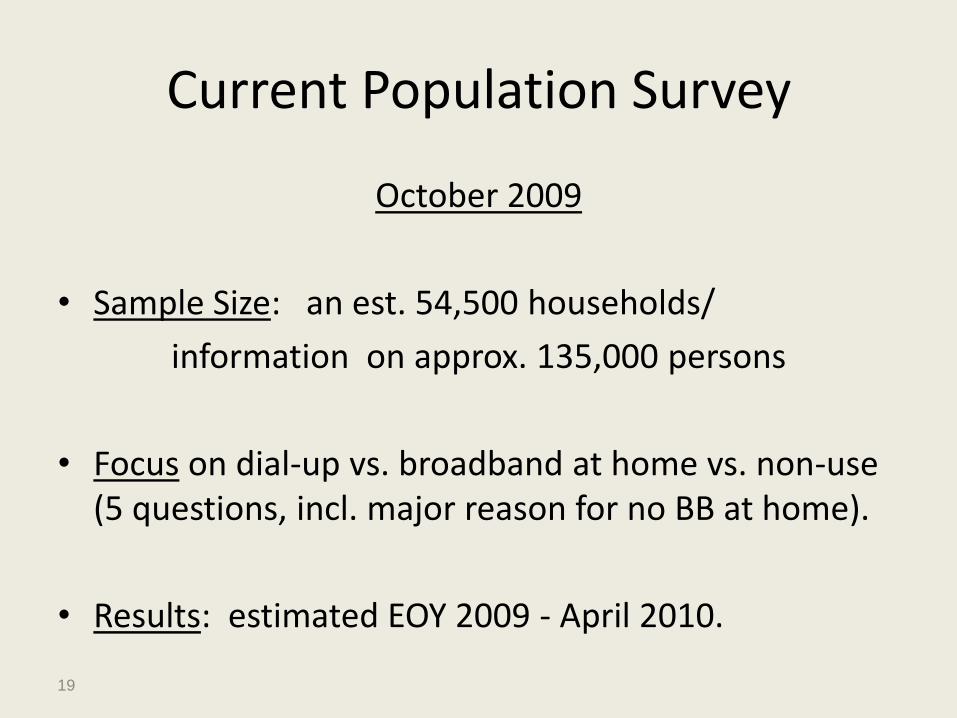
Current Population Survey
October 2009
• Sample Size: an est. 54,500 households/
information on approx. 135,000 persons
• Focus on dial-up vs. broadband at home vs. non-use (5 questions, incl. major reason for no BB at home).
• Results: estimated EOY 2009 - April 2010.
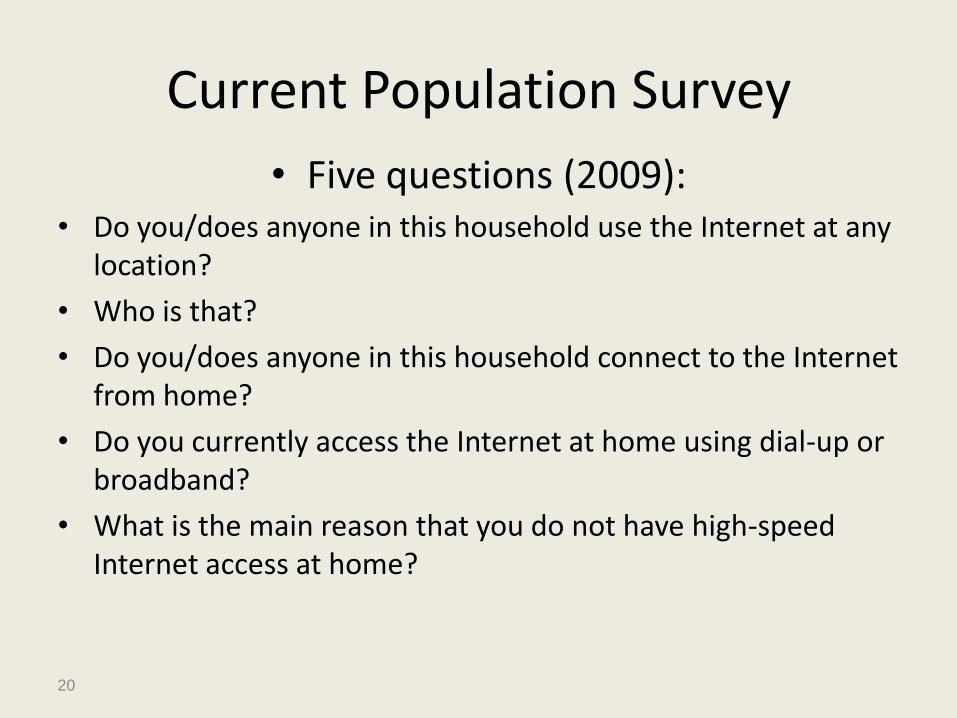
Current Population Survey
• Five questions (2009):• Do you/does anyone in this household use the Internet at any
location?
• Who is that?
• Do you/does anyone in this household connect to the Internet from home?
• Do you currently access the Internet at home using dial-up or broadband?
• What is the main reason that you do not have high-speed Internet access at home?
20
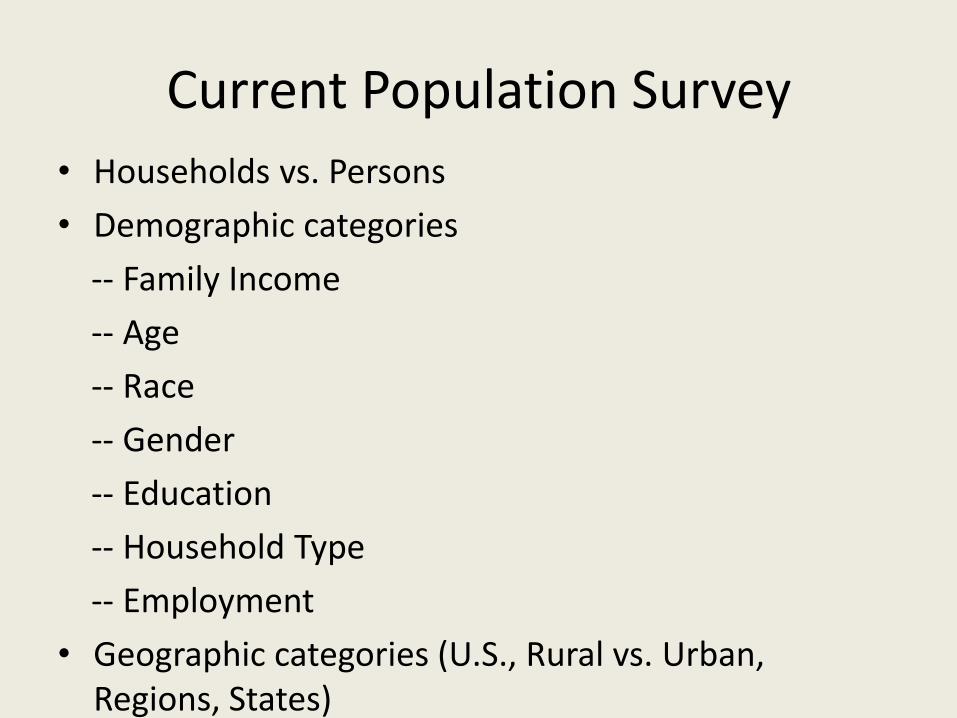
Current Population Survey
• Households vs. Persons
• Demographic categories
-- Family Income
-- Age
-- Race
-- Gender
-- Education
-- Household Type
-- Employment
• Geographic categories (U.S., Rural vs. Urban, Regions, States)
22
Current Population Survey
Links to the data
• http://www.bls.census.gov/cps_ftp.html#cpssupps
• http://dataferrett.census.gov/
23
Our Question For You
What data do you want future CPS
surveys to capture?
How would it be useful?

24
NTIA’s Recovery Act broadband programs are subject to the requirements of:
• The Paperwork Reduction Act
– Subject to OMB approval.
• The Trade Secrets Act
• The Freedom of Information Act (FOIA)
– Some information may be exempt from disclosure pursuant to FOIA exemptions.
Legal Considerations
25
• Three FOIA exemptions may be relevant to broadband information:
– (b)(4) Trade Secrets and Confidential Commercial/Financial Information
– (b)(5) Deliberative Process Privilege
– (b)(6) Personal Privacy
Key FOIA Exemptions

Core Issues of the Workshop
1. The types and frequency of broadband data that NTIA can compile through its ongoing programs and research that will be useful to the research community.
2. The current sources of data available to the research community for research related to broadband Internet access.
3. The economic, social, policy, or other areas that research related to broadband Internet access can inform.
4. The emergent themes, trends, and new directions within the research community regarding broadband Internet access data.
5. The data format preferred by researchers including those for distributing broadband-related data on the Web to promote maximum transparency for researchers and the interested public.


