40
ntopng A Web-based Network Traffic Monitoring Application New York City, NY June 14th, 2017 Simone Mainardi <[email protected]> linkedin.com/in/simonemainardi
| Date post: | 07-Mar-2018 |
| Category: |
Documents |
| Upload: | nguyendang |
| View: | 255 times |
| Download: | 4 times |

ntopng
A Web-based Network Traffic Monitoring Application
New York City, NY June 14th, 2017
Simone Mainardi <[email protected]>linkedin.com/in/simonemainardi

Agenda
• About ntop• Network traffic monitoring using ntopng◦Motivation◦ntopng architectural design and interfaces
• Integrations with third-party software◦Grafana◦Logstash
• Summary

© 2017 - ntop.org
About ntop

© 2017 - ntop.org
About ntop
• Private company devoted to development of Open Source network traffic monitoring applications.
• R&D Italy, Sales Switzerland.• ntop (circa 1998) isthe first app we released and it is aweb-based networkmonitoringapplication.
4
© 2017 - ntop.org
Product Lines
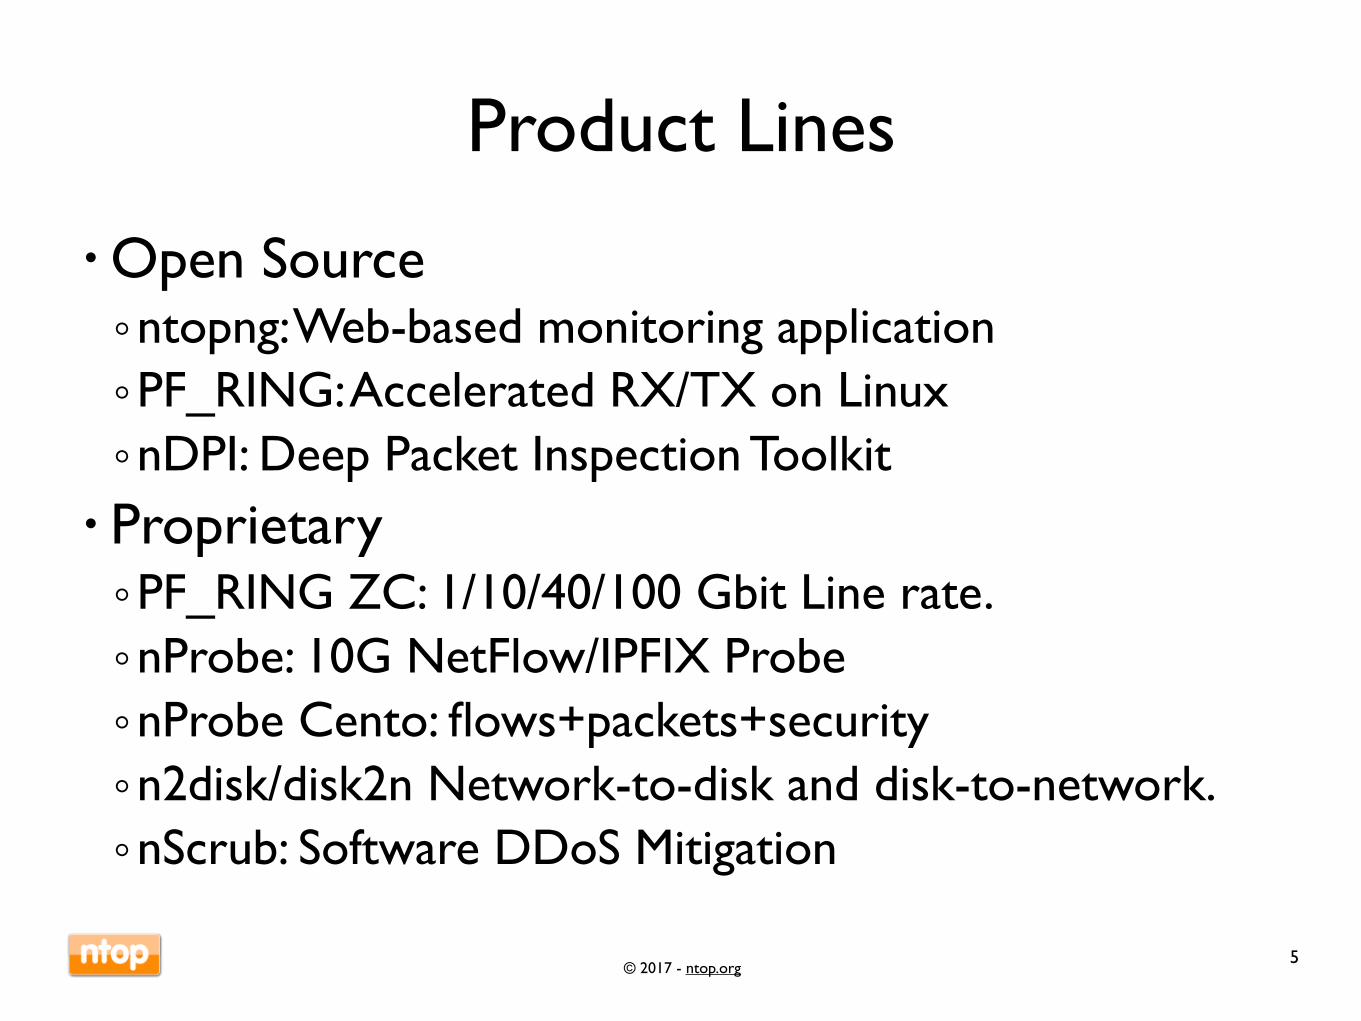
• Open Source◦ntopng: Web-based monitoring application◦PF_RING: Accelerated RX/TX on Linux◦nDPI: Deep Packet Inspection Toolkit
• Proprietary◦PF_RING ZC: 1/10/40/100 Gbit Line rate.◦nProbe: 10G NetFlow/IPFIX Probe◦nProbe Cento: flows+packets+security◦n2disk/disk2n Network-to-disk and disk-to-network.◦nScrub: Software DDoS Mitigation
5

© 2017 - ntop.org
Network Traffic MonitoringUsing ntopng

© 2017 - ntop.org7
“To measure is to know”
“If you can not measure it,you can not improve it”
Lord William Thomson
(aka Lord Kelvin)

© 2017 - ntop.org
What Happens in Our Network?
• Do we have control over our network?• It’s not possible to imagine a healthy network without a clear understanding of traffic flowing on our network
• Knowledge is the first step towards evaluation of potential network security issues
• Event correlation can provide us timely information about our network health
8
© 2017 - ntop.org
Packets Never Lie
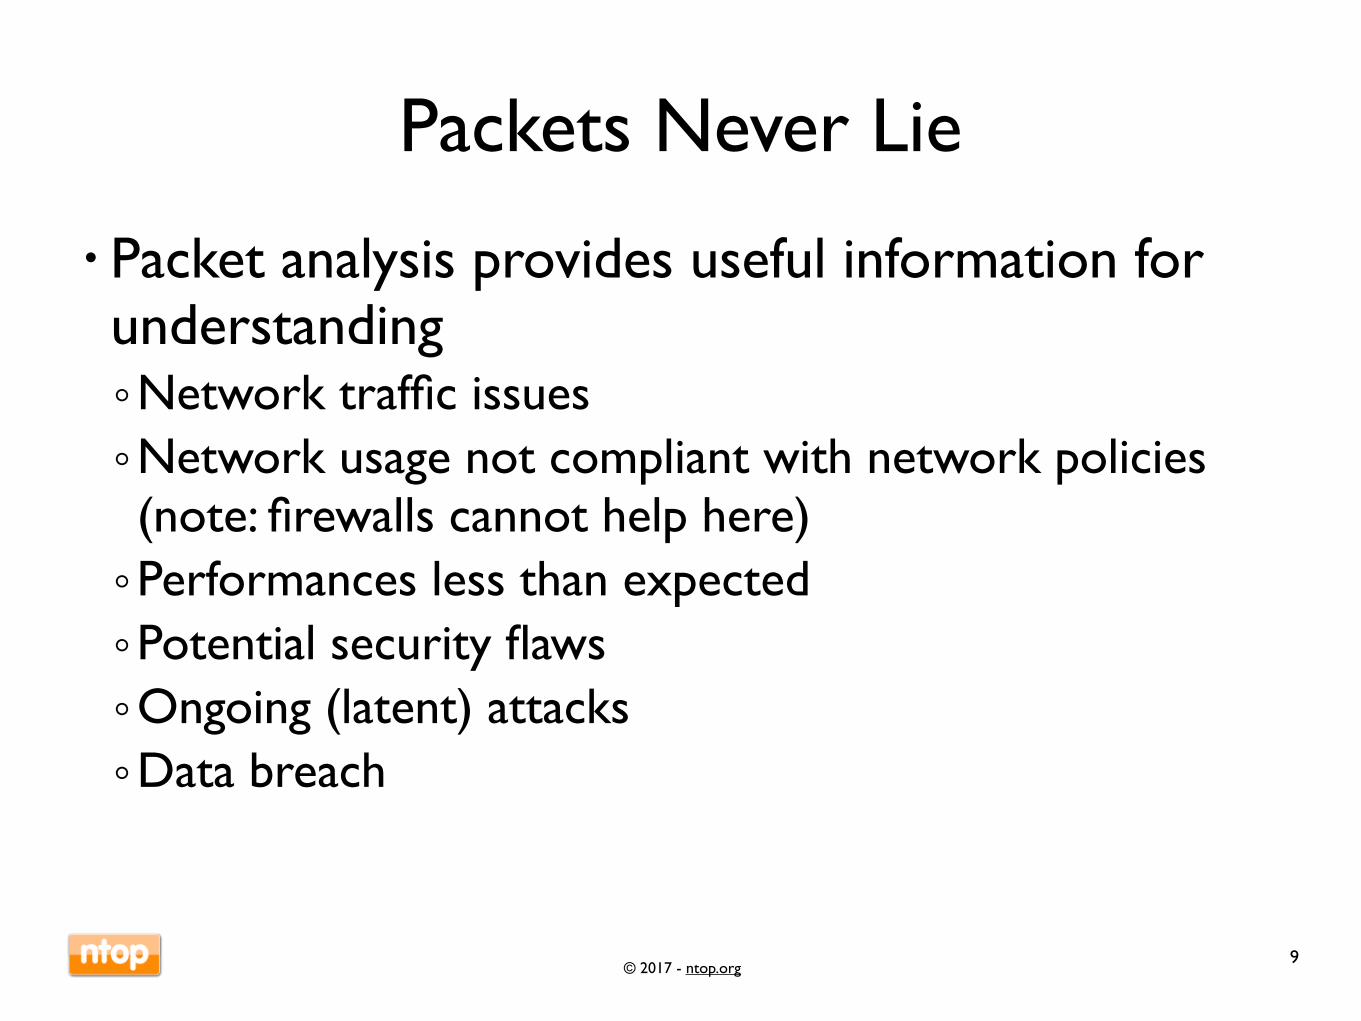
• Packet analysis provides useful information for understanding◦Network traffic issues◦Network usage not compliant with network policies (note: firewalls cannot help here)◦Performances less than expected◦Potential security flaws◦Ongoing (latent) attacks◦Data breach
9

© 2017 - ntop.org
Before We Start: ntopng Installation
• Source codehttps://github.com/ntop/ntopng
• Binary Packages (stable and nightly) http://packages.ntop.org (Debian, Ubuntu, CentOS, OSX, Raspbian (ARM), FreeBSD, Windows)
10

© 2017 - ntop.org
ntopng Architecture
11
• Three different and self-contained components, communicating with clean API calls.
Users
HTTPLua-based Web Reports
nDPI-based C++ Monitoring Engine
PF_RING Kernel Module and Drivers
InternetTraffic
Lua API Calls
PF_RING C API Calls(Linux) Kernel
Data Cache

© 2017 - ntop.org
Lua-based ntopng Scriptability [1/3]
• A design principle of ntopng has been the clean separation of the GUI from engine (in ntop it was all mixed)
• This means that ntopng can (also) be used (via HTTP) to feed data into third party apps such as Grafana and Nagios, just to name a few
• All data export from the engine happens via Lua• Lua methods invoke the ntopng C++ API in order to interact with the monitoring engine
12

© 2017 - ntop.org
Lua-based ntopng Scriptability [2/3]
• /scripts/callback/ scripts are executedperiodically to performspecific actions.
• /scripts/lua/ scriptsare executed only by the web GUI.
• Example: http://ntopng:3000/lua/flow_stats.lua
13
© 2017 - ntop.org
Lua-based ntopng Scriptability [3/3]
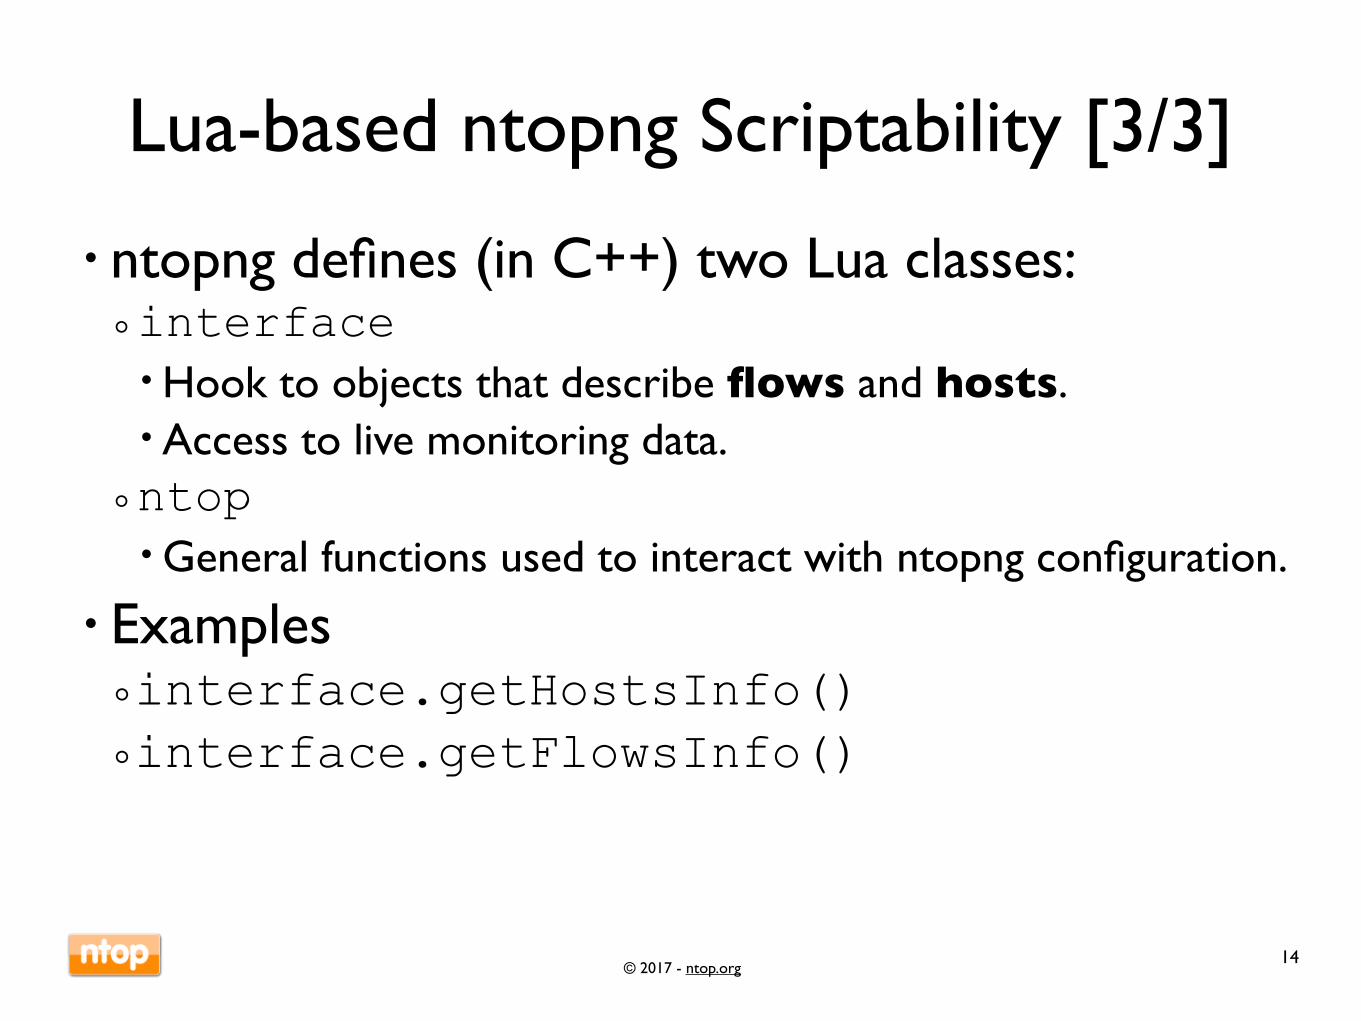
• ntopng defines (in C++) two Lua classes:◦interface !Hook to objects that describe flows and hosts.!Access to live monitoring data.◦ntop !General functions used to interact with ntopng configuration.
• Examples◦interface.getHostsInfo() ◦interface.getFlowsInfo()
14

© 2017 - ntop.org
ntopngInterfaces

© 2017 - ntop.org
Web UI: Active Flows [1/2]
16
http://localhost:3000/lua/flows_stats.lua
© 2017 - ntop.org
Web UI: Active Flows [2/2]
17
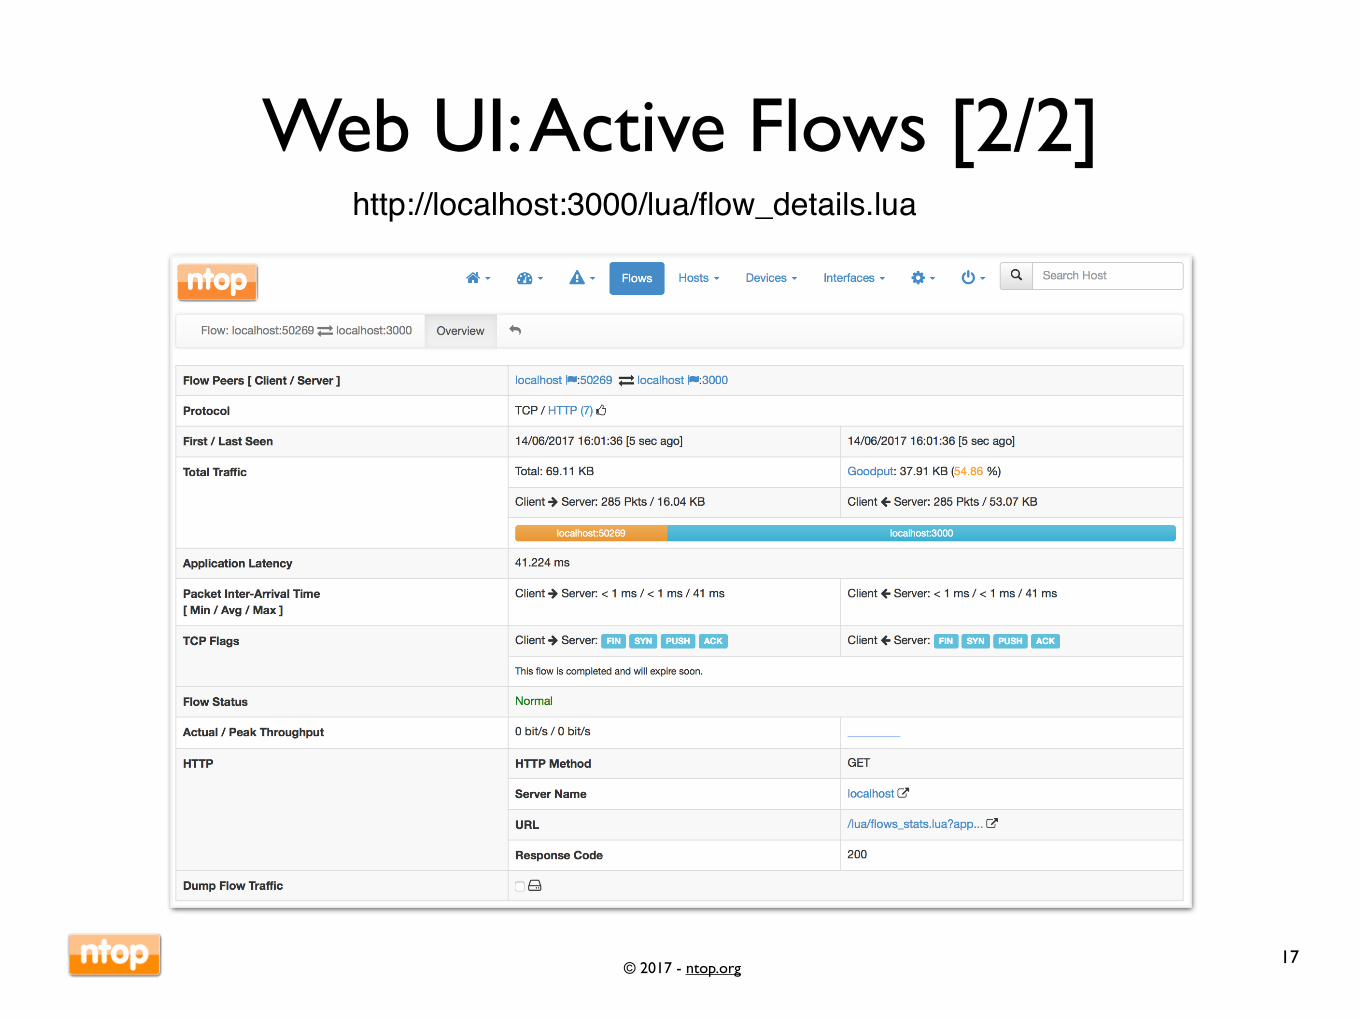
http://localhost:3000/lua/flow_details.lua
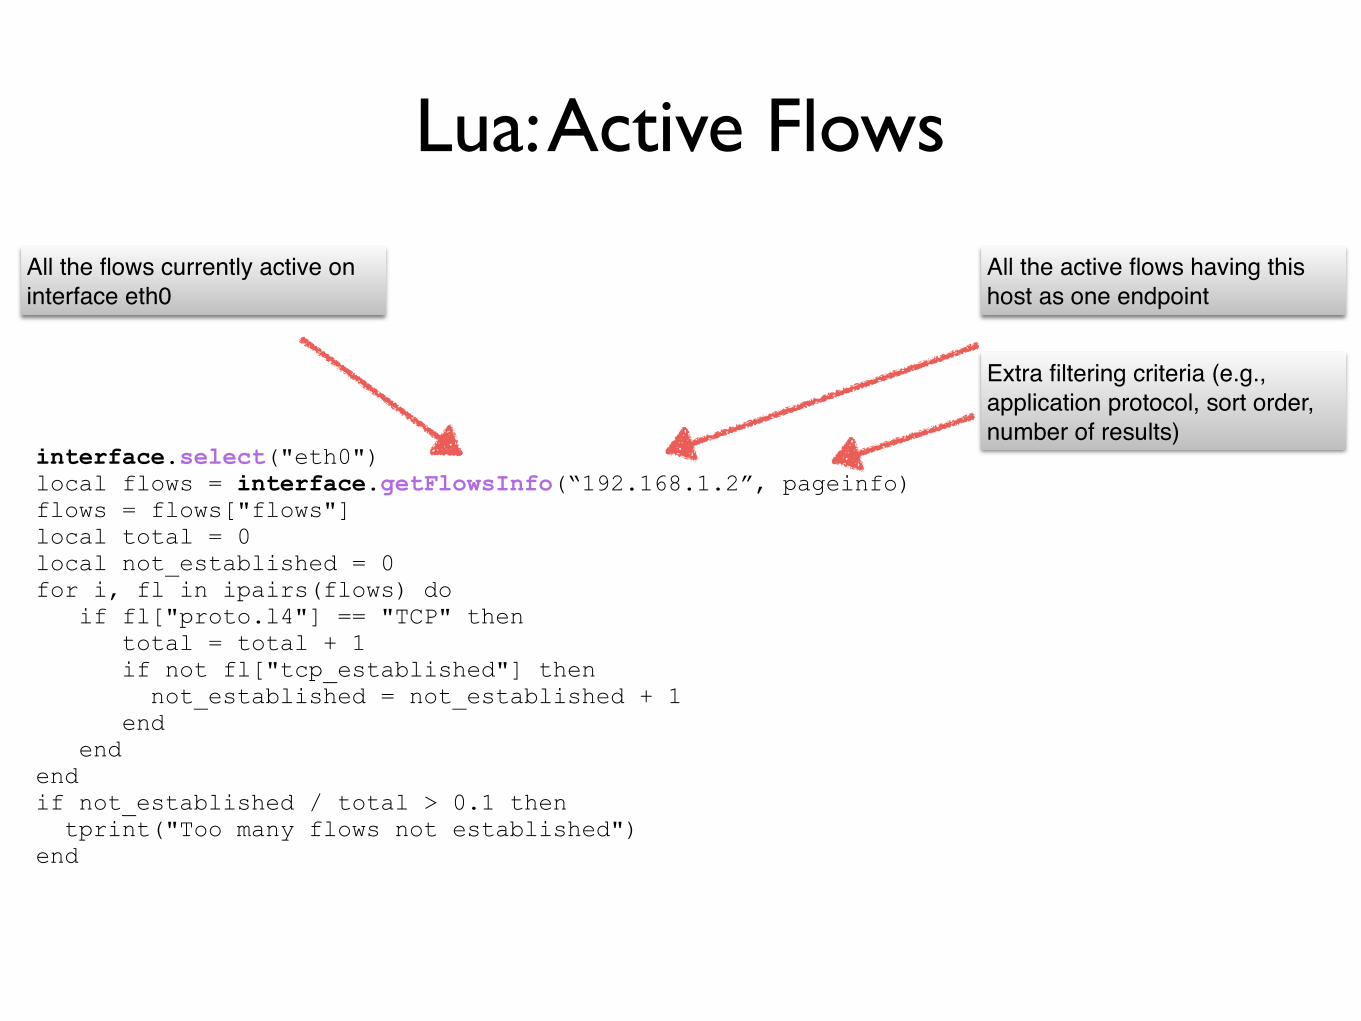
Lua: Active Flows
interface.select("eth0") local flows = interface.getFlowsInfo(“192.168.1.2”, pageinfo) flows = flows["flows"] local total = 0 local not_established = 0 for i, fl in ipairs(flows) do if fl["proto.l4"] == "TCP" then total = total + 1 if not fl["tcp_established"] then not_established = not_established + 1 end end end if not_established / total > 0.1 then tprint("Too many flows not established") end
All the active flows having this host as one endpoint
Extra filtering criteria (e.g., application protocol, sort order, number of results)
All the flows currently active on interface eth0

© 2017 - ntop.org
Web UI: Active Hosts [1/2]
19
http://localhost:3000/lua/hosts_stats.lua
© 2017 - ntop.org
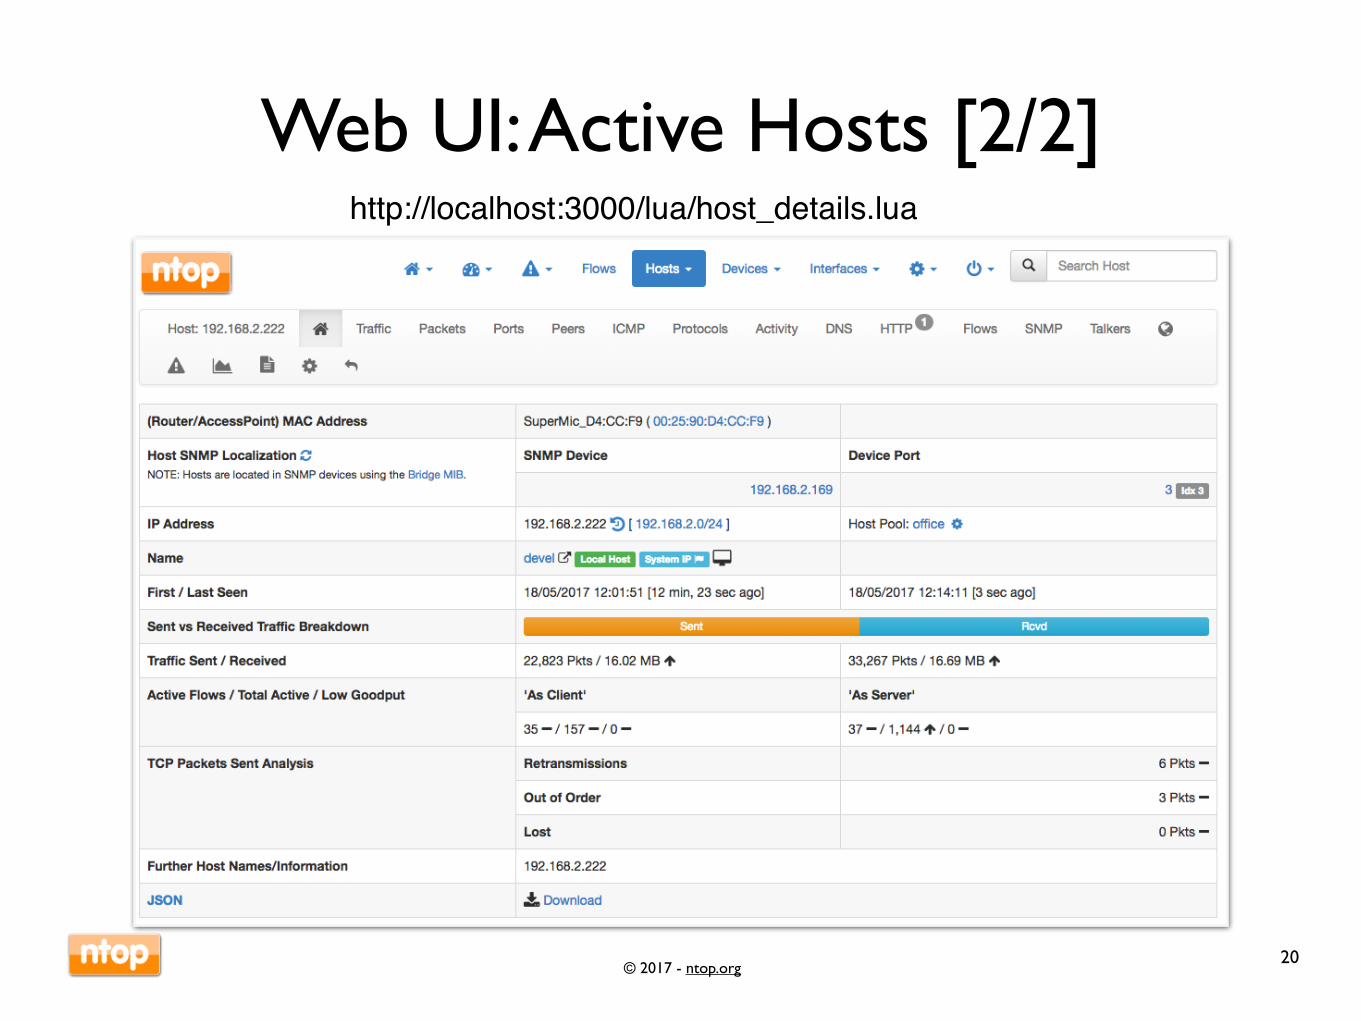
Web UI: Active Hosts [2/2]
20
http://localhost:3000/lua/host_details.lua
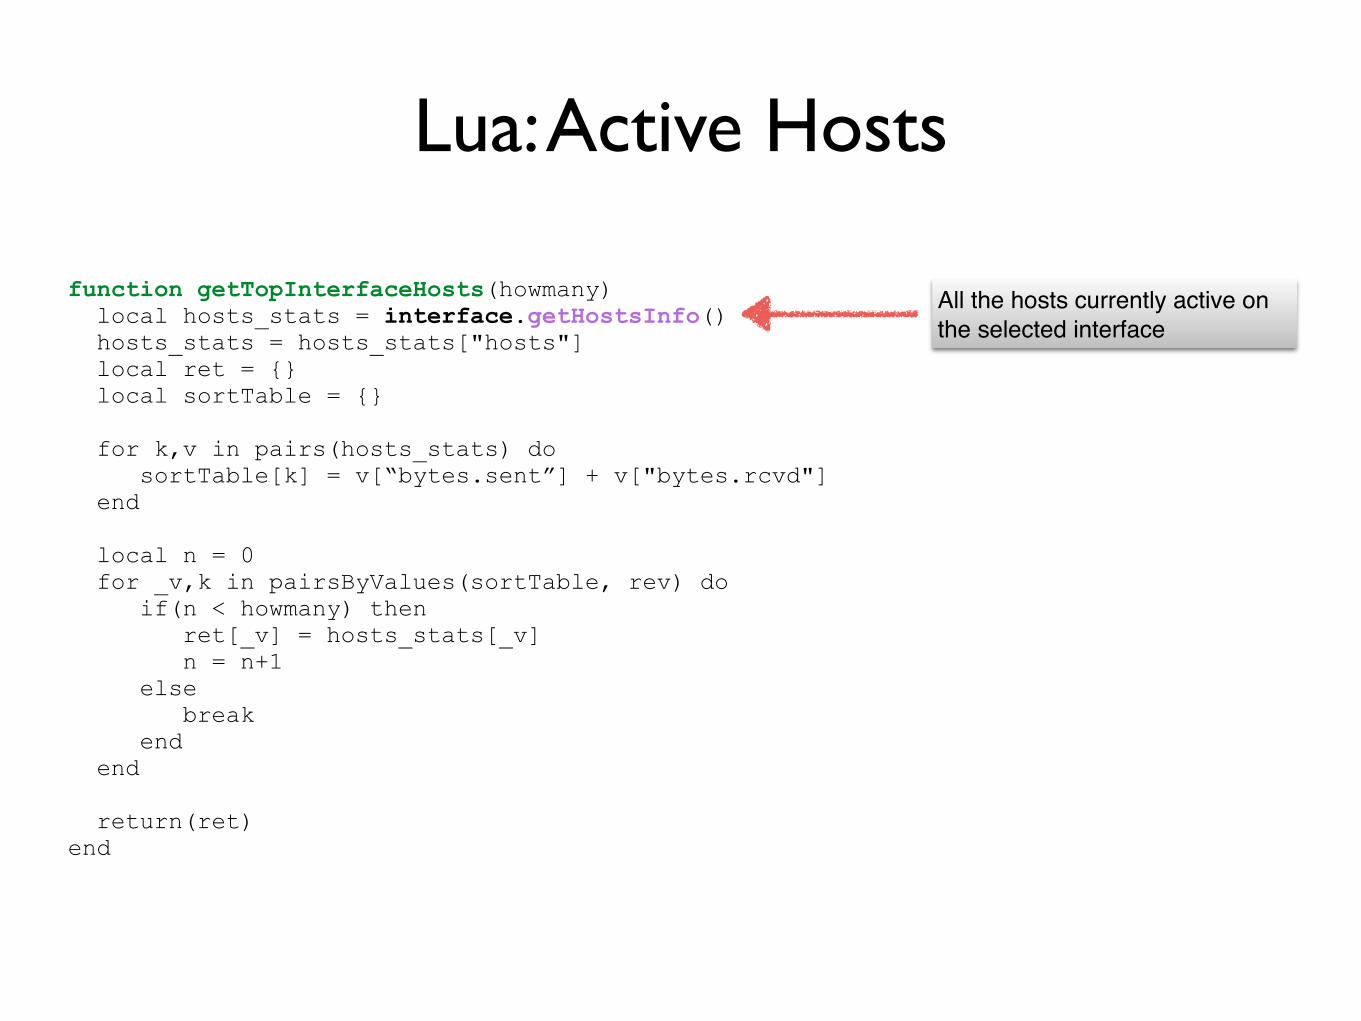
Lua: Active Hosts
function getTopInterfaceHosts(howmany) local hosts_stats = interface.getHostsInfo() hosts_stats = hosts_stats["hosts"] local ret = {} local sortTable = {}
for k,v in pairs(hosts_stats) do sortTable[k] = v[“bytes.sent”] + v["bytes.rcvd"] end
local n = 0 for _v,k in pairsByValues(sortTable, rev) do if(n < howmany) then ret[_v] = hosts_stats[_v] n = n+1 else break end end
return(ret) end
All the hosts currently active on the selected interface

© 2017 - ntop.org
ntopngData Integrations with Third-Party Tools

Supported Third-Party Tools
• Timeseries◦RRDs◦Grafana◦Prometheus (wip)
• Flows◦MySQL/MariaDB◦ElasticSearch◦Logstash

• Platform for monitor (and alert on) metrics• Storage-platform agnostic◦Abstractions with Datasource plugins
• Flexible data visualizations◦Custom (exportable) dashboards◦Reusable dashboard building blocks (Panel plugins)
• Support for 30+ storage platforms◦ Influxdb◦Prometheus◦SNAP◦etc.
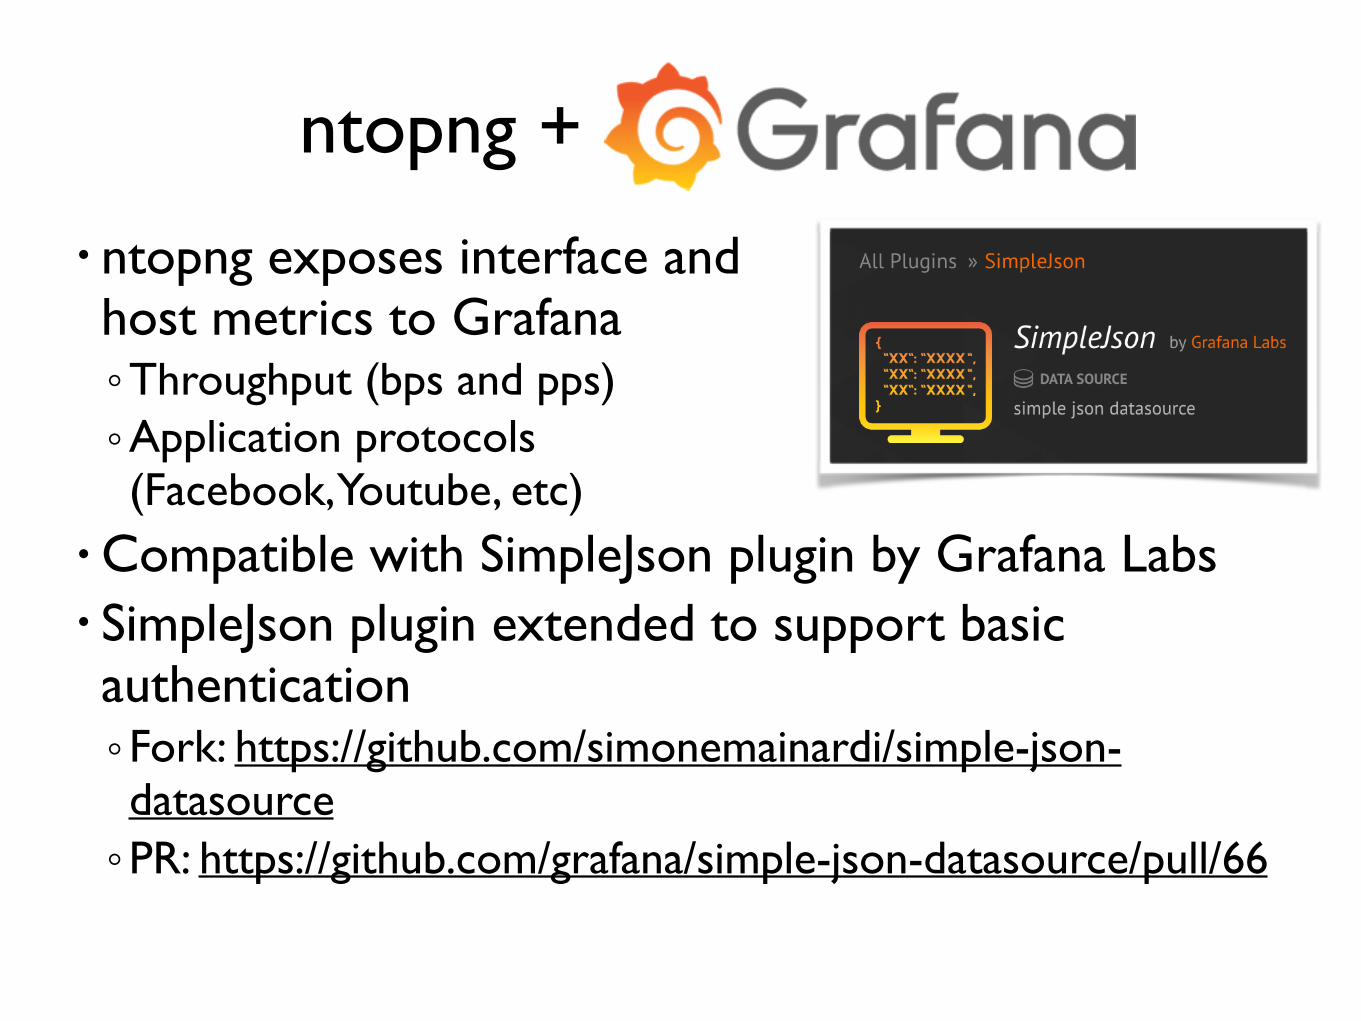
ntopng +
• ntopng exposes interface andhost metrics to Grafana◦Throughput (bps and pps)◦Application protocols(Facebook, Youtube, etc)
• Compatible with SimpleJson plugin by Grafana Labs• SimpleJson plugin extended to support basic authentication◦Fork: https://github.com/simonemainardi/simple-json-datasource◦PR: https://github.com/grafana/simple-json-datasource/pull/66
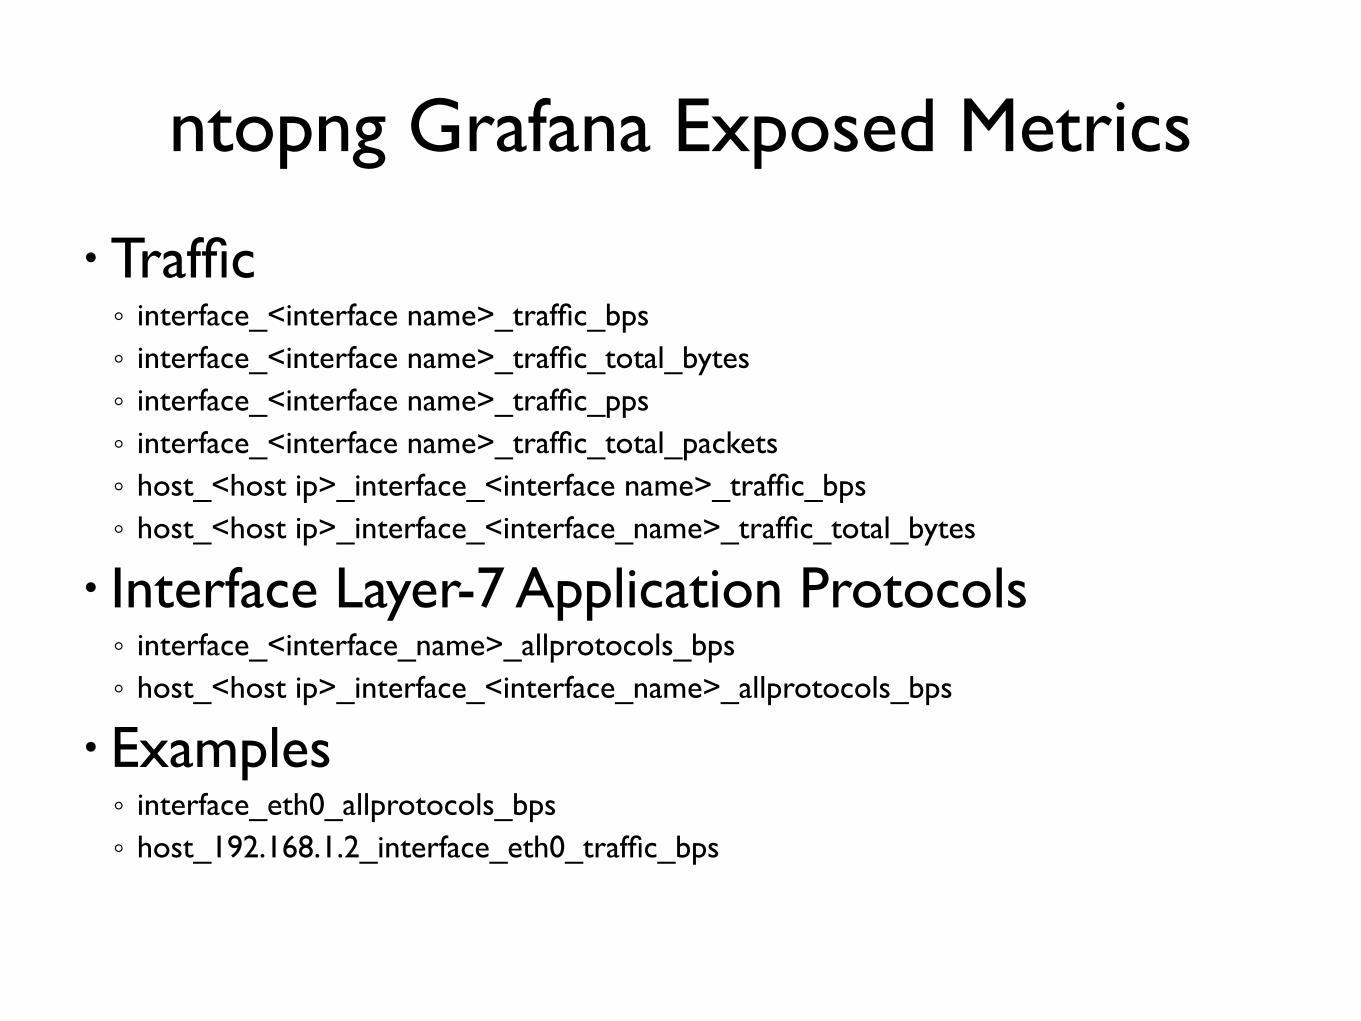
ntopng Grafana Exposed Metrics
• Traffic◦ interface_<interface name>_traffic_bps◦ interface_<interface name>_traffic_total_bytes◦ interface_<interface name>_traffic_pps◦ interface_<interface name>_traffic_total_packets◦ host_<host ip>_interface_<interface name>_traffic_bps◦ host_<host ip>_interface_<interface_name>_traffic_total_bytes
• Interface Layer-7 Application Protocols◦ interface_<interface_name>_allprotocols_bps◦ host_<host ip>_interface_<interface_name>_allprotocols_bps
• Examples◦ interface_eth0_allprotocols_bps◦ host_192.168.1.2_interface_eth0_traffic_bps

Grafana ntopng Datasource
Datasource plugin is SimpleJson
Just a name to identify the datasource
http endpoint is<ntopng host>:<port>/lua/modules/grafana
A user/password pair as created in ntopng
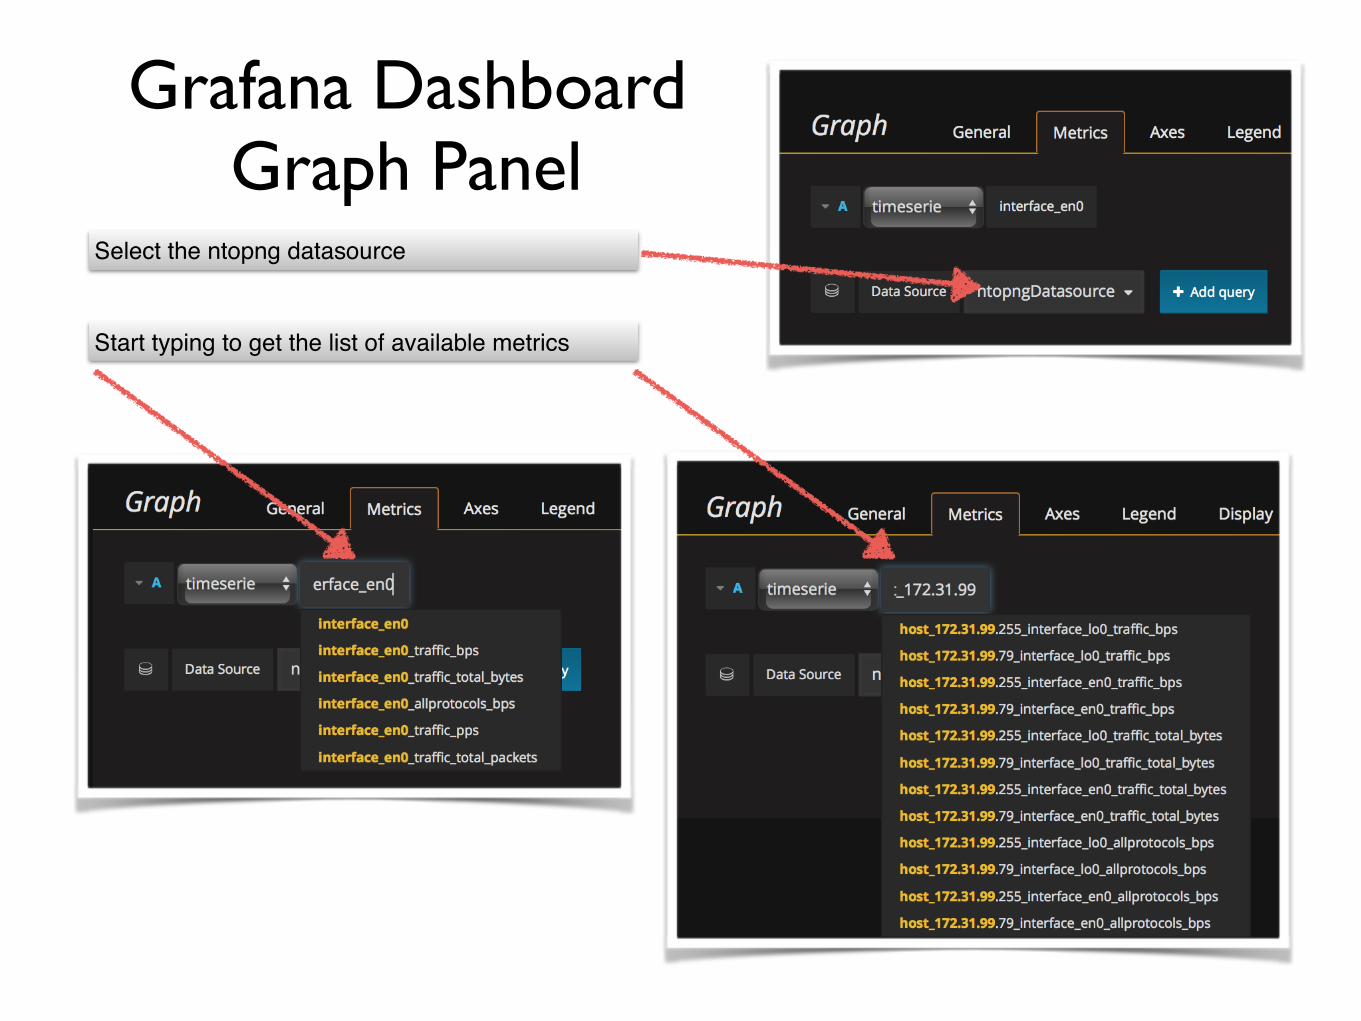
Grafana DashboardGraph Panel
Select the ntopng datasource
Start typing to get the list of available metrics
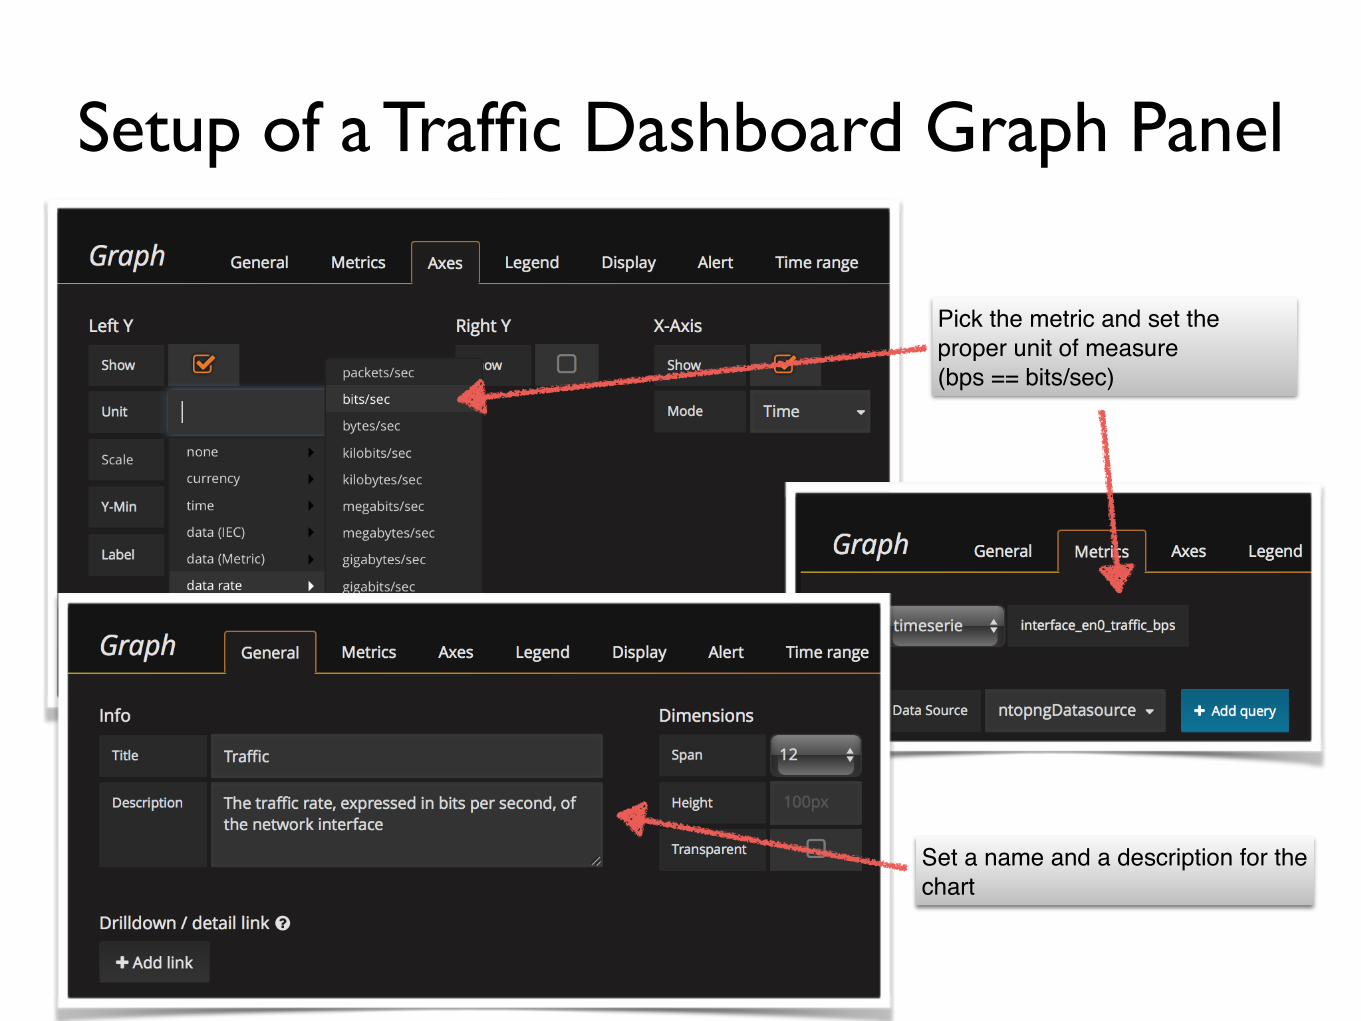
Setup of a Traffic Dashboard Graph Panel
Pick the metric and set the proper unit of measure (bps == bits/sec)
Set a name and a description for the chart

A Traffic Dashboard Graph Panel
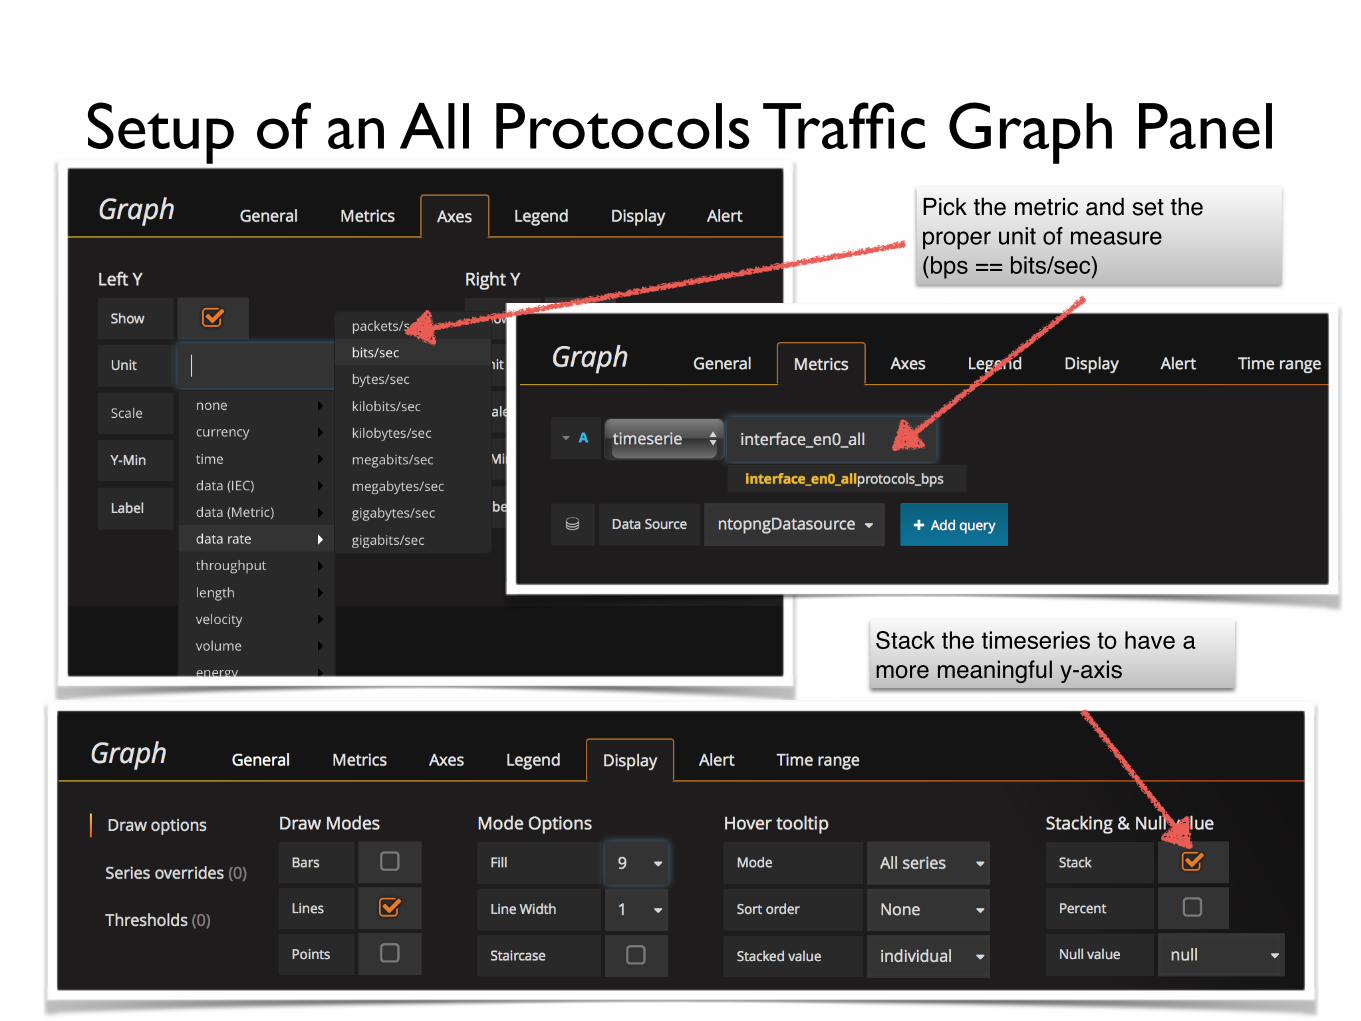
Setup of an All Protocols Traffic Graph PanelPick the metric and set the proper unit of measure (bps == bits/sec)
Stack the timeseries to have a more meaningful y-axis
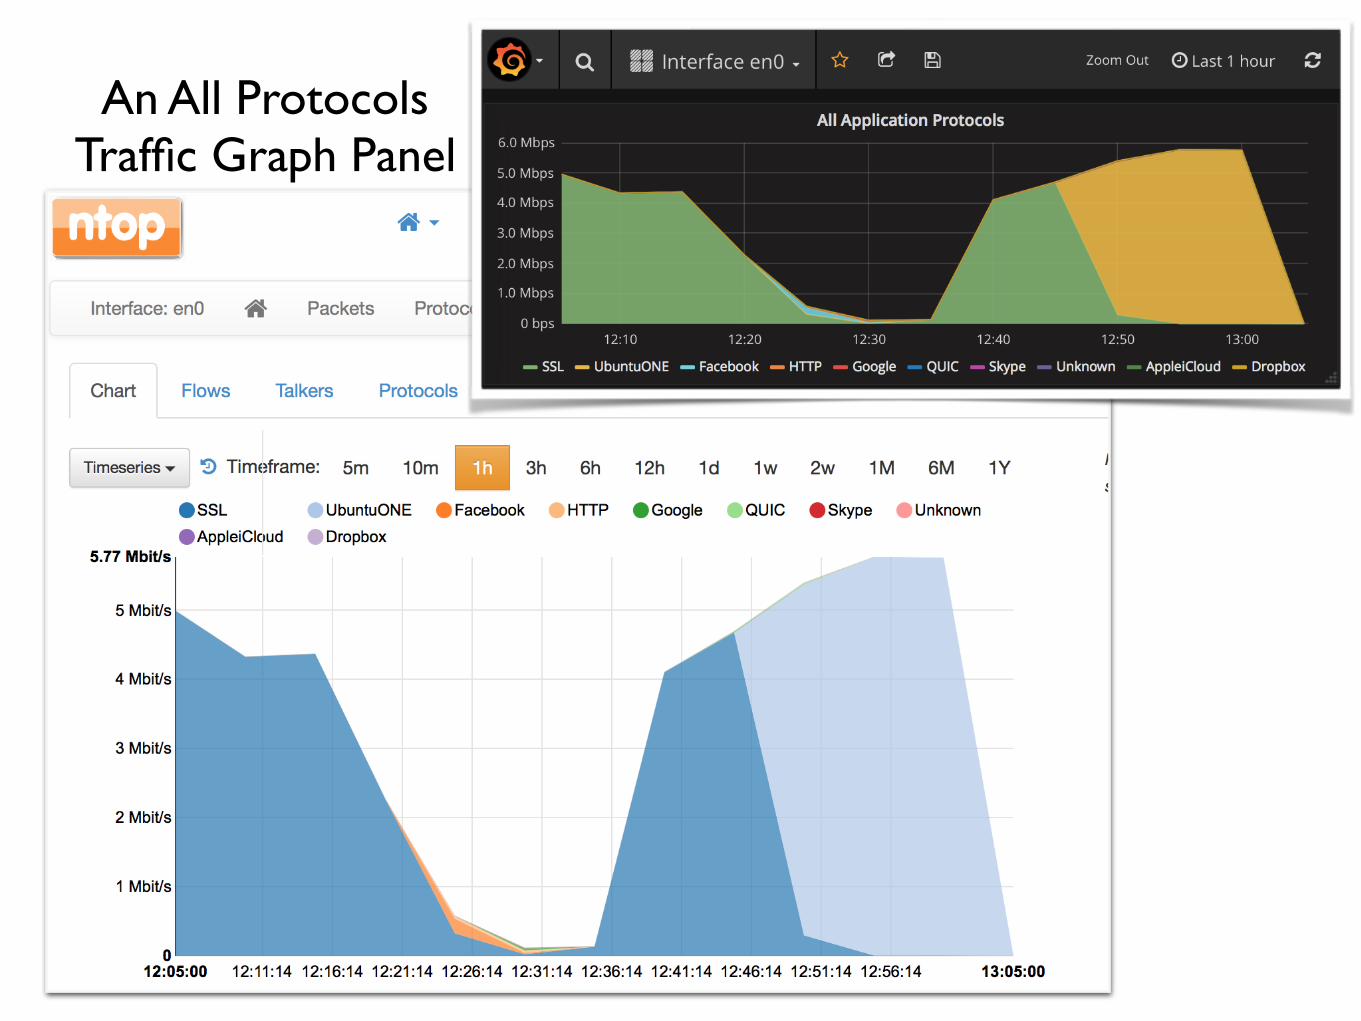
An All Protocols Traffic Graph Panel
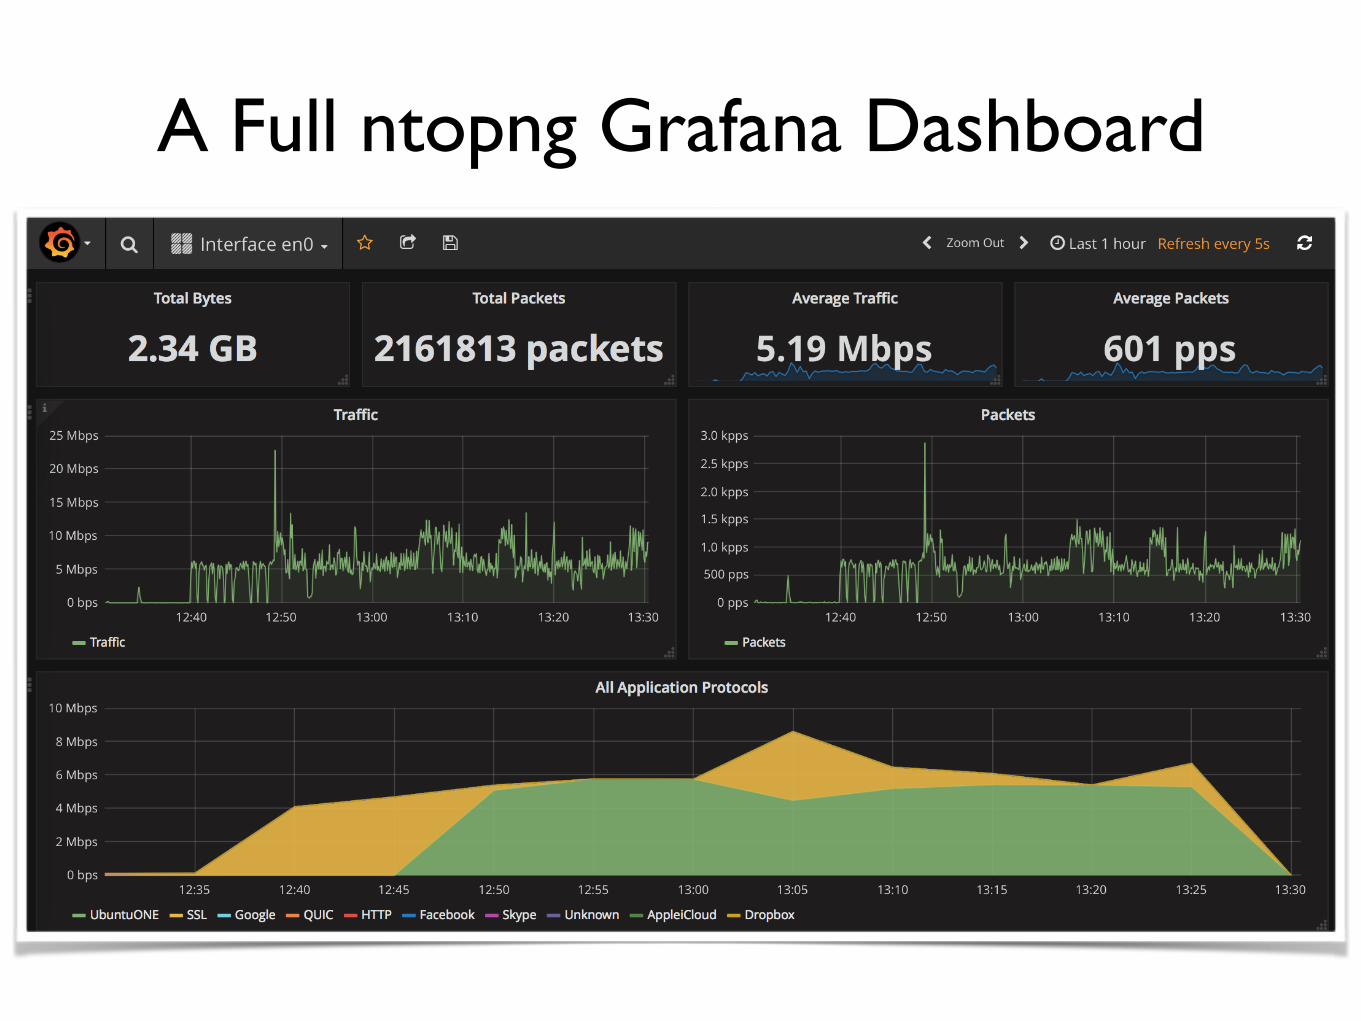
A Full ntopng Grafana Dashboard
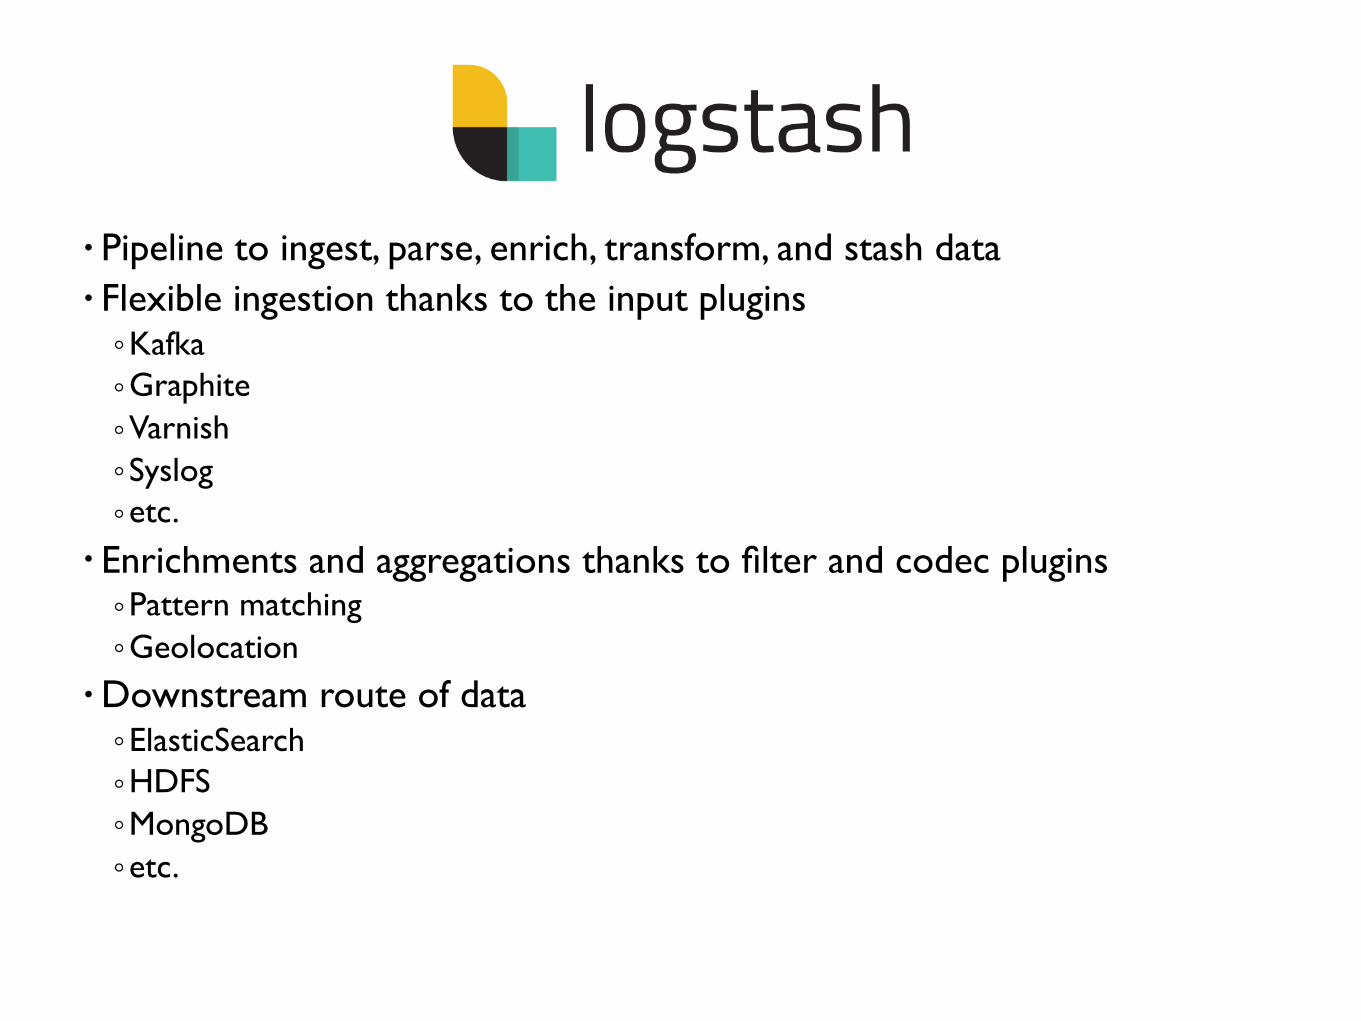
• Pipeline to ingest, parse, enrich, transform, and stash data• Flexible ingestion thanks to the input plugins◦Kafka◦Graphite◦Varnish◦Syslog◦etc.
• Enrichments and aggregations thanks to filter and codec plugins◦Pattern matching◦Geolocation
• Downstream route of data◦ElasticSearch◦HDFS◦MongoDB◦etc.
ntopng +
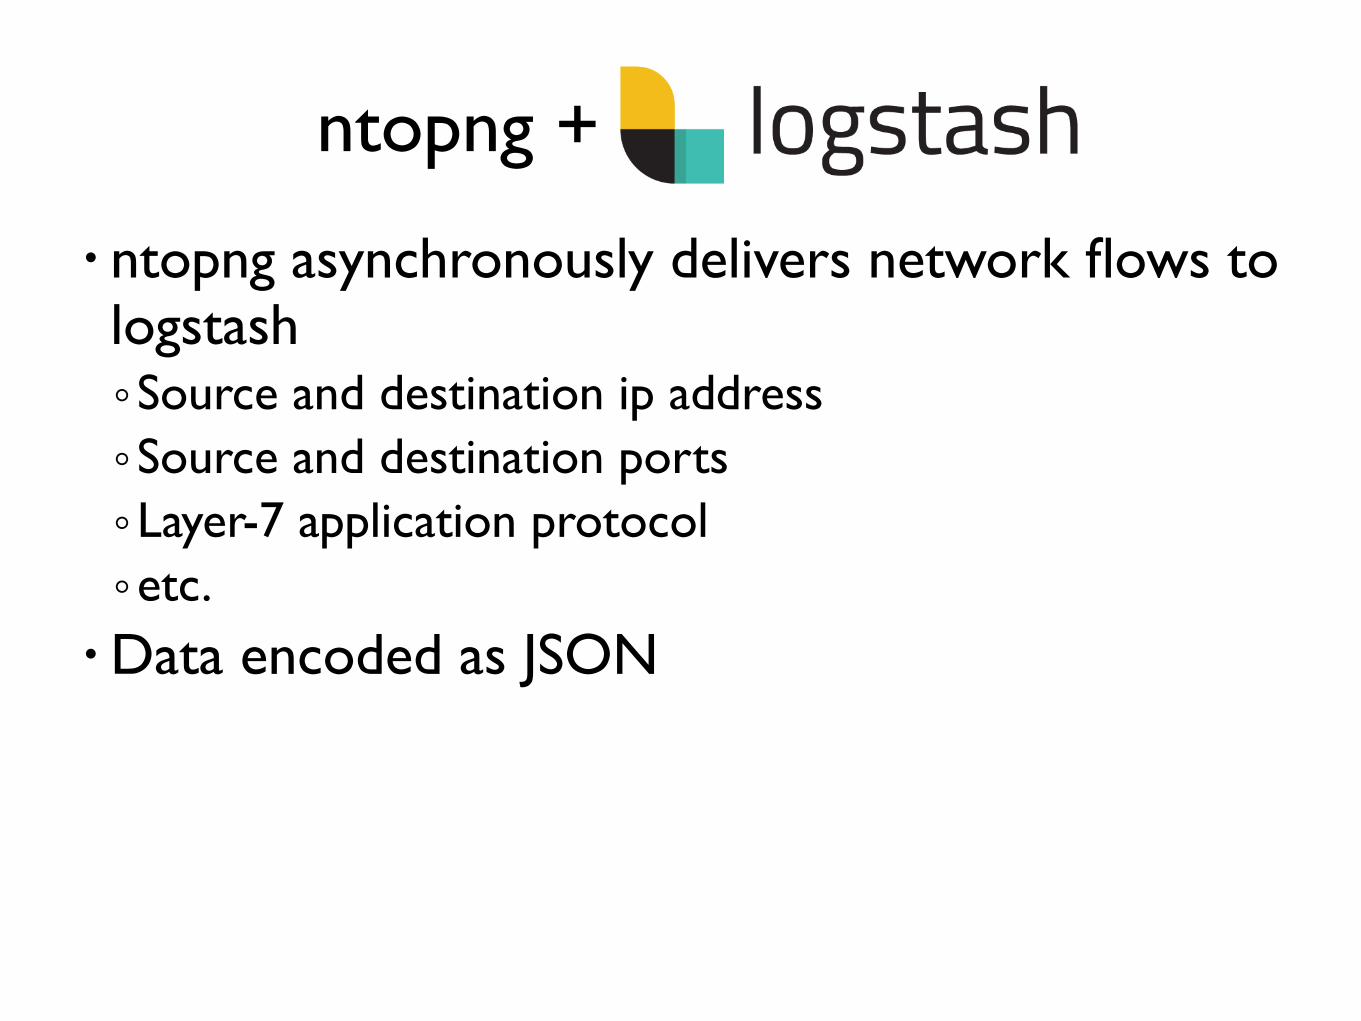
• ntopng asynchronously delivers network flows to logstash◦Source and destination ip address◦Source and destination ports◦Layer-7 application protocol◦etc.
• Data encoded as JSON
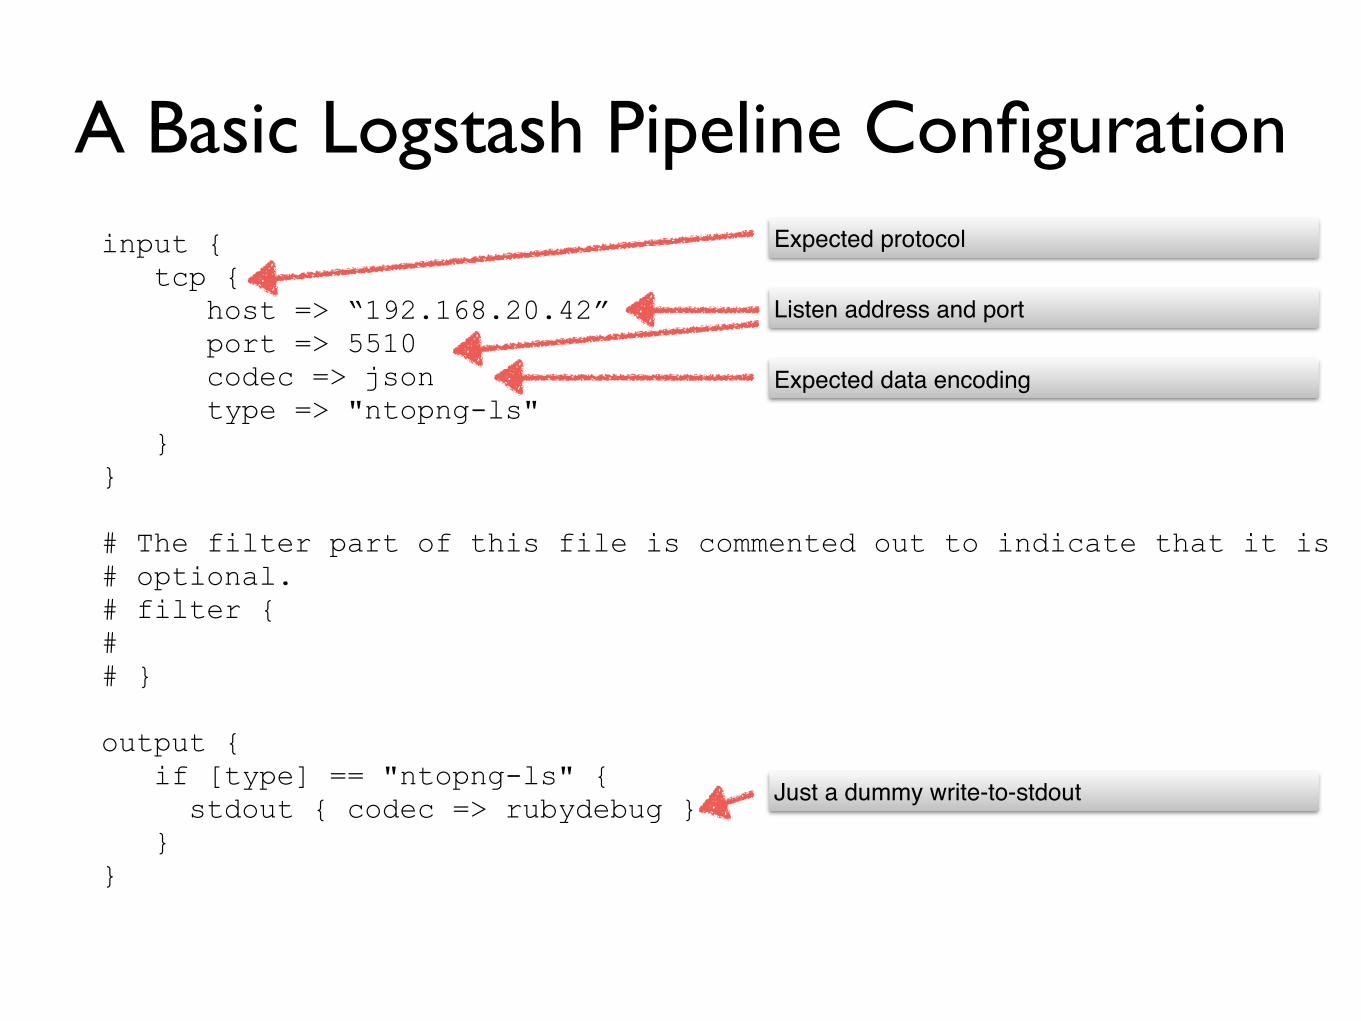
A Basic Logstash Pipeline Configurationinput { tcp { host => “192.168.20.42” port => 5510 codec => json type => "ntopng-ls" } }
# The filter part of this file is commented out to indicate that it is # optional. # filter { # # }
output { if [type] == "ntopng-ls" { stdout { codec => rubydebug } } }
Listen address and port
Expected protocol
Expected data encoding
Just a dummy write-to-stdout
ntopng + Logstash: Starting Logstash
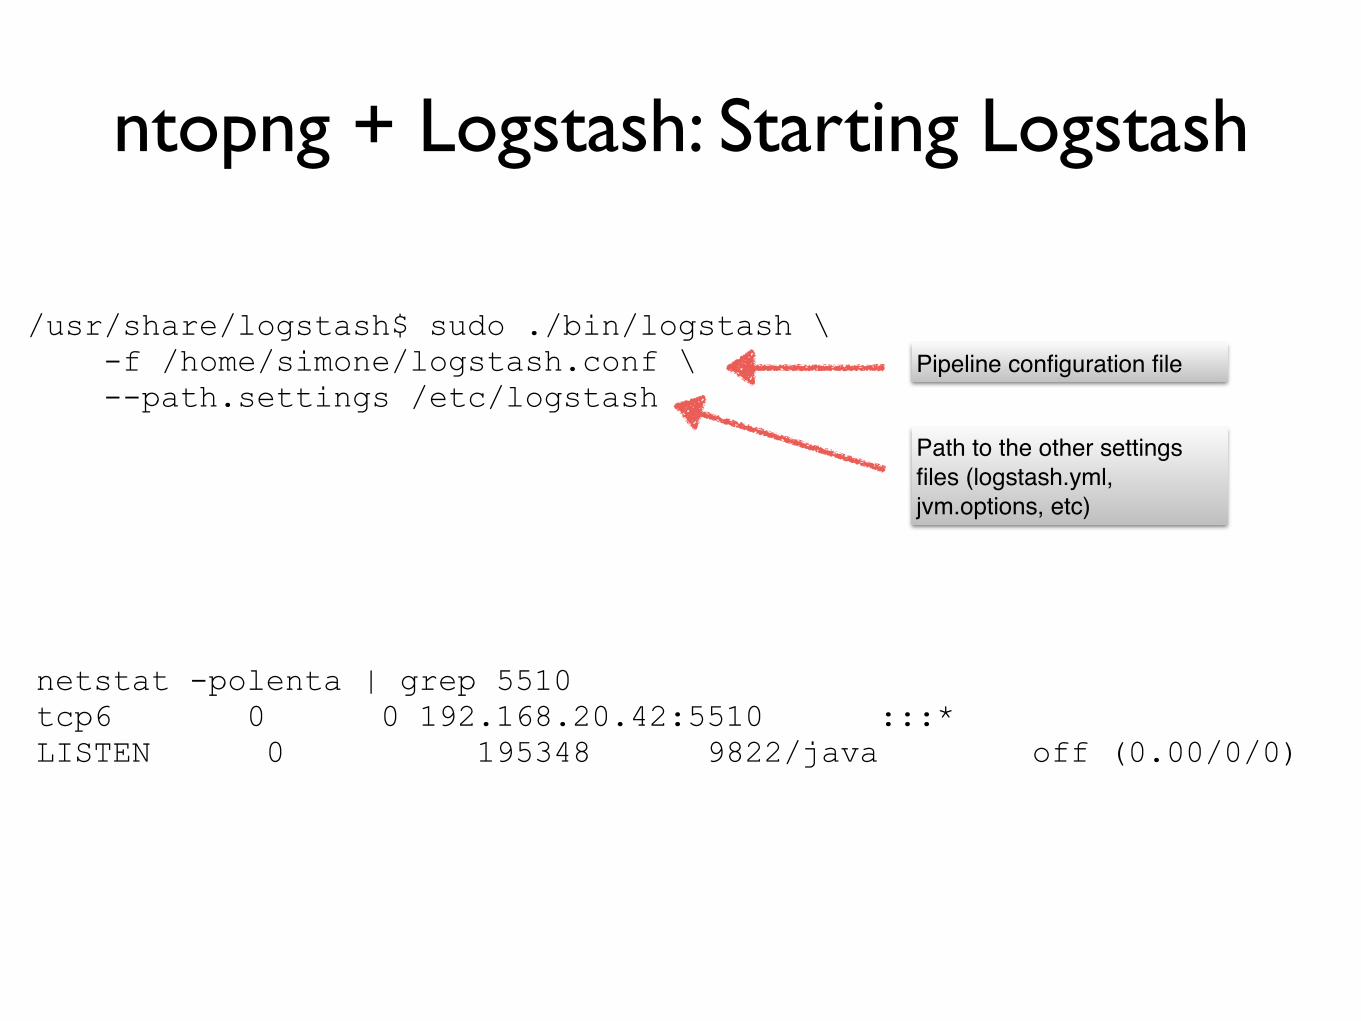
/usr/share/logstash$ sudo ./bin/logstash \ -f /home/simone/logstash.conf \ --path.settings /etc/logstash
Pipeline configuration file
Path to the other settings files (logstash.yml, jvm.options, etc)
netstat -polenta | grep 5510 tcp6 0 0 192.168.20.42:5510 :::* LISTEN 0 195348 9822/java off (0.00/0/0)
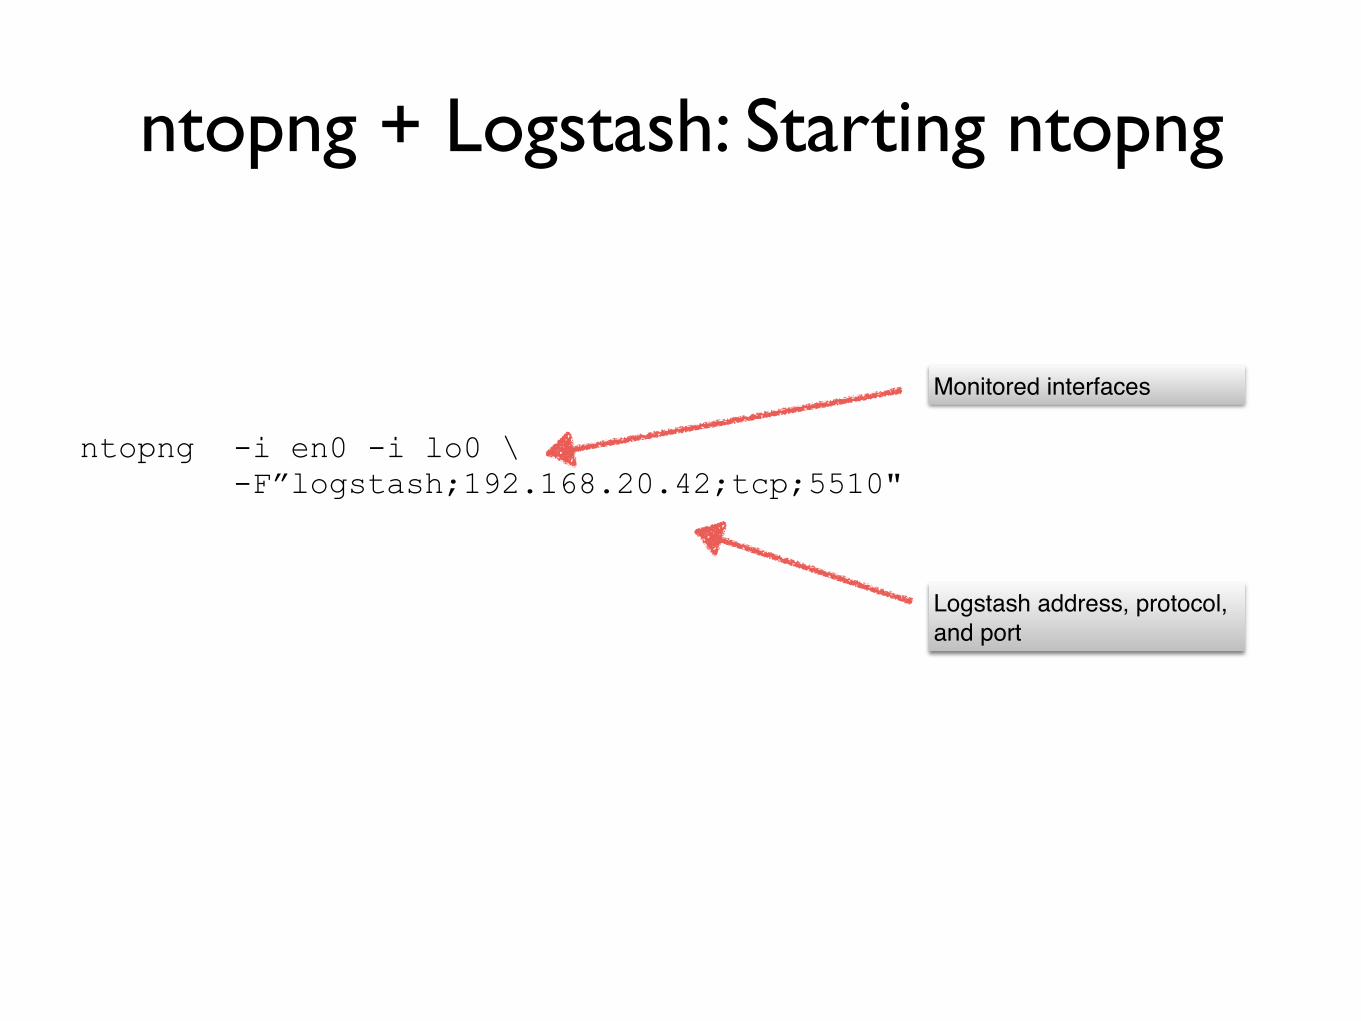
ntopng + Logstash: Starting ntopng
Monitored interfaces
Logstash address, protocol, and port
ntopng -i en0 -i lo0 \ -F”logstash;192.168.20.42;tcp;5510"

Logstash Output Data{ "type" => "ntopng-ls", "L7_PROTO" => 7, "OUT_PKTS" => 16, "HTTP_URL" => "/lua/modules/grafana/query", "NTOPNG_INSTANCE_NAME" => "Simones-MBP", "INTERFACE" => "lo0", "@version" => "1", "host" => "192.168.20.39", "TCP_FLAGS" => 27, "CLIENT_NW_LATENCY_MS" => 0.009, "HTTP_RET_CODE" => 200, "PROTOCOL" => 6, "LAST_SWITCHED" => 1497300991, "IPV4_DST_ADDR" => "127.0.0.1", "OUT_BYTES" => 3617, "L7_PROTO_NAME" => "HTTP", "HTTP_HOST" => "127.0.0.1", "L4_DST_PORT" => 3000, "SERVER_NW_LATENCY_MS" => 0.035, "@timestamp" => 2017-06-12T20:56:39.074Z, "ntop_timestamp" => "2017-06-12T20:56:31.0Z", "IPV4_SRC_ADDR" => "127.0.0.1", "IN_PKTS" => 16, "IN_BYTES" => 1880, "port" => 63212, "L4_SRC_PORT" => 63321, "HTTP_METHOD" => "POST", "FIRST_SWITCHED" => 1497300991 }

Take Home
• ntopng is Lua-scriptable network monitoring tool◦Continuously monitors hosts and flows◦Saves/exports metrics and flows
• Several third-party integrations including◦Grafana◦Logstash◦Prometheus and SNAP under development
• Scriptability and ability to communicate over a network pave the way for visually unlimited third-party integrations


![High-speed Traffic Analysis Using ntopng: The New Features ... · Packets Never Lie [1/3] • Suppose that for specific hosts (e.g. for which an IDS has reported security issues)](https://static.documents.pub/doc/80x56/5fda8518a8434628f27d4a7e/high-speed-trafic-analysis-using-ntopng-the-new-features-packets-never-lie.jpg)


