26


A Dynamic Supply Response Model for the Sheep and Goat Industry
in Indonesia
Nu Nu San and Henk Knipscheer
Working Paper No. 154 March 1994
Winrock International, Morrilton, AK, USA

ACKNOWLEDGEMENTS
Authors would like to express their sincere thanks to
Dr. Nicholas Kalaitzandonakes and Dr. Brady Deaton (University of
Missouri in Columbia) for their advice and comment on this paper.
We also thank Dr. Ruth Gatenby, Mr. Leo Batubara and Mr. Setel Karo
Karo for the support of this publication.

A Dynamic Supply Response Model for the Sheep and Goat Industry in Indonesia
Nu Nu an' and Henk Knipschee$
Small ruminants are an important source of income for Indonesian small-holders, and one of the growing sub-sectors of Indonesian agriculture. One of the key policy question is how Indonesian policy makers can support the expansion of the small ruminants sub-sector. A potential policy tool is price regulation. In order to analyze the potential impact of price support measurements by GOI, the supply elasticity of small ruininants in Indonesia was estimated using a two-stage econometric procedure.
First, while taking the biological cycle of sheep and goats into consideration, a mathematical formula for the number of small ruminants at a future time was constructed. This biological supply formula was then included in a profit maximization model which included price variables and a discount rate. This model consisted of three equations which were estimated using the seemingly unrelated equation systems method.
Data were obtained from 1970 through 1989. The model yielded parameter estimates which were consistent with the supply theory, and significant at 5%. The model yielded price elasticity estimates for the supply of sheep (0.24) and goats (0.37), which are similar to earlier estimates found for muttcn in the Philippines (0.40). The results confirm the relative inelastic supply of small ruminants. Price supports, therefore, may not be the best way to stimulate growth in mutton and goat meat supply.
' Research Assistant, Department of Agricultural Economics, University of Missouri-Columbia.
Principal Investigator, SR-CRSP, Winrock International, Morrilton, AK, USA.

ABSTRAK
Usaha ternak ruminansia adalah suatu sumber pendapatan yang penting bagi petani Indonesia dan merupakan salah satu sub-sektor yang sedang berkembang pada pertanian Indonesia. Salah satu pertanyaan yang penting adalah bagaimana pembuat kebijakan di Indonesia dapat mendukung perluasan/perkembangan sub-sektor peternakan tersebut. Penentuan harga merupakan satu ha1 yang penting. Dalam rangka menganalisa dampak potensial langkah pendukunggan harga oleh pemerintah Indonesia, elastisitas pasok dari ternak peliharaan Indonesia diprediksi dengan menggunakan dua prosedur tingkatan ekonometrik.
Pertama, dengan mempertimbangkan siklus biologi dari domba dan kambing, dibuat suatu formula matematik untuk jumlah ternak peliharaan untuk masa yang akan datang. Formula biologi suplai ini kemudian dimasukkan dalam satu model maksimisasi keuntungan, termasuk variabel harga dan tingkat penawaran harga. Model ini terdiri atas tiga model rumus yang diestimasikan dengan menggunakan sistem model terkait.
Data diperoleh dari tahun 1970-1989. Model ini mengkasilkan estimasi parameter yang konsisten dengan teori suplai (nyata pada tingkat 5 % ) . Model tersebut menghasilkan estimasi elastisitas harga untuk suplai domba (0,24) dan kambing (0,37). Temuan ini mirip degan estimasi terdahulu untuk domba yang dilakukan di Philipina (0,40). Hasil ini menguatkan suplai inelastis yang relatif dari ternak peliharaan. Karena itu, dukungan harga bukanlah cara terbaik untuk merangsang peningkatan pemasok daging kambing dan domba.
Contents
Page No . Background ............................................. 1
................... Raising Small Ruminants in Indonesia 2
............................ Biology Cycle and Marketing 2
Theory of Supply .................................... 3
....................... Literature Review on Methodology 4
................. Dynamics of Small Ruminant Population 6
................................... The Conceptual Model 8
....................................... Model Estimation 10
Data ................................................... 13
Results ................................................ 13
Discussion .............................................. 14
............................................... Reference 17
Graphs Appendix
Sheep and Goat Meat Production ......................... 1
.................................. Sheep and Goat Prices 2
BACKGROUND
I n I n d o n e s i a , s m a l l ruminants ( i n t h i s s t u d y - sheep and
g o a t ) a r e t y p i c a l l y a s s o c i a t e d w i t h s m a l l s c a l e f a rmers . Smal l
ruminants a r e e a s y t o r a i s e , p r o l i f i c and have a r eady m a r k e t ,
more i m p o r t a n t l y t h e y r e q u i r e l o w - i n i t i a l inves tment and
maintenance c o s t s . Knipscheer e t a l . (1983) e s t i m a t e d t h a t s h e e p
and g o a t i n I n d o n e s i a can be found on e v e r y f i f t h farm.
According t o t h e s t u d y of S a b r a n i e t a l . (1982) t h e r e were e i g h t
m i l l i o n g o a t s i n Indones ia and a t l e a s t h a l f of them a r e i n J a v a .
I n o r d e r t o i n c r e a s e t h e food s u p p l y and r a i s e t h e income o f t h e
s m a l l h o l d e r engaged i n t h e smal l ruminant p r o d u c t i o n , SR-CRSP~
i n i t i a t e d a r e s e a r c h p l a n i n 1984 a l o n g w i t h t h e Outreach P i l o t
P r o j e c t . The program is des igned t o i n t r o d u c e a p p r o p r i a t e s h e e p
and g o a t management t e c h n o l o g i e s i n c l u d i n g b r e e d i n g , h e a l t h ,
econornic/marketing and n u t r i t i o n .
On t h e o t h e r hand, p r i c e p o l i c y i s a l s o widely used t o
a d j u s t t h e volume of a n a g r i c u l t u r a l commodity. P o l i c y makers
o f t e n u s e p r i c e e l a s t i c i t i e s a s a t o o l f o r t h e i r d e c i s i o n s .
Depending upon t h e respons iveness o f a commodity t o i t s p r i c e ,
one can d e t e r m i n e a n e f f e c t i v e t y p e of government p o l i c y t o
i n c r e a s e t h e food supply . T h e r e f o r e , i n t h i s paper an a t t e m p t is
made t o e s t i m a t e t h e supp ly e l a s t i c i t i e s of s m a l l ruminan t s i n
Indones ia .
-
Smal l Ruminants - C o l l a b o r a t i v e Resea rch Suppor t Program

2
RAISING SMALL RUMINANTS IN INDONESIA
Small ruminant production in Indonesia is more or less a
family business. Generally, they are raised in barns with a zero
grazing system or partial grazing combined with a cut and carry
system. The forages and agricultural by-products are the basic
sources of energy. The main forages are native grass and tree
leaves of banana, jack fruit and mango etc. The agricultural by-
product feeds generally used for small ruminant production 9
systems are rice bran, soy bean and corn meals.
BIOLOGICAL CYCLE AND MARKETING FOR SMALL RUMINANTS
On average, well developed small ruminants can be first
mated at 8 months of age. The average lambing interval is 8
months, and it takes about 9 months in order to be ready for the
market for slaughtering4. Therefore approximately 20-24 months
are required for a farmer to increase the flock size.
A report on small ruminant marketing channels in Java
prepared by Soedjana et al. (1990), indicates that even though
some seasonality is noticed for forage availability, small
ruminant breeding can be carried out year round. Accordingly,
there are no particular times that large numbers of animals reach
the same age or market weight at the same time. Nevertheless,
they observe that there are periods during the year when market
prices for small ruminants increase, whereas market prices of
Personal communication with Dr. Ruth Gatenby, SR-CRSP, Sei Putih, Indonesia.

small ruminants are determined by the weight, breed, sex and age,
local preference and religious holidays.
THEORY OF SUPPLY
The basic supply theory for agricultural commodities is well
defined in Cochrane ( 1 9 4 4 ) and Nerlove & Bachman (1960). In
their studies, supply of a commodity refers to "the quantity of
output offered with associated price, for some given time
periodi1, whereas response means "how the quantity of a commodity
offered for sale varies with changes in the price of the
commodityM. The theory of supply assumes that there is a
positive relationship between quantity supplied and its own
price. Besides, the slope of the supply relation will vary
according to the time period and the existence and extent of
production alternatives and the closeness of existing production
alternatives. Overall, the total output of agriculture may vary
from other causes such as weather, technology change, changes in
market organization and structure and government policies.
Therefore, when modelling supply response for a commodity,
it is necessary to find a way to hold technological advance and
other influencing factors constant in order to capture the true
relationship. Second, the analyst must know which factors the
decision makers treat as fixed for the period and unit of inquiry
under consideration, find quantity measures of such fixed
factors, and introduce them into the system of equations in a
proper fashion.
4
The expectation and the uncertainty also play an important
role in studying supply response relations. For agricultural
commodities farmers have to decide how much input will be used
for the production of next year's commodity. Therefore, farmers
usually consider not only the current price but also the what he
thinks he may receive in the future. In modelling supply
response functions, future price expectation formations are used
to represent the uncertainty nature of agricultural prices.
LITERATURE REVIEW ON METHODOLOGY
Linear programming methods and econometric methods are found
to be two basic methods used to estimate agricultural supply
response. Two stage procedures, directly estimated single
commodity system, and directly estimated supply systems are the
most common econometric methods.
Programming models usually include a set of linear, additive
production functions for each possible output with constraints on
resource availabilities. The objective function could be a
profit function or the aversion of risk. Then the profit
maximizing output and input levels for each farms are specified
consistent with production technology and product and input
prices. The report of Cowling and Baker (1963) is one of many
studies using this approach.
In two-stage econometric procedures, supply response
relationships are derived in a second stage by algebraic
manipulation, which includes imposing profit maximizing marginal

5
conditions on results obtained by econometric estimation in the
first stage. Among the many studies of this type, Binswanger
(1974) and Lopez (1980) used a cost function approach which
estimated aggregate single-commodity supply functions.
In the case of a directly estimated supply response system,
the production possibility frontier is assumed to exhibit a
constant elasticity of transformation into products and all
inputs are taken to be fixed and not product specific. In
reality input and output levels are jointly determined and at
least some factors are product specific. Dixon et al. (1976)
represent this type of approach.
The bulk of the agricultural supply response studies are in
the directly estimated, partial, commodity supply model. Here,
agriculture is characterized by multiple agricultural outputs and
the commodity being studied is of partial nature. Besides,
profit maximization conditions are not restricted in the supply
equation. Moreover, this type of estimation is of an ad-hoc
nature and obtains from the fact that these studies are based on
tine series data in which supply response is measured at the
aggregate level. The idea of supply dynamics in those studies is
that agricultural supply response to any shock may be spread over
a number of following data periods. Especially in agriculture,
this year's production is mostly influenced by decisions taken in
the past. Decisions may be influenced by the economic conditions
prevailing at the time and expectations about the future.
One of the largest bodies of supply response model building

6
is related to the formation of expectations and to the derivation
of appropriate functional forms. Incorporation of expectational
variables for prices, revenues or profits into supply functions
represent an ad-hoc method of allowing for the role of investment
in supply response.
DYNLIICS OF SMALL RUMINANT POPULATION
The biological cycles of sheep and goat production are
considered to be identical in this study. In Indonesia the
primary purpose of raising small ruminants is for slaughtering
for own consumption and sales to others. Therefore, categorizing
female and male populations may not seem necessary. However,
females are usually kept longer in a flock to increase the
population than male small ruminants. Hence, let superscript Is'
represents the sex of the animal, subscript (0, j, ... n) represent the age of animal, and subscript 't' represents time. Then XS,,,
XSjt, . . . ,XSnt symbolizes the number of animals in different age categories and XSOt is the number of offspring at time t, XSnt is
the number of small ruminants of age n at time t. xfn, is the
number of female mall ruminants and Xmnt is the number of male
ruminants: therefore, xSnt = xfnt + Pnt.
First, the mathematical formula for the number of offspring
at time t is constructed. Second, the number of small ruminants
at different ages and the number of small ruminants ready for
marketing are calculated. The reproduction rate of small
ruminants of age j, in other words the number of offspring born
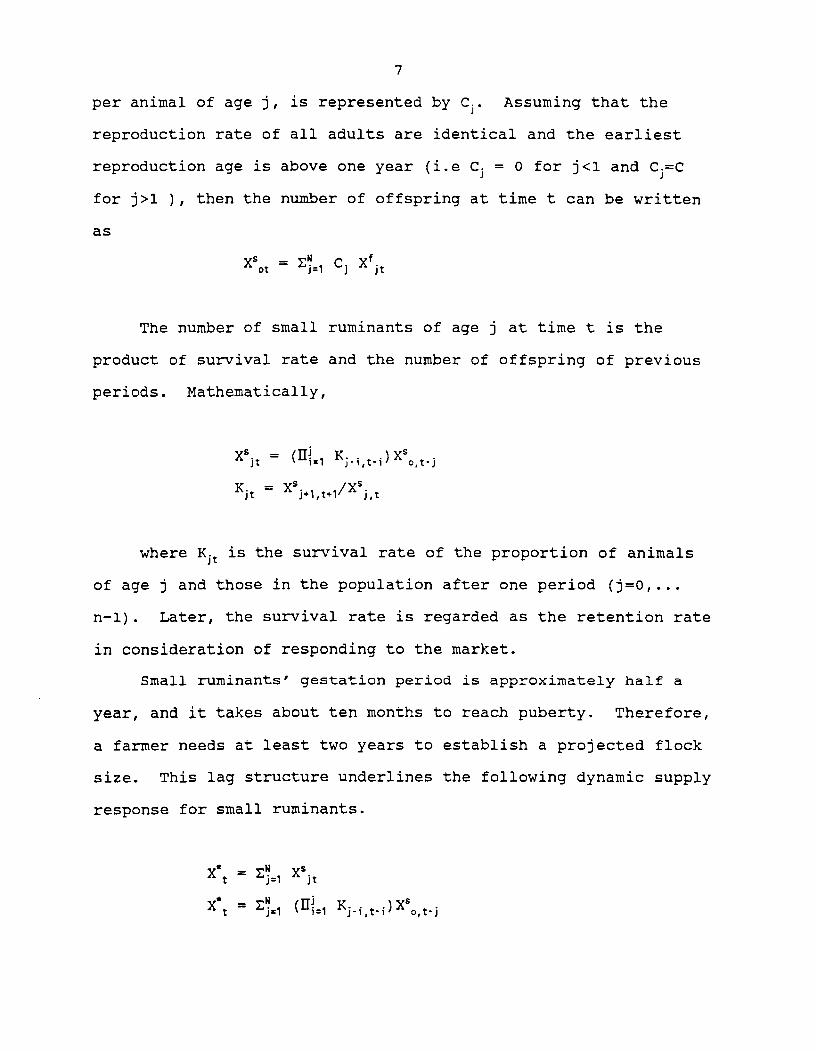
7
per animal of age j, is represented by Cj . Assuming that the
reproduction rate of all adults are identical and the earliest
reproduction age is above one year (i.e C j = 0 for j<l and Cj=C
for j>l ) , then the number of offspring at time t can be written
as
The number of small ruminants of age j at time t is the
product of survival rate and the number of offspring of previous
periods. Mathematically,
where Kjt is the survival rate of the proportion of animals
of age j and those in the population after one period (j=O, ... -1). Later, the survival rate is regarded as the retention rate
in consideration of responding to the market.
Small ruminants' gestation period is approximately half a
year, and it takes about ten months to reach puberty. Therefore,
a farmer needs at least two years to establish a projected flock
size. This lag structure underlines the following dynamic supply
response for small ruminants.
x*, = q=, xsjt
x*, = q=, (q1 K j - i , t - i ) xso,t-j

8
Since retention rates, K's, are affected by the market
prices, and to make a decision for how much to produce each
period over time, the expected prices are considered as
influential factors on the retention period. All these factors
are underlined in the model, which estimates supply response of
small ruminants as described in the next two sections.
THE CONCEPTUAL MODEL
With reference to Chavas and Klemme (1986), the following
theoretical model is constructed to explain the dynamic supply
response behavior of an optimizing farmer. The objective
function, which is the net present value of the profit generated
from raising small ruminants over time, is being maximized
subject to a fixed amount of resources, such as land or
facilities. Mathematically,
Max ( l/l+r) Ut
Sub j ect fixed resource constraint. . II, = Profit generated at time t r = discount rate
Although the primary purpose of raising small ruminants is
for slaughtering, they still provide current products such as
manure during their stay in the flock. Therefore, the profit
function can be written as follows:
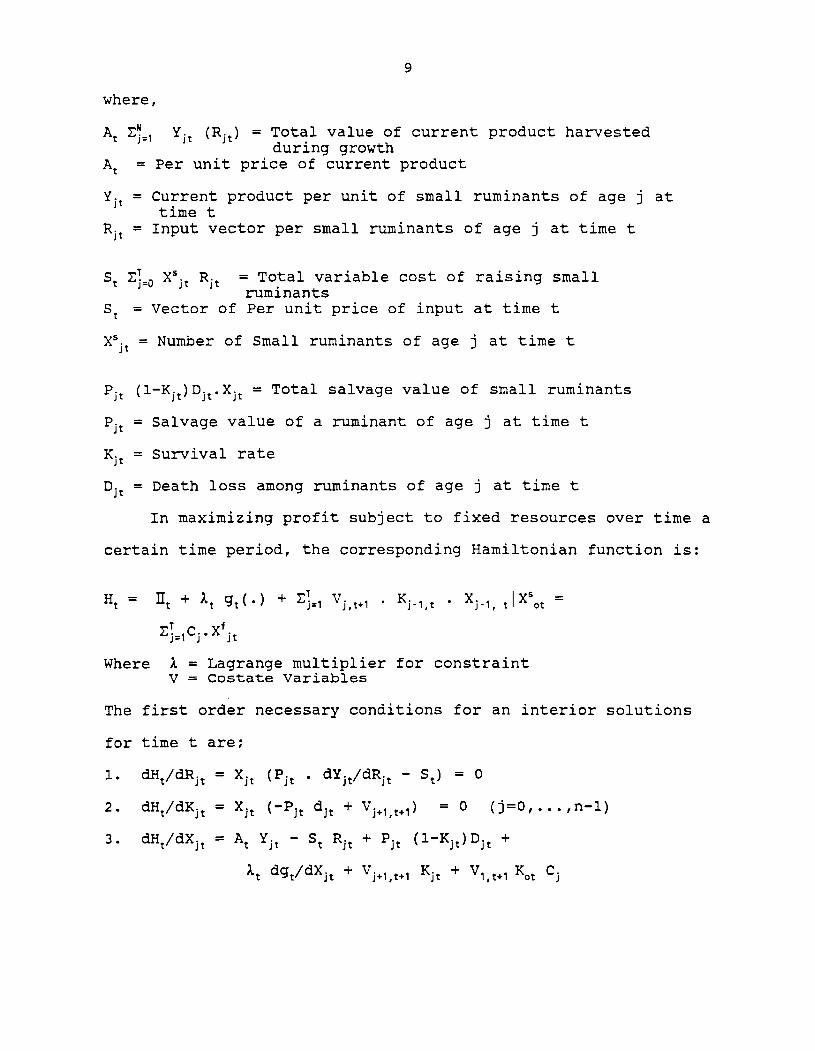
where,
BY=, Yjt (Rjt) = Total value of current product harvested during growth
= Per unit price of current product
Yjt = Current product per unit of small ruminants of age j at time t
Rjt = Input vector per small ruminants of age j at time t
St 8:=, Xsjt Rjt = Total variable cost of raising small ruminants
St = Vector of Per unit price of input at time t
XSjt = Number of Small ruminants of age j at time t
Pjt (1-K. )D. .XI, = Total salvage value of small ruminants J t J t
Pjt = Salvage value of a ruminant of age j at time t
Kjt = Survival rate
Djt = Death loss among ruminants of age j at time t
In maximizing profit subject to fixed resources over time a
certain time period, the corresponding Hamiltonian function is:
Where I = Lagrange multiplier for constraint V = Costate Variables
The first order necessary conditions for an interior solutions
for time t are;
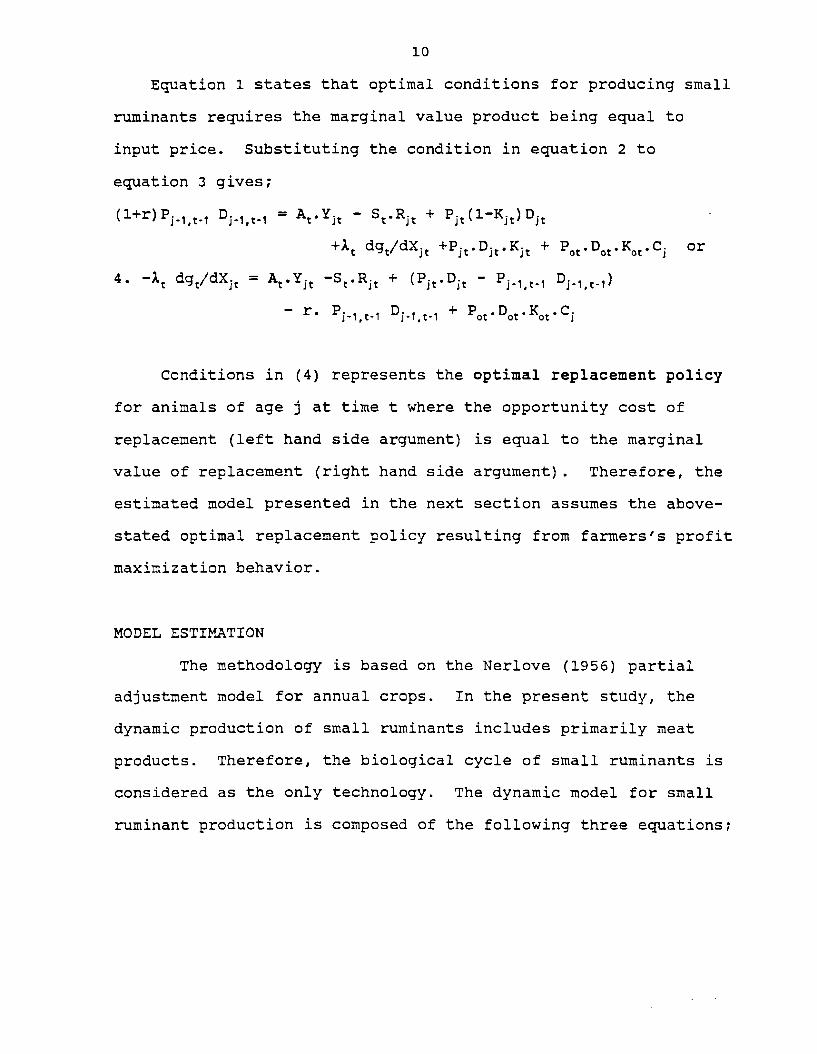
10
Epaticn 1 states that optimal conditions for producing small
runinants requires the marginal value product being equal to
input price. Substituting the condition in equation 2 to
equation 3 gives;
('+r) Piel ,t-l Dj-l,t-l = At.Yjt - St.Rit + Pjt (1-Kjt) Djt
+It dgt/dXjt +Pjt. Djt. Kjt + Pot. Dot. KO,. Cj or
4. -1, dg,/dXjt = At-Yit -St*Rjt + (Pjt*Djt - Pj.l,t.l Di-l,t-l I
- r* Pj-1,t-1 Dj-lot-1 + pot. D,~. K,~ . cj
Conditions in (4) represents the optimal replacement policy
for animals of age j at time t where the opportunity cost of
replacement (left hand side argument) is equal to the marginal
value of replacement (right hand side argument). Therefore, the
estimated model presented in the next section assumes the above-
stated optimal replacement policy resulting from farmers's profit
maximization behavior.
MODEL ESTIYATION
The methodology is based on the Nerlove (1956) partial
adjustment model for annual crops. In the present study, the
dynamic production of small ruminants includes primarily meat
products. Therefore, the biological cycle of small ruminants is
considered as the only technology. The dynamic model for small
ruminant production is composed of the following three equations;

1. Q, - Q,.2 = r ( ~ , ' - Qt.2 )
2 . P', - pet-, = v ( P , - , - P* ,-, 3 . Q ' , = a , + a, P', + al Z t + U,
where,
Qt = Number of smal l ruminants marketed i n t i m e t P& = Actual p r i c e of smal l ruminant p e r u n i t i n t P t = Expected normal p r i c e i n 't' f o r nex t f u t u r e p e r i o d z t = Other exogenous v a r i a b l e s ( h e r e , r ice p roduc t ion ) r = C o e f f i c i e n t f o r q u a n t i t y ad jus tment v = C o e f f i c i e n t f o r p r i c e e x p e c t a t i o n
E m a t i o n one i l l u s t r a t e s t h e p a r t i a l adjus tment of animal
popula t ion i n t i m e t. A s d i s cus sed i n t h e popu la t i on dynamic
s e c t i o n , t h e requ i red b i o l o g i c a l l a g of two y e a r s is inco rpo ra t ed
t o a d j u s t t h e f l o c k s i z e .
Equation two demonstra tes t h e na ive p r i c e e x p e c t a t i o n , where
expected p r i c e of each pe r iod is l a s t p e r i o d ' s expec ted p r i c e
p l u s o r minus some degree of ad jus tment , which can be i n t e r p r e t e d
a s a f r a c t i o n 'v' of t h e d i f f e r e n c e between l a s t p e r i o d ' s a c t u a l
p r i c e and expected p r i c e . I f 'v ' is ze ro , a c t u a l p r i c e s a r e
t o t a l l y d i f f e r e n t from e x p e c t a t i o n and i f 'v ' one, t h e n expected
p r i c e s a r e same a s l a s t y e a r ' s r e a l i z e d p r i c e .
E m a t i o n t h r e e r e l a t i o n s h i p between t h e d e s i r e d
q u a n t i t y of ou tpu t and assumed exp lana to ry v a r i a b l e s .
R i c e product ion is inc luded a s an exogenous v a r i a b l e '2,' i n t h e
a n a l y s i s . Although t h e r e a r e more t h a n one c r o p f o r sma l l
ruminant farmers t o use a s f e e d , such a s corn o r soybean, r ice is
chosen because it is a s t a p l e c rop widely grown th roughout
Indones ia and a t y p i c a l feed f o r smal l ruminants .
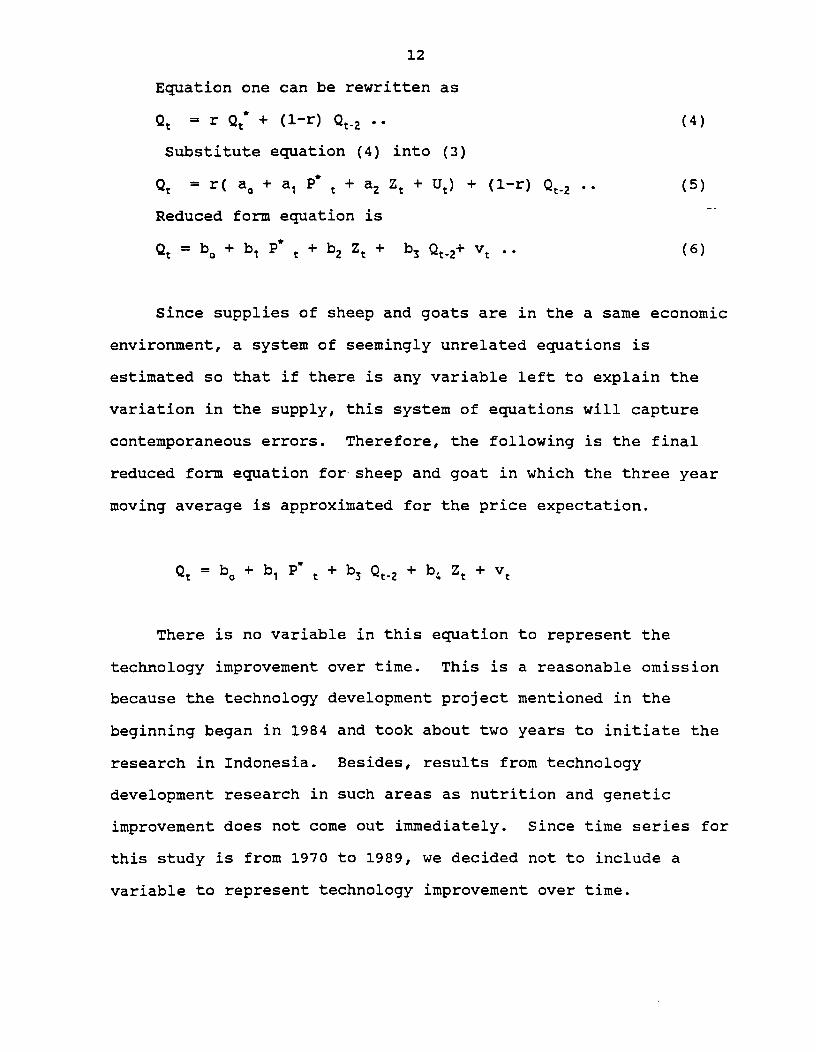
12
Equation one can be rewritten as
Q, = r Q,* + (1-r) Qt-, (4)
Substitute equation (4) into (3)
Q, = r( a, + a, P*, + at Z, + U,) + (1-r) Qt-, .. ( 5 --
Reduced form equation is
Q, = b, + b, P* , + b, 2, + b3 Qt-,+ vt . . ( 6
Since supplies of sheep and goats are in the a same economic
environment, a system of seemingly unrelated equations is
estimated so that if there is any variable left to explain the
variation in the supply, this system of equations will capture
contemporaneous errors. Therefore, the following is the final
reduced form equation for, sheep and goat in which the three year
moving average is approximated for the price expectation.
There is no variable in this equation to represent the
technology improvement over time. This is a reasonable omission
because the technology development project mentioned in the
beginning began in 1984 and took about two years to initiate the
research in Indonesia. Besides, results from technology
development research in such areas as nutrition and genetic
improvement does not come out immediately. Since time series for
this study is from 1970 to 1989, we decided not to include a
variable to represent technology improvement over time.

DATA
Time series data from 1970-1989 for the quantity production
of goat and sheep meat, and area of rice production are published
data from Indonesia Ministry of Agricultural statistics. Time
series price data for sheep and goat meat is from United Nation
ARIES Data Base in Washington D.C., U.S.A. Figure 1 presents the
quantity of sheep and goat production from 1970-1989. Figure 2
reveals the sheep and goat price movements over 20 years.
RESULTS
Table 1 and 2 report the estimates from the Seemingly
Unrelated Equation system for sheep and goats, respectively.
Table 1 SUR Estimates for Sheep Production in Indonesia, from 1970 to 1989.
Variables Parameter Est. t-Statistics Probability
Intercept -1.54 -2.13 0.05
observation = 17

Table 2 SUR Estimates for Goat Production in Indonesia, From 1970 to 1989.
Variables Parameter Est. t-statistics Probability
Intercept -1.59 -1.07 0.30
P' t 0.37 2.09 0.05
Qt-z 0.64 2.80 0.01
zt 0.34 0.63 0.54
Observation = 17
The results from tables 1 and 2 indicate that the parameter
estimates for the price of meat for sheep and goats are
significant at the 5% level. The price of meat and the quantity
of production is positively related. Therefore, the sign
condition for price and quantity is in accordance with supply
theory. The estimated supply elasticities are (0.24) and (0.37)
for sheep and goat, respectively. The rice production variable
daes explain the some of variation in the production of goats but
not for sheep.
DISCUSSION
An objective of this analysis is to determine whether price
policy can be used as a tool to increase the supply of small
ruminants and potentially benefit both consumer and producer.
The analysis estimates relatively low supply elasticity for both
sheep and goats. In the literature the low supply elasticity
(0.40) for mutton is also estimated by Sullivan et al. in 1989
with data from the Philippines, which is an ecological zone

similar to East Indonesia.
However, this analysis is bounded by the limited data, both
in terms of number of observations and category. Therefore, the
exogenous variables included in the study seem to be weak.
Besides, the time variable is not included in the analysis, thus
one question could be raised: "has technology really not
improved over 20 years?". Since small ruminants are associated
with the relatively small farmers and raising small ruminants has
not been considered as a prime source of income, it is likely
that the technology for such production has not improved
significantly. This is consistent with the personal observations
of the authors. On the other hand, the program initiated for
technology improvement in small ruminants began only in 1984.
Therefore, the impact of the program may not be seen until 1988-
89 or even later.
Secondly, time series data used in this analysis is not
deflated, and a three years moving average is used instead. Our
analysis revealed that the coefficients of analysis with deflated
data was relatively insignificant compared to that of un-deflated
data. The reason for this might be that'the available deflator
(price index) for aggregate consumption may not have been
suitable for the small ruminants consumption, which seems to be a
very insignificant portion of the aggregate consumption.
In conclusion, the major objective of the research is
reached despite many constraints. The relatively low supply
elasticity for price suggests that price policy may not be suited

16
to achieve increments in small ruminant production. Alternative
approaches such as improvement in technology could be a more
appropriate in order to increase the supply of small ruminants in
Indonesia. -.
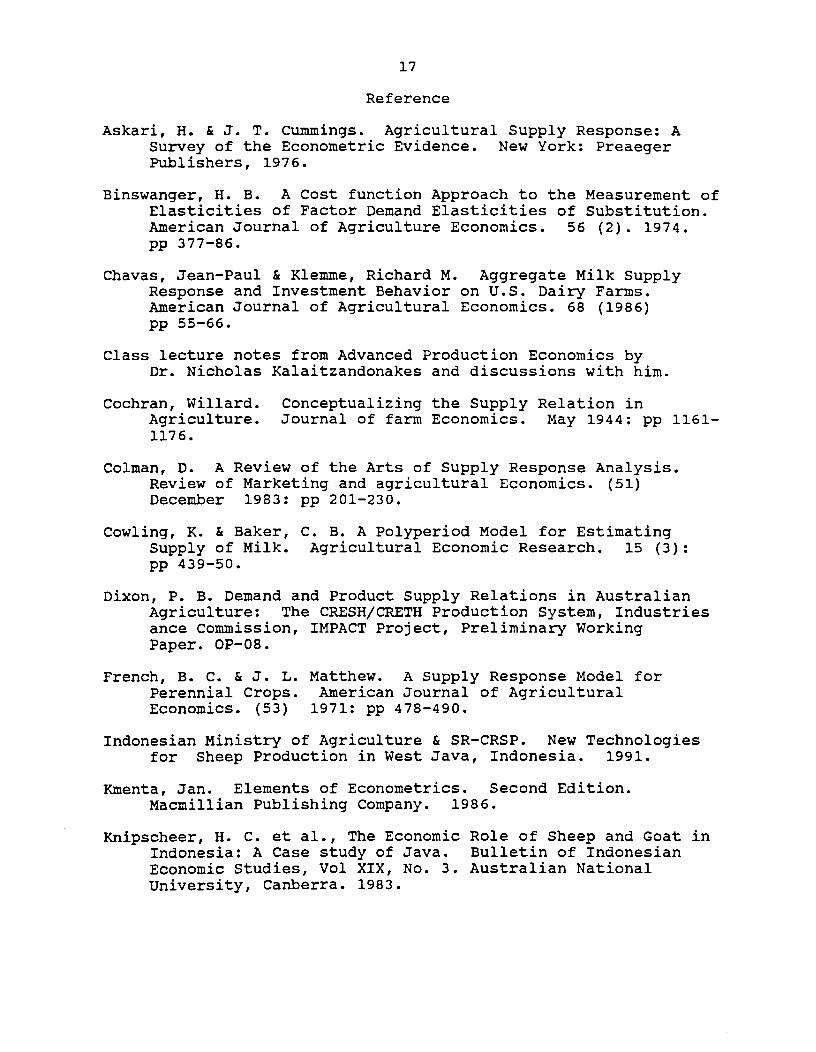
Reference
Askari, H. & J. T. Cummings. Agricultural Supply Response: A Survey of the Econometric Evidence. New York: Preaeger Publishers, 1976.
Binswanger, H. B. A Cost function Approach to the Measurement of Elasticities of Factor Demand Elasticities of Substitution. American Journal of Agriculture Economics. 56 (2). 1974. pp 377-86.
Chavas, Jean-Paul & Klemme, Richard M. Aggregate Milk Supply Response and Investment Behavior on U.S. Dairy Farms. American Journal of Agricultural Economics. 68 (1986) pp 55-66.
Class lecture notes from Advanced Production Economics by Dr. Nicholas Kalaitzandonakes and discussions with him.
Cochran, Willard. Conceptualizing the Supply Relation in Agriculture. Journal of farm Economics. May 1944: pp 1161- 1176.
Colman, D. A Review of the Arts of Supply Response Analysis. Review of Marketing and agricultural Economics. (51) December 1983: pp 201-230.
Cowling, K. & Baker, C. B. A Polyperiod Model for Estimating Supply of Milk. Agricultural Economic Research. 15 (3): pp 439-50.
Dixon, P. B. Demand and Product Supply Relations in Australian Agriculture: The CRESH/CRETH Production System, Industries ance commission, IMPACT Project, Preliminary Working Paper. OP-08.
French, B. C. & J. L. Matthew. A Supply Response Model for perennial Crops. American Journal of Agricultural Economics. (53) 1971: pp 478-490.
Indonesian Ministry of Agriculture & SR-CRSP. New Technologies for Sheep Production in West Java, Indonesia. 1991.
Kmenta, Jan. Elements of Econometrics. Second Edition. ~acmillian Publishing Company. 1986.
Knipscheer, H. C. et al. , The Economic Role of Sheep and Goat in Indonesia: A Case study of Java. Bulletin of Indonesian Economic Studies, Vol XIX, No. 3. Australian National University, Canberra. 1983.

Ludgate, P. J. (Editor) Summary Report of 1987-1988 Outreach Pilot Project Research Activities. Working Paper No. 96, SR-CRSP, January 1989.
Lopez, R. E. The Structure of Production and the Derived Demand for Inputs in Canadian Agriculture. American Journal of Agriculture Economics. 62 (1) 1980. pp 38-45.
Nerlove, M. The Dynamics of Supply: Retrospect and Prospect. American Journal of Agricultural Economics. (61) 1979: pp 874-888.
Nerlove, M. & K. L. Bachman. The Analysis of Changes in Agricultural Supply: Problems and Approaches. Journal of Farm Economics. August 1960: pp 531-554.
Nerlove, M. Estimates of the Elasticities of Supply of Selected Agricultural Commodities. (38) 1956. pp 496-509.
Reynolds R. G. & B. Gardiner. Supply Response in the Australian Sheep Industry: A Case for Disaggregation and Dynamics. Australia n Journal of Agriculture Economics. December 1950.
Soedjana, T. D. & A. Priyanti. Analysis of Factors Affecting the Farm-gate Price for Small Ruminants in West Java. Working Paper. CRSP.
Sullivan, J. et al. A Database for Trade Liberalization Studies U.S.D.A. Economic Research Service. Agriculture and Trade Analysis Division. March 1989.
Thomas, N. & M. Rangkuti. Small Ruminant Production in the Small-Farm Perspective. Working Paper No. 10, SR-CRSP, March, 1983.
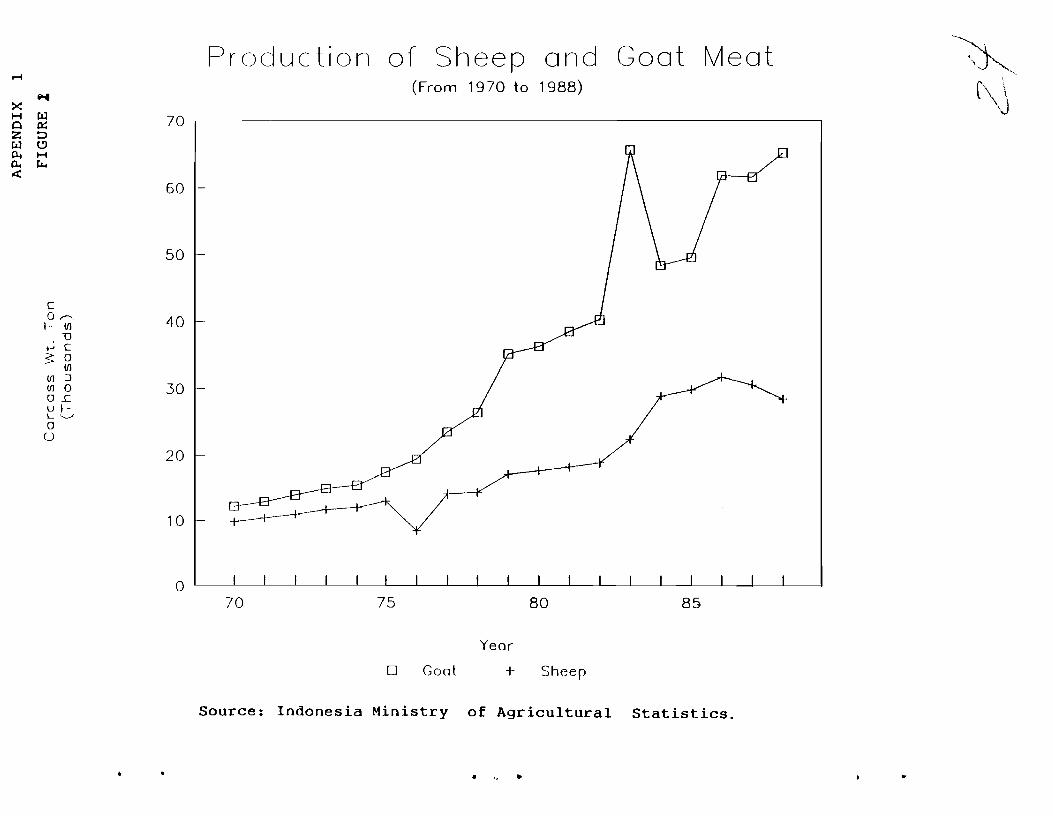
Procluction of Sheep and Goat Meat (From 1970 to 1988)
Year
lIl Goat 4- Sheep
Source : I n d o n e s i a M i n i s t r y o f A g r i c u l t u r a l S t a t i s t i c s .

Price of Sheep and Goat Meat (From 1970 to 1989)
Year
Goat + Sheep
Source: United Nation Aries Data Base i n Washington D . C . U.S.A.
w ., b


