Nuclear Inst. and Methods in Physics Research, A 890 (2018) 84–95
Contents lists available at ScienceDirect
Nuclear Inst. and Methods in Physics Research, A
journal homepage: www.elsevier.com/locate/nima
Photoelectron yields of scintillation counters with embeddedwavelength-shifting fibers read out with silicon photomultipliersAkram Artikov c, Vladimir Baranov c, Gerald C. Blazey d, Ningshun Chen f, Davit Chokheli c,g,Yuri Davydov c, E. Craig Dukes f, Alexsander Dychkant d, Ralf Ehrlich f, Kurt Francis d,M.J. Frank e, Vladimir Glagolev c, Craig Group f,*, Sten Hansen b, Stephen Magill a,Yuri Oksuzian f, Anna Pla-Dalmau b, Paul Rubinov b, Aleksandr Simonenko c, Enhao Song f,Steven Stetzler f, Yongyi Wu f, Sergey Uzunyan d, Vishnu Zutshi da Argonne National Laboratory, Argonne, IL 60439, USAb Fermi National Accelerator Laboratory, Batavia, IL 60510, USAc Joint Institute for Nuclear Research, Dubna, 141980, Russian Federationd Northern Illinois University, DeKalb, IL, 60115, USAe University of South Alabama, Mobile, AL 36688, USAf University of Virginia, Charlottesville, VA 22904, USAg High Energy Physics Scientific-Research Institute of Iv. Javakhishvili, Tbilisi State University (HEPI-TSU), Tbilisi, 0186, Georgia
Photoelectron yields of extruded scintillation counters with titanium dioxide coating and embedded wavelengthshifting fibers read out by silicon photomultipliers have been measured at the Fermilab Test Beam Facility using120 GeV protons. The yields were measured as a function of transverse, longitudinal, and angular positions fora variety of scintillator compositions, reflective coating mixtures, and fiber diameters. Timing performance wasalso studied. These studies were carried out by the Cosmic Ray Veto Group of the Mu2e collaboration as part oftheir R&D program.
1. Introduction
The Mu2e experiment will search for the neutrino-less conversionof a muon into an electron in the presence of an aluminum nucleusat a single-event sensitivity of about 3 × 10⁻¹⁷ [1]. This represents asensitivity improvement of four orders of magnitude relative to thecurrent best limit on this process [2]. The observation of this processwould signal the existence of charged lepton-flavor violation at a levelfar beyond what is expected from the standard model predictions [3].
A major background for this experiment will be due to cosmic-raymuons that can produce several processes mimicking the signal. Thesecosmic-ray induced background events, which will occur at a rate ofabout one per day, must be suppressed by four orders of magnitude inorder to achieve the sensitivity goals of Mu2e. To do this, an activeveto will surround the primary Mu2e detection apparatus on five sidesin order to detect penetrating cosmic-ray muons. The veto will consistof more than 5000 scintillation counters arranged in four layers, eachcounter is 20 mm thick by 50 mm wide and with varying lengths. This
paper describes measurements made with the prototype counters for theMu2e Cosmic Ray Veto (CRV).
2. Counter description
The counters tested here were all 3000 × 50 × 20 mm3. Theywere extruded at the FNAL-NICADD Extrusion Line Facility [4]. Thepolystyrene base of each counter was STYRON 665 W. Four differentscintillator composition/coating mixtures were tested, and are listed inTable 1. The primary dopant was always 2,5-diphenyloxazole (PPO, 1%by weight). The secondary dopant was either 1,4-bis (5-phenyloxazol-2-yl) benzene (POPOP) or 1,4-bis (2-methylstyryl) benzene (bis-MSB).A co-extruded reflective coating of 0.25 mm nominal thickness sur-rounded the core. This outer reflective coating was added throughmaterial injected from a second extrusion machine (co-extruder) thatmixed the polystyrene and TiO2 pellets. Each counter also had two co-extruded holes of nominal 2.6 mm diameter into which wavelength-shifting (WLS) fibers were placed. A cross-sectional view of a counter is
This document was prepared by Mu2e collaboration using the resources of the Fermi National Accelerator Laboratory (Fermilab), a U.S. Department of Energy, Office of Science, HEP User Facility. Fermilab is managed by Fermi Research Alliance, LLC (FRA), acting under Contract No. DE-AC02-07CH11359.
Fig. 1. Photo from the end of a typical counter. The shape of the counter, theholes, and the TiO2 coating are visible. Tick marks are spaced by 0.5 mm.
Fig. 2. Dicounter end view showing fiber positions. Dimensions (mm) arenominal: actual values are slightly different.
shown in Fig. 1, where the shape of the counter, the holes, and the TiO2coating are visible.
Counters were assembled into full dicounters at the University ofVirginia. The counters were first glued into pairs called dicounters,using 3M DP420 epoxy [5], producing the profile shown in Fig. 2. Thefibers were then placed into the four dicounter holes. The WLS fiberswere Kuraray double-clad Y11 doped with 175 ppm K27 dopant, andwere non-S-type [6]. Counters with three different fiber diameters werestudied: 1.0, 1.4, and 1.8 mm. The fibers were not glued in the extrusionholes, nor were they constrained in any fashion to lie in the holes. Ateach end of the dicounter an acetal fiber guide bar was glued to theextrusions using 3M DP100 epoxy [7]. At the same time the WLS fiberswere glued into funnel-shaped channels in the fiber guide bars using thesame epoxy. The fibers, protruding from both ends of the dicounters,were cut off using a hot knife and the fiber guide bars were then fly cut,which served to polish the fiber ends.
Light captured in the fibers was read out at both ends by 2.0×2.0 mm2
(model S13360-2050VE, 1584 pixels, pixel size of 50 𝜇) Hamamatsu sili-con photomultipliers (SiPMs) [8]. These surface-mount, through-siliconvia (TSV) devices were chosen because they have a thin (0.1 mm) epoxylayer which allows closer proximity between the fiber and photosensor.Radiation damage from neutrons is a concern. The devices described inthis paper had not been irradiated. Ref. [9] studies the SiPM radiationhardness and its impact on CRV performance.
The SiPMs were soldered to small 8.61 × 5.61 mm2 circuit boards,called SiPM carrier boards, that sat in rectangular wells in an anodizedaluminum fixture called the SiPMmounting block. Proper registration ofthe SiPMs to the fibers is critically important in obtaining the maximumlight yield, particularly for the 1.8 mm diameter fibers when mated to
Fig. 3. Exploded view of the end of a dicounter showing the fiber guide bar,SiPM mounting block, SiPM carrier boards, SiPMs, and counter motherboard.The flasher LEDs and pogo pins that are soldered to the counter motherboardare not shown.
Fig. 4. The components used in the electronic readout of the dicounters.
the 2.0 × 2.0 mm2 SiPMs. The SiPM mounting blocks were preciselyaligned to the fiber guide bars by internally threaded sleeves that wereglued into holes on either end of the fiber guide bar. A rubber sealbetween the fiber guide bar and the SiPM mounting block was used tomake the assembly light tight. An exploded view of the dicounter end isgiven in Fig. 3 and a photograph of its components is shown in Fig. 4.
The SiPMs were electrically connected via spring-loaded pins (pogopins) to a small circuit board called the counter motherboard (CMB).The pogo pins gently pushed down on the SiPM carrier boards, pressingthe SiPMs up against the fiber ends. The opaque counter motherboardformed the top of the aluminum SiPM mounting block making the SiPMassembly fixture light tight. The counter motherboard has two flasherLEDs (not used in the tests described here), a thermometer, and an HDMIreceptacle. Efforts weremade tominimize the extent of the end assemblywhich, including the HDMI receptacle, still protruded 37 mm beyondthe extrusions.
Signals from the CMB were carried out to a 64-channel front endboard (FEB) via a short HDMI cable. The FEB provided bias to the SiPMs,signal pre-amplification and shaping, analog-to-digital conversion at12.6 ns intervals (1/79.5MHz), and high-speed serial links via Ethernetto a readout controller or a stand-alone computer [10].
85
A. Artikov et al. Nuclear Inst. and Methods in Physics Research, A 890 (2018) 84–95
Fig. 5. Photo of test beam setup.
Fig. 6. An illustration of the test beam experiment setup (not to scale). Inaddition to the MWPCs (shown as black lines), the three scintillation counters(shown as blue dashed lines) were also included in the setup for triggering.
3. Experimental setup
The Fermilab Test Beam Facility is described in Ref. [11] and a photoof the CRV test-beam setup is shown in Fig. 5. A 120 GeV proton beamwas incident on the counters once a minute in a spill that lasted fourseconds. Up to 3000 events per spill were recorded, so a typical runof 50,000 events took less than 20 min. The counters were mountedon a frame attached to a table with horizontal and vertical motions.Horizontal table motion was only sufficient to position the fixed beamacross about half the length of the 3-m-long counters. Four dicounterswere mounted together, one behind the other, so that the beam wasincident at the same position on each counter.
The experimental setup illustrated in Fig. 6 employed four 1.0-mmpitch multi-wire proportional chambers (MWPCs) with time-to-digital-conversion readout, two upstream (𝑧 = −3667 mm and 𝑧 = −906 mm)and two downstream (𝑧 = 1935 mm and 𝑧 = 9672 mm) of the upstreamcounters face (𝑧 = 0 mm). Typical residuals were on the order of0.5 mm. Proton tracks were reconstructed from the MWPC data byapplying a straight-line fit and requiring a normalized 𝜒2 value of lessthan two. Hits were required in at least three out of the four MWPCsand events with multiple hits in a plane separated by more than fourwires were rejected to eliminate events with multiple interactions. Thebeam profile from a typical run as reconstructed by the MWPCs is givenin Fig. 7. The trigger consisted of a coincidence of three scintillationcounters, all 101.6 × 101.6 mm2, one upstream, and two downstream ofthe motion table.
Digitization of the SiPM signals was initiated by the trigger signalfrom the scintillation counters and a begin-of-spill timing signal fromthe Fermilab Test Beam Facility. A total of 127 samples were stored for
Fig. 7. The beam profile for protons which triggered the data acquisition ina typical run. Dicounters in this run were nominally positioned so the protonbeam was incident 1000 mm from one end of the dicounter and at 75 mm fromthe bottom of the dicounter (transversally centered in the top counter). The xand y projections are shown on a log scale. The Gaussian sigmas from fits to thepeak region in the projections are also shown in the figure.
each triggered event for a total sampling length of 1597ns. The FEBbuffered the triggered data during the spill in an on-board DRAM thatwas read out between spills to a laptop computer. Two FEBs were usedin the data acquisition (DAQ), one for each end of the counters.
Data were taken during two running periods: February and Juneof 2016. In the February period several fiber diameters were testedincluding 1.8, 1.4, and 1.0 mm in different dicounters all with the samescintillator/reflective coating mixture of 1% PPO+ 0.03% POPOP/15%TiO2. In the June period three different scintillator/reflective coatingmixtures were tested, all with 1.4 mm diameter fibers: (1) 1% PPO +0.03% POPOP/30% TiO2, (2) 1% PPO + 0.05% POPOP/30% TiO2, and(3) 1% PPO+ 0.05% bis-MSB/30% TiO2. In the analysis described heretheir light output is always compared to a common reference dicounterfrom the February 2016 period with 1.4 mm diameter fibers.
4. Gain and photoelectron calibration
SiPMs produce a signal that is proportional to the number of pixelsthat have fired. For low-noise and low-crosstalk devices operating
86
A. Artikov et al. Nuclear Inst. and Methods in Physics Research, A 890 (2018) 84–95
Fig. 8. A typical response from a SiPM due to a proton traveling through acounter. The time difference between samples is 12.6 ns. The 𝑦-axis is the ADCvalue digitized by the FEB. Note the single photoelectron noise hit prior to thearrival of the photon and the undershoot after the signal region.
with minimal saturation effects, such as the SiPMs used in thesemeasurements,[8]1 the number of pixels fired is roughly equal tothe photoelectron (PE) yield. Each SiPM was calibrated to determinehow a given response corresponds to the number of photons thatwere detected. When a proton traverses a counter, the time-dependentresponse received from a SiPM will typically look like the signal shownin Fig. 8. Every 12.6 ns the signal from the SiPM is sampled and digitized.The resulting ADC value is a function of the gain applied to the SiPMsignal by the FEB and the number of SiPM pixels that fired. The responseof a SiPM is dependent on the over-voltage, defined as the differencebetween the applied bias voltage and the breakdown voltage of theSiPM. The breakdown voltage is unique to each SiPM, but it was foundthat they did not vary by more than ±0.1V. Hence, the same bias wasapplied to each of the SiPMs. Bias voltages of 55.1 V and 55.3 V werechosen for the February 2016 and June 2016 runs, respectively. Thesecorrespond to an overvoltage of about 2V. The amplifier gain appliedat the FEB was set to fill half of the range of the 12-bit ADC.
A calibration was performed to provide a conversion between anADC value and the equivalent PE yield. Before the calibration, thepedestal must be subtracted from all other ADC values in order tozero-center the data. The pedestal was defined to be the most probableADC value taken from the pre-signal region (0 to 945ns or the first75 samples or in Fig. 8). Then calibration was done by finding ADCvalues corresponding to just one or two fired pixels from dark-currentpulses. In Fig. 8, before the large signal pulse, a small dark pulse isvisible corresponding to the signal from a single pixel.
The integral of each pulse was taken as a measure of the size of thesignal. To do so, a Gumbel distribution [12] given by
𝐴𝐷𝐶(𝑡) = 𝐴𝑒−𝑡−𝐵𝐶 −𝑒−
𝑡−𝐵𝐶 , (1)
was fit to each pulse.2 In Eq. (1), 𝐴∕𝑒 is the pulse height, 𝐵 is the pulsetime, and 𝐶𝜋∕
√
6 is the pulse width (standard deviation). The integralof Eq. (1) is given by 𝐴×𝐶 and was used as a measure of the total signaloutput from a SiPM. Fig. 9 shows fitted pulses corresponding to 1 and2 photoelectrons due to the dark current. The figure also includes anexample signal pulse.
1 According to Hamamatsu, the 2.0 × 2.0 mm2 SiPMs operating with a 2Vovervoltage have less than one million dark noise counts per second above .5PE, and about 2% cross talk.
2 The Gumbel distribution was selected because it was found empirically togive a good description of the pulse shapes.
(a) 1 PE dark pulse. (b) 2 PE dark pulse. (b) 41 PE pulse.
Fig. 9. Typical pulses, after pedestal subtraction, and fit with a Gumbeldistribution whose integral corresponds to: (a) one photoelectron, (b) twophotoelectrons, and (c) a signal pulse.
To conduct the calibration, the pre-signal region for all events issampled to find dark pulses like those seen in the pre-signal region ofFig. 8. All dark pulses found are fit using Eq. (1) and the distribution ofthe integrals of these pulses is formed (an example is shown in Fig. 10).Independent Gaussian fits are applied to the peaks in the histogramand the mean values correspond to the pulse sizes for one and twophotoelectrons. A small peak from three photoelectrons can also beobserved in Fig. 10. However, it was not included in the analysis becausethe calibration is done in an automated way for all channels and runsand there is not always statistics to resolve this third peak. The pedestaland the one and two PE values are plotted in the inset of Fig. 10 anda linear fit is applied to the data. The slope of this line provides theconversion between ADC values and PE values for a single SiPM. Withthis calibration method, conversion factors are stable to better than ±1%between runs under stable temperature conditions (±0.5◦C).
5. Data analysis
The test beam data is used to study the PE yield and timing propertiesof the 3m-long counters. Unless otherwise noted, the light yield isdetermined by summing the PE yield from the two SiPMs on one endof a counter. The light yield of a counter is determined from the PEyield distribution from each proton that caused a trigger and passed theMWPC event selection. Each PE distribution was fit with the sum of aGaussian and a Landau function in order to extract the peak and fullwidth at half maximum (FWHM). The peak value of the resulting fit istaken as the most probable PE value and is often referred to simply asthe PE yield.
With ∼50,000 events per run the typical statistical uncertainties onthe most probable PE values are small (< 0.1%). However, in caseswhere the same counter was measured multiple times from the samebeam position, it was observed that PE yield results are stable to ±2%or better. Observed variations can be attributed to uncertainties in thecalibration, temperature variations, and statistical limitations of theanalysis method.3
5.1. Studies of photoelectron yields
Fig. 11 shows the PE distribution of the reference counter whenprotons are normally incident at the transverse center of the counter and
3 The average room temperatures during the February and June data takingperiods were 23C and 24C, respectively, with a standard deviation of < 1◦C. Wedid not attempt to correct for temperature dependence, however the analysesthat compared PE yield directly between runs were checked, and temperaturevariations in those runs are stable to ±1◦C. A temperature fluctuation of 1◦Ccorresponds to a photon detection efficiency fluctuation of about 1–2%.
87
A. Artikov et al. Nuclear Inst. and Methods in Physics Research, A 890 (2018) 84–95
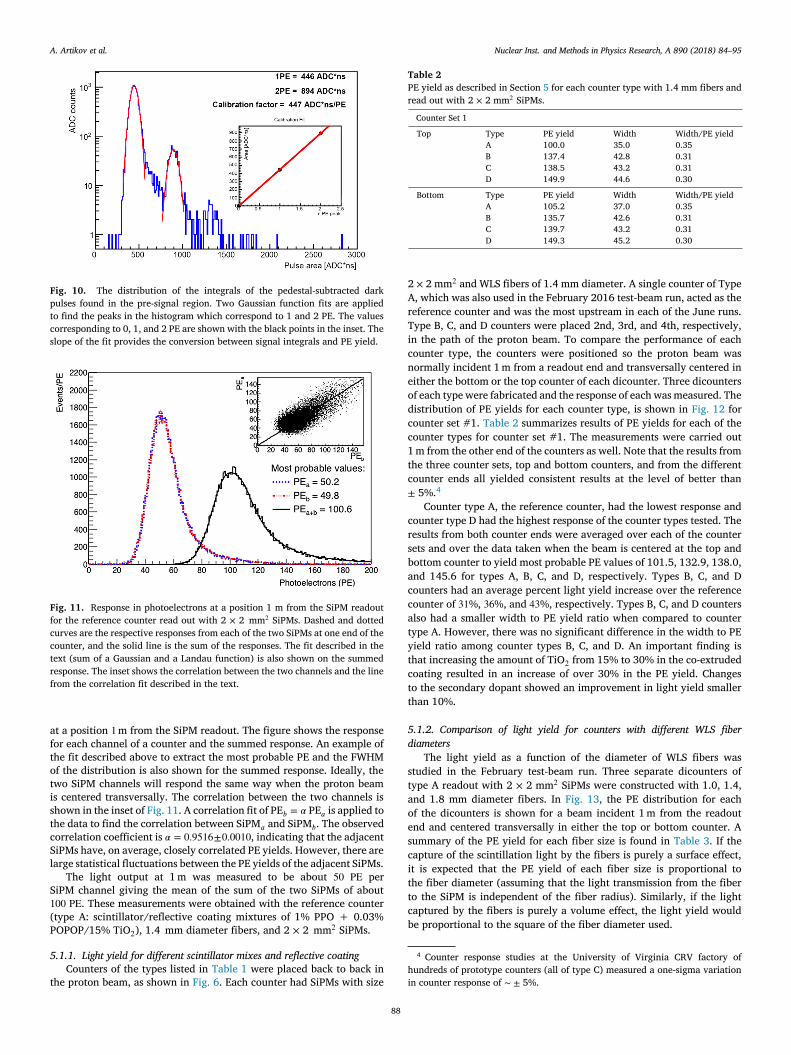
Fig. 10. The distribution of the integrals of the pedestal-subtracted darkpulses found in the pre-signal region. Two Gaussian function fits are appliedto find the peaks in the histogram which correspond to 1 and 2 PE. The valuescorresponding to 0, 1, and 2 PE are shown with the black points in the inset. Theslope of the fit provides the conversion between signal integrals and PE yield.
Fig. 11. Response in photoelectrons at a position 1 m from the SiPM readoutfor the reference counter read out with 2 × 2 mm2 SiPMs. Dashed and dottedcurves are the respective responses from each of the two SiPMs at one end of thecounter, and the solid line is the sum of the responses. The fit described in thetext (sum of a Gaussian and a Landau function) is also shown on the summedresponse. The inset shows the correlation between the two channels and the linefrom the correlation fit described in the text.
at a position 1m from the SiPM readout. The figure shows the responsefor each channel of a counter and the summed response. An example ofthe fit described above to extract the most probable PE and the FWHMof the distribution is also shown for the summed response. Ideally, thetwo SiPM channels will respond the same way when the proton beamis centered transversally. The correlation between the two channels isshown in the inset of Fig. 11. A correlation fit of PE𝑏 = 𝛼 PE𝑎 is applied tothe data to find the correlation between SiPM𝑎 and SiPM𝑏. The observedcorrelation coefficient is 𝛼 = 0.9516±0.0010, indicating that the adjacentSiPMs have, on average, closely correlated PE yields. However, there arelarge statistical fluctuations between the PE yields of the adjacent SiPMs.
The light output at 1m was measured to be about 50 PE perSiPM channel giving the mean of the sum of the two SiPMs of about100 PE. These measurements were obtained with the reference counter(type A: scintillator/reflective coating mixtures of 1% PPO + 0.03%POPOP/15% TiO2), 1.4 mm diameter fibers, and 2 × 2 mm2 SiPMs.
5.1.1. Light yield for different scintillator mixes and reflective coatingCounters of the types listed in Table 1 were placed back to back in
the proton beam, as shown in Fig. 6. Each counter had SiPMs with size
Table 2PE yield as described in Section 5 for each counter type with 1.4 mm fibers andread out with 2 × 2 mm2 SiPMs.
Counter Set 1
Top Type PE yield Width Width/PE yieldA 100.0 35.0 0.35B 137.4 42.8 0.31C 138.5 43.2 0.31D 149.9 44.6 0.30
Bottom Type PE yield Width Width/PE yieldA 105.2 37.0 0.35B 135.7 42.6 0.31C 139.7 43.2 0.31D 149.3 45.2 0.30
2 × 2 mm2 and WLS fibers of 1.4 mm diameter. A single counter of TypeA, which was also used in the February 2016 test-beam run, acted as thereference counter and was the most upstream in each of the June runs.Type B, C, and D counters were placed 2nd, 3rd, and 4th, respectively,in the path of the proton beam. To compare the performance of eachcounter type, the counters were positioned so the proton beam wasnormally incident 1m from a readout end and transversally centered ineither the bottom or the top counter of each dicounter. Three dicountersof each type were fabricated and the response of each wasmeasured. Thedistribution of PE yields for each counter type, is shown in Fig. 12 forcounter set #1. Table 2 summarizes results of PE yields for each of thecounter types for counter set #1. The measurements were carried out1m from the other end of the counters as well. Note that the results fromthe three counter sets, top and bottom counters, and from the differentcounter ends all yielded consistent results at the level of better than± 5%.4
Counter type A, the reference counter, had the lowest response andcounter type D had the highest response of the counter types tested. Theresults from both counter ends were averaged over each of the countersets and over the data taken when the beam is centered at the top andbottom counter to yield most probable PE values of 101.5, 132.9, 138.0,and 145.6 for types A, B, C, and D, respectively. Types B, C, and Dcounters had an average percent light yield increase over the referencecounter of 31%, 36%, and 43%, respectively. Types B, C, and D countersalso had a smaller width to PE yield ratio when compared to countertype A. However, there was no significant difference in the width to PEyield ratio among counter types B, C, and D. An important finding isthat increasing the amount of TiO2 from 15% to 30% in the co-extrudedcoating resulted in an increase of over 30% in the PE yield. Changesto the secondary dopant showed an improvement in light yield smallerthan 10%.
5.1.2. Comparison of light yield for counters with different WLS fiberdiameters
The light yield as a function of the diameter of WLS fibers wasstudied in the February test-beam run. Three separate dicounters oftype A readout with 2 × 2 mm2 SiPMs were constructed with 1.0, 1.4,and 1.8 mm diameter fibers. In Fig. 13, the PE distribution for eachof the dicounters is shown for a beam incident 1m from the readoutend and centered transversally in either the top or bottom counter. Asummary of the PE yield for each fiber size is found in Table 3. If thecapture of the scintillation light by the fibers is purely a surface effect,it is expected that the PE yield of each fiber size is proportional tothe fiber diameter (assuming that the light transmission from the fiberto the SiPM is independent of the fiber radius). Similarly, if the lightcaptured by the fibers is purely a volume effect, the light yield wouldbe proportional to the square of the fiber diameter used.
4 Counter response studies at the University of Virginia CRV factory ofhundreds of prototype counters (all of type C) measured a one-sigma variationin counter response of ∼ ± 5%.
88
A. Artikov et al. Nuclear Inst. and Methods in Physics Research, A 890 (2018) 84–95
(a) Top, counter set #1. (b) Bottom, counter set #1.
Fig. 12. The PE yield distribution for the first counter set shown for the top (a) and bottom (b) counter for each type given in Table 1. The proton beam was incident1m from the readout end and centered transversally in the counter. Note that type B and type C are hard to differentiate in the figure due to the similarity of theirdistributions.
(a) Top counter. (b) Bottom counter.
Fig. 13. The PE distribution for dicounters with 1.0, 1.4, and 1.8 mm diameter WLS fibers. The proton beam was incident 1 m from the readout end and centeredtransversally in the (a) top counter and the (b) bottom counter.
Table 3PE yield as described in Section 5 and fiber size comparison for type A countersread out with 2 × 2 mm2 SiPMs. The ratio shown is of the PE yields.Fiber size PE yield Width Width/PE Ratio1.0 Ratio1.4Top counter
The data given in Table 3 show that PE yield increases roughlylinearly with fiber diameter, indicating light yield from the fibers islargely a surface effect. However, in a study using a 3 × 3 mm2 SiPM apotential registration problem with the 1.8 mm fiber was discovered. Itsuggests a light loss of about 18% when the 1.8 mm fiber is paired witha 2 × 2 mm2 SiPMs. If this is taken into account, then the dependence isslightly non-linear, suggesting that light is largely, but not completely,collected near the fiber surface.
Table 4Summary of change in PE yield as described in Section 5 due to application ofoptical grease between the 1.8 mm diameter fibers and the 2 × 2 mm2 SiPMs.The ratio shown is of the PE yields.
PE yield Width Width/PE yield Ratio
No grease 144.3 45.4 0.31Grease 158.1 46.2 0.29 1.1
5.1.3. Effect of improving the optical coupling between SiPM and WLS fiberThe effect of placing BC-630 Silicone Optical Grease [13] (index of
refraction of 1.465) between the ends of the WLS fibers and the SiPMswas explored in the February test-beam run. Note that the fiber core hasan index of 1.59 [6] and the epoxy coating of the SiPM has an index of1.55 [8]. A dicounter of type A with 1.8 mm fibers and 2 × 2 mm2 SiPMshad optical grease placed between the SiPMs and the fiber ends. Fig. 14shows the PE yield of this dicounter when the beam was centered at aposition 1m from the readout end and centered transversely on the topcounter before and after the optical grease was applied. A summary ofthe results is given in Table 4. There is a small (10%) increase in the PEyield due to the application of optical grease indicating that the fibercoupling to the SiPM without the grease is already good.
89
A. Artikov et al. Nuclear Inst. and Methods in Physics Research, A 890 (2018) 84–95
Fig. 14. A comparison between the PE distributions for the same counter beforeand after optical grease was applied between the 1.8 mm diameter fibers andthe 2 × 2 mm2 SiPMs.
5.1.4. Studies of reflectors on counter endsDicounters with electronic readout on both ends produce some level
of reflection due to the previously mentioned change in the index ofrefraction between the fibers, air, and SiPMs. For counters with single-ended readout, the PE yield can be enhanced by adding reflectors tothe far end. Using single-ended readout may be cost effective, or maybe required due to issues of access, space constraints, or high radiationlevels.
In order to measure the effect of reflection at the opposite end ofa counter on PE yields, two different dicounters of type A with fiberdiameters 1.8 mm and 2 × 2 mm2 SiPMs were modified by replacingthe electronic readout at one end with a reflective material. Blacktape was applied at one end of the counter to set a baseline for thePE yields without reflection. Another dicounter had one end cappedwith aluminum coated Mylar. In Fig. 15(a) and Fig. 15(b), the PEdistributions are plotted when the beam was incident 1m from thereadout end and centered transversally on the top counter of eachdicounter tested. In the figure, one distribution comes from a run ofthe same dicounter with SiPMs at both ends and one comes from a runwith one of the described modifications at one end. A summary of theresults is given in Table 5.
Table 5PE yield as described in Section 5 with different reflector modifications. Theratio shown is of the PE yields.
From Table 5, the black tape reduced the PE yield by 14% comparedto SiPM readout electronics on the far end. The aluminum coated Mylarincreased PE yield by 32% relative to the readout electronics.5
5.2. Longitudinal, transverse, and angular counter scans
Data were taken with the proton beam positioned 100 mm from oneend to 750 mm from the opposite end of the 3 m long dicounters. Theselongitudinal scans were taken with the beam transversally centered ineach counter in the dicounter. Near one counter end, several runs werealso taken to study the falloff of the response due to counter end effects.Fig. 16 illustrates target locations of the proton beam. The counterresponse was also studied in four angular orientations relative to thebeam.
5.2.1. Longitudinal scansThe results reported previously all had the beam positioned at 1m
from the readout end. Longitudinal scans were made to study the vari-ation in PE yield with distance from the readout end. For these studies,multiple runs were made with the proton beam normally incident onvarious positions along the longitudinal length of the dicounter andtransversally centered either in the top or bottom counter (see Fig. 16).The motion table, to which the dicounters were fixed, did not allow forfurther movement beyond 2250 mm. However, since data are read outfrom both ends of the dicounter, data is available for beam positionsfrom 100 to 2900 mm (distance from one end of the dicounter of100 mm implies a distance from the other end of 2900 mm). Fig. 17shows the PE yield of the reference counter of type A with 2 × 2 mm2
SiPMs and 1.4 mm diameter fibers as a function of the beam position.
5 A more thorough study of various reflectors has been conducted using adark box and radioactive source by a subset of the authors of this work and willbe published soon.
(a) Black tape. (b) Aluminized Mylar.
Fig. 15. A comparison of the PE distributions obtained with the beam at 1m from a readout end from the same counter with default readout and after (a) blacktape or (b) aluminum-coated Mylar was applied to the opposite end of the counter. The default case refers to readout electronics (SiPM) on the far end. The beamwas located 1m from the readout end of the dicounter.
90
A. Artikov et al. Nuclear Inst. and Methods in Physics Research, A 890 (2018) 84–95
Fig. 16. Beam longitudinal and transverse positions used in the counter scans.
Fig. 17. The PE yield (most probable value) of the standard counter as a functionof the distance from the SiPM readout. Solid (open) circles are data from the top(bottom) counter. The statistical uncertainties on the most probable values ofthe PE distributions are too small to be visible on the figure.
The data points for the top and bottom counters in Fig. 17 followthe same trend. In principle, the data in Fig. 17 can be fit with anexponential function to estimate the attenuation length in the fiber. Inpractice, the result is sensitive to the range used in the fit due to edgeeffects in the counters (light loss from the end of the counter increaseswhen the proton beam is closer to the counter end). In addition, thelight attenuation in the fiber is wavelength dependent causing theaverage attenuation length to vary depending on the distance of theincident particle from the readout. Finally, the attenuationmeasurementis sensitive to the presence of light reflected from the far end of the fiberwhich is significant for the SiPM readout as discussed in Section 5.1.4.In Ref. [14] the attenuation length was measured as a function ofwavelength in the fiber using an apparatus designed for this purpose.
5.2.2. Longitudinal scan near counter endFine scans near the readout end of counters were conducted in order
to study the falloff of the response due to light escaping from the endof the counter. The default counters were rough cut with a circular sawbefore the black fiber guide bar was epoxied on. A special counter wasalso prepared in which both counter ends were painted with BC-620reflective paint from Saint-Gobain [13] before attaching the fiber guidebar. The falloff of the PE yield for the counter with reflective paintwas compared to the reference counter. Data from several runs wereused with the beam incident between 0 and 100 mm from the counterend. Each channel’s response was normalized to the value far from thereadout end (80 < 𝑥 < 120 mm). Consistent behavior in the four SiPMchannels (two near and two far) was observed for each counter and
Fig. 18. The falloff of the PE yield in the rough-cut counter (default) comparedto the counter whose ends were painted with reflective paint. Counters werenormalized to their own response far from the readout end (80 < 𝑥 < 120 mm)so that the falloff near the end could be directly compared. Statistical error barsare too small to be visible on the figure.
the data were combined into the summary plot shown in Fig. 18. Bothcounters show a falloff in the PE yield as the protons get closer to thecounter end. However, the painted counter performs significantly better.For protons 2 mm from the counter end the reference counter has lostabout 50% of its light yield, while the counter with painted ends hasonly lost about 20%. Beyond 100 mm there is no noticeable difference(< 2 %) between the performance of the reference counter and the onewhose end was prepared with white reflective paint.
5.2.3. Transverse responseThe response of the dicounters along their 100 mm transverse width
was measured for the reference counter when the proton beam wasincident 1.5m from the SiPM readout. Even though the proton beamwas incident either 25 mm (center of bottom counter) or 75 mm (centerof top counter) from the bottom of the dicounter, the spread of theproton beam spot shown in Fig. 7 allows for the transverse response tobe studied over the entire counter.6 To increase the number of eventsacross the transverse width, the response at both ends of the fiber wascombined for six runs: three when the beam was centered on the topcounter and three for the bottom counter.
The average PE yield as a function of position across the transversewidth for each fiber of the dicounter is shown in Fig. 19(a). For a givenfiber there is approximately a 20% variation in light yield across thecounter. This is expected due to the relatively poor light attenuation inthe scintillator extrusions and the shadowing effect of the fiber channels.
Combining the fibers in each counter, the average PE yield as afunction of position across the transverse width of the dicounter isshown in Fig. 19(b). An important feature of the data in Fig. 19 is thesharp drop off in average PE yield when the protons are close to theboundaries of each counter. Since each counter is 50 mm wide, theseboundaries occur at nominal positions of 0, 50, and 100 mm. There is aneffective gap of approximately 0.5 mm between the two counters dueto the TiO2 coating. There is also a dip in the average PE yield wherethe WLS fibers are located in each counter, at positions of ∼ 10, 35, 60,and 85 mm. This is consistent with the protons passing through lessscintillating material due to the channels housing the fiber.
5.2.4. Angular scansThe counter response was studied at four angular orientations of
the incident proton beam relative to the counter 𝜃 = 90◦, 105◦, 120◦,
6 Note that a more detailed transverse scan was produced in a past test-beamstudy and reported in Ref. [15].
91
A. Artikov et al. Nuclear Inst. and Methods in Physics Research, A 890 (2018) 84–95
(a) Four fiber channels. (b) Fibers combined.
Fig. 19. The average PE yield in the default counter type for (a) each of the four SiPM channels on one end of a dicounter and (b) averaged over the fibers in eachcounter, both shown as a function of the transverse position of the incident proton. In (a) the open (closed) triangles show the bottom (top) fiber in each counterin a dicounter (bottom counter between 0 and 50 mm and top counter between 50 and 100 mm). The beam was located 1.5m from the end of the dicounter. Theerror bars are large in locations where there were few incident protons.
and 150◦ as illustrated in Fig. 20(a). In the longitudinal dimensionprotons entered a counter at 1m from the edge. The correspondingPE responses are shown in Fig. 20(b) for the counter with a 1.8 mmdiameter fiber. The PE yields and widths of the fits for this data areshown in Fig. 21 as functions of the angle 𝜃 and the correspondingwidth of the counter along the beam direction. A linear increase ofthe number of photoelectrons as a function of the incident proton pathlength through the scintillator is observed.
5.3. Timing studies
5.3.1. Single-channel time resolution studiesThe photon arrival time at a SiPM is calculated by using the Gumbel
fit described in Section 4 to estimate the peak time of the pulse.7 Thesingle-channel time resolution can be estimated from the time differencebetween two channels on the same side of the same extrusion, sincethe incident proton should produce a coincident pulse in both channels.The standard deviation of the time difference in the channels 𝜎dif f isrelated to the single-channel time resolution 𝜎res by a factor of
√
2(𝜎res = 𝜎dif f
√
2). Fig. 22(a) shows the distribution of the time difference
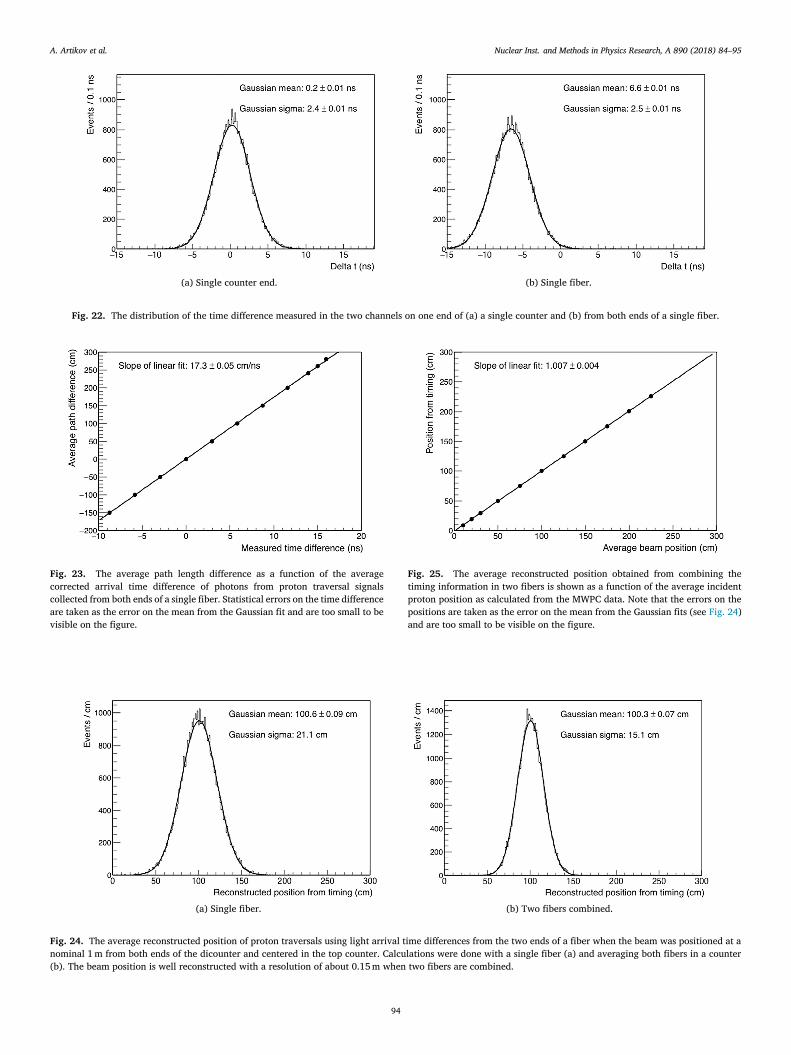
measured between the two channels of one counter end. The distributionis peaked at zero with a Gaussian sigma of 2.4 ns indicating a singlechannel timing resolution of 1.7 ns. The mean offset of 0.2 ns is smallcompared to the resolution and is probably due to differences in therouting of the two channels in the electronic readout. The result inFig. 22 uses counter type C. For the reference counter, type A, the timingresolution is 1.9 ns, while for counter type D the resolution is 1.6 ns.
Fig. 22(b) shows the distribution of the time difference measuredin the two channels from opposite ends of the same fiber in a counterof type C when the beam is located at the longitudinal center of thecounter. In this case, the fiber ends were read out with two differentFEBs. The resolution is close to that observed in Fig. 22(a) where asingle FEB was used. The results suggest that routing in the electronicreadout does not have a large impact on the time resolution and thattime resolution is primarily limited by variations of photon path lengthsin the scintillator and fiber affecting the mean arrival time at the SiPM.The large offset in the mean of Fig. 22(b) will be discussed in the nextsection.
7 The peak time, rather than the leading edge time, will be used by the CRVbecause the peak time method is less sensitive to the expected rate of noise hitsin the counters due to the neutron and gamma backgrounds in the detector hall.
5.3.2. Speed of light in the fiberThe difference in the arrival times of photons at the SiPMs on
opposite ends of the fibers can be used to determine the speed that thelight signal travels down the WLS fibers. The two ends of a dicounter areconnected to two separate readout boards (FEBs) that are synchronizedto a 26 MHz reference clock fanned out from a controller module.There are timing offsets between the cards that arise from a variety ofsources including differences in cabling lengths and logic delays. SeeFig. 22(b) for an example of this offset before a correction is applied. Inorder to find the time offsets and make a correction, the average timedifference between left and right readouts was found when the beamwas positioned in the middle of the length of the dicounter, 1500 mmfrom either end. The average time difference varies slightly by channel,but was found to be about 6 ns.
The path difference for light traveling to both ends of a fiber froma particle incident at position 𝑥 is 𝐿 − 2𝑥, where 𝐿 is the length of thecounter and 𝑥 = 0 is defined to be the end of the counter. So, if the lightarrival time difference 𝛥𝑡 is detected between SiPMs at opposite ends ofthe counter, the incident position of the proton along the counter lengthcan be calculated as
𝑥 =𝐿 − 𝛥𝑡 ∗ 𝑣𝛾
2. (2)
Hence, the speed of light in the fibers, 𝑣𝛾 , is
𝑣𝛾 = 𝐿 − 2𝑥𝛥𝑡
. (3)
Fig. 23 shows an example from one fiber of the average path lengthdifference based on the MWPC position versus the average correctedarrival time difference of photons arriving at each end of the fiber.Data was gathered when the beam was transversally centered on the topcounter and at various positions along the longitudinal position of thecounter, allowing for multiple path length differences to be sampled.Applying a linear fit to the data gives a speed of light in the WLSfibers of 17.3 cm/ns (0.58𝑐), where 𝑐 is the speed of light in vacuum.Using Kuraray’s quoted index of refraction for the fibers of 1.6, thenominal speed of light is calculated to be 18.73 cm/ns or 0.625𝑐. Theexperimentally determined speeds of light may not match the nominalcase due to the fact that photons do not travel down the fiber in a straightline, but rather travel helically down the fiber, increasing their effectivepath length and thus lowering the measured speed of light found usingthe straight-line path assumption.
92
A. Artikov et al. Nuclear Inst. and Methods in Physics Research, A 890 (2018) 84–95
Fig. 20. (a) The CRV counter orientation during angle scans with the proton beam 1 m from the counter end. (b) PE yields corresponding to the four angularpositions at 𝜃 = 90◦(nominal), 105◦, 120◦, 150◦ measured for the counter with 1.8 mm diameter fibers.
Fig. 21. The most probable PE value obtained as a function of (a) counter angular position and (b) the proton path length through the counter.
5.3.3. Position measurement from timingUsing the speed of light in the fibers and the light arrival time
difference, the incident position of the proton along the counter lengthcan be computed using Eq. (2). Fig. 24(a) shows the distribution ofreconstructed positions using timing information from both ends of asingle fiber for a run where the beam was incident 1m from the endsof a dicounter of type C. A fit was applied using a Gaussian functiongiving an average constructed position of 100.6± 0.1 cm and a standarddeviation of 21.1 cm using a single fiber. The longitudinal positionsof the counters were found to be misaligned by up to 8 mm, so thereconstruction position is in good agreement with the true position. Byaveraging the time difference in two fibers, the position resolution isimproved by a factor of 1∕
√
2 to about 15 cm, see Fig. 24(b).8
Proton positions were reconstructed based on timing and comparedto the average proton traversal position from the MWPC data when thebeam was centered transversely in a counter and incident at variouspositions along the longitudinal length of the dicounter. The averagereconstructed event position as a function of average incident protonposition is shown in Fig. 25. Applying a linear fit to the data in Fig. 25gave a slope consistent with 1.0 indicating that the incident protonposition could be accurately reconstructed.
8 The position may also be estimated by comparing the light yield responseat each end of a counter, but the resolution from that method is found to beapproximately a factor of two worse than the resolution using timing.
6. Summary and conclusions
A pulsed beam of 120 GeV protons provided at the Fermilab TestBeam Facility was used to measure properties of the prototype countersfor the Cosmic Ray Veto system of the Mu2e experiment. The counterswere constructed using extruded scintillation strips with titanium diox-ide coating and embedded wavelength-shifting fibers read out by siliconphotomultipliers.
The average PE yield was measured to be 50 PE per SiPM channelfor normal incident protons at a position 1 m from the end of a 3 m-longcounter read out with 1.4 mm fibers and 2.0 × 2.0 mm2 SiPMs. Withincreased concentration of TiO2 in the co-extruded counter coating, theaverage PE yield increased by more than 30% to over 65 PE per SiPMchannel. Studies of the impact of changing the fiber size, and the amountof dopant were also performed.
Longitudinal and transverse beam scans were used to study proper-ties of the prototype counters and the light yield from angular scanswas found to be consistent with our expectations according to thelength of the path taken through the counter. Single-channel timingresolution based on a 79.5 MHz sampling rate was demonstrated to bebetter than 2 ns. With a single-channel timing resolution of less than2 ns, the particle position can be determined using the time differencefrom readouts at each end of the fiber to 15 cm by combining timinginformation from both fibers in a counter.
The Mu2e counters will be outfitted with 1.4 mm diameter WLSfibers, the most recent vintage 2.0×2.0 mm2 Hamamatsu SiPMs, and willbe extruded with the improved TiO2 concentration in the co-extrudedcoating. With this configuration, the Cosmic Ray Veto system will meetthe requirements of the Mu2e experiment.
93
A. Artikov et al. Nuclear Inst. and Methods in Physics Research, A 890 (2018) 84–95
(a) Single counter end. (b) Single fiber.
Fig. 22. The distribution of the time difference measured in the two channels on one end of (a) a single counter and (b) from both ends of a single fiber.
Fig. 23. The average path length difference as a function of the averagecorrected arrival time difference of photons from proton traversal signalscollected from both ends of a single fiber. Statistical errors on the time differenceare taken as the error on the mean from the Gaussian fit and are too small to bevisible on the figure.
Fig. 25. The average reconstructed position obtained from combining thetiming information in two fibers is shown as a function of the average incidentproton position as calculated from the MWPC data. Note that the errors on thepositions are taken as the error on the mean from the Gaussian fits (see Fig. 24)and are too small to be visible on the figure.
(a) Single fiber. (b) Two fibers combined.
Fig. 24. The average reconstructed position of proton traversals using light arrival time differences from the two ends of a fiber when the beam was positioned at anominal 1m from both ends of the dicounter and centered in the top counter. Calculations were done with a single fiber (a) and averaging both fibers in a counter(b). The beam position is well reconstructed with a resolution of about 0.15m when two fibers are combined.
94
A. Artikov et al. Nuclear Inst. and Methods in Physics Research, A 890 (2018) 84–95
Acknowledgments
We are grateful for the vital contributions of the Fermilab staffand the technical staff of the participating institutions. This work wassupported by the US Department of Energy; the Italian Istituto Nazionaledi Fisica Nucleare; the Science and Technology Facilities Council, UK;the Ministry of Education and Science of the Russian Federation; the USNational Science Foundation; the Thousand Talents Plan of China; theHelmholtz Association of Germany; and the EU Horizon 2020 Researchand Innovation Program under the Marie Sklodowska-Curie GrantAgreement No. 690385. Fermilab is operated by the Fermi ResearchAlliance, LLC under Contract No. DE-AC02-07CH11359 with the U.S.Department of Energy, Office of Science, Office of High Energy Physics.The United States Government retains and the publisher, by acceptingthe article for publication, acknowledges that the United States Govern-ment retains a non-exclusive, paid-up, irrevocable, world-wide licenseto publish or reproduce the published form of this manuscript, or allowothers to do so, for United States Government purposes.
References
[1] L. Bartoszek, et al., Mu2e Technical Design Report, 2015, arXiv:1501.05241.[2] W.H. Bertl, et al. [SINDRUM II Collaboration], Eur. Phys. J. C 47 (2006) 337.
[4] A. Pla-Dalmau, A.D. Bross, V. Rykalin, Extruding plastic scintillator at fermilab, in:2003 IEEE NSS Conference Record, FERMILAB-CONF-03-318-E.
[5] Scotch-Weld DP420, 3M, 3M Center, St. Paul, MN 55144, USA.[6] Kuraray America, Inc. 200 Park Ave. NY 10166 USA; 3-1-6, NIHONBASHI, CHUO-
KU, TOKYO 103-8254, JAPAN. http://kuraraypsf.jp/psf. (Accessed July 2017).[7] Scotch-Weld DP100, 3M, 3M Center, St. Paul, MN 55144, USA.[8] Hamamatsu Photonics K.K. 325-6 Sunayama-cho, Naka-ku, Hamamatsu City,
[13] Saint-Gobain, http://www.crystals.saint-gobain.com/products/assembly-materials.(Accessed August 2017).
[14] G. DeZoort, E.C. Dukes, R.C. Group, H. Kessenich, Y. Oksuzian, T. Rase, D. Shooltz,Performance of Wavelength-Shifting Fibers for the Mu2e Cosmic Ray Veto Detector,2015, arXiv:1511.06225.
[15] A. Artikov, et al. [Mu2e Cosmic Ray Veto Group], Performance of scintillatorcounters with silicon photomultiplier readout, in: Proceedings, Meeting of the APSDivision of Particles and Fields (DPF 2015): Ann Arbor, Michigan, USA, 4-8 Aug2015, DPF2015-350, arXiv:1511.00374.