II. One-Dimensional Fourier Transform Spectroscopy 7
III. Two-Dimensional Fourier Transform Spectroscopy 9
IV. Modified Two-Dimensional FT-NMR Experiments 15
V. Relayed Correlation 15
VI. Rotating Frame Experiments 15
VII. Multiple-Quantum Spectroscopy 18
VIII. Multiple-Quantum Filtering 19
IX. Spin-Topology Filtration 22
X. Exclusive Correlation Spectroscopy 22
XI. Heteronuclear Two-Dimensional Experiments 22
XII. Three-Dimensional Fourier-Transformation Spectroscopy 23
XIII. Molecular Dynamics Investigated by NMR 25
XIV. Magnetic Resonance Fourier Imaging 27
XV. Conclusion 28
XVI. References 29
I. Introduction
The world of the nuclear spins is a true par- mechanics and quantum statistics, and numerousadise for theoretical and experimental physicists. textbook-like examples have emerged. On the otherIt supplies, for example, most simple test systems hand, the ease in handling nuclear spin systems pre-for demonstrating the basic concepts of quantum destines them for the testing of novel experimental
,. - , . , J? j .. r,, i , , t • • . -4.il.- herent spectroscopy have been developed predomi-the Nobel Foundation, Stockholm, for permission to print this K K J .lecture. nantly within nuclear magnetic resonance (NMR)
6 Bulletin of Magnetic Resonance
and have found widespread application in a varietyof other fields.
Several key experiments of magnetic resonancehave already been honored by Nobel prizes inphysics, starting with the famous molecular-beamexperiments by Isidor I. Rabi (1-3) acknowledged in1944, followed by the classical NMR experiments byEdward M. Purcell (4) and Felix Bloch (5,6), hon-ored with the 1952 prize, and the optical detectionschemes by Alfred Kastler (7), leading to a prize in1966. Some further Nobel prize winners in Physicshave been associated in various ways with magneticresonance: John H. Van Vleck developed the the-ory of dia- and paramagnetism and introduced themoment method into NMR; Nicolaas Bloembergenhad a major impact on early relaxation theory andmeasurements; Karl Alex Miiller contributed sig-nificantly to electron paramagnetic resonance; Nor-man F. Ramsey is responsible for the basic theoryof chemical shifts and J couplings; and Hans G.Dehmelt developed pure nuclear quadrupole reso-nance.
But not only for physicists is nuclear magneticresonance of great fascination. More and morechemists, biologists and medical doctors discoverNMR spectroscopy, not so much for its conceptualbeauty but for its extraordinary usefulness. In thiscontext, a great number of magnetic resonance toolshave been invented to enhance the power of NMR inview of a variety of applications (8-15). This Nobellecture provides a glimpse behind the scenes in anNMR toolmaker's workshop.
Nuclear spin systems possess unique propertiesthat predestine them for studies of molecules:
1) The atomic nuclei serving as sensors are ex-tremely well localized, with a diameter of a few fem-tometers, and can report on local affairs in theirimmediate vicinity. It is thus possible to exploremolecules and matter in great detail.
2) The interaction energy of the sensors withthe environment is extremely small, less than 0.2J mol"1, corresponding to the thermal energy at 30mK. The monitoring of molecular properties is thusvirtually perturbation-free. Nevertheless, the inter-action is highly sensitive to the local environment.
3) Information on the structure of molecules canbe obtained from nuclear pair interactions: Mag-netic dipole-dipole interactions provide distance in-formation, while scalar J couplings allow one to de-
termine dihedral angles.At first glance, it may be astonishing that it is
possible to accurately determine internuclear dis-tances by radio frequencies with wavelengths A »1 m, since this seemingly violates the quantum me-chanical uncertainty relation, aq • ap > Ti/2, withthe linear momentum p = 2nh/X, as it applies toscattering experiments or to a microscope. It isimportant that in magnetic resonance the geomet-ric information is encoded in the spin Hamiltonian,7i = 7i ( q i , . . . , qfc), where q^ is the nuclear coordi-nates. An accurate structure determination, there-fore, boils down to an accurate energy measurementthat can be made as precise as desired, providedthat the observation time t is extended accordingto CTE • t > %/2. An upper limit of t is in practicegiven by the finite lifetime of the energy eigenstatesdue to relaxation processes. Thus, the accuracy ofNMR measurements is not restricted by the wave-length but rather by lifetimes limited by relaxationprocesses.
The information content of a nuclear spin Hamil-tonian and the associated relaxation superoperatorof a large molecule, for example a protein, is im-mense: It is possible to determine the frequencies ofthe chemical shifts of hundreds of spins in a moleculeto an accuracy of 16-18 bits. Internuclear distancesfor thousands of proton pairs can be measured toabout 0.1 A. Several hundred dihedral angles in amolecule can be determined with an uncertainty ofless than 10°.
The weakness of the nuclear spin interactions, sofar described as an advantage, leads on the otherhand to severe problems in detection. Large num-bers of spins are required to discriminate the weaksignals from noise. Under optimum conditions withmodern high-field NMR spectrometers, 1014-1015
spins of one kind are needed to detect a signal withina measurement time of one hour. The low signal-to-noise ratio is the most limiting handicap of NMR.Any increase by technical means would significantlyextend the possible range of NMR applications.
This clearly defines the two goals that had to beachieved during the past three decades to promoteNMR as a practical tool for molecular structure de-termination: 1) Optimization of the signal-to-noiseratio; 2) Development of procedures to cope withthe enormous amount of inherent information on themolecule under investigation.
Vol. 16, No. 1/2 7
FT CW
Figure 1: Schematic representation of pulse FTspectroscopy illustrated by the 60 MHz 1H NMRspectrum of 7-ethoxy-4-methylcoumarin (22). Aninitial (7r/2)y rf pulse, represented by the rotationsuperoperator P, excites the transverse magnetiza-tion <r(0) from the equilibrium state a0. Free preces-sion of all coherences in parallel under the evolutionsuperoperator E(t) leads to the final state a(t). De-tection with the detection operator D produces theFID shown (sum of 500 scans) which, after Fouriertransformation T provides the spectrum FT. Forcomparison, a continuous-wave (CW) spectrum isshown which was also recorded in 500 s under iden-tical conditions.
II. One-Dimensional FourierTransform Spectroscopy
A major improvement in the signal-to-noise ra-tio of NMR spectra was achieved in 1964 by theconception of Fourier transform (FT) spectroscopy.The basic principle-parallel data acquisition, lead-ing to the multiplex advantage-was applied alreadyby Michelson in 1891 in optical spectroscopy (16)and explicitly formulated by Fellgett in 1951 (17).However, the approach used in optics, spatial in-terferometry, is unsuited for NMR spectroscopy,since an interferometer with the necessary resolu-tion would require a pathlength of at least 3 x 10⁸
m.Weston A. Anderson at Varian Associates in
Palo Alto was experimenting in the early sixtieswith a mechanical multiple-frequency generator, the"wheel of fortune", which was conceived to simulta-neously excite the spin system with N frequencies,
in order to shorten the performance time of an ex-periment by a factor N, by recording the responseof N spectral elements in parallel (18). It was soonrecognized that more elegant solutions were neededfor commercial success.
Numerous possibilities are conceivable for thegeneration of a broad-band frequency source thatallows the simultaneous irradiation of all of thespins of a spin system. We mention four schemes:1) Radio-frequency pulse excitation, 2) stochasticrandom noise excitation, 3) rapid scan excitation,4) excitation by a computer-synthesized multiple-frequency waveform. For each method, a differenttype of data processing is required to derive the de-sired NMR spectrum.
The application of radio-frequency (rf) pulse ex-citation was suggested by Weston A. Anderson tothe author for a detailed experimental study in 1964(19-21). The experiment is outlined in Figure 1. Tothe sample that is polarized in a static magnetic fieldalong the z-sods, an rf pulse is applied along the y-axis that rotates the magnetization vectors Mfc ofall spins lk by vr/2 into an orientation perpendicularto the static field. In the arrow notation (23) withthe acting operator, here a (vr/2)y rotation, on thetop of the arrow this is expressed by eqn. 1.
Mkz Mkx (1)
The subsequent free induction decay (FID) consistsof the superposition of all eigenmodes of the sys-tem. The operator D of an observable is used todetect the signal that is Fourier-transformed to sep-arate the different spectral contributions. Figure 1shows an early example of FT NMR spectroscopyon the sample 7-ethoxy-4-methylcoumarin for which500 FIDs were coadded and Fourier-transformed toproduce the FT spectrum shown (22). A continu-ous wave (cw) spectrum obtained by the slow pas-sage through the frequency range was recorded inthe same total time of 500 s and is also shown inFigure 1 for comparison of the signal-to-noise ratios.
To please the more mathematically inclinedreader, the experiment can also be expressed bythe evolution of the density operator a (t) under thepreparation superoperator P = exp{-iFy7r/2} andthe evolution superoperator E(t) = exp{-iHt-Tt}.The superoperator Fy is defined by Fy A = [Fy, A]
Bulletin of Magnetic Resonance
with Fy — where Iky is a component angular
momentum operator of spin k. 7i is the Hamiltoniancommutator superoperator,7iA = [H, A] and F isthe relaxation superoperator. The expectation value< D > (t) of the observable operator D is then givenby eqn. 2, where cr$ represents the density operatorof the spin system in thermal equilibrium.
< D > (i) = Tr{DE(t)Pcr0} (2)The reduction in performance time for one spec-
trum is determined by the number of spectral ele-ments N, that is, the number of significant points inthe spectrum, roughly given by N = F/Af, whereF is the total width of the frequency range and A /a typical linewidth of a signal. A corresponding in-crease in the signal-to-noise ratio of y/~N per unittime can be obtained by coadding an appropriatenumber of FID signals originating from a repeatedpulse experiment. The gain in signal-to-noise canbe appreciated from Figure 1.
It has been known for a long time that the fre-quency response function (spectrum) of a linear sys-tem is the Fourier transform of the impulse re-sponse (FID). This was already implicitly evidentin the work of Jean Baptiste Joseph Fourier who in1822 investigated the heat conduction in solid bod-ies (24). In 1957 Lowe and Norberg proved thisrelation to hold also for spin systems despite theirstrongly nonlinear response characteristics (25).
Stochastic testing of unknown systems by whiterandom noise was proposed in the forties by Nor-bert Wiener (26). One could say that the color ofthe output noise carries the spectral information onthe investigated system. The first applications ofrandom noise excitation in NMR spectroscopy wereproposed independently by Russel H. Varian (27)and by Hans Primas (28,29) for broad-band excita-tion and broad-band decoupling, respectively. Thefirst successful experiments using random noise ir-radiation led to heteronuclear "noise decoupling"(30,31), a method that proved to be essential forthe practical success of 13C NMR spectroscopy inchemical applications.
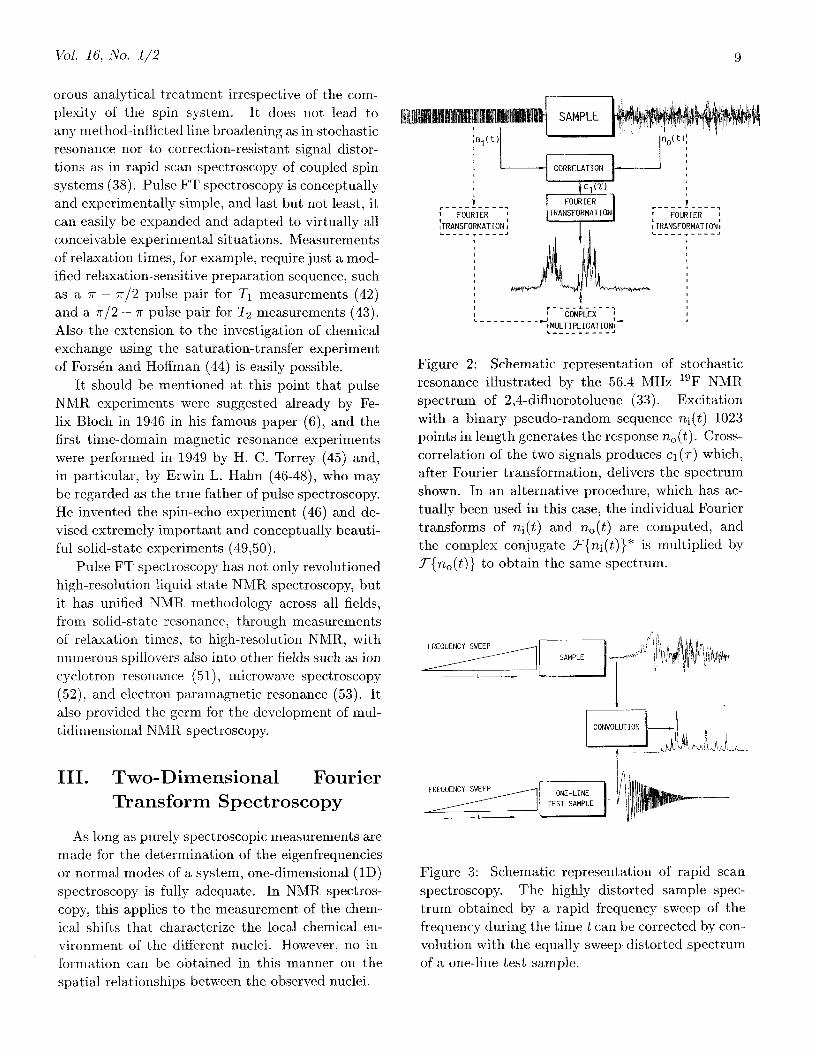
In 1970, Reinhold Kaiser (32) and the author(33) independently demonstrated stochastic reso-nance as a means to improve the signal-to-noiseratio of NMR experiments by broad-band irradia-tion. Here, the computed cross-correlation function
(eqn. 3) of the input noise n;(i) and the output noiseno(t) is equivalent to the FID of pulse FT spectros-copy.
CI(TT) = no(t)ni(t - T) (3)This is illustrated in Figure 2 for fluorine resonanceof 2,4-difluorotoluene. A binary pseudo-random se-quence with a maximal white spectrum is used forexcitation. Its advantages are the predictable spec-tral properties and the constant rf power. The lowpeak-power puts less stringent requirements on theelectronic equipment. Disadvantages arise from thesimultaneous irradiation and detection which canlead to line-broadening effects absent in pulse FTspectroscopy in which perturbation and detectionare separated in time. A further disadvantage, whenreal random noise is used, is the probabilistic natureof the response which requires extensive averagingto obtain a stable mean value. Higher order corre-lation functions, such as eqn. 4 allow also the char-acterization of nonlinear transfer properties of theinvestigated system (26).
= no(t)rii(t - - r2)rij(t - r3)(4)
This has been exploited extensively by Bliimich andZiessow for NMR measurements (34,35).
A third approach, rapid scan spectroscopy,initially proposed by Dadok and Sprecher (36),achieves a virtually simultaneous excitation of allspins by a rapid sweep through the frequency range(37,38). The resulting spectrum is strongly dis-torted, but can be corrected mathematically be-cause of the deterministic nature of the distortions.Correction amounts to convolution with the signalof a single spin measured under identical conditionsor simulated on a computer. An example is givenin Figure 3. It is interesting to note how similara rapid scan spectrum is to an FID except for thesuccessively increasing oscillation frequency.
Finally, it is possible by computer synthesis tocompute an excitation function with a virtually ar-bitrary excitation profile. This was originally uti-lized for decoupling purposes by Tomlinson and Hill(39), but is also the basis for composite pulse exci-tation schemes that have proved to be very powerful(40,41).
Among the broad-band excitation techniques,pulse excitation is the only one that allows for a rig-
Vol. 16, No. 1/2
orous analytical treatment irrespective of the com-plexity of the spin system. It does not lead toany method-inflicted line broadening as in stochasticresonance nor to correction-resistant signal distor-tions as in rapid scan spectroscopy of coupled spinsystems (38). Pulse FT spectroscopy is conceptuallyand experimentally simple, and last but not least, itcan easily be expanded and adapted to virtually allconceivable experimental situations. Measurementsof relaxation times, for example, require just a mod-ified relaxation-sensitive preparation sequence, suchas a ir — vr/2 pulse pair for T\ measurements (42)and a vr/2 — TT pulse pair for Ti measurements (43).Also the extension to the investigation of chemicalexchange using the saturation-transfer experimentof Forsen and Hoffman (44) is easily possible.
It should be mentioned at this point that pulseNMR experiments were suggested already by Fe-lix Bloch in 1946 in his famous paper (6), and thefirst time-domain magnetic resonance experimentswere performed in 1949 by H. C. Torrey (45) and,in particular, by Erwin L. Hahn (46-48), who maybe regarded as the true father of pulse spectroscopy.He invented the spin-echo experiment (46) and de-vised extremely important and conceptually beauti-ful solid-state experiments (49,50).
Pulse FT spectroscopy has not only revolutionedhigh-resolution liquid-state NMR spectroscopy, butit has unified NMR methodology across all fields,from solid-state resonance, through measurementsof relaxation times, to high-resolution NMR, withnumerous spillovers also into other fields such as ioncyclotron resonance (51), microwave spectroscopy(52), and electron paramagnetic resonance (53). Italso provided the germ for the development of mul-tidimensional NMR spectroscopy.
III. Two-Dimensional FourierTransform Spectroscopy
As long as purely spectroscopic measurements aremade for the determination of the eigenfrequenciesor normal modes of a system, one-dimensional (ID)spectroscopy is fully adequate. In NMR spectros-copy, this applies to the measurement of the chem-ical shifts that characterize the local chemical en-vironment of the different nuclei. However, no in-formation can be obtained in this manner on thespatial relationships between the observed nuclei.
Figure 2: Schematic representation of stochasticresonance illustrated by the 56.4 MHz 19F NMRspectrum of 2,4-difluorotoluene (33). Excitationwith a binary pseudo-random sequence n\(t) 1023points in length generates the response no{t). Cross-correlation of the two signals produces ci(r) which,after Fourier transformation, delivers the spectrumshown. In an alternative procedure, which has ac-tually been used in this case, the individual Fouriertransforms of n\(i) and no(t) are computed, andthe complex conjugate ^r{n;(i)}* is multiplied by
to obtain the same spectrum.
FREQUENCY SWEEP
Figure 3: Schematic representation of rapid scanspectroscopy. The highly distorted sample spec-trum obtained by a rapid frequency sweep of thefrequency during the time t can be corrected by con-volution with the equally sweep-distorted spectrumof a one-line test sample.
10 Bulletin of Magnetic Resonance
i> H^ R O
a -- - i [ H , a ] - f { cr - a0 }
COHERENT TRANSFER | | CROSS-RELAXATION "|
A B C D E F G H
Figure 4: The two pair-interactions relevant in NMRspectroscopy. The through-bond scalar 3\.\ couplingcontributes to the Hamiltonian and leads to a co-herent transfer (A) of spin order between spins Ikand I/. The time-modulated through-space dipole-dipole interaction Dmn(t) causes multiexponentialcross relaxation (B) between spins lm and In. Thetwo interactions allow a sequential assignment of theresonances of neighboring spins in the peptide frag-ment shown and the determination of structure pa-rameters. The three-bond J coupling is a measurefor the dihedral angle about the central bond, thedipole-dipole interaction for internuclear distances.
There are two important pair interactions innuclear spin systems, the scalar through-bondelectron-mediated spin-spin interaction (J coupling)and the through-space magnetic dipole-dipole inter-action (Figure 4). The J coupling is described bythe scalar term Tiki = 27rJfc/I/cI; in the spin Hamil-tonian. It is responsible for the multiplet splittingsin high-resolution spectra of liquids. Under suit-able conditions, it can lead to an oscillatory trans-fer of spin order between the two spins Ij, and I;.The magnetic dipole-dipole interaction Dmn, on theother hand, is represented by a traceless tensor ofsecond rank. Its average in isotropic solution is zero,and it can lead to signal splitting only in anisotropicmedia. However, its time modulation causes relax-ation processes also in isotropic solution that areresponsible for a multiexponential recovery of thespins to thermal equilibrium after a perturbation.Knowledge of these interactions allows one to de-duce geometric relations in the molecule in solution(54,55) and arrangements of atoms in solids. In theoptimum case, a complete three-dimensional struc-
Figure 5: Schematic correlation diagram for the rep-resentation of pair interactions of nuclear spins.
<7n *~ (7(0)E(t2)
(7(t1,t2)
Figure 6: Schematic representation of a 2D experi-ment, here with a simple two-pulse sequence. Thefirst pulse excites coherences that precess during t\and are transferred by the second pulse to differenttransitions where the coherences continue to precesswith a new frequency. The 2D spectrum obtainedby a 2D Fourier transformation of <D>(i i , t2) is a
visual representation of the transfer matrix R.
ture of a molecule can be deduced (56).Although these interactions affect ID spectra,
special techniques are needed for their measure-ment. In the approximation of a linear response,it is impossible by first principles to distinguish twoindependent signals from a doublet caused by a spin-spin interaction. Experiments to explore the nonlin-ear response properties of nuclear spin systems havebeen known since the fifties. In saturation stud-ies with strong rf fields several spins belonging tothe same coupled spin system are excited simulta-neously yielding multiple-quantum transitions that
Vol. 16, No. 1/2 11
contain connectivity information (57). Particularlyfruitful were double- and triple-resonance experi-ments in which two or three rf fields are appliedsimultaneously, resulting in decoupling and spin-tickling effects (58-60).
The early multiple-resonance experiments havein the meantime been replaced by multidimensionalexperiments. Pair interactions among spins aremost conveniently represented in terms of a correla-tion diagram as shown in Figure 5. This suggests therecording of a "two-dimensional spectrum" that es-tablishes such a correlation map of the correspond-ing spectral features. The most straightforward ap-proach may be a systematic double-resonance ex-periment whose result can be represented as an am-plitude S(u>i,u>2) which depends on the frequenciesu>i and u>2 of the two applied rf fields (8,58).
A new approach to measuring two-dimensional(2D) spectra was proposed by Jean Jeener in 1971(61). He suggested a 2D FT experiment consistingof two 7r/2 pulses with a variable time t\ between thepulses and the time variable £2 measuring the timeelapsed after the second pulse as shown in Figure 6;this is an expansion of the principles illustrated inFigure 1 (see also Fig. 10a). Measuring the responses{t\,t2) of the two-pulse sequence which is Fourier-transformed with respect to both time variables pro-duces a two-dimensional spectrum 5(^1,^2) of thedesired form (62,63).
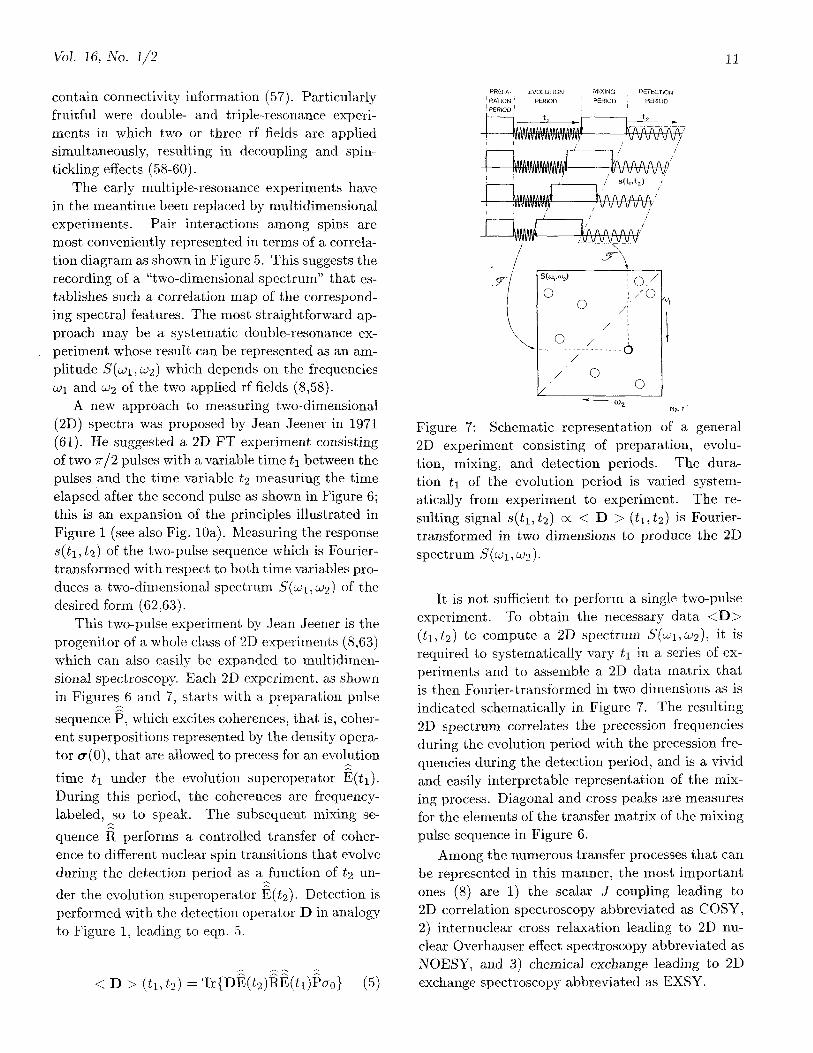
This two-pulse experiment by Jean Jeener is theprogenitor of a whole class of 2D experiments (8,63)which can also easily be expanded to multidimen-sional spectroscopy. Each 2D experiment, as shownin Figures 6 and 7, starts with a preparation pulsesequence P, which excites coherences, that is, coher-ent superpositions represented by the density opera-tor <x(0), that are allowed to precess for an evolutiontime t\ under the evolution superoperator E ^ ) .During this period, the coherences are frequency-labeled, so to speak. The subsequent mixing se-quence R performs a controlled transfer of coher-ence to different nuclear spin transitions that evolveduring the detection period as a function of t% un-der the evolution superoperator E(i2)- Detection isperformed with the detection operator D in analogyto Figure 1, leading to eqn. 5.
< D > (ti, t2) = Tt{DE(*2)RE(ti)P(7o} (5)
PREPA- EVOLUTION MIXING DETECTIONRATION ' PERIOD ' PERIOD ' PERIODPERIOD ' ' l
t, I 1 t ,
Figure 7: Schematic representation of a general2D experiment consisting of preparation, evolu-tion, mixing, and detection periods. The dura-tion t\ of the evolution period is varied system-atically from experiment to experiment. The re-sulting signal s(£i,*2) oc < D > (£i,*2) is Fourier-transformed in two dimensions to produce the 2Dspectrum
It is not sufficient to perform a single two-pulseexperiment. To obtain the necessary data <D>(£1,̂ 2) to compute a 2D spectrum S(COI,UJ2), it isrequired to systematically vary £1 in a series of ex-periments and to assemble a 2D data matrix thatis then Fourier-transformed in two dimensions as isindicated schematically in Figure 7. The resulting2D spectrum correlates the precession frequenciesduring the evolution period with the precession fre-quencies during the detection period, and is a vividand easily interpretable representation of the mix-ing process. Diagonal and cross peaks are measuresfor the elements of the transfer matrix of the mixingpulse sequence in Figure 6.
Among the numerous transfer processes that canbe represented in this manner, the most importantones (8) are 1) the scalar J coupling leading to2D correlation spectroscopy abbreviated as COSY,2) internuclear cross relaxation leading to 2D nu-clear Overhauser effect spectroscopy abbreviated asNOESY, and 3) chemical exchange leading to 2Dexchange spectroscopy abbreviated as EXSY.
Figure 8: Phase-sensitive 400 MHz XH COSY spec-trum of antamanide (1) in chloroform (at 250 K) ina contour-line representation. Positive and negativecontours are not distinguished. The spectrum wasrecorded by Dr. Martin Blackledge.
Figure 9: Assignment of the protons of the backboneof antamanide (1) by the combination of COSY (C)and NOESY (N) cross peaks. The missing NH pro-tons in the four proline residues break the chain ofsequential C-N connectivities.
The COSY transfer, which proceeds through Jcoupling, is truly a quantum mechanical effect thatdoes not find a satisfactory classical explanation. Bymeans of a single (n/2)x rf mixing pulse, as in Fig-ure 6, it is possible to transfer coherence of spink, which is antiphase with respect to spin I andrepresented in the density operator by the opera-tor term 21^1^ into coherence of spin I, which isantiphase with respect to spin k, represented by -2IfczIjj/ (eqn. 6), whereby each factor of the productspin-operator can be considered to be rotated byTT/2 about the a;-axis.
21*,,!kyi-lz ~ 2IfczI.•fcz% (6)
Antiphase coherence of the type 21kyIiz is onlyformed during the evolution period when there isa direct spin-spin coupling between the spins Ik and1/ (eqn. 7).
+ 2IkyIlzsin
(7)This implies that in a two-dimensional correlationspectrum there are cross peaks only between directlycoupled spins (as long as the approximation of weakcoupling holds). It is obvious from eqn. 7 that thereis no net coherence transfer, e.g. I^x —> lix, andthe cross-peak integral must disappear. In otherwords, there is an equal number of cross-peak mul-tiplet lines with positive and negative intensity.
ProH Phe10 V a l 1 Proz
/ 2 \ 2 i 2 i 2 i i \CH2 CH-CO-NH-CH-CO-NH-CH-CO-NH-CH-CO-N. ^CH,
^ N " ^ CH 2
I ICO COI I
^ C H V / N NCH2 N-CO-CH-NH-CO-CH-NH-CO-CH-NH-CO-CH CH2\ / I I i \ ICH2-CH2 CH2
O oPro7 Phe6 Phe5 A la 4
CH2-CH2
ProJ
A COSY spectrum, such as the one shown inFigure 8 for the cyclic decapeptide antamanide (1)can be used to find pairs of spins belonging to thesame coupling network of an amino acid residue in
Vol. 16, No. 1/2 13
COSY
NOESY jEXSY
RELAY
TOCSYROESY
1]
1
71w n—41—12-^
[
MQS n n n wFigure 10: Pulse sequences for some of the mostuseful homonuclear 2D experiments: a) COSY, b)NOESY or EXSY, c) relayed COSY, d) TOCSYor ROESY in the rotating coordinate system, e)multiple-quantum spectroscopy.
the molecule. All intense cross peaks arise from cou-plings over two and three bonds that allow, first ofall, the assignment of the pairs of NH and CaH alongthe polypeptide backbone (backbone protons), asindicated by C in Figure 9 for the six amino acidresidues with NH protons. In addition, it is alsopossible to assign the protons in the side chains.
The transfers of NOESY and EXSY experimentsinvolve incoherent, dissipative processes that bringthe system back to equilibrium in an exponential ormultiexponential manner after an initial perturba-tion. They require an extended mixing time dur-ing which the random processes are given a chanceto occur. Both processes can be investigated withthe same three-pulse scheme (Figure 10b) (8,64-67).The mixing period is bracketed by two TT/2 pulsesthat transform coherence into static spin-order andback into coherence. The exchange processes trans-fer the spin order between different spins or betweendifferent chemical species, respectively. This typeof transfer can be understood on the basis of clas-sical kinetic models. The resulting 2D spectrumrepresents a kinetic matrix with cross-peak inten-sities proportional to the exchange rate constants ofpseudo-first-order reactions.
',lppm]
Figure 11: 400 MHz 1H NOESY spectrum of anta-manide (1) in chloroform (at 250 K) in a contour-line representation. The spectrum was recorded byDr. Martin Blackledge.
For the NOESY transfer, the exchange rate con-stants are given by the cross-relaxation rate con-stants, which are due to magnetic dipole-dipole in-teractions, and are proportional to 1/4, for nuclearpairs Ifc and I;, and depend on the correlation timerc of the tumbling of the molecules in solution. Thedistance dependence can be used to measure relativeor, if rc is known, absolute distances in molecules.The NOESY cross peaks thus allow the identifica-tion of neighboring protons in a molecule - impor-tant, for example, in identifying protons that belongto adjacent amino acid residues in peptides.
A NOESY spectrum of antamanide (1) is givenin Figure 11. The sequential backbone protons ofadjacent amino acid residues with NOESY crosspeaks are marked in Figure 9 with N. It is seenin Figure 9 that these together with the protonswith J- cross peaks from the COSY spectrum (Fig-ure 8) form two unbroken chains of connectivitiesthat can be used for the identification of the back-bone protons. The two chains are not joined be-cause of the absence of NH protons in the four pro-line residues. The general assessment procedure ofproton resonance frequencies based on COSY andNOESY spectra has been established by Wiithrich
14 Bulletin of Magnetic Resonance
Figure 12: 2D 13C EXSY spectrum of a mixtureof cis- and irans-decalin recorded at 22.5 MHz and241 K (76). Top: Three-dimensional representation(stacked plot). Bottom: A contour-line representa-tion with the assignment of the peaks.
and his research group (56).Based on a complete or partial set of assigned
resonances, it is then possible to deduce informationon the molecular structure. Each NOESY cross-peak intensity provides an internuclear distance thatcan be used in a manual or computerized process toconstruct a molecular model compatible with theexperimental data. In this process it is also pos-sible to employ scalar coupling constants extractedfrom COSY-type spectra (most conveniently fromE. COSY spectra, as mentioned later). Accordingto the Karplus relations (54), there is a relation be-tween vicinal coupling constants and dihedral an-gles. Ingenious computer procedures to determinemolecular structures based on NMR data were firstdeveloped by Kurt Wiithrich and his research teamand tested on a large number of small to medium-size proteins (56, 68-71). At present, mainly two
Figure 13: Extensions of the standard COSY exper-iment. Relayed correlation, total correlation spec-troscopy (TOCSY), and multiple-quantum spectros-copy (MQS) increase the information content, whileexclusive correlation (E. COSY), multiple-quantumfiltering (MQF), and spin-topology filtration reducethe complexity. Both avenues can lead to three-dimensional spectroscopy.
computer algorithms for the structure determina-tion are in use - the distance-geometry algorithm(72,73) and modifications of it, and the restrainedmolecular-dynamics algorithm (74,75), again withmany variations. The structural problem in anta-manide (1) will be discussed later, as it involves in-tramolecular dynamic processes that complicate thesituation.
Cross peaks in a NOESY-type exchange spec-trum can also originate from chemical exchange; thethree-pulse experiment of Figure 10b is indeed wellsuited for the investigation of chemical exchangenetworks (64,65,76). A distinction of the two typesof signals is not possible by inspection of a single2D spectrum. However, variable-temperature stud-ies are often conclusive. At sufficiently low temper-atures at which chemical exchange becomes slow,only NOESY cross peaks should remain. The twotypes of signals may also be distinguished in ex-periments with rotating coordinate systems as men-tioned in the next section.
The 13C NMR spectrum of a mixture of cis- andirons-decalin in Figure 12 is typical for a spectrum
Vol. 16, No. 1/2 15
showing chemical exchange. The spectrum gives ev-idence of the well-known conformational stability ofirans-decalin, whereas for cis-decalin four pairs ofcarbon spins are involved in a conformational ex-change process, giving raise to two pairs of crosspeaks (76).
IV. Modified Two-DimensionalFT-NMR Experiments
Starting from the two prototypical 2D FT NMRexperiments, numerous modified, expanded, and im-proved experiments have been suggested. Many ofthem have found a place in the arsenal of routinemethods for the NMR spectroscopist. A first cate-gory of experiments, represented in the upper part ofFigure 13, causes extended correlation through twoor more transfer steps: Relayed correlation exper-iments involve two-step correlation, and total cor-relation spectroscopy (TOCSY) multiple-step cor-relation. The latter experiment leads to the im-portant class of rotating frame experiments, includ-ing rotating frame Overhauser effect spectroscopy(ROESY) an alternative to NOESY. Finally alsomultiple-quantum spectroscopy allows one to inves-tigate connectivity in spin systems. A second classof experiments attempts the simplification of spec-tra by exclusive correlation (E. COSY), multiple-quantum filtering, and spin-topology filtration.
V. Relayed Correlation
In a standard COSY experiment, coherence istransfered exclusively between two directly coupledspins by means of a single mixing pulse. By a se-quence of two TT/2 pulses, as in Figure 10c, it ispossible to effect a transfer of coherence across twosequential couplings from spin I& to spin I; throughthe relay spin Ir (77,78). For the relation in eqn. 8,Jkrh = Jkrrm = JriTm = 1/2 is assumed.
*-kx
-2L.JrzMy (8)
During the extended mixing period rm, it is thusnecessary to refocus the antiphase character of theIr spin coherences with respect to spin Ij. and cre-ate antiphase character with respect to spin 1/ toallow for a second transfer by the second mixingpulse. Relayed correlation is useful whenever theresonance of the relay spin Ir cannot be identifiedunambiguously. With a relay experiment it is thennevertheless possible to assign spins Ifc and 1/ to thesame coupling network (e.g. belonging to the sameamino acid residue in a polypeptide chain). It isusually advantageous to refocus the effects of thechemical shift precession during the mixing periodby incorporating a central n pulse as shown in Fig-ure 10c.
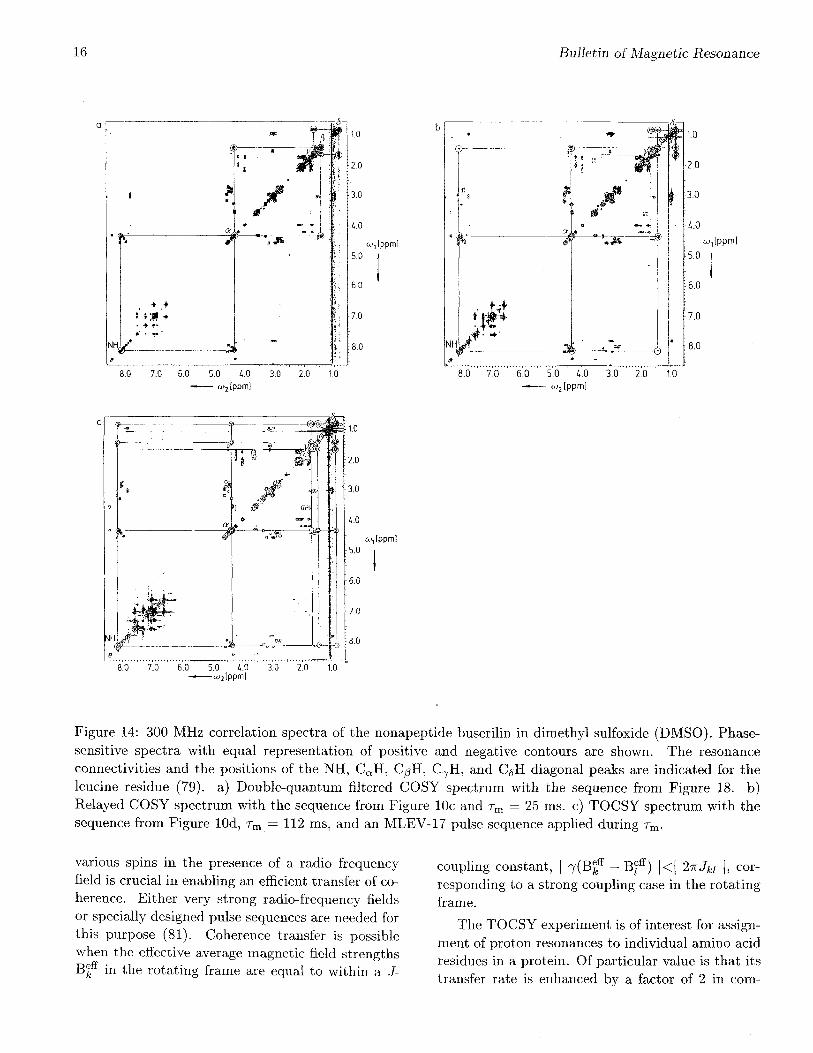
Relayed coherence transfer is illustrated by 300MHz XH NMR spectra of the linear nonapep-tide buserilin, pyro-Glu-His-Trp-Ser-Tyr-D-Ser-Leu-Arg-Pro-NHCH2CH3. Figure 14a shows a (double-quantum filtered) COSY spectrum and Figure 14bthe corresponding relayed COSY spectrum (79).In both spectra, the resonance connectivities forthe leucine residue are marked. It is evident thatin the COSY spectrum only nearest neighbor pro-tons are connected by cross peaks: NH-CaH, CaH-C^H1-2, C^H1-2-C7H, and C7H-(C^H3)1'2. On theother hand, in the relayed COSY spectrum, alsothe next-nearest neighbors NH-C^H1'2 and C/3H1'2-(C5H3)1'2 are connected. The third pair of relayedcross peaks CaH-C7H, is weak because of the highmultiplicity of the C7H resonance and is not visiblein the contour representation of Figure 14b. Similarrelayed cross peaks can be found for the other aminoacid residues.
VI. Rotating Frame Experi-ments
By means of an extended mixing pulse se-quence, transfer of coherence over an arbitrary num-ber of steps is possible in principle. In particular,continuous wave irradiation leads to the mixing ofall eigenmodes of a spin system and correspond-ingly to transfers of coherence between all of them.This is exploited in total correlation spectroscopy(TOCSY) with the sequence shown in Figure lOd.All spins belonging to the same J-coupling networkcan be identified with TOCSY (80,81). The accu-rate matching of the precession frequencies of the
16 Bulletin of Magnetic Resonance
8.0 7.0 6.0 5.0 4.0 3.0 2.0 1.0
8.0 7.0 6.0 5.0 4.0 3.0 2.0 1.0
oijlppml
8.0 7.0 6.0 5.0 4.0 3.0 2.0 1.0— o)2[ppm]
Figure 14: 300 MHz correlation spectra of the nonapeptide buserilin in dimethyl sulfoxide (DMSO). Phase-sensitive spectra with equal representation of positive and negative contours are shown. The resonanceconnectivities and the positions of the NH, CaH, CgH, C7H, and CgH diagonal peaks are indicated for theleucine residue (79). a) Double-quantum filtered COSY spectrum with the sequence from Figure 18. b)Relayed COSY spectrum with the sequence from Figure 10c and rm = 25 ms. c) TOCSY spectrum with thesequence from Figure lOd, rm = 112 ms, and an MLEV-17 pulse sequence applied during rm.
various spins in the presence of a radio frequencyfield is crucial in enabling an efficient transfer of co-herence. Either very strong radio-frequency fieldsor specially designed pulse sequences are needed forthis purpose (81). Coherence transfer is possiblewhen the effective average magnetic field strengths
in the rotating frame are equal to within a J-
cor-coupling constant, | 7(B|ft - B fresponding to a strong coupling case in the rotatingframe.
The TOCSY experiment is of interest for assign-ment of proton resonances to individual amino acidresidues in a protein. Of particular value is that itstransfer rate is enhanced by a factor of 2 in com-
Vol. 16, No. 1/2 17
parison to COSY or relayed transfer experiments inthe laboratory frame (80). Another property is that,because of the presence of a radio-frequency field, in-phase coherence transfer is possible (eqn. 9), leadingto in-phase cross-peak multiplet structures.
l i f e , Hx (9)
A TOCSY spectrum of buserilin is included inFigure 14c for comparison with the relayed andstandard COSY spectra depicted. Again three-steptransfers CoH^CgHs)1'2 and even four-step trans-fers NH-^C^Hs)1'2 are visible here. Some expectedcross peaks involving C7H are missing as before be-cause of the extensive multiplet structure of C7H.
The elimination of the chemical shift precessionby the rf irradiation leads not only to the coher-ent transfer through the J-coupling network, butalso to an incoherent transfer of spin order throughtransverse cross-relaxation. The transverse cross-relaxation terms are, in principle, always present.However, strong differential chemical shift preces-sion of spin pairs normally causes a quenching ofthe transfer in the sense of first-order perturba-tion theory. In the presence of a strong rf field,this quenching is no longer operative and transversecross-relaxation occurs. This is the transfer mecha-nism of the rotating frame Overhauser effect spec-troscopy (ROESY) experiment (82).
ROESY has similar properties as NOESY butdiffers in the dependence of the cross-relaxation rateconstant Y^i on the correlation time TC of the molec-ular rotational motion that modulates the internu-clear dipole-dipole interaction responsible for cross-relaxation (cf. eqns. 10 and 11 where the spectraldensity J is defined by eqn. 12).
NOE MoYAir)
4TT
3J(2u;o) (10)
^J(2co0)\ (11)
(12)
As usual, coo is the Larmor frequency of the two nu-clei with the internuclear distance r^i- Eqns. 10 and12 imply that Fj^OE changes sign for an intermediate
correlation time rc of (5/4) l/2 u0 *; that is, the cross-relaxation rate becomes small in the neighborhoodof this condition. Depending on the viscosity of thesolvent and the resonance frequency LL>O, this occursfor globular molecules within a range of molecularmass of 500-2000 Da. F^ O E , on the other hand,is less sensitive to rc and remains positive for anymolecular mass. The ROESY experiment is there-fore of advantage for molecules of intermediate size.
- In addition, the different sensitivity of NOE andROE to rc allows one to deduce information onintramolecular mobility by comparison of the twomeasurements (83). An advantage of ROESY overNOESY experiments is that the cross-peak ampli-tude is negative, while the simultaneously occurringcross peaks due to chemical exchange are positiveand allow for an easy distinction as long as the sig-nals do not overlap.
It should be recognized that in the rotating framecoherence transfer through J couplings and crossrelaxation occur simultaneously, whereby TOCSYcross peaks are positive and ROESY cross peaksappear with negative amplitude. This complicatesthe 2D spectra and calls for separation procedures.The suppression of the coherent transfer through Jcouplings (TOCSY) is easy, because it is only nec-essary to mismatch the condition | 7 (B | — Bf) \<| 2irJki |, for example by a slight frequency offset inthe presence of not-too-strong rf fields. The cross-relaxation rates are much less sensitive to such amismatch and a clean ROESY spectrum results.
Obtaining a clean TOCSY spectrum is more de-manding because relaxation cannot easily be manip-ulated. A technique was proposed by C. Griesinger(84), which relies on a combination of eqns. 10 and11 to set the average cross-relaxation rate constantto zero (eqn. 13). A suitable weighting factor p canbe found whenever T^[
OE < 0, that is, for suffi-ciently large molecules with rc > (5/4)1/2w(J"1. Thisrequires the magnetization to move on a trajectorythat spends a fraction p of time along the z-axis anda fraction (1-p) in the transverse plane. For rc —> oo,one finds p = 2/3 for TM — 0. A suitable pulse se-quence, a modification of an MLEV-17 spin-lockingsequence, has been proposed in ref. (84).
Another optimized sequence, called "CleanCITY", was developed by J. Briand (85). A clean
18 Bulletin of Magnetic Resonance
ro.o
2.0
4.0
>, Ippm]
6.0
8.0
10.0
10.0 8.0 6.0— u>2 Ippm)
10.0 8.0 6.0tt»2 Ippfni
MLEV-17
Clean CITY
10.0 8.0 6.0 4.0o/,[ppm]
2.0
Figure 15: Phase-sensitive 300 MHz lR TOCSYspectra of 15 mM sample of bovine pancreatictrypsin inhibitor in D2O recorded with a mixingtime of 69 ms (85). a) Mixing process with MLEV-17 pulse sequence. Negative peaks are shown by-contours filled in black, b) Mixing process with theClean CITY pulse sequence, c) Cross sections alongLOI through the diagonal peak of Tyr23eH at LV2 =6.33 ppm in the spectra a) and b) (marked withbroken lines).
TOCSY spectrum of bovine pancreatic trypsin in-hibitor (BPTI) using the Clean CITY sequence iscompared in Figure 15 with a conventional TOCSYspectrum to demonstrate the efficient suppression ofthe (negative) ROESY peaks.
VII. Multiple-QuantumSpectroscopy
In the spectroscopy, in general, only those tran-sitions are directly observable for which the observ-able operator has matrix elements not equal to zero,leading to the so-called allowed transitions. For
« •
12ft.,
Figure 16: 90 MHz 2D XH correlation spectrum of[D3]3-amino-propanol with double-quantum transi-tions along u>\ and single-quantum transitions alongu>2 • The three types of double-quantum transitionsmentioned in the text are indicated. Enlargementsof all cross peaks are shown on the left. The spec-trum is shown in an absolute value representation(from ref. 89).
magnetic resonance in strong magnetic fields withweak cw perturbation or with a free induction de-cay in the absence of rf, the observable operator ofthe transverse magnetization Fx = ]Tfe Ifei has ma-trix elements only between eigenstates of the Hamil-tonian differing in the magnetic quantum numberM by ±1. Thus single-quantum transitions are theallowed transitions, while multiple-quantum transi-tions with I AM I > 1 are forbidden. Multiple-quantum transitions can, however, be induced bystrong cw rf fields that cause a mixing of states(8,57) or by a sequence of at least two rf pulses(Fig. lOe) (8,63,86,87). Observation is possible againin the presence of a strong rf field (8,57) or after afurther detection pulse (8,63,86,87).
Vol. 16, No. 1/2 19
For spin systems with 1=1/2, multiple-quantumtransitions invariably involve several spins, andmultiple-quantum spectra contain information onthe connectivity of spins within the J-coupling net-work in analogy to 2D correlation spectra. In par-ticular, the highest order transition allows one todetermine the number of coupled spins. Relaxationrate constants of multiple-quantum coherences aredependent on the correlation of the random pertur-bations affecting the spins involved and provide in-formation on motional processes (88).
A simple instructive example of a 2D double-quantum spectrum is given in Figure 16 to demon-strate the use of multiple-quantum transitions forthe assignment of resonances (89). Along u)\, double-quantum transitions and along o>2 single-quantumtransitions are displayed for the six-spin system of[D3]3-aminopropanol DOCH2CH2CH2ND2. In gen-eral, there are three categories of double-quantumtransitions:
1) Double-quantum transitions involving two di-rectly coupled spins. They lead to pairs of crosspeaks displaced symmetrically from the double-quantum diagonal (u\ = 2o>2) with u;2 coordinatescorresponding to the Larmor frequencies of the twospins (e.g. uox - OA + $7M, fijvi + ̂ x ) -
2) Double-quantum transitions involving twomagnetically equivalent spins. They lead to one ormore cross peaks at an UJ\ frequency that intersectsthe double-quantum diagonal at the w2 frequencycorresponding to the common Larmor frequency ofthe two spins (e.g. uj\ = 20,^,20,^, 2QX, althoughthe spins are magnetically equivalent only withinexperimental accuracy).
3) Double-quantum transitions involving two re-motely coupled spins. They lead to single crosspeaks at an u>\ frequency that intersects the doublequantum diagonal at w2 equal to the mean of thetwo Larmor frequencies (e.g. OJI = OA + H X ) . Thesecross peaks carry information identical to that inrelayed correlation spectra.
For the practical application it is essential thata multiple-quantum spectrum never contains anarray of strong diagonal peaks. It should bementioned that a beautiful and useful form ofa double-quantum experiment is the 2D INADE-QUATE spectroscopy proposed by Bax, Freeman,and Kempsell (90,91). There, only type 1 peaks canarise.
The methods mentioned so far produce addi-tional cross peaks that provide information not ac-cessible with the standard COSY and NOESY ex-periments. In the following, techniques are dis-cussed that lead to simplified spectra which mayfacilitate their interpretation.
VIII. Multiple-Quantum Filter-ing
Selective filtering can be achieved by excitingmultiple-quantum coherence, selecting a particularquantum order, and reconverting the selected orderinto observable magnetization. Depending on theselected order, this leads to multiple-quantum fil-tering of various orders. The spin-system-selectiveeffect relies on coherence transfer selection rules thatlimit the allowed transfers for weakly coupled spins(8,92):
1) It is impossible to excite p quantum coher-ence in spin systems with less than p-coupled spins1=1/2.
2) For the appearance of a diagonal peak of spinIfc in a p-quantum-filtered COSY spectrum, the spin1̂ must be directly coupled to at least p - 1 furtherspins.
3) For the appearance of the cross peaks betweenspins Ifc and I; in a p-quantum-filtered COSY spec-trum, both spins must simultaneously be coupled toat least p - 2 further spins.
Violations of these coherence transfer selectionrules occur for strong coupling and for certain spe-cial relaxation situations (93).
In Figure 17, the effect of four-quantum filteringon various four-spin systems is demonstrated. Thesample consists of a mixture of the five compoundsirans-phenylcyclopropanecarboxylic acid (K4), DL-isocitric acid-lactone (P3,].), 1,1-dichloroethane (S4),2-chloropropionic acid (C4), and D-saccharic acid-1,4-lactone (L4) with the coupling topologies indi-cated in Scheme 1 (94).
Figure 17a shows a conventional (double-quantum-filtered) COSY spectrum of the mix-ture, while in Figure 17b the corresponding four-quantum-filtered spectrum is reproduced. The fil-tering effect can easily be understood based on thegiven rules and the coupling topologies shown in
20 Bulletin of Magnetic Resonance
2 1
Figure 17: Multiple-quantum-filtered and spin-topology-filtered 300 MHz 1H COSY spectra of a mixture ofthe compounds from Scheme 1 containing four-spin systems, a) Double-quantum-filtered spectrum obtainedwith the pulse sequence from Figure 18. b) Four-quantum-filtered spectrum obtained with the pulse sequencefrom Figure 18. c) G4 spin-topology-filtered spectrum obtained with the pulse sequence from Figure 19 (fromref. 94).
Scheme 1. The interpretation is left to the reader.Only cross peaks of the molecule with K4 topologyand diagonal peaks of molecules with P3 1, S4, andK4 topologies remain.
Technically, multiple-quantum filtering exploitsthe characteristic dependence of a multiple-quantum coherence transfer on the rf phase of theacting pulse sequence (8,92,95,96). Let us assume atransfer of coherence cpl(t) by a unitary transforma-tion U(0), representing a particular pulse sequence,to coherence cp2(t), where px and p2 are the ordersof coherence.
U(0)cp2(t) (14)
All rf pulses in the sequence are now phase-shiftedby $, leading to U($) . Then it can be shown thatthe resulting coherence Cp2(t) is phase-shifted by
(15)
The phase shift is therefore proportional to thechange in coherence order (Ap = P2—Pi)- After a se-ries of experiments are performed in which the phase
Vol. 16, No. 1/2 21
® ^oScheme 1. The compounds used for the spectra inFigure 17 and their spin-coupling topologies.
<£ is incremented in regular intervals 2ir/N from 0to 2TT(JV — 1)/N, it is possible to select for a par-ticular Ap by computing the corresponding Fouriercoefficient of Ap: Let s(t, $) be the recorded signalof an experiment with phase shift <3>, then we obtainthe filtered signal according to eqn. 16.
p =
Figure 18: Pulse sequence for multiple-quantum-filtered COSY experiment with the coherence trans-fer diagram for double-quantum filtering. The phase4> is incremented systematically in a set of N exper-iments and the resulting experimental results arecombined according to eqn. 16.
s(t, Ap) = V s(t, 2Trk/N)e-i27rkAp/N (16)Z /k=0
The required number of increments N of the phase $depends on the number of values of Ap that have tobe discriminated (96). It is obvious that unless theinitial order of coherence p\ is known, no particularorder of coherence p2 can be filtered out in this man-ner. Most conveniently the initial state is selectedto be in thermal equilibrium with p\ = 0. Then, theentire pulse sequence preceding the point at whicha coherence order should be selected must be phase-cycled. For multiple-quantum-filtered COSY exper-iments, this leads to the pulse sequence shown inFigure 18.
Obviously, multiple-quantum-filtering and phasecycling require ./V-times more experiments. How-ever, no information is lost, since in each term ofeqn. 16 just the phase factor is compensated, andidentical signals are coadded for the relevant path-ways. Thus the longer performance time is refundedin terms of an increased signal-to-noise ratio.
Figure 19: Pulse sequence for C4 spin-topology fil-tration consisting of TT/2 and TT pulses. The delaysare adjusted to T = 1/(8J) and A = 1/(2J), whereJ is the uniform J-coupling constant. </> is phase-cycled for four-quantum selection and 9 for the sup-pression of axial peaks (94).
2QF
• o • oo • o •
o • o •
3QF
o»«o• oo»• oo»
E.COSY
• c
• o— J23
-M2
)1
Figure 20: E. COSY experiment to simplify themultiplet structure of cross peaks. The double-quantum- and the triple-quantum-filtered crosspeak between spins Ii and I2 of a three-spin sys-tem are combined to produce an E. COSY pattern.Positive and negative multiplet components are dis-tinguished by empty and filled circles.
22 Bulletin of Magnetic Resonance
IX. Spin-Topology Filtration
It may be desirable to enhance the filtering ef-fect illustrated in Figure 17 and to select individualspin coupling topologies. Indeed it is possible to de-sign extended pulse sequences, in combination withmultiple-quantum nitration, that are tailor-made forspecific spin coupling topologies (94,97,98). A pulsesequence built into a 2D COSY experiment, thatis selective for cyclic C4 spin coupling topologies isdepicted schematically in Figure 19. If this pulse se-quence is applied to the mixture of compounds withfour-spin systems (Scheme 1), the 2D spectrum ofFigure 17c is obtained. It shows efficient suppressionof all other spin systems. It should be noted, how-ever, that the situation is here rather ideal. Often,these filters do not perform as well because theirdesign relies on all non-zero spin couplings beingequal. In reality, there are weak and strong cou-plings that cannot be characterized by topologicalconsiderations alone. Often also the intensities ofsignals decrease during the extended pulse sequencesdue to relaxation. This limits the practical useful-ness of these methods.
active coupling constant J\i responsible for the co-herence transfer. The displacement vector betweenthe two squares is given by the two passive couplingsJ13 and J23 to the third (passive) spin. It should bementioned that this multiplet structure is identicalto the one obtained by a COSY experiment witha mixing pulse with an extremely small flip angle(102).
E. COSY is of practical use whenever the cross-peak multiplet structure must be analyzed for thedetermination of J-coupling constants. This can bedone conveniently by hand by measuring the dis-placement of peripheral multiplet components (101)or by a recursive contraction procedure on a com-puter (103).
XI. Heteronuclear Two-Dimen-sional Experiments
X. Exclusive Correlation Spec-troscopy
Multiple-quantum filtering suppresses not onlydiagonal and cross peaks in 2D spectra but alsochanges the sign pattern in the cross-peak multi-plet structure. By appropriate combination of dif-ferently multiple-quantum-filtered 2D spectra, it ispossible to simplify the multiplet structure by reduc-ing the number of multiplet components. Exclusivecorrelation spectroscopy (E. COSY), proposed byO.W. S0rensen, eliminates all multiplet componentsfrom a COSY spectrum except for those belongingto pairs of transitions with an energy level in com-mon (99-101). In practice, it is not necessary tocombine multiple-quantum-filtered spectra literally,but it is possible to coadd directly the experimen-tal results from a phase cycle with the appropriateweighting factors.
Figure 20 shows schematically the combinationof cross-peak multiplets connecting two spins, Ii andI2, in a three-spin system after double- and triple-quantum filtering. The remaining pattern consistsof two basic squares with side lengths equal to the
In addition to the homonuclear 2D experimentsdiscussed so far, at least as many heteronuclearexperiments have been proposed and introducedto the repertoire of routine spectroscopy methods.Of greatest practical importance are heteronuclearshift correlation spectra which correlate the chemi-cal shifts of directly bonded or remotely connectedheteronuclei (104,105). In this context, so-called in-verse detection experiments are of particular inter-est. Here proton I-spin coherence is observed in %2while spin coherence of a less sensitive, less abun-dant S nucleus evolves in t\ (104). The most effi-cient pulse sequences create heteronuclear two-spincoherence that evolves in t\ and that acquires thefrequency information of the S-spin resonance (106).Also in the heteronuclear environment, relayed co-herence transfer (78) as well as experiments in therotating frame (107) are important. Spin filtering isused for multiplicity selectivity, that is, for distin-guishing S spins coupled to one, two, or three I spins(108), and in the form of J filtering for the distinc-tion of one-bond and multiple-bond couplings (109).This enumeration of heteronuclear experiments is byno means exhaustive.
Vol. 16, No. 1/2 23
Figure 21: Schematic representation of a 3D NMR experiment as an extension of Figures 1 and 6. Threeevolution periods with the time variables t\, ti, and £3 are separated by two transfer or mixing processes withthe transfer matrices Rl and R2. A 3D experiment can be conceived as the contraction of two 2D experiments.
Figure 22: 3D representation of a 300 MHz 3Dhomonuclear ROESY-TOCSY spectrum of buserilinin [De]DMSO photographed from a computer screen(116).
XII. Three-Dimensional Fourier-TransformationSpectroscopy
No new principles are required for the devel-opment of 3D NMR spectroscopy, which is just alogical extension of 2D NMR spectroscopy. Insteadof a single mixing process which relates two fre-quency variables, two sequential mixing processesrelate three frequencies: the origin frequency u>\,the relay frequency u>2, and the detection frequencyUJ3 (Figure 21). In this sense a 3D experiment canbe considered as the combination of two 2D exper-iments. Obviously a very large number of possible3D experiments can be conceived. However, onlyfew of them have proved to be indispensible so far(110-118).
Figure 23: 3D resolution of a 2D XH NMR spec-trum by 15N resonance spreading. The NH-CaHcross peaks are displaced in a third dimension bythe corresponding 15N chemical shifts.
Two applications of the 3D spectroscopy con-cept have emerged: 1) 3D correlation and 2) 3Ddispersion spectroscopy (see also Fig. 13). Three-dimensional correlation is of importance in homonu-clear experiments. It has been mentioned thatthe assignment procedure in biomolecules requires aCOSY-type and a NOESY-type 2D spectrum. Thetwo 2D experiments could be contracted into one3D experiment, combining a J-coupling-mediatedtransfer and a cross-relaxation transfer. A 3DCOSY-NOESY spectrum possesses the advantagethat the entire assignment process can be carriedout with a single homogeneous data set (115,116).It also incorporates redundant information that al-lows cross checks of the assignments. For obtainingquantitative information, however, 3D spectra areless suited, since all peak intensities are products of
24 Bulletin of Magnetic Resonance
two transfer coefficients that are sometimes difficultto separate.
A 3D ROESY-TOCSY spectrum of the linearnonapeptide buserilin is shown in Figure 22 (vf.Fig. 14)(116). A ROESY instead of a NOESY se-quence is required for buserilin, as it is a moleculeof intermediate size for which the NOE intensitiesare small. The TOCSY step has the advantage thatchains of multiple-step cross peaks extend to nucleiin the side chains are obtained thus facilitating theidentification of the amino acid residues.
It should be recognized that recording a 3D spec-trum is considerably more time-consuming than two2D spectra, since two time parameters, t\ and £2,must be incremented independently, requiring a 2Darray of experiments. Thus the question arises ofwhen it is worth the effort to record a 3D spectrum.This question has been discussed in numerous pub-lications (116,119,120).
Let us consider a particular cross peak in a 3Dspectrum that correlates the coherences {tu} in thewi, {rs} in the w2 and {pq} in the U13 dimension.Its intensity is determined by the following product(eqn. 17) of matrix elements in the eigenbasis of theunperturbed Hamiltonian HQ (116).
Z{pq}{rs}{tu} ~
A nonvanishing intensity establishes a two-step cor-relation {tu}-{rs}-{pq}.
The 3D experiment can be compared with two2D experiments that employ the mixing processesx(l) x(2)R and R , respectively. The corresponding in-tensities are expressed by eqns. 18 and 19.
Z {rs}{tu}
~~ D1PR{pq}{rs}(I>
(18)
(19)
If in the 2D spectra the two relevant peaks withintensities Z and Z \ can be identified,J{rs}{tu} {Pq}{}possibly in crowded regions, the two-step correla-tion, represented by a 3D peak, could also be es-tablished based on the two 2D spectra {tu}-{rs}and {rs}-{pq}. Provided that Z{pq}{rs}{tu} / 0 istrue, the intensities a n d Z <{Jq}{rs}
a r e de-{ferent from zero when in addition Dgr ^ 0 and
(P <7"o)rs 7̂ 0 hold. This implies that the re-lay transition {rs} must be excited in the prepa-ration state p(2) a n ( j detectable by the observableD^l\ For allowed one-spin single-quantum coher-ences, this condition is fulfilled for single-pulse ex-citation and direct detection. On the other hand,forbidden multiple-spin single-quantum coherences(combination lines) and multiple-quantum coher-ences can neither be excited by a single nonselectivepulse nor directly detected. Such coherences regu-larly occur in the UJI dimension of a 3D spectrum.The excitation and indirect detection of these co-herences in 2D experiments requires special pulsesequences for excitation and detection.
In conclusion, the two constituent 2D experi-ments deliver the same information on the spin sys-tem as the 3D spectrum, provided that 1) the rel-evant frequencies in the u>2 dimension of the 3Dspectrum can be excited and detected in the 2D ex-periments, and 2) the cross peaks are not hiddenby spectral overlap and can be identified in the 2Dspectra. The first condition is normally not severe,as the 2D experiments can be modified for excita-tion and detection of forbidden transitions wheneverrequired. On the other hand, the limited resolvingpower of 2D spectra is the most important motiva-tion for justifying 3D (and possibly higher dimen-sional) spectroscopy.
Because the gain in resolution justifies 3D spec-troscopy, it may be worthwhile to introduce a thirdfrequency axis just for resolution purposes, ratherthan combining two processes relevant for the as-signment requiring high resolution in all three di-mensions. It is then possible to choose the extentof 3D resolution arbitrarily and optimize the per-formance time of the 3D experiment. To spreada 2D spectrum into a third dimension, homonu-clear or heteronuclear transfers can be used. Het-eronuclear one-bond transfers are far more efficient,however, because the strong heteronuclear one-bondcouplings prevent leakage to further spins. This al-lows an efficient transfer, virtually without loss ofmagnetization. In addition, nuclei like 13C and 15Nexhibit large ranges of chemical shifts with high re-solving power. The principle of spreading is repre-sented graphically in Figure 23.
A 3D 15N-spread TOCSY spectrum of ribonucle-ase A is shown in Figure 24. Heteronuclear spread-ing requires usually isotopic labeling of the molecule.
Vol. 16, No. 1/2 25
In this case, ribonuclease A was grown in an E. colimedium containing 15N-labeled nutrients. The spec-trum was obtained with the pulse sequence fromFigure 25. Initially proton coherence is excited andprecesses during t\ under 15N refocusing by the ap-plied vr pulse. During the mixing time rm, coher-ence transfer from other protons to the NH pro-tons is effected in the rotating frame by the appli-cation of a TOCSY multiple-pulse sequence. TheNH coherence is then converted into 15NH heteronu-clear multiple-quantum coherence (HMQC) whichprecesses during t-i and acquires 15N resonance in-formation (under proton refocusing). After recon-version into NH proton coherence, detection followsduring £3 under 15N decoupling. For a completeassignment of the proton resonances a 15N-spreadNOESY spectrum is required in addition.
The step to 4D spectroscopy (121) is a logicalone: In 2D experiments, spins are pairwise corre-lated, for example NH and CQH protons. Three-dimensional dispersion uses either 15N or 13Ca res-onance for spreading the resonances of NH or CQH,respectively. In a 4D experiment, both spreadingprocesses are applied simultaneously (Scheme 2).The order of the frequencies in the actual experi-ment is a matter of convenience. Normally, the de-tection frequency W4 refers to proton spins for sen-sitivity reasons. In most cases, the two spreadingcoordinates are rather coarsely digitized to limit theperformance time, just enough to achieve separationof peaks overlapping in the 2D spectrum. Often 8to 32 points in each of the two dimensions are suffi-cient.
Scheme 2. Double spreading in 4D experiments.
XIII. Molecular Dynamicsvestigated by NMR
In-
The molecular structures determined by NMRspectroscopy in solution, by X-ray diffraction in sin-gle crystals, or by other means are invariably mo-tionally averaged structures, whereby the averaging
Figure 24: 3D 15N-spread 600 MHz XH TOCSYspectrum of 15N-labeled ribonuclease A in wa-ter. The 3D spectrum shows the 15N resonancesalong the 102 axis. The spectrum was recorded byC. Griesinger with the pulse sequence from Fig-ure 25 and processed by S. Boentges. The samplewas provided by Prof. S. Benner of ETH Zurich.
TTTTTTTTOCSY
15N
CHNH
71/2 7T/2
Figure 25: Pulse sequence for recording a 3D 15N-spread TOCSY spectrum. After presaturation ofthe water resonance (I), the proton resonances areexcited and precess during t\. After the homonu-clear TOCSY transfer from CH to the NH pro-tons, the coherence is converted into heteronuclearmultiple-quantum coherence (HMQC) that evolvesduring ti and acquires 15N shift information. Af-ter reconversion to proton coherence, the NH reso-nances are detected during £3 under 15N decoupling.
26 Bulletin of Magnetic Resonance
process is strongly dependent on the measurementtechnique. To interpret experimentally determinedstructures, some knowledge of the motional proper-ties of the molecule is in fact indispensible. Molec-ular dynamics is also relevant for its own sake, inparticular for the understanding of reactivity andinteraction with other molecules. In many cases, ac-tive sites in a molecular pocket are only accessibledue to the flexibility of the molecule itself.
The characterization of the motional propertiesof a molecule is orders of magnitude more difficultthan the description of an averaged molecular struc-ture. While 3̂ —6 coordinates are sufficient to fix astructure containing N atoms, the characterizationof molecular dynamics requires 3N-6 variances ofthe intramolecular coordinates, (3JV-6)(3iV-5)/2 co-variances, and the same number of auto- and cross-correlation functions, respectively. In addition, alsohigher order correlation functions are needed for amore refined description of dynamics. In practice,a sufficient number of observables is never availablefor a full description of dynamics. In this sense, thestudy of dynamics is an open-ended problem.
Numerous techniques are available for obtainingdata on dynamics: Debye-Waller factors in X-raydiffraction give hints on the variances of the nu-clear coordinates, however, without a measure forthe time scale. Inelastic and quasielastic neutronscattering deliver correlation functions, but withouta reference to the structure. Fluorescence depolar-ization allows one to determine the motional correla-tion function of fluorescent groups, such as tyrosineresidues in proteins. Ultrasonic absorption gives anindication of the frequencies of the dominant mo-tional modes, but again without a structural refer-ence.
NMR spectroscopy is more universally applica-ble to motional studies than most of the other tech-niques. The range of correlation times rc that canbe covered by various NMR methods is enormous,from picoseconds to seconds and more (Scheme 3).
1 s < rc: Real-time monitoring after initialperturbation
broadening, and exchange narrowing1 /xs < TC < 10 ms: Measurements of relaxation time Tje
in the rotating frame30 ps < rc < I/us: Measurements of relaxation time Ti
in the laboratory frameTC < 100 ps: Averaged parameter values
Scheme 3. NMR methods for the determination ofmotional correlation times rc
Except for slow motions on a time scale of amillisecond or more for which lineshape analysis,saturation transfer experiments, and 2D exchangestudies can be performed, many dynamics studiesby NMR rely on measurements of relaxation times.The various relaxation parameters, such as the lon-gitudinal relaxation time Ti, the transverse relax-ation time T2, the rotating-frame relaxation timeTie, and cross-relaxation rate constants TM dependon the correlation time rc of the underlying randomprocess.
The following discussion shall be restricted to arecent study of the intramolecular dynamics in an-tamanide (1) (83,122,123) (see Figs. 8,9,11). An-tamanide is an antidote for toxic components ofthe mushroom Amanita phalloides. Astonishingly,the antidote is a component of the same mush-room. Indications have been found in early ul-trasonic absorption studies (124) that the peptidering seems to undergo a conformational exchangeprocess with a frequency of about 1 MHz. In thecourse of extensive investigations of antamanide byKessler's research group (125), it has also been no-ticed that the distance constraints obtained fromNMR measurements could not be fitted by a sin-gle conformation. In our laboratory Martin Black-ledge performed rotating-frame relaxation measure-ments and localized a hydrogen-bond exchange pro-cess with an activation energy of about 20 kJ mol"1
and a lifetime of 25 fj,s at room temperature (un-published results, see also ref. 126). With a newdynamic structure determination procedure calledMEDUSA (123), the conformational space of anta-manide was investigated more systematically thanever before. 1176 feasible low-energy structureswere found. They were combined in dynamically
A second study concentrated on the dynamicsof ring puckering of the four proline residues in an-tamanide (122). The conformation of the five-ringsystems can be determined from the dihedral anglesXi, X2) a n d X3 which in turn can be deduced fromthe vicinal proton-proton J-coupling constants us-ing the Karplus relations (54). The relevant cou-pling constants (21 per residue) were determinedfrom E. COSY spectra. Based on these measure-ments, a model was constructed for each of the pro-line residues by least-squares fitting. It was foundthat for Pro3 and Pro8 a good fit can be obtainedwith a single rigid conformation, while for Pro2 andPro7 two rapidly exchanging conformations were re-quired to reduce the fitting error to within an ac-ceptable range. At the same time, measurementsof the 13C relaxation time confirmed that Pro3 andPro8 are rigid, while Pro2 and Pro7 show dynamicbehavior with correlation times between 30 and 40ps. This implies that the dynamics of the peptidering and the proline ring are not correlated and pro-ceed on entirely different time scales. The two ex-changing conformations found for Pro2 are shownin Figure 27. It is seen that the conformationalchanges resemble the up and down movements ofthe "flap of the envelope" (C7).
XIV. Magnetic ResonanceFourier Imaging
Magnetic resonance imaging (MRI) has hadan enormous impact on medical diagnosis and hasrapidly become a powerful routine tool. The basic
Figure 26: Pairs of conformers of antamanide thatfulfill the experimentally determined structural con-straints. The two pairs are shown as stereoplots aswell as in abstract form. In the former, hydrogenbonds are indicated by broken lines, in the latter byarrows pointing towards the hydrogen-bonded oxy-gen atom. The C-C. bonds about which the torsionangles </>5 and 4>§ are defined are indicated by heavylines. 4>5 is in the lower and <f>io in the upper half ofthe stereoplots. (from ref. 123).
Pro2d) Pro2(2)
Figure 27: The two experimentally determined con-formations of the amino acid residue Pro2 in anta-manide (1) (see ref. 122).
28 Bulletin of Magnetic Resonance
I
Figure 28: Schematic representation of FourierNMR imaging, here shown in two dimensions. Twoorthogonal gradients (gx,9y) a r e applied during thet\ and £2 periods of a 2D experiment. A 2D Fouriertransformation of the data set s(ti,t2) produces a2D image of the investigated subject (R.R.E.).
procedure for recording a 2D or 3D NMR image ofan object is attributed to Paul Lauterbur (127). Amagnetic field gradient, applied along different di-rections in space in a sequence of experiments, pro-duces projections of the nuclear spin density of theobject onto the direction of the gradient. From asufficiently large set of such projections it is possi-ble to reconstruct an image of the object, for exam-ple, by filtered backprojection in analogy to X-raytomography.
A different approach is directly related to 2Dand 3D FT spectroscopy. Frequency encoding ofthe three spatial dimensions is achieved by a linearmagnetic field gradient applied successively alongthree orthogonal directions for the durations £1, £2,and £3, respectively, in a pulse FT experiment (128).In full analogy to 3D spectroscopy, the time param-eters t\ and £2 are incremented in regular intervalsfrom experiment to experiment. The recorded sig-nal s(t\,t2,tz) is Fourier-transformed in three di-mensions to produce a function S(OJI,0^2,^3) whichis equivalent to a 3D spatial image when the spa-tial information is decoded using the relations x —^l/Sx, V ~ ^2/gy, and z = io^/gz with the three field
gradients gx, gy, and gz. The procedure is illustratedin Figure 28 for two dimensions.
In a further refinement, proposed by Edelstein etal. (129), the time variables £1 and £2 are replaced byvariable field gradient strengths gx and gy appliedduring a constant evolution time. With regard tothe accumulated phase, (eqn. 20) it is immaterialwhether the evolution time or the field gradients arevaried.
7 = (20)
However, keeping the time t^ constant eliminatesundesired relaxation effects.
In medical imaging, 3D experiments have a natu-ral justification, although it is sometimes simpler toapply selective excitation techniques to select a 2Dslice through the object to be imaged (130). Evenextensions to higher dimensions are quite realistic.In a fourth dimension, for example, chemical shiftinformation can be accommodated (131). Also 2Dspectroscopic information could be combined withthree spatial dimensions, leading to a 5D experi-ment. No limitations seem to exist for human imag-ination. However, the practical limits will soon bereached when the required performance times arealso taken into consideration.
XV. Conclusion
I am not aware of any other field of science out-side of magnetic resonance that offers so much free-dom and opportunities for a creative mind to inventand explore new experimental schemes that can befruitfully applied in a variety of disciplines. NMRspectroscopy is intellectually attractive because theobserved phenomena can be understood based on asound theory, and almost all conceits can also betested by easy experiments. At the same time, thepractical importance of NMR is enormous and canjustify much of the playful activities of an addictedspectroscopist.
Most of the credit for the inspiration and execu-tion of the work described should go to my teach-ers Hans Primas and Hans H. Giinthard, to mysupervisor Weston A. Anderson, to the inspiratorJean Jeener, and to my co-workers (in more orless chronological order): Thomas Baumann, EnricoBartholdi, Robert Morgan, Stefan Schaublin, AnilKumar, Dieter Welti, Luciano Miiller, Alexander
Vol. 16, No. 1/2 29
Wokaun, Walter P. Aue, Jiri Karhan, Peter Bach-mann, Geoffrey Bodenhausen, Peter Brunner, Al-fred Hohener, Andrew A. Maudsley, Kuniaki Na-gayama, Max Linder, Michael Reinhold, RonaldHaberkorn, Thierry Schaffhauser, Douglas Burum,Federico Graf, Yongren Huang, Slobodan Macura,Beat H. Meier, Dieter Suter, Pablo Caravatti, OleW. S0rensen, Lukas Braunschweiler, Malcolm H.Levitt, Rolf Meyer, Mark Ranee, Arthur Schweiger,Michael H. Frey, Beat U. Meier, Marcel Miiri,Christopher Councell, Herbert Kogler, RolandKreis, Norbert Miiller, Annalisa Pastore, ChristianSchonenberger, Walter Studer, Christian Radloff,Albert Thomas, Rafael Briischweiler, Herman Cho,Claudius Gemperle, Christian Griesinger, ZoltanL. Madi, Peter Meier, Serge Boentges, Marc Mc-Coy, Armin Stockli, Gabriele Aebli, Martin Black-ledge, Jacques Briand, Matthias Ernst, Tilo Lev-ante, Pierre Robyr, Thomas Schulte-Herbriiggen,Jxirgen Schmidt and Scott Smith. I would alsolike to thank my technical staff, Hansruedi Hager,Alexandra Frei, Janos A. Deli, Jean-Pierre Michot,Robert Ritz, Thomas Schneider, Markus Hinter-mann, Gerhard Gucher, Josef Eisenegger, WalterLammler and Martin Neukomm; my secretary IreneMiiller; and several research groups with which Ihad the pleasure to collaborate, first of all the re-search group of Kurt Wiithrich and the group ofHorst Kessler. I am grateful for support in the earlydays from Varian Associates and more recently fromthe Swiss Federal Institute of Technology, the SwissNational Science Foundation, the Kommission zurForderung der Wissenschaftlichen Forschung, andlast but not least to Spectrospin AG.
XVI. References
^.I . Rabi, Phys. Rev. 51, 652 (1937).2I.I. Rabi, J.R. Zacharias, S. Miilman, and P.
Kusch, Phys. Rev. 53, 318 (1938); I.I. Rabi, S.Miilman, P. Kusch, and J.R. Zacharias, ibid. 55,526 (1939).
51M.B. Comisarow and A.G. Marshall, Chem.Phys. Lett. 25, 282 (1974); ibid. 26, 489 (1974).
52J.C. McGurk, H. Mader, R.T. Hofmann, T.G.Schmalz, and W.H. Flygare, J. Chem. Phys. 61 ,3759 (1974).
53For example, M.K. Bowman in "ModernPulsed and Continuous-Wave Electron Spin Reso-nance", (Eds.: L. Kevan, M.K. Bowman), J. Wiley,New York, 1990, p.l.
54M. Karplus, J. Chem. Phys. 30, 11 (1959).55J.H. Noggle and R.E. Schirmer, "The Nuclear
Overhauser Effect", Academic Press, New York,1971.
56K. Wiithrich, "NMR of Proteins and NucleicAcids", Wiley Interscience, New York, 1986.
57S. Yatsiv, Phys. Rev. 113, 1522 (1952).58W.A. Anderson and R. Freeman, J. Chem.
Phys. 37, 85 (1962).59R. Freeman and W.A. Anderson, J. Chem.
Phys. 37, 2053 (1962).60R.A. Hoffman and S. Forsen, Prog. Nucl.
Magn. Reson. Spectrsoc. 1, 15 (1966).61J. Jeener, Ampere International Summer
School (Basko Polje, Yugoslavia) 1971, unpublished.62R.R. Ernst, Vlth International Conference on
Magnetic Resonance in Biological Systems (Kander-steg, Switzerland) 1974, unpublished.
63W.P. Aue, E. Bartholdi, and R.R. Ernst, J.Chem. Phys. 64, 2229 (1976).
111 G.W. Vuister and R. Boelens, J. Magn. Re-son. 73, 328 (1987).
112C. Griesinger, O.W. S0rensen, and R.R.Ernst, J. Magn. Reson. 73, 574 (1987).
113C. Griesinger, O.W. S0rensen, and R.R.Ernst, J. Am. Chem. Soc. 109, 7227 (1987).
U 4 H. Oschkinat, C. Griesinger, P. Kraulis, O.W.S0rensen, R.R. Ernst, A.M. Gronenborn, and G.M.Clore, Nature (London) 332, 374 (1988).
115G.W. Vuister, R. Boelens, and R. Kaptein, J.Magn. Reson. 80, 176 (1988).
116C. Griesinger, O.W. S0rensen, and R.R.Ernst, J. Magn. Reson. 84, 14 (1989).
117E.R.P. Zuiderweg and S.W. Fesik, Biochem-istry 28, 2387 (1989).
U 8 D . Marion, P.C. Driscoll, L.E. Kay, P.T.Wingfield, A. Bax, A.M. Gronenborn, and G.M.Clore, Biochemistry 28, 6150 (1989).
32 Bulletin of Magnetic Resonance
119S. Boentges, B.U. Meier, C. Griesinger, andR.R. Ernst, J. Magn. Reson. 85, 337 (1989).
120O.W. S0rensen, J. Magn. Reson. 89, 210(1990).
121L.E. Kay, G.M. Clore, A. Bax, and A.M. Gronenborn, Science 249, 411 (1990).
122Z.L. Madi, C. Griesinger, and R.R. Ernst, J.Am. Chem. Soc. 112, 2908 (1990).
123R. Briischweiler, M. Blackledge, and R.R.Ernst, J. Biomol. NMR 1, 3 (1991).
124W. Burgermeister, T. Wieland, and R. Win-kler, Eur. J. Biochem. 44, 311 (1974).
125H. Kessler, M. Klein, A. Miiller, K. Wagner,J.W. Bats, K. Ziegler, and M. Frimmer, Angew.Chem. 98, 1030 (1986); Angew. Chem. Int. Ed.Engl. 25, 997 (1986); H. Kessler, A. Miiller, andK.H. Pook, Liebigs Ann. Chem., 903 (1989); H.Kessler, J.W. Bats, J. Lautz, and A. Miiller, LiebigsAnn. Chem., 913 (1989); J. Lautz, H. Kessler, W.F.van Gunsteren, H.J. Berendsen, R.M. Scheek, R.Kaptein, and J. Blaney, Proc. 20th Eur. Pept.Symp., (Eds.: G. Jung, E. Bayer), 438 (1989).
126R.R. Ernst, M. Blackledge, S. Boentges, J.Briand, R. Briischweiler, M. Ernst, C. Griesinger,Z.L. Madi, T. Schulte-Herbriiggen, and O.W.S0rensen, in "Proteins, Structure, Dynamics, De-sign" (Eds.: V. Renugopalakrishnan, P.R. Carey,I.C.P. Smith, S.G. Huang, and A.C. Storer), ES-COM, Leiden, 1991.
127P.C. Lauterbur, Nature 242, 190 (1973).128Anil Kumar, D. Welti, and R.R. Ernst, J.
Magn. Reson. 18, 69 (1975).129W.A. Edelstein, J.M.S. Hutchison, G. John-
son, and T.W. Redpath, Phys. Med. Biol. 25, 751(1980).
130P. Mansfield, A.A. Maudsley, and T. Baines,J. Phys. E9, 271 (1976).